EOA2016: Employment Outlook & the Full Costs of Health
23
Hare
-
Upload
pihcsnohomish -
Category
Health & Medicine
-
view
16 -
download
0
Transcript of EOA2016: Employment Outlook & the Full Costs of Health

Hare

Employment Outlook & the Full Costs of Health
2016 Report: Employer Health Costs, employment outlook and strategies to improveEmmett Health, CEO, Community TransitEddie Johnson, Digital Partnership Director of Telehealth, Providence Health & ServicesBob LeRoy, Executive Director, Alzheimer's Association WA. State ChapterErin Monroe, Executive Director, Workforce SnohomishJim Stephanson (M), Director, Economic Alliance of Snohomish County
Equity – Work is a key social determinant of health. Wellness as a key factor in health and productivity. Empathy – Role of work re: purpose and meaning, basic needs, mental and emotional well-being, and physical health.Resilience – Role of workplace wellness in prevention/recovery, economic vitality. Empowerment – Practical tools that can be leveraged today to make a difference.

WORKFORCE SNOHOMISH• Who we are?
• What do we do?
• Where is our region?

EMPLOYMENT–HEALTH CONNECTION CASE STUDY• Employment is a key predictor of a healthy lifestyle
• 2013 Flood and Mudslide – Oso, Washington• Hired 79 Long-term unemployed to rebuild the area for 6 months• 50% were hired into permanent jobs• 25% came back one month later wanting to go back to work• Proved to help with mental health, self confidence, self-worth, self-
sustainment, & contributing to their community
Workforce Snohomish Full Economic Burden of
Health• Why the Providence Institute launched the WorkWell Center and this Study: “Employment is a key social determinant of health. An “Rx” for a job is one of the greatest health-inducing investments employers and communities can make.”
--Scott Forslund, Executive Director, Providence Institute for a Healthier Community
• “2016 Full Cost of Health Economic Burden & Impacts Report for Snohomish County Employers”
• Commissioned by the WorkWell Center for Workplace Health at the Providence Institute for a Healthier Community (PIHC)
• Produced by Community Attributes, Inc. (CAI) and Integrated Benefits Institute (IBI) using IBI’s benchmarking data model
• Relies on CDC, AHRQ, and BLS nationally representative data, state data, local county-level data

Workforce Snohomish Full Economic Burden of
HealthDEFINITIONS:• Healthcare Costs – The costs of healthcare benefits and workers comp
paid to claimants.
• Absenteeism – The cost of employees taking time off due to health reasons, e.g. chronic illness.
• Presenteeism – The cost of reduced productivity that results from an employee going to work in spite of a health concern.
Source: Integrated Benefits Institute
Workforce Snohomish Full Economic Burden of
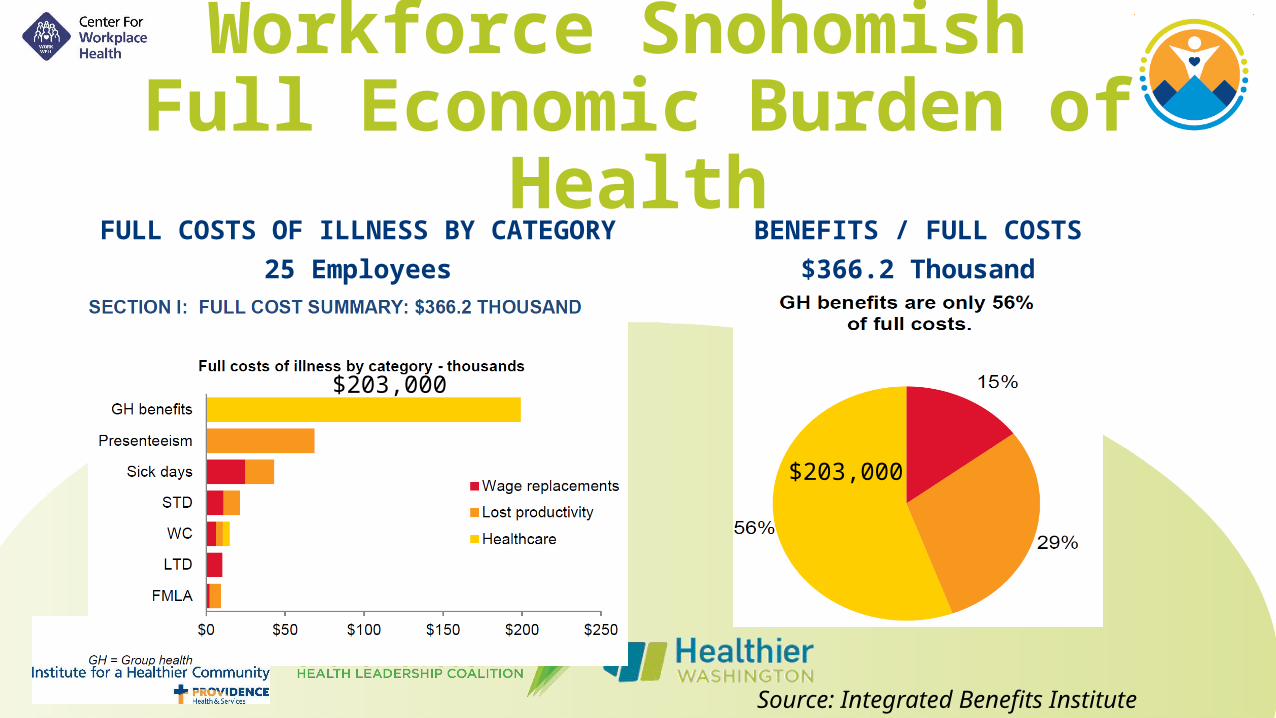
HealthFULL COSTS OF ILLNESS BY CATEGORY
25 EmployeesBENEFITS / FULL COSTS
$366.2 Thousand
Source: Integrated Benefits Institute
$203,000
$203,000
Workforce Snohomish Full Economic Burden of
Health
Source: Integrated Benefits Institute
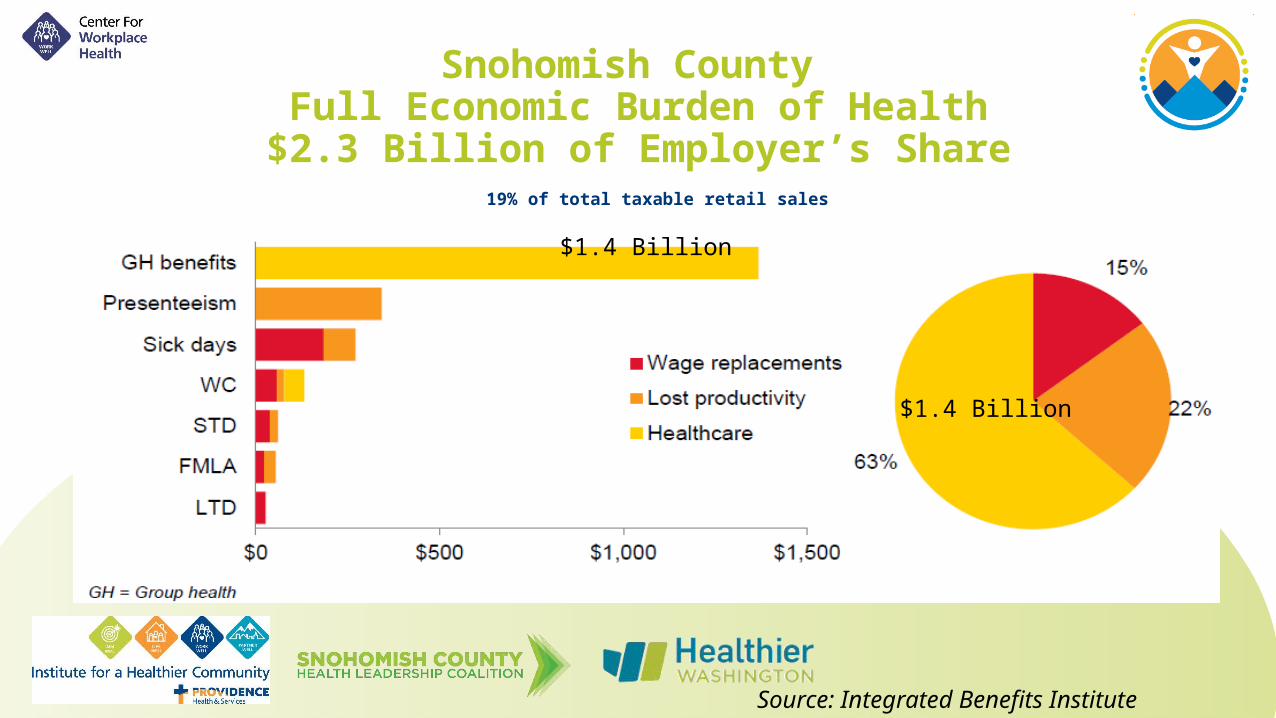
Snohomish County Full Economic Burden of Health$2.3 Billion of Employer’s Share
19% of total taxable retail sales
BENEFITS / FULL COSTS
Source: Integrated Benefits Institute
• Add chart • Add pie chart$1.4 Billion
$1.4 Billion

Snohomish CountyFull Economic Burden of Health
2.5 Million Days
Source: Integrated Benefits Institute

Snohomish CountyFull Economic Burden of
Health• Total Employer Medical Costs - $1.4 billion• Absences & Lost Productivity - $1 billion• Lost Workdays – 2.5 million• Equivalent to 10,000 FTE’s• Equivalent to the workforce of the 5th largest city in Snohomish
County (City of Mill Creek)
Source: Center for Workplace Health

Industry Total Lost Days Wage Replacements Lost Productivity HealthcareManufacturing 600,200 $141.3 $195.8 $316.3Government 389,400 $63.7 $86.1 $6.1Health Services 342,600 $34.7 $54.0 $181.3Retail 254,600 $15.8 $27.7 $115.2Construction 167,500 $22.0 $29.3 $95.5Accommodation and Restaurants 153,600 $5.3 $6.7 $48.5Administrative Services 100,500 $6.7 $10.8 $47.6Finance 81,400 $13.1 $30.3 $52.0Professional Services 80,200 $8.7 $6.2 $49.0Wholesale 67,900 $9.8 $16.6 $37.5Other Services 52,500 $3.6 $6.0 $36.8Information 48,200 $9.0 $16.8 $39.6Transportation 46,500 $6.7 $6.4 $19.2Arts and Culture 28,200 $1.1 $1.7 $15.5Real Estate 24,900 $2.6 $4.1 $12.8Educational Services 14,600 $1.0 $2.1 $10.7Management 10,400 $1.5 $3.9 $8.2Agriculture 10,100 $0.9 $0.9 $2.5Utilities 1,223 $0.3 $0.4 $0.9Mining 1,203 $0.2 $0.3 $1.4Total 2,471,000 $328.5 $502.4 $1,421.6

Snohomish County: Time Loss by industryAverage time loss varies by industry: 7 – 13 days/year• Blended average: 9.2
days/year• 31% sick days• 34% disability, WC, FMLA• 35% absence on the job /
presenteeism
Transportation 12.6Health Services 11.1Utilities 10.7Government 10.6Construction 9.7Manufacturing 9.5Finance 9.2Agriculture 9.1Mining 9.0Educational Services 8.9Real Estate 8.8Wholesale 8.5Administrative Services 8.5Information 8.4Management 8.3Arts and Culture 8.0Other Services 8.0Retail 7.7Professional Services 7.6Accommodation and Restaurants 7.5

Lost Work Days Vary by LocationAfter adjusting for employment density, different areas of Snohomish County experience different levels of cost burden based on the industry mix. > When the health costs of lost work are normalized by population instead of
acreage, new hotspots and gaps appear.
> The Mill Creek area, which has high health costs per acre, has much lower costs when normalized by population.
> Rural areas with lower populations, like tracts in north and east Snohomish County, have higher health costs of lost work per person due to their lower populations.
> There are several areas with both high populations and high health costs per person:
> The Mukilteo-Everett area, a major manufacturing center> The Arlington area, another area with a concentration of
manufacturing employment> The Lynnwood region> The Monroe area

Real economic impact Average lost workday: $825 in lost GDP GDP is a metric of economic
productivity, so assessing how lost work days affect GDP gives valuable insight into how industry productivity could improve by lightening the burden and costs of health.
GDP per employee in Snohomish County is approximately $215,341
On average, 261 days of lost work equal one employee worth of GDP.
GDP lost per work day varied significantly from industry to industry.
Industry GDP Lost per Work DayReal Estate $11,901Utilities $10,761Information $5,753Management $3,167Transportation $1,628Mining $1,611Professional Services $1,514Wholesale $1,474Finance $897Government $638Educational Services $634Other Services $557Arts and Culture $552Agriculture $538Manufacturing $510Administrative Services $501Retail $439Construction $418Health Services $385Accommodation and Restaurants $242All Industry Average $825
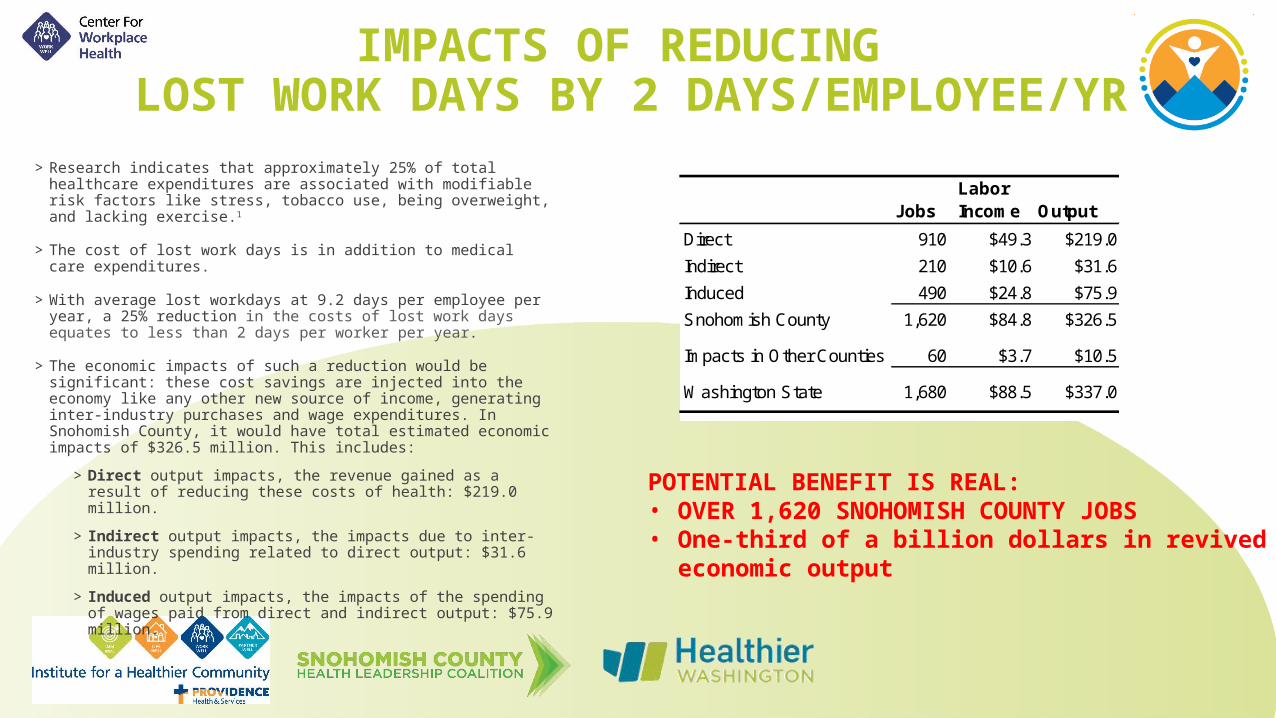
IMPACTS OF REDUCING LOST WORK DAYS BY 2 DAYS/EMPLOYEE/YR
>Research indicates that approximately 25% of total healthcare expenditures are associated with modifiable risk factors like stress, tobacco use, being overweight, and lacking exercise.1
>The cost of lost work days is in addition to medical care expenditures.
>With average lost workdays at 9.2 days per employee per year, a 25% reduction in the costs of lost work days equates to less than 2 days per worker per year.
>The economic impacts of such a reduction would be significant: these cost savings are injected into the economy like any other new source of income, generating inter-industry purchases and wage expenditures. In Snohomish County, it would have total estimated economic impacts of $326.5 million. This includes:
>Direct output impacts, the revenue gained as a result of reducing these costs of health: $219.0 million.
> Indirect output impacts, the impacts due to inter-industry spending related to direct output: $31.6 million.
> Induced output impacts, the impacts of the spending of wages paid from direct and indirect output: $75.9 million.
JobsLabor Income Output
Direct 910 $49.3 $219.0Indirect 210 $10.6 $31.6Induced 490 $24.8 $75.9Snohomish County 1,620 $84.8 $326.5
Impacts in Other Counties 60 $3.7 $10.5
Washington State 1,680 $88.5 $337.0
POTENTIAL BENEFIT IS REAL: • OVER 1,620 SNOHOMISH COUNTY JOBS• One-third of a billion dollars in revived economic output

FISCAL IMPACTS OF REDUCING LOST WORK DAYS BY 2 DAYS/EMPLOYEE
• Sales tax - $2.3 million in additional tax revenues
• B & O tax - $1.5 million in additional tax revenues
• Other taxes - $300,000 in additional tax revenues

Snohomish County Workforce
• Fastest growing county in the state
• Employment growth is currently at 2.7%
• Unemployment is 4.8%

Average Annual Growth Rate,
Snohomish County, 2013-2018
Source: Employment Security Department/LMPA; projections
CONSTRUCTION EDUCATION and HEALTH SERVICES
PROFESSIONAL and BUSINESS SERVICES LEISURE and HOSPITALITY
WHOLESALE TRADE TRANSPORTATION, WAREHOUSING AND UTILITIES
TOTAL NONFARM OTHER SERVICES
FINANCIAL ACTIVITIES RETAIL TRADE INFORMATION GOVERNMENT
MANUFACTURING NATURAL RESOURCES and MINING
-10% -8% -6% -4% -2% 0% 2% 4% 6%5.0%
3.4%3.4%
2.2%1.9%1.9%
1.6%1.5%
1.4%1.4%1.3%
1.2%-0.7%
-7.8%

Net impact of Industry Growth on Time Loss
• Shift in industry mix is increasing the time loss burden on employers• Increase of 4,291 employees per year would add 39,839 additional lost work days…
• If total employment rises by 1.6%/year…• Total time loss rises by 1.8%/year• Time loss is rising 13% faster than employment• Adds increasing burden on Sno Co employers and the local economy – IN
ADDITION to healthcare costs rising faster than GDP.
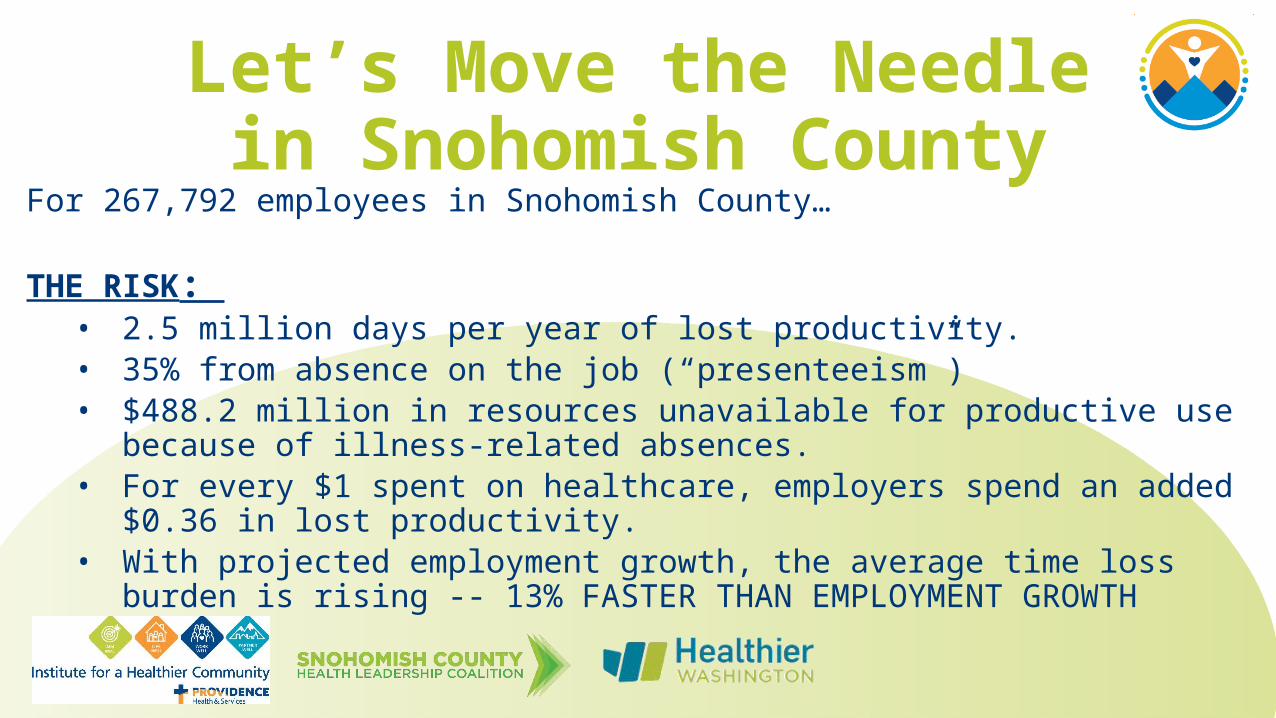
Let’s Move the Needlein Snohomish County
For 267,792 employees in Snohomish County…
THE RISK: • 2.5 million days per year of lost productivity.• 35% from absence on the job (“presenteeism”)• $488.2 million in resources unavailable for productive use because of illness-related
absences.• For every $1 spent on healthcare, employers spend an added $0.36 in lost productivity.• With projected employment growth, the average time loss burden is rising -- 13%
FASTER THAN EMPLOYMENT GROWTH

Let’s Move the Needlein Snohomish County
THE OPPORTUNITIES:
• It’s the right thing to do: Workforce & employment are the KEY DETERMINANTS of health
• Improvements could generate thousands of jobs & hundreds of millions in economic growth.
• Improving time loss by 2 days per year … will generate 1,620 new jobs… 37% of projected job growth
• If we could do something that generates up to 37% more jobs than now projected…it’s a bet we’d take.
• Huge opportunity to make this beautiful place – a healthier place• That’s the conversation we want to have next. What practical solutions can employers
begin pursuing today to improve wellness and productivity?