![AYEΔadeRS · 2016. 4. 18. · ABAYE0633 glucose dehydrogenase [pyrroloquinoline-quinone] precursor (Quinoprotein glucose DH) gcd -0.68 0.62 0.04 ABAYE0351 glutamate dehydrogenase](https://static.fdocuments.net/doc/165x107/60ab45296a50e12d13181ce1/ayeaders-2016-4-18-abaye0633-glucose-dehydrogenase-pyrroloquinoline-quinone.jpg)
Enzyme electrode for glucose based on the quinoprotein glucose dehydrogenase
4
ANALYST, AUGUST 1985, VOL. 110 925 Enzyme Electrode for Glucose Based on the Quinoprotein Glucose Dehydrogenase William H. Mullen" and Stephen J. Churchouse Department of Physical Chemistry, The University, Newcastle upon Tyne NE1 7RU, UK and Pankaj M. Vadgama Department of Clinical Biochemistry and Metabolic Medicine, The University, Newcastle upon Tyne NE24HH, UK Glucose dehydrogenase (E.C. 1.1.99.17) has been used to produce an amperometric enzyme electrode for glucose. With phenazine ethosulphate as the electron mediator, a linear response for up to 0.8 mM glucose was obtained with response times of 3-5 min. 2,6-Dichlorophenolindophenol as mediator gave long (> 30 min) response times, but the measurement time was reduced to 30 s by monitoring the first-order differential of the response; the derivatised signal allowed temporal separation of the enzyme-mediated signal from electrochemical interference. Whole blood glucose measurements were correlated with a spectro- photometric method based on glucose oxidase (y = 0.84~ + 0.67, r = 0.963, n = 36). Keywords: Glucose determination; enzyme electrode; glucose dehydrogenase; blood measurement The practical measurement of glucose by enzyme electrodes has generally been achieved by the use of glucose oxidase (E.C. 1.1.3.4); with amperometric sensors either consumption of oxygen (co-substrate for the enzymic reaction) or liberation of hydrogen peroxide (product) has been measured.1 More recently the enzyme reaction has been monitored indirectly using ferricyanide2 and ferrocenes as electron mediators. With this latter approach it has been possible to obtain measurements that are independent of background po2 variation and which, because of the low redox potential of the mediators, allow operation of the amperometric sensors at lower polarising voltages. Glucose dehydrogenase (E.C. 1.1.99.17), isolated from Pseudornonas and Acinetobacter species,4 is one of the recently characterised class of quinoprotein enzymes in which the prosthetic group is a pyrroloquinoline quinone (PQQ) .5 The enzyme catalyses the oxidation of glucose using a variety of electron acceptors, including phenazine ethosulphate (N- ethyldibenzopyrazine) (PES) [EM, (the midpoint redox potential of a couple at pH 7) = -0.172 V versus Ag - AgCI], ferricyanide and 2,6-dichlorophenolindophenol (DCPIP) (EM7 = -0.005 V versus Ag - AgC1): D-glucose + acceptor = D-gluconolactone + reduced acceptor The enzyme cannot use oxygen as an electron acceptor. In contrast to glucose dehydrogenase (E.C. 1.1.1.47) from Bacillus cereus the enzyme does not require NAD or NADP. Incorporation of the Acinetobacter enzyme into an enzyme electrode is described, with PES and DCPIP as electron acceptors between the enzyme and, a polarised platinum electrode. Optimisation of the basic system has enabled glucose to be measured in diluted whole blood. Experimental Reagents All reagents were purchased from BDH Chemicals (Poole, Dorset) unless stated otherwise. PES, DCPIP, bovine serum albumin (Fraction V) and sodium heparin were purchased from Sigma (Poole). Glutaraldehyde (25% aqueous solution) was from Aldrich Chemical Company (Milwaukee, WI). Glucose dehydrogenase (120 units mg-1) from Acinetobacter culcoaceticus was a gift from Dr. S. Collins (ICI Agricultural * To whom correspondence should be addressed. Division, Billingham, Cleveland). The enzyme preparation was stored in ammonium sulphate solution at 4 OC. Apparatus A Radiometer E50 Clark-type oxygen electrode was connec- ted to a digital acid - base analyser (Radiometer PHM 72) and the output monitored with a Gallenkamp Euroscribe chart recorder. The polarising voltage applied to the 25 pm diameter Pt working electrode of the sensor was varied against an Ag - AgCl reference electrode by altering the voltage output of the internal battery source of the analyser (all polarising voltages are quoted with reference to Ag - AgC1). For the kinetic-mode measurements the analyser was inter- faced to an Apple 2e microcomputer via an IEEE 488 linked Hewlett-Packard 3478A digital multimeter; this allowed the derivatised electrode signal to be readily followed and permitted automatic computation of glucose concentration. Enzyme Electrode Construction and Operation Electrode membranes bearing cross-linked enzyme are pre- pared by initially mixing 10 p1 of enzyme solution (1 mg ml-1) with 10 pl of 100 mg ml-1 serum albumin and 5 pl of 25% glutaraldehyde on a glass slide. The mixture is immediately spread over the rough side of a 1.5 cm diameter polycarbonate ultrafiltration membrane (1 pm pore size, obtained from Nuclepore, Pleasanton, CA) and covered by a second polycarbonate membrane with its rough surface towards the enzyme layer. The enzyme is then allowed to cross-link and dry at room temperature for 1 h, following which the membranes are separated. One membrane is mounted over the Clark electrode with the enzyme layer in direct contact with the Pt working electrode; the internal electrolyte in all instances has the same composition as the external assay solution. For measurements using PES, the assay buffer (10 ml) was 0.1 M sodium carbonate solution containing 50-p~ PES and the Clark electrode was polarised at 0.65 V. Care was required to prevent photo-decomposition of PES during measurement, and both the electrode and the assay solutions were shielded from Iight by means of aluminium foil. For measurements using DCPIP the buffer (10 ml) was 0.1 M sodium carbonate solution containing 10-6-10-2 M DCPIP; the polarising potential was 0.4 V. Glucose (0.5 M), ascorbic acid (20 mM), cysteine (20 mM), uric acid (2 mM) and glutathione (20 mM) Published on 01 January 1985. Downloaded by Tulane University on 22/09/2013 10:14:28. View Article Online / Journal Homepage / Table of Contents for this issue
Transcript of Enzyme electrode for glucose based on the quinoprotein glucose dehydrogenase

ANALYST, AUGUST 1985, VOL. 110 925
Enzyme Electrode for Glucose Based on the Quinoprotein Glucose Dehydrogenase
William H. Mullen" and Stephen J. Churchouse Department of Physical Chemistry, The University, Newcastle upon Tyne NE1 7RU, UK and Pankaj M. Vadgama Department of Clinical Biochemistry and Metabolic Medicine, The University, Newcastle upon Tyne NE24HH, UK
Glucose dehydrogenase (E.C. 1.1.99.17) has been used to produce an amperometric enzyme electrode for glucose. With phenazine ethosulphate as the electron mediator, a linear response for up to 0.8 mM glucose was obtained with response times of 3-5 min. 2,6-Dichlorophenolindophenol as mediator gave long (> 30 min) response times, but the measurement time was reduced to 30 s by monitoring the first-order differential of the response; the derivatised signal allowed temporal separation of the enzyme-mediated signal from electrochemical interference. Whole blood glucose measurements were correlated with a spectro- photometric method based on glucose oxidase ( y = 0 . 8 4 ~ + 0.67, r = 0.963, n = 36). Keywords: Glucose determination; enzyme electrode; glucose deh ydrogenase; blood measurement
The practical measurement of glucose by enzyme electrodes has generally been achieved by the use of glucose oxidase (E.C. 1.1.3.4); with amperometric sensors either consumption of oxygen (co-substrate for the enzymic reaction) or liberation of hydrogen peroxide (product) has been measured.1 More recently the enzyme reaction has been monitored indirectly using ferricyanide2 and ferrocenes as electron mediators. With this latter approach it has been possible to obtain measurements that are independent of background po2 variation and which, because of the low redox potential of the mediators, allow operation of the amperometric sensors at lower polarising voltages.
Glucose dehydrogenase (E.C. 1.1.99.17), isolated from Pseudornonas and Acinetobacter species,4 is one of the recently characterised class of quinoprotein enzymes in which the prosthetic group is a pyrroloquinoline quinone (PQQ) .5
The enzyme catalyses the oxidation of glucose using a variety of electron acceptors, including phenazine ethosulphate (N- ethyldibenzopyrazine) (PES) [ E M , (the midpoint redox potential of a couple at pH 7) = -0.172 V versus Ag - AgCI], ferricyanide and 2,6-dichlorophenolindophenol (DCPIP) ( E M 7 = -0.005 V versus Ag - AgC1): D-glucose + acceptor = D-gluconolactone + reduced acceptor The enzyme cannot use oxygen as an electron acceptor. In contrast to glucose dehydrogenase (E.C. 1.1.1.47) from Bacillus cereus the enzyme does not require NAD or NADP.
Incorporation of the Acinetobacter enzyme into an enzyme electrode is described, with PES and DCPIP as electron acceptors between the enzyme and, a polarised platinum electrode. Optimisation of the basic system has enabled glucose to be measured in diluted whole blood.
Experimental Reagents All reagents were purchased from BDH Chemicals (Poole, Dorset) unless stated otherwise. PES, DCPIP, bovine serum albumin (Fraction V) and sodium heparin were purchased from Sigma (Poole). Glutaraldehyde (25% aqueous solution) was from Aldrich Chemical Company (Milwaukee, WI). Glucose dehydrogenase (120 units mg-1) from Acinetobacter culcoaceticus was a gift from Dr. S. Collins (ICI Agricultural
* To whom correspondence should be addressed.
Division, Billingham, Cleveland). The enzyme preparation was stored in ammonium sulphate solution at 4 OC.
Apparatus A Radiometer E50 Clark-type oxygen electrode was connec- ted to a digital acid - base analyser (Radiometer PHM 72) and the output monitored with a Gallenkamp Euroscribe chart recorder. The polarising voltage applied to the 25 pm diameter Pt working electrode of the sensor was varied against an Ag - AgCl reference electrode by altering the voltage output of the internal battery source of the analyser (all polarising voltages are quoted with reference to Ag - AgC1). For the kinetic-mode measurements the analyser was inter- faced to an Apple 2e microcomputer via an IEEE 488 linked Hewlett-Packard 3478A digital multimeter; this allowed the derivatised electrode signal to be readily followed and permitted automatic computation of glucose concentration.
Enzyme Electrode Construction and Operation Electrode membranes bearing cross-linked enzyme are pre- pared by initially mixing 10 p1 of enzyme solution (1 mg ml-1) with 10 pl of 100 mg ml-1 serum albumin and 5 pl of 25% glutaraldehyde on a glass slide. The mixture is immediately spread over the rough side of a 1.5 cm diameter polycarbonate ultrafiltration membrane (1 pm pore size, obtained from Nuclepore, Pleasanton, CA) and covered by a second polycarbonate membrane with its rough surface towards the enzyme layer. The enzyme is then allowed to cross-link and dry at room temperature for 1 h, following which the membranes are separated. One membrane is mounted over the Clark electrode with the enzyme layer in direct contact with the Pt working electrode; the internal electrolyte in all instances has the same composition as the external assay solution.
For measurements using PES, the assay buffer (10 ml) was 0.1 M sodium carbonate solution containing 5 0 - p ~ PES and the Clark electrode was polarised at 0.65 V. Care was required to prevent photo-decomposition of PES during measurement, and both the electrode and the assay solutions were shielded from Iight by means of aluminium foil. For measurements using DCPIP the buffer (10 ml) was 0.1 M sodium carbonate solution containing 10-6-10-2 M DCPIP; the polarising potential was 0.4 V. Glucose (0.5 M), ascorbic acid (20 mM), cysteine (20 mM), uric acid (2 mM) and glutathione (20 mM)
Publ
ishe
d on
01
Janu
ary
1985
. Dow
nloa
ded
by T
ulan
e U
nive
rsity
on
22/0
9/20
13 1
0:14
:28.
View Article Online / Journal Homepage / Table of Contents for this issue

926 ANALYST, AUGUST 1985, VOL. 110
stock solutions were made up in 0.1 M sodium carbonate solution, pH 8.75.
Computer-controlled Kinetic Analysis Computer software was devised to compute a differential signal over pre-selected time intervals. The programming involved machine-code subroutines to allow the following: continuous, moving graphical display of the derived data; specification of program options such as chart speed, sensitiv- ity and offset prior to and during an assay; and on-screen digital readout of the averaged differential response over any given time period.
For this work it was found suitable to obtain data points at 3-s intervals.
Results Measurements Using PES At PES concentrations > 500 WM the electrode signal showed considerable base-line drift (equivalent to -0.5 mM min-1 of glucose), whereas at <5 WM PES, stability could be achieved but responses became sluggish, requiring 10-15 min to reach a plateau. A concentration of 50 WM PES was selected for glucose measurements as this gave stable readings over 2 h and response times of 3-5 min. The response to glucose increased with increasing pH up to the limit of PES stability (pH < 10)6 (see Fig. 1). The plateau region of the pH profile (ca. pH 8.7) was used in measurements and gave a linear current response up to 0.8 mM glucose (Fig. 2). Above 1 mM glucose the signal to noise ratio decreased sharply, and at >1.4 mM glucose there was an irreversible fall-off in response.
I I I I
7 8 9 PH
Fig. 1. pH profile of the PES-mediated response
30 I I
25 . N I E
2 0 .
3 r c .-
1 5 - Q, U c
1 0 - L
S 0
0 0.2 0.4 0.6 0.8 1 1.2 1.4 [G lucose]/m~
Fig. 2. PES-mediated response of glucose dehydrogenase
Measurements Using DCPIP A stable base line was obtained using DCPIP concentrations up to 10 mM, but above 1 mM DCPIP there was a loss in response of up to 50% after 24 h. Although sensitivity at lower DCPIP concentrations was reduced (Fig. 3), stability improved and 0.2 mM DCPIP was used for glucose assays as this provided a stable electrode output for up to 18 h. A major potential drawback with DCPIP was the long response times to steady state (30-60 min); however, as the output signal increased linearly with time over the first 5 min, the first-order differential of the electrode response could be easily followed. Computer calculation of the differential allowed measure- ments to be taken within 15 s. With this kinetic mode of analysis, as with the steady-state response, linearity could be achieved for up to 0.25 mM glucose only. However, linearisa- tion in the range 0.1-1 mM glucose was possible either by plotting the reciprocal of the output current against the reciprocal of glucose concentration (ie., a Lineweaver - Burke plot); or by plotting current against the square root of the glucose concentration (Fig. 4). The latter method, giving greater accuracy over the required range, was used for measurements. The pH profile of the enzyme electrode response showed a maximum at pH 9.75 (Fig. 5 ) , but as with PES there was a plateau region at ca. pH 8.7. Measurements were taken at pH 8.75.
The system was found to respond to direct electrochemical interferents in solution (viz., ascorbate, urate, reduced glutathione and cysteine). These species reached a near- equilibrium response more rapidly than the enzyme-mediated glucose signal, showing up as peaks on the differential output after 3-10 s; this is illustrated in Fig. 6(a) for ascorbate interference. The height of the peak reflected the concentra-
Log([ DCPIP]/M)
Fig. 3. Effect of DCPIP concentration on the response to 0.5 mM glucose
40 -
I I I I
0.1 0.25 0.5 1 1.5 [GlUcose]/m~
Fig. 4. DCPIP-mediated response of glucose dehydrogenase: current differential versus glucose concentration
Publ
ishe
d on
01
Janu
ary
1985
. Dow
nloa
ded
by T
ulan
e U
nive
rsity
on
22/0
9/20
13 1
0:14
:28.
View Article Online
ANALYST, AUGUST 1985, VOL. 110 927
c I
30 . ? 2 3
20 - al m m
I 1 1 I
6 7 8 9 1 0 1 1
PH
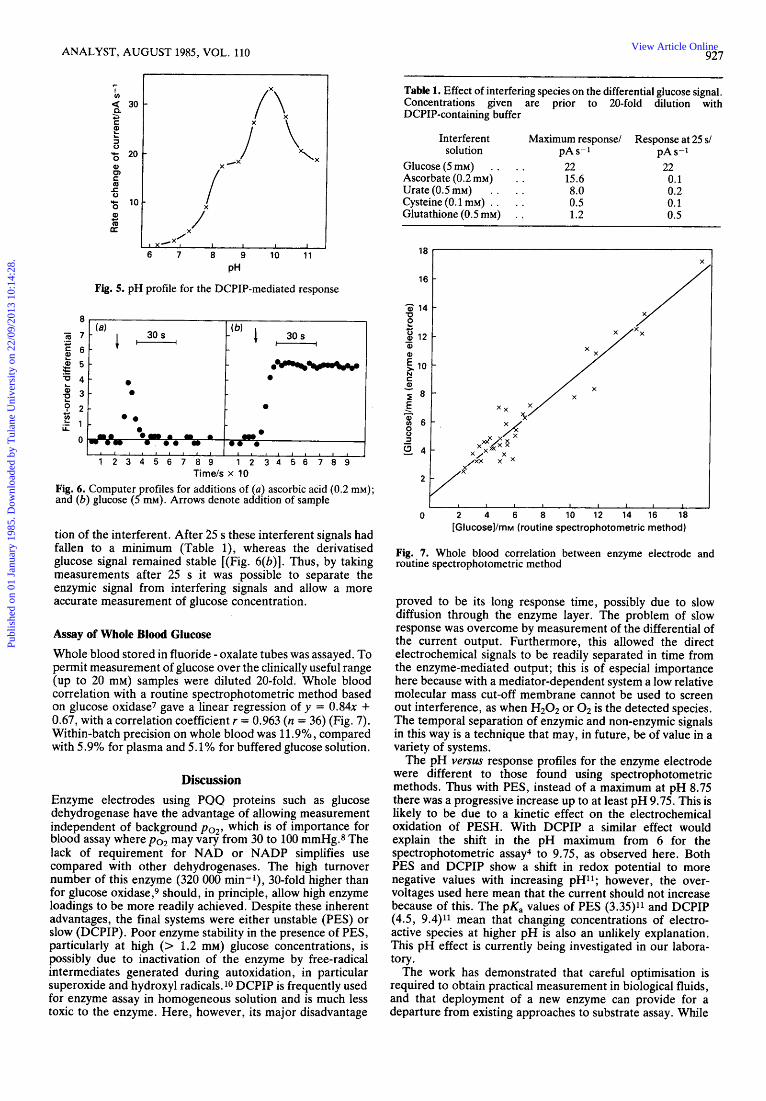
Fig. 5. pH profile for the DCPIP-mediated response
8
- (@ 1 , 30s , (a) 30 s I - 7i .- 7 - 4-
L 0 0
0 0 0 Om- -" . oo-o 1 1 , 1 1 1 1 1 1 , 1 1 1 1 I I 1
1 2 3 4 5 6 7 8 9 1 2 3 4 5 6 7 8 9 Time/s x 10
Fig. 6. Computer profiles for additions of (a) ascorbic acid (0.2 mM); and (b) glucose ( 5 mM). Arrows denote addition of sample
Table 1. Effect of interfering species on the differential glucose signal. Concentrations given are prior to 20-fold dilution with DCPIP-containing buffer
Interferent Maximum response/ Response at 25 s/ solution pA s-1 pA s-1
Glucose(5mM) . . . . 22 Ascorbate (0.2 mM) . . 15.6 Urate(0.5m~) . . . . 8.0 Cysteine (0.1 rnM) . . . . 0.5 Glutathione (0.5 rnM) . . 1.2
22 0.1 0.2 0.1 0.5
18 X
tion of the interferent. After 25 s these interferent signals had fallen to a minimum (Table l) , whereas the derivatised glucose signal remained stable [(Fig. 6(b)]. Thus, by taking measurements after 25 s it was possible to separate the enzymic signal from interfering signals and allow a more accurate measurement of glucose concentration.
Assay of Whole Blood Glucose Whole blood stored in fluoride - oxalate tubes was assayed. To permit measurement of glucose over the clinically useful range (up to 20 mM) samples were diluted 20-fold. Whole blood correlation with a routine spectrophotometric method based on glucose oxidase7 gave a linear regression of y = 0 . 8 4 ~ + 0.67, with a correlation coefficient r = 0.963 (n = 36) (Fig. 7). Within-batch precision on whole blood was 11.9% , compared with 5.9% for plasma and 5.1% for buffered glucose solution.
Discussion Enzyme electrodes using PQQ proteins such as glucose dehydrogenase have the advantage of allowing measurement independent of background po2, which is of importance for blood assay where po:, may vary from 30 to 100 mmHg.8 The lack of requirement for NAD or NADP simplifies use compared with other dehydrogenases. The high turnover number of this enzyme (320 000 min-l), 30-fold higher than for glucose oxidase,g should, in principle, allow high enzyme loadings to be more readily achieved. Despite these inherent advantages, the final systems were either unstable (PES) or slow (DCPIP). Poor enzyme stability in the presence of PES, particularly at high (> 1.2 mM) glucose concentrations, is possibly due to inactivation of the enzyme by free-radical intermediates generated during autoxidation, in particular superoxide and hydroxyl radicals. 10 DCPIP is frequently used for enzyme assay in homogeneous solution and is much less toxic to the enzyme. Here, however, its major disadvantage
0 2 4 6 8 10 12 14 16 18 [GlUCOSe]imM (routine spectrophotometric method)
Fig. 7. Whole blood correlation between enzyme electrode and routine spectrophotometric method
proved to be its long response time, possibly due to slow diffusion through the enzyme layer. The problem of slow response was overcome by measurement of the differential of the current output. Furthermore, this allowed the direct electrochemical signals to be readily separated in time from the enzyme-mediated output; this is of especial importance here because with a mediator-dependent system a low relative molecular mass cut-off membrane cannot be used to screen out interference, as when H202 or 0 2 is the detected species. The temporal separation of enzymic and non-enzymic signals in this way is a technique that may, in future, be of value in a variety of systems.
The pH versus response profiles for the enzyme electrode were different to those found using spectrophotometric methods. Thus with PES, instead of a maximum at pH 8.75 there was a progressive increase up to at least pH 9.75. This is likely to be due to a kinetic effect on the electrochemical oxidation of PESH. With DCPIP a similar effect would explain the shift in the pH maximum from 6 for the spectrophotometric assay4 to 9.75, as observed here. Both PES and DCPIP show a shift in redox potential to more negative values with increasing pH11; however, the over- voltages used here mean that the current should not increase because of this. The pK, values of PES (3.35)" and DCPIP (4.5, 9.4)11 mean that changing concentrations of electro- active species at higher pH is also an unlikely explanation. This pH effect is currently being investigated in our labora- tory.
The work has demonstrated that careful optimisation is required to obtain practical measurement in biological fluids, and that deployment of a new enzyme can provide for a departure from existing approaches to substrate assay. While
Publ
ishe
d on
01
Janu
ary
1985
. Dow
nloa
ded
by T
ulan
e U
nive
rsity
on
22/0
9/20
13 1
0:14
:28.
View Article Online

928 ANALYST, AUGUST 1985, VOL. 110
whole blood assay with this system shows a poorer correlation with the spectrophotometric method than that achieved by glucose oxidase-based electrodes, the system could, neverthe- less, provide the basis for a rapid bedside analyser.
The use of the quinoprotein glucose dehydrogenase as a catalyst in the determination of glucose in a clinical setting has recently been described in a patent.12
We gratefully acknowledge support from the Science and Engineering Research Council and ICI.
References 1. Carr, P. W., and Bowers, L. D., “Immobilised Enzymes in
Analytical and Clinical Chemistry,” Academic Press, New York, 1980.
2. Mor, J. R., and Guarnaccia, R. ,Anal. Biochem., 1977,79,319. 3. Cass, A. E. G., Davis, G., Francis, G., Hill, H. A. O., Aston,
W. J., Higgins, I. J., Plotkin, E. V., Scott, L. D. L., and Turner, A. P. F., Anal. Chem., 1984, 56, 667.
4.
5 . 6. 7. 8.
9. 10.
11.
12.
Matshuchita, K., and Ameyama, M., Methods Enzymol., 1983, 89, 149. Duine, J. A., and Frank, J., Trends Biochem. Sci., 1981,6,278. Ghosh, R. , and Quayle, J. R., Anal. Biochem., 1979,99, 112. Trinder, P. , Ann. Clin. Biochem., 1969, 6 , 24. Latner, A. L., “Cantarow and Trumper’s Clinical Bioche- mistry,” Seventh Edition, Saunders, London, 1975,
Hauge, J. G., J. Biol. Chem., 1964, 239, 3630. Davis, G., and Thornalley, P. J., Biochim. Biophys. Acta, 1983, 724,456. Ksenzhek, 0. S. , Petrova, S. A., and Koldyazhny, M. V., Bioelectrochem. Bioenerg., 1977,4, 345. Imperial Chemical Industries, Eur. Pat., 94161A, 15th April, 1983.
p. 437.
Paper A5158 Received February 14th, I985 Accepted February 28th, 1985
Publ
ishe
d on
01
Janu
ary
1985
. Dow
nloa
ded
by T
ulan
e U
nive
rsity
on
22/0
9/20
13 1
0:14
:28.
View Article Online