Envy and Altruism in Hard Times1 - University of Wisconsin...
52
Envy and Altruism in Hard Times 1 Kenneth Scheve Yale University Preliminary and Incomplete August 2010 1 Paper prepared for presentation at the 2010 Annual Meetings of the American Political Science Association. I would like to thank Massimilliano Onorato for excellent research assistance and Yale Universitys MacMillan Center for International and Area Studies and the Institution for Social and Policy Studies for nancial support.
Transcript of Envy and Altruism in Hard Times1 - University of Wisconsin...

Envy and Altruism in Hard Times1
Kenneth Scheve
Yale University
Preliminary and Incomplete
August 2010
1Paper prepared for presentation at the 2010 Annual Meetings of the American Political ScienceAssociation. I would like to thank Massimilliano Onorato for excellent research assistance and YaleUniversity�s MacMillan Center for International and Area Studies and the Institution for Socialand Policy Studies for �nancial support.

Abstract
The politics of economic crises bring distributive economic con�ict to the fore of national
political debates. How economic activity is to be regulated and how policy should be used to
transfer resources between citizens become central political questions and the answers chosen
often in�uence the trajectory of policy for a generation or at least until the next crisis. This
paper investigates how social preferences, speci�cally envy and altruism, in�uence individual
policy opinions in these debates. I argue that social preferences have a powerful in�uence
on support for policy alternatives which in turn shape the incentives faced by politicians in
setting policy. I conduct original survey experiments in France and the United States and
provide strong evidence that individuals care both about how economic policy alternatives
a¤ect their own interests and how they in�uence the welfare of others. Their concern about
the welfare of others is consistent with inequality aversion� both envy and altruism. The
analysis focuses on key policy areas in the response to the current international economic
crisis: trade policy, �nancial sector regulation, and tax policy. This preliminary draft presents
the results from the United States only as the French survey is in the �eld.
1 Introduction
The politics of economic crises bring distributive economic con�ict to the fore of national
political debates. How economic activity is to be regulated and how policy should be used
to transfer resources between citizens become central political questions and the answers
chosen often in�uence the trajectory of policy for a generation or at least until the next
crisis. The current economic crisis has been no di¤erent. Around the world, governments
have struggled to arrive at new policies that regulate economic activity more e¤ectively, that
provide a stimulus to economic growth, and that address sometimes severe �scal imbalances.
These political debates have spurred everything from riots in Greece to tea parties in the
United States.
The political economic logic that informs these debates and ultimately the policies im-
plemented is complex and varies in important ways according to the economic and political
context of each country. Nonetheless, an essential element of many of these policy debates is
distributive� they are about who gets what� and as such, can be explained and understood
in light of a long tradition of scholarship on economic policymaking. This research focuses
on identifying the determinants of preferences over policy alternatives by the relevant groups
in society� e.g. voters, �rms, interest groups, politicians, bureaucrats, and the media in a
democratic setting� and the institutions that aggregate these preferences. This wide-ranging
literature provides a host of insights about why di¤erent actors or groups in society advo-
cate the policies that they do, why they make particular types of arguments, and why they
succeed or fail at getting what they want. Of particular relevance for understanding the po-
litical debate of policymaking in democracies during economic crises is the policy opinions of
individual citizens. Whether or not these opinions utlimately determine the policies chosen,
the opinions of voters and the sources of these opinions shape the strategies of all the other
actors in the political process.
This paper investigates how social preferences, or other-regarding preferences, in�uence
individual policy opinions about economic policymaking in the context of an economic cri-
1

sis. Building on previous research and focusing on trade, tax policy, and �nancial market
regulation, I argue that individual preferences over economic policies are shaped by consid-
erations of others, above and beyond the e¤ect of these policies on one�s own income. A
growing literature has explored theoretically and empirically the possibility that individuals
may have "other-regarding" preferences.1 One important approach assumes that individual
utility functions depend not only on the individual�s own material payo¤ but also on the
material payo¤s that others receive. These interdependent, social preferences could include
everything from altruism, for which utility increases with the well being of other people, to
spitefulness, for which utility decreases in the well being of others.
The theoretical framework that I develop in this paper for explaining how social prefer-
ences in�uence economic policy opinions emphasizes the form of social preferences known as
"inequity aversion," in which individuals are altruistic toward others if their material payo¤s
are below an equitable benchmark but envious of others whose payo¤s are above this level
(Fehr and Schmidt, 1999). I argue theoretically that individual attitudes about inequality�
both envy and altruism� lead to systematic di¤erences in support for trade protection across
di¤erent sectors of the economy, in support for taxing banking incomes, and in support for
higher income taxes to help reduce the budget de�cit. In each policy domain, individuals
not only consider how policy alternatives a¤ect their own interests but also how they a¤ect
the incomes of others relative to their own. This argument obviously relates to previous
research on inequality aversion but it also is relevant to previous research on the importance
of fairness concerns in redistributive policymaking. Inequality aversion as conceptualized
here is essentially a speci�c de�nition of what counts as a fair policy alternative in terms of
granting resources to some citizens or taking resources from others.2
1For reviews, see Sobel (2005), Fehr and Schmidt (2006), Levitt and List (2007), and DellaVigna (2009).2See Alesina and Giuliano (2009) for a recent review of research on preferences over redistribution. See
also Bartels (2008, especially Chapter 5) for a comprehensive analysis of egalitarian values in the UnitedStates. Previous research on the role of fairness has typically focused on how beliefs about the sources ofincome� e.g. hard work and e¤ort versus luck and connections� in�uence assessments of the fairness ofpolicy alternatives about redistribution (e.g. Alesina and Angeletos (2005)). Scheve and Stasavage (2010)argue that historically mobilization for mass warfare has had a substantial impact on the perceived fairnessof and support for progressive taxation.
2

The main objective of the paper is to evaluate empirically the role of inequality aversion
in opinion formation about economic policies in the context of the current �nancial crisis. To
do this, I conduct original survey experiments on national samples of individuals in France
(survey in the �eld and thus not included in this draft) and the United States. I pursue
two di¤erent types of empirical strategies in the anlaysis. First, I evaluate experimentally
how variation in the incomes of the bene�ciaries of various policies in�uence support for
those policies. I show that opinons about trade, �nancial market regulation, and tax policy
vary systematically with information provided about the incomes of those a¤ected by policy
alternatives. Respondents are generally more supportive of policies that bene�t lower income
recipients or create costs for higher income recipients. Second, I adopt a speci�c formalization
of inequality aversion, incorporate this utlilty function into standard models of policymaking,
and estimate structurally an equation of policy preferences. I �nd that individuals have
the social preferences of altruism and envy assumed in these models though the relative
importance of these motivations vary across issue areas. Econometrically identifying these
preferences lends considerable support to the main claim of this paper that envy and altruism
play a central role in distributive political con�ict over economic policies during times of
economic crises.
The estimates in this paper indicate that support for sector-speci�c trade protection in
the United States depends on both altruism and envy. For example, in the analysis of trade-
policy opinions, increasing the measure of altruism (the gap by which a respondent�s income
exceeds the income of the typical worker in the sector being considered for increased trade
protection) by two standard deviations raises the probability that respondents support trade
protection by 13 percentage points (about a 37% increase). Similarly, increasing the measure
of envy (the gap by which a respondent�s income lies below the income of the typical worker in
the sector being considered for increased trade protection) by two standard deviations, lowers
the probability that respondents support trade protection by 14 percentage points (about a
40% decrease). The equivalent quantities in the analysis of support for increases in the income
3

tax in order to help lower the de�cit were also substantively important. Increasing the envy
measure by two standard deviations, raises the probability that respondents support higher
income taxes by 24 percentage points (about a 50% increase) while increases in the altruism
measure by two standard deviations lowers the probability that respondents support higher
income taxes by 15 percentage points (about a 32% change). Similar results for envy, though
not altruism, are reported for policy opinions about taxing high banking incomes. Overall,
the analysis �nds substantial evidence that U.S. respondents exhibit inequity aversion in
their preferences over economic policy.
The paper contributes to the existing literature on economic policy preferences in at least
three ways. First, most previous research on economic policy opinions that emphasizes other
regarding preferences focuses on altruism rather than envy.3 This paper suggests that both
factors are important determinants of policy opinions. Second, previous research has for the
most part focused on particular ways in which other regarding preferences might in�uence a
speci�c policy issue while this paper adopts a common framework for understanding the role
of other-regarding preferences in the determination of economic policy preferences.4 Third,
the evidence in the existing literature on other-regarding preferences and public opinion
about economic policies is largely based on individual-level cross-sectional regressions with
very strong identi�cation assumptions and even, for these results, the evidence is often based
on indirect indicators open to multiple interpretations.5 The survey experiments conducted
here follow closely from the speci�c theoretical accounts of envy and altruism that are claimed
to be important for opinion formation and allow for a clearer identi�cation of the in�uence
3See discussion in Alesina and Giuliano�s (2009) review and in recent research such as Rueda and Pon-tusson (2010), but also see Bartels (2008, Chapter 5) for an exception.
4The area of economic policymaking that has most seriously considered a role for other-regarding prefer-ences is redistributive policymaking. See, for example, Luttmer (2001), Alesina and Glaeser (2004), Bartels(2008), and Rueda and Pontusson (2010). Work in other policy domains is less common but see Mans�eldand Mutz (2009) and Lu, Scheve, and Slaughter (2010) on trade policy.
5Again, this characterization is clearest for the literature on preferences about redistribution for whichthe most research on other-regarding preferences has been conducted. A typical empirical analysis in thisliterature might regress a measure of support for redistributive policies on an attitude measure such as leftideology or a general measure of psychological orientation and conclude that the partial correlation betweenthese measures is evidence of altruism. Examples of indirect evidence include studies which note di¤erencesin opinion support across sex or racial categories and infer di¤errences in altruism.
4

of other-regarding preferences.
The rest of the paper is organized as follows. In Section 2, I present a summary of the main
argument and outline the theoretical framework which informs the empirical work. Section
3 describes the survey and the design of the experiments, reports the basic experimental
treatment e¤ects, and �nally presents the analysis estimating the in�uence of envy and
altruism on opinion formation. Section 4 o¤ers some concluding remarks.
2 Social Concerns and Economic Policymaking
In June 2010, the United Kingdom like many countries around the world faced a massive
budget de�cit as a consequence of the �nancial crisis. At this time and in the context of
volatile European �nancial markets reacting to severe �scal problems across Europe, a new
Conservative and Liberal Democratic coalition government announced an emergency budget.
George Osborne, the Conservative Chancellor of the Exchequer, presented a memorable
budget not just for the agressiveness with which it attacked the UK�s budget de�cit but for
its insistence that the budget should be and was fair in terms of the distribution of the costs
of reducing the de�cit and in terms of protecting the most vulnerable. The Chancellor used
some form of the word �fair�fourteen times in the budget speech and more often than not
the meaning of fairness in the speech was that all citizens would su¤er in terms of decreased
bene�ts and higher taxes but that the rich would disproportionately sacri�ce to create a
more sustainable budget. In the Chancellor�s words ending the speech �The richest paying
the most and the vulnerable protected. That is our approach. Prosperity for all. That
is our goal.�6 This speech and much of the summer�s political debate about �scal policy
in the UK is an example of how ideas about distributional fairness, often essentially ideas
about inequality, can shape political preferences and debate about economic policymaking,
particularly in the context of economic crises.7
6See full text at http://www.hm-treasury.gov.uk/junebudget_speech.htm.7It is worth noting that the non-partisan Institute for Fiscal Studies, the leading tax think tank in the
UK, issued a report at the end of the summer 2010 examining the Government�s claims about the budget�s
5
This paper argues that this speech and so many like it are indicative of a preference
among voters for equality as well as policies that improve individual welfare. A growing
literature has explored theoretically and empirically the possibility that some individuals may
have other regarding preferences. Sobel (2005), Fehr and Schmidt (2006), and DellaVigna
(2009) provide reviews of the empirical evidence of these preferences and various theoretical
frameworks for understanding this evidence. One signi�cant approach in this literature is
models of social preferences which assume that individual utility functions depend not only
on the individual�s own material payo¤ but also on the material payo¤s that others receive.
The main idea is that individuals maximize their utility as they would in more conventional
self-interested models but they do not solely care about their own material outcomes. These
social preferences could include everything from altruism, for which utility increases with
the well being of other people, to spitefulness, for which utility decreases in the well being
of others.
One in�uential form of social preference in this literature is inequity aversion. Fehr and
Schmidt (1999), for example, posit that individuals are altruistic toward others if their mate-
rial payo¤s are below an equitable benchmark but envious of others whose payo¤s are above
this level. They propose a simple utility function to capture this idea and argue that it is
consistent with behavior commonly observed in a wide variety of experimental social interac-
tions such as dictator games, ultimatum games, trust games, public good games, punishment
games, and gift exchange games.8 Empirically the claim is not that all individuals are averse
to inequality but that there are at least a signi�cant proportion of individuals who are and
that this preference has an important e¤ect on social interactions.
In this paper, I apply the idea of inequality aversion to the explanation of policy opinions
about trade, the taxation of banking incomes, and income tax increases in order to balance
distributional consequences and conclusively proclaimed the new policies to be �clearly regressive�. Thisassessment has led to ongoing debate about the fairness of the government�s policies. The point of the speechand the debate for our purposes is simply that the government felt compelled to say that the budget shouldbe distributionally fair and claim that its proposals actually were.
8See Charness and Rabin (2002) for an important related alternative formalization of social preferencesand Sobel (2005) for a more general review.
6

the budget. The appendix presents a complete formal model of preferences for trade policy
(and will in the next draft do so for the other policy areas) and this section simply outlines
the general theoretical approach that informs the empirical work.
For each policy area, individuals are assumed to have a utility function of the following
general form:
ui = x0 +
nXl=1
ui(xl)��
n� 1Xi6=j
maxfIj � Ii; 0g ��
n� 1Xi6=j
maxfIi � Ij; 0g (1)
This utility function has two components: utility from consumption (x0+Pn
l=1 ui(xl)) and
disutility from inequality aversion (� �n�1
Pi6=j maxfIj � Ii; 0g �
�n�1
Pi6=j maxfIi � Ij; 0g).
Goods are indexed by l and individuals are indexed by i. x0 is the consumption of the
numeraire good 0 and xl is the consumption of non-numeraire good l. The utility functions
ui(�) are increasing functions which are di¤erentiable, separable, and strictly concave. Since
I assume that individuals consume their entire income (Ii), it is helpful to think about
utility from consumption essentially being utility from own income Ii.The term for inequality
aversion is same as the speci�cation in Equation (1) in Fehr and Schmidt (1999: 822). In
particular, Fehr and Schmidt specify one parameter (�) for �altruism" when Ii > I�i; and
the other parameter for �envy" (�) when Ii < I�i. This speci�cation of the utility function
implies that an individual would feel altruistic to those who earn less than him/her, and
feel envious to those who earn more at the same time. Consequently, in thinking about the
determinants of policy preferences in this framework, the central questions are how do the
policy alternatives in�uence an individual�s own income Ii and how do they a¤ect the income
of everyone else in society Ij.
For trade policy, I adopt a standard economic environment in which individuals earn
a return to their labor and a sector-speci�c skill or factor with which they are endowed,
there is an exogenous world price for each good, and more protectionist trade policies raise
7

domestic prices relative to the world price and in doing so the returns to those individuals
with sector-speci�c skills in that sector. As in the standard model, trade protection in one�s
own sector makes one better o¤ by increasing one�s own income while trade protection in
other sectors makes one worse o¤ by raising the prices of the goods one consumes. The
focus is on what policy opinions individuals have about trade protection in other sectors
and so the key departure from the standard model is that because individuals are inequality
averse, their preferences over sector-speci�c trade barriers are sensitive to the income levels
in a given sector. If for example, I earn more than the average worker in a given sector,
trade protection that raises the income of workers in that sector is, all else equal, welfare
improving for me� the altruism e¤ect. If, on the other hand, I earn less than the average
worker in a given sector, trade protection not only makes me worse o¤ as a consumer but it
makes me worse o¤ because the policy raises the income of someone already better o¤ than
I� the envy e¤ect.
The theoretical framework for the analysis of a new tax on banking incomes and an
increase in the income tax to balance the budget follows this same logic. Each policy al-
ternative for these issues may a¤ect an individuals own income and the income of others.
Setting aside the e¤ect of the policy on an individual�s own income, the expectation is that
there is a preference for policies that equalize income generally and more speci�cally that
individuals will be more (less) willing to subsidize (reduce) the income of those who earn less
than they do� that is, they will exhibit altruism in their policy opinions� and less (more)
willing to subsidize (reduce) the incomes of those who make more than they do� that is,
they will exhibit envy in their policy opinions. The key goal of the empirical work is to eval-
uate the hypotheses that altruism and envy in�uence policy opinions in these three areas of
economic policymaking.
8

3 Envy and Altruism in Economic Policy Preferences
In this section I use a national sample of individuals in the United States (French data analy-
sis in process) to provide a series of diverse empirical tests for evaluating the importance
of inequality aversion in opinion formation about economic policies. I pursue two di¤erent
types of empirical strategies in the anlaysis. First, I evaluate experimentally how variation
in the incomes of the bene�ciaries of various policies in�uence support for those policies. I
show that opinons about trade, �nancial market regulation, and tax policy vary systemati-
cally with information provided about the incomes of those a¤ected by policy alternatives.
Respondents are generally more supportive of policies that bene�t lower income recipients
or create costs for higher income recipients. Second, I adopt a speci�c formalization of in-
equality aversion, incorporate this utlilty function into standard models of policymaking, and
estimate structurally an equation of policy preferences. I �nd that individuals have the social
preferences of altruism and envy assumed in these models though the relative importance of
these motivations vary across issue areas.
3.1 Experimental Design
The empirical analysis is based on evidence from an original survey conducted in July and
August of 2010. The survey was conducted over the internet for a national sample of the
U.S. adult population with 2,485 respondents.9 The sample is a quota sample with quotas
set to target the U.S. adult population for employment status (working as an employee,
working self-employed, not working looking for a job, not working retired, not working
disabled, not working student, not working other). The sample is representative on the
matched characteristics and broadly representative of the U.S. adult population on other
observed characteristcs such as sex, age, education, and income (see appendix for descriptive
statistics), but it is not a random sample. As such, I will focus exclusively on analyses which
9The experiment was conducted by Qualtrics, www.qualtrics.com. The survey was reviewed and grantedan exemption by Yale University�s Human Subjects Review Committee.
9

take advantage of the various survey experiments conducted rather than making descriptive
inferences about the U.S. population. While it is possible that there are di¤erential treatment
e¤ects for the participants in this survey and a random sample of the U.S. population, this
seems unlikely to be the case.10 At the very least, the estimates reported here are analogous
to a large-scale laboratory experiment with participants that broadly represent the U.S.
population. This section describes three sets of experiments on trade policy, �nancial market
regulation, and tax policy, which were conducted as part of the survey.11
The �rst experiment investigates if individual policy preferences about sector-speci�c
trade protection exhibit inequality aversion. To do this, I randomly assigned respondents to
consider trade protection for industries with di¤erent wage levels and recorded their support
for sector-speci�c trade protection.
The question used to elicit support for sector-speci�c trade protection was:
There is an industry in the United States in which the average worker makes Xdollars per year. Some people favor establishing new trade barriers such as importtaxes and quotas because trade barriers would increase the wages of workers inthis industry. Others oppose new trade barriers because they would raise pricesthat consumers pay and hurt other industries. Do you favor or oppose these newtrade barriers?IF FAVOR: Do you strongly favor or only somewhat favor new trade barriers
for this industry?IF OPPOSE: Do you strongly oppose or only somewhat oppose new trade
barriers for this industry?
The value of X was assigned randomly across respondents to be equal to 18,000, 40,000,
or 80,000 dollars per year.12 These values were chosen so that respondents were considering
trade protection for low, average, and high wage industries. The low value of $18,000 cor-
responds to an income a bit higher than the total money income in 2007 for an adult who
10One important piece of evidence consistent with the argument that the experimental results reported hereare likely to be the same as for a random sample of the U.S. population is that the trade-policy experimentreported here is a replication of Lu, Scheve, and Slaughter (2010) which did use a random sample and theresults across the two experiments are very similar.11The order of the experiments was randomly rotated to avoid contamination across experiments.12We conducted several types of balance tests, each of which indicated that the observed characteristics
of the respondents were balanced across treatment groups.
10

worked full-time, year-round at the 10th percentile in the income distribution.13 Alterna-
tively, one can think about this low income amount as the wage earned by a worker who
worked full-time, year round at about $9.00 per hour or a bit higher than the minimum wage.
The average value was selected as a round value close to the median total money income in
2007 for an adult who worked full-time, year-round of $41,245. Similarly, the high wage of
$80,000 falls at about the 84th percentile in the total money income distribution in 2007.
It is important to compare the wording of this survey question to other questions ex-
amined in the literature on the determinants of trade-policy opinions. This question asks
respondents whether they favor new trade barriers for a single industry and consequently
is more narrowly focused than typical question formats which elicit opinions about general
trade policy across an entire economy. Moreover, although not stated explicitly, the word-
ing implies that the industry in question is not the industry in which the respondent works.
This question was selected because its sector focus allows the investigation of other regarding
preferences more cleanly than a general trade-policy question. The experimental manipula-
tion varies the income of others� in particular workers in another sector� rather than the
income of the individual respondent.14 Consequently, it is possible to investigate how varia-
tion in the income of the workers likely to bene�t from trade protection in�uences support
for sector-speci�c trade barriers. Moreover, I will be able to use variation in the income of
the workers likely to bene�t to estimate separately the in�uence of envy and altruism on
policy preferences.
The marginal responses to this question are consistent with the intention to elicit support
for sector-speci�c trade policies. Speci�cally, respondents are much less likely to give a
protectionist response when considering a single industry than when answering a question
about general trade policy. Again, with the caveat that the sample collected here is a quota
13The source for this data is the Current Population Survey, Annual Social and Economic Supplement,Table PINC-02.14See the appendix for an economic model consistent with the sector-speci�c focus of this trade policy
question. As the model makes clear, workers in other sectors are worse o¤ from trade protection in a givensector absent inequality aversion, but the critical di¤erence in welfare across the treatments is the income ofthe bene�ciary of the trade protection.
11

sample and not meant for describing the U.S. population, just 33.8% of respondents favor
new trade barriers while about two thirds of respondents are opposed.15 This ratio of two-to-
one against new sector-speci�c trade barriers contrasts with responses to more general trade
policy questions which, depending on question wording, tend to elicit anywhere from two-
to-one support for further trade barriers to equal support and opposition to new barriers
(see Scheve and Slaughter 2001b, Chapter 2). There are many possible explanations for
this di¤erence in marginal responses, including variation in the experimental treatments
corresponding to the average wage levels in the industry under consideration, but such
responses are not surprising given that the proposed policy change singles out a speci�c
industry for assistance.
The second experiment investigates if individual policy preferences about special income
taxes for workers in the banking industry exhibit inequality aversion.16 To do this, I ran-
domly assigned respondents to consider the introduction of a new tax on banker incomes
with di¤erent salaries at which the tax would apply. For this experiment, I also varied the
economic costs of the tax in order to probe the extent to which the importance of other-
regarding preferences vary with the assumed costs of the policy.
The question used to elicit support for a special bank income tax was:
One proposal being considered as part of the reform of the U.S. �nancialsystem is the introduction of a new tax on banker incomes. One version of thisproposal would be an additional tax of X dollars on all banking salaries above Ydollars per year. This additional tax could be used to help reduce the de�cit. Onecriticism of this proposal is that higher taxes are costly in terms of tax collectionand fewer incentives for bankers to work and invest. These costs might meanthat for every 1,000 dollars of lost income for bankers only Z dollars of revenueis raised to reduce the budget de�cit. Do you favor or oppose this new tax onbankers?IF FAVOR: Do you strongly favor or only somewhat favor this new tax on
bankers?IF OPPOSE: Do you strongly oppose or only somewhat oppose this new tax
15Note that despite the caveat about the sample, the marginal responses to this question are quite similarto those reported in Lu, Scheve, and Slaughter (2010) which was a random sample of the U.S. population.16I also conducted a related experiment on �nancial market regulation generally which will be discussed
brie�y below.
12

on bankers?
The values of X and Y were assigned randomly across respondents to be equal to 1,000,
2,000, and 3,000 dollars and 100,000, 200,000, and 300,000 dollars respectively.17 The values
of Z were assigned randomly across respondents to be equal to 900 and 500 dollars. The
values of X and Y were chosen so that respondents were considering a special tax on banking
incomes of comparable relative magnitude but applied at di¤erent income levels. While an
argument certainly could be made that a percentage tax rate might be more realistic, I chose
an absolute additional tax to keep the question simple and easy to understand. The values
of Z are set to correspond to a �Low Cost�and �High Cost�condition. For the �Low Cost�
treatment, the assumption is that incentive e¤ects of the tax and adminstrative costs are
relatively small while in the �High Cost�treatment they are relatively large. In each case,
the assumption is that the additional revenue collected is used to reduce the de�cit and
the reduction of the de�cit does not have a direct impact on the individual�s own income.18
Consequently, the experimental manipulation focuses on two dimensions, the income level
of the category of individuals likely to be harmed by the tax and the costliness of the tax.
The analysis will focus on evaluating how these two factors in�uence support for new taxes
on banking incomes and again, I will be able to use variation in the income of the workers
likely to be harmed by the tax to estimate separately the in�uence of envy and altruism on
policy preferences. Given the context of public debate about the �nancial crises, it is not
surprising that this tax received substantial support among respondents with 61.8 percent
of respondents favoring the tax.
The third experiment investigates if individual policy preferences about increasing income
taxes to decrease the budget de�cit exhibit inequality aversion. To do this, I randomly
assigned respondents to consider tax increases at di¤erent income levels.
17We conducted several types of balance tests, each of which indicated that the observed characteristicsof the respondents were balanced across treatment groups.18For example, this would be the case if the main bene�ciary of the transfer is the next generation of tax
payers. We eliminate all respondents working in the �nancial sector for this analysis so that there is nopossibility that the tax has a direct e¤ect on their own tax liabilities.
13
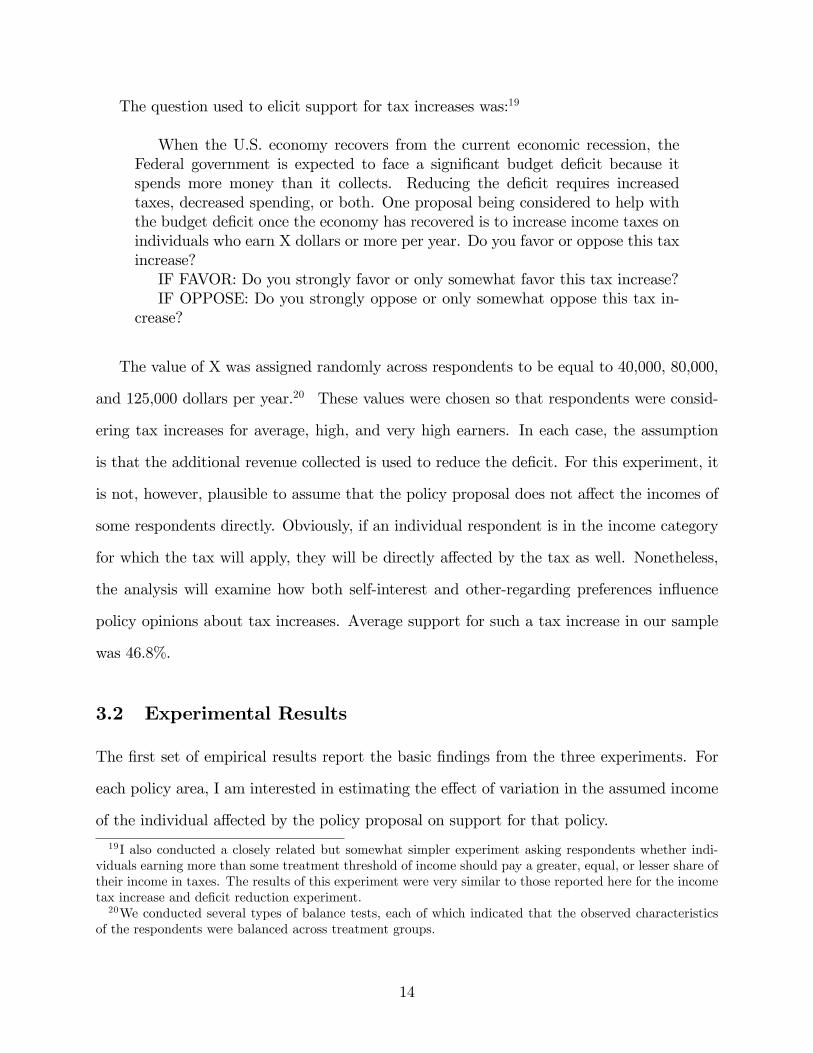
The question used to elicit support for tax increases was:19
When the U.S. economy recovers from the current economic recession, theFederal government is expected to face a signi�cant budget de�cit because itspends more money than it collects. Reducing the de�cit requires increasedtaxes, decreased spending, or both. One proposal being considered to help withthe budget de�cit once the economy has recovered is to increase income taxes onindividuals who earn X dollars or more per year. Do you favor or oppose this taxincrease?IF FAVOR: Do you strongly favor or only somewhat favor this tax increase?IF OPPOSE: Do you strongly oppose or only somewhat oppose this tax in-
crease?
The value of X was assigned randomly across respondents to be equal to 40,000, 80,000,
and 125,000 dollars per year.20 These values were chosen so that respondents were consid-
ering tax increases for average, high, and very high earners. In each case, the assumption
is that the additional revenue collected is used to reduce the de�cit. For this experiment, it
is not, however, plausible to assume that the policy proposal does not a¤ect the incomes of
some respondents directly. Obviously, if an individual respondent is in the income category
for which the tax will apply, they will be directly a¤ected by the tax as well. Nonetheless,
the analysis will examine how both self-interest and other-regarding preferences in�uence
policy opinions about tax increases. Average support for such a tax increase in our sample
was 46.8%.
3.2 Experimental Results
The �rst set of empirical results report the basic �ndings from the three experiments. For
each policy area, I am interested in estimating the e¤ect of variation in the assumed income
of the individual a¤ected by the policy proposal on support for that policy.
19I also conducted a closely related but somewhat simpler experiment asking respondents whether indi-viduals earning more than some treatment threshold of income should pay a greater, equal, or lesser share oftheir income in taxes. The results of this experiment were very similar to those reported here for the incometax increase and de�cit reduction experiment.20We conducted several types of balance tests, each of which indicated that the observed characteristics
of the respondents were balanced across treatment groups.
14

For the trade policy experiment, I constructed two measures of support for new trade
barriers based on responses to the trade policy question. Trade Opinion 1 is set equal to 1
for respondents who favor new trade barriers and is equal to zero for those opposed. Trade
Opinion 2 is set equal to 1 for respondents who oppose new trade barriers strongly, 2 for
respondents who oppose new trade barriers somewhat, 3 for respondents who favor new
trade barriers somewhat, and 4 for those who favor new trade barriers strongly. Each of the
measures is increasing in support for a protectionist policy.
Table 1 reports the mean estimates for each treatment category and di¤erence-in-means
estimates for each combination of treatments. These results provide substantial evidence
that support for sector-speci�c trade barriers are in�uenced by the average wage of workers
in the industry.
Support for new trade barriers is 11 percentage points higher (a 33% increase) for re-
spondents who considered protection for an industry with a low wage versus respondents
who considered protection for an industry with an average wage. This di¤erence was 20
percentage points (an over 80% increase) for respondents who considered protection for an
industry with a low wage versus respondents who considered protection for an industry
with a high wage. The di¤erences between the middle and high wage treatments are also
substantively and statistically signi�cant. The appendix reports additional estimates of dif-
ferences across treatment categories controlling for various demographic characteristics of
respondents. These estimates closely mirror those reported in Table 1.21
These experimental results provide strong evidence that increasing the average wage of
the industry under consideration for trade protection reduces support for new trade barriers
in that industry. The random assignment of the treatments in the experiment makes us
con�dent that these di¤erences are not attributable to other characteristics of the respondents
or other selection e¤ects. This result is consistent with the claim that inequality-averse
citizens prefer to support the incomes of low-wage sectors more than high-wage sectors.
21The estimates, including the magnitudes, are also quite close to those reported in Lu, Scheve, andSlaughter (2010).
15

MeanEstimatesbyTreatmentCategory
Di¤erenceEstimates
Low
Wage
MiddleWage
HighWage
$18,000
$40,000
$80,000
Low-Middle
Low-High
Middle-High
TradeOpinion1
0.444
0.332
0.239
0.112
0.205
0.093
(0.017)
(0.016)
(0.015)
(0.024)
(0.023)
(0.022)
0.000
0.000
0.000
TradeOpinion2
2.406
2.205
1.998
0.201
0.408
0.207
(0.036)
(0.035)
(0.031)
(0.050)
(0.047)
(0.046)
0.001
0.000
0.000
NumberofObservations
820
825
840
Table1:EstimatedE¤ectofAverageWageofIndustryonSupportforTradeProtection.Columns1-3reportmeanestimatesfor
TradeOpinion1andTradeOpinion2bytreatmentcategoryandthestandarderroroftheestimateinparentheses.Columns
3-6reportdi¤erence-in-meanstests,thestandarderrorinparentheses,andp-valueassumingunequalvariances.
16

There obviously may be alternative reasons that respondents demonstrate greater support
for protection in low-paying sectors but this pattern of support is certainly consistent with
inequality aversion.
For the banker�s tax experiment, I constructed two measures of support for a new tax
on banking incomes based on responses to the question described above. Bank Tax Opinion
1 is set equal to 1 for respondents who favor the new tax and is equal to zero for those
opposed. Bank Tax Opinion 2 is set equal to 1 for respondents who oppose the new tax
strongly, 2 for respondents who oppose the new tax somewhat, 3 for respondents who favor
the new tax somewhat, and 4 for those who favor the new tax strongly. Each of the measures
is increasing in support for higher taxes on banking incomes.
Table 2 reports the mean estimates for each income treatment category and di¤erence-in-
means estimates for each combination of income treatments.22 The estimates are separated
between the �Low Cost�and �High Cost�treatment conditions. These results provide sub-
stantial evidence that support for a new tax on banking incomes is in�uenced by the income
levels of those a¤ected by the tax under the �Low Cost�treatment condition but not under
the �High Cost�treatment condition.
Under the �Low Cost�treatment for which it is assumed that for every 1,000 dollars in
lost income for bankers, 900 dollars of revenue is raised, support for the additional tax on
high banker incomes is about 8 percentage points higher (a 14% increase) for respondents
who considered a tax increase that started for bankers earning 200,000 dollars per year or
more compared with respondents who considered a tax increase applied to bankers with
annual incomes of 100,000 dollars or more. The di¤erence between the 300,000 dollar and
100,000 dollar treatments was about 16 percentage points.
The results under the �High Cost�treatment for which it is assumed that for every 1,000
dollars in lost income for bankers, only 500 dollars of revenue is raised suggest small and often
statistically insigni�cant di¤erences across the main treatments. For example, support for
22Respondents working in the �nancial industry are excluded from the analysis.
17

MeanEstimatesbyTreatmentCategory
Di¤erenceEstimates
Low
CostTreatment
$100k
$200k
$300k
$100k-$200k
$100k-$300k
$200k-$300k
BankTaxOpinion1
0.560
0.636
0.718
-0.076
-0.158
-0.082
(0.025)(0.025)
(0.022)
(0.035)
(0.034)
(0.033)
0.031
0.000
0.014
BankTaxOpinion2
2.632
2.829
2.990
-0.197
-0.358
-0.161
(0.058)(0.057)
(0.054)
(0.081)
(0.079)
(0.078)
0.016
0.000
0.040
NumberofObservations
391
382
401
HighCostTreatment
$100k
$200k
$300k
$100k-$200k
$100k-$300k
$200k-$300k
BankTaxOpinion1
0.569
0.610
0.636
-0.041
-0.067
-0.026
(0.023)(0.025)
(0.025)
(0.034)
(0.034)
(0.035)
0.228
0.049
0.459
BankTaxOpinion2
2.709
2.825
2.861
-0.116
-0.152
-0.036
(0.053)(0.057)
(0.058)
(0.078)
(0.079)
(0.081)
0.139
0.054
0.658
NumberofObservations
448
390
382
Table2:EstimatedE¤ectofIncomeThresholdonSupportforNew
TaxonBankingIncomes.Columns1-3reportmean
estimatesforBankTaxOpinion1andBankTaxOpinion2bytreatmentcategoryandthestandarderroroftheestimatein
parentheses.Columns3-6reportdi¤erence-in-meanstests,thestandarderrorinparentheses,andp-valueassumingunequal
variances.Thetoppanelreportsthesequantitiesunderthe�LowCost�treatmentandthebottom
panelreportsthesequantitties
underthe�HighCost�treatment.Respondentsworkinginthe�nancialsectorarenotincludedintheseestimates.
18

the additional tax on high banker incomes is about 4 percentage points higher for respondents
who considered a tax increase that started for bankers earning 200,000 dollars per year or
more compared with respondents who considered a tax increase applied to bankers with
annual incomes of 100,000 dollars or more, and this di¤erence is not statistically signi�cant.
The di¤erence between the 300,000 dollar and 200,000 dollar treatments was even smaller.
The total di¤erence in support between the 100,000 and 300,000 treatment groups is almost
7 percentage points and the estimate is marginally statistically sign�cant.
The appendix reports additional estimates of di¤erences across treatment categories con-
trolling for various demographic characteristics of respondents. These estimates closely mir-
ror those reported in Table 2 for both the �Low Cost" and �High Cost�conditions.
This pattern of results suggests that respondents are more favorable of a bank tax that
applies to higher income bankers but only if such a policy is not too costly. This e¤ect
is consistent with inequality aversion in policy opinions but, as in the trade experiment,
could be driven by another mechanism. The strong results for the �Low Cost� condition
suggest that respondents are willing to incurr some e¢ ciency costs to implement policies
which create greater equality while the weaker results for the �High Cost�condition indicate
that this willingness has clear limits for many respondents. They are neither so envious nor
so altruistic to choose policies generating greater equality at any price.
For the de�cit reduction and income tax experiment, I constructed two measures of
support for raising income taxes on relatively high earners. Income Tax Opinion 1 is set
equal to 1 for respondents who favor raising income taxes and is equal to zero for those
opposed. Income Tax Opinion 2 is set equal to 1 for respondents who oppose raising income
taxes strongly, 2 for respondents who oppose raising taxes somewhat, 3 for respondents who
favor raising income taxes somewhat, and 4 for those who favor raising income taxes strongly.
Each of the measures is increasing in support for raising income taxes.
Table 3 reports the mean estimates for each income treatment category and di¤erence-in-
means estimates for each combination of income treatments. The top panel reports estimates
19
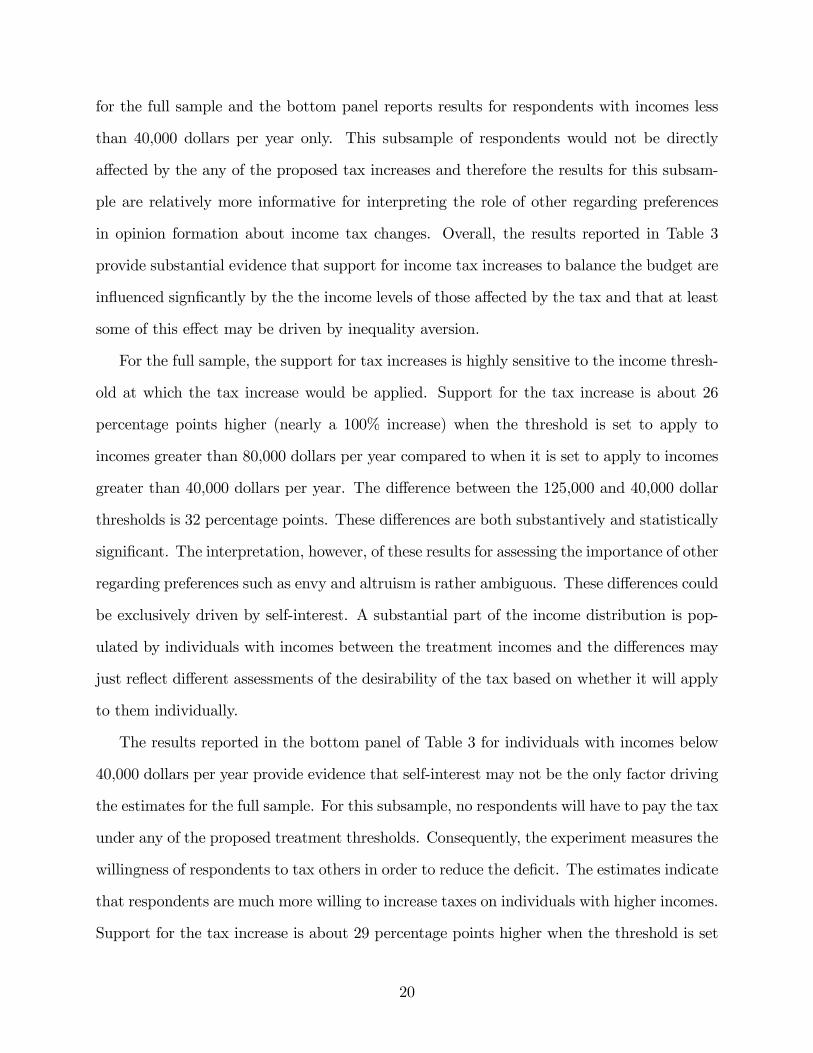
for the full sample and the bottom panel reports results for respondents with incomes less
than 40,000 dollars per year only. This subsample of respondents would not be directly
a¤ected by the any of the proposed tax increases and therefore the results for this subsam-
ple are relatively more informative for interpreting the role of other regarding preferences
in opinion formation about income tax changes. Overall, the results reported in Table 3
provide substantial evidence that support for income tax increases to balance the budget are
in�uenced sign�cantly by the the income levels of those a¤ected by the tax and that at least
some of this e¤ect may be driven by inequality aversion.
For the full sample, the support for tax increases is highly sensitive to the income thresh-
old at which the tax increase would be applied. Support for the tax increase is about 26
percentage points higher (nearly a 100% increase) when the threshold is set to apply to
incomes greater than 80,000 dollars per year compared to when it is set to apply to incomes
greater than 40,000 dollars per year. The di¤erence between the 125,000 and 40,000 dollar
thresholds is 32 percentage points. These di¤erences are both substantively and statistically
signi�cant. The interpretation, however, of these results for assessing the importance of other
regarding preferences such as envy and altruism is rather ambiguous. These di¤erences could
be exclusively driven by self-interest. A substantial part of the income distribution is pop-
ulated by individuals with incomes between the treatment incomes and the di¤erences may
just re�ect di¤erent assessments of the desirability of the tax based on whether it will apply
to them individually.
The results reported in the bottom panel of Table 3 for individuals with incomes below
40,000 dollars per year provide evidence that self-interest may not be the only factor driving
the estimates for the full sample. For this subsample, no respondents will have to pay the tax
under any of the proposed treatment thresholds. Consequently, the experiment measures the
willingness of respondents to tax others in order to reduce the de�cit. The estimates indicate
that respondents are much more willing to increase taxes on individuals with higher incomes.
Support for the tax increase is about 29 percentage points higher when the threshold is set
20

MeanEstimatesbyTreatmentCategory
Di¤erenceEstimates
FullSam
ple
$40k
$80k
$125k
$40k-$80k
$40k-$125k
$80k-$125k
IncomeTaxOpinion1
0.270
0.528
0.594
-0.258
-0.324
-0.067
(0.016)(0.017)
(0.017)
(0.023)
(0.023)
(0.024)
0.000
0.000
0.006
IncomeTaxOpinion2
1.791
2.492
2.687
-0.701
-0.896
-0.194
(0.038)(0.041)
(0.043)
(0.055)
(0.057)
(0.059)
0.000
0.000
0.001
NumberofObservations
792
862
831
LessThan
$40K
inIncomeSam
ple
$40k
$80k
$125k
$40k-$80k
$40k-$125k
$80k-$125k
IncomeTaxOpinion1
0.330
0.618
0.658
-0.288
-0.328
-0.040
(0.022)(0.024)
(0.024)
(0.033)
(0.033)
(0.034)
0.000
0.000
0.230
IncomeTaxOpinion2
1.970
2.732
2.891
-0.762
-0.921
-0.158
(0.053)(0.057)
(0.060)
(0.078)
(0.080)
(0.083)
0.000
0.000
0.056
NumberofObservations
436
411
404
Table3:EstimatedE¤ectofIncomeThresholdonSupportforIncomeTaxIncreasestoReducetheDe�cit.Columns1-3report
meanestimatesforIncomeTaxOpinion1andIncomeTaxOpinion2bytreatmentcategoryandthestandarderrorofthe
estimateinparentheses.Columns3-6reportdi¤erence-in-meanstests,thestandarderrorinparentheses,andp-valueassuming
unequalvariances.Thetoppanelreportsthesequantitiesforthefullsampleandthebottom
panelreportsthesequantittiesfor
thoserespondentswithpersonalincomeslessthan40,000dollarsperyear.
21

to apply to incomes greater than 80,000 dollars per year compared to when it is set to apply
to incomes greater than 40,000 dollars per year. The di¤erence between the 125,000 and
40,000 dollar thresholds is 33 percentage points. Thus, the magnitudes of the di¤erences
across treatment groups are broadly similar to those for the full sample.
The appendix reports additional estimates of di¤erences across treatment categories con-
trolling for various demographic characteristics of respondents. These estimates closely mir-
ror those reported in Table 3 for both the full sample and the lower income sample.
This pattern of results is broadly consistent with inequality aversion generally and with
envy in particular. Again, other mechanisms could also account for the results. In partic-
ular, in this case expectations about future income mobility could explain why respondents
are more willing to tax those with higher incomes. While keeping that caveat in mind, it
is important to note that many of the alternative explanations for any one of the policy
experiments is much less compelling as an account for all three experiments. For example,
income mobility is not likely to explain preferences about banking incomes or sector-speci�c
trade protection. Nonetheless, it would be useful to probe the results of these experiments
further to determine the extent to which they provide evidence for the importance of in-
equality aversion generally and envy and altruism spec�cally in the formation of economic
policy opinions and I turn to that task in the next section.
3.3 Estimation of Envy and Altruism Parameters
The analysis in this section is designed to estimate the envy and altruism parameters as
de�ned in Fehr and Schmidt�s (1999) formalization of inequality aversion and as applied
to the three areas of policymaking explored in this paper. The empirical strategy is to
derive an estimating equation from a model of policymaking in each area and to use the
data from the survey experiments to estimate the envy and altruism parameters in those
models. Importantly, the identi�cation strategy relies on variation from the experimental
treatments to identify the envy and altruism parameters. A full derivation of the theoretical
22

models and estimating equations is reported in the appendix. The discussion here focuses
on summarizing the estimating equations and reporting the empirical results.
For trade policy, the indirect utility of an individual in considering policy alternatives
can be simpli�ed to:
Zi = Ii � �[maxfIj � Ii; 0g]� �[maxfIi � Ij; 0g] + �i where i 6= j (2)
where Zi is indirect utility; Ii is the individual�s own income; Ij is the income of the
average worker in the sector under consideration for trade protection (which will be raised
if new trade barriers are adopted); �i is a normally distributed error term which should be
considered to be all unobserved factors in�uencing opinion about sector-speci�c trade policy
not included in the model, � is the envy parameter which indicates the magnitude of the
utility loss when indivdiual j earns more than individual i; and � is the altruism parameter
which indicates the magnitude of the utility loss when i earns more than individual j.
Let zFi be the utility to individual i from introducing new trade barriers and zOi be
the utility to individual i from the status quo policy with no new trade barriers Assume
that the survey respondents answer the question favoring or opposing new trade barriers by
selecting the policy option that yields the highest utility. Let Y � � zFi � zOi . If y� > 0,
the individual favors new trade barriers and otherwise will be opposed. Further, let yi = 1
if y� > 0 and yi = 0 otherwise. Y � is the di¤erence between two normally distributed
variables and is itself normally distributed. As such, the probability that an individual
favors P (Y � > 0) = P (Y = 1) or opposes P (Y � � 0) = P (Y = 0) new trade barriers can be
derived from the standard normal CDF. This yields:
P (Y = 1) = �( 0 � �[maxfIj � Ii; 0g]� �[maxfIi � Ij; 0g]) (3)
where �(�) is the standard normal CDF and 0 is a constant. Note that the income term
Ii drops out when zOi is subtracted from zFi because trade barriers in sector j do not a¤ect
the income of individuals in other sectors in the model.
23

The variable Trade Opinion 1 described above is de�ned to follow this estimation frame-
work and is set equal to 1 if the respondent favors new trade barriers and is set equal to
0 if they are opposed. I also measured annual personal income in the survey. The survey
assigned respondents to one of 19 annual personal income categories and then de�ned the
actual magnitude of each respondent�s income as equal to the midpoint of the income range
in which they placed themselves. This variable, Personal Income, serves as the measure of
Ii. The variable Other Income is equal to the treatments in the survey question and takes
on the three randomly assigned values of 18,000, 40,000, or 80,000 dollars. This variable
serves as the measure of Ij. I de�ne the variable Envy equal to Other Income minus Personal
Income if Other Income is greater than Personal Income and equal to zero if not. I de�ne
the variable Altruism equal to Personal Income minus Other Income if Personal Income is
greater than Other Income and equal to zero if not.23 Thus, I have measures of each element
of Equation 2 and the initial estimating equation is:
P (Y = 1) = �( 0+�Envy+ �Altruism) (4)
I estimate this equation as a probit model and report heteroskedastic consistent standard
errors.24 The �rst key hypothesis from the model is that � < 0 because sector-speci�c trade
protection will raise the income of workers in that industry, reducing the utility of individuals
who have lower incomes than the industry under consideration for trade protection (see
appendix for details). The second main hypothesis from the model is that � > 0 because
sector-speci�c trade protection will raise the income of workers in that industry, increasing
the utility of individuals who have higher incomes than the industry under consideration
for trade protection (again see appendix for further details). In short, new trade barriers
increase or decrease inequality depending on your own income and thus the direction of the
23All of these variables are measured in thousands.24The preceding derivation could be adjusted for analysis of the ordered opinion measure Trade Opinion
2 and estimated with an ordered probit model or a regression. The results below are qualitatively similarin these alternative speci�cations.
24
envy and altruism parameters, although both indicating a form of inequality aversion, are
in opposite directions.25
The initial speci�cation follows directly from the theoretical framework. Given that the
substantive interest is in estimating the Envy and Altruism parameters, it is important to
note that this speci�cation makes the usual strong identi�cation assumptions of a cross-
sectional analysis. These assumptions would be violated if the model was incomplete and
the omitted factors were correlated with Envy or Altruism. Because Personal Income
is a component of the Envy and Altruism variables, and because personal income and its
correlates such as education have been shown to be associated with trade opinions, there is
little doubt that the estimates in this baseline speci�cation are biased.
In a second, preferred speci�cation, I add three additional controls. The �rst is Personal
Income; the second is an indicator variable, Personal Income Greater, equal to one if the
individual�s Personal Income is greater than the Other Income treatment which they re-
ceived; and the third is an interaction term between Personal Income Greater and Personal
Income. This speci�cation recognizes that the Envy and Altruism variables are a function of
Personal Income, Other Income, and which one is greater than the other. The experimental
treatments ensure that Other Income is randomly assigned across respondents but Personal
Income is not. However, once I control for Personal Income, Personal Income Greater,
and their interaction, variation in the Envy and Altruism variables is driven exclusively by
the random assignment of the Other Income treatments from the survey experiment. This
speci�cation has the substantial advantage of fully employing the experiment to identify the
estimates of the Envy and Altruism parameters and yields consistent estimates of the para-
meters even if the model is incomplete.26 For this reason, although I report results for the
initial speci�cation, I focus attention on the models that include Personal Income, Personal
25Note that the estimates of the envy and altruism parameters investigate whether the data from theexperiment are consistent with the theoretical framework. It is possible that an alternative theory, perhapsan alternative theory of other regarding preferences would explain the data as well.26Note that one potential concern is if there are heterogeneous treatment e¤ects from the di¤erent com-
ponents of the Envy and Altruism variables, this speci�cation would only estimate the e¤ect from the OtherIncome component of Envy and Altruism.
25

Probit Model EstimatesModel 1 Model 2 Model 3 Model 4Coe¢ cient Coe¢ cient Coe¢ cient Coe¢ cientEstimates Estimates Estimates Estimates
Envy, � -0.007 -0.008 -0.009 -0.010(0.003) (0.002) (0.002) (0.003)0.000 0.000 0.000 0.002
Altruism, � 0.000 0.007 0.007 0.006(0.001) (0.002) (0.002) (0.002)0.737 0.000 0.001 0.010
Personal Income, 1 -0.008 -0.007 -0.010(0.002) (0.002) (0.003)0.000 0.000 0.002
Personal Income Greater, 2 0.118 0.092 -0.003(0.127) (0.131) (0.203)0.351 0.482 0.990
Personal Income Greater � -0.000 -0.000 0.004Personal Income, 3 (0.003) (0.003) (0.004)
0.957 0.897 0.308
Demographic Controls No No Yes YesState Fixed E¤ects No No Yes YesIndustry Fixed E¤ects No No No Yes
Log-likelihood -1562.8 -1544.3 -1472.6 -789.7Observations 2,477 2,477 2,419 1,308
Table 4: Envy, Altruism, and Support for Trade Protection in the United States, ProbitEstimates. The table reports the results of probit regressions for the variable Trade Opinion1 on Envy, Altruism, and various control variables. For each model, the table reports theprobit coe¢ cient estimates for each variable, their heteroskedastic-consistent robust standarderrors in parentheses, and p-values. A constant term is included in each regression but notreported in the table.
Income Greater, and their interaction as controls.27 I also present additional results which
add control variables to this second speci�cation.
Table 4 reports the main results for trade policy opinions. The estimates for Model
1 are for the initial speci�cation. The estimates are mixed. The coe¢ cient estimate for
the envy parameter is negative and statistically signi�can while the estimate for altruism,
while positive as hypothesized, is small in magnitude and statistically insigni�cant. As
27It is worth noting that the estimates for the Envy and Altruism parameters are qualitatively the samein unreported speci�cations that condition only on Personal Income in comparison to the speci�cationhighlighted here with all three controls.
26

discussed above, this speci�cation follows from the theoretical model but is likely biased
because although the Other Income component of Envy and Altruism is randomly assigned,
the Personal Income component is not. Given the existing literature on the correlates of
trade opinions, there are very good reasons to believe that there are unobserved and omitted
factors in�uencing trade opinions which are correlated with Envy or Altruism. The Model
2 speci�cation in Table 4 addresses this issue by adding the variables Personal Income,
Personal Income Greater and their interaction.
The results for Model 2 indicate that the estimates for both envy and altruism are cor-
rectly signed and statistically and substantively signi�cant. The estimated probit coe¢ cient,
�, for the variable Envy is equal to -0.008 with a standard error of 0.002. This indicates
that, all else equal, individuals are less supportive of sector-speci�c trade barriers, the greater
the income of the average worker in the industry under consideration for protection relative
to the survey respondent. The magnitude of the envy e¤ect is substantial. To get a sense of
the substantive magnitude of this estimate, the e¤ect of increasing the Envy measure from
0� the value assigned to the variable when the respondent has an income greater than or
equal to the average income in the industry under consideration for trade protection� to
47.2� a two standard deviation increase equivalent to an income di¤erence of $47,200� on
the probability of supporting new trade barriers, holding all other variables at their means
is -0.136 (standard error of 0.028). This means that the probability of favoring new trade
barriers falls 13.6 percentage points, which is about a 40% decrease from the overall mean
of the Trade Opinion 1 measure.
The estimated probit coe¢ cient, �, for the variable Altruism is equal to 0.007 with a
standard error of 0.002. The magnitude of this e¤ect is also substantively signi�cant. The
e¤ect of increasing the Altruism measure from 0� the value assigned to the variable when
the respondent has an income less than or equal to the average income in the industry under
consideration for trade protection� to 47.2� a two standard deviation increase equivalent to
an income di¤erence of $47,200� on the probability of supporting new trade barriers, holding
27

all other variables at their means is 0.127 (standard error of 0.035). This means that the
probability of favoring new trade barriers increases 12.7 percentage points, which is about a
37% increase from the overall mean of the Trade Opinion 1 measure.
Table 4 also reports two additional speci�cations which add various control variables to
Model 2. The Model 3 speci�cation adds the variables College Grad, Female, andAge de�ned
above and �xed e¤ects for the state of the respondent. The Model 4 speci�cation also adds
�xed e¤ects for industry of employment. The estimates of the envy and altruism parameters
� and � are quite similar to those reported for Model 4. So although education and sex
in�uence trade opinions, their inclusion makes little di¤erence for the estimates because
conditional on Personal Income, Personal Income Greater, and their interaction, variation
in Envy and Altruism is randomly assigned and thus uncorrelated with education, sex, or
any other determinants of trade opinion. Overall, the estimates in Table 4 provide robust
evidence that envy and altruism have an important e¤ect on support for trade protection.
The experiment on the new tax on banking incomes allows for estimation of the envy
parameter but not the altruism parameter. The experiment employs treatments that vary
the income threshold at which the tax will apply. These thresholds are at $100,000, $200,000,
and $300,000 and because the survey top codes personal income at $175,000, it is not clear
that any respondents make more money than the second or third treatments. Moreover,
because the survey is broadly representative of the U.S. population, there are only a couple
of hundred observations above $100,000. Finally, unlike the trade question the treatment is
a threshold and the bank tax applies to all banking incomes above the threshold. As such,
the threshold underestimates the income of the average banker likely to be a¤ected by the
policy. This means that many respondents with incomes higher than the threshold may view
the tax as primarily a policy that would lower incomes of bankers who are not so di¤erent
from themelves or who are even better o¤ than they are. In contrast, the experiment is well
suited for estimating the impact of envy on opinion formation as the the treatments vary
the relative income of those likely to be harmed by the policy without directly impacting
28

the incomes of the respondents.28
The dependent variable is Bank Tax Opinion 1 which is set equal to 1 if the respondent
favors the new tax on banking incomes and is set equal to 0 if they are opposed. The initial
estimating equation is:
P (Y = 1) = �( 0+�Envy) (5)
and is estimated as a probit model. Envy is de�ned as in the trade experiment except
that Other Income is determined by the treatments for the bank tax experiment. The key
hypothesis is that � > 0 because a new tax on banking incomes will lower the after-tax
returns to bankers with salaries over the threshold de�ned by the treatment and to the
extent that respondents exhibit envy in their preferences, lowering these bankers�incomes
increases the utility of individuals who have lower incomes than the threshold.
As with the trade experiment, this initial speci�cation follows from the theoretical frame-
work but has the same potential identi�cation problems. Here, I again, add three control
variables� Personal Income, Personal Income Greater, and their interaction� in a second
preferred speci�cation. Once I control for Personal Income, Personal Income Greater, and
their interaction, variation in the Envy variable is driven exclusively by the random assign-
ment of the Other Income treatments from the survey experiment. For this reason, although
I report results for the initial speci�cation, I focus attention on the models that include Per-
sonal Income, Personal Income Greater, and their interaction as controls.29 Finally, recall
that the new banking tax experiment was conducted under both a �Low Cost�and �High
Cost�frame. I report the separate estimates of the envy parameter for each condition.
28Respondents working in the �nancial sector are excluded from this analysis. Note that although there isalmost no power in the experiment to estimate the altruism parameter, it is possible in some speci�cationsto estimate a model including the variable. For all the reasons discussed above, it is not surprising that theestimates are small in magnitude and imprecisely estimated.29It is worth noting that the estimates for the Envy parameter are qualitatively the same in unreported
speci�cations that condition only on Personal Income in comparison to the speci�cation highlighted herewith all three controls. The results are also similar for speci�cations which add demographic controls andstate �xed e¤ects to Model 2.
29

Probit Model EstimatesLow Cost High Cost
Model 1 Model 2 Model 1 Model 2Coe¢ cient Coe¢ cient Coe¢ cient Coe¢ cientEstimates Estimates Estimates Estimates
Envy, � 0.0022 0.0021 0.0014 0.0005(0.0004) (0.005) (0.0004) (0.005)0.000 0.000 0.001 0.324
Personal Income, 1 0.0003 -0.0020(0.0011) (0.0011)0.756 0.060
Personal Income Greater, 2 0.4936 -0.7758(0.9447) (0.8543)0.601 0.364
Personal Income Greater � -0.0047 0.0009Personal Income, 3 (0.0067) (0.0062)
0.829 0.890
Log-likelihood -753.2 -752.7 -811.0 -799.9Observations 1,171 1.171 1,216 1,216
Table 5: Envy, Altruism, and Support for a Banking Income Tax, Probit Estimates. Thetable reports the results of probit regressions for the variable Trade Opinion 1 on Envy, andvarious control variables. For each model, the table reports the probit coe¢ cient estimatesfor each variable, their heteroskedastic-consistent robust standard errors in parentheses, andp-values. A constant term is included in each regression but not reported in the table.
30

Table 5 reports the main results for the new tax on banking incomes. I start by focusing
on the results for the �Low Cost� prime. The estimates for Model 1 are for the initial
speci�cation. The coe¢ cient estimate for the envy parameter is positive as predicted and
statistically signi�cant. As discussed above, this speci�cation follows from the theoretical
model but may be biased because although theOther Income component of Envy is randomly
assigned, the Personal Income component is not. The Model 2 speci�cation in Table 5
addresses this issue by adding the variables Personal Income, Personal Income Greater and
their interaction.
The results for Model 2 indicate that the estimate for the envy parameter is again positive
as predicted and statistically and substantively signi�cant. The estimated probit coe¢ cient,
�, for the variable Envy is equal to 0.0021 with a standard error of 0.0005. This indicates
that, all else equal, individuals are more supportive of a new bank tax, the greater the
di¤erence between a respondent�s own income and the threshold of the banking incomes on
which the tax will be applied. The magnitude of the envy e¤ect is substantial. To get a
sense of the substantive magnitude of this estimate, the e¤ect of increasing the Envy measure
from 0� the value assigned to the variable when the respondent has an income greater than
or equal to the treatment threshold� to 169.4� a two standard deviation increase� on the
probability of supporting the new tax , holding all other variables at their means is 0.140
(standard error of 0.032). This means that the probability of favoring the new tax on
banking incomes increases 14 percentage points, which is about a 23% increase from the
overall mean of the Bank Tax Opinion 1 measure. Importantly, the role of envy appears
to be conditional on how costly the policy is. The Model 2 estimate under the �High
Cost� condition is positive but smaller in maginitude and not statistically sign�cant once
the controls are added. Overall, the estimates suggest that inequality aversion generally
and envy speci�cally may in�uence policy preferences but there are limits to how willing
individuals are to incur costs to create equality.
The focus here on envy makes sense in light of the most salient dimensions of public re-
31

action to �nancial regulation during the aftermath of the economic crises. If other-regarding
preferences are important for how people think about policy alternatives, it is likely that
envy rather than altruism is the most relevant other-regarding consideration. That said, I
conducted a follow up experiment, which was better designed for investigating the potential
in�uence of both envy and altruism in preferences about �nancial market regulation. The
experiment was based on the following question:
The average income for workers in the U.S. banking industry is X dollarsper year. The Federal government is considering increased regulations on thisindustry. Some economists argue that these regulations will reduce �nancialinnovation which helps the economy grow while others argue that it will reducethe risk of �nancial crises. Do you favor or oppose these new banking regulations?IF FAVOR: Do you strongly favor or only somewhat favor new banking reg-
ulations?IF OPPOSE: Do you strongly oppose or only somewhat oppose new banking
regulations?
where X was set at either $50,000 or $100,000. Here I was able to proceed with the analysis
in a way analogous to the trade policy experiment. The results (not reported) suggest that
both envy and altruism were evident in policy opinions about banking regulation. While
the results of this analysis certainly do not undermine the very reasonable view that envy
is likely the relatively most important other-regarding preference when it comes to public
opinion about economic policymaking about �nance, it does suggest that altruism should
not be rule out as a relevant consideration.
The de�cit reduction and income tax experiment allows for the estimation of both the
envy and altruism parameters. One potential issue with this estimation is that the income
tax experiment is not focused on a particular industry and so all respondents with incomes
above the treatment threshold would be subject to the tax. Consequently, the policy change
can a¤ect both the respondent�s own income as well as the income of others. To address this
problem, it is nessecary to control for personal income and a dummy variable for whether or
not personal income is above or below the treatment threshold, and the interaction of these
two variables.
32

The dependent variable is Income Tax Opinion 1 which is set equal to 1 if the respondent
favors increased taxes on incomes above the treatment threshold and is set equal to 0 if they
are opposed. The initial estimating equation is:
P (Y = 1) = �( 0+�Envy+ �Altruism+�X) (6)
and is estimated as a probit model. Envy and Altruism are de�ned as in the other
experiments except that Other Income is determined by the treatments for the income tax
experiment. X a is vector of control variables which includes Personal Income, Personal
Income Greater, and their interaction in the Model 2 speci�cation and also includes vari-
ous demograph�c variables and state �xed e¤ects in the Model 3 speci�cation. The �rst
hypothesis is that � > 0 because increasing income taxes will lower the after-tax returns to
individuals with salaries over the threshold de�ned by the treatment and to the extent that
respondents exhibit envy in their preferences, lowering these individuals�incomes increases
the utility of respondents who have lower incomes than the threshold. The second main
hypothesis is that � < 0 because the tax will decrease the after-tax income of individuals
with incomes less than the respondent.
Table 6 reports the main results for the increase in the income tax experiment. The esti-
mates are almost identical across the two speci�cations and I will focus on those for Model
2. The coe¢ cient estimate for the envy parameter is positive as predicted and statistically
signi�cant. The estimated probit coe¢ cient, �, for the variable Envy is equal to 0.0087 with
a standard error of 0.0009. This indicates that, all else equal, individuals are more support-
ive of income tax increases, the greater the di¤erence between a respondent�s own income
and the threshold of the income tax increase. The magnitude of the envy e¤ect is substan-
tial. To get a sense of the substantive magnitude of this estimate, the e¤ect of increasing
the Envy measure from 0� the value assigned to the variable when the respondent has an
income greater than or equal to the treatment threshold� to 70.8� a two standard deviation
increase� on the probability of supporting the tax increase, holding all other variables at
33

Probit Model EstimatesModel 2 Model 3Coe¢ cient Coe¢ cientEstimates Estimates
Envy, � 0.0087 0.0089(0.0009) (0.0010)0.000 0.000
Altruism, � -0.0054 -0.0052(0.0026) (0.0027)0.037 0.053
Personal Income, 1 0.0040 0.0046(0.0012) (0.0013)0.001 0.000
Personal Income Greater, 2 -0.6785 -0.7291(0.1824) (0.1905)0.000 0.000
Personal Income Greater � 0.0023 0.0024Personal Income, 3 (0.0023) (0.0024)
0.316 0.321
Demographic Controls No YesState Fixed E¤ects No Yes
Log-likelihood -1570.3 -1492.7Observations 2,477 2,412
Table 6: Envy, Altruism, and Support for Income Tax Increases, Probit Estimates. Thetable reports the results of probit regressions for the variable Income Tax Opinion 1 onEnvy, Altruism, and various control variables. For each model, the table reports the probitcoe¢ cient estimates for each variable, their heteroskedastic-consistent robust standard errorsin parentheses, and p-values. A constant term is included in each regression but not reportedin the table.
34

their means is 0.239 (standard error of 0.025). This means that the probability of favoring
the income tax change increases about 24 percentage points, which is about a 50% increase
from the overall mean of the Income Tax Opinion 1 measure.
The estimated probit coe¢ cient, �, for the variable Altruism is equal to -0.0054 with a
standard error of 0.0026. Although this estimate is only marginally statistically signi�cant,
the magnitude of the e¤ect is substantively important. The e¤ect of increasing the Altruism
measure from 0� the value assigned to the variable when the respondent has an income less
than or equal to the treatment threshold� to 70.8� a two standard deviation increase� on
the probability of supporting the tax increase, holding all other variables at their means is
-0.149 (standard error of 0.066). This means that the probability of favoring the income tax
policy change decreases 15 percentage points (about 32% of the overall mean).
Overall, the estimates in Table 6 provide robust evidence that envy and altruism have
an important e¤ect on policy opinions about raising taxes. This is consistent with the
overall argument of this paper emphasizing the importance of other-regarding preferences
in opinion formation about economic policy alternatives. At the same time, the results
provide a substantial reminder that a role for other-regarding preferences does not imply
that self-interest does not also matter for economic policy opinions. The role of self-interest
is clearest in the income tax experiment by considering whether it makes a di¤erence that
individuals are above or below the threshold at which the tax increase will be implemented.
The estimates for the coe¢ cient Personal Income Greater (and its interaction with Personal
Income) in Table 6 suggest that this di¤erence implies, all else equal, about a 25 percentage
point decrease in the probablity of supporting an income tax increase.30
30While there is substantial empirical research consistent with there being an important role for self-interestin the formation of economic policy preferences and political behavior generally and certainly in the contextof economic crises, there is also an important tradition in political science which takes a skeptical view (seee.g. Bartels 2008). The results of this study are in various ways consistent with self-interest playing a rolebut adjudicating this debate is not a central focus of this paper.
35
4 Conclusion
Mass political behavior in the midst of an economic crisis provides a unique lens for studying
distributive political con�ict and the determinants of political opinion and behavior. This
paper points to any one of the millions of citizens who have voted, marched, or rioted to
advocate or protest one policy position or another in their national political debate on how
best to respond to the crisis and asks why did those citizens take the positions that they
did and why did they often seem so invested in the debate. It seems likely that self-interest
plays an important role in answering these questions. Having often already lost much in
the crisis itself, individual citizens are acutely aware of the consequences of policy change
on their individual welfare. Moreover, economic crises are often periods of sign�cant policy
change with long-lasting distributional consequences. In short, with so much at stake,
it would be suprising if self-interest did not inform policy opinions and behavior in the
national debate. However, the theatre of these political debates suggests the possbility that
other considerations may also be central to determining the positions that citizens take and
their behavior in the political process. The German or American taxpayer or Greek or
Spanish civil servant is not outraged simply because they will lose from some new policy
under consideration though that may be part of the story. Rather, their policy position and
outrage is in part because the policy alternative under consideration either resonates or is
in con�ict with their sense of fairness.
In this paper, I investigate how one speci�c understanding of fairness� inequality aversion�
in�uences individual policy opinions about economic policymaking in the context of an eco-
nomic crisis. I argue that attitudes about inequality� both envy and altruism� lead to
systematic di¤erences in support for trade protection across di¤erent sectors of the economy,
in support for taxing banking incomes, and in support for higher income taxes. In each pol-
icy domain, individuals not only consider how policy alternatives a¤ect their own interests
but also how they a¤ect the incomes of others relative to their own.
The paper provides empirical evidence from a set of original survey experiments on a
36

national sample of respondents in the United States (and I will shortly complement this
with analogous experiments in France). First, I show experimentally how variation in the in-
comes of the bene�ciaries of various policies in�uence support for those policies. I show that
opinons about trade, �nancial market regulation, and tax policy vary systematically with
information provided about the incomes of those a¤ected by policy alternatives. Respon-
dents are generally more supportive of policies that bene�t lower income recipients or create
costs for higher income recipients. Second, I adopt a speci�c formalization of inequality
aversion, incorporate this utlilty function into standard models of policymaking, and esti-
mate structurally an equation of policy preferences. I �nd that individuals have the social
preferences of altruism and envy assumed in these models though the relative importance
of these motivations vary across issue areas. Econometrically identifying these preferences
lends considerable support to the main claim of this paper that envy and altruism play a
central role in distributive political con�ict over economic policies during times of economic
crises. That said, the evidence presented here should be viewed as pointing in the direction
of an important role for inequality aversion but it must be recognized that it is possible for
alternative mechanisms to generate the pattern of preferences observed across the experi-
ments. It must also be said that many such alternatives seem more plausible for one policy
area than another and so fail to simply explain the pattern across all experiments in the
way that inequality aversion does. Nonetheless, exploring new experiments and analyses to
evaluate alternative mechanisms seems a productive task for future research.
References
[1] Alesina, Alberto, and G.M. Angeletos. 2005. �Fairness and Redistribution.�American
Economic Review Vol. 95 No. 4:960-980.
[2] Alesina, Alberto, and Paola Giuliano. 2009. �Preferences for Redistribution.�IZA Dis-
cussion Paper No. 4056.
37
[3] Alesina, Alberto, and Edward Glaeser. 2004. Fighting Poverty in the US and Europe:
A World of Di¤erence. Oxford: Oxford University Press.
[4] Bartels, Larry. 2008. Unequal Democracy: The Political Economy of the New Gilded
Age. New York: Russell Sage Foundation/Princeton University Press.
[5] Charness, Gary, and Matthew Rabin. 2002. �Understanding Social Preferences with
Simple Tests.�Quarterly Journal of Economics Vol. 117 No. 3: 817-69.
[6] DellaVigna, Stefano. 2009. �Psychology and Economics: Evidence from the Field.�
Journal of Economic Literature Vol. XLVII No. 2:315-372.
[7] Fehr, Ernst, and Klaus M. Schmidt. 1999. "A Theory of Fairness, Competition, and
Cooperation." The Quarterly Journal of Economics 114:817-868.
[8] Fehr, Ernst, and Klaus M. Schmidt. 2006. "The Economics of Fairness, Reciprocity, and
Altruism� Experimental Evidence and New Theories." In S. Kolm and Jean Mercier
Ythier (eds.), Handbook on the Economics of Giving, Reciprocity, and Altruism, Else-
vier, pp. 615-691.
[9] King, Gary, Michael Tomz, and JasonWittenberg. 2000. "Making the Most of Statistical
Analyses: Improving Interpretation and Presentation." American Journal of Political
Science Vol. 44 No. 2 (April):347-361.
[10] Levitt, Steven D., and John A. List. 2007. �What Do Laboratory Experiments Measur-
ing Social Preferences Reveal About the Real World?" Journal of Economic Perspectives
Vol. 21 No. 2:153-174.
[11] Lu, Xiaobo, Kenneth Scheve, and Matthew J. Slaughter. 2010. �Envy, Altruism, and
the International Distirbution of Trade Protection.�NBER Working Paper #15700.
[12] Luttmer, Ezro. 2001. �Group Loyalty and the Taste for Redistribution.� Journal of
Political Economy 109 (3): 500-528.
38

[13] Mans�eld, Edward, and Diana Mutz. 2009. �Support for Free Trade: Self-Interest,
Sociotropic Politics, and Out-Group Anxiety.�International Organization Vol. 63: 425-
457.
[14] McCarty, Nolan, Keith Poole, and Howard Rosenthal. 2006. Polarized America: The
Dance of Ideology and Unequal Riches. Cambridge: The MIT Press.
[15] Rueda, David, and Jonas Pontusson. 2010. �Individual Preferences for Redistribution in
Western Europe: Self-Interest, Political Articulation, Altruism, and Identity.�Princeton
University Working Paper.
[16] Scheve, Kenneth, and Matthew J. Slaughter. 2001b. Globalization and the Perceptions
of American Workers. Washington DC: Institute for International Economics.
[17] Scheve, Kenneth, and David Stasavage. 2010. �The Conscription of Wealth: Mass War-
fare and the Demand for Progressive Taxation.�International Organization Vol. 64 No.
4 (Fall):529-562.
[18] Sobel, Joel. 2005. �Interdependent Preferences and Reciprocity.�Journal of Economic
Literature Vol. XLIII No. 2 (June):392-436.
A Appendix
A.1 Social Concerns Models of Economic Policy Preferences
A.1.1 Trade
This section presents Lu, Scheve, and Slaughter�s (2010) model of trade preferences under
the assumption that indviduals are inequality averse and derives an econometric model for
estimating the envy and altruism parameters of the theoretical model. Lu, Scheve, and
Slaughter argue that if individual citizens and policymakers care not only about how trade
policy in�uences their real incomes but also how it a¤ects their incomes relative to others,
39

with a preference for policies that promote income equality, government policies will tend
to support industries that employ lower-earning, less-skilled workers more intensively. For
purposes of this paper, I consider only the implications of the model for individual preferences
and present it here in order to justify the estimation strategy employed in Section 3.
In a perfectly competitive economy with a population size of N and n sectors, individuals
maximize the utility function given by
ui = x0 +nXi=1
ui(xi)��
n� 1Xi6=j
maxfIj � Ii; 0g ��
n� 1Xi6=j
maxfIi � Ij; 0g (7)
This utility function has two components: utility from consumption (x0 +Pn
i=1 ui(xi))
and disutility from inequality aversion (� �n�1
Pi6=j maxfIj�Ii; 0g�
�n�1
Pi6=j maxfIi�Ij; 0g).
Goods/sectors and types of individuals� as all individuals within a sector are identical� are
indexed by i, i = 1; 2; :::n. x0 is the consumption of the numeraire good 0 and xi is the
consumption of non-numeraire good i. The utility functions ui(�) are increasing functions
which are di¤erentiable, separable, and strictly concave.
To account for inequality aversion, a social preference term is added to the individual�s
utility function. The term for inequality aversion is same as the speci�cation in Equation
(1) in Fehr and Schmidt (1999: 822). In particular, Fehr and Schmidt specify one parameter
(�) for �altruism" when Ii > I�i; and the other parameter for �envy" (�) when Ii < I�i.
This speci�cation of the utility function implies that an individual would feel altruistic to
those who earn less than him/her, and at the same time feel envious of those who earn more.
Let �i indicate the fraction of population N working in sector i, and assume that workers
in sector i all earn identical incomes which are a function of their labor and the return
to sector-speci�c skills and/or inputs owned only by individuals working in each respective
sector. Note that an individual owns at most one type of sector-speci�c input, and assume
the sector-speci�c factor input is indivisible and non-tradable. The technologies to produce
these goods have constant returns to scale, and the speci�c factor inputs have inelastic
40

supplies. The numeraire good 0 is produced with labor alone and sets the economy-wide
return to labor. The non-numeraire good i is produced with labor and the sector-speci�c
factor input. Normalize the wage of good 0 to 1, and the aggregate reward to the speci�c
factor depends on the domestic price of the good, that is, �i(pi); where pi is the domestic
price. Index each sector�s per capita return such that �i(pi)�iN
> �i�1(pi�1)�i�1N
. The total income
(Ii) to an individual in sector i, is equal to their wage of 1 plus�i(pi)�iN
. Individual consumption
must meet the budget constraint such that Ii � x0 +nPi=1
pixi. Denote the exogenous world
price of goods to be p�i .
The net revenue per capita from trade policies (tari¤s or subsidies) is expressed as
r(p) =nXi=1
(pi � p�i )[di(pi)�1
Nyi(pi)] (8)
where di(pi) is the demand function of good i by an individual, and di(�) equals to
the inverse of u0i(xi), and yi(pi) is the domestic output of good i and yi(pi) = �0i(pi):
p = (p1; p2; :::pn) is a vector of domestic prices of the non-numeraire goods. Each individual
receives an equal net transfer of r(p). The consumer surplus derived from these goods is
s(p) �P
i ui[di(pi)]�P
i pidi(pi). Given these assumptions, individuals�indirect utility in
sector i can be derived as follows:
Zi(p) = 1 +�i(pi)
�iN+ r(p) + s(p)� �
n� 1Xi6=j
maxf�j(pj)�jN
� �i(pi)�iN
; 0g
� �
n� 1Xi6=j
maxf�i(pi)�iN
� �j(pj)�jN
; 0g (9)
Individual preferences about trade policy in sector j are determined by how a marginal
change in the price of good j due to a tari¤ or subsidy will impact this function:
@Zi@pj
=1
N[(pj � p�j)m0
j(pj)� yj(pj)]��
n� 1yj(pj)
�jNif�j(pj)
�jN>�i(pi)
�iN& i 6= j (10a)
41

@Zi@pj
=1
N[(pj � p�j)m0
j(pj)� yj(pj)] +�
n� 1yj(pj)
�jNif�j(pj)
�jN<�i(pi)
�iN& i 6= j (10b)
@Zi@pj
= yj(pj)+1
N[(pj�p�j)m0
j(pj)�yj(pj)]+[(n�i)�
n� 1�(i�1)�
n� 1]yj(pj)
�jNif i = j (10c)
wheremj(pj) � Ndj(pj)�yj(pj) is the net import function. Assuming good j is a normal
good, then yi(pi) = �0i(pi) > 0. I also note that m0j(pj) < 0. Hence, an increase of price
for good j will tend to reduce the welfare of individual i because of the net negative e¤ect
of the impact on consumer welfare and tari¤ revenue is 1N[(pj � p�j)m0
j(pj) � yj(pj)] < 0.
Inequality aversion means that an increase in the price for good j reduces the individual
i�s welfare due to envy if individuals in sector j earn more than individuals in sector i
(by � �n�1
yj(pj)
�jN) but increases welfare due to altruism if individuals in sector j earn less
than individuals in sector i (by + �n�1
yj(pj)
�jN). These two relationships imply that individuals
considering whether to support sector-speci�c trade protection that would increase the price
and incomes in another sector will, all else equal, be less likely to support barriers if they
have a lower income than workers in the industry under consideration for protection� envy
e¤ect� and more likely to support barriers if they have a higher income than workers in the
industry under consideration for protection� altruism e¤ect. The empirical work tests this
central feature of the model. For i = j, individuals in this group will gain income from
tari¤ protection. However, the e¤ect of inequality aversion may either increase or decrease
workers�welfare, depending on where sector i�s per capita factor endowment return falls in
the overall income distribution as well as on the degree of altruism and envy.
To derive the statistical model for estimating the e¤ect of envy and altruism on support
for sector-speci�c trade protection, I start with the individual indirect utility function in
Equation (9), introduce an error term, and specify its distribution. The error term should be
thought to be composed primarily of those factors in�uencing opinion about sector-speci�c
trade protection not included in the model. The addition of the error term, �i, yields:
42

Zi(p) = 1 +�i(pi)
�iN+ r(p) + s(p)� �
n� 1Xi6=j
maxf�j(pj)�jN
� �i(pi)�iN
; 0g
� �
n� 1Xi6=j
maxf�i(pi)�iN
� �j(pj)�jN
; 0g+ �i (11)
I assume that �i is normally distributed and that it enters the function additively. I
further simplify the model in three ways. First, I omit the terms r(p) and s(p); which
represent per capita tari¤ revenues and per capita consumer surplus. Neither argument
varies across individuals and so will be captured by the constant in the estimating equation.
Second, the survey question forces respondents to focus on one industry at a time and so
I consider only income di¤erences between the individual and the average worker in this
industry. Consistent with the model, this assumes that changes in trade policy in one
industry do not a¤ect income in other industries. Third, the term �i(pi)�iN
is equal to the
portion of individual i�s income that varies across individuals/sectors and is denoted as Ii
(and analogously for individual/sector j). These simpli�cations yield:
Zi(p) = Ii � �[maxfIj � Ii; 0g]� �[maxfIi � Ij; 0g] + �i where i 6= j (12)
Let zFi be the utility to individual i from introducing new trade barriers and zOi be
the utility to individual i from the status quo policy with no new trade barriers. I assume
that the survey respondents answer the question favoring or opposing new trade barriers by
selecting the policy option that yields the highest utility. Let Y � � zFi � zOi . If y� > 0,
the individual favors new trade barriers and otherwise will be opposed. Further, let yi = 1
if y� > 0 and yi = 0 otherwise. Y � is the di¤erence between two normally distributed
variables and is itself normally distributed. As such, the probability that an individual
favors P (Y � > 0) = P (Y = 1) or opposes P (Y � � 0) = P (Y = 0) new trade barriers can be
derived from the standard normal CDF. This yields:
P (Y = 1) = �( 0 � �[maxfIj � Ii; 0g]� �[maxfIi � Ij; 0g]) (13)
43

where �(�) is the standard normal CDF and 0 is a constant. Note that the income term
Ii =�i(pi)�iN
drops out when zOi is subtracted from zFi because trade barriers in sector j do not
a¤ect the income of individuals in other sectors in the model.
The variable Trade Opinion 1 described above is de�ned to follow this estimation frame-
work and is set equal to 1 if the respondent favors new trade barriers and is set equal to
0 if they are opposed. I also measured annual personal income in the survey. The survey
assigned respondents to one of 19 annual personal income categories and then de�ned the
actual magnitude of each respondent�s income as equal to the midpoint of the income range
in which they placed themselves. This variable, Personal Income, serves as the measure of
Ii. The variable Other Income is equal to the treatments in the survey questions and takes
on the three randomly assigned values of 18,000, 40,000, or 80,000 dollars. This variable
serves as the measure of Ij. I de�ne the variable Envy equal to Other Income minus Personal
Income if Other Income is greater than Personal Income and equal to zero if not. I de�ne
the variable Altruism equal to Personal Income minus Other Income if Personal Income
is greater than Other Income and equal to zero if not.31 Thus, I have measures of each
argument in Equation (13) and the initial estimating equation is:
P (Y = 1) = �( 0+�Envy+ �Altruism) (14)
I estimate this equation as a probit model and report heteroskedastic consistent standard
errors.32 The �rst key hypothesis from the model is that � < 0 because sector-speci�c trade
protection will raise the income of workers in that industry, reducing the utility of individuals
who have lower incomes than the industry under consideration for trade protection (see
Equation (10a) above). The second main hypothesis from the model is that � > 0 because
sector-speci�c trade protection will raise the income of workers in that industry, increasing
the utility of individuals who have higher incomes than the industry under consideration
31All of these variables are measured in thousands.32The preceding derivation could be adjusted for analysis of the ordered opinion measure Trade Opinion
2 and estimated with an ordered probit model or a regression. The results are qualitatively similar in thesealternative speci�cations.
44

for trade protection (see Equation (10b) above). In short, new trade barriers increase or
decrease inequality depending on your own income and thus the direction of the envy and
altruism parameters, although both indicating a form of inequality aversion, are in opposite
directions.
A.1.2 Banking Income Taxes
To be completed.
A.1.3 Income Taxes and the De�cit
To be completed.
A.2 Descriptive Statistics
Observations Mean Std. Dev.
Trade Opinion 1 2,485 0.338 0.473Trade Opinion 2 2,470 2.201 0.981Bank Tax Opinion 1 2,485 0.618 0.486Bank Tax Opinion 2 2,480 2.797 1.125Income Tax Opinion 1 2,485 0.468 0.499Income Tax Opinion 2 2,481 2.334 1.223Female 2,474 0.552 0.497Age 2,485 46.383 14.959Unemployed33 1,576 0.126 0.332Labor Force 2,485 0.634 0.482Personal Income34 2,477 37,500 NACollege Graduate 2,477 0.409 0.492
Table A-1: Descriptive Statistics.
A.3 Regression Treatment Estimates
This section reports additional estimates of di¤erences across treatment categories controlling
for various demographic characteristics of respondents. These estimates closely mirror those
45

reported in Table 1, 2, and 3.
For the trade policy experiment, Table A-2 reports estimates of the di¤erences across
the treatment categories controlling for various demographic characteristics of respondents
and �xed e¤ects for geographical location and industry of employment. This framework
allows identi�cation of the treatment e¤ects within geographical location, industry, and
other respondent characteristics. I estimate the following ordinary least squares regressions:
TradeOpinion1i;k;j = �0 + �1MWTi;k;j + �2HWTi;k;j +�Xi;k;j + �k + �j + �i;k;j (15)
where the dependent variable Trade Opinion 1 is the dichotomous measure described
in the main text and is increasing in support for trade protection; MWT, Middle Wage
Treatment, is a dichotomous measure equal to one if the respondent received the middle
wage treatment and zero otherwise; HWT, High Wage Treatment, is a dichotomous measure
equal to one if the respondent received the high wage treatment and zero otherwise; X is a
vector of demographic variables measuring education attainment, sex, age, and income;35 �k
are �xed e¤ects for the state the respondent lives in; �j are �xed e¤ects for industries; � is the
error term; i, k, and j index individuals, geographic locations, and industries respectively;
and �0, �1, �2, and � are parameters to be estimated. The omitted treatment category is
Low Wage Treatment and so the parameters �1 and �2 should be interpreted respectively
as the e¤ect of being exposed to the middle and high wage treatments compared to the
low wage treatment. The estimates reported in Table A-2 are nearly identical to those
discussed for Table 1 without control variables. Model A1 excludes industry �xed e¤ects
and Model A2 includes them. It is worth noting the stability of these estimates across the
two models despite the fact that the speci�cations with industry �xed e¤ects have many
fewer observations because individuals not in the labor market cannot be coded for this35The variables are College Grad equal to one if the respondent graduated from college and zero if not,
Female equal to one if the respondent is female and zero if not, Age equal to age in years, and PersonalIncome equal to an individual�s annual income.
46

Ordinary Least Squares Estimates
Model A1 Model A2
Middle Wage Treatment -0.105 -0.075(0.025) (0.033)0.000 0.024
High Wage Treatment -0.199 -0.201(0.023) (0.032)0.000 0.000
Demographic Controls Yes YesState Fixed E¤ects Yes YesIndustry Fixed E¤ects No Yes
Standard Error of Regression 0.464 0.466Observations 2,427 1,333
Table A-2: Estimated E¤ect of Average Wage of Industry on Support for Trade Protection,Linear Probability Model Estimates. The table reports the results of ordinary least squaresregressions for the variable Trade Opinion 1 on Middle Wage Treatment, High Wage Treat-ment, and various control variables. The omitted treatment is the Low Wage Treatment. Thedemographic control variables include College, Female, Age, and Income. For each model,the table reports the coe¢ cient estimates for each variable, their heteroskedastic-consistentrobust standard errors in parentheses, and p-values. A constant term is included in eachregression but not reported in the table.
variable.
For the new tax on banking incomes experiment, Table A-3 reports estimates of the
di¤erences across the treatment categories controlling for various demographic characteristics
of respondents and �xed e¤ects for geographical location. Again, this framework allows
identi�cation of the treatment e¤ects within geographical location and other respondent
characteristics. I estimate the following ordinary least squares regressions:
BankTaxOpinion1i;k = �0 + �1$200kTi;k + �2$300kTi;k +�Xi;k + �k + �i;k (16)
where the dependent variable Bank Tax Opinion 1 is the dichotomous measure described
in the main text and is increasing in support for the introduction of a new tax on high bank
incomes; $200kT, $200k Treatment, is a dichotomous measure equal to one if the respondent
47
received the treatment for which the new tax would be applied to banking incomes greater
than $200,000 and zero otherwise; $300kT, $300k Treatment, is a dichotomous measure
equal to one if the respondent received the high wage treatment and zero otherwise; X is
a vector of demographic variables measuring education attainment, sex, age, and income;
�k are �xed e¤ects for the state the respondent lives in; � is the error term; i and k index
individuals and states respectively; and �0, �1, �2, and � are parameters to be estimated.
The omitted treatment category is $100k Treatment and so the parameters �1 and �2 should
be interpreted respectively as the e¤ect of being exposed to the $200k Treatment and $300k
Treatment compared to the $100k Treatment. Table A-3, like Table 2, reports separate
estimates for those respondents who considered the tax under the �Low Cost� condition
and those who considered the tax under the �High Cost�condition. The estimates reported
in Table A-3 are nearly identical to those discussed for Table 2 without control variables.
Again, there is clear evidence that respondents are more supportive of introducing the new
tax when the bankers to be a¤ected by the tax have higher incomes as long as the e¢ ciency
costs of the tax are not too high.
For the income tax experiment, Table A-4 reports estimates of the di¤erences across
the treatment categories controlling for various demographic characteristics of respondents
and �xed e¤ects for geographical location. I estimate the following ordinary least squares
regressions:
IncomeTaxOpinion1i;k = �0 + �1$80kTi;k + �2$125kTi;k +�Xi;k + �k + �i;k (17)
where the dependent variable Income Tax Opinion 1 is the dichotomous measure de-
scribed in the main text and is increasing in support for higher income taxes; $80kT, $80k
Treatment, is a dichotomous measure equal to one if the respondent received the treatment
for which the increase in income taxes would be applied to incomes greater than $80,000
48

Ordinary Least Squares EstimatesModel A1
Low Cost High Cost
$200k Treatment 0.074 0.035(0.037) (0.035)0.044 0.313
$300k Treatment 0.163 0.069(0.034) (0.035)0.000 0.049
Demographic Controls Yes YesState Fixed E¤ects Yes Yes
Standard Error of Regression 0.476 0.484Observations 1,146 1,193
Table A-3: Estimated E¤ect of Income Threshold on Support for New Tax on BankingIncomes, Linear Probability Model Estimates. The table reports the results of ordinaryleast squares regressions for the variable Bank Tax Opinion 1 on $200k Treatment, $300kTreatment, and various control variables. The omitted treatment is the $100k Treatment.The demographic control variables include College, Female, Age, and Income. For eachmodel, the table reports the coe¢ cient estimates for each variable, their heteroskedastic-consistent robust standard errors in parentheses, and p-values. A constant term is includedin each regression but not reported in the table.
49

Ordinary Least Squares EstimatesModel A1
Full Sample <$40k Sample
$80k Treatment 0.260 0.283(0.023) (0.033)0.000 0.000
$125k Treatment 0.335 0.324(0.024) (0.034)0.000 0.000
Demographic Controls Yes YesState Fixed E¤ects Yes Yes
Standard Error of Regression 0.468 0.471Observations 2.427 1,228
Table A-4: Estimated E¤ect of Income Threshold on Support for Income Tax Increases toReduce the De�cit, Linear Probability Model Estimates. The table reports the results ofordinary least squares regressions for the variable Income Tax Opinion 1 on $80k Treatment,$125k Treatment, and various control variables. The omitted treatment is the $40k Treat-ment. The demographic control variables include College, Female, Age, and Income. Foreach model, the table reports the coe¢ cient estimates for each variable, their heteroskedastic-consistent robust standard errors in parentheses, and p-values. A constant term is includedin each regression but not reported in the table.
and zero otherwise; $125kT, $125k Treatment, is a dichotomous measure equal to one if the
respondent received the high wage treatment and zero otherwise; X is a vector of demo-
graphic variables measuring education attainment, sex, age, and income; �k are �xed e¤ects
for the state the respondent lives in; � is the error term; i and k index individuals and states
respectively; and �0, �1, �2, and � are parameters to be estimated. The omitted treatment
category is $40k Treatment and so the parameters �1 and �2 should be interpreted respec-
tively as the e¤ect of being exposed to the $80k Treatment and $125k Treatment compared
to the $40k Treatment. Table A-4, like Table 3, reports separate estimates for full sample
and for those respondents with personal incomes less than $40,000. The estimates reported
in Table A-4 are extremely close to those discussed in Table 3 without control variables.
50