Envisioning Neighborhoods with ... - Reconnecting America · Envisioning Neighborhoods with...
147
Mineta Transportation Institute San José State University San Jose, CA 95192-0219 Norman Y. Mineta International Institute for Surface Transportation Policy Studies Created by Congress in 1991 MTI Report 01-15 Envisioning Neighborhoods with Transit-Oriented Development Potential
Transcript of Envisioning Neighborhoods with ... - Reconnecting America · Envisioning Neighborhoods with...
Mineta Transportation InstituteSan Jos é State University
San Jose, CA 95192-0219
Norman Y. MinetaInternational Institute forSurface Transportation Policy StudiesCreated by Congress in 1991
MTI Report 01-15
Envisioning Neighborhoods with Transit-Oriented Development Potential
a publication of the
The Mineta Transportation InstituteCollege of Business
San José State UniversitySan Jose, CA 95192-0219
Created by Congress in 1991
MTI Report 01-15
Envisioning Neighborhoods with Transit-Oriented Development Potential
May 2002
Earl G. BossardJeff Hobbs Brett HondorpTara Kelly Scott Plembaeck
Dayana Salazar Andrea SuboticRichard Taketa Tung TranPin-Yuan Wang Dali ZhengSteven Colman
1. Report No.
4. Title and Subtitle
7. Authors
9. Performing Organization Name and Address
15. Supplementary Notes
12. Sponsoring Agency Name and Address
16. Abstract
17. Key Words
19. Security Classif. (of this report) 20. Security Classif. (of this page) 21. No. of Pages 22. Price
18. Distribution Statement
14. Sponsoring Agency Code
13. Type of Report and Period Covered
11. Contract or Grant No.
10. Work Unit No.
8. Performing Organization Report No.
6. Performing Organization Code
5. Report Date
3. Recipient’s Catalog No.2. Government Accession No.
Mineta Transportation Institute College of Business—BT500San José State UniversitySan Jose, CA 95129-0219
California Department of TransportationSacramento, CA 95819
U.S. Department of TransportationResearch and Special Programs Administration400 7th Street, SWWashington, DC 20590-0001
No restrictions. This document is available to the public through the National Technical Information Service, Springfield, VA 22161
Unclassified Unclassified
Final Report
Technical Report Documentation Page
Form DOT F 1700.7 (8-72)
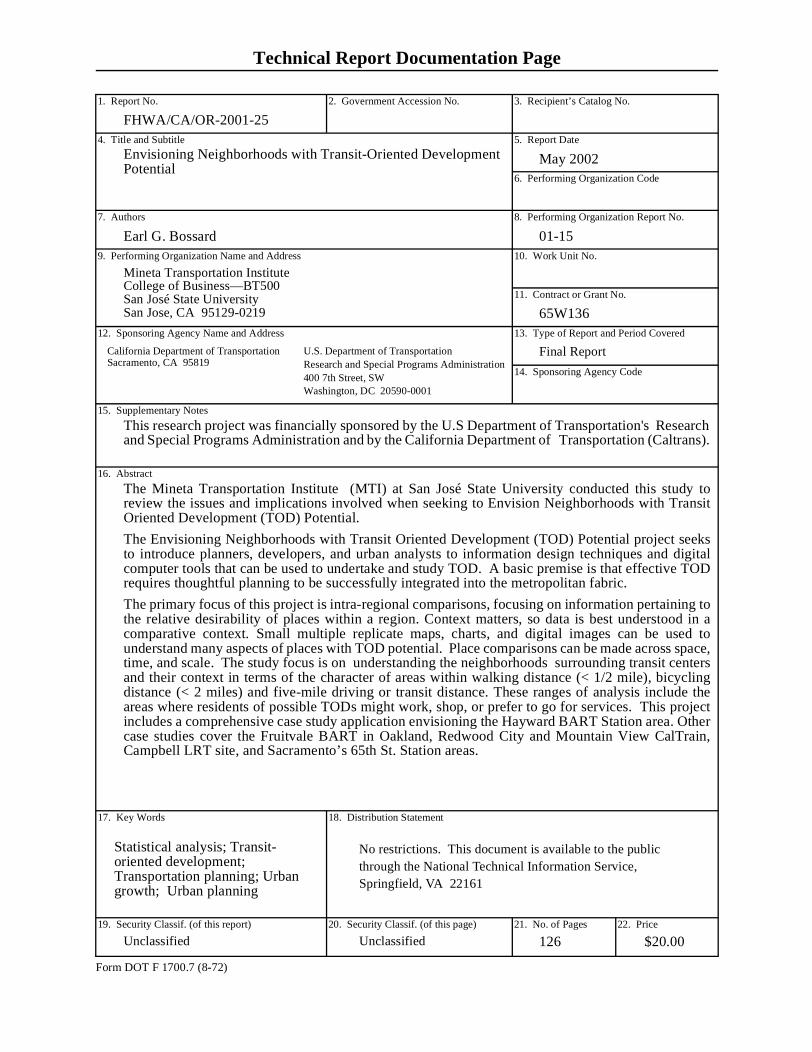
FHWA/CA/OR-2001-25
Envisioning Neighborhoods with Transit-Oriented Development Potential
Earl G. Bossard
This research project was financially sponsored by the U.S Department of Transportation's Research and Special Programs Administration and by the California Department of Transportation (Caltrans).
The Mineta Transportation Institute (MTI) at San José State University conducted this study toreview the issues and implications involved when seeking to Envision Neighborhoods with TransitOriented Development (TOD) Potential.
The Envisioning Neighborhoods with Transit Oriented Development (TOD) Potential project seeksto introduce planners, developers, and urban analysts to information design techniques and digitalcomputer tools that can be used to undertake and study TOD. A basic premise is that effective TODrequires thoughtful planning to be successfully integrated into the metropolitan fabric.
The primary focus of this project is intra-regional comparisons, focusing on information pertaining tothe relative desirability of places within a region. Context matters, so data is best understood in acomparative context. Small multiple replicate maps, charts, and digital images can be used tounderstand many aspects of places with TOD potential. Place comparisons can be made across space,time, and scale. The study focus is on understanding the neighborhoods surrounding transit centersand their context in terms of the character of areas within walking distance (< 1/2 mile), bicyclingdistance (< 2 miles) and five-mile driving or transit distance. These ranges of analysis include theareas where residents of possible TODs might work, shop, or prefer to go for services. This projectincludes a comprehensive case study application envisioning the Hayward BART Station area. Othercase studies cover the Fruitvale BART in Oakland, Redwood City and Mountain View CalTrain,Campbell LRT site, and Sacramento’s 65th St. Station areas.
Statistical analysis; Transit-oriented development; Transportation planning; Urban growth; Urban planning
May 2002
01-15
65W136
126 $20.00
To order this publication, please contact the following:
Mineta Transportation Institute
College of Business BT-550
San José State University
San Jose, CA 95192-0219
Tel (408) 924-7560
Fax (408) 924-7565
E-mail: [email protected]
http://transweb.sjsu.edu
Copyright © 2002 by MTI
All rights reserved
Library of Congress Catalog Card Number: 200195386
ACKNOWLEDGEMENTS
The Envisioning Neighborhoods with Transit-Oriented Development Potential project teammembers are all associated with San José State University’s Urban and Regional PlanningDepartment (nine members) or Geography Department (three members).
The principal investigator was Earl Bossard. Other team members from the Urban and RegionalPlanning Department include Mineta Transportation Institute (MTI) Research Associates DayanaSalazar and Steven Colman, and graduate students Tara Kelly, Erin Mayer, Scott Plambaeck,Tung Tran, Pin-Yuan Wang, and Dali Zheng. Team members from the Geography Departmentinclude MTI Research Associate Richard Taketa and graduate students Jeff Hobbs and AndreaSubotic.
Institutional support was provided by the Urban and Regional Planning and GeographyDepartments as well as the Mineta Transportation Institute at San José State University. Theplanning and community development departments in the cities of Campbell, Hayward, MountainView, Oakland, Redwood City, and Sacramento all helped provide data and information for thisstudy.
Other contributors to this project include SJSU Masters in Urban Planning graduate BrettHondorp, who contributed an essay on TOD history, and Geography Department studentsShyamala Raveendran, who contributed her project analysis 3-D images of Fruitvale BART areadata, and Anthony Jayaprakash, who provided ArcView operational assistance.
The direct sponsor and overseer of this project was the Mineta Transportation Institute. MTIResearch Director Trixie Johnson played a major role in overseeing administrative matters as wellas providing direction, support, and guidance. The California Department of Transportation andthe U.S. Department of Transportation provided the funding for this project via MTI.
We would also like to thank MTI staff including Research and Publications Assistant SonyaCardenas; Webmasters Barney Murray and Shun Nelson for getting drafts of the work onto theInternet; and Graphics Designers Ben Corrales, Shun Nelson and Cedric Howard and EditorialAssociates Robyn Whitlock, Catherine Frazier and Irene Rush for following the project to printand onto CD-ROM.
Envisioning Neighborhoods with Transit-Oriented Development Potential i
TABLE OF CONTENTS
EXECUTIVE SUMMARY . . . . . . . . . . . . . . . . . . . . . . . . . . 1
CONCEPTS FOR ENVISIONING NEIGHBORHOODS WITH TOD POTENTIAL . . . . . . . . . . . . . . . . . . . . . . . . 5SELECTED PROJECT OVERVIEWS THAT PRESENT KEY CONCEPTS FOR ENVISIONING NEIGHBORHOODS WITH TOD POTENTIAL . . . . . . . . . . . . . . . . . . . . . . . . . . . . . . . . . . . . . . . 6
Organizational Principles and Framework (Project Overview 6) . 6Data File Relationships Chart (Project Overview 7) . . . . . . . . . . . 7A Solution to Urban Analysis Problems in the Digital Era (Project Overview 8) . . . . . . . . . . . . . . . . . . . . . . . . . . . . . . . . . . . 9
Find data . . . . . . . . . . . . . . . . . . . . . . . . . . . . . . . . . . . . . . . . 10Filter data . . . . . . . . . . . . . . . . . . . . . . . . . . . . . . . . . . . . . . . . 10Transform data . . . . . . . . . . . . . . . . . . . . . . . . . . . . . . . . . . . . 10Model data . . . . . . . . . . . . . . . . . . . . . . . . . . . . . . . . . . . . . . . 10Synthesize data . . . . . . . . . . . . . . . . . . . . . . . . . . . . . . . . . . . . 11
An Analysis and Presentation Solution for Envisioning Neighborhoods (Project Overview 9) . . . . . . . . . . . . . . . . . . . . . 11Envisioning Neighborhoods Techniques and Principles (Project Overview 10) . . . . . . . . . . . . . . . . . . . . . . . . . . . . . . . . . 13
ENVISIONING NEIGHBORHOOD CONCEPTS . . . . . . . . . . . . . . 13How Information Visualization Facilitates Understanding (Project Overview 10A) . . . . . . . . . . . . . . . . . . . . . . . . . . . . . . . . 14Using Information Visualization to Envision Neighborhoods (Project Overview 10B) . . . . . . . . . . . . . . . . . . . . . . . . . . . . . . . . 16Scales for Envisioning Places (Project Overview 11) . . . . . . . . . 25Project Overviews 12 Through 15 . . . . . . . . . . . . . . . . . . . . . . . . 27Population and Job Densities (Project Overviews 16 & 17) . . . . 27
Data Sources, Software, and Techniques Documentation . . . 29Population and Jobs Within a Half Mile of East Bay BART Stations (Project Overview 18) . . . . . . . . . . . . . . . . . . . . . . . . . . 30
Characteristics . . . . . . . . . . . . . . . . . . . . . . . . . . . . . . . . . . . . 30Possible Applications . . . . . . . . . . . . . . . . . . . . . . . . . . . . . . . 31
Data Sources, Software, and Techniques Documentation . . . . . . 31What Project Overview 18 Shows . . . . . . . . . . . . . . . . . . . . . . . . 32
PROJECT OVERVIEW 19 . . . . . . . . . . . . . . . . . . . . . . . . . . . . . . . . 32Characteristics . . . . . . . . . . . . . . . . . . . . . . . . . . . . . . . . . . . . . . . 32Possible Applications . . . . . . . . . . . . . . . . . . . . . . . . . . . . . . . . . . 32
Mineta Transportation Institute
Envisioning Neighborhoods with Transit-Oriented Development Potentialii
SUMMARY OVERVIEW OF STUDY AREAS . . . . . . . . . . . . . . . 33
ENVISIONING THE FORTHCOMING DOWNTOWN CAMPBELL LRT STATION TOD POTENTIAL . . . 35
ENVISIONING THE FRUITVALE BART STATION VICINITY . . . . . . . . . . . . . . . . . . . . . . . . . . . . . . . . . . . . . 41
ENVISIONING THE HAYWARD CITY BART STATION VICINITY . . . . . . . . . . . . . . . . . . . . . . . . . . . 47
ENVISIONING THE MOUNTAIN VIEW VTA/CALTRAIN STATION VICINITY . . . . . . . . . . . . . . . . 55
ENVISIONING THE REDWOOD CITY CALTRAIN STATION VICINITY . . . . . . . . . . . . . . . . . . . . . . . . . . . 59
ENVISIONING THE SACRAMENTO 65TH STREET LRT VICINITY . . . . . . . . . . . . . . . . . . . . . . . . . . . . . . . . 63
COUNTY OR REGIONAL CONTEXTS . . . . . . . . . . . . . . 67REGIONAL DATA . . . . . . . . . . . . . . . . . . . . . . . . . . . . . . . . . . . . . . 67COUNTY CONTEXT VIEW CHARACTERISTICS . . . . . . . . . . . 70
A. ENVISIONING THE QUALITY OF LIFE AND CONTEXT FOR DEVELOPMENT IN NEIGHBORHOODS WITH TRANSIT-ORIENTED DEVELOPMENT POTENTIALABSTRACT . . . . . . . . . . . . . . . . . . . . . . . . . . . . . . . . . . . . . . . . . . . . 73INTRODUCTION . . . . . . . . . . . . . . . . . . . . . . . . . . . . . . . . . . . . . . . 74APPROPRIATE SCALES FOR STUDYING URBAN QOL . . . . . 75ENVISIONING NEIGHBORHOODS AS A TECHNIQUE FOR ESTIMATING QOL . . . . . . . . . . . . . . . . . . . . . . . . . . . . . . . . . . . . . 77CASE STUDY EXAMPLE ENVISIONING THE FRUITVALE BART STATION VICINITY . . . . . . . . . . . . . . . . . . . . . . . . . . . . . . 78SUMMARY PAGE VIEWS ENVISIONING THE FRUITVALE BART STATION AREA . . . . . . . . . . . . . . . . . . . . . . . . . . . . . . . . . . 81
Mineta Transportation Institute
Envisioning Neighborhoods with Transit-Oriented Development Potential iii
CONCLUSION . . . . . . . . . . . . . . . . . . . . . . . . . . . . . . . . . . . . . . . . . 91ACKNOWLEDGMENTS . . . . . . . . . . . . . . . . . . . . . . . . . . . . . . . . . 91REFERENCES . . . . . . . . . . . . . . . . . . . . . . . . . . . . . . . . . . . . . . . . . 91
B. HISTORY OF TRANSIT-ORIENTED DEVELOPMENTDEFINITION OF TRANSIT-ORIENTED DEVELOPMENT . . . . . 93BRIEF HISTORY OF TRANSIT-ORIENTED DEVELOPMENT . . . . . . . . . . . . . . . . . . . . . . . . . . . . . . . . . . . . . . . 93MAJOR ELEMENTS OF TRANSIT-ORIENTED DEVELOPMENT . . . . . . . . . . . . . . . . . . . . . . . . . . . . . . . . . . . . . . . 94RELATIONSHIP OF TOD TO NEW URBANISM AND SMART GROWTH . . . . . . . . . . . . . . . . . . . . . . . . . . . . . . . . . . . . . . . . . . . . . 96SPECIFIC FEATURES OF TRANSIT-ORIENTED DEVELOPMENT . . . . . . . . . . . . . . . . . . . . . . . . . . . . . . . . . . . . . . . 97
Design Features . . . . . . . . . . . . . . . . . . . . . . . . . . . . . . . . . . . . . . 97Density Features . . . . . . . . . . . . . . . . . . . . . . . . . . . . . . . . . . . . . 98
PROXIMITY TO STATIONS . . . . . . . . . . . . . . . . . . . . . . . . . . . . . 100NOTES . . . . . . . . . . . . . . . . . . . . . . . . . . . . . . . . . . . . . . . . . . . . . . . 101REFERENCES . . . . . . . . . . . . . . . . . . . . . . . . . . . . . . . . . . . . . . . . 102
C. WHY ENVISION TRANSIT-ORIENTED DEVELOPMENT POTENTIAL WITHIN A NEIGHBORHOOD CONTEXT WITH QUALITY-OF-LIFE MEASURES?
D. OPERATIONS HELPOPERATING INSTRUCTIONS AND TECHNICAL NOTES . . . 107
System Requirements . . . . . . . . . . . . . . . . . . . . . . . . . . . . . . . . 107Operating Instructions . . . . . . . . . . . . . . . . . . . . . . . . . . . . . . . . 107Suggested Paths Through the Envisioning Neighborhoods with TOD Potential Files. . . . . . . . . . . . . . . . . . . . . . . . . . . . . . 108
FEEDBACK REQUEST . . . . . . . . . . . . . . . . . . . . . . . . . . . . . . . . 110Figure 1-ArcView Extension: SJSU Zone Summary . . . . . . . . . 111Figure 2-ArcView Extension: SJSU Zone Summary 2 . . . . . . . 112Figure 3-ArcView Extension: SJSU Zone Summary 3 . . . . . . . 113
Mineta Transportation Institute
Envisioning Neighborhoods with Transit-Oriented Development Potentialiv
E. PRESENTATION OVERVIEWS . . . . . . . . . . . . . . . . . 115
BIBLIOGRAPHY . . . . . . . . . . . . . . . . . . . . . . . . . . . . . . . . 123GEOGRAPHIC INFORMATION SYSTEMS . . . . . . . . . . . . . . . . 123INFORMATION DESIGN AND TECHNOLOGY . . . . . . . . . . . . 124PLANNING AND TOD REFERENCES . . . . . . . . . . . . . . . . . . . . 125DATABASE SOURCES . . . . . . . . . . . . . . . . . . . . . . . . . . . . . . . . . 127
ACRONYMS AND ABBREVIATIONS . . . . . . . . . . . . . . 129
ABOUT THE AUTHORS . . . . . . . . . . . . . . . . . . . . . . . . . 131
Mineta Transportation Institute
Envisioning Neighborhoods with Transit-Oriented Development Potential v
LIST OF TABLES
1 Project Overview 6: Organizational Principles and Framework . . . . 72 How Information Visualization Facilitates Understanding . . . . . . . 153 Using Information Visualization to Envision Neighborhoods . . . . 16B-1 Major Elements of Transit-Oriented Development . . . . . . . . . . . . . 95B-2 Minimum Residential Densities for Various Types of Transit
Services . . . . . . . . . . . . . . . . . . . . . . . . . . . . . . . . . . . . . . . . . . . . . 100
Mineta Transportation Institute

Envisioning Neighborhoods with Transit-Oriented Development Potentialvi
Mineta Transportation Institute
Envisioning Neighborhoods with Transit-Oriented Development Potential vii
LIST OF FIGURES
1 Project Overview 7: Data File Relationships Chart . . . . . . . . . . . . . 82 Project Overview 9: Small Multiple Replicas . . . . . . . . . . . . . . . . . 123A Schema for Envisioning Neighborhoods, Example 1 . . . . . . . . . . . 173B Schema for Envisioning Neighborhoods, Example 2 . . . . . . . . . . . 183C Schema for Envisioning Neighborhoods, Example 3 . . . . . . . . . . . 193D Schema for Envisioning Neighborhoods, Example 4 . . . . . . . . . . . 203E Schema for Envisioning Neighborhoods, Example 5 . . . . . . . . . . . 213F Schema for Envisioning Neighborhoods, Example 6 . . . . . . . . . . . 223G Schema for Envisioning Neighborhoods, Example 7 . . . . . . . . . . . 233H Schema for Envisioning Neighborhoods, Example 8 . . . . . . . . . . . 243I Schema for Envisioning Neighborhoods, Example 9 . . . . . . . . . . . 254 Project Overview 11: Scales for Envisioning Places
Understanding the Context of TOD Developments; Example: TOD Near the Hawyard BART Station . . . . . . . . . . . . . 26
5 Population Density, San Francisco Bay Area . . . . . . . . . . . . . . . . . 286 Population, Employed Residents, and Jobs Within 1/2 Mile of
East Bay BART Station . . . . . . . . . . . . . . . . . . . . . . . . . . . . . . . . . . 307 Campbell Summaries 1 and 2 . . . . . . . . . . . . . . . . . . . . . . . . . . . . . 368 Campbell Summaries 3 and 4 . . . . . . . . . . . . . . . . . . . . . . . . . . . . . 369 Campbell Summaries 5 and 6 . . . . . . . . . . . . . . . . . . . . . . . . . . . . . 3710 Campbell Summaries 7 and 8 . . . . . . . . . . . . . . . . . . . . . . . . . . . . . 3811 Fruitvale Summaries 1 and 2 . . . . . . . . . . . . . . . . . . . . . . . . . . . . . . 4112 Fruitvale Summaries 3 and 4 . . . . . . . . . . . . . . . . . . . . . . . . . . . . . . 4213 Fruitvale Summary 5 . . . . . . . . . . . . . . . . . . . . . . . . . . . . . . . . . . . . 4314 Fruitvale Summary 6 . . . . . . . . . . . . . . . . . . . . . . . . . . . . . . . . . . . . 4415 Fruitvale Summaries 9 and 11 . . . . . . . . . . . . . . . . . . . . . . . . . . . . . 4516 Fruitvale Summaries 7 and 8 . . . . . . . . . . . . . . . . . . . . . . . . . . . . . . 4517 Hayward Summary 1 . . . . . . . . . . . . . . . . . . . . . . . . . . . . . . . . . . . . 4718 Hayward Summaries 2 and 3 . . . . . . . . . . . . . . . . . . . . . . . . . . . . . . 4919 Hayward Summary 4 . . . . . . . . . . . . . . . . . . . . . . . . . . . . . . . . . . . . 5120 Mountain View Summaries 1 and 2 . . . . . . . . . . . . . . . . . . . . . . . . 5521 Mountain View Summary 3 . . . . . . . . . . . . . . . . . . . . . . . . . . . . . . 5622 Mountain View Summaries 4 and 5 . . . . . . . . . . . . . . . . . . . . . . . . 5723 Redwood Summaries 1 and 2 . . . . . . . . . . . . . . . . . . . . . . . . . . . . . 5924 Redwood City Summaries 3 and 4 . . . . . . . . . . . . . . . . . . . . . . . . . 6025 Redwood City Summary 7 . . . . . . . . . . . . . . . . . . . . . . . . . . . . . . . 6126 Sacramento Summaries 1 and 2 . . . . . . . . . . . . . . . . . . . . . . . . . . . 6327 Sacramento Summaries 3 and 4 . . . . . . . . . . . . . . . . . . . . . . . . . . . 63
Mineta Transportation Institute
Envisioning Neighborhoods with Transit-Oriented Development Potentialviii
28 San Francisco Bay Region for Five TOD Study Areas . . . . . . . . . . 6829 Population 2000 and 2020 Rail Transit and TOD Areas . . . . . . . . . 6930 Regional Context of the Fruitvale and Hayward BART Station
Areas . . . . . . . . . . . . . . . . . . . . . . . . . . . . . . . . . . . . . . . . . . . . . . . . 7131 Alameda County TOD Study Areas with Highways . . . . . . . . . . . . 72A-1 Organizational Principles and Framework . . . . . . . . . . . . . . . . . . . . 79A-2 Chart of Data Relationships for Envisioning Neighborhoods with
TOD Potantial. . . . . . . . . . . . . . . . . . . . . . . . . . . . . . . . . . . . . . . . . . 79A-3 Location Maps for Fruitvale BART Station Vicinity. . . . . . . . . . . . 81A-4 Digital Ortho Photos and Photos for Fruitvale BART Station
Vicinity . . . . . . . . . . . . . . . . . . . . . . . . . . . . . . . . . . . . . . . . . . . . . . . 82A-5aStacked Bar Charts and Standard Bar Chart. . . . . . . . . . . . . . . . . . . 84A-5bStacked Bar Chart and Standard Bar Chart . . . . . . . . . . . . . . . . . . . 85A-6aPopulation Rings for Fruitvale BART Area. . . . . . . . . . . . . . . . . . . 86A-6bBlock Groups Within 1, 2 and 5 miles of Fruitvale BART
Station. . . . . . . . . . . . . . . . . . . . . . . . . . . . . . . . . . . . . . . . . . . . . . . . 87A-7aHousing Units in a Stacked Bar Chart; 7b-Z scores for Fruitvale
TOD Areas . . . . . . . . . . . . . . . . . . . . . . . . . . . . . . . . . . . . . . . . . . . . 88A-8 Fruitvale BART Station Area Year 2000 Profiles . . . . . . . . . . . . . . 89C-1 CD File: Why_TOD, slide 1 . . . . . . . . . . . . . . . . . . . . . . . . . . . . . 105D-1 ArcView Extension: SJSU Zone Summary . . . . . . . . . . . . . . . . . . 111D-2 ArcView Extension: SJSU Zone Summary 2. . . . . . . . . . . . . . . . . 112D-3 ArcView Extension: SJSU Zone Summary 3. . . . . . . . . . . . . . . . . 113
Mineta Transportation Institute
Executive Summary 1
EXECUTIVE SUMMARY
The Envisioning Neighborhoods with Transit Oriented Development (TOD)Potential project seeks to introduce planners, developers, and urban analysts toinformation design techniques and digital computer tools which can be used toundertake and study TOD. A basic premise is that effective TOD requiresthoughtful planning to be successfully integrated into the metropolitan fabric.
The primary focus of this project is intra-regional comparisons, focusing ondecisions pertaining to the relative desirability of places within the region.Limited attention has been given to site-specific details, although this aspectmerits additional attention. The study focus is on understanding theneighborhoods surrounding transit centers and their context in terms of thecharacter of areas within walking distance (<1/2 mile), bicycling distance (<2miles), and five-mile driving or transit distance. These ranges of analysisinclude the areas where residents of possible TODs might work, shop, or preferto go for services.
Understanding these areas may be important for developers seeking to co-locate work sites, service centers, retail or other facilities for residents,workers, and visitors within walking, bicycling, and moderate driving or transitriding distance of the TOD focus area.
This project includes a comprehensive case study application envisioning theHayward BART Station area. Other case studies cover the Fruitvale BART inOakland, Redwood City, and Mountain View CalTrain, Campbell LRT site,and Sacramento's 65th St. Station area. Chapter one will explain the relevanceof transit-oriented development via detailed tables, charts and maps.
This project is unique in that the graphics are not reproduced within the text,but included on the accompanying CD-ROM. To reproduce the graphics incolor is cost-prohibitive, and the full-color interactive graphics are of such highquality that MTI elected to publish this series of studies with the CD-ROM toencourage usability of the publication. Readers and users of this study areencouraged to use the CD-ROM with its enhanced viewability.
The transit centers chosen for the creation of prototype examples are orientedaround rail transit stops, with two being at BART (Bay Area Rapid Transit)heavy rail stops in the East Bay region (Hayward, and the Fruitvale stop inOakland); two at CalTrain heavy rail stops in the Peninsula region between San
Mineta Transportation Institute
Executive Summary2
Francisco and San Jose (Redwood City and Mountain View); and three at lightrail transit (LRT) stops (the Mountain View and future downtown Campbellstop in Santa Clara County, and the 65th Street stop in Sacramento County).
Four of the transit centers include the downtowns of small to medium largecities. All served as farm market centers during their formative years. Two(Redwood City and Mountain View) were on the commuter steam rail linebuilt between San Francisco and San Jose in the 1860s. Redwood City andHayward are the county seats of large urban counties, having from 500,000 tomore than a million residents.
The PowerPoint slides are the principal output of this study. These files includefull color displays and multiple hyperlinks to facilitate access to related textdiscussions, video clips and animated time series maps. The hyperlinks withthe PowerPoint files enable users to choose and immediately access the levelsand areas of analysis they are interested in seeing. This approach has manyadvantages compared to the straight linear approach of reading printed text.Reading the printed black and white version is most meaningful whenaccompanied by viewing on a computer monitor the color PowerPoint fileversion of the presentation screens available from the CD-ROM or website, asmost of the maps and diagrams have been designed for color viewing.
The basic organizational principle for the Envisioning NeighborhoodsTechnique developed by Dr. Bossard can be surmised in the single sentence,“Use small replicate GIS maps, charts, digital images, and tables to facilitatecomparisons across space, time, and scale because data is best understood in acomparative context.”
This document contains several separate studies which were undertaken bySJSU students under Dr. Bossard’s supervision.
The chapter one overview explains the type of data which are available on thePowerPoint presentation, the project overview presentations, as well asrationale for TOD and envisioning neighborhood techniques.
Chapter two includes summary overviews including maps and graphs of thevarious study areas, including Campbell light rail, Fruitvale BART in Oakland,Hayward BART, Mountain View CalTrain/light rail, Redwood City CalTrain,and the Sacramento 65th Street Station.
Mineta Transportation Institute
Executive Summary 3
Chapter three, “County or Regional Contexts” is a series of maps showing theregional setting for the five TOD study areas in Alameda, San Mateo, andSanta Clara Counties.
Appendix A is the text of Dr. Bossard and Tara Kelly’s presentationEnvisioning the Quality of Life and Context for Development inNeighborhoods with Transit-Oriented Development Potential, which waspresented at the Second International Conference on Quality of Life in Cities,Singapore, March 2000.
Appendix B is a “History of Transit-Oriented Development” prepared by BrettHondorp.
Appendix C is a complete, turnkey PowerPoint presentation which explainswhat transit-oriented development is all about. It also links TOD’s connectionto the New Urbanism movement and introduces the viewer to the Envisioningproject from San José State University.
System requirements to use the enclosed CD-ROM include the following:
• Windows PC running Microsoft PowerPoint 2000. RealPlayer, CasioPanorama and GIF Animator.
• 32 MB or more CPU (Sacramento detailed views and Fruitvale views mayrequire 64 MB).
• 200 MB hard disk space
• 17" or larger monitor with XGA resolution (1024 x 780). SVGA resolution(800 x 600 generally okay, but has some graphics problems). XGAresolution (640 x 480) shows most text, but graphics are very poor.
Mineta Transportation Institute

Executive Summary4
Mineta Transportation Institute
Concepts for Envisioning Neighborhoods with TOD Potential 5
CONCEPTS FOR ENVISIONING NEIGHBORHOODS WITH TOD POTENTIAL
The Envisioning Neighborhoods concepts underlying this project wereoriginally developed for presentations at the conferences on Computers inUrban Planning and Urban Management (CUPUM) held in Bombay, India, in1997 and Venice, Italy, in 1999; and for the Conference on Quality of Life inCities, held in Singapore in 1998. They were refined for the Conference onQuality of Life in Cities held in Singapore in 2000.
Additional information on this topic can be found in the papers published inthese conference proceedings: Bossard and Tallam (1997), Bossard (1998),Bossard (1999), and Bossard and Kelly (2000). Especially pertinent is thepaper “Envisioning the Quality of Life and Context for Development inNeighborhoods with Transit Oriented Development Potential” by Bossard andKelly, which is reproduced in this paper and is accessible in the digital versionby clicking on the “Envisioning QOL” button in the “Help and Rationale”column in the Main TOD Menu.
The PowerPoint files are the principal output of this study. These files includefull-color displays and multiple hyperlinks to facilitate access to related textdiscussions, video clips, and animated time series map displays. Thehyperlinks within the PowerPoint files enable users to choose and immediatelyaccess the levels and areas of analysis in which they are interested. Thisapproach has many advantages compared to the linear approach of readingprinted text. Reading the printed black-and-white version is most meaningfulwhen also viewing on a computer monitor the color PowerPoint file version ofthe presentation screens available from the CD-ROM or Web site, as most ofthe maps and diagrams have been designed for color viewing.
Please refer to CD-ROM file 1_Introductory Presentation, which is a completepresentation. For more in-depth information, refer to CD-ROM file0_TOD_Main and the multiple files that can be accessed through that gatewayfile. The 0_Operating_Instructions file provides guidance in accessing andusing the PowerPoint files.
Mineta Transportation Institute
Concepts for Envisioning Neighborhoods with TOD Potential6
SELECTED PROJECT OVERVIEWS THAT PRESENT KEY CONCEPTS FOR ENVISIONING NEIGHBORHOODS WITH TOD POTENTIAL
The remaining pages in this chapter discuss, and in many cases also presentblack-and-white miniatures of, selected project overviews from the digitalpresentation, which present key concepts for Envisioning Neighborhoods withTransit-Oriented Development (TOD) potential.
Organizational Principles and Framework (Project Overview 6) (O_TOD_Main.ppt screen 12)
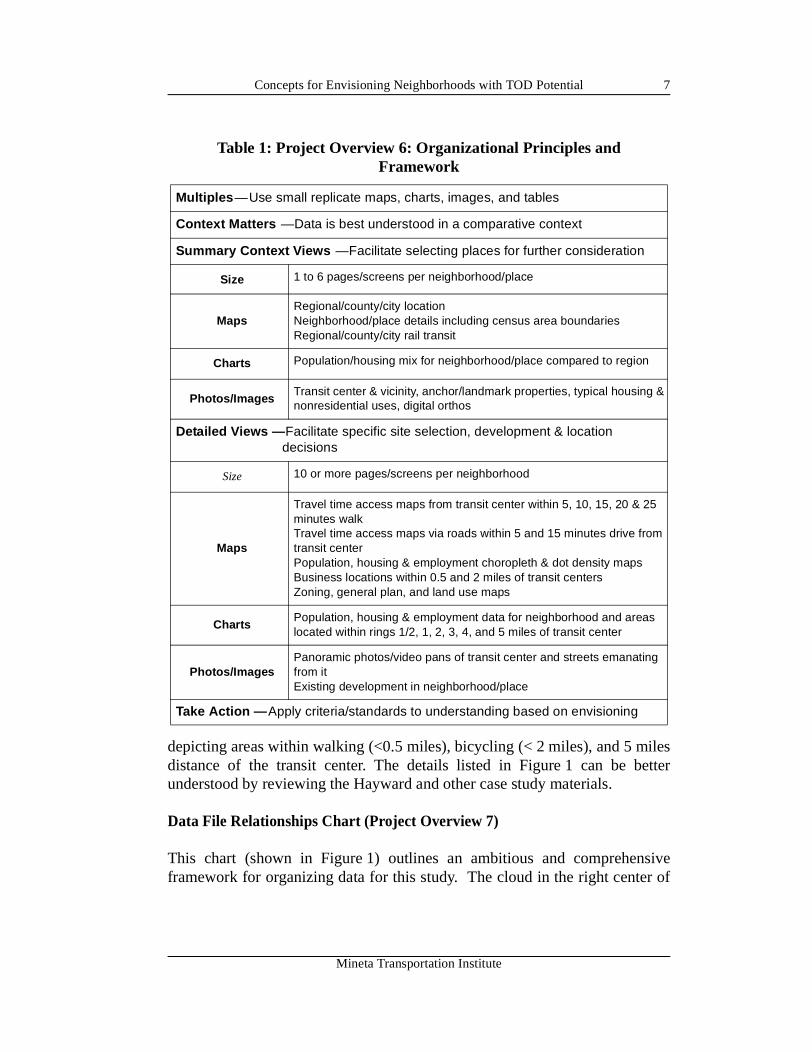
The basic organizational principle for the Envisioning Neighborhoodstechnique developed by Professor Bossard is: “Use small replicate GIS maps,charts, digital images, and tables to facilitate comparisons across space, time,and scale because data is best understood in a comparative context.” Theseprinciples have been derived, in part, from the works of Edward Tufte, authorand publisher of the seminal texts The Visual Display of QuantitativeInformation (1983) and Envisioning Information (1990). These principles arethe basis of the first two components of the hierarchical OrganizationalPrinciples and Framework for Envisioning Neighborhoods with Transit-Oriented Development (TOD) Potential, shown as Project Overview 6(Table 1). The next two components of the framework (Summary ContextViews and Detailed Views) are discussed below.
Summary Context Views of a few pages for neighborhoods with TODpotential help planners, developers, or analysts decide whether the place meritsfurther consideration. These summary context views may include maps, charts,and digital images that place the TOD-potential neighborhood in regionalcontext, while presenting images and data suggesting the character of theplace. The Hayward Summary Overview, presented in “Envisioning theHayward City BART Station Vicinity,” beginning on page 47, is the primeexample of a summary context view, although each of the other summaryviews has some distinctive features of merit.
Detailed Views provide 10 or more pages/screens per neighborhood case studyarea to facilitate specific site selection, development, and location decisionsregarding TOD development. The Hayward case study presents the mostcomprehensive set of detailed views, but each of the other case study examplesalso presents some distinctive features of merit. The detailed views clusterinformation based on spatial context, with separate files and menus for data
Mineta Transportation Institute
Concepts for Envisioning Neighborhoods with TOD Potential 7
depicting areas within walking (<0.5 miles), bicycling (< 2 miles), and 5 milesdistance of the transit center. The details listed in Figure 1 can be betterunderstood by reviewing the Hayward and other case study materials.
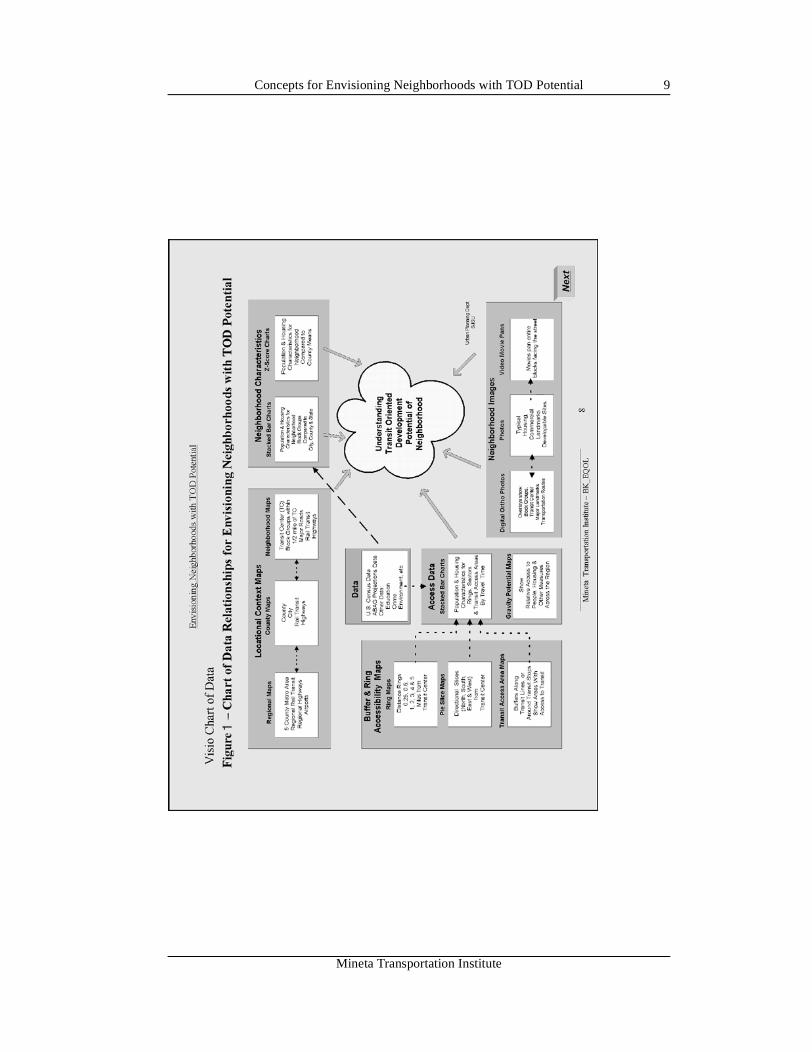
Data File Relationships Chart (Project Overview 7)
This chart (shown in Figure 1) outlines an ambitious and comprehensiveframework for organizing data for this study. The cloud in the right center of
Table 1: Project Overview 6: Organizational Principles and Framework
Multiples—Use small replicate maps, charts, images, and tables
Context Matters —Data is best understood in a comparative context
Summary Context Views —Facilitate selecting places for further consideration
Size 1 to 6 pages/screens per neighborhood/place
MapsRegional/county/city locationNeighborhood/place details including census area boundariesRegional/county/city rail transit
Charts Population/housing mix for neighborhood/place compared to region
Photos/ImagesTransit center & vicinity, anchor/landmark properties, typical housing & nonresidential uses, digital orthos
Detailed Views —Facilitate specific site selection, development & location decisions
Size 10 or more pages/screens per neighborhood
Maps
Travel time access maps from transit center within 5, 10, 15, 20 & 25 minutes walkTravel time access maps via roads within 5 and 15 minutes drive from transit centerPopulation, housing & employment choropleth & dot density mapsBusiness locations within 0.5 and 2 miles of transit centersZoning, general plan, and land use maps
ChartsPopulation, housing & employment data for neighborhood and areas located within rings 1/2, 1, 2, 3, 4, and 5 miles of transit center
Photos/ImagesPanoramic photos/video pans of transit center and streets emanating from itExisting development in neighborhood/place
Take Action —Apply criteria/standards to understanding based on envisioning
Mineta Transportation Institute
Concepts for Envisioning Neighborhoods with TOD Potential8
the chart identifies the process goal, which is “Understanding Transit-OrientedDevelopment Potential of [a] Neighborhood.”
The Locational Context Maps, top left in the chart, are a key SummaryContext View study area component. They identify the location ofneighborhoods in their regional, county, and city context along with principaltransit connections, which for our study areas are via rail and light rail transit.
The Data and Neighborhood Characteristics features take U.S. census andother area data and present them via stacked bar charts and z-score charts thatenable comparison of block group areas averaging 1,000 residents withinwalking distance of the transit center to their city, county, and state. Thesecharts enable analysts to compare, at several scales, characteristics of the areasaround transit centers to surrounding areas. Other data presented forneighborhoods include zoning/land use constraint maps, which may be ofparticular interest to developers. Local real estate listing, assessment, andmarket information could also be included in envisioning studies.
The Neighborhood Images information, bottom right in the chart, usesphotos, digital ortho adjusted aerial photos, and video pans of neighborhoodsto help produce a qualitative (that is, nonquantitative) image of the area.
The Buffer & Ring Accessibility Maps and Access Data, bottom left in thechart, include access measures that can be developed using geographicinformation systems (GIS) mapping analysis and various modeling techniques,including the Zone Summary Arc View Extension developed for this project,which produces data needed for ring, pie slice, and buffer maps. This programestimates ring populations from zonal data and helps produce maps andpopulation estimates for areas within various driving and walking distances.
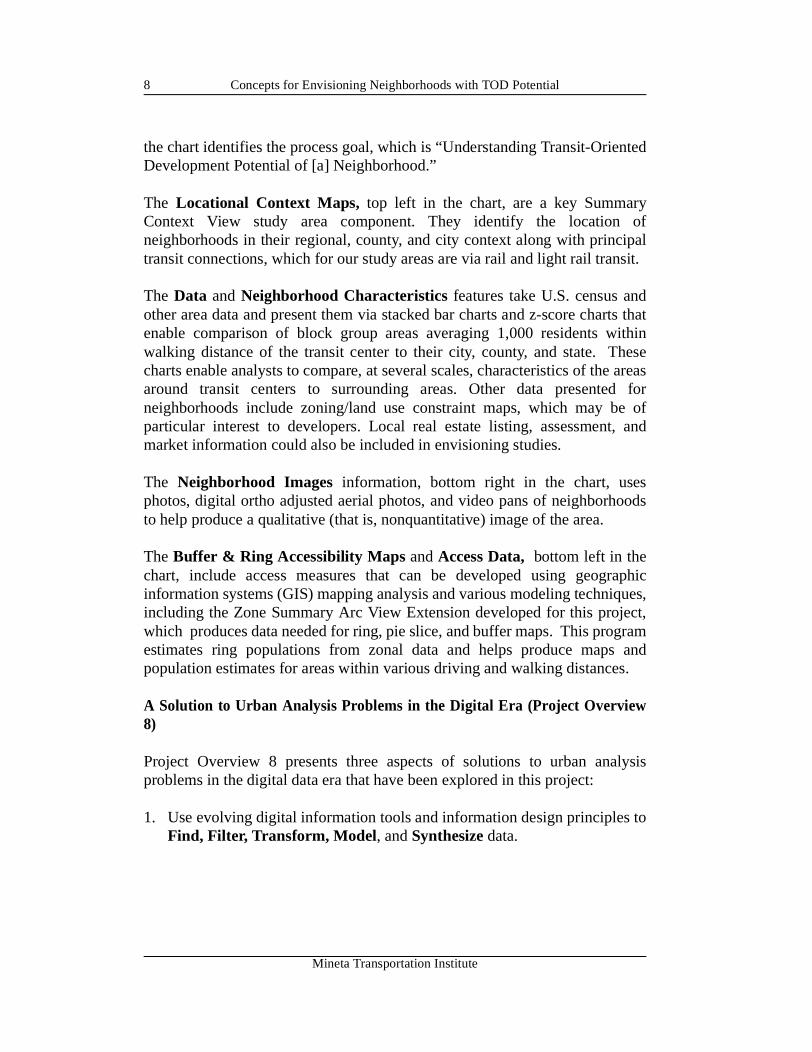
A Solution to Urban Analysis Problems in the Digital Era (Project Overview8)
Project Overview 8 presents three aspects of solutions to urban analysisproblems in the digital data era that have been explored in this project:
1. Use evolving digital information tools and information design principles toFind, Filter, Transform, Model, and Synthesize data.
Mineta Transportation Institute
Concepts for Envisioning Neighborhoods with TOD Potential 9
Mineta Transportation Institute
Concepts for Envisioning Neighborhoods with TOD Potential10
2. Use Envisioning Neighborhoods principles to Present the resultinginformation using a schema that organizes data into small multiples, in aform useful for understanding conditions and making decisions.
3. Take action after applying criteria/standards to understanding based onenvisioning.
The use of digital information tools and information design principles to find,filter, transform, model, and synthesize data is discussed below.
Find data
The Internet has fostered a phenomenal increase in the quantity and quality ofdata available for urban analysis in recent years. Private vendors andgovernment agencies also have made available large quantities of data on CD-ROMs. Sophisticated search engines are being developed to search the Internetfor relevant data. Batty, 1998, discusses the future of data-finding “agents” thatcan act digitally for data seekers and search the information for desired data.
Filter data
A major problem with digital information is that procedures to screen data toselect only data relevant to the task at hand have not kept up with increases inthe quantity of raw data found. A solution is for broadly based standards toemerge for metadata — data about data — describing its origin, character,accuracy, and timeliness. Metadata can be used to help filter data down to thatlikely to be appropriate for further analysis. The issues of finding and filteringdata, which typically costs 15-50 percent of GIS total project costs (Longley, etal., 2001, p. 206) are worthy of detailed study, but that is beyond the scope ofthis study, which focuses on the data display and analysis part of theenvisioning process.
Transform data
Relevant raw data often need to be transformed so that they can be readilycomparable to other data. Frequently, it is desirable to transform raw countdata into relative share or intensity measures to facilitate comparisons of thecharacter of places of different sizes. Calculating the mean and standarddeviations of census measures for small areas in a county, such as block groupsor census tracts, can produce z-scores that compare measures for a place tomean values for larger areas, such as counties.
Mineta Transportation Institute
Concepts for Envisioning Neighborhoods with TOD Potential 11
Model data
Transformed data can be input into projection, simulation, and other types oftransportation-land use models to estimate relationships and future conditions.This study relies on the modeling efforts of the Association of Bay AreaGovernments (ABAG), the regional agency for the nine counties around SanFrancisco Bay, for estimates and projections for periods from 1990 to 2020 forareas as small as census tracts. Modeling efforts undertaken with the datainclude estimating various data counts for areas within one-half mile of railstations and transit centers, shown in Project Overview 18 (page 30).
Synthesize data
A key aspect of the Envisioning Neighborhoods technique is bringing togetherpieces of data in replicate multiple maps and charts to synthesize data intouseful information.
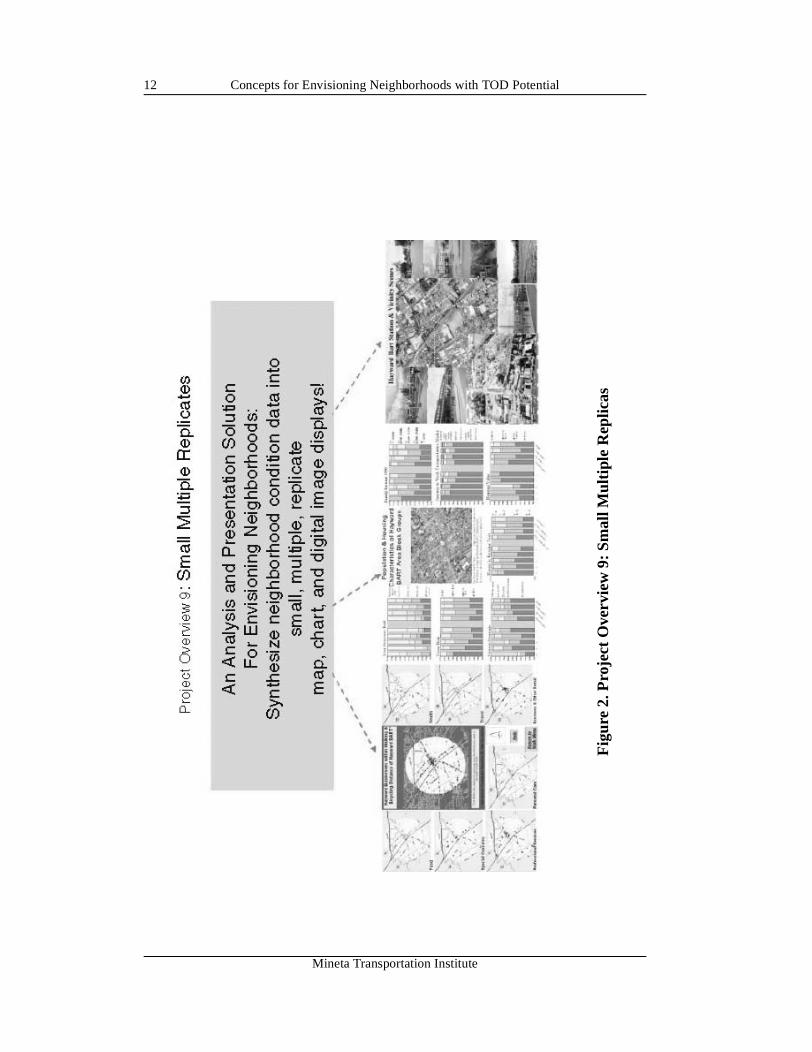
An Analysis and Presentation Solution for Envisioning Neighborhoods(Project Overview 9)
Synthesize neighborhood condition data into small, multiple, replicatemap, chart, and digital image displays
This overview (shown in figure 2) is based on a quotation from Edward Tufte:“Small multiples, whether tabular or pictorial, move to the heart of visualreasoning—to see, distinguish, choose...Their multiplied smallness enforceslocal comparisons within our eyespan, relying on an active eye to select andmake contrasts rather than on bygone memories of images scattered over pagesand pages.” (Tufte, 1990, p. 33.)
Small multiples of maps enable us to see the spatial distribution of severaldifferent factors, such as the seven categories of business activity within2 miles of the Hayward BART Station shown in the bottom left image.Comparisons can be of where concentrations of particular types of businessesoccur and where particular types of businesses may be lacking. This mayenable developers to look for unmet market niches that they can choose to fillfrom a TOD site, or may convince potential tenants that a TOD project hassufficient services to satisfy their needs.
Small multiples of charts, such as the multiple stacked bar charts in thebottom central image, enable analysts to compare the relative distributions for
Mineta Transportation Institute
Concepts for Envisioning Neighborhoods with TOD Potential
Mineta Transportation Institute
12
Fig
ure
2. P
roje
ct O
verv
iew
9: S
mal
l Mul
tipl
e R
eplic
as
Concepts for Envisioning Neighborhoods with TOD Potential 13
a number of central data for block groups to the distributions for the city,county, and state. With practice, analysts can use this approach to envisiongeneral conditions in TOD areas quickly.
Small multiple images, such as the pictures of scenes in the vicinity of theHayward BART station presented in the bottom right image, provide manyqualitative impressions of the character of an area in a limited amount of space.
Envisioning Neighborhoods Techniques and Principles (Project Overview 10)
(Not shown in this printed version.)
The Project Overview 10 slide in the digital presentation succinctlysummarizes the Envisioning Neighborhoods principles with four points:Context matters; data is best understood in a comparative context; place datacan be compared over space, time, and scale; and small multiples of maps,charts, and digital images are efficient data presentation formats.
The “Envisioning Neighborhoods Concepts” button on Project Overview 10links to an extensive presentation developed by Professor Earl Bossard tooutline the underlying rationale for the information design, using smallmultiples of maps, charts, and digital images to facilitate comparisons acrossspace, time, and scale. The presentation cites several books on the subject byTufte. It has examples and discussions regarding small multiples, comparisonsacross space, time, and scale, with examples using census data.
ENVISIONING NEIGHBORHOOD CONCEPTS
The Envisioning Neighborhoods technique develops and uses visualrepresentational frameworks of data, called schema, to facilitate understandingand/or decision making in a variety of ways, described in Project Overview10A, (Table 2 on page 15). The emerging field of information design is rapidlydevising better ways to organize and present data (Card, Mackinlay, andShneiderman, 1999; Jacobson, 1999; Tufte, 1983, 1990, 1997; Davenport,1997).
One approach to Envisioning Neighborhoods, derived from what Readings inInformation Visualization—Using Vision to Think (Card, Mackinlay, andShneiderman, 1999, pp. 10-12) calls knowledge crystallization, is to gatherinformation for some purpose; make sense of it by constructing arepresentational framework, called a schema; and then package it in a form
Mineta Transportation Institute
Concepts for Envisioning Neighborhoods with TOD Potential14
suitable for communication or action. A more complete explanation woulddelineate the following steps:
1. Forage for information regarding the neighborhoods to be studied;
2. Search for a schema, a visual structure of data to represent theneighborhood;
3. Fill the schema with data;
4. Problem-solve working with the schema and determine if the resultingvisualization is sufficient to solve the problem; if so, the solution isobserved and packaged for communication or action in Step 6;
5. If necessary, search for a new or revised schema that yields a clearersolution, proceeding through Steps 2, 3, and 4;
6. Package the patterns and solutions found into output designed forcommunication or action.
Project Overview 10B (Table 3 on page 16) provides further detail regardingthe schema-based envisioning approach. Project Overview 10C, presented inFigure 3 beginning on page 17, presents nine examples of schema used forEnvisioning Neighborhoods.
Envisioning tasks can be “…characterized by the use of large amounts ofheterogeneous information, ill-structured problem solving, but a relativelywell-defined goal requiring insight into information relative to some purpose.”(Card, et al., 1999).
General envisioning of neighborhoods can use the summary overview schemadeveloped for this project as standard templates; they combine small replicateGIS maps, charts, digital images, and tables. Standard template schema, shownin Project Overview 10C (Figures 3A through 3I, page 17 through page 25),facilitate comparisons of places and choices of places for further study. An in-depth understanding of particular neighborhoods or neighborhood problemsoften is best achieved by using custom schema that give central positions to thespecial factors that make the place unique. The detailed view schema in thisproject contain customized schema. All examples in Figure 3 are from the MTIProject 9810 PowerPoint files. These examples, and others, can be accessed intheir home settings from file EN_Schema.ppt.
Mineta Transportation Institute
Concepts for Envisioning Neighborhoods with TOD Potential 15
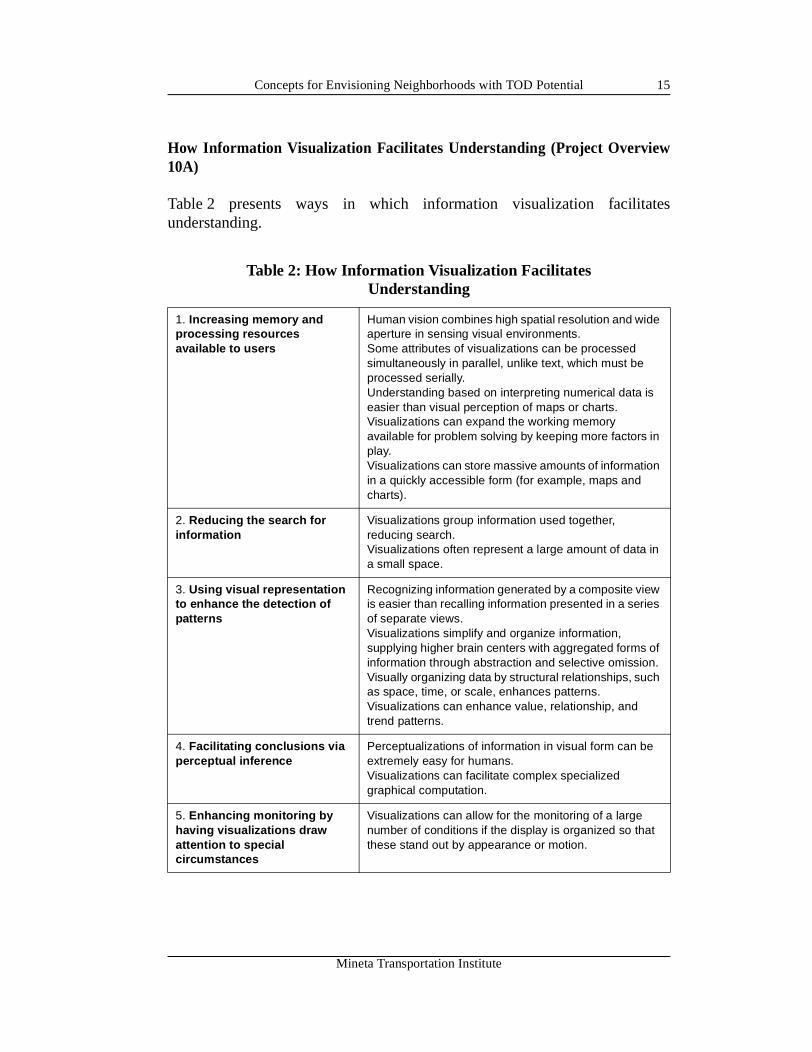
How Information Visualization Facilitates Understanding (Project Overview10A)
Table 2 presents ways in which information visualization facilitatesunderstanding.
Table 2: How Information Visualization Facilitates Understanding
1. Increasing memory and processing resources available to users
Human vision combines high spatial resolution and wide aperture in sensing visual environments.Some attributes of visualizations can be processed simultaneously in parallel, unlike text, which must be processed serially.Understanding based on interpreting numerical data is easier than visual perception of maps or charts.Visualizations can expand the working memory available for problem solving by keeping more factors in play.Visualizations can store massive amounts of information in a quickly accessible form (for example, maps and charts).
2. Reducing the search for information
Visualizations group information used together, reducing search.Visualizations often represent a large amount of data in a small space.
3. Using visual representation to enhance the detection of patterns
Recognizing information generated by a composite view is easier than recalling information presented in a series of separate views.Visualizations simplify and organize information, supplying higher brain centers with aggregated forms of information through abstraction and selective omission.Visually organizing data by structural relationships, such as space, time, or scale, enhances patterns.Visualizations can enhance value, relationship, and trend patterns.
4. Facilitating conclusions via perceptual inference
Perceptualizations of information in visual form can be extremely easy for humans.Visualizations can facilitate complex specialized graphical computation.
5. Enhancing monitoring by having visualizations draw attention to special circumstances
Visualizations can allow for the monitoring of a large number of conditions if the display is organized so that these stand out by appearance or motion.
Mineta Transportation Institute
Concepts for Envisioning Neighborhoods with TOD Potential16
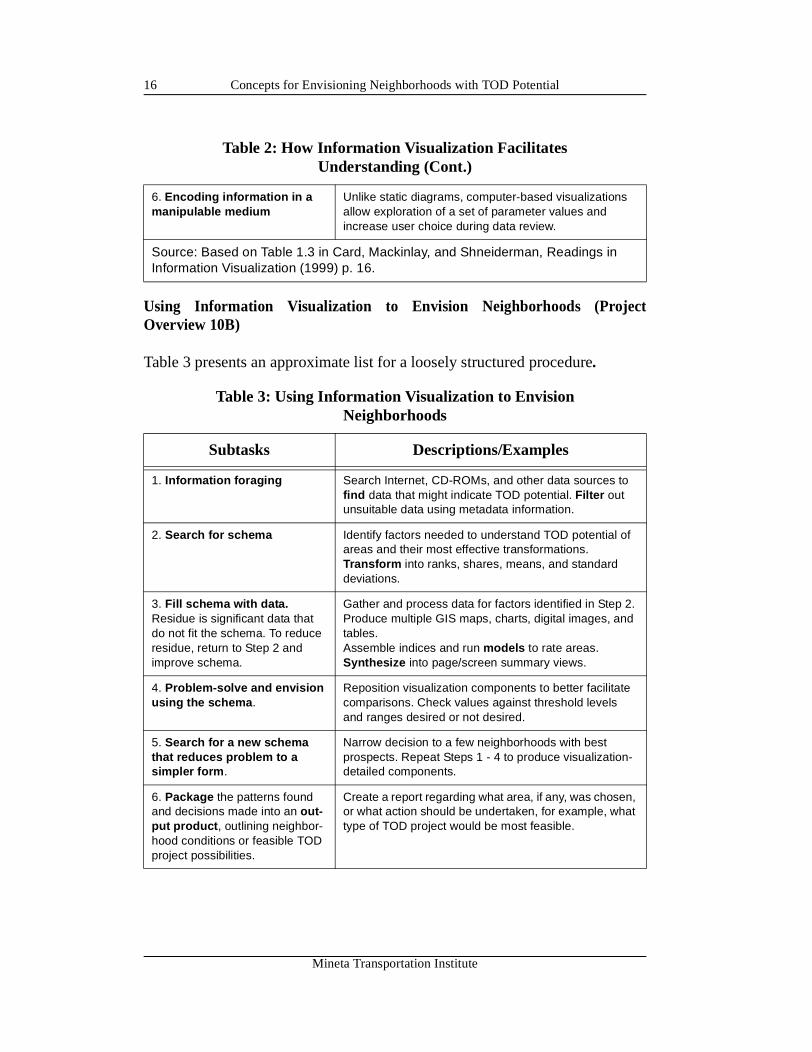
Using Information Visualization to Envision Neighborhoods (ProjectOverview 10B)
Table 3 presents an approximate list for a loosely structured procedure.
6. Encoding information in a manipulable medium
Unlike static diagrams, computer-based visualizations allow exploration of a set of parameter values and increase user choice during data review.
Source: Based on Table 1.3 in Card, Mackinlay, and Shneiderman, Readings in Information Visualization (1999) p. 16.
Table 3: Using Information Visualization to Envision Neighborhoods
Subtasks Descriptions/Examples
1. Information foraging Search Internet, CD-ROMs, and other data sources to find data that might indicate TOD potential. Filter out unsuitable data using metadata information.
2. Search for schema Identify factors needed to understand TOD potential of areas and their most effective transformations. Transform into ranks, shares, means, and standard deviations.
3. Fill schema with data. Residue is significant data that do not fit the schema. To reduce residue, return to Step 2 and improve schema.
Gather and process data for factors identified in Step 2. Produce multiple GIS maps, charts, digital images, and tables.Assemble indices and run models to rate areas.Synthesize into page/screen summary views.
4. Problem-solve and envision using the schema.
Reposition visualization components to better facilitate comparisons. Check values against threshold levels and ranges desired or not desired.
5. Search for a new schema that reduces problem to a simpler form.
Narrow decision to a few neighborhoods with best prospects. Repeat Steps 1 - 4 to produce visualization-detailed components.
6. Package the patterns found and decisions made into an out-put product, outlining neighbor-hood conditions or feasible TOD project possibilities.
Create a report regarding what area, if any, was chosen, or what action should be undertaken, for example, what type of TOD project would be most feasible.
Table 2: How Information Visualization Facilitates Understanding (Cont.)
Mineta Transportation Institute
Concepts for Envisioning Neighborhoods with TOD Potential 17
Source: Based on Figure 1.15 in Card, Mackinlay, and Shneiderman, Readings in Information Visualization (1999) p. 10-11.
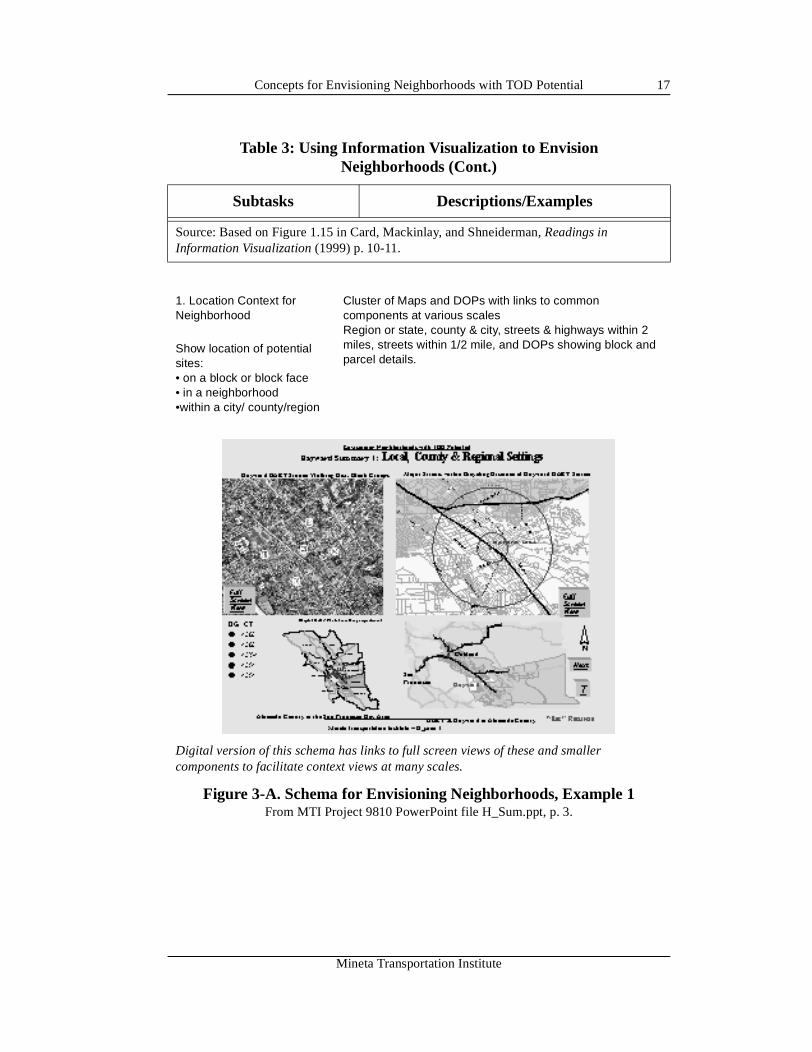
1. Location Context for Neighborhood
Show location of potential sites:• on a block or block face• in a neighborhood•within a city/ county/region
Cluster of Maps and DOPs with links to common components at various scalesRegion or state, county & city, streets & highways within 2 miles, streets within 1/2 mile, and DOPs showing block and parcel details.
Digital version of this schema has links to full screen views of these and smaller components to facilitate context views at many scales.
Figure 3-A. Schema for Envisioning Neighborhoods, Example 1From MTI Project 9810 PowerPoint file H_Sum.ppt, p. 3.
Table 3: Using Information Visualization to Envision Neighborhoods (Cont.)
Subtasks Descriptions/Examples
Mineta Transportation Institute
Concepts for Envisioning Neighborhoods with TOD Potential18
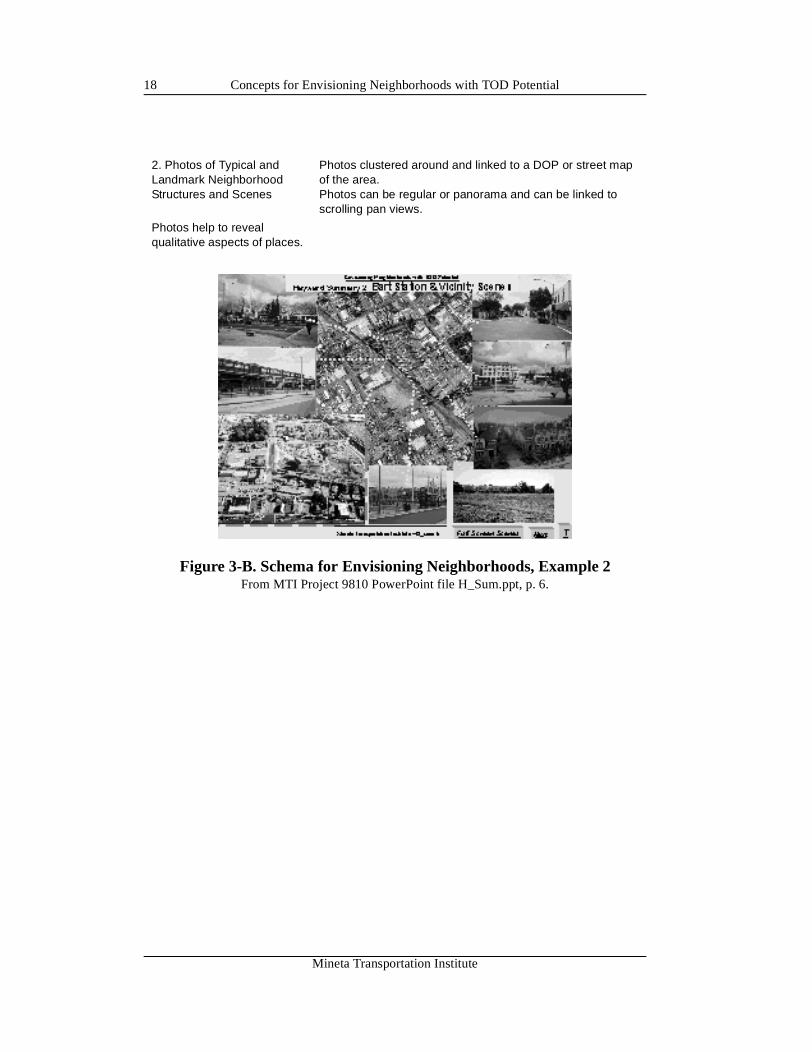
2. Photos of Typical and Landmark Neighborhood Structures and Scenes
Photos help to reveal qualitative aspects of places.
Photos clustered around and linked to a DOP or street map of the area. Photos can be regular or panorama and can be linked to scrolling pan views.
Figure 3-B. Schema for Envisioning Neighborhoods, Example 2From MTI Project 9810 PowerPoint file H_Sum.ppt, p. 6.
Mineta Transportation Institute
Concepts for Envisioning Neighborhoods with TOD Potential 19
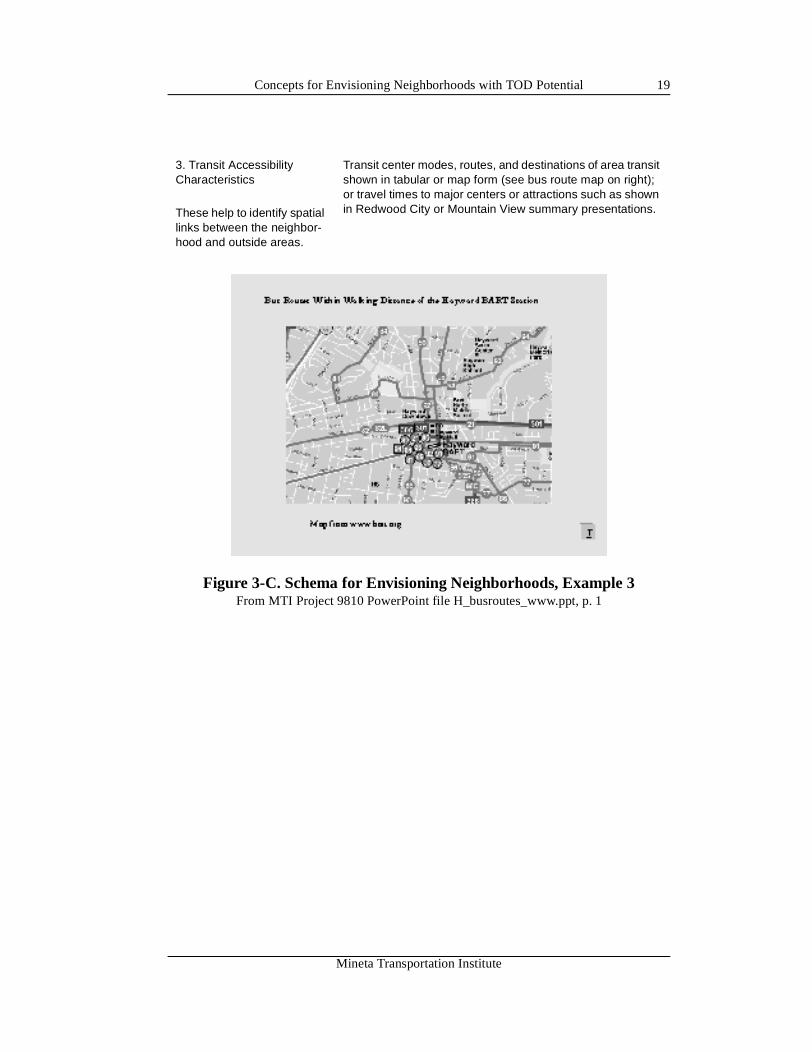
3. Transit Accessibility Characteristics
These help to identify spatial links between the neighbor-hood and outside areas.
Transit center modes, routes, and destinations of area transit shown in tabular or map form (see bus route map on right); or travel times to major centers or attractions such as shown in Redwood City or Mountain View summary presentations.
Figure 3-C. Schema for Envisioning Neighborhoods, Example 3From MTI Project 9810 PowerPoint file H_busroutes_www.ppt, p. 1
Mineta Transportation Institute
Concepts for Envisioning Neighborhoods with TOD Potential20
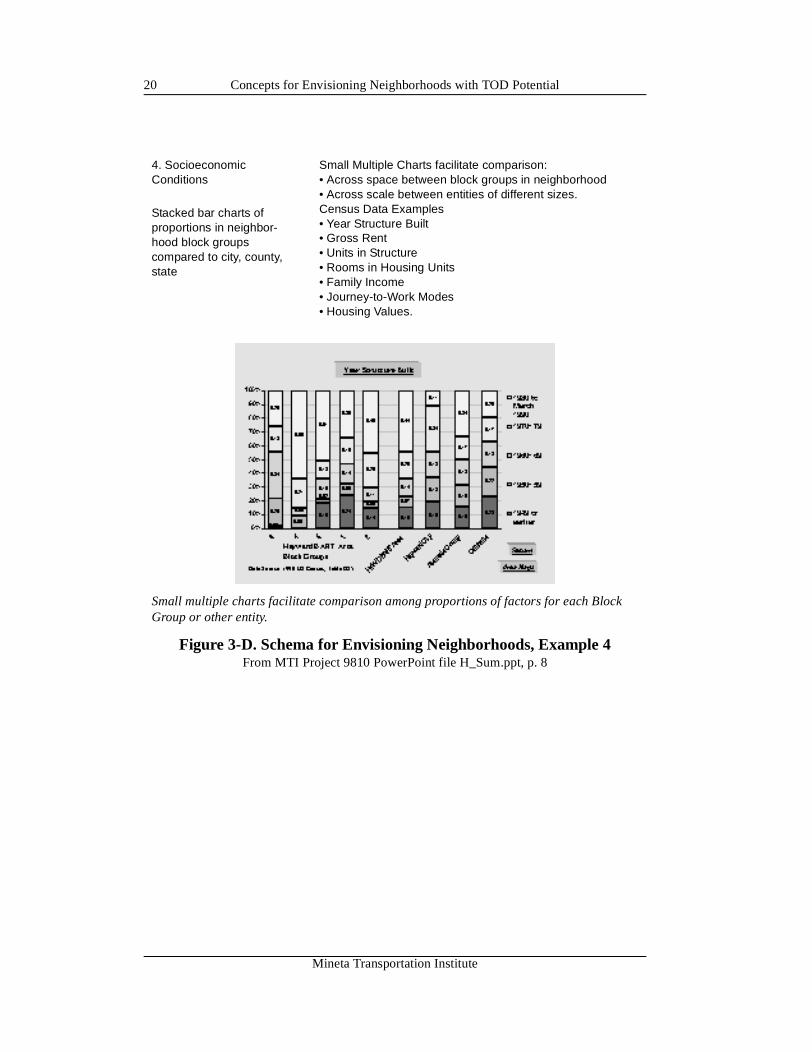
4. Socioeconomic Conditions
Stacked bar charts of proportions in neighbor-hood block groups compared to city, county, state
Small Multiple Charts facilitate comparison:• Across space between block groups in neighborhood• Across scale between entities of different sizes.Census Data Examples• Year Structure Built• Gross Rent• Units in Structure• Rooms in Housing Units• Family Income• Journey-to-Work Modes• Housing Values.
Small multiple charts facilitate comparison among proportions of factors for each Block Group or other entity.
Figure 3-D. Schema for Envisioning Neighborhoods, Example 4From MTI Project 9810 PowerPoint file H_Sum.ppt, p. 8
Mineta Transportation Institute
Concepts for Envisioning Neighborhoods with TOD Potential 21
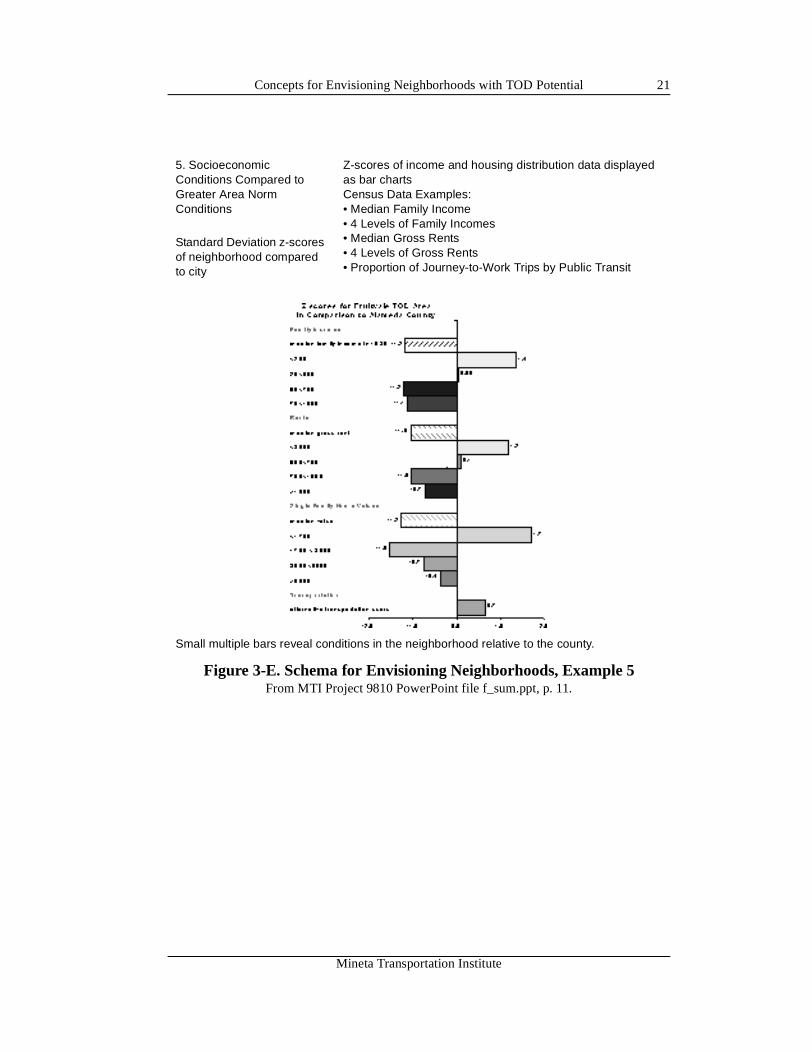
5. Socioeconomic Conditions Compared to Greater Area Norm Conditions
Standard Deviation z-scores of neighborhood compared to city
Z-scores of income and housing distribution data displayed as bar chartsCensus Data Examples:• Median Family Income• 4 Levels of Family Incomes• Median Gross Rents• 4 Levels of Gross Rents• Proportion of Journey-to-Work Trips by Public Transit
Small multiple bars reveal conditions in the neighborhood relative to the county.
Figure 3-E. Schema for Envisioning Neighborhoods, Example 5From MTI Project 9810 PowerPoint file f_sum.ppt, p. 11.
Mineta Transportation Institute
Concepts for Envisioning Neighborhoods with TOD Potential22
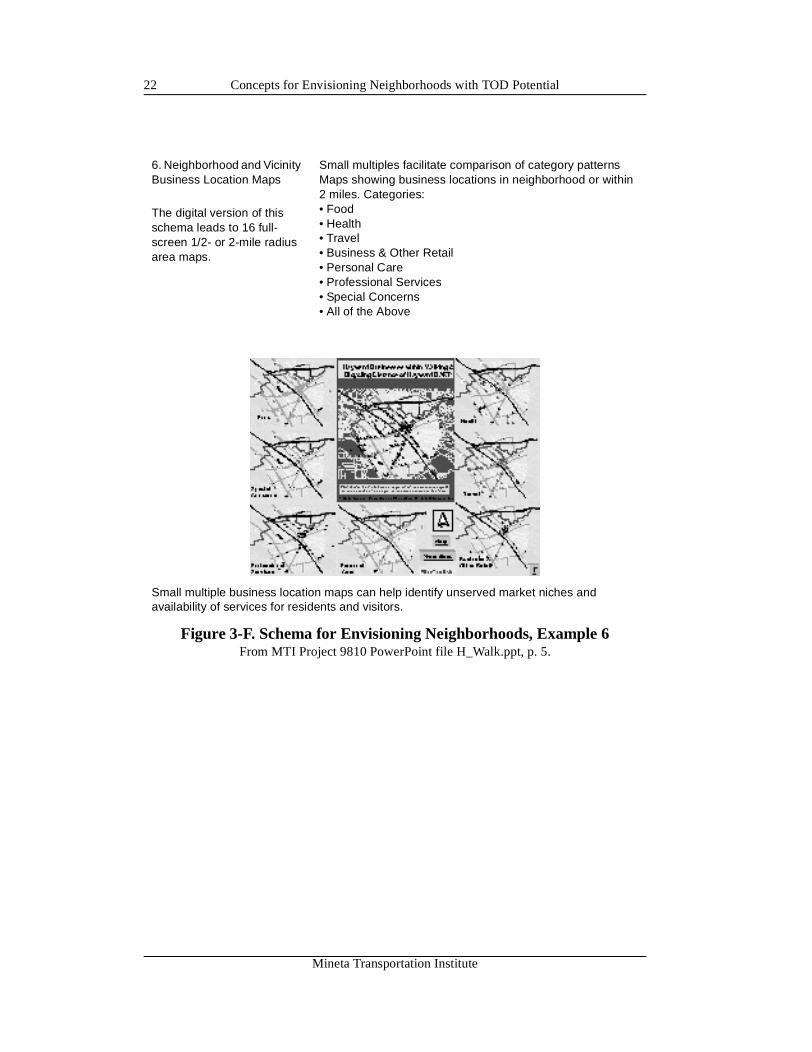
6. Neighborhood and Vicinity Business Location Maps
The digital version of this schema leads to 16 full-screen 1/2- or 2-mile radius area maps.
Small multiples facilitate comparison of category patternsMaps showing business locations in neighborhood or within 2 miles. Categories:• Food• Health• Travel• Business & Other Retail• Personal Care• Professional Services• Special Concerns• All of the Above
Small multiple business location maps can help identify unserved market niches and availability of services for residents and visitors.
Figure 3-F. Schema for Envisioning Neighborhoods, Example 6From MTI Project 9810 PowerPoint file H_Walk.ppt, p. 5.
Mineta Transportation Institute
Concepts for Envisioning Neighborhoods with TOD Potential 23
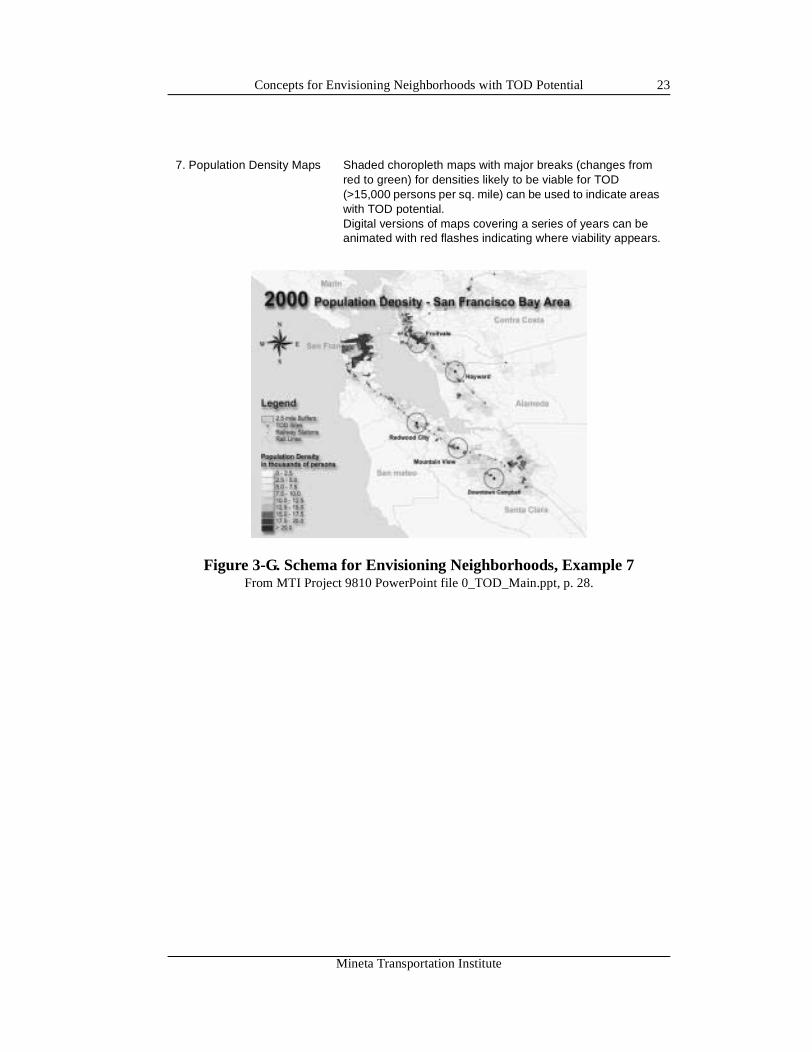
7. Population Density Maps Shaded choropleth maps with major breaks (changes from red to green) for densities likely to be viable for TOD (>15,000 persons per sq. mile) can be used to indicate areas with TOD potential.Digital versions of maps covering a series of years can be animated with red flashes indicating where viability appears.
Figure 3-G. Schema for Envisioning Neighborhoods, Example 7From MTI Project 9810 PowerPoint file 0_TOD_Main.ppt, p. 28.
Mineta Transportation Institute
Concepts for Envisioning Neighborhoods with TOD Potential24
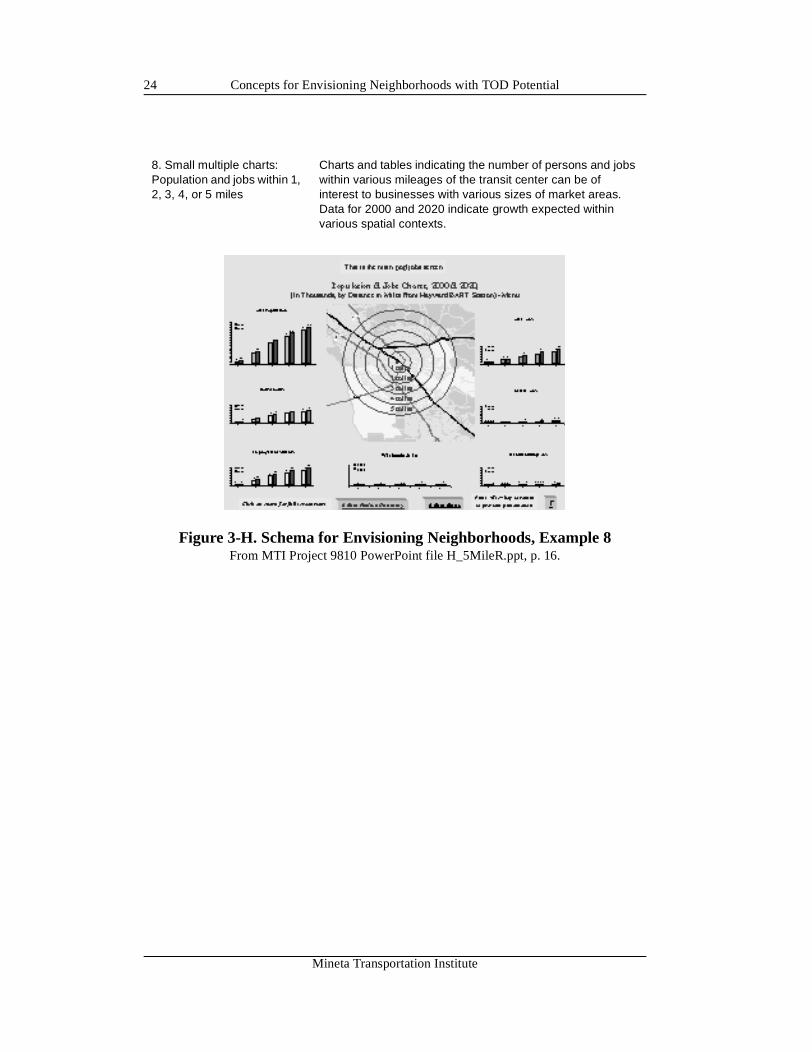
8. Small multiple charts: Population and jobs within 1, 2, 3, 4, or 5 miles
Charts and tables indicating the number of persons and jobs within various mileages of the transit center can be of interest to businesses with various sizes of market areas. Data for 2000 and 2020 indicate growth expected within various spatial contexts.
Figure 3-H. Schema for Envisioning Neighborhoods, Example 8From MTI Project 9810 PowerPoint file H_5MileR.ppt, p. 16.
Mineta Transportation Institute
Concepts for Envisioning Neighborhoods with TOD Potential 25
Scales for Envisioning Places (Project Overview 11)
“Reveal the data at several levels of detail, from a broad overview to thefine structure.” (Tufte, 1983, p.13.)
To understand neighborhood data for a census tract-sized neighborhood of4,000 persons, compare the distributions within the component block groups tothe distributions for the same measure for the census tract, city, county, andstate.
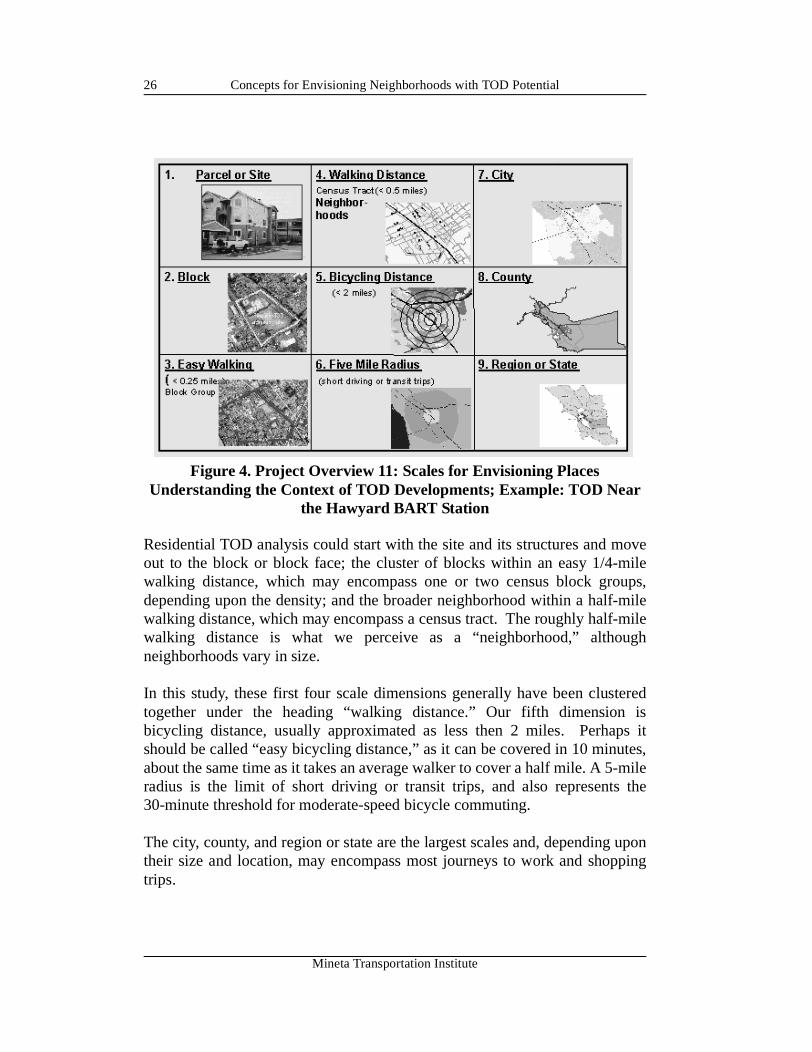
A comprehensive set of scales for analyzing and understanding a TOD and itscontextual setting must start with the TOD project site and move out throughsuccessively larger scales that encompass broader activity patterns (seeFigure 4).
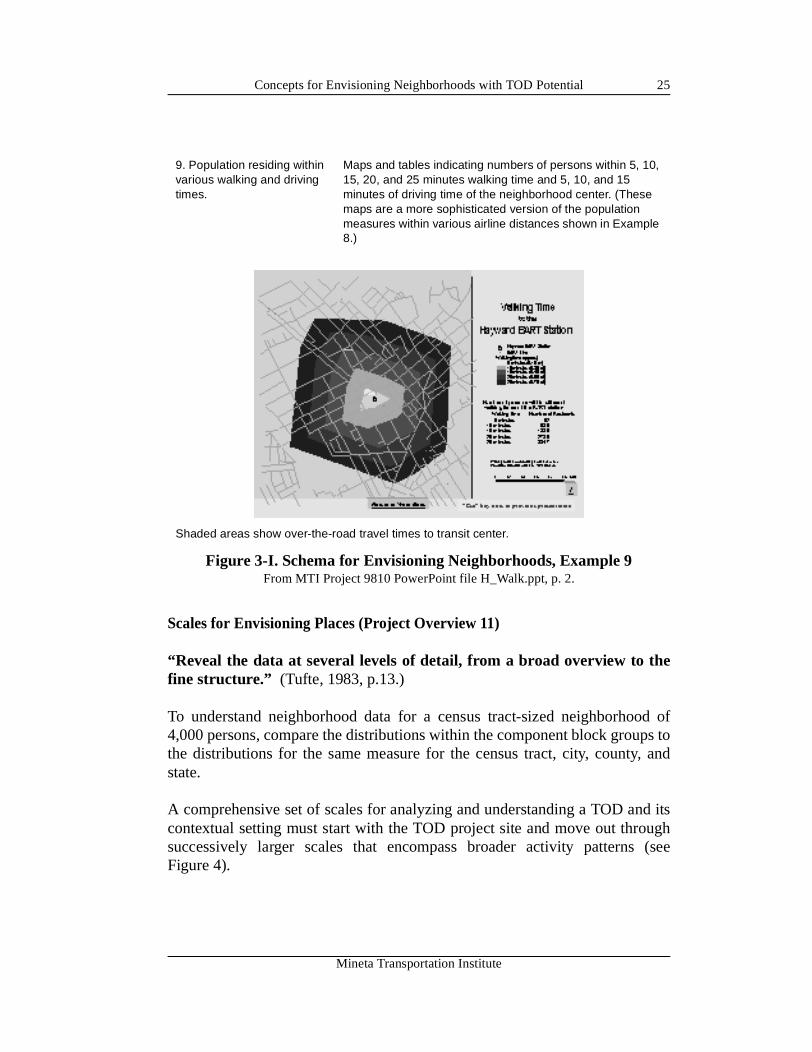
9. Population residing within various walking and driving times.
Maps and tables indicating numbers of persons within 5, 10, 15, 20, and 25 minutes walking time and 5, 10, and 15 minutes of driving time of the neighborhood center. (These maps are a more sophisticated version of the population measures within various airline distances shown in Example 8.)
Shaded areas show over-the-road travel times to transit center.
Figure 3-I. Schema for Envisioning Neighborhoods, Example 9From MTI Project 9810 PowerPoint file H_Walk.ppt, p. 2.
Mineta Transportation Institute
Concepts for Envisioning Neighborhoods with TOD Potential26
Residential TOD analysis could start with the site and its structures and moveout to the block or block face; the cluster of blocks within an easy 1/4-milewalking distance, which may encompass one or two census block groups,depending upon the density; and the broader neighborhood within a half-milewalking distance, which may encompass a census tract. The roughly half-milewalking distance is what we perceive as a “neighborhood,” althoughneighborhoods vary in size.
In this study, these first four scale dimensions generally have been clusteredtogether under the heading “walking distance.” Our fifth dimension isbicycling distance, usually approximated as less then 2 miles. Perhaps itshould be called “easy bicycling distance,” as it can be covered in 10 minutes,about the same time as it takes an average walker to cover a half mile. A 5-mileradius is the limit of short driving or transit trips, and also represents the30-minute threshold for moderate-speed bicycle commuting.
The city, county, and region or state are the largest scales and, depending upontheir size and location, may encompass most journeys to work and shoppingtrips.
Figure 4. Project Overview 11: Scales for Envisioning Places Understanding the Context of TOD Developments; Example: TOD Near
the Hawyard BART Station
Mineta Transportation Institute
Concepts for Envisioning Neighborhoods with TOD Potential 27
CD-ROM file H_Scales demonstrates scales involved for envisioning placesand understanding the context of TOD development.
Project Overviews 12 Through 15
For Project Overviews 12, 13, 14, and 15, see file 0_TOD_Main.ppt slides 22to 27.
Population and Job Densities (Project Overviews 16 & 17)
(Project Overview 17 is a menu for accessing population and job densityanimations. It is not reproduced in the printed version.)
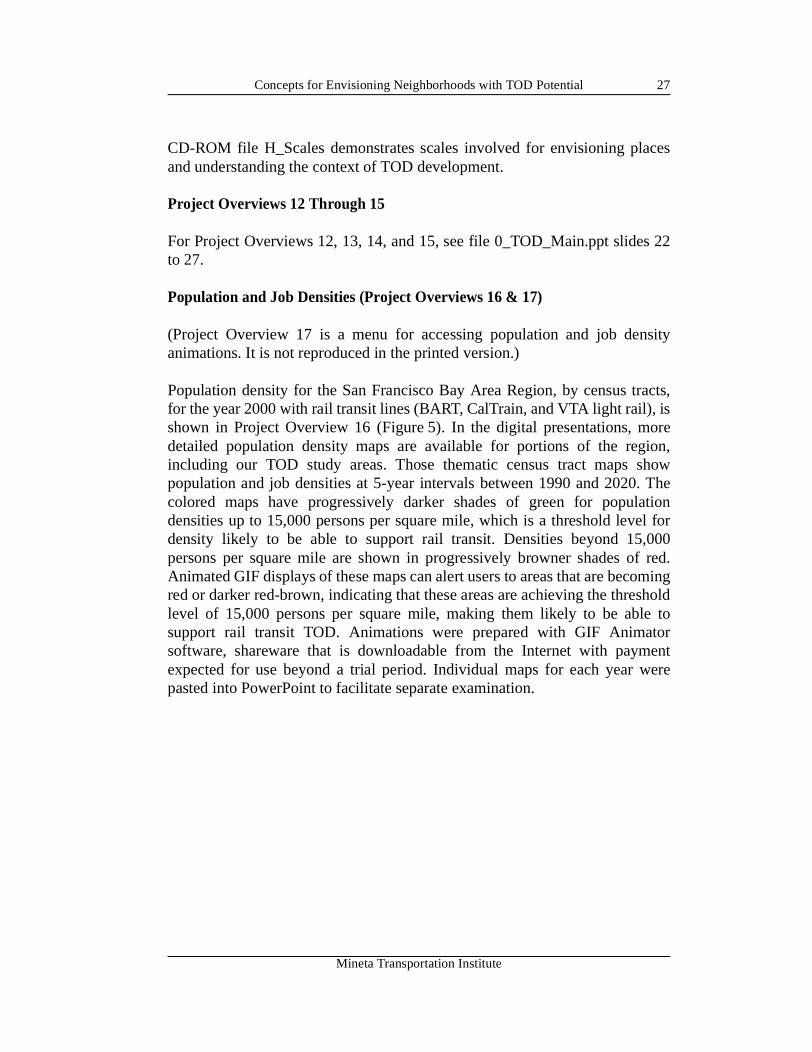
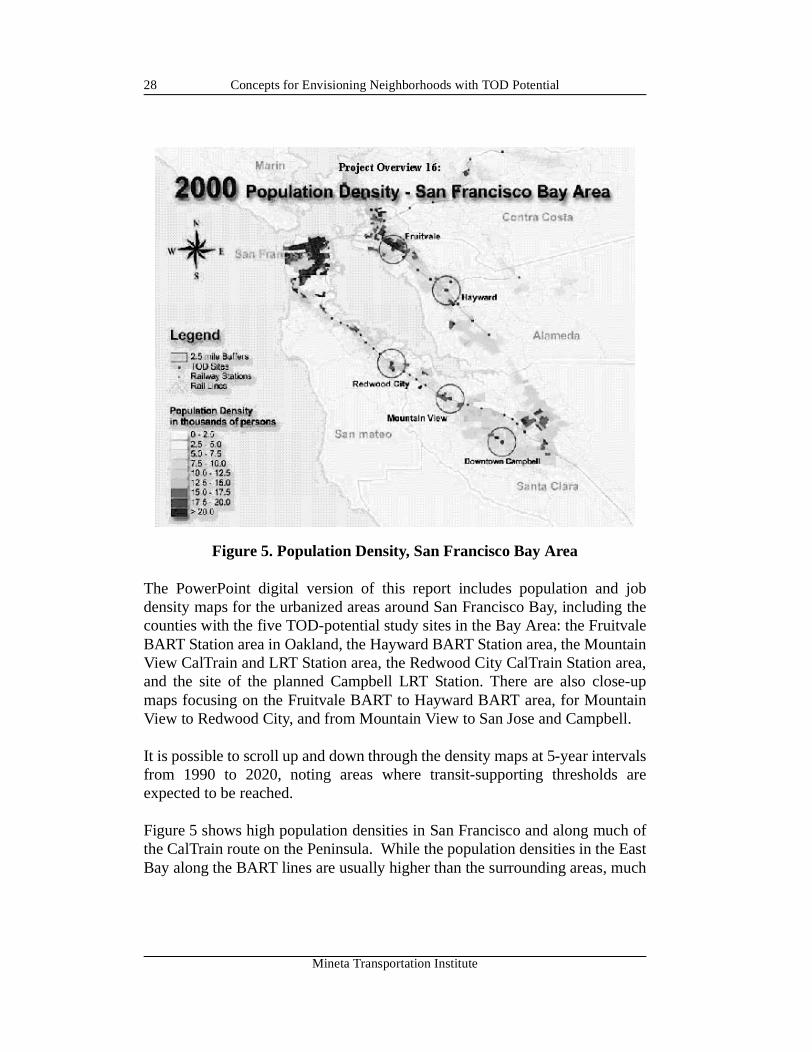
Population density for the San Francisco Bay Area Region, by census tracts,for the year 2000 with rail transit lines (BART, CalTrain, and VTA light rail), isshown in Project Overview 16 (Figure 5). In the digital presentations, moredetailed population density maps are available for portions of the region,including our TOD study areas. Those thematic census tract maps showpopulation and job densities at 5-year intervals between 1990 and 2020. Thecolored maps have progressively darker shades of green for populationdensities up to 15,000 persons per square mile, which is a threshold level fordensity likely to be able to support rail transit. Densities beyond 15,000persons per square mile are shown in progressively browner shades of red.Animated GIF displays of these maps can alert users to areas that are becomingred or darker red-brown, indicating that these areas are achieving the thresholdlevel of 15,000 persons per square mile, making them likely to be able tosupport rail transit TOD. Animations were prepared with GIF Animatorsoftware, shareware that is downloadable from the Internet with paymentexpected for use beyond a trial period. Individual maps for each year werepasted into PowerPoint to facilitate separate examination.
Mineta Transportation Institute
Concepts for Envisioning Neighborhoods with TOD Potential28
Figure 5. Population Density, San Francisco Bay Area
The PowerPoint digital version of this report includes population and jobdensity maps for the urbanized areas around San Francisco Bay, including thecounties with the five TOD-potential study sites in the Bay Area: the FruitvaleBART Station area in Oakland, the Hayward BART Station area, the MountainView CalTrain and LRT Station area, the Redwood City CalTrain Station area,and the site of the planned Campbell LRT Station. There are also close-upmaps focusing on the Fruitvale BART to Hayward BART area, for MountainView to Redwood City, and from Mountain View to San Jose and Campbell.
It is possible to scroll up and down through the density maps at 5-year intervalsfrom 1990 to 2020, noting areas where transit-supporting thresholds areexpected to be reached.
Figure 5 shows high population densities in San Francisco and along much ofthe CalTrain route on the Peninsula. While the population densities in the EastBay along the BART lines are usually higher than the surrounding areas, much
Mineta Transportation Institute
Concepts for Envisioning Neighborhoods with TOD Potential 29
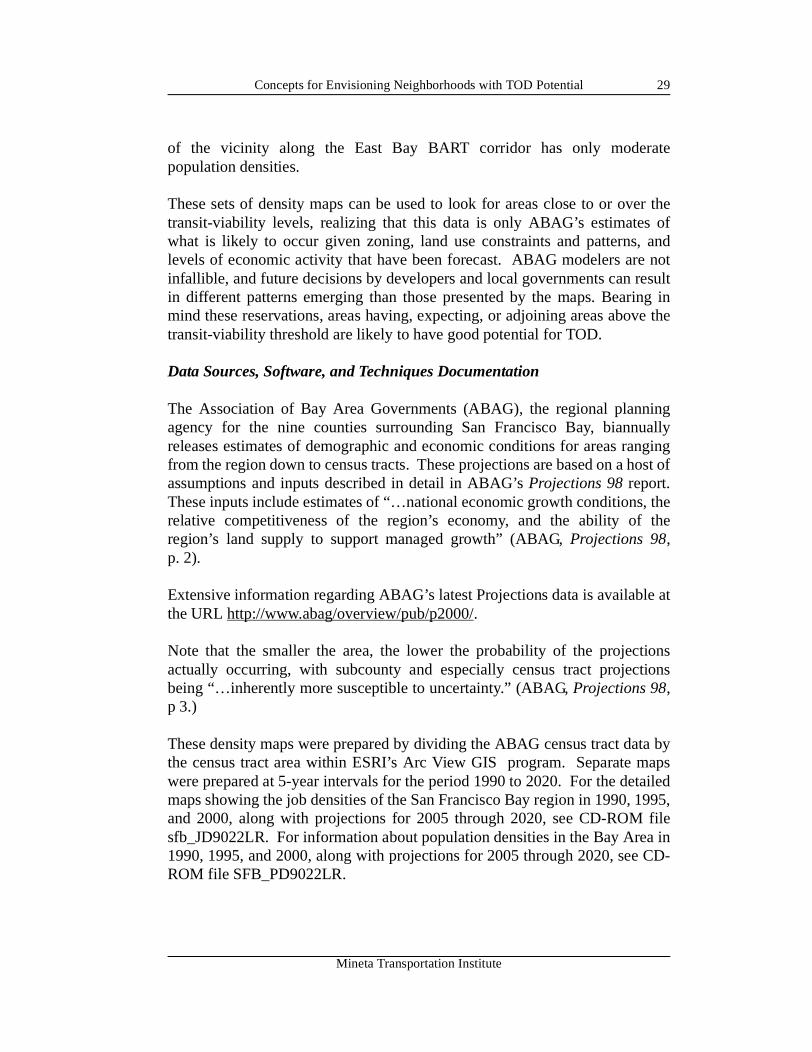
of the vicinity along the East Bay BART corridor has only moderatepopulation densities.
These sets of density maps can be used to look for areas close to or over thetransit-viability levels, realizing that this data is only ABAG’s estimates ofwhat is likely to occur given zoning, land use constraints and patterns, andlevels of economic activity that have been forecast. ABAG modelers are notinfallible, and future decisions by developers and local governments can resultin different patterns emerging than those presented by the maps. Bearing inmind these reservations, areas having, expecting, or adjoining areas above thetransit-viability threshold are likely to have good potential for TOD.
Data Sources, Software, and Techniques Documentation
The Association of Bay Area Governments (ABAG), the regional planningagency for the nine counties surrounding San Francisco Bay, biannuallyreleases estimates of demographic and economic conditions for areas rangingfrom the region down to census tracts. These projections are based on a host ofassumptions and inputs described in detail in ABAG’s Projections 98 report.These inputs include estimates of “…national economic growth conditions, therelative competitiveness of the region’s economy, and the ability of theregion’s land supply to support managed growth” (ABAG, Projections 98,p. 2).
Extensive information regarding ABAG’s latest Projections data is available atthe URL http://www.abag/overview/pub/p2000/.
Note that the smaller the area, the lower the probability of the projectionsactually occurring, with subcounty and especially census tract projectionsbeing “…inherently more susceptible to uncertainty.” (ABAG, Projections 98,p 3.)
These density maps were prepared by dividing the ABAG census tract data bythe census tract area within ESRI’s Arc View GIS program. Separate mapswere prepared at 5-year intervals for the period 1990 to 2020. For the detailedmaps showing the job densities of the San Francisco Bay region in 1990, 1995,and 2000, along with projections for 2005 through 2020, see CD-ROM filesfb_JD9022LR. For information about population densities in the Bay Area in1990, 1995, and 2000, along with projections for 2005 through 2020, see CD-ROM file SFB_PD9022LR.
Mineta Transportation Institute
Concepts for Envisioning Neighborhoods with TOD Potential30
Population and Jobs Within a Half Mile of East Bay BART Stations (ProjectOverview 18)
Characteristics
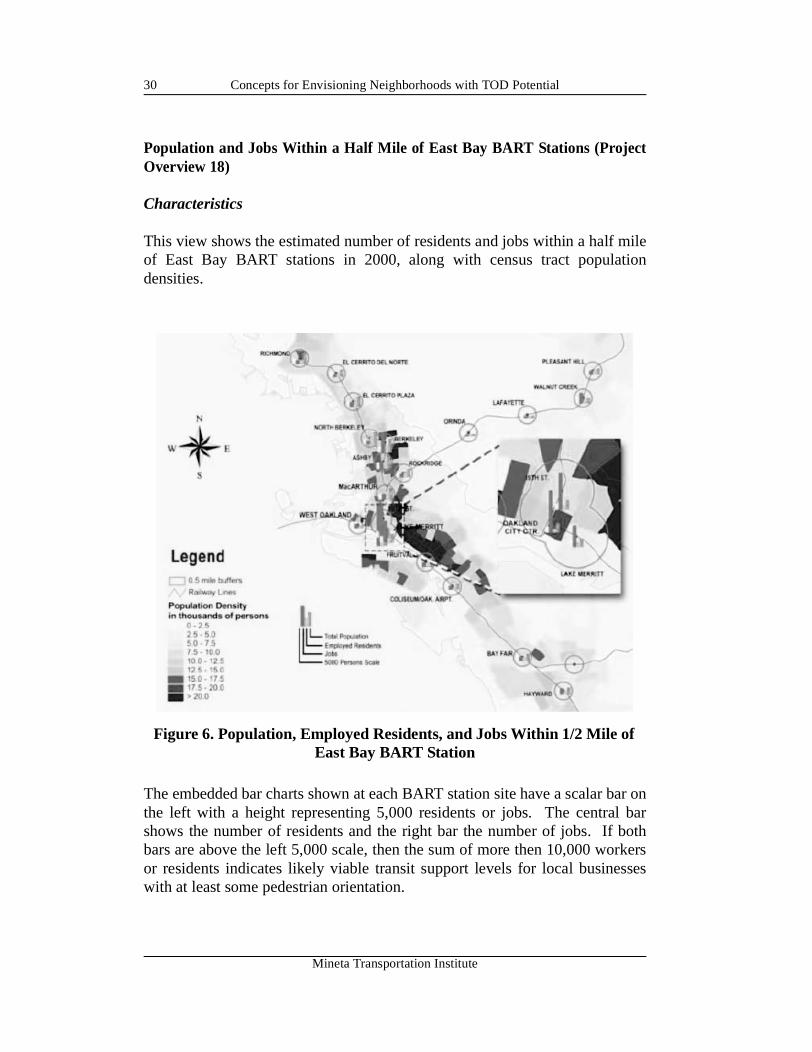
This view shows the estimated number of residents and jobs within a half mileof East Bay BART stations in 2000, along with census tract populationdensities.
The embedded bar charts shown at each BART station site have a scalar bar onthe left with a height representing 5,000 residents or jobs. The central barshows the number of residents and the right bar the number of jobs. If bothbars are above the left 5,000 scale, then the sum of more then 10,000 workersor residents indicates likely viable transit support levels for local businesseswith at least some pedestrian orientation.
Figure 6. Population, Employed Residents, and Jobs Within 1/2 Mile of East Bay BART Station
Mineta Transportation Institute
Concepts for Envisioning Neighborhoods with TOD Potential 31
Possible Applications
The year 2020 estimates could be used to determine which areas not above thethreshold level in 2000 are expected to reach the transit-viability thresholdlevel by 2020. Then attention can be given to the years in between andconsideration given to site-specific developments that would help supply thetransit-viable threshold levels and beyond.
One-mile buffers could be used to estimate population and workers within theextended walking and easy bicycling distance range, and quarter-mile bufferscould be used to estimate jobs and population within easy walking distance.
Two-mile radii could be used to estimate data for the moderate bicyclingdistance area. In Tokyo thousands of bicycles are taken daily to many in-townrail stations, a pattern that could be repeated in California, which has a milderclimate, better suited for bicycling.
Data Sources, Software, and Techniques Documentation
Using an Arc View Avenue program script written by Professor Richard Taketafor this project, the proportions of census tract areas inside and outside thehalf-mile buffers constructed around East Bay BART stations were calculatedand used to estimate the proportion of the area of each census tract that waswithin the walking-distance buffer.
ABAG Projections 98 census tract data were used. Assuming that populationand jobs were uniformly distributed across the census tracts, estimates of thenumbers of residents and jobs in all tract areas within each buffer werecalculated and summed, yielding estimates of the number of jobs and residentswithin a half-mile walking distance of each East Bay BART station in 2000.
A circular area a half mile in radius has an area of about three-fourths of asquare mile. As 15,000 residents per square mile is a rough threshold forsupport of good transit service, the levels of residents alone within the bufferareas to support good transit would be 11,250. Assuming that jobs in an areahad at least a similar effect on transit viability as residents, a combination ofmore than 10,000 residents and jobs within the transit half-mile buffer wouldindicate transit viability. The initial version of this map was constructed inthree hours using the ABAG Projections 98 data, the Arc View GIS mappingprogram, and the program script by Professor Taketa. The final presentationmap was refined with PageMaker software. One difficult task was to enlarge
Mineta Transportation Institute
Concepts for Envisioning Neighborhoods with TOD Potential32
the downtown Oakland area while keeping the chart bars at the same scale asin the main body of the map.
What Project Overview 18 Shows
Most of the BART station areas from Richmond to Hayward are close to theviable-transit threshold, with the Berkeley and downtown Oakland stationareas well above the threshold level. However, outside of central Oakland andBerkeley, only the area north of the Fruitvale BART station indicates sufficientresidential density to support strong transit.
PROJECT OVERVIEW 19
Characteristics
This view presents a table outlining types of criteria, standards, or norms thatcould be applied to envisioning measurements before undertaking an action.Each criteria, standard, or norm is linked to at least one possible application asan indication of some of the ways in which the Envisioning Neighborhoodsoutputs of small multiple replicate maps, charts, images, and tables could beeffectively used to take action regarding neighborhoods or places.
Possible Applications
Taking action with regard to neighborhoods or places could entail simplydeciding that the neighborhood did or did not merit further consideration orstudy.
Direct actions could include developers deciding to seek a site in the area,governments deciding to declare the area a place with high TOD potentialwithin which special benefits and programs would be available, or prospectivetenants (both commercial and residential) deciding to relocate within the area.
The application of criteria, standards, or norms to Envisioning Neighborhoodsoutput can be undertaken in several ways, depending on circumstances. If onlya single necessary and sufficient condition were present, such as to whether ornot an area has been classified, an indication of whether that condition hasbeen satisfied should be given central prominence in the EnvisioningNeighborhoods summary view.
Mineta Transportation Institute
Concepts for Envisioning Neighborhoods with TOD Potential 33
While Envisioning Neighborhoods summary views can be customized forparticular applications, in many instances they will be fairly generic. In manycases, however, the criteria, standards, or norms for actions will vary and willbe specific to the circumstances and perspectives of the actor. For this reason,this project has emphasized preparation of the generic envisioning views;however, the specific criteria standards can be invaluable in facilitatingdevelopment when these standards are incorporated into the analysis, in manycases as overlays to the envisioning screens.
SUMMARY OVERVIEW OF STUDY AREAS
The transit centers chosen for creating prototype examples are oriented aroundrail transit stops, with two being at BART heavy rail stops in the East Bayregion (Hayward, and the Fruitvale stop in Oakland); two at CalTrain heavyrail stops in the Peninsula region between San Francisco and San Jose(Redwood City and Mountain View); and three at light rail transit (LRT) stops(the Mountain View stop and the future downtown Campbell stop in SantaClara County, and the 65th Street stop in Sacramento County).
Four of the transit centers include the downtowns of small to medium-largecities. All were farm market centers during their formative years. TheRedwood City and Mountain View centers were on the commuter steam railline built between San Francisco and San Jose in the 1860s. Redwood City andHayward are the county seats of large urban counties, with from half a millionto more than a million residents. See Appendix B, “History of Transit-OrientedDevelopment, for additional details.
Mineta Transportation Institute

Concepts for Envisioning Neighborhoods with TOD Potential34
Mineta Transportation Institute
Envisioning the Forthcoming Downtown Campbell LRT Station TOD Potential 35
ENVISIONING THE FORTHCOMING DOWNTOWN CAMPBELL LRT STATION TOD POTENTIAL
Campbell is a city of approximately 38,000 people seven miles southwest ofdowntown San Jose, in Santa Clara County, California. This study, preparedby Scott Plambaeck, concentrates on the future downtown Campbell light railstation (see CD-ROM file C_Sum for a complete PowerPoint presentation).The extension of the VTA light rail line from downtown San Jose to downtownCampbell, known as the Vasona Line, is expected to be completed in 2004.
The three block groups in downtown Campbell are studied and compared toSanta Clara County and the state of California. The future downtown Campbellstation will be located in an area with low population density, as downtownCampbell is mainly a commercial center of small shops and restaurants. Theethnic balance of the downtown Campbell block groups is mainly white,contrasting greatly with Santa Clara County and the state of California as awhole.
This study lists seven types of businesses within walking and bicyclingdistance of downtown Campbell. Block group information also is provided,showing the number of Hispanics in the downtown area and the populationdensity of the downtown Campbell vicinity. Features mapped include floodplains and downtown area restaurants.
This overview only suggests the procedures that could be used for envisioning.A full envisioning would require more data, with the 2000 census undoubtedlyoffering a wealth of additional information. The Campbell maps included inthis publication were created using 1990 data from the U.S. Census Bureau.
Campbell’s downtown core is enjoying a revival as coffee shops, restaurants,and small businesses thrive in this unique and charming downtown. Newhousing has been built within a quarter mile of the station site and more isplanned. The downtown station will be close to several well-establishedneighborhoods.
Mineta Transportation Institute
Envisioning the Forthcoming Downtown Campbell LRT Station TOD Potential36
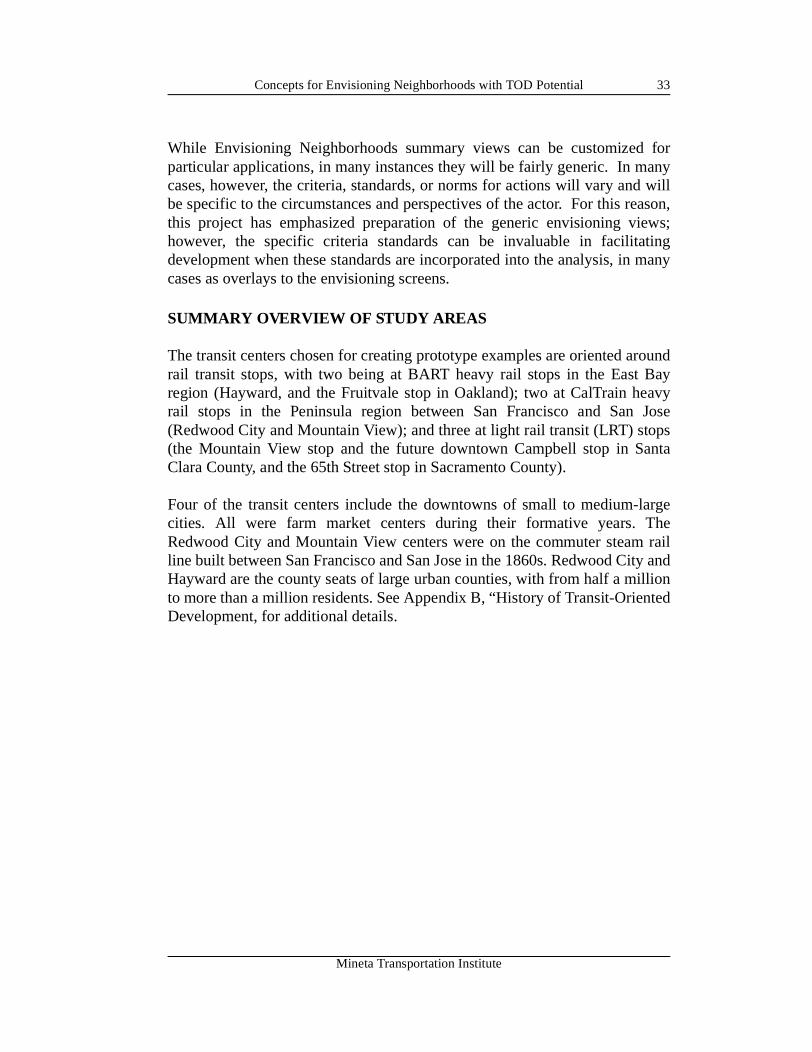
The PowerPoint presentation includes the following information:
Campbell Summary 1 (Figure 1, left side) shows downtown Campbell from alocal, city, county, and state view. The local walking view shows the futuredowntown Campbell LRT station and the half-mile vicinity around the station.This station is the focus of the Campbell study, and the map identifies all thelocal streets within a half-mile of downtown Campbell as well as thedowntown block groups. The city view shows the entire city of Campbell andthe planned LRT stations of the Vasona LRT line. The line, expected to befinished by December 2004, will connect Campbell to the Guadalupe LRT linein downtown San Jose and thousands of jobs in north San Jose, Milpitas, SantaClara, Sunnyvale, and Mountain View. All the streets of Campbell are shownin the city view, but only the major streets are identified.
The county view shows the city of Campbell as it relates to the entire countyand shows the county’s highways. Campbell, primarily a bedroom community,
Figure 1. Campbell Summaries 1 and 2
Figure 2. Campbell Summaries 3 and 4
Mineta Transportation Institute
Envisioning the Forthcoming Downtown Campbell LRT Station TOD Potential 37
is a mature suburb, located 7 miles southwest of downtown San Jose. The stateview shows the nine Bay Area counties within the state of California. SantaClara County is shown in green in the digital color version of CampbellSummary 1.
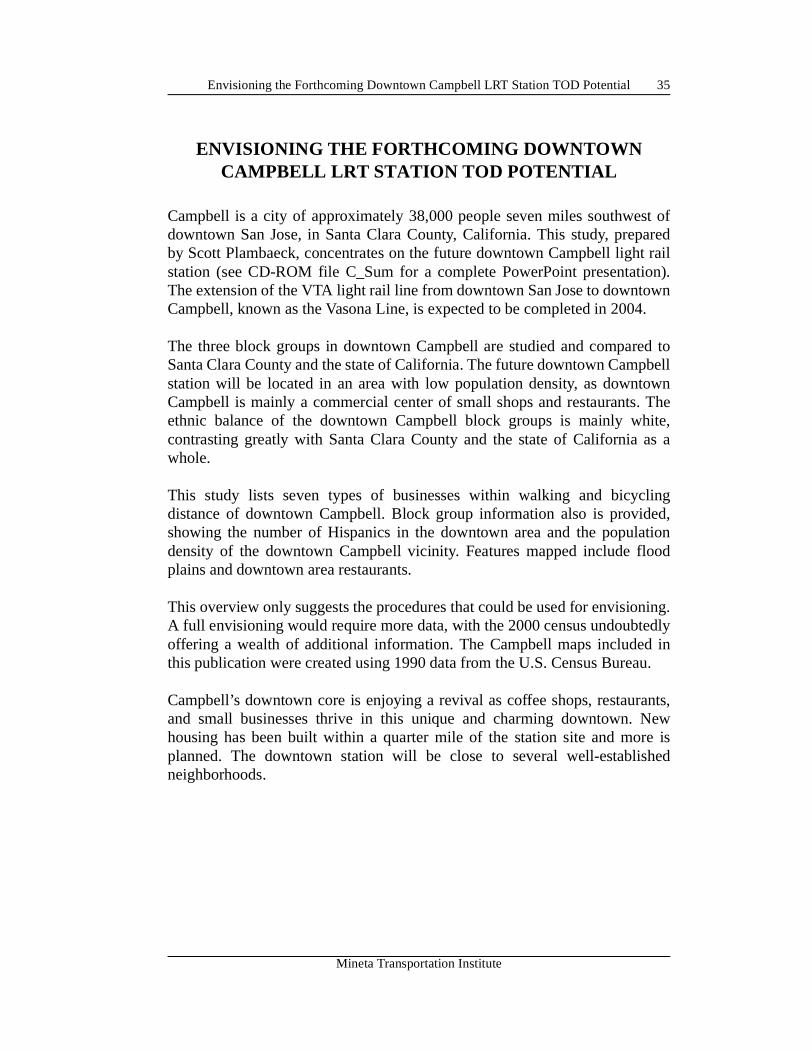
Campbell Summaries 2, 3, and 4 (Figure 1, right side and Figure 2) show age,race and ethnic background. They compare ethnic breakdowns in the state ofCalifornia, Santa Clara County, and the city of Campbell, and compare them tothe three downtown Campbell block groups. They also detail the census blockgroups via a digital ortho photo (DOP) of Campbell obtained from the Website www.badger.parl.com. Major streets and the location of the future LRTstation and VTA Vasona LRT line are included.
Campbell has a larger percentage of whites than Santa Clara County or thestate. Block Group 3 in Census Tract 5056.02 is almost 100 percent white, aninfrequent situation the Bay Area. Agewise, the three downtown block groupshave a lower population than the city, county, or state of those under 19, but alarger percentage of those in the 19-29 range. Block Group 2 in Census Tract5065.02 has a large population of those aged 30 to 49. Block Group 3 has themost extreme numbers, with a high percentage of those 65 and over andvirtually no population under age 19.
Looking at age is important for TOD for several reasons. Seniors tend to ridetransit more than other age groups, and it is important to determine the needs ofthe prime working-age population, ages 18 to 64.
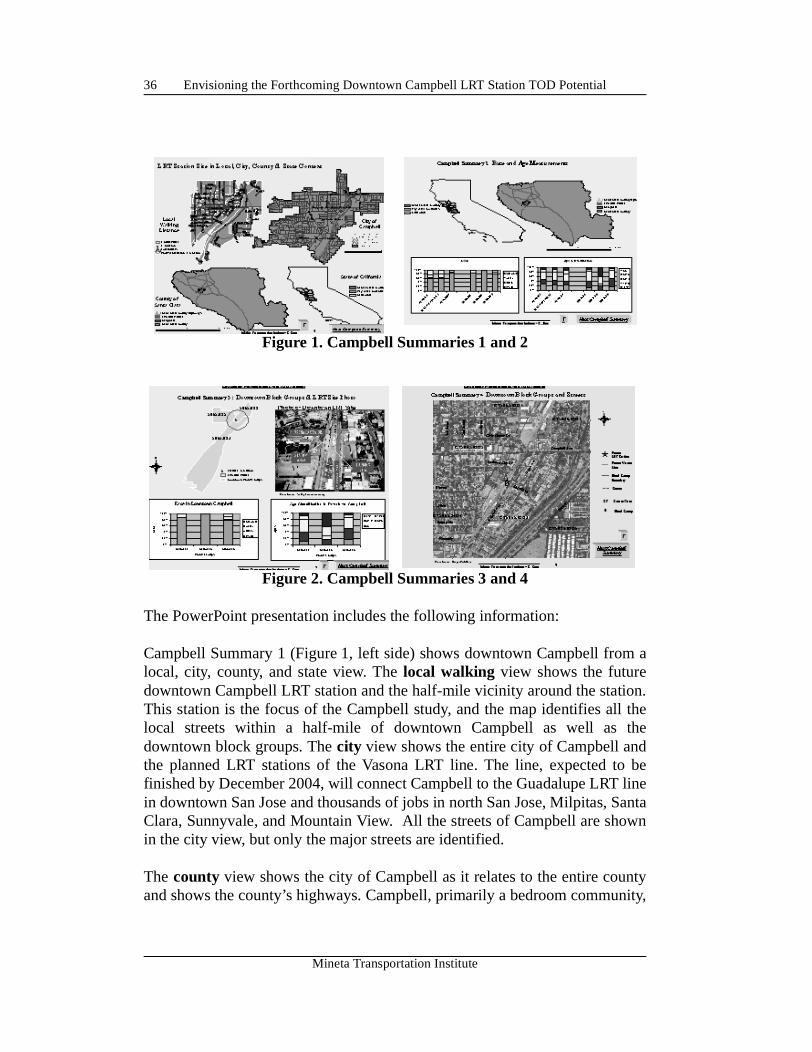
Campbell Summary 5, Downtown Campbell’s Future LRT Station Area, showsCampbell within Santa Clara County and the highways within the county(Figure 3, left side). The map on the top right shows the restaurants within a
Figure 3. Campbell Summaries 5 and 6
Mineta Transportation Institute
Envisioning the Forthcoming Downtown Campbell LRT Station TOD Potential38
half mile of the future LRT station. The restaurants are represented by bluedots. The bottom map presents the density per square kilometer measured atthe block level. Blocks with the highest densities tend to be further from thestation but within walking distance. Sufficient density is essential in supportingTOD.
The lower right map shows the blocks and the local streets of downtownCampbell and the location of the future downtown Campbell station. The half-mile buffer indicates neighborhoods within walking distance of the station.
Campbell Summary 6, Campbell’s Restaurants, goes into more detailregarding restaurants in Campbell (Figure 3, right side). Using the data fromPowerfinder Phone Disc 98, Info USA.com, Inc., two maps were createdshowing restaurants in the entire city of Campbell and restaurants within one-half mile of the future downtown LRT station. These maps show that most ofthe restaurants in Campbell are clustered near downtown. The city-level mapshows that many of the restaurants in Campbell will be served by the VasonaLRT line.
The second, more detailed, map provides the names of the downtownrestaurants. Restaurants are a popular destination for people, and locatingstations near restaurants and other entertainment facilities is important inattracting people to ride transit.
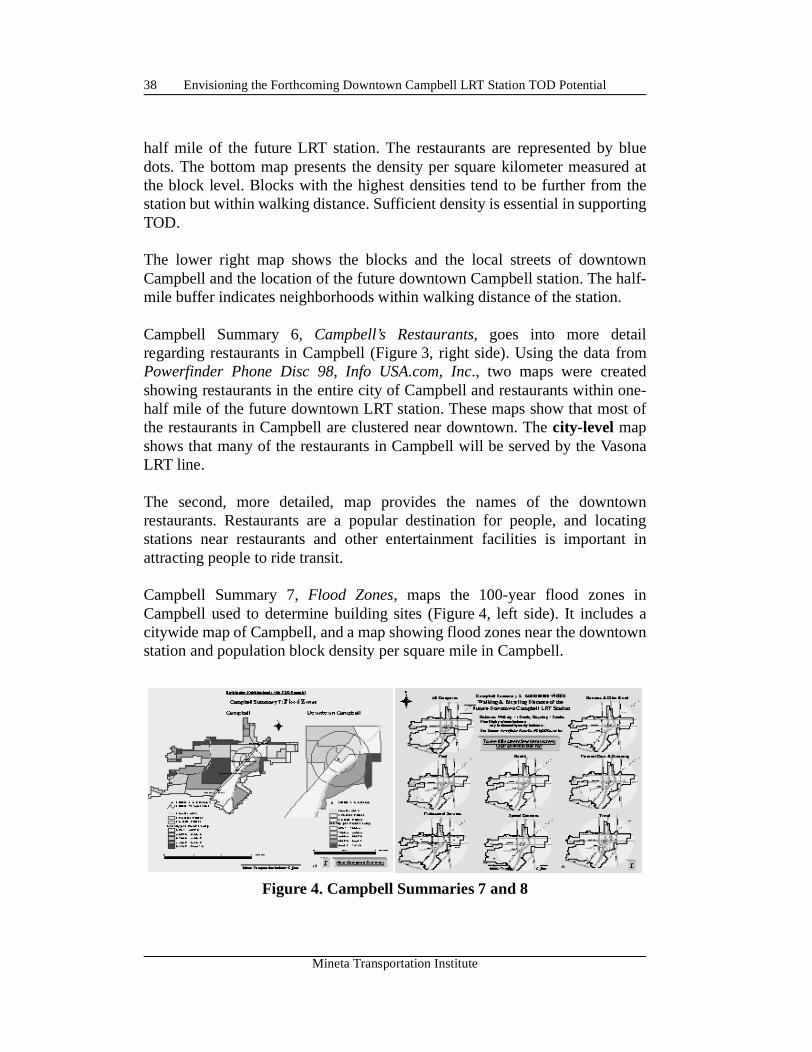
Campbell Summary 7, Flood Zones, maps the 100-year flood zones inCampbell used to determine building sites (Figure 4, left side). It includes acitywide map of Campbell, and a map showing flood zones near the downtownstation and population block density per square mile in Campbell.
Figure 4. Campbell Summaries 7 and 8
Mineta Transportation Institute
Envisioning the Forthcoming Downtown Campbell LRT Station TOD Potential 39
Campbell Summary 8, Businesses Within Walking and Biking Distance, is aseries of eight interactive maps broken into seven broad categories (Figure 4,right side). The digital version of Campbell Summary 8 provides access to 16full-screen maps at one-half or two-mile levels. The one-half-mile maps showthe walking distance from the future downtown Campbell station.
Including the location and types of businesses is essential in studying sitessuitable for TOD. In addition to building mass transit near housing, masstransit needs to go places that people want and need to go to. The PruneyardShopping Center, a major shopping center in Campbell, is shown on the map.Although the Pruneyard is outside the half-mile circle, it is less that 1 milefrom the downtown station site and is a major retail and employment center inCampbell.
Two miles is considered the biking distance from the future downtown station.Since Campbell is geographically small, portions of San Jose are included inthe bicycling distance map. Much of the Vasona Line, which will connectCampbell to downtown San Jose, is shown.
The seven business categories shown in Campbell Summary 8 comprise thefollowing types of businesses:
• Business and other retail, including book, copy, gift, and photo finishingshops, along with variety and video stores.
• Food, including bakeries, candy and nut shops, coffee and tea shops,grocers, restaurants, and health foods.
• Health, including dentists, drugstores, hospitals within 2 and 5 miles,nursing homes, and physicians.
• Professional services, including accountants, banks, insurance agents, andattorneys.
• Personal care and grooming, consisting of barbers, beauty salons, childcare, nursery schools, dry cleaners, laundromats, nail salons, and physicalfitness facilities.
• Special concerns—businesses that could cause problems—includes bars,gunsmiths, liquor stores, and pawnbrokers.
• Travel, including auto repair, auto rental, bike repair, service stations,motel and hotels, and travel agents.
Mineta Transportation Institute
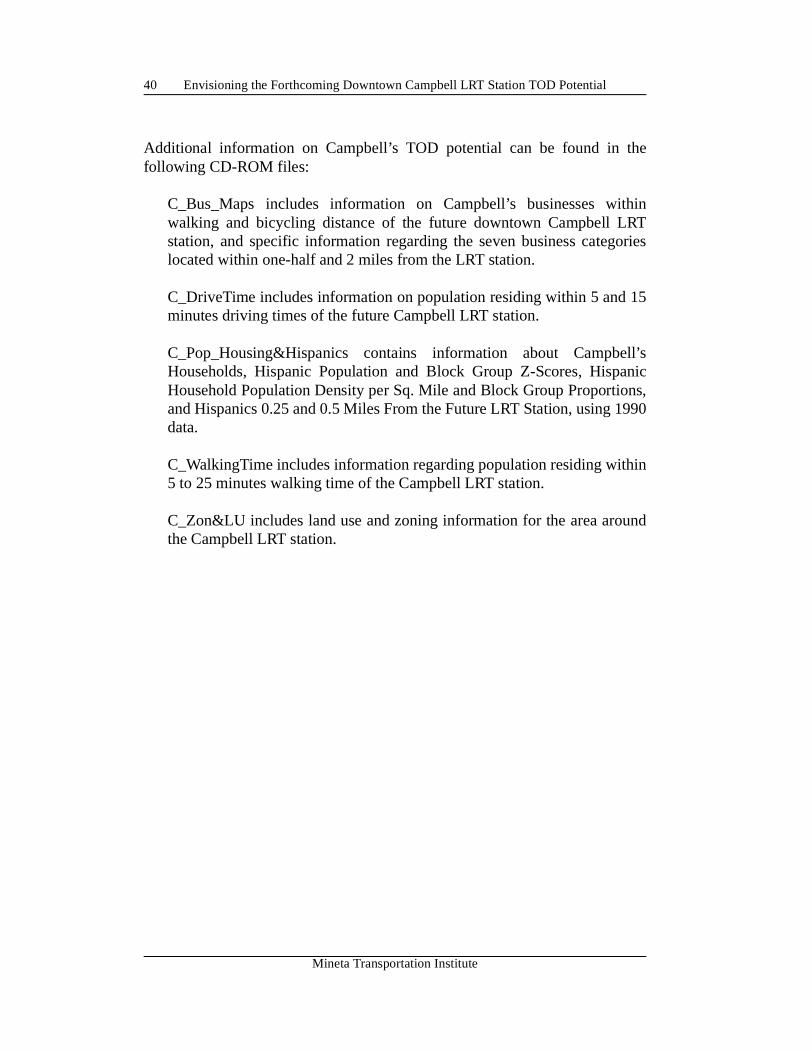
Envisioning the Forthcoming Downtown Campbell LRT Station TOD Potential40
Additional information on Campbell’s TOD potential can be found in thefollowing CD-ROM files:
C_Bus_Maps includes information on Campbell’s businesses withinwalking and bicycling distance of the future downtown Campbell LRTstation, and specific information regarding the seven business categorieslocated within one-half and 2 miles from the LRT station.
C_DriveTime includes information on population residing within 5 and 15minutes driving times of the future Campbell LRT station.
C_Pop_Housing&Hispanics contains information about Campbell’sHouseholds, Hispanic Population and Block Group Z-Scores, HispanicHousehold Population Density per Sq. Mile and Block Group Proportions,and Hispanics 0.25 and 0.5 Miles From the Future LRT Station, using 1990data.
C_WalkingTime includes information regarding population residing within5 to 25 minutes walking time of the Campbell LRT station.
C_Zon&LU includes land use and zoning information for the area aroundthe Campbell LRT station.
Mineta Transportation Institute
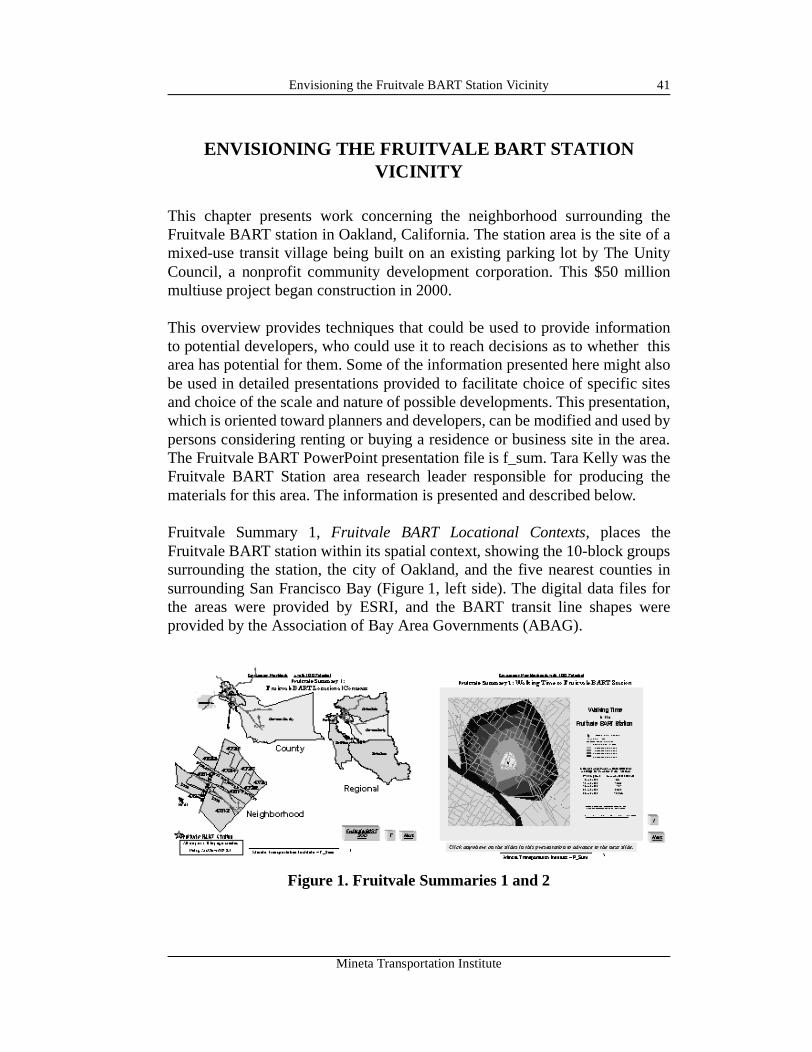
Envisioning the Fruitvale BART Station Vicinity 41
ENVISIONING THE FRUITVALE BART STATION VICINITY
This chapter presents work concerning the neighborhood surrounding theFruitvale BART station in Oakland, California. The station area is the site of amixed-use transit village being built on an existing parking lot by The UnityCouncil, a nonprofit community development corporation. This $50 millionmultiuse project began construction in 2000.
This overview provides techniques that could be used to provide informationto potential developers, who could use it to reach decisions as to whether thisarea has potential for them. Some of the information presented here might alsobe used in detailed presentations provided to facilitate choice of specific sitesand choice of the scale and nature of possible developments. This presentation,which is oriented toward planners and developers, can be modified and used bypersons considering renting or buying a residence or business site in the area.The Fruitvale BART PowerPoint presentation file is f_sum. Tara Kelly was theFruitvale BART Station area research leader responsible for producing thematerials for this area. The information is presented and described below.
Fruitvale Summary 1, Fruitvale BART Locational Contexts, places theFruitvale BART station within its spatial context, showing the 10-block groupssurrounding the station, the city of Oakland, and the five nearest counties insurrounding San Francisco Bay (Figure 1, left side). The digital data files forthe areas were provided by ESRI, and the BART transit line shapes wereprovided by the Association of Bay Area Governments (ABAG).
Figure 1. Fruitvale Summaries 1 and 2
Mineta Transportation Institute
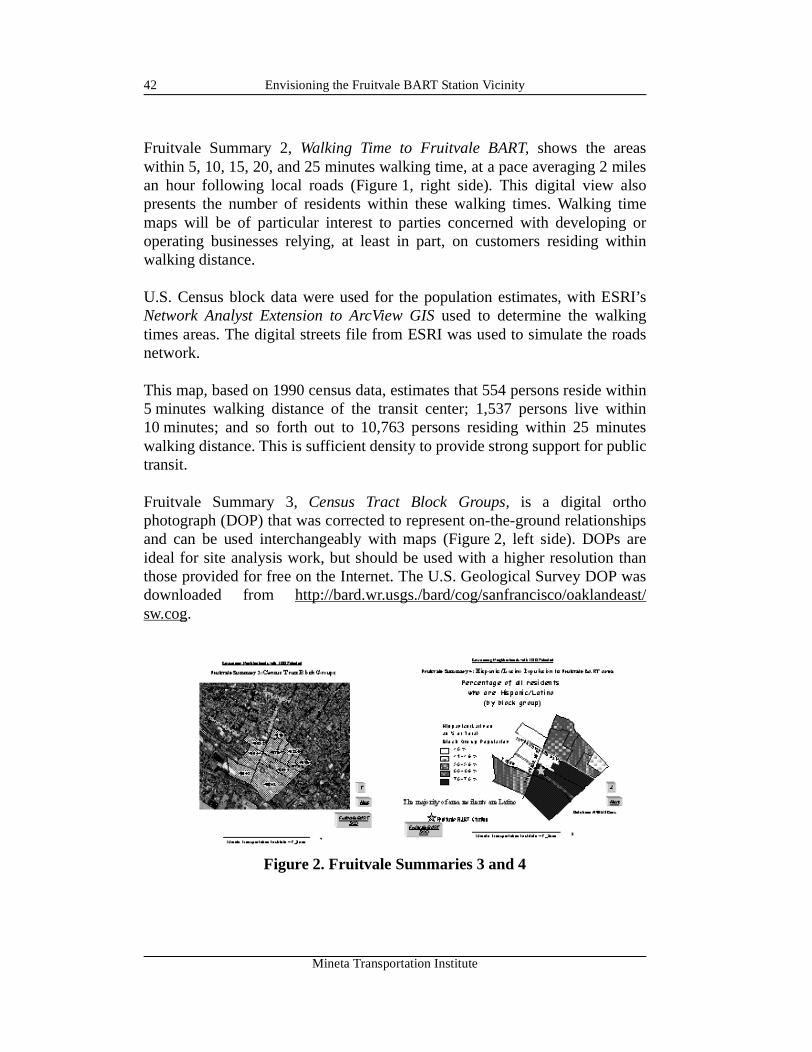
Envisioning the Fruitvale BART Station Vicinity42
Fruitvale Summary 2, Walking Time to Fruitvale BART, shows the areaswithin 5, 10, 15, 20, and 25 minutes walking time, at a pace averaging 2 milesan hour following local roads (Figure 1, right side). This digital view alsopresents the number of residents within these walking times. Walking timemaps will be of particular interest to parties concerned with developing oroperating businesses relying, at least in part, on customers residing withinwalking distance.
U.S. Census block data were used for the population estimates, with ESRI’sNetwork Analyst Extension to ArcView GIS used to determine the walkingtimes areas. The digital streets file from ESRI was used to simulate the roadsnetwork.
This map, based on 1990 census data, estimates that 554 persons reside within5 minutes walking distance of the transit center; 1,537 persons live within10 minutes; and so forth out to 10,763 persons residing within 25 minuteswalking distance. This is sufficient density to provide strong support for publictransit.
Fruitvale Summary 3, Census Tract Block Groups, is a digital orthophotograph (DOP) that was corrected to represent on-the-ground relationshipsand can be used interchangeably with maps (Figure 2, left side). DOPs areideal for site analysis work, but should be used with a higher resolution thanthose provided for free on the Internet. The U.S. Geological Survey DOP wasdownloaded from http://bard.wr.usgs./bard/cog/sanfrancisco/oaklandeast/sw.cog.
Figure 2. Fruitvale Summaries 3 and 4
Mineta Transportation Institute
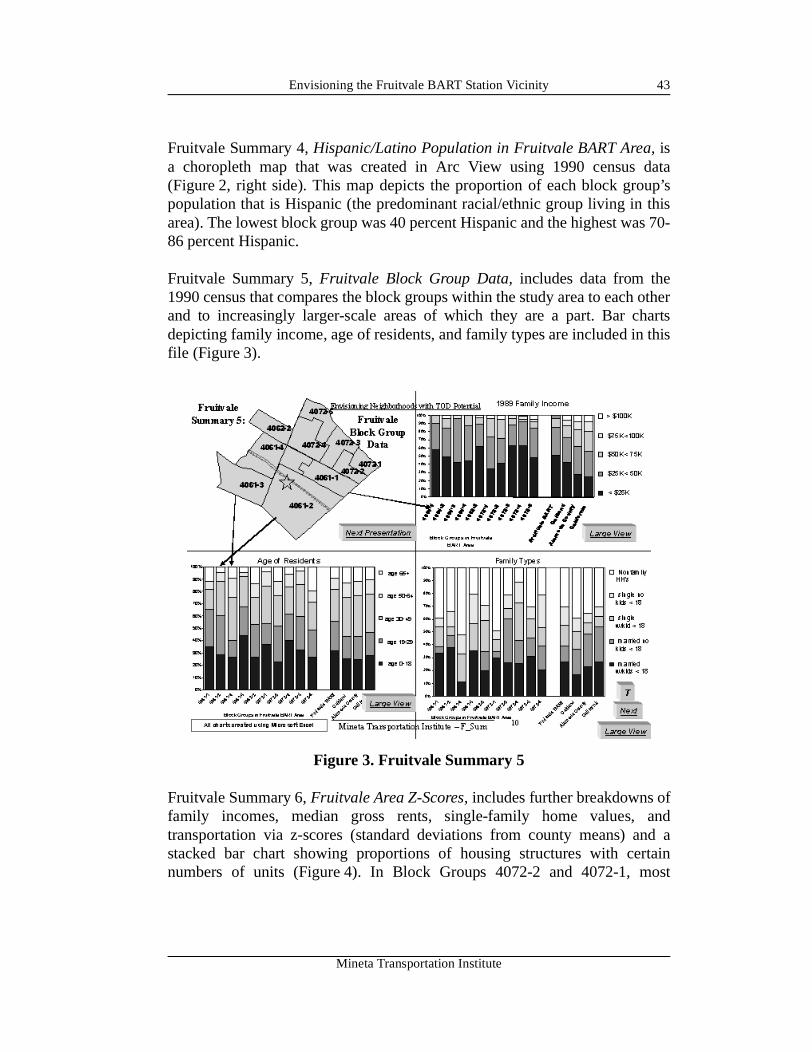
Envisioning the Fruitvale BART Station Vicinity 43
Fruitvale Summary 4, Hispanic/Latino Population in Fruitvale BART Area, isa choropleth map that was created in Arc View using 1990 census data(Figure 2, right side). This map depicts the proportion of each block group’spopulation that is Hispanic (the predominant racial/ethnic group living in thisarea). The lowest block group was 40 percent Hispanic and the highest was 70-86 percent Hispanic.
Fruitvale Summary 5, Fruitvale Block Group Data, includes data from the1990 census that compares the block groups within the study area to each otherand to increasingly larger-scale areas of which they are a part. Bar chartsdepicting family income, age of residents, and family types are included in thisfile (Figure 3).
.
Figure 3. Fruitvale Summary 5
Fruitvale Summary 6, Fruitvale Area Z-Scores, includes further breakdowns offamily incomes, median gross rents, single-family home values, andtransportation via z-scores (standard deviations from county means) and astacked bar chart showing proportions of housing structures with certainnumbers of units (Figure 4). In Block Groups 4072-2 and 4072-1, most
Mineta Transportation Institute
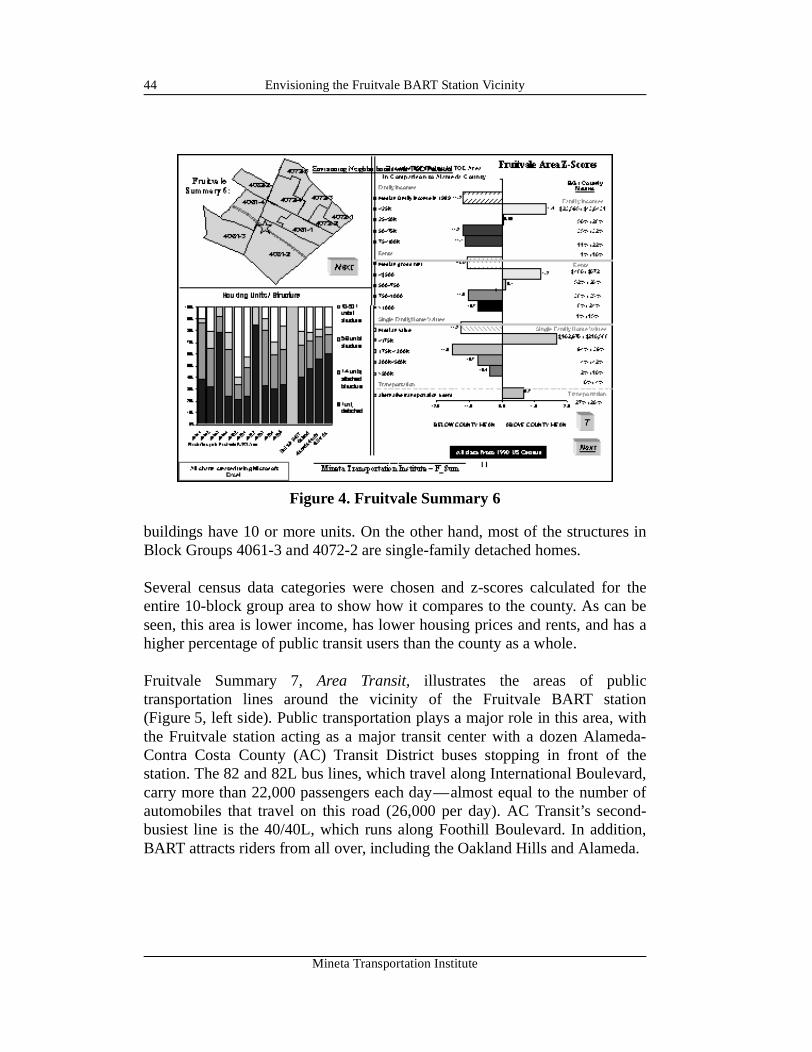
Envisioning the Fruitvale BART Station Vicinity44
buildings have 10 or more units. On the other hand, most of the structures inBlock Groups 4061-3 and 4072-2 are single-family detached homes.
Several census data categories were chosen and z-scores calculated for theentire 10-block group area to show how it compares to the county. As can beseen, this area is lower income, has lower housing prices and rents, and has ahigher percentage of public transit users than the county as a whole.
Fruitvale Summary 7, Area Transit, illustrates the areas of publictransportation lines around the vicinity of the Fruitvale BART station(Figure 5, left side). Public transportation plays a major role in this area, withthe Fruitvale station acting as a major transit center with a dozen Alameda-Contra Costa County (AC) Transit District buses stopping in front of thestation. The 82 and 82L bus lines, which travel along International Boulevard,carry more than 22,000 passengers each day—almost equal to the number ofautomobiles that travel on this road (26,000 per day). AC Transit’s second-busiest line is the 40/40L, which runs along Foothill Boulevard. In addition,BART attracts riders from all over, including the Oakland Hills and Alameda.
Figure 4. Fruitvale Summary 6
Mineta Transportation Institute
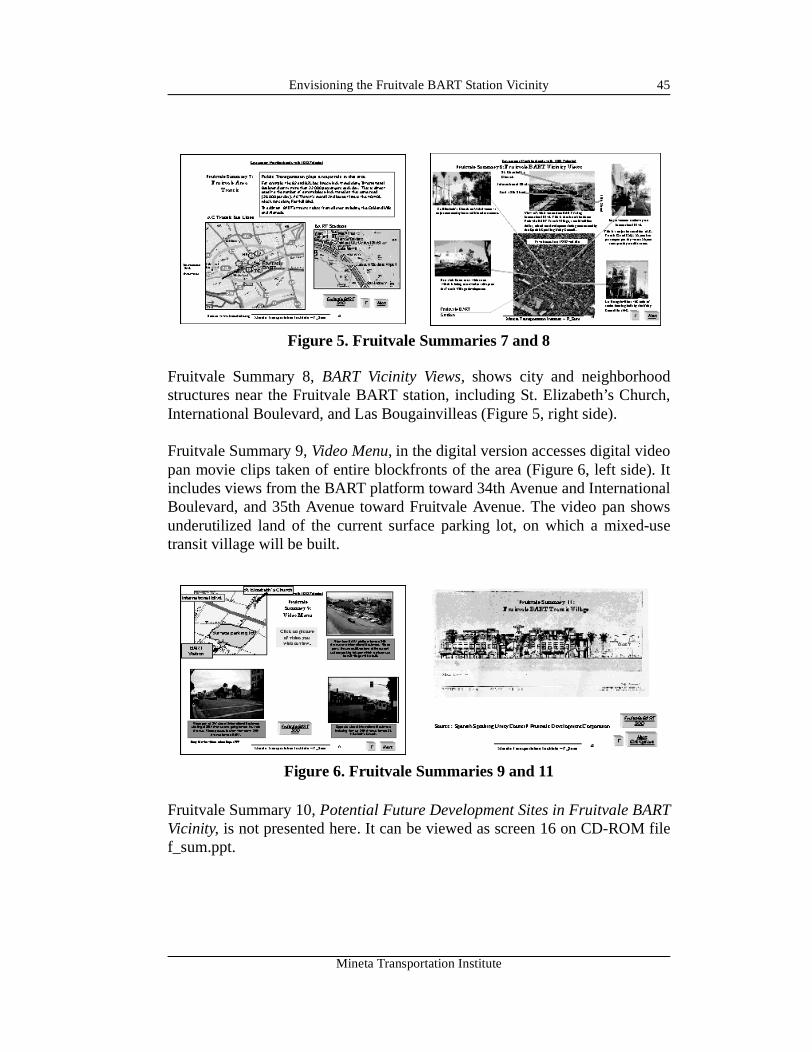
Envisioning the Fruitvale BART Station Vicinity 45
Fruitvale Summary 8, BART Vicinity Views, shows city and neighborhoodstructures near the Fruitvale BART station, including St. Elizabeth’s Church,International Boulevard, and Las Bougainvilleas (Figure 5, right side).
Fruitvale Summary 9, Video Menu, in the digital version accesses digital videopan movie clips taken of entire blockfronts of the area (Figure 6, left side). Itincludes views from the BART platform toward 34th Avenue and InternationalBoulevard, and 35th Avenue toward Fruitvale Avenue. The video pan showsunderutilized land of the current surface parking lot, on which a mixed-usetransit village will be built.
Fruitvale Summary 10, Potential Future Development Sites in Fruitvale BARTVicinity, is not presented here. It can be viewed as screen 16 on CD-ROM filef_sum.ppt.
Figure 5. Fruitvale Summaries 7 and 8
Figure 6. Fruitvale Summaries 9 and 11
Mineta Transportation Institute
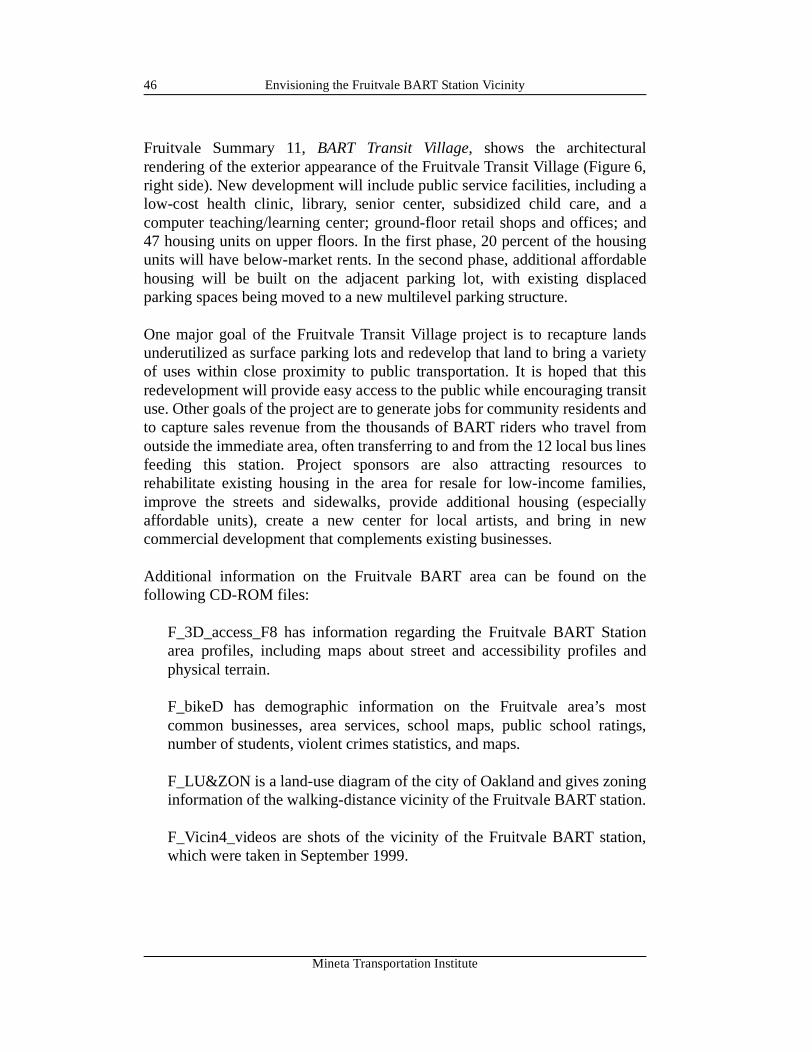
Envisioning the Fruitvale BART Station Vicinity46
Fruitvale Summary 11, BART Transit Village, shows the architecturalrendering of the exterior appearance of the Fruitvale Transit Village (Figure 6,right side). New development will include public service facilities, including alow-cost health clinic, library, senior center, subsidized child care, and acomputer teaching/learning center; ground-floor retail shops and offices; and47 housing units on upper floors. In the first phase, 20 percent of the housingunits will have below-market rents. In the second phase, additional affordablehousing will be built on the adjacent parking lot, with existing displacedparking spaces being moved to a new multilevel parking structure.
One major goal of the Fruitvale Transit Village project is to recapture landsunderutilized as surface parking lots and redevelop that land to bring a varietyof uses within close proximity to public transportation. It is hoped that thisredevelopment will provide easy access to the public while encouraging transituse. Other goals of the project are to generate jobs for community residents andto capture sales revenue from the thousands of BART riders who travel fromoutside the immediate area, often transferring to and from the 12 local bus linesfeeding this station. Project sponsors are also attracting resources torehabilitate existing housing in the area for resale for low-income families,improve the streets and sidewalks, provide additional housing (especiallyaffordable units), create a new center for local artists, and bring in newcommercial development that complements existing businesses.
Additional information on the Fruitvale BART area can be found on thefollowing CD-ROM files:
F_3D_access_F8 has information regarding the Fruitvale BART Stationarea profiles, including maps about street and accessibility profiles andphysical terrain.
F_bikeD has demographic information on the Fruitvale area’s mostcommon businesses, area services, school maps, public school ratings,number of students, violent crimes statistics, and maps.
F_LU&ZON is a land-use diagram of the city of Oakland and gives zoninginformation of the walking-distance vicinity of the Fruitvale BART station.
F_Vicin4_videos are shots of the vicinity of the Fruitvale BART station,which were taken in September 1999.
Mineta Transportation Institute
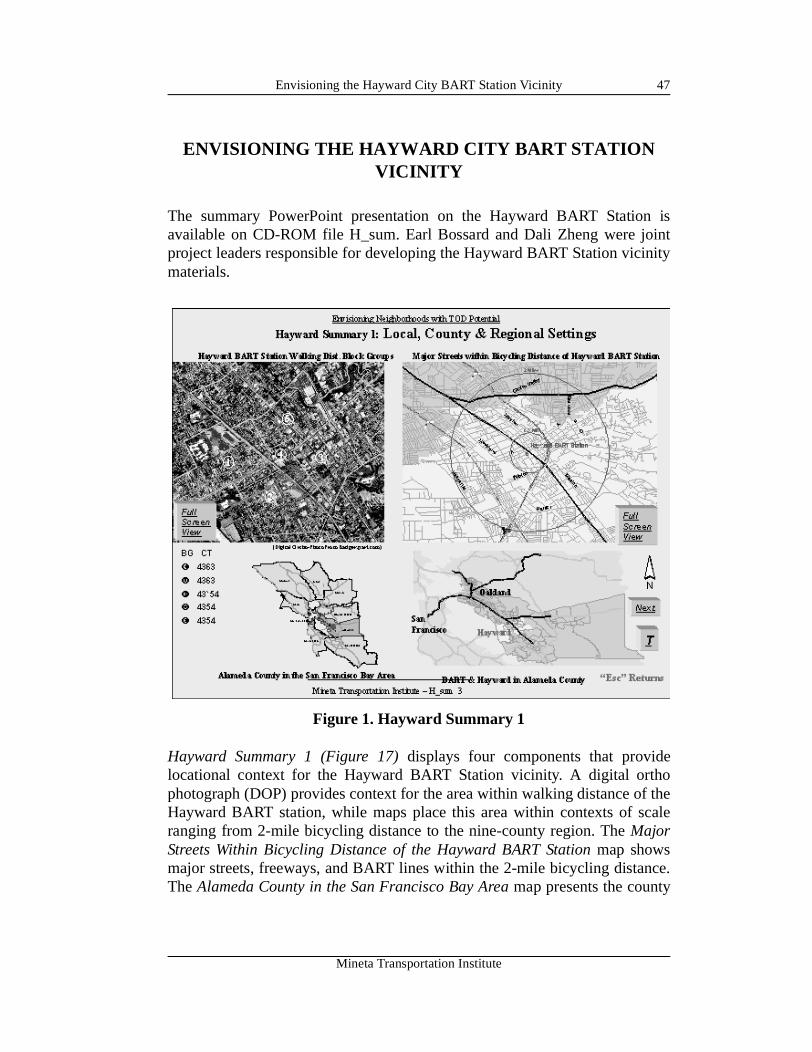
Envisioning the Hayward City BART Station Vicinity 47
ENVISIONING THE HAYWARD CITY BART STATION VICINITY
The summary PowerPoint presentation on the Hayward BART Station isavailable on CD-ROM file H_sum. Earl Bossard and Dali Zheng were jointproject leaders responsible for developing the Hayward BART Station vicinitymaterials.
Figure 1. Hayward Summary 1
Hayward Summary 1 (Figure 17) displays four components that providelocational context for the Hayward BART Station vicinity. A digital orthophotograph (DOP) provides context for the area within walking distance of theHayward BART station, while maps place this area within contexts of scaleranging from 2-mile bicycling distance to the nine-county region. The MajorStreets Within Bicycling Distance of the Hayward BART Station map showsmajor streets, freeways, and BART lines within the 2-mile bicycling distance.The Alameda County in the San Francisco Bay Area map presents the county
Mineta Transportation Institute
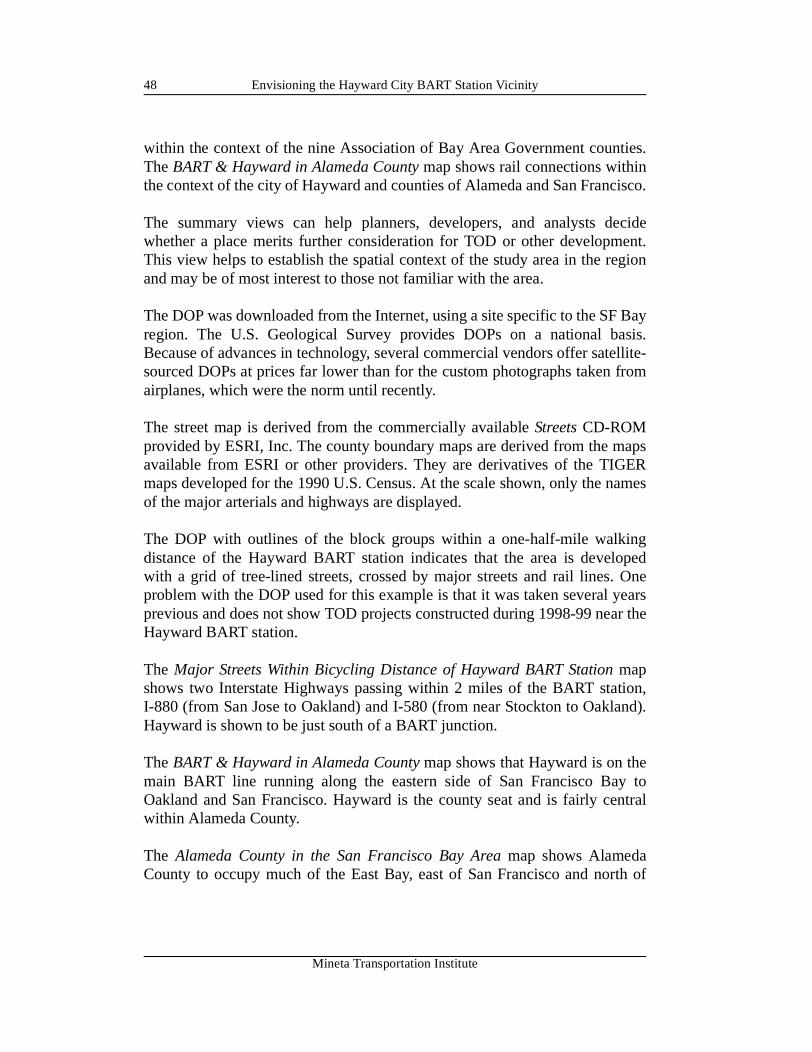
Envisioning the Hayward City BART Station Vicinity48
within the context of the nine Association of Bay Area Government counties.The BART & Hayward in Alameda County map shows rail connections withinthe context of the city of Hayward and counties of Alameda and San Francisco.
The summary views can help planners, developers, and analysts decidewhether a place merits further consideration for TOD or other development.This view helps to establish the spatial context of the study area in the regionand may be of most interest to those not familiar with the area.
The DOP was downloaded from the Internet, using a site specific to the SF Bayregion. The U.S. Geological Survey provides DOPs on a national basis.Because of advances in technology, several commercial vendors offer satellite-sourced DOPs at prices far lower than for the custom photographs taken fromairplanes, which were the norm until recently.
The street map is derived from the commercially available Streets CD-ROMprovided by ESRI, Inc. The county boundary maps are derived from the mapsavailable from ESRI or other providers. They are derivatives of the TIGERmaps developed for the 1990 U.S. Census. At the scale shown, only the namesof the major arterials and highways are displayed.
The DOP with outlines of the block groups within a one-half-mile walkingdistance of the Hayward BART station indicates that the area is developedwith a grid of tree-lined streets, crossed by major streets and rail lines. Oneproblem with the DOP used for this example is that it was taken several yearsprevious and does not show TOD projects constructed during 1998-99 near theHayward BART station.
The Major Streets Within Bicycling Distance of Hayward BART Station mapshows two Interstate Highways passing within 2 miles of the BART station,I-880 (from San Jose to Oakland) and I-580 (from near Stockton to Oakland).Hayward is shown to be just south of a BART junction.
The BART & Hayward in Alameda County map shows that Hayward is on themain BART line running along the eastern side of San Francisco Bay toOakland and San Francisco. Hayward is the county seat and is fairly centralwithin Alameda County.
The Alameda County in the San Francisco Bay Area map shows AlamedaCounty to occupy much of the East Bay, east of San Francisco and north of
Mineta Transportation Institute
Envisioning the Hayward City BART Station Vicinity 49
Santa Clara. This places Hayward within 30 miles of Oakland, San Jose, andPalo Alto, and less than an hour’s BART ride from downtown San Francisco.
Hayward Summary 2, BART Station and Vicinity Scenes, presents photographsof eight scenes from the area referenced to the DOP (Figure 2, left side). Thesescenes can provide a quick qualitative feel for the nature of the area, providinga sense of the scale, age, and style of existing and proposed developments.
The photos show that the BART station is elevated, with a busy set of feederbuses stopping between the station and city hall. Most of the existingdowntown development consists of buildings one or two stories in height.Existing and planned TOD development in the vicinity of the BART stationtend to be two to three stories in height.
Several vacant sites with TOD potential are in the vicinity, shown in the airphoto in the bottom left of the view. More details are provided about existingand proposed TOD projects in this area in the detailed views for Hayward.
Hayward Summary 3, Population/Housing Characteristics of Study AreaBlock Groups, presents seven sets of stacked bar charts showing census datafor the five block groups within walking distance of the BART station(Figure 2, right side). Data for increasingly larger areas are also shown, startingwith the average for this area, and proceeding out to the city, county, and state.Each chart presents comparisons across space among the area block groupsand across scale between these block groups and their larger city, county, andstate entity.
Figure 2. Hayward Summaries 2 and 3
Mineta Transportation Institute
Envisioning the Hayward City BART Station Vicinity50
Census data presented include the year the structure was built, gross rent, unitsin structure, rooms in housing units, family income, journey-to-work modes,and housing values. Analysts can compare block groups in the area and decidewhich, if any, have characteristics favoring what they wish to develop. Areacharacteristics can be used to determine what types of TOD might be mostsuitable for the area.
The comparisons across scale data will facilitate placing the area in context,while helping to understand local characteristics.
A comparison of the seven sets of stacked bar charts for five block groupswithin walking distance of the Hayward BART station reveals a surprisingnumber of differences. In all block groups, 20 to 60 percent of the housing wasbuilt between 1980 and 1990; in three, about 20 percent of the housing wasbuilt before 1949. In terms of gross rents, Block Group 3 had far more low-renthousing (70 percent) than any of the others, which had 20 to 40 percent.
In Block Group 3, 60 percent of the buildings have 10 to 50 units, but threeother block groups had less than 10 percent of their units in such largestructures. The charts for rooms in housing units tell a similar story, with BlockGroup 3 having far more small (< four rooms) housing units.
As might be expected from its high proportions of low rents, small housingunits, and multiple housing unit structures, Block Group 1 has far more lower-income families. The journey-to-work transportation mode data for BlockGroup 3 is surprising in that it has the highest percentage of workers who drivealone to work.
Comparison of the four right stacked bars in each set of charts reveals how thewalking distance area (leftmost of the four right side bars) compares to its city(Hayward), county (Alameda), and the state of California.
Starting with the housing values in the bottom right set of bars, it is clear thatthis area has a considerably higher share of low-value housing units, and amuch smaller share of high-value housing, than the county or state. Both thisarea and the city of Hayward have an insignificant share of high-value housing(>$500K). This area also has a greater share of the two lower-family-incomegroups and a lesser share of the higher-income groups than do the county orstate. These charts help define the housing markets in this area and in the cityof Hayward in context with the larger county market.
Mineta Transportation Institute
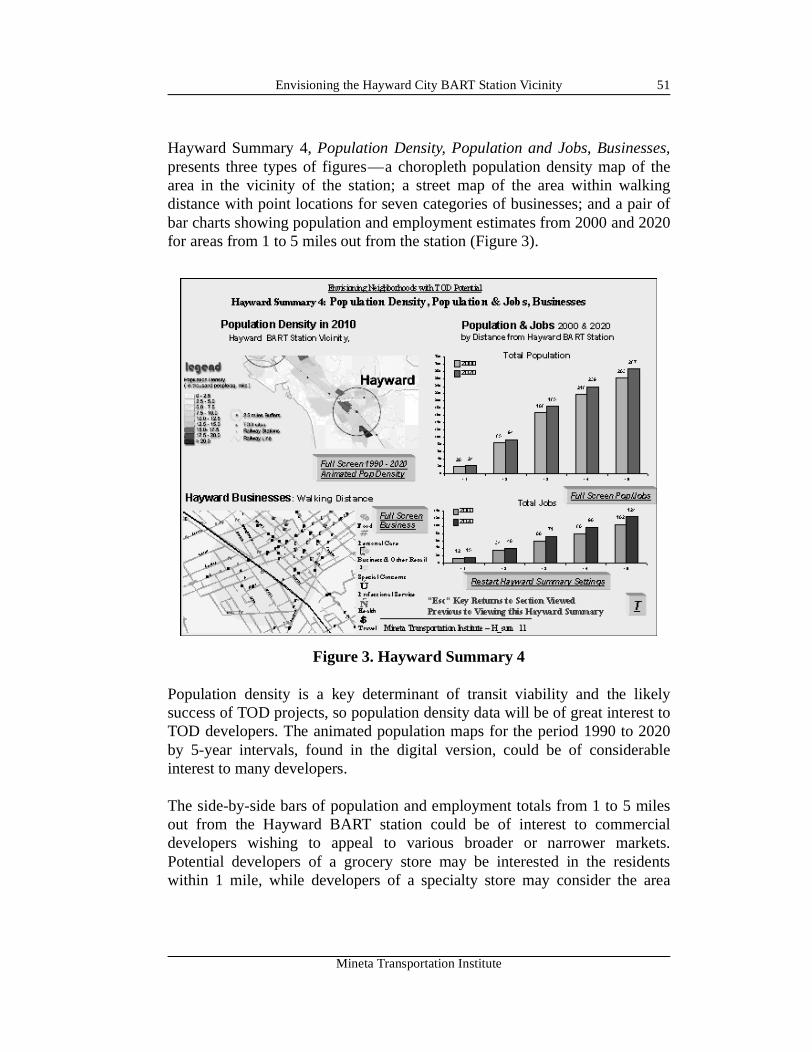
Envisioning the Hayward City BART Station Vicinity 51
Hayward Summary 4, Population Density, Population and Jobs, Businesses,presents three types of figures—a choropleth population density map of thearea in the vicinity of the station; a street map of the area within walkingdistance with point locations for seven categories of businesses; and a pair ofbar charts showing population and employment estimates from 2000 and 2020for areas from 1 to 5 miles out from the station (Figure 3).
Figure 3. Hayward Summary 4
Population density is a key determinant of transit viability and the likelysuccess of TOD projects, so population density data will be of great interest toTOD developers. The animated population maps for the period 1990 to 2020by 5-year intervals, found in the digital version, could be of considerableinterest to many developers.
The side-by-side bars of population and employment totals from 1 to 5 milesout from the Hayward BART station could be of interest to commercialdevelopers wishing to appeal to various broader or narrower markets.Potential developers of a grocery store may be interested in the residentswithin 1 mile, while developers of a specialty store may consider the area
Mineta Transportation Institute
Envisioning the Hayward City BART Station Vicinity52
within 5 miles. The digital version of Hayward Summary 4 has links to sevenfull-page screens with estimates of population and jobs in 2000 and 2020.
The Businesses Within Walking Distance maps could be of interest tocommercial developers who want to know the business mix of the area andinvestigate possible market niches. The business maps can also informpotential residents of the services and shopping opportunities within thevicinity. The digital version of Hayward Summary 4 has links to 16 businessmaps either within walking or bicycling distance.
In terms of population density, the 2010 map reveals some, but not extensive,areas with sufficient density to support viable transit.
The ring data charts indicate only moderate population growth is expected inthe next 20 years for the areas within 2 miles of the transit center, but that morethan 20 percent employment growth (102,000 to 124,000) can be expectedover that period in the area within 5 miles of the transit center.
The business maps show a heavy concentration of activity east of the transitcenter, which could be expected in this downtown area of a city of 140,000.A and Mission Streets have considerable strip commercial developments.
Additional information regarding the Hayward TOD potential are located onthe following CD-ROM files:
H_5MileR shows the 5-mile radius population and job charts, race andethnic population maps, residents within 5- and 15-minute drives of thetransit center, and population density data.
H_Bike has maps of Hayward, showing seven business types withinbicycling distance of the Hayward BART station and populationpercentages of the various ethnic groups residing within bicycling distanceof the station.
H_busroutes_www is a map of bus routes near the Hayward BART station,taken from the ABAG/MTC Web site.
H_DOP includes DOPs of the various block groups in the Hayward BARTStation vicinity.
H_DOP_5mile_JPG is a DOP of the city of Hayward and vicinity.
Mineta Transportation Institute
Envisioning the Hayward City BART Station Vicinity 53
H_F_PD9022 gives population density information regarding the Haywardarea, using ABAG estimates for 1990, 1995, 2000, 2005, 2010, 2015, and2020.
H_TOD_specs has additional information regarding the Hayward BARTstation vicinity, including specifications for redevelopment sites.
H_W_Scene has photographic scenes of the area around the HaywardBART station, including links to video clips, moving panorama views, andstill panorama views.
H_Walk includes maps detailing population within various walking timesto the Hayward BART station; businesses within walking distance of theBART station; land use and zoning information for the walking-distancevicinity of the BART station; and bar graphs for population and housingcharacteristics, family incomes, rents, housing values, and populationpercentages.
H_Zoning_LU contains land use and zoning information for the walking-distance vicinity of the Hayward BART Station.
Mineta Transportation Institute

Envisioning the Hayward City BART Station Vicinity54
Mineta Transportation Institute
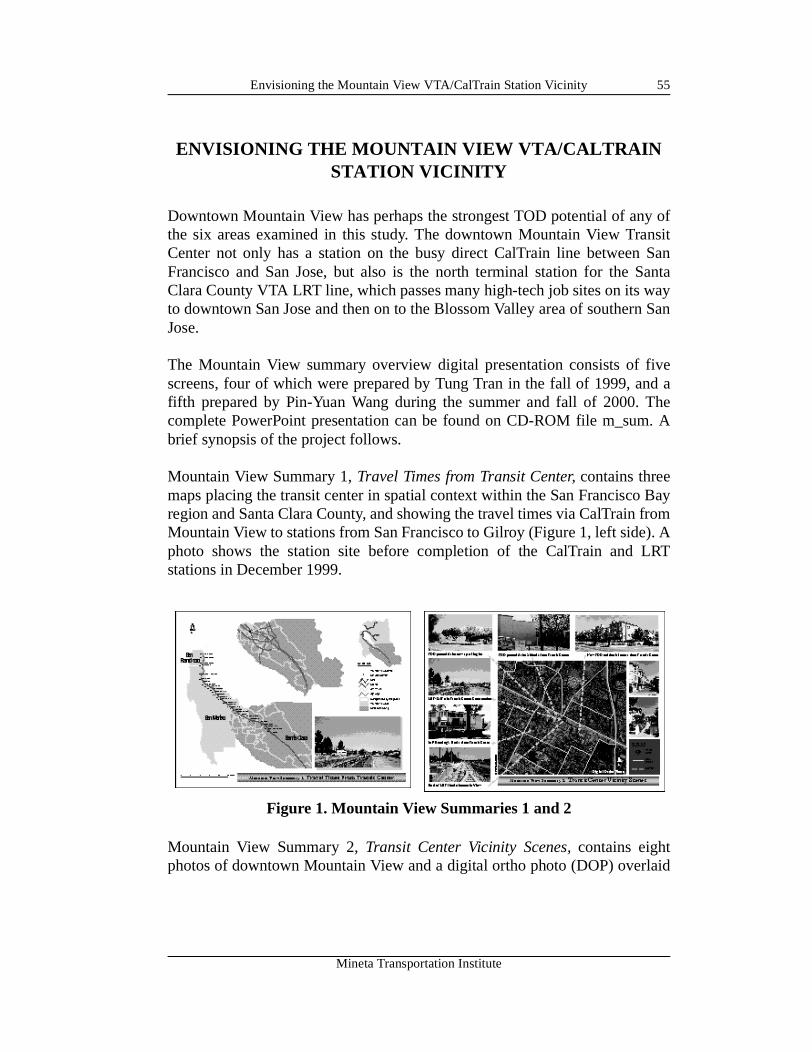
Envisioning the Mountain View VTA/CalTrain Station Vicinity 55
ENVISIONING THE MOUNTAIN VIEW VTA/CALTRAIN STATION VICINITY
Downtown Mountain View has perhaps the strongest TOD potential of any ofthe six areas examined in this study. The downtown Mountain View TransitCenter not only has a station on the busy direct CalTrain line between SanFrancisco and San Jose, but also is the north terminal station for the SantaClara County VTA LRT line, which passes many high-tech job sites on its wayto downtown San Jose and then on to the Blossom Valley area of southern SanJose.
The Mountain View summary overview digital presentation consists of fivescreens, four of which were prepared by Tung Tran in the fall of 1999, and afifth prepared by Pin-Yuan Wang during the summer and fall of 2000. Thecomplete PowerPoint presentation can be found on CD-ROM file m_sum. Abrief synopsis of the project follows.
Mountain View Summary 1, Travel Times from Transit Center, contains threemaps placing the transit center in spatial context within the San Francisco Bayregion and Santa Clara County, and showing the travel times via CalTrain fromMountain View to stations from San Francisco to Gilroy (Figure 1, left side). Aphoto shows the station site before completion of the CalTrain and LRTstations in December 1999.
Mountain View Summary 2, Transit Center Vicinity Scenes, contains eightphotos of downtown Mountain View and a digital ortho photo (DOP) overlaid
Figure 1. Mountain View Summaries 1 and 2
Mineta Transportation Institute
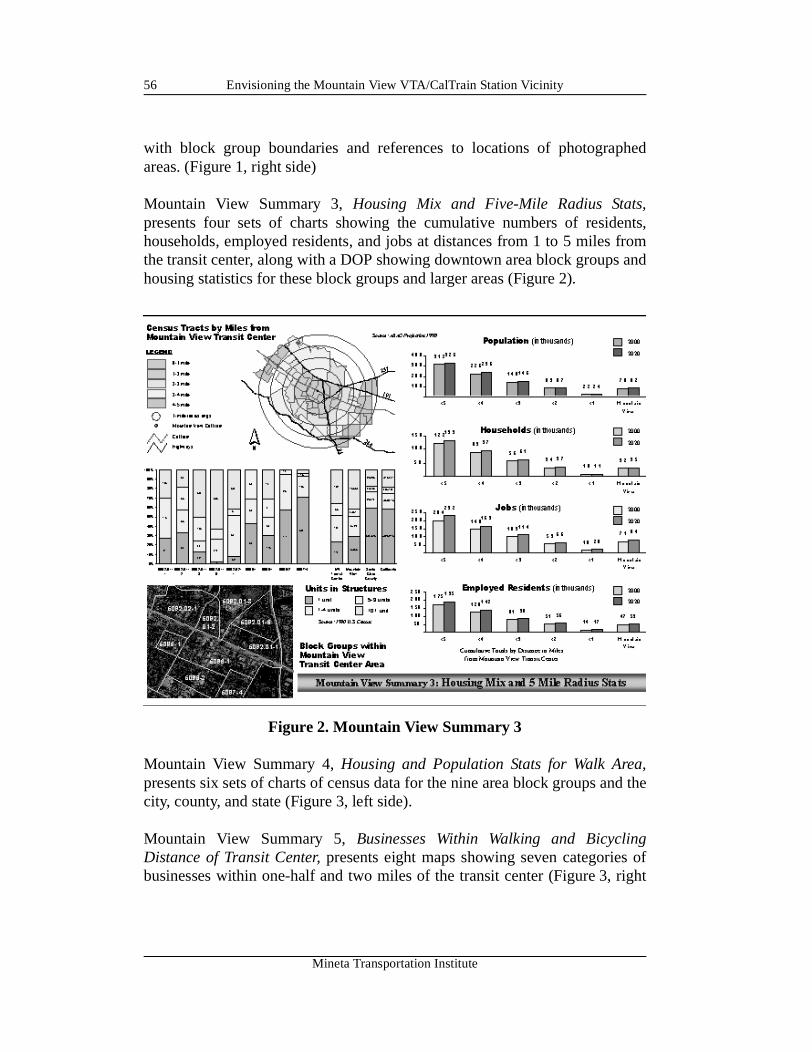
Envisioning the Mountain View VTA/CalTrain Station Vicinity56
with block group boundaries and references to locations of photographedareas. (Figure 1, right side)
Mountain View Summary 3, Housing Mix and Five-Mile Radius Stats,presents four sets of charts showing the cumulative numbers of residents,households, employed residents, and jobs at distances from 1 to 5 miles fromthe transit center, along with a DOP showing downtown area block groups andhousing statistics for these block groups and larger areas (Figure 2).
Figure 2. Mountain View Summary 3
Mountain View Summary 4, Housing and Population Stats for Walk Area,presents six sets of charts of census data for the nine area block groups and thecity, county, and state (Figure 3, left side).
Mountain View Summary 5, Businesses Within Walking and BicyclingDistance of Transit Center, presents eight maps showing seven categories ofbusinesses within one-half and two miles of the transit center (Figure 3, right
Mineta Transportation Institute
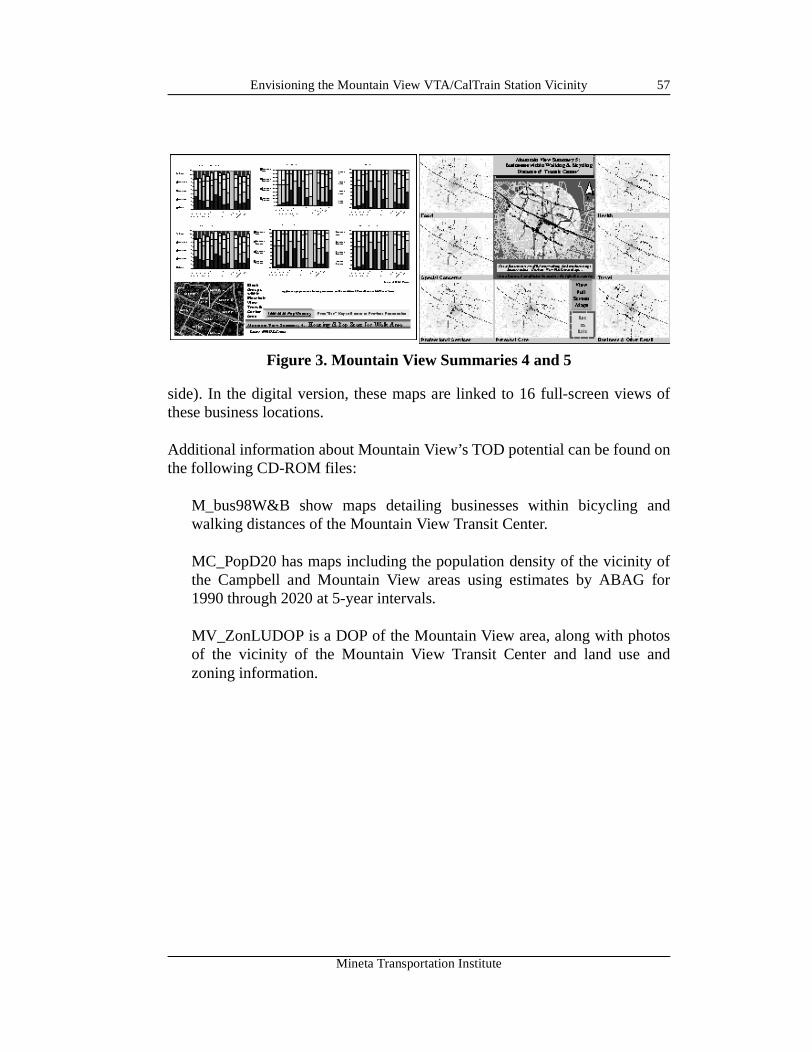
Envisioning the Mountain View VTA/CalTrain Station Vicinity 57
side). In the digital version, these maps are linked to 16 full-screen views ofthese business locations.
Additional information about Mountain View’s TOD potential can be found onthe following CD-ROM files:
M_bus98W&B show maps detailing businesses within bicycling andwalking distances of the Mountain View Transit Center.
MC_PopD20 has maps including the population density of the vicinity ofthe Campbell and Mountain View areas using estimates by ABAG for1990 through 2020 at 5-year intervals.
MV_ZonLUDOP is a DOP of the Mountain View area, along with photosof the vicinity of the Mountain View Transit Center and land use andzoning information.
Figure 3. Mountain View Summaries 4 and 5
Mineta Transportation Institute

Envisioning the Mountain View VTA/CalTrain Station Vicinity58
Mineta Transportation Institute
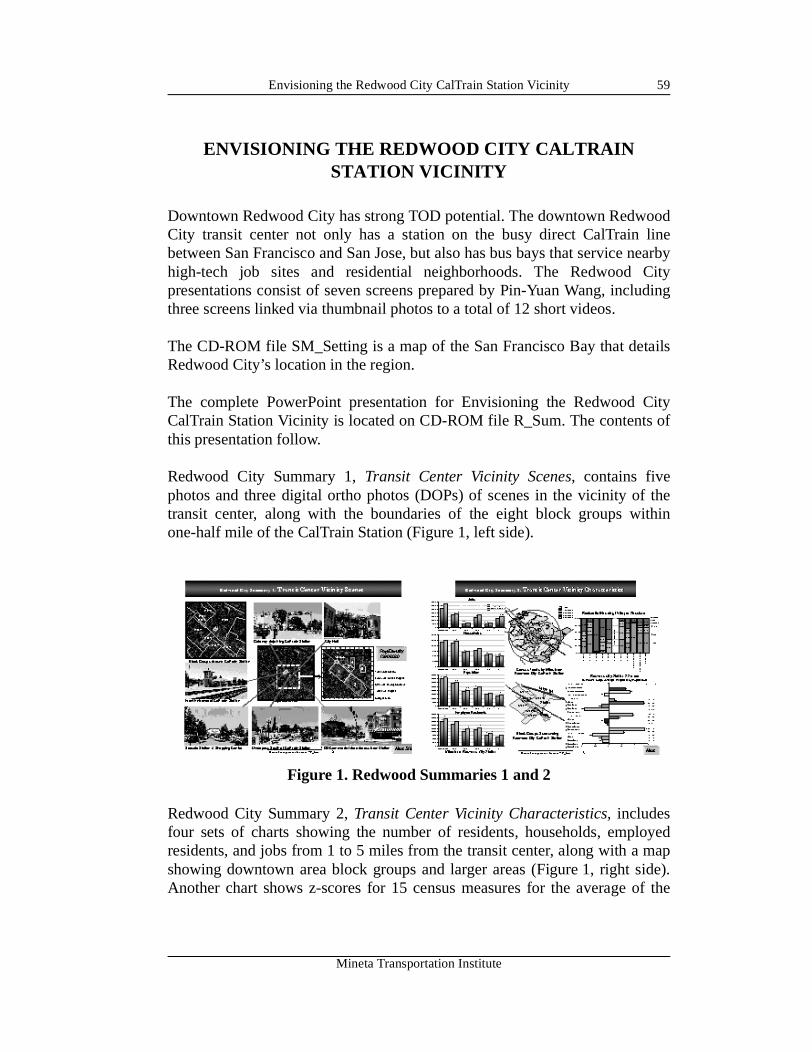
Envisioning the Redwood City CalTrain Station Vicinity 59
ENVISIONING THE REDWOOD CITY CALTRAIN STATION VICINITY
Downtown Redwood City has strong TOD potential. The downtown RedwoodCity transit center not only has a station on the busy direct CalTrain linebetween San Francisco and San Jose, but also has bus bays that service nearbyhigh-tech job sites and residential neighborhoods. The Redwood Citypresentations consist of seven screens prepared by Pin-Yuan Wang, includingthree screens linked via thumbnail photos to a total of 12 short videos.
The CD-ROM file SM_Setting is a map of the San Francisco Bay that detailsRedwood City’s location in the region.
The complete PowerPoint presentation for Envisioning the Redwood CityCalTrain Station Vicinity is located on CD-ROM file R_Sum. The contents ofthis presentation follow.
Redwood City Summary 1, Transit Center Vicinity Scenes, contains fivephotos and three digital ortho photos (DOPs) of scenes in the vicinity of thetransit center, along with the boundaries of the eight block groups withinone-half mile of the CalTrain Station (Figure 1, left side).
Redwood City Summary 2, Transit Center Vicinity Characteristics, includesfour sets of charts showing the number of residents, households, employedresidents, and jobs from 1 to 5 miles from the transit center, along with a mapshowing downtown area block groups and larger areas (Figure 1, right side).Another chart shows z-scores for 15 census measures for the average of the
Figure 1. Redwood Summaries 1 and 2
Mineta Transportation Institute
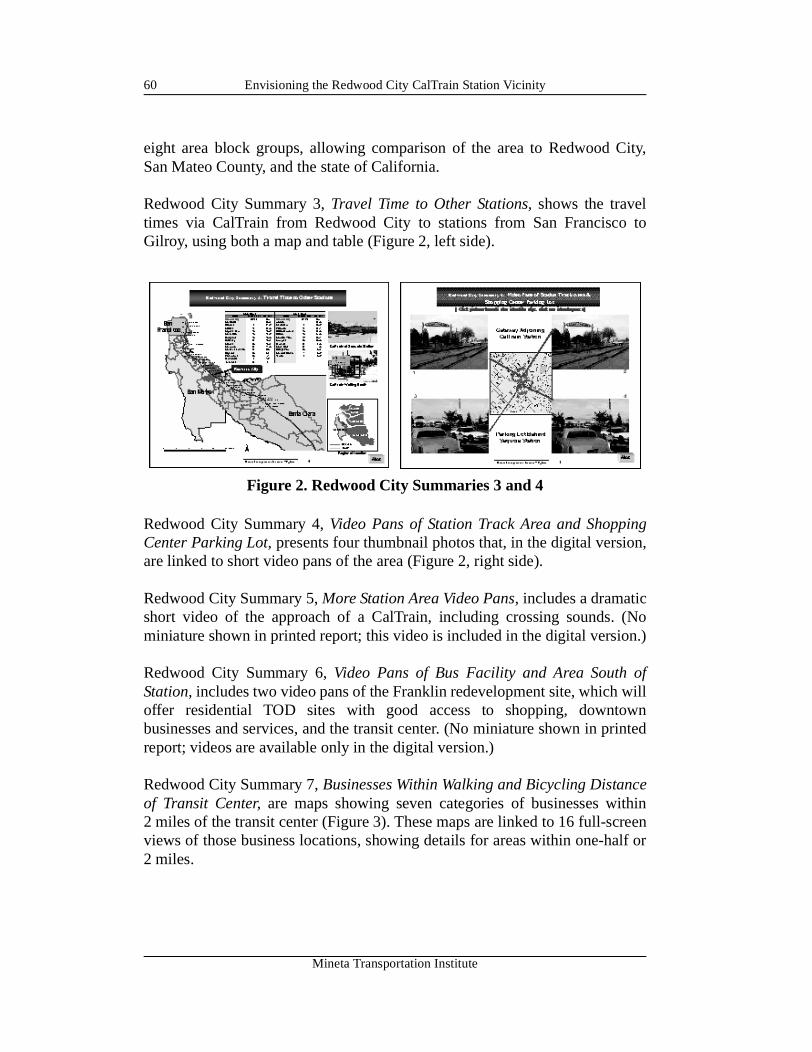
Envisioning the Redwood City CalTrain Station Vicinity60
eight area block groups, allowing comparison of the area to Redwood City,San Mateo County, and the state of California.
Redwood City Summary 3, Travel Time to Other Stations, shows the traveltimes via CalTrain from Redwood City to stations from San Francisco toGilroy, using both a map and table (Figure 2, left side).
Redwood City Summary 4, Video Pans of Station Track Area and ShoppingCenter Parking Lot, presents four thumbnail photos that, in the digital version,are linked to short video pans of the area (Figure 2, right side).
Redwood City Summary 5, More Station Area Video Pans, includes a dramaticshort video of the approach of a CalTrain, including crossing sounds. (Nominiature shown in printed report; this video is included in the digital version.)
Redwood City Summary 6, Video Pans of Bus Facility and Area South ofStation, includes two video pans of the Franklin redevelopment site, which willoffer residential TOD sites with good access to shopping, downtownbusinesses and services, and the transit center. (No miniature shown in printedreport; videos are available only in the digital version.)
Redwood City Summary 7, Businesses Within Walking and Bicycling Distanceof Transit Center, are maps showing seven categories of businesses within2 miles of the transit center (Figure 3). These maps are linked to 16 full-screenviews of those business locations, showing details for areas within one-half or2 miles.
Figure 2. Redwood City Summaries 3 and 4
Mineta Transportation Institute
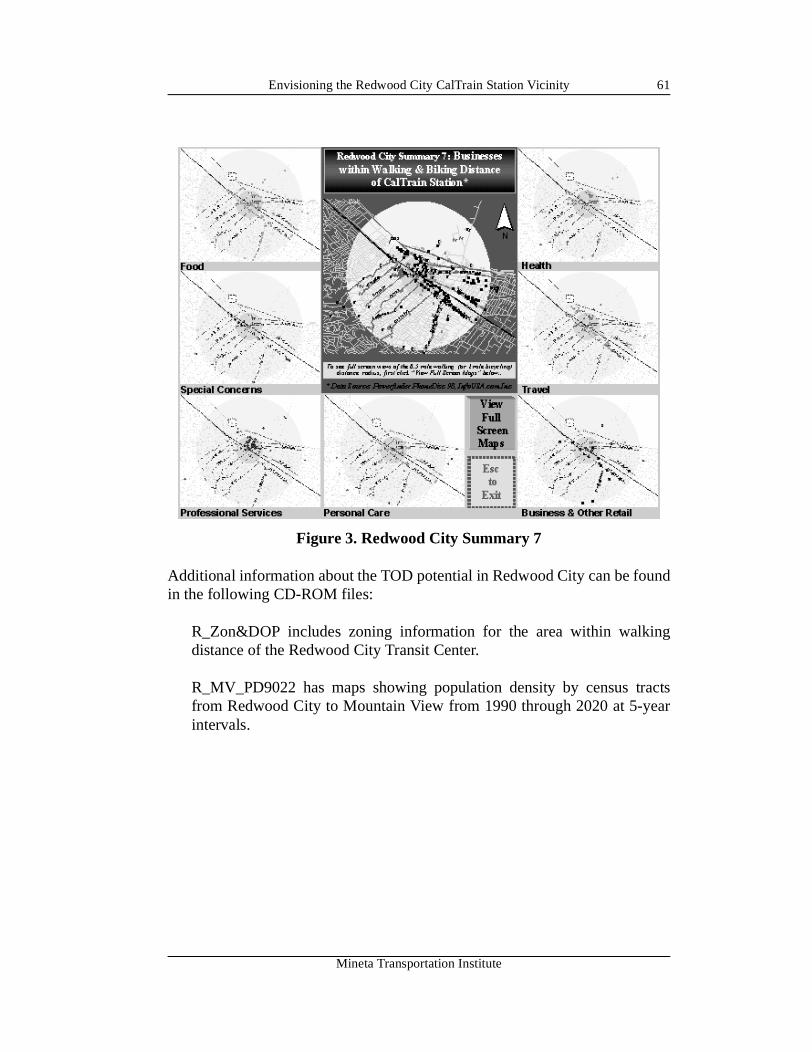
Envisioning the Redwood City CalTrain Station Vicinity 61
Figure 3. Redwood City Summary 7
Additional information about the TOD potential in Redwood City can be foundin the following CD-ROM files:
R_Zon&DOP includes zoning information for the area within walkingdistance of the Redwood City Transit Center.
R_MV_PD9022 has maps showing population density by census tractsfrom Redwood City to Mountain View from 1990 through 2020 at 5-yearintervals.
Mineta Transportation Institute

Envisioning the Redwood City CalTrain Station Vicinity62
Mineta Transportation Institute
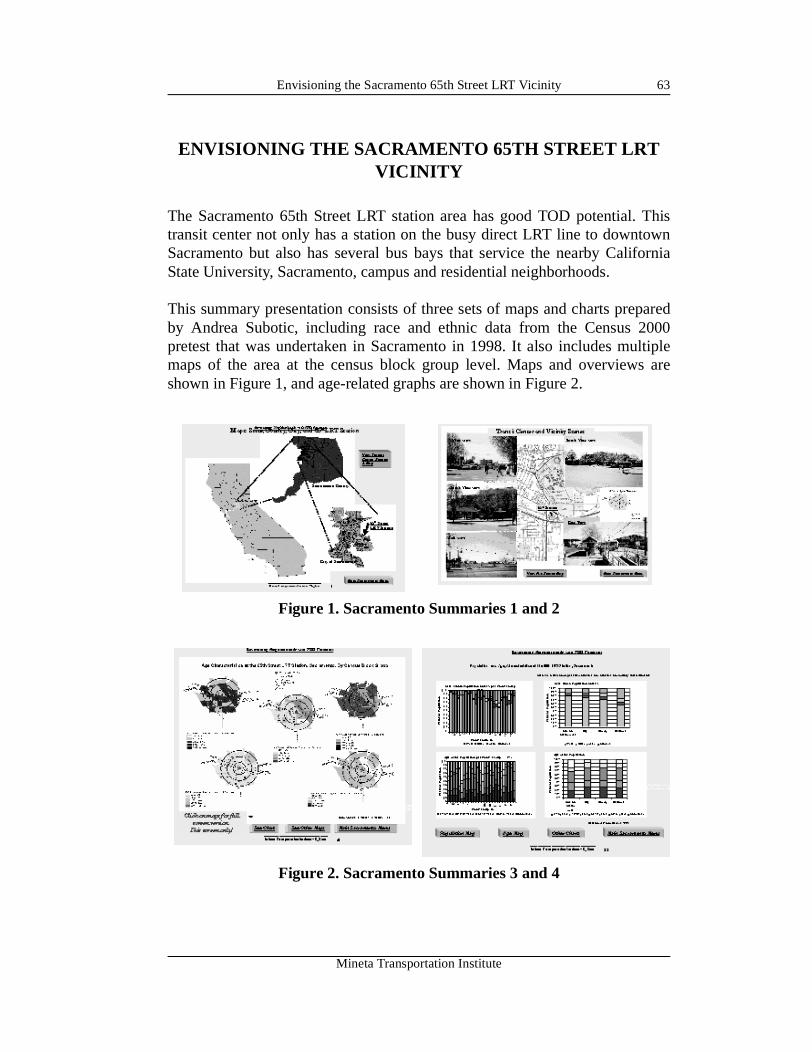
Envisioning the Sacramento 65th Street LRT Vicinity 63
ENVISIONING THE SACRAMENTO 65TH STREET LRT VICINITY
The Sacramento 65th Street LRT station area has good TOD potential. Thistransit center not only has a station on the busy direct LRT line to downtownSacramento but also has several bus bays that service the nearby CaliforniaState University, Sacramento, campus and residential neighborhoods.
This summary presentation consists of three sets of maps and charts preparedby Andrea Subotic, including race and ethnic data from the Census 2000pretest that was undertaken in Sacramento in 1998. It also includes multiplemaps of the area at the census block group level. Maps and overviews areshown in Figure 1, and age-related graphs are shown in Figure 2.
Figure 1. Sacramento Summaries 1 and 2
Figure 2. Sacramento Summaries 3 and 4
Mineta Transportation Institute
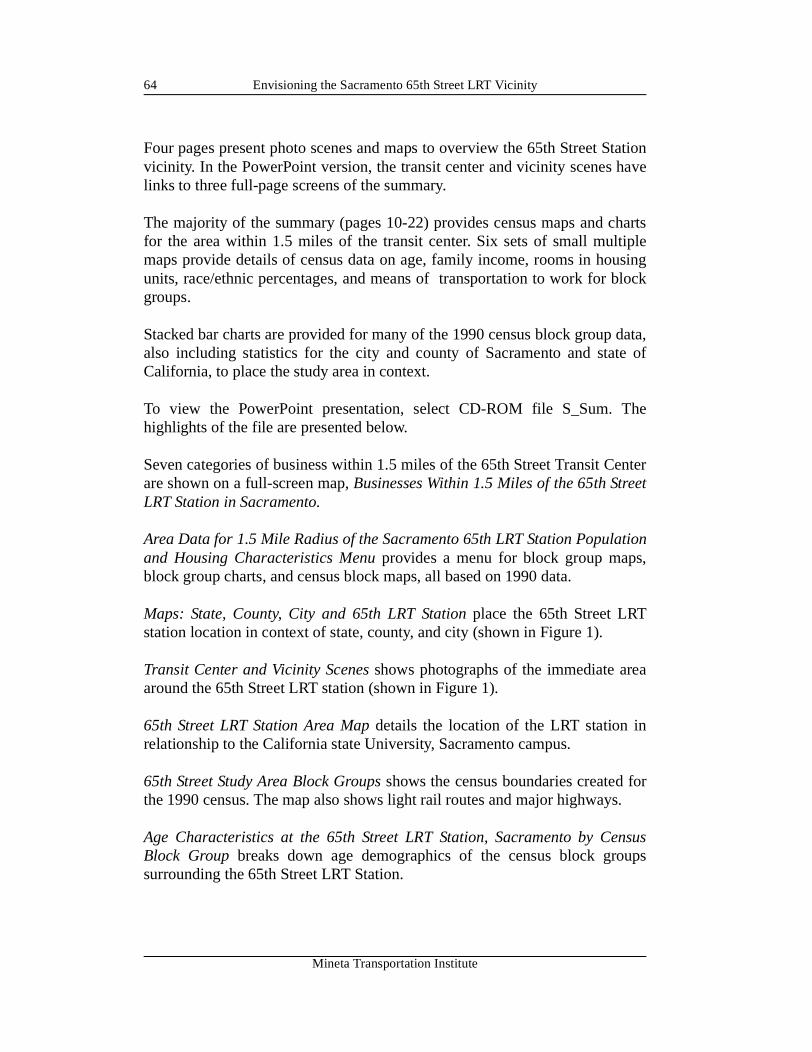
Envisioning the Sacramento 65th Street LRT Vicinity64
Four pages present photo scenes and maps to overview the 65th Street Stationvicinity. In the PowerPoint version, the transit center and vicinity scenes havelinks to three full-page screens of the summary.
The majority of the summary (pages 10-22) provides census maps and chartsfor the area within 1.5 miles of the transit center. Six sets of small multiplemaps provide details of census data on age, family income, rooms in housingunits, race/ethnic percentages, and means of transportation to work for blockgroups.
Stacked bar charts are provided for many of the 1990 census block group data,also including statistics for the city and county of Sacramento and state ofCalifornia, to place the study area in context.
To view the PowerPoint presentation, select CD-ROM file S_Sum. Thehighlights of the file are presented below.
Seven categories of business within 1.5 miles of the 65th Street Transit Centerare shown on a full-screen map, Businesses Within 1.5 Miles of the 65th StreetLRT Station in Sacramento.
Area Data for 1.5 Mile Radius of the Sacramento 65th LRT Station Populationand Housing Characteristics Menu provides a menu for block group maps,block group charts, and census block maps, all based on 1990 data.
Maps: State, County, City and 65th LRT Station place the 65th Street LRTstation location in context of state, county, and city (shown in Figure 1).
Transit Center and Vicinity Scenes shows photographs of the immediate areaaround the 65th Street LRT station (shown in Figure 1).
65th Street LRT Station Area Map details the location of the LRT station inrelationship to the California state University, Sacramento campus.
65th Street Study Area Block Groups shows the census boundaries created forthe 1990 census. The map also shows light rail routes and major highways.
Age Characteristics at the 65th Street LRT Station, Sacramento by CensusBlock Group breaks down age demographics of the census block groupssurrounding the 65th Street LRT Station.
Mineta Transportation Institute
Envisioning the Sacramento 65th Street LRT Vicinity 65
Age 0-18 Block Group Map, 65th Street Station Area shows the percentage ofresidents under the age of 18.
Family Income in 1989 at the 65th Street LRT Station, Sacramento by CensusBlock Groups breaks down the income levels of families living near the LRTstation.
Rooms in Housing Units at the 65th Street LRT Station, Sacramento by CensusBlock Groups indicates the sizes of housing units near the LRT station.
Race/Ethnic Percentages at the 65th Street LRT Station, Sacramento byCensus Block Groups shows the race/ethnic breakdown of the neighborhoodssurrounding the 65th Street LRT Station.
Means of Transportation to Work at the 65th Street LRT Station, Sacramentoby Census Block Group summarizes the modes of transportation used byresidents near the LRT station.
Year Structure Built at the 65th Street LRT Station, Sacramento by CensusBlock Groups indicates the age of structures standing in the neighborhoodaround the 65th Street LRT Station.
Year Structure Built at the 65th Street LRT Station, Sacramento has bar chartscomparing the age of structures near the 65th Street LRT Station to theremainder of Sacramento, Sacramento County, and the state of California.
Population and Age Characteristics at the 65th Street LRT Station,Sacramento has bar charts comparing the population and age characteristics ofresidents near the 65th Street LRT Station to the remainder of Sacramento,Sacramento County, and the state of California (shown in Figure 2).
Family Income and Means of Transportation at the 65th Street LRT Station,Sacramento are bar charts comparing family incomes and means oftransportation to and from work between the residents near the 65th StreetLRT Station and the remainder of Sacramento, Sacramento County, and thestate of California.
Means of Transportation to Work at the 65th LRT Station, Sacramento is adetailed graph that breaks down mode of transportation by census block group,including carpooling, driving alone, motorcycle, public transportation, and rail.
Mineta Transportation Institute
Envisioning the Sacramento 65th Street LRT Vicinity66
Rooms in Housing Units in Structure at the 65th Street LRT Station,Sacramento is a series of bar charts that break down the number of rooms perstructure in the census block groups near the 65th Street LRT Station, andcompares the number of rooms to the remainder of Sacramento, SacramentoCounty, and the state of California.
Race/Ethnic Percentages at the 65th Street LRT Station, Sacramento byCensus Bloc, 1998 has graphs detailing the racial percentages of theneighborhood surrounding the 65th Street LRT Station, using 1998 data.
Race/Ethnic Percentages at the 65th Street LRT Station, Sacramento byCensus Block, 1990 gives the same data as above but using 1990 data.
Businesses Within 1.5 Miles of the 65th Street LRT Station in Sacramento is amap with local businesses plotted in relationship to their location of the 65thStreet LRT Station.
Mineta Transportation Institute
County or Regional Contexts 67
COUNTY OR REGIONAL CONTEXTS
Envisioning the Regional Setting for Five TOD Study Areas in the SanFrancisco Bay Region presents a series of maps showing the regional settingfor the five TOD study areas in Alameda, San Mateo, and Santa Clara counties.The “regional setting” is both broadly and narrowly construed, with the broadview looking at the nine counties constituting the Association of Bay AreaGovernments (ABAG) region, and the narrow view looking at the five countiesnearest the study areas: San Francisco, San Mateo, Santa Clara, Alameda, andContra Costa.
REGIONAL DATA
The regional data shown include rail transit routes; county boundaries;highways, commercial airports, and ferry terminals; 2000 and 2020 estimatesof population, population density, and housing density; and 1990 census dataregarding race, ethnicity, and family incomes.
Understanding the regional setting of areas with TOD potential is importantbecause a significant proportion of activities in this region cross multiplecounties, with journey-to-work trips often crossing county boundaries.Potential developers of residential TOD projects need to be aware of where thefuture residents of their projects may be working. TOD developers also need tobe aware of how their project fits in with the general demographic patterns ofthe region.
All the population and housing estimates for 2000 and 2020 are based onABAG’s Projections ’98 census tract data. The 1990 race/ethnicity and familyincome data source is the U.S. Census, as ABAG does not produce census-tract-level statistics for these measures. Highlights of the CD-ROM fileTOD_Region are discussed below. Printed miniatures are shown here only forthe Regional Settings and 2000/2020 Population slides.
Rail Transit and Five TOD Study Areas (TOD_Region, slide 1) shows that thestudy areas encircle San Francisco Bay, with Fruitvale, Hayward, RedwoodCity, and Mountain View having direct rail transit access to San Francisco (seeFigure 1.)
Mineta Transportation Institute
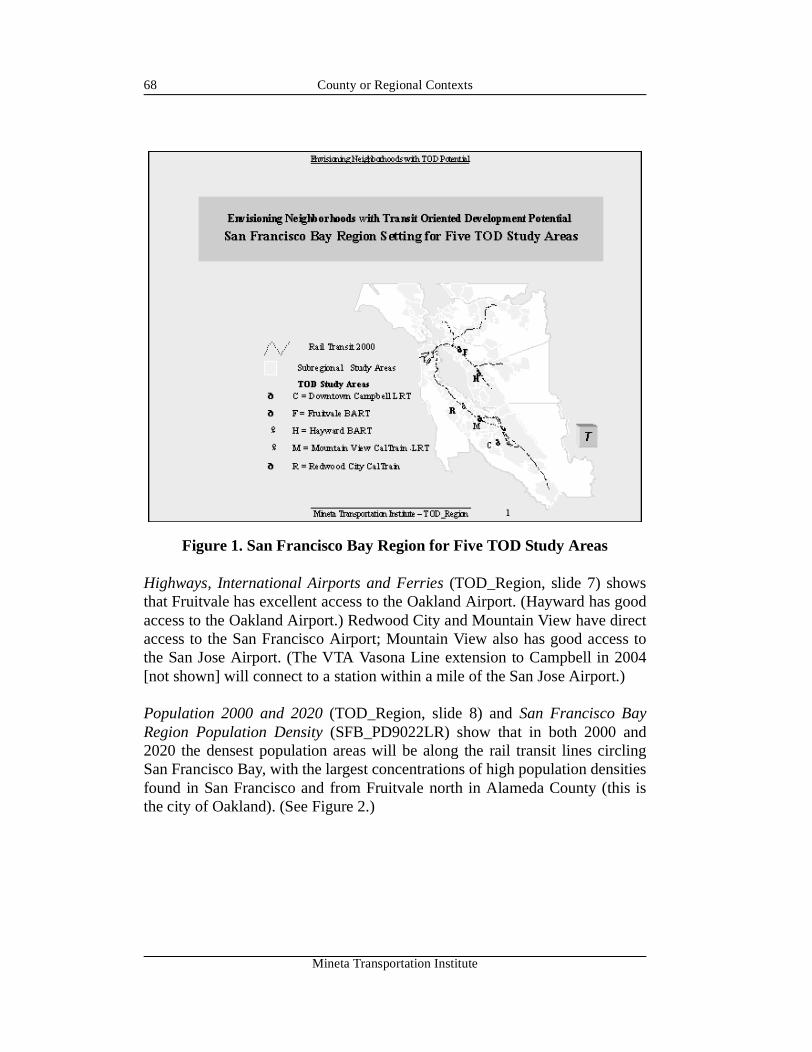
County or Regional Contexts68
Figure 1. San Francisco Bay Region for Five TOD Study Areas
Highways, International Airports and Ferries (TOD_Region, slide 7) showsthat Fruitvale has excellent access to the Oakland Airport. (Hayward has goodaccess to the Oakland Airport.) Redwood City and Mountain View have directaccess to the San Francisco Airport; Mountain View also has good access tothe San Jose Airport. (The VTA Vasona Line extension to Campbell in 2004[not shown] will connect to a station within a mile of the San Jose Airport.)
Population 2000 and 2020 (TOD_Region, slide 8) and San Francisco BayRegion Population Density (SFB_PD9022LR) show that in both 2000 and2020 the densest population areas will be along the rail transit lines circlingSan Francisco Bay, with the largest concentrations of high population densitiesfound in San Francisco and from Fruitvale north in Alameda County (this isthe city of Oakland). (See Figure 2.)
Mineta Transportation Institute
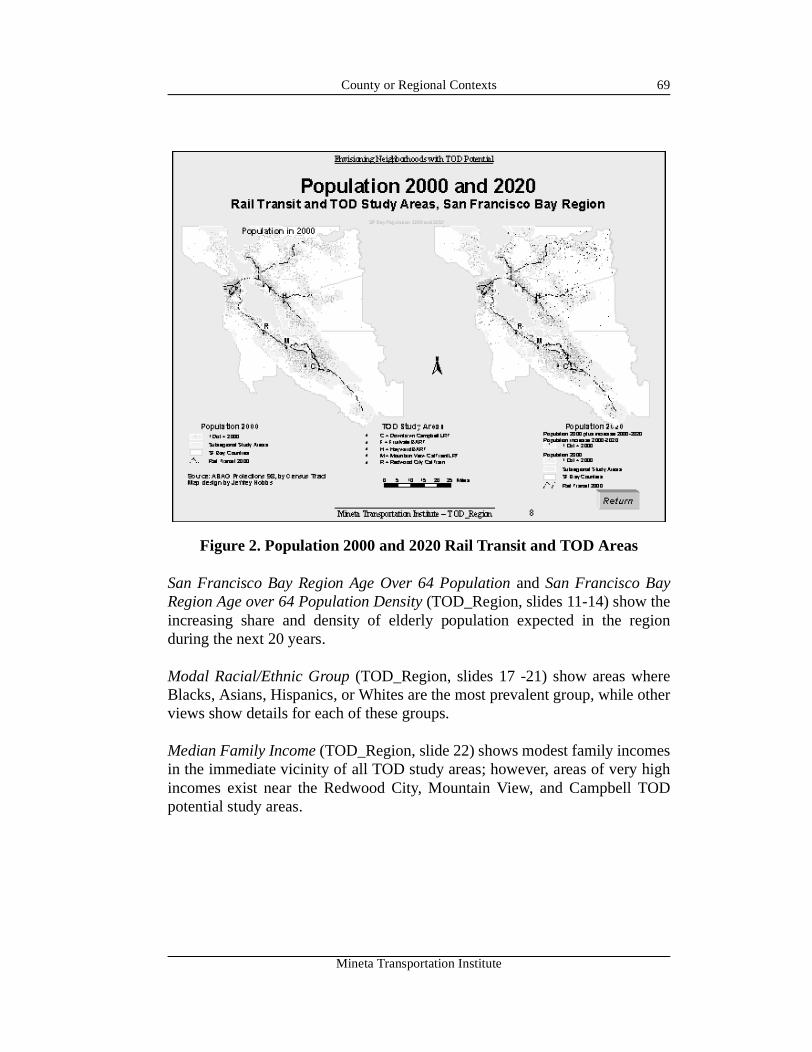
County or Regional Contexts 69
Figure 2. Population 2000 and 2020 Rail Transit and TOD Areas
San Francisco Bay Region Age Over 64 Population and San Francisco BayRegion Age over 64 Population Density (TOD_Region, slides 11-14) show theincreasing share and density of elderly population expected in the regionduring the next 20 years.
Modal Racial/Ethnic Group (TOD_Region, slides 17 -21) show areas whereBlacks, Asians, Hispanics, or Whites are the most prevalent group, while otherviews show details for each of these groups.
Median Family Income (TOD_Region, slide 22) shows modest family incomesin the immediate vicinity of all TOD study areas; however, areas of very highincomes exist near the Redwood City, Mountain View, and Campbell TODpotential study areas.
Mineta Transportation Institute
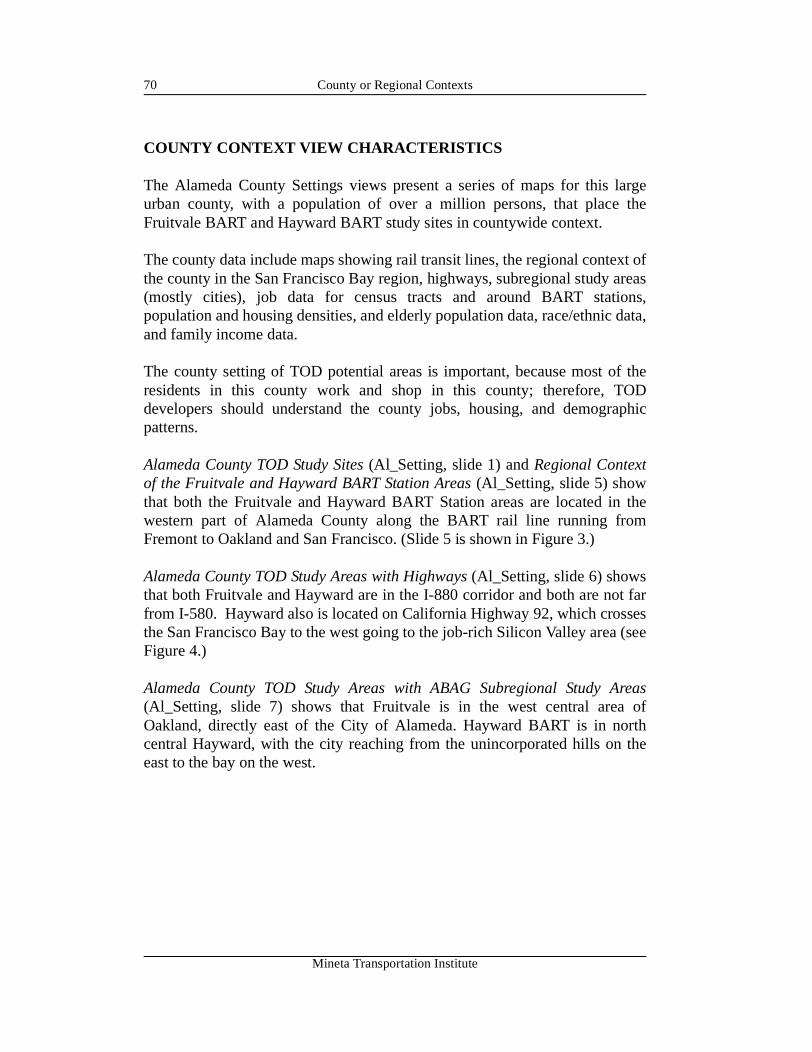
County or Regional Contexts70
COUNTY CONTEXT VIEW CHARACTERISTICS
The Alameda County Settings views present a series of maps for this largeurban county, with a population of over a million persons, that place theFruitvale BART and Hayward BART study sites in countywide context.
The county data include maps showing rail transit lines, the regional context ofthe county in the San Francisco Bay region, highways, subregional study areas(mostly cities), job data for census tracts and around BART stations,population and housing densities, and elderly population data, race/ethnic data,and family income data.
The county setting of TOD potential areas is important, because most of theresidents in this county work and shop in this county; therefore, TODdevelopers should understand the county jobs, housing, and demographicpatterns.
Alameda County TOD Study Sites (Al_Setting, slide 1) and Regional Contextof the Fruitvale and Hayward BART Station Areas (Al_Setting, slide 5) showthat both the Fruitvale and Hayward BART Station areas are located in thewestern part of Alameda County along the BART rail line running fromFremont to Oakland and San Francisco. (Slide 5 is shown in Figure 3.)
Alameda County TOD Study Areas with Highways (Al_Setting, slide 6) showsthat both Fruitvale and Hayward are in the I-880 corridor and both are not farfrom I-580. Hayward also is located on California Highway 92, which crossesthe San Francisco Bay to the west going to the job-rich Silicon Valley area (seeFigure 4.)
Alameda County TOD Study Areas with ABAG Subregional Study Areas(Al_Setting, slide 7) shows that Fruitvale is in the west central area ofOakland, directly east of the City of Alameda. Hayward BART is in northcentral Hayward, with the city reaching from the unincorporated hills on theeast to the bay on the west.
Mineta Transportation Institute
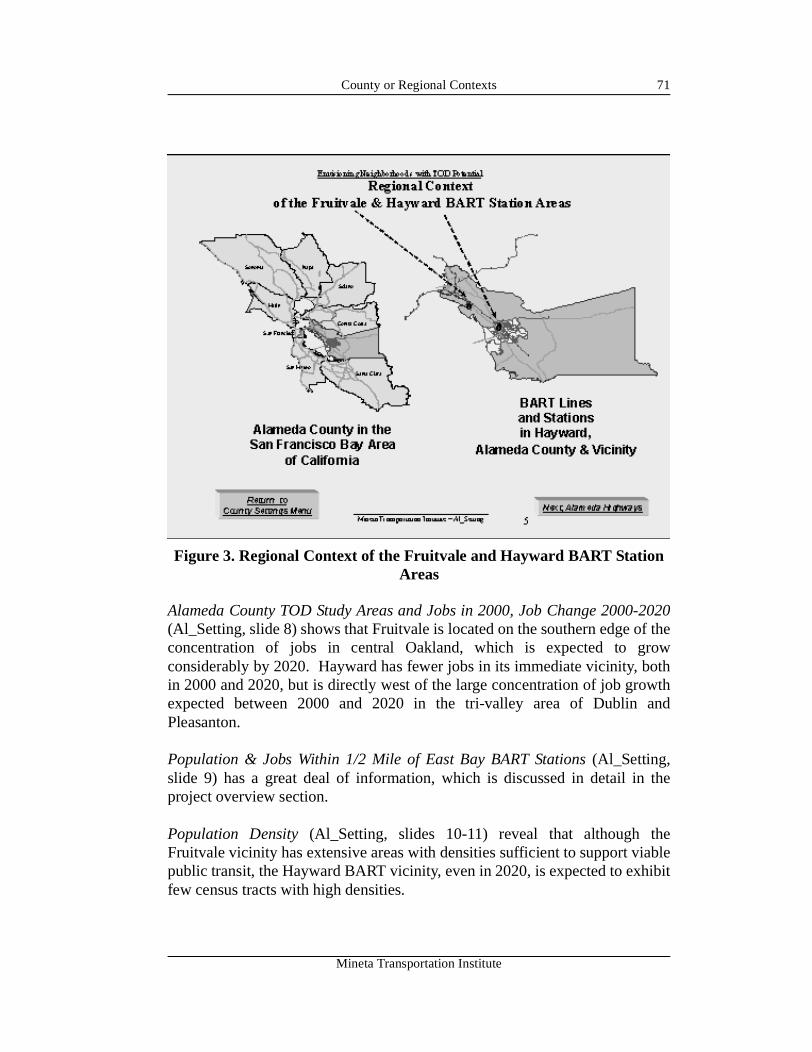
County or Regional Contexts 71
Alameda County TOD Study Areas and Jobs in 2000, Job Change 2000-2020(Al_Setting, slide 8) shows that Fruitvale is located on the southern edge of theconcentration of jobs in central Oakland, which is expected to growconsiderably by 2020. Hayward has fewer jobs in its immediate vicinity, bothin 2000 and 2020, but is directly west of the large concentration of job growthexpected between 2000 and 2020 in the tri-valley area of Dublin andPleasanton.
Population & Jobs Within 1/2 Mile of East Bay BART Stations (Al_Setting,slide 9) has a great deal of information, which is discussed in detail in theproject overview section.
Population Density (Al_Setting, slides 10-11) reveal that although theFruitvale vicinity has extensive areas with densities sufficient to support viablepublic transit, the Hayward BART vicinity, even in 2020, is expected to exhibitfew census tracts with high densities.
Figure 3. Regional Context of the Fruitvale and Hayward BART Station Areas
Mineta Transportation Institute
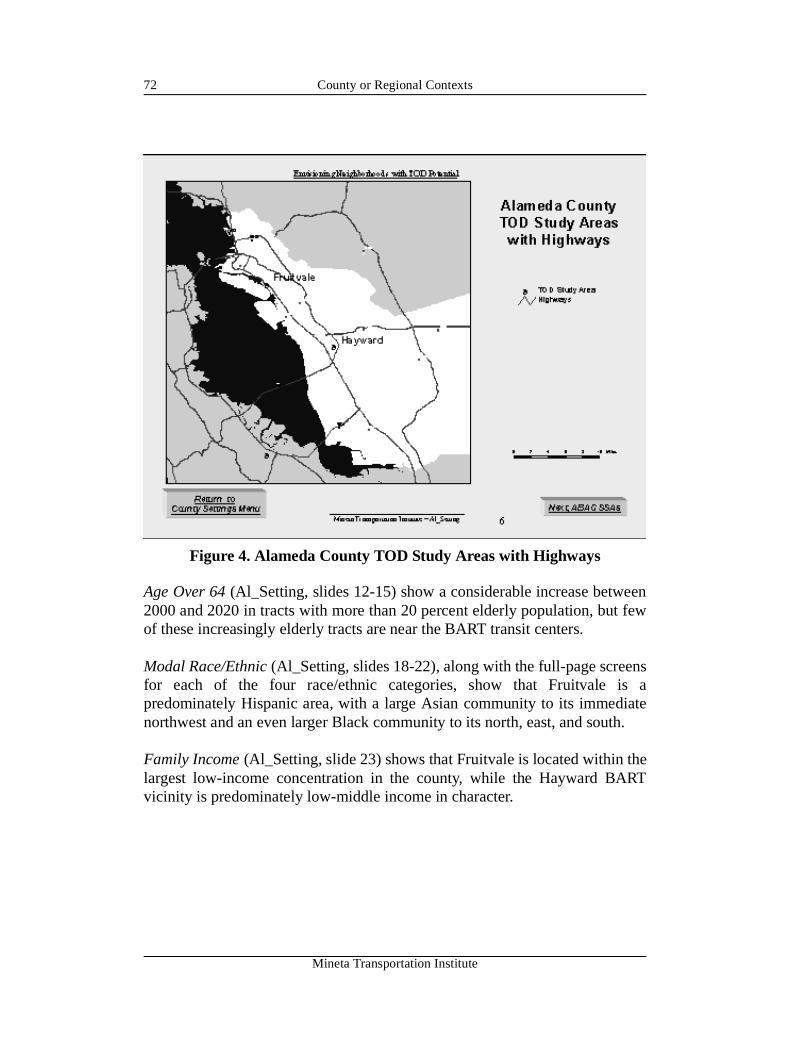
County or Regional Contexts72
Age Over 64 (Al_Setting, slides 12-15) show a considerable increase between2000 and 2020 in tracts with more than 20 percent elderly population, but fewof these increasingly elderly tracts are near the BART transit centers.
Modal Race/Ethnic (Al_Setting, slides 18-22), along with the full-page screensfor each of the four race/ethnic categories, show that Fruitvale is apredominately Hispanic area, with a large Asian community to its immediatenorthwest and an even larger Black community to its north, east, and south.
Family Income (Al_Setting, slide 23) shows that Fruitvale is located within thelargest low-income concentration in the county, while the Hayward BARTvicinity is predominately low-middle income in character.
Figure 4. Alameda County TOD Study Areas with Highways
Mineta Transportation Institute
Envisioning the Quality of Life and Context for Development in Neighborhoods with TOD Potential 73
APPENDIX A: ENVISIONING THE QUALITY OF LIFE AND CONTEXT FOR DEVELOPMENT IN
NEIGHBORHOODS WITH TRANSIT-ORIENTED DEVELOPMENT POTENTIAL
ABSTRACT
The digital information revolution had provided an incredibly rich set of digitaltools and data that can be utilized for envisioning quality of life in cities. Weargue that quality of life (QOL) is a distinctly personal measure for eachperson, reflecting his or her values and culture, nested in a set of spatialrelationships starting with home-related facilities that help satisfy residentialneeds, and include a hierarchy of neighborhood communities.
We suggest that QOL studies for persons and development sites should explorethe context of their locations, looking at data for blocks, using a variety ofneighborhood definitions in a regional setting.
This paper takes a second look at using digital tools and data to understandneighborhood conditions explored in ICQOLOC I by Bossard, this timeutilizing data tools and sources not readily available only two years ago.
Digital tools explored include increasingly powerful computer hardware,digital cameras and camcorders, global positioning systems (GPS) and robustsoftware to transform and model urban data. Digital data readily available onthe Internet and CD-ROM now includes ortho photos, topographic maps,census data, school data, crime data, real estate listings and publictransportation route maps and schedules.
The Envisioning Neighborhoods Technique (Bossard, 1998) is used for a casestudy evaluating the quality of life and context for development inneighborhoods with transit-oriented development potential. Detailed sets ofmultiple maps, charts and photos present neighborhood conditions, withquantitative aspects shown by multiple maps and charts, and qualitativeaspects highlighted in photos, videos and digital ortho photos.
Mineta Transportation Institute
Envisioning the Quality of Life and Context for Development in Neighborhoods with TOD Potential74
INTRODUCTION
America is undergoing an urban renaissance, with considerable interest inimproving quality of life within its cities. This urban renaissance isaccompanied by support within many areas for reconsideration of urbangrowth patterns and policies, paying increased attention to the diversity ofresidential lifestyle preferences.
The “new urbanism,” “smart growth” and “sustainable communities” arenames for movements developing in the USA reflecting one residentiallifestyle preference which has been neglected under policies which promotedstandardized, automobile-oriented, suburban housing tracts (Katz; Van der Rynand Calthorpe). A key aspect of the New Urbanism movements is interest inintegrating public transportation systems with well-planned, livablecommunity developments having sufficient densities to support publictransportation systems. Transit-Oriented Development (TOD) is the expressionincreasingly used to describe land use development specifically designed totake advantage of close proximity to good public transit.
TODs are distinguished from other urban settings by what Bernick andCervero call the 3-Ds of density, diversity and design.
Density means “...having enough residents and workers within a reasonablewalking distance of transit stations to generate ridership.” Diversity implies“...a mixture of land uses, housing types, and ways of circulating...within theTOD area.” Design includes “...physical features and site layouts that areconductive to walking, biking, and transit riding” (Bernick and Cervero, p. 73).
Although transit-oriented development has been advocated in the U.S. foryears (Bernick and Cervero, Ch.1), it has yet to realize its full potential. TheEnvisioning Neighborhoods with Transit-Oriented Development project hasbeen undertaken at San José State University under the sponsorship of theMineta Transportation Institute to develop techniques for regional planningagencies, local governments and developers to screen, analyze, select andpromote areas with TOD potential. In order to facilitate TOD site selection,socioeconomic, demographic, land use, transportation, design and otherquality of life measures must all be considered in a spatial setting.
Mineta Transportation Institute
Envisioning the Quality of Life and Context for Development in Neighborhoods with TOD Potential 75
APPROPRIATE SCALES FOR STUDYING URBAN QOL
What is the appropriate scale for studying urban QOL? While the QOLNETInternational website points out that there is presently no general agreement onthe definition of quality of life, it suggest that nascent urban QOL studies havebeen generally carried out on the personal and city level (http://www.qolnet.nus.edu.sg/what.html).
We suggest that quality of life is ultimately a distinctly personal measure foreach person, reflecting his or her values and culture, nested in a set of spatialrelationships. These spatial relationships begin with a person's home, reachingout to home-related facilities that help satisfy residential needs, and include anested hierarchy of neighborhood communities which may encompass school,shopping, recreation and service functions (see S. Brower, chapter 2,“Neighborhood Settings,” for an elaboration of these concepts.)
Personal quality of life may also be a function of the way in which differentelements of various neighborhood communities are mixed together in space.Kevin Lynch uses a concept called grain to categorize spatial mixes (Lynch, p.265).
The grain of a mix is fine when like elements, or small clusters of them, suchas members of the same economic or ethnic group, are widely dispersed amonga variety of different economic or ethnic groups, and coarse when extensiveareas of the same group are segregated from extensive areas of other groups. Agrain is sharp when the transition from a cluster of like groups to its unlikeneighbors is abrupt, and blurred if the transition is gradual. For Lynch, grain issimply a way of making explicit a spatial feature of cities which is oftendiscussed and is variously referred to by such words as segregation,integration, diversity, purity, land-use mix or clustering. “In its many forms,grain is critical to the goodness of a place.” (Lynch, p. 266).
Therefore QOL can be a function of the social, ethnic and economic mix inneighborhood areas as compared to their contextual surroundings. As personalQOL preferences for grain coarseness and sharpness may be quite varied, it isdesirable to make available grain-related QOL information in a variety offorms, with aggregate census tract and block group data in maps, charts, andtables used to determine coarseness and census block data used to estimatefineness.
Mineta Transportation Institute
Envisioning the Quality of Life and Context for Development in Neighborhoods with TOD Potential76
If QOL is a personal measure, but depends on a hierarchy of facilitiesencompassing one’s residence, and various definitions of neighborhood, aswell as the grain, or spatial mix of groups or elements one interacts with, thento understand QOL we must understand the spatial settings of urbancomponents, starting with the smallest possible components (people,households, blocks, etc.) and moving out to encompass larger units such asclusters of blocks and other various conceptions of neighborhoods. KeithDevlin, in InfoSense—Turning Information into Knowledge, condenses hisadvice into one golden rule: context matters (Devlin, p. 201). This applies tourban QOL analysis in that spatial context is a very important component,especially in urban settings.
While the digital/communications revolution (W. Mitchell) has created vastamounts of personal and household data, this data is generally not uniformlyavailable to researchers and is scattered among survey research firms, geo-marketers, utilities, real estate assessment officials and a wide variety of semi-autonomous public service providers and websites.
Therefore in the USA we usually start urban QOL analysis with readilyaccessible decennial census data, which provides more than 2,000 pieces ofdata for block group areas averaging 1,000 persons, and the same detailedinformation for census tracts averaging 4,000 persons, as well as for towns,cities, counties and states (Meyers).
While we would like to use as much personal data for individuals orhouseholds as possible, in many cases we are forced to use data for larger arealunits, either block groups, census tracts or even cities. This may entail seriousproblems, identified by quantitative geographers as the modifiable areal unitproblem (MAUP) (Wrigley, et. al., p. 23; Openshaw, chapter 4).
Social scientists see this as a manifestation of what they call the ecologicalfallacy. The ecological fallacy involves the inappropriate inference ofindividual-level relationships from areal-unit-level results. It arises, typically,when areal-unit data are the only source available to the researcher, but theobjects of study are individual-level characteristics and relationships. Routineanalysis of census area data in the formulation of policy responses toindividual household-level sociological/medical problems of deprivation,deviance, morbidity, etc., is fraught with considerable ecological fallacy risksand must be viewed as highly suspect (Wrigley, et. al., p. 30).
Mineta Transportation Institute
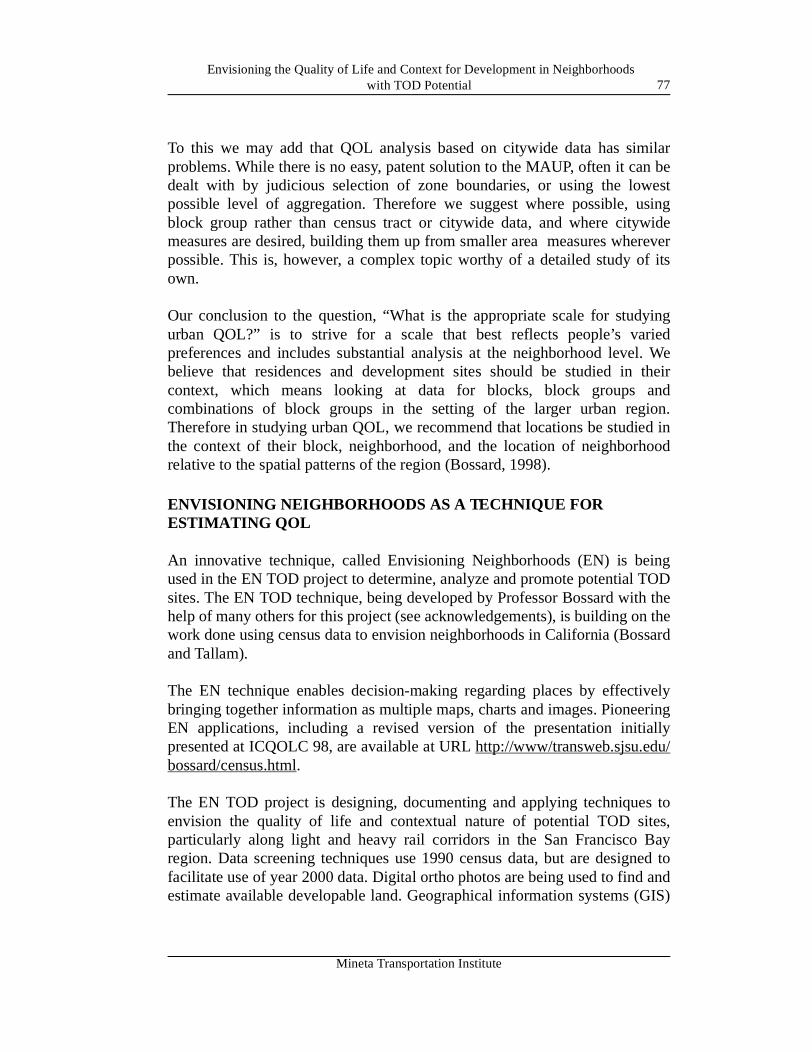
Envisioning the Quality of Life and Context for Development in Neighborhoods with TOD Potential 77
To this we may add that QOL analysis based on citywide data has similarproblems. While there is no easy, patent solution to the MAUP, often it can bedealt with by judicious selection of zone boundaries, or using the lowestpossible level of aggregation. Therefore we suggest where possible, usingblock group rather than census tract or citywide data, and where citywidemeasures are desired, building them up from smaller area measures whereverpossible. This is, however, a complex topic worthy of a detailed study of itsown.
Our conclusion to the question, “What is the appropriate scale for studyingurban QOL?” is to strive for a scale that best reflects people’s variedpreferences and includes substantial analysis at the neighborhood level. Webelieve that residences and development sites should be studied in theircontext, which means looking at data for blocks, block groups andcombinations of block groups in the setting of the larger urban region.Therefore in studying urban QOL, we recommend that locations be studied inthe context of their block, neighborhood, and the location of neighborhoodrelative to the spatial patterns of the region (Bossard, 1998).
ENVISIONING NEIGHBORHOODS AS A TECHNIQUE FOR ESTIMATING QOL
An innovative technique, called Envisioning Neighborhoods (EN) is beingused in the EN TOD project to determine, analyze and promote potential TODsites. The EN TOD technique, being developed by Professor Bossard with thehelp of many others for this project (see acknowledgements), is building on thework done using census data to envision neighborhoods in California (Bossardand Tallam).
The EN technique enables decision-making regarding places by effectivelybringing together information as multiple maps, charts and images. PioneeringEN applications, including a revised version of the presentation initiallypresented at ICQOLC 98, are available at URL http://www/transweb.sjsu.edu/bossard/census.html.
The EN TOD project is designing, documenting and applying techniques toenvision the quality of life and contextual nature of potential TOD sites,particularly along light and heavy rail corridors in the San Francisco Bayregion. Data screening techniques use 1990 census data, but are designed tofacilitate use of year 2000 data. Digital ortho photos are being used to find andestimate available developable land. Geographical information systems (GIS)
Mineta Transportation Institute
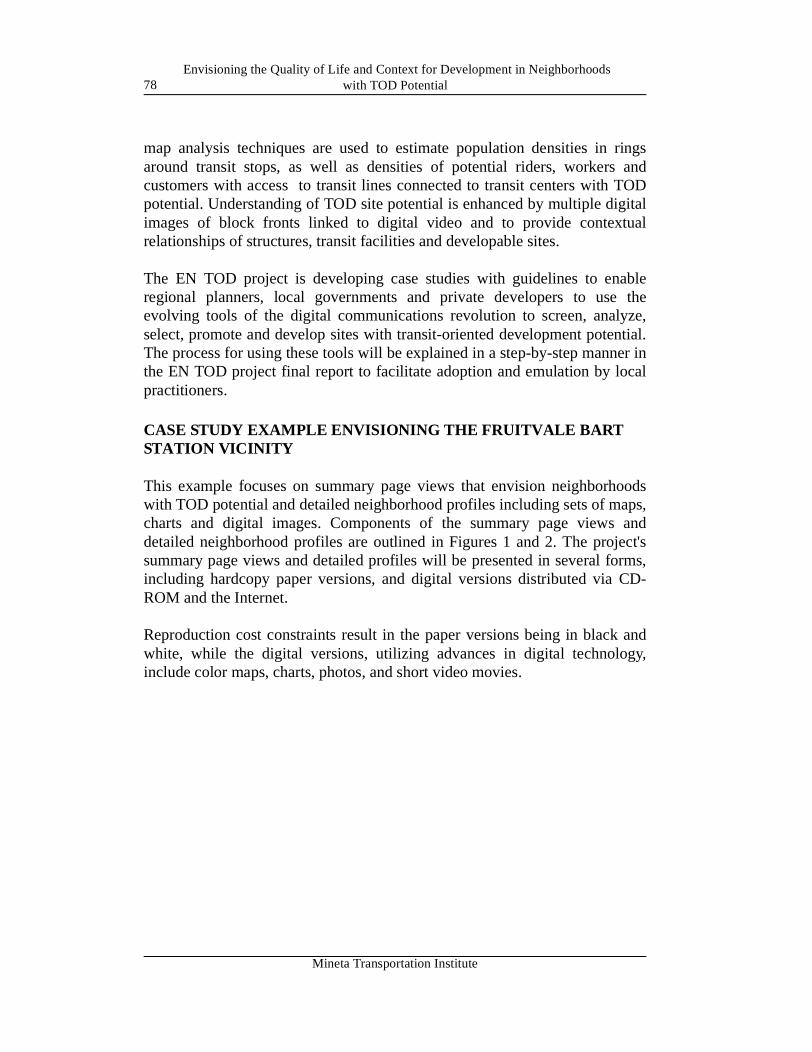
Envisioning the Quality of Life and Context for Development in Neighborhoods with TOD Potential78
map analysis techniques are used to estimate population densities in ringsaround transit stops, as well as densities of potential riders, workers andcustomers with access to transit lines connected to transit centers with TODpotential. Understanding of TOD site potential is enhanced by multiple digitalimages of block fronts linked to digital video and to provide contextualrelationships of structures, transit facilities and developable sites.
The EN TOD project is developing case studies with guidelines to enableregional planners, local governments and private developers to use theevolving tools of the digital communications revolution to screen, analyze,select, promote and develop sites with transit-oriented development potential.The process for using these tools will be explained in a step-by-step manner inthe EN TOD project final report to facilitate adoption and emulation by localpractitioners.
CASE STUDY EXAMPLE ENVISIONING THE FRUITVALE BART STATION VICINITY
This example focuses on summary page views that envision neighborhoodswith TOD potential and detailed neighborhood profiles including sets of maps,charts and digital images. Components of the summary page views anddetailed neighborhood profiles are outlined in Figures 1 and 2. The project'ssummary page views and detailed profiles will be presented in several forms,including hardcopy paper versions, and digital versions distributed via CD-ROM and the Internet.
Reproduction cost constraints result in the paper versions being in black andwhite, while the digital versions, utilizing advances in digital technology,include color maps, charts, photos, and short video movies.
Mineta Transportation Institute
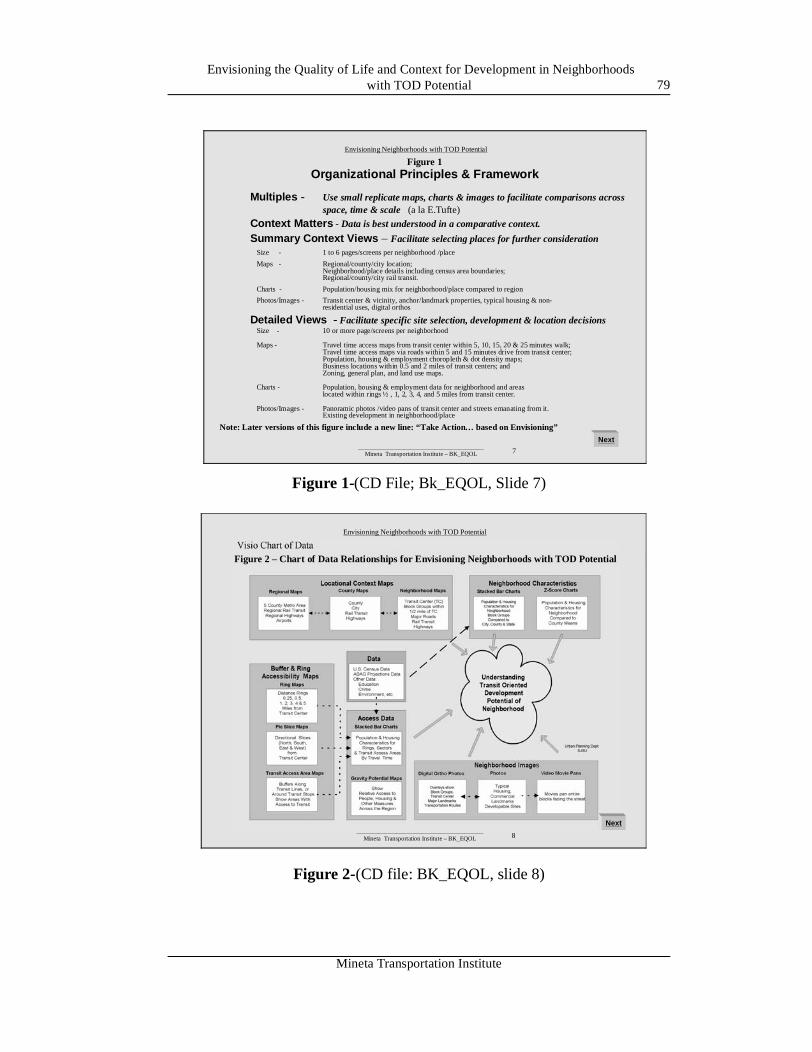
Envisioning the Quality of Life and Context for Development in Neighborhoods with TOD Potential 79
Figure 1-(CD File; Bk_EQOL, Slide 7)
Figure 2-(CD file: BK_EQOL, slide 8)
_________________________________________Mineta Transportation Institute – BK_EQOL 7
Envisioning Neighborhoods with TOD Potential
Multiples - Use small replicate maps, charts & images to facilitate comparisons across space, time & scale (a la E.Tufte)
Context Matters - Data is best understood in a comparative context.
Summary Context Views – Facilitate selecting places for further considerationSize - 1 to 6 pages/screens per neighborhood /place
Maps - Regional/county/city location; Neighborhood/place details including census area boundaries; Regional/county/city rail transit.
Charts - Population/housing mix for neighborhood/place compared to region
Photos/Images - Transit center & vicinity, anchor/landmark properties, typical housing & non-residential uses, digital orthos
Detailed Views - Facilitate specific site selection, development & location decisionsSize - 10 or more page/screens per neighborhood
Maps - Travel time access maps from transit center within 5, 10, 15, 20 & 25 minutes walk;Travel time access maps via roads within 5 and 15 minutes drive from transit center;Population, housing & employment choropleth & dot density maps; Business locations within 0.5 and 2 miles of transit centers; andZoning, general plan, and land use maps.
Charts - Population, housing & employment data for neighborhood and areaslocated within rings ½ , 1, 2, 3, 4, and 5 miles from transit center.
Photos/Images - Panoramic photos /video pans of transit center and streets emanating from it.Existing development in neighborhood/place
Organizational Principles & FrameworkFigure 1
Note: Later versions of this figure include a new line: “Take Action… based on Envisioning”Next
_________________________________________Mineta Transportation Institute – BK_EQOL 8
Envisioning Neighborhoods with TOD Potential
Figure 2 – Chart of Data Relationships for Envisioning Neighborhoods with TOD Potential
Next
Mineta Transportation Institute
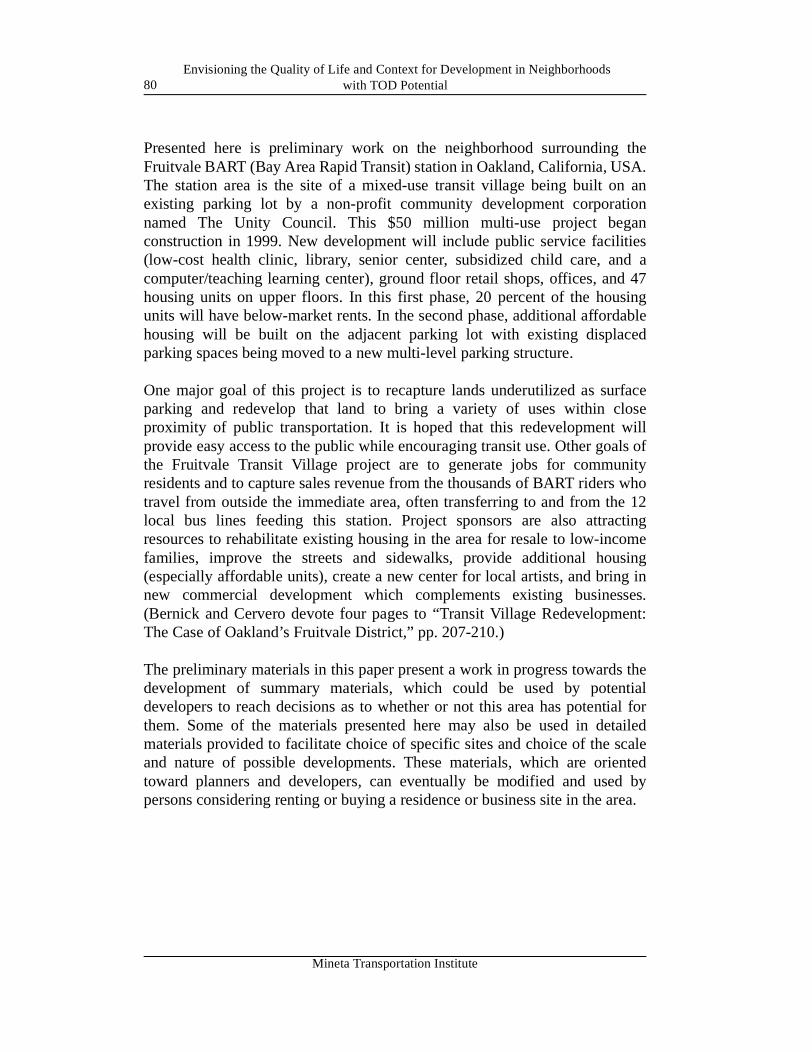
Envisioning the Quality of Life and Context for Development in Neighborhoods with TOD Potential80
Presented here is preliminary work on the neighborhood surrounding theFruitvale BART (Bay Area Rapid Transit) station in Oakland, California, USA.The station area is the site of a mixed-use transit village being built on anexisting parking lot by a non-profit community development corporationnamed The Unity Council. This $50 million multi-use project beganconstruction in 1999. New development will include public service facilities(low-cost health clinic, library, senior center, subsidized child care, and acomputer/teaching learning center), ground floor retail shops, offices, and 47housing units on upper floors. In this first phase, 20 percent of the housingunits will have below-market rents. In the second phase, additional affordablehousing will be built on the adjacent parking lot with existing displacedparking spaces being moved to a new multi-level parking structure.
One major goal of this project is to recapture lands underutilized as surfaceparking and redevelop that land to bring a variety of uses within closeproximity of public transportation. It is hoped that this redevelopment willprovide easy access to the public while encouraging transit use. Other goals ofthe Fruitvale Transit Village project are to generate jobs for communityresidents and to capture sales revenue from the thousands of BART riders whotravel from outside the immediate area, often transferring to and from the 12local bus lines feeding this station. Project sponsors are also attractingresources to rehabilitate existing housing in the area for resale to low-incomefamilies, improve the streets and sidewalks, provide additional housing(especially affordable units), create a new center for local artists, and bring innew commercial development which complements existing businesses.(Bernick and Cervero devote four pages to “Transit Village Redevelopment:The Case of Oakland’s Fruitvale District,” pp. 207-210.)
The preliminary materials in this paper present a work in progress towards thedevelopment of summary materials, which could be used by potentialdevelopers to reach decisions as to whether or not this area has potential forthem. Some of the materials presented here may also be used in detailedmaterials provided to facilitate choice of specific sites and choice of the scaleand nature of possible developments. These materials, which are orientedtoward planners and developers, can eventually be modified and used bypersons considering renting or buying a residence or business site in the area.
Mineta Transportation Institute
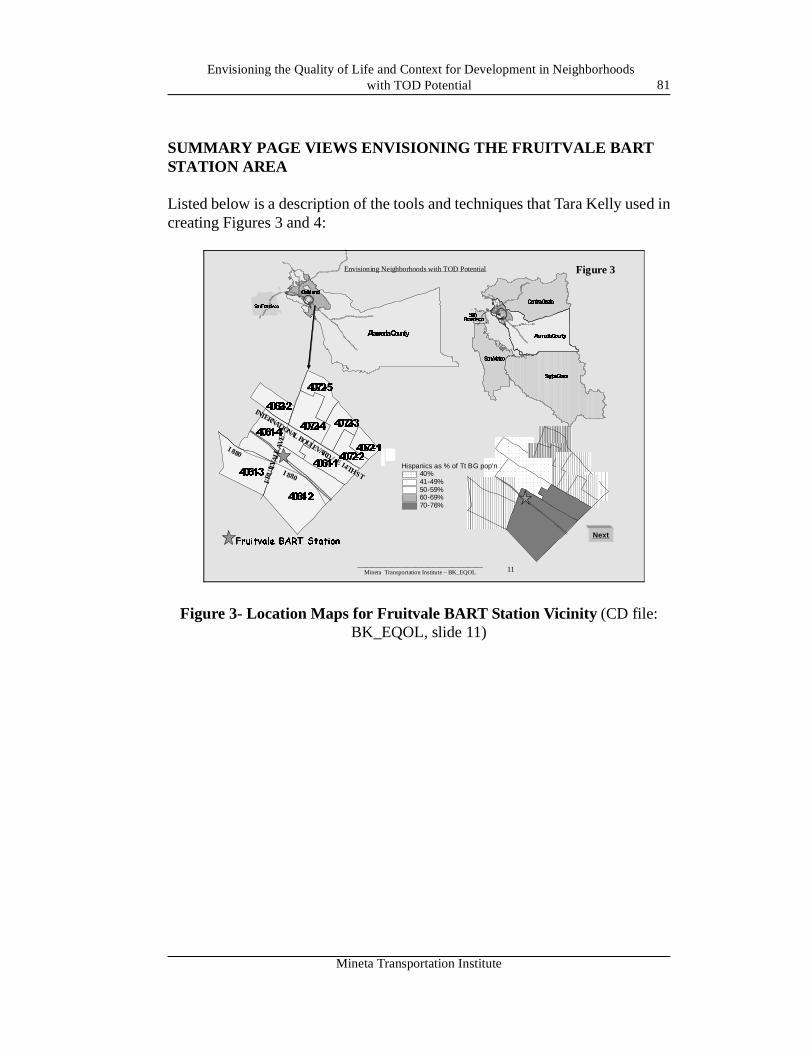
Envisioning the Quality of Life and Context for Development in Neighborhoods with TOD Potential 81
SUMMARY PAGE VIEWS ENVISIONING THE FRUITVALE BART STATION AREA
Listed below is a description of the tools and techniques that Tara Kelly used increating Figures 3 and 4:
Figure 3- Location Maps for Fruitvale BART Station Vicinity (CD file: BK_EQOL, slide 11)
_________________________________________Mineta Transportation Institute – BK_EQOL 11
Envisioning Neighborhoods with TOD Potential
SanFrancisco
AlamedaCounty
Oakland
Hispanics as % of Tt BG pop'n40%41-49%50-59%60-69%70-76%
SanMateo
SantaClara
AlamedaCounty
ContraCosta
SanFrancisco
Fruitvale BART Station
4072-5
4072-3
4072-14072-2
4061-1
4061-2
4061-3
4061-4
4062-2
4072-4
I880
INTERNATIONAL BOULEVARD/E14THST
FRU
ITVA
LEAV
E
I880
Figure 3
Next
Mineta Transportation Institute
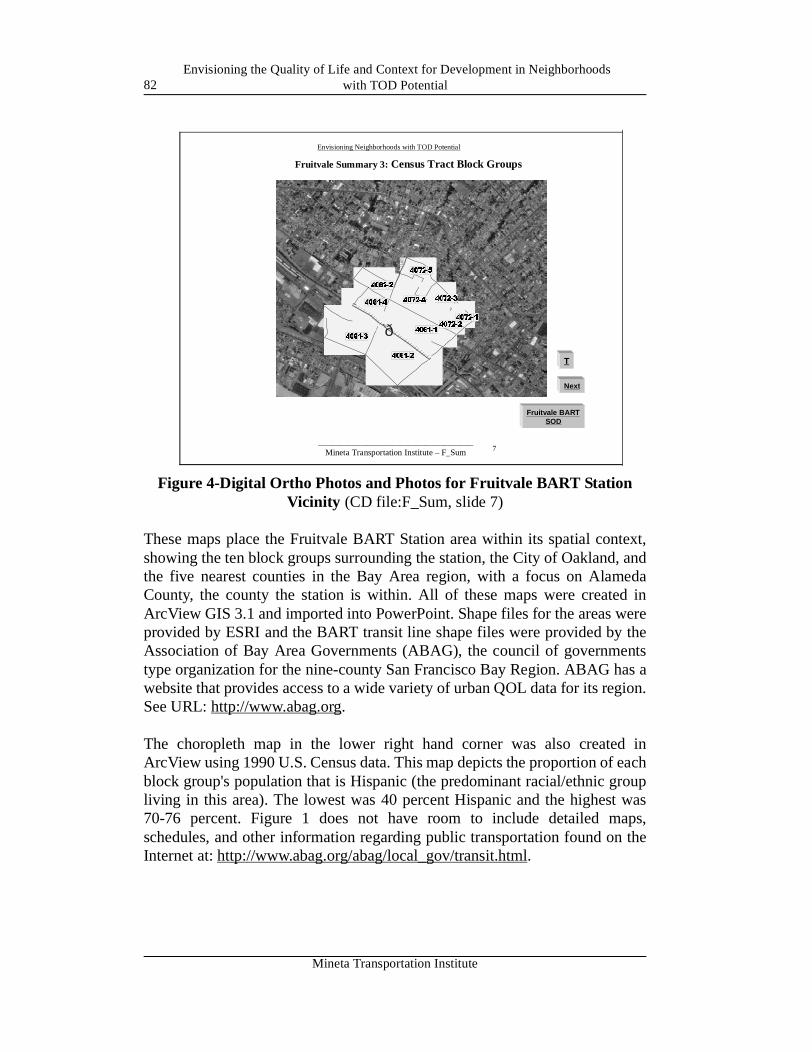
Envisioning the Quality of Life and Context for Development in Neighborhoods with TOD Potential82
Figure 4-Digital Ortho Photos and Photos for Fruitvale BART Station Vicinity (CD file:F_Sum, slide 7)
These maps place the Fruitvale BART Station area within its spatial context,showing the ten block groups surrounding the station, the City of Oakland, andthe five nearest counties in the Bay Area region, with a focus on AlamedaCounty, the county the station is within. All of these maps were created inArcView GIS 3.1 and imported into PowerPoint. Shape files for the areas wereprovided by ESRI and the BART transit line shape files were provided by theAssociation of Bay Area Governments (ABAG), the council of governmentstype organization for the nine-county San Francisco Bay Region. ABAG has awebsite that provides access to a wide variety of urban QOL data for its region.See URL: http://www.abag.org.
The choropleth map in the lower right hand corner was also created inArcView using 1990 U.S. Census data. This map depicts the proportion of eachblock group's population that is Hispanic (the predominant racial/ethnic groupliving in this area). The lowest was 40 percent Hispanic and the highest was70-76 percent. Figure 1 does not have room to include detailed maps,schedules, and other information regarding public transportation found on theInternet at: http://www.abag.org/abag/local_gov/transit.html.
____________________________________Mineta Transportation Institute – F_Sum 7
Envisioning Neighborhoods with TOD Potential
Foothill Boulevard
International Boulevard 4072-5
4072-3
4072-1
4072-24061-1
4061-2
4061-3
4061-4
4062-2
4072-4
ð
Fru
it val
eAv
enue
Fruitvale Summary 3: Census Tract Block Groups
Fruitvale BARTSOD
T
Next
Mineta Transportation Institute
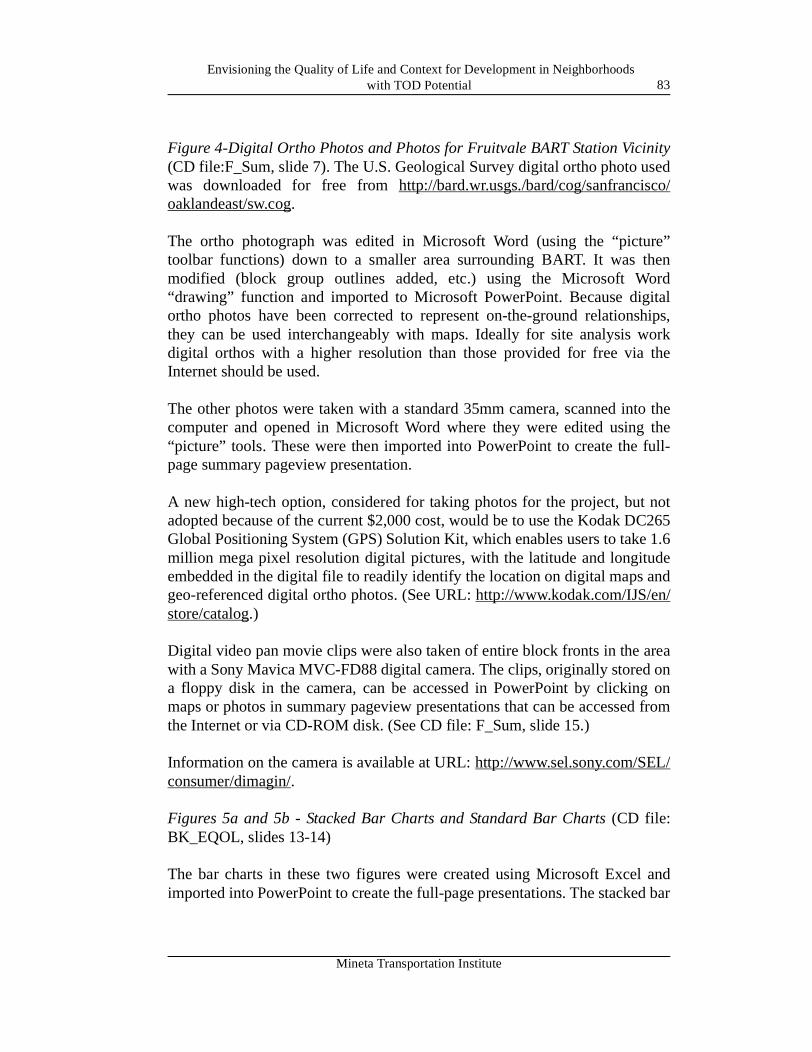
Envisioning the Quality of Life and Context for Development in Neighborhoods with TOD Potential 83
Figure 4-Digital Ortho Photos and Photos for Fruitvale BART Station Vicinity(CD file:F_Sum, slide 7). The U.S. Geological Survey digital ortho photo usedwas downloaded for free from http://bard.wr.usgs./bard/cog/sanfrancisco/oaklandeast/sw.cog.
The ortho photograph was edited in Microsoft Word (using the “picture”toolbar functions) down to a smaller area surrounding BART. It was thenmodified (block group outlines added, etc.) using the Microsoft Word“drawing” function and imported to Microsoft PowerPoint. Because digitalortho photos have been corrected to represent on-the-ground relationships,they can be used interchangeably with maps. Ideally for site analysis workdigital orthos with a higher resolution than those provided for free via theInternet should be used.
The other photos were taken with a standard 35mm camera, scanned into thecomputer and opened in Microsoft Word where they were edited using the“picture” tools. These were then imported into PowerPoint to create the full-page summary pageview presentation.
A new high-tech option, considered for taking photos for the project, but notadopted because of the current $2,000 cost, would be to use the Kodak DC265Global Positioning System (GPS) Solution Kit, which enables users to take 1.6million mega pixel resolution digital pictures, with the latitude and longitudeembedded in the digital file to readily identify the location on digital maps andgeo-referenced digital ortho photos. (See URL: http://www.kodak.com/IJS/en/store/catalog.)
Digital video pan movie clips were also taken of entire block fronts in the areawith a Sony Mavica MVC-FD88 digital camera. The clips, originally stored ona floppy disk in the camera, can be accessed in PowerPoint by clicking onmaps or photos in summary pageview presentations that can be accessed fromthe Internet or via CD-ROM disk. (See CD file: F_Sum, slide 15.)
Information on the camera is available at URL: http://www.sel.sony.com/SEL/consumer/dimagin/.
Figures 5a and 5b - Stacked Bar Charts and Standard Bar Charts (CD file:BK_EQOL, slides 13-14)
The bar charts in these two figures were created using Microsoft Excel andimported into PowerPoint to create the full-page presentations. The stacked bar
Mineta Transportation Institute
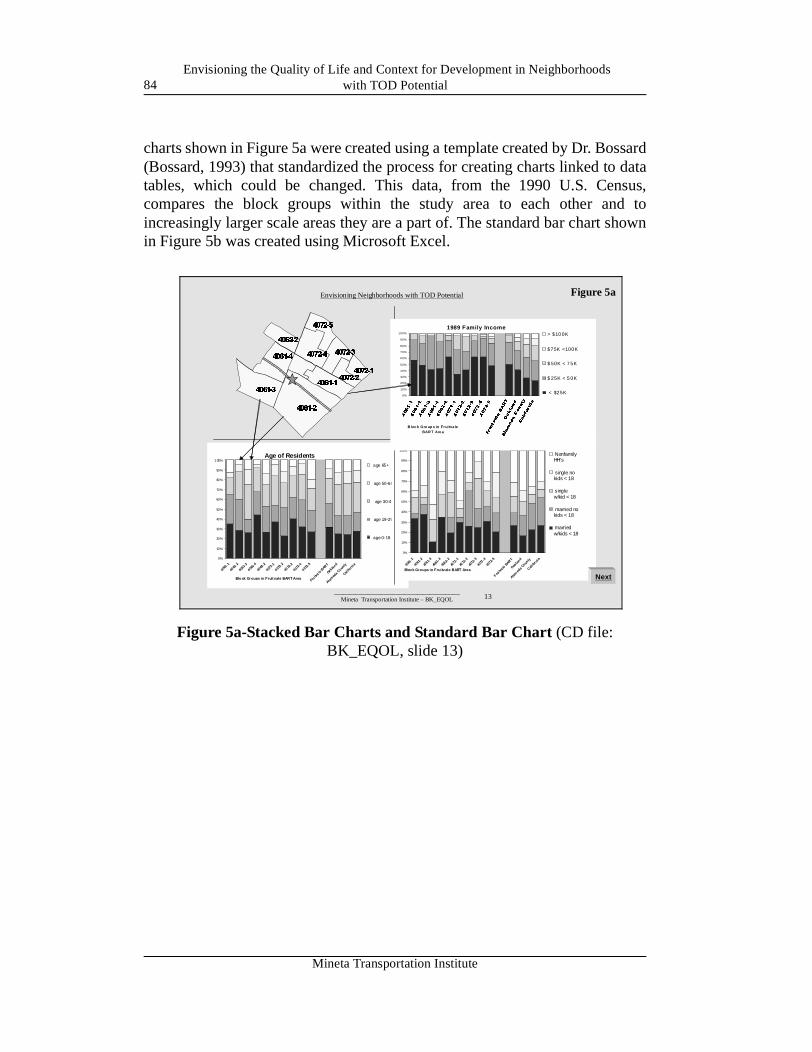
Envisioning the Quality of Life and Context for Development in Neighborhoods with TOD Potential84
charts shown in Figure 5a were created using a template created by Dr. Bossard(Bossard, 1993) that standardized the process for creating charts linked to datatables, which could be changed. This data, from the 1990 U.S. Census,compares the block groups within the study area to each other and toincreasingly larger scale areas they are a part of. The standard bar chart shownin Figure 5b was created using Microsoft Excel.
Figure 5a-Stacked Bar Charts and Standard Bar Chart (CD file: BK_EQOL, slide 13)
_________________________________________Mineta Transportation Institute – BK_EQOL 13
Envisioning Neighborhoods with TOD Potential
Age of Residents
0%
10%
20%
30%
40%
50%
60%
70%
80%
90%
100%
4061
-1
4061
-2
4061-3
4061-
4
4062
-2
4072-1
4072-
2
4072
-3
4072-4
4072-
5
Frui tv
ale BART
Oakland
Alam
eda C
ounty
Califo
rnia
age 65+
age 50-64
age 30-49
age 19-29
age 0-18
Blo ck Groups in Fruitvale BART Area
Family Types
0%
10%
20%
30%
40%
50%
60%
70%
80%
90%
100%
4061
-1
4061
-2
4061-
3
4061
-4
4062-
2
4072
-1
4072
-2
4072
-3
4072
-4
4072
-5
F ruitva
le B
ART
Oaklan
d
Alamed
a Coun
ty
Califor
nia
NonfamilyHH's
single nokids < 18
singlew/kid < 18
married nokids < 18
marriedw/kids < 18
Block Groups in Fruitvale BART Area
1989 Family Income
0%
10%
20%
30%
40%
50%
60%
70%
80%
90%
100%
4061-1
4061-2
4061-3
4061-4
4062-2
4072-1
4072-2
4072-3
4072-4
4072-5
Fruitvale BART
Oakland
Alameda County
California
> $10 0K
$75K <100K
$ 50K < 7 5K
$ 25K < 5 0K
< $25K
B lock Gro up s in Fruitva le BAR T Area
4072-5
4072-3
4072-1
4072-24061-1
4061-2
4061-3
4061-4
4062-2
4072-4
Figure 5a
Next
Mineta Transportation Institute
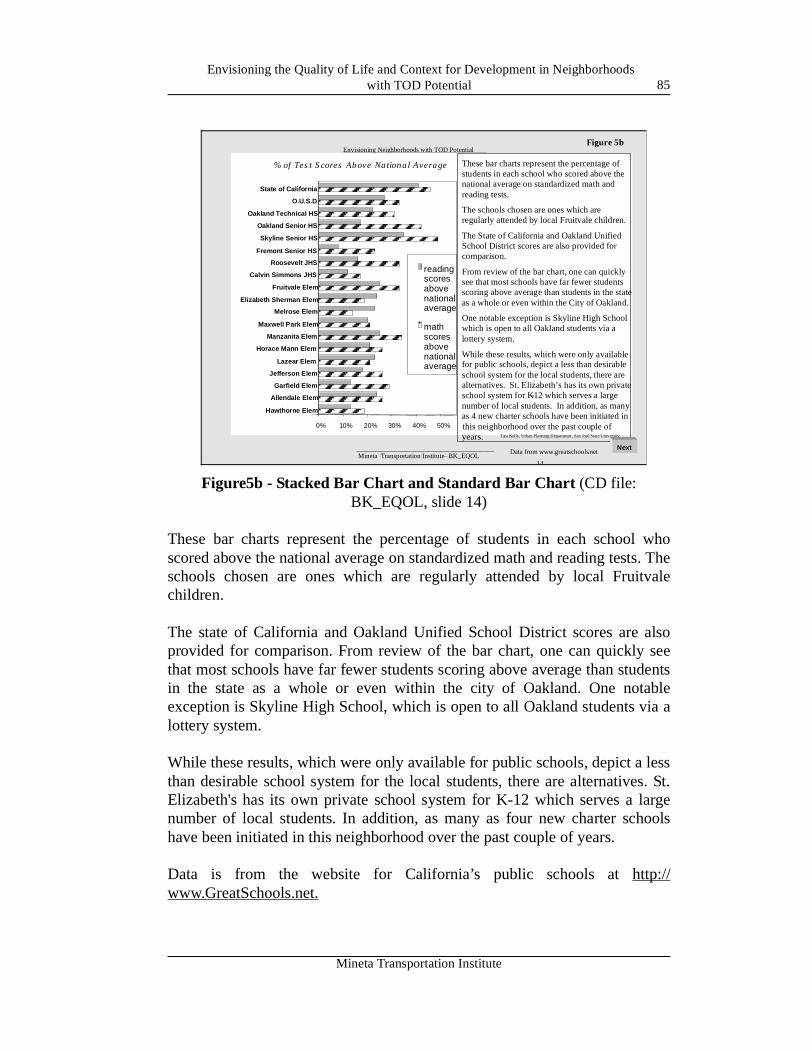
Envisioning the Quality of Life and Context for Development in Neighborhoods with TOD Potential 85
Figure5b - Stacked Bar Chart and Standard Bar Chart (CD file: BK_EQOL, slide 14)
These bar charts represent the percentage of students in each school whoscored above the national average on standardized math and reading tests. Theschools chosen are ones which are regularly attended by local Fruitvalechildren.
The state of California and Oakland Unified School District scores are alsoprovided for comparison. From review of the bar chart, one can quickly seethat most schools have far fewer students scoring above average than studentsin the state as a whole or even within the city of Oakland. One notableexception is Skyline High School, which is open to all Oakland students via alottery system.
While these results, which were only available for public schools, depict a lessthan desirable school system for the local students, there are alternatives. St.Elizabeth's has its own private school system for K-12 which serves a largenumber of local students. In addition, as many as four new charter schoolshave been initiated in this neighborhood over the past couple of years.
Data is from the website for California’s public schools at http://www.GreatSchools.net.
_________________________________________ Mineta Transportation Institute– BK_EQOL
14
Envisioning Neighborhoods with TOD Potential
% of Test Scores Above National Average
0% 10% 20% 30% 40% 50%
Hawthorne Elem
Allendale Elem
Garfield Elem
Jefferson Elem
Lazear Elem
Horace Mann Elem
Manzanita Elem
Maxwell Park Elem
Melrose Elem
Elizabeth Sherman Elem
Fruitvale Elem
Calvin Simmons JHS
Roosevelt JHS
Fremont Senior HS
Skyline Senior HS
Oakland Senior HS
Oakland Technical HS
O.U.S.D
State of California
readingscoresabovenationalaverage
mathscoresabovenationalaverage
Tara Kelly, Urban Planning Department, San José State University
These bar charts represent the percentage ofstudents in each school who scored above thenational average on standardized math andreading tests.
The schools chosen are ones which areregularly attended by local Fruitvale children.
The State of California and Oakland UnifiedSchool District scores are also provided forcomparison.
From review of the bar chart, one can quicklysee that most schools have far fewer studentsscoring above average than students in the stateas a whole or even within the City of Oakland.
One notable exception is Skyline High Schoolwhich is open to all Oakland students via alottery system.
While these results, which were only availablefor public schools, depict a less than desirableschool system for the local students, there arealternatives. St. Elizabeth’s has its own privateschool system for K-12 which serves a largenumber of local students. In addition, as manyas 4 new charter schools have been initiated in
this neighborhood over the past couple ofyears.
Data from www. greatschools .net
Figure 5b
Next
Mineta Transportation Institute
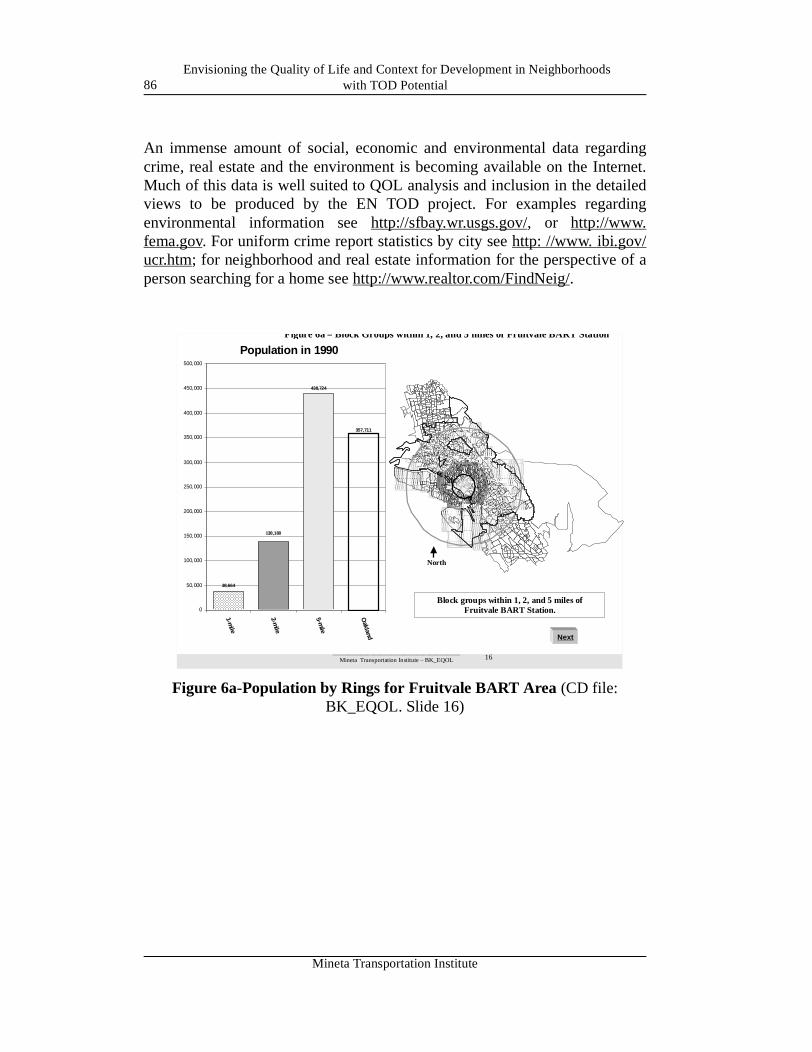
Envisioning the Quality of Life and Context for Development in Neighborhoods with TOD Potential86
An immense amount of social, economic and environmental data regardingcrime, real estate and the environment is becoming available on the Internet.Much of this data is well suited to QOL analysis and inclusion in the detailedviews to be produced by the EN TOD project. For examples regardingenvironmental information see http://sfbay.wr.usgs.gov/, or http://www.fema.gov. For uniform crime report statistics by city see http: //www. ibi.gov/ucr.htm; for neighborhood and real estate information for the perspective of aperson searching for a home see http://www.realtor.com/FindNeig/.
Figure 6a-Population by Rings for Fruitvale BART Area (CD file: BK_EQOL. Slide 16)
_________________________________________Mineta Transportation Institute – BK_EQOL 16
Envisioning Neighborhoods with TOD Potential
#
Block groups within 1, 2, and 5 miles of Fruitvale BART Station.
Population in 1990
38,664
438,724
357,711
138,180
0
50,000
100,000
150,000
200,000
250,000
300,000
350,000
400,000
450,000
500,000
1-mile
2-mile
5-mile
Oakland
North
Figure 6a – Block Groups within 1, 2, and 5 miles of Fruitvale BART Station
Next
Mineta Transportation Institute
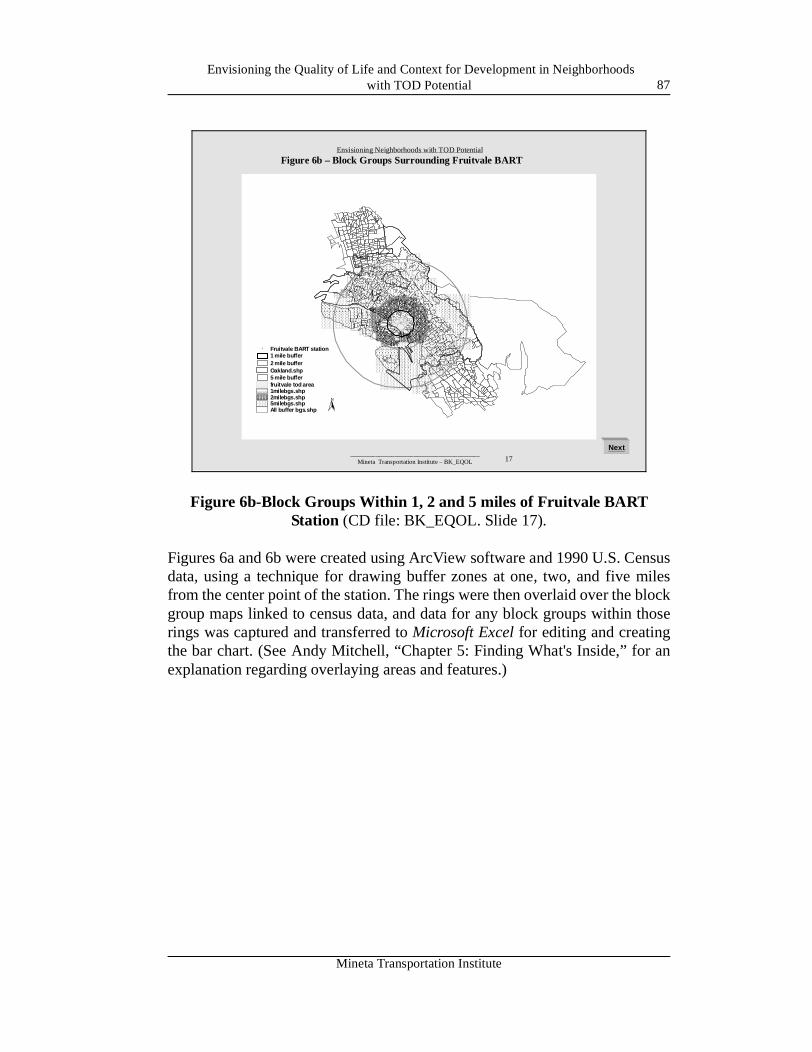
Envisioning the Quality of Life and Context for Development in Neighborhoods with TOD Potential 87
Figure 6b-Block Groups Within 1, 2 and 5 miles of Fruitvale BART Station (CD file: BK_EQOL. Slide 17).
Figures 6a and 6b were created using ArcView software and 1990 U.S. Censusdata, using a technique for drawing buffer zones at one, two, and five milesfrom the center point of the station. The rings were then overlaid over the blockgroup maps linked to census data, and data for any block groups within thoserings was captured and transferred to Microsoft Excel for editing and creatingthe bar chart. (See Andy Mitchell, “Chapter 5: Finding What's Inside,” for anexplanation regarding overlaying areas and features.)
_________________________________________Mineta Transportation Institute – BK_EQOL 17
Envisioning Neighborhoods with TOD Potential
#
All buffer bgs.shp5milebgs.shp2milebgs.shp1milebgs.shpfruitvale tod area5 mile bufferOakland.shp2 mile buffer1 mile buffer
# Fruitvale BART station
N
Figure 6b – Block Groups Surrounding Fruitvale BART
Next
Mineta Transportation Institute
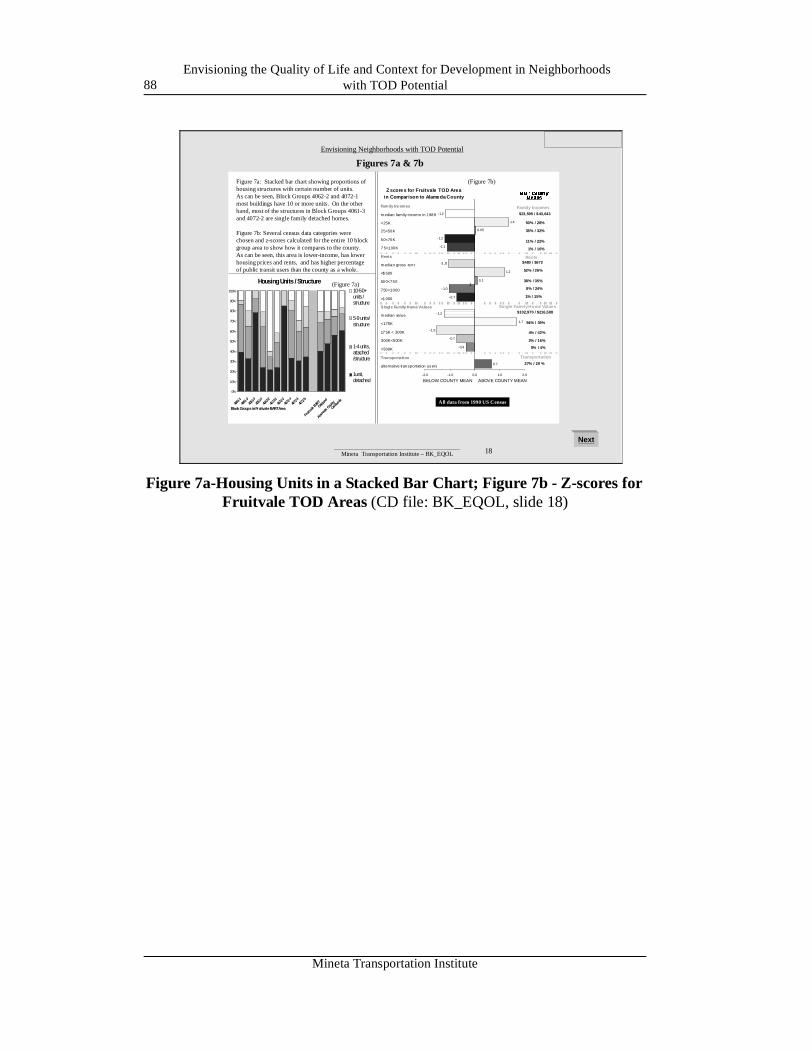
Envisioning the Quality of Life and Context for Development in Neighborhoods with TOD Potential88
Figure 7a-Housing Units in a Stacked Bar Chart; Figure 7b - Z-scores for Fruitvale TOD Areas (CD file: BK_EQOL, slide 18)
_________________________________________Mineta Transportation Institute – BK_EQOL 18
Envisioning Neighborhoods with TOD Potential
BELOW COUNTY MEAN ABOVE COUNTY MEAN
Z score s for Fruitvale TOD Area in Comparison to Alameda County
0.7
-0.4
-0.7
-1.5
-1.2
-0.7
-1.0
0.1
1.2
-1.0
-1.1
-1.2
0.05
1.4
-1.2
1.7
-2.0 -1.0 0.0 1.0 2.0
1
Family Incomes
m edian family incom e in 1989
<25K
25<50K
50<75K
7 5<100K
Rents
m edian gross rent
<$ 500
50 0<750
750<1000
>1 000
S ingle Fa mily Home Values
m edian value
<175K
17 5K < 300K
300K<500K
>500K
Transportation
al ternative tran sportation us ers
All data from 1990 US Census
Housing Units / Structure
0%
10%
20%
30%
40%
50%
60%
70%
80%
90%
100%
4061-1
4061-2
4061-3
4061-4
4062-2
4072-1
4072-2
4072-3
4072-4
4072-5
Fruitv
ale B
ARTOak
land
Alamed
a Cou
nty
Califo
rnia
10-50+units /structure
5-9 units/structure
1-4 units,attached/structure
1unit,detached
Block Groups in Fruitvale BART Area
Single Family Home Values
$23,595 / $43,643
BG / CountyMeans
50% / 28%
35% / 32%
11% / 22%
1% / 10%
$480 / $672
52% / 26%
38% / 35%
8% / 24%
1% / 15%
$102,970 / $216,588
94% / 39%
4% / 42%
2% / 16%
0% / 4%
27% / 20 %
Transportation
Rents
Family Incomes
Figure 7a: Stacked bar chart showing proportions of housing structures with certain number of units. As can be seen, Block Groups 4062-2 and 4072-1most buildings have 10 or more units. On the other hand, most of the structures in Block Groups 4061-3 and 4072-2 are single family detached homes.
Figure 7b: Several census data categories were chosen and z-scores calculated for the entire 10 block group area to show how it compares to the county. As can be seen, this area is lower-income, has lower housing prices and rents, and has higher percentage of public transit users than the county as a whole.
(Figure 7a)
(Figure 7b)
Figures 7a & 7b
Next
Mineta Transportation Institute
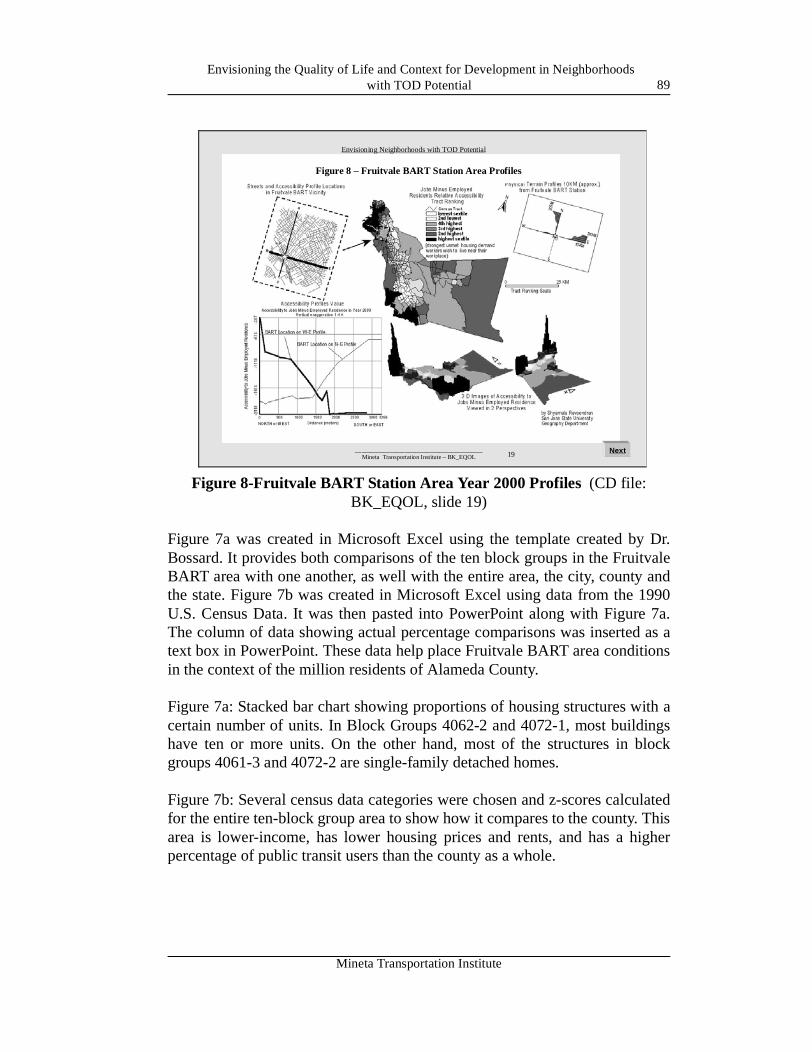
Envisioning the Quality of Life and Context for Development in Neighborhoods with TOD Potential 89
Figure 8-Fruitvale BART Station Area Year 2000 Profiles (CD file: BK_EQOL, slide 19)
Figure 7a was created in Microsoft Excel using the template created by Dr.Bossard. It provides both comparisons of the ten block groups in the FruitvaleBART area with one another, as well with the entire area, the city, county andthe state. Figure 7b was created in Microsoft Excel using data from the 1990U.S. Census Data. It was then pasted into PowerPoint along with Figure 7a.The column of data showing actual percentage comparisons was inserted as atext box in PowerPoint. These data help place Fruitvale BART area conditionsin the context of the million residents of Alameda County.
Figure 7a: Stacked bar chart showing proportions of housing structures with acertain number of units. In Block Groups 4062-2 and 4072-1, most buildingshave ten or more units. On the other hand, most of the structures in blockgroups 4061-3 and 4072-2 are single-family detached homes.
Figure 7b: Several census data categories were chosen and z-scores calculatedfor the entire ten-block group area to show how it compares to the county. Thisarea is lower-income, has lower housing prices and rents, and has a higherpercentage of public transit users than the county as a whole.
_________________________________________Mineta Transportation Institute – BK_EQOL 19
Envisioning Neighborhoods with TOD Potential
Figure 8 – Fruitvale BART Station Area Profiles
Next
Mineta Transportation Institute
Envisioning the Quality of Life and Context for Development in Neighborhoods with TOD Potential90
Listed below is a description of the innovative tools and techniques thatShyamala Raveendran considered or used in creating Figure 8. Her goal is todemonstrate how a variety of 3-D visualization tools can be used to understandactual and theoretical spatial patterns.
The Accessibility to Jobs Minus Employed Residence 2000 map is based on agravity spatial interaction model (Bossard, 1998) showing the relative accessin the entire county to the difference between the number of workers workingand the number of workers living in census tracts. This measure provides aninnovative estimate of the relative access to housing demand, where housingdemand is based on good access to one’s workplace. According to thismeasure, the darker the areas on the map, the stronger the housing demand.This map was done using ArcView 3. 1.
The “Streets and Accessibility@ Profile Locations...” street map, also donewith ArcView, shows the location of the Fruitvale BART Station, the streets inits vicinity, and the location of North-South and East-West profiles which werecut through the “3-D Images of Accessibility” described below.
The 3D “Accessibility to JNER2000” maps were done with ArcView - 3DAnalyst Extension. The respective 2D themes were converted to 3D themes byusing “Accessibility to JUER2000” attribute values as the z-value (height).The maps were then viewed in the “3D Scene” dialogue. Next, they werepositioned to a desired perspective. The perspective was then exported as aJPEG image file-hence the image as seen on the layout. These 3-D imagesshow the high potential strength of housing demand in the downtown Oaklandarea northwest of the station.
The 3D N-S and E-W profiles of Accessibility to Jobs Minus EmployedResidents 2000, shown in the bottom left comer of Figure 8, were also donewith ArcView-3D Analyst. First, a line was drawn on the 3D thematic map in a“View.” Next, the “Profile Line” tool sketched a “Visibility Profile” line graphof the map in a “Layout.” These profiles indicate that housing demand is likelyto be stronger going north or east from the station area, rather than south orwest.
The Physical Terrain Profiles from the Fruitvale BART station, shown in theupper right corner of Figure 8, present profiles of the actual physical terrainwithin 10 kilometers of the station. These profiles were done using U.S.Geological Survey topographic maps using the TOPO! Version 1.0, a low-costsoftware used by hikers and bicyclists to plan trips.
Mineta Transportation Institute
Envisioning the Quality of Life and Context for Development in Neighborhoods with TOD Potential 91
The profile images exported from TOPO! were rotated, mirrored, and scaledusing mainly Paint Shop Pro 4.00.
Finally, all images and maps were brought into a “Layout” in ArcView.
CONCLUSION
Many communities in the USA are grappling with the notion of how best tomeet the desires of their residents whose personal quality of life reflects thesustainable communities movement, which seeks to establish areas that arelivable and walkable, and accessible to a great many services andconveniences. Given the factors outlined above, often the ideal setting is alocation within close proximity of public transit in an urban setting.
As planning officials, developers and others strive to meet the demand forsustainable communities, they need to equip themselves with the tools to selectsites that make sense within their spatial context. The EnvisioningNeighborhoods-Transit-Oriented Development (EN TOD) technique, with itsmyriad methods for analyzing and presenting data in a spatial context, is onesuch tool.
ACKNOWLEDGMENTS
Acknowledgment is given for support provided by the Mineta TransportationInstitute at San José State University, the California Department ofTransportation, and U.S. Department of Transportation for this work.
Appreciation is given for contributions to this project by team members StevenColman, Dayana Salazar, Richard Taketa, Antony R. Jayaprakash, Erin Mayer,Tran V. Tung, and Pin-Yuan Wang, as well as to SJSU Open University studentShyamala Raveendran.
REFERENCES
Included in main report's references.
Mineta Transportation Institute

Envisioning the Quality of Life and Context for Development in Neighborhoods with TOD Potential92
Mineta Transportation Institute
History of Transit-Oriented Development 93
APPENDIX B: HISTORY OF TRANSIT-ORIENTED DEVELOPMENT
Brett Hondorp
For the PowerPoint presentation, see CD-ROM file TOD_History.
DEFINITION OF TRANSIT-ORIENTED DEVELOPMENT
Much has been written about transit-oriented development (TOD) in recentyears, and a number of research efforts have provided detailed evaluations ofsuccessful TOD projects in such diverse locations as the San Francisco BayArea, Washington, D.C., Atlanta, and San Diego. In the literature, TODprojects are referred to by a variety of names, including transit-focuseddevelopment, transit-based development, transit-supportive development, ortransit villages. The definition of TOD varies, depending on the researcher.According to Bernick and Cervero, who prefer the term “transit village,” TODconsists of a “compact, mixed-use community, centered around a transit stationthat, by design, invites residents, workers, and shoppers to drive their cars lessand ride mass transit more.”1 Lefaver describes TOD somewhat broadly as“higher density residential or mixed-use developments built alongtransportation corridors…i.e., rail and major bus lines as well as freeways.”2
Porter limits TOD to development “generally within a half a mile of rail transitstations.”3 This project focuses on TOD near rail or light rail stations.
BRIEF HISTORY OF TRANSIT-ORIENTED DEVELOPMENT
The first transit-oriented development projects in the United States were therailroad and streetcar suburbs of the late 19th and early 20th centuries. Theearliest commuter rail lines were powered by steam engines that could achievehigh sustained speeds efficiently but were slow to accelerate and decelerate,and thus promoted the development of stations that were several miles apart.4
In New York City, for example, three commuter railroads—the Hudson RiverRailroad, Harlem River Valley Railroad, and Long Island Sound Railroad—helped channel population expansion from the five boroughs to outlyingsuburban townships.5 Although more common in large East Coast cities, asteam-powered commuter rail service existed in the San Francisco Bay Area inthe late 19th century. The San Francisco–San Jose railway began service alongthe peninsula in 1864 and led to the development of commuter suburbs such as
Mineta Transportation Institute
History of Transit-Oriented Development94
Burlingame, Redwood City, and San Mateo.6 Today, CalTrain follows thiscorridor.
Electric street railways were developed in the late 1880s. Electric streetcarspicked up their power from an overhead electrical line (using a “trolley” pole),and used the running rail as a ground.7 Although electric streetcars could notachieve the top speeds of the steam engines, they were cleaner and quieter, andcould start and stop more efficiently, making them useful for interurban as wellas commuter service. Construction of electric railway systems typically wasprivately funded, as developers built rail lines to outlying areas and used therailways to promote their real estate holdings. The first electric streetcarsystem was the Pacific Electric Railway in Southern California, which at itspeak, served 50 communities with 1,164 miles of track and 270 trains a day.8 Inthe San Francisco Bay Area, the San Francisco, Oakland & San Jose Railway,more commonly known as the Key System, had developed a vast network oflines in the East Bay by the turn of the century. The extension of the KeySystem lines into previously undeveloped areas of Berkeley-Oakland Hills ledto the rapid settlement of new townships such as Piedmont.9
By the early 1900s, electric streetcar systems had emerged in cities throughoutthe United States, replacing horse-drawn or cable-pulled systems. According toMiddleton, “…more than any other development, the electric streetcarscontributed to the growth of America’s suburbs.”10 Population growthfollowed car lines as middle class households sought to escape crowded, dirty,noisy inner-city living. The success of the early streetcar suburbs wasdependent on pedestrian access to transit for connection to downtown jobs andneighborhood services. Typical features of these early transit neighborhoodsincluded a transit depot and public space in the center of the neighborhood,small cottage-type houses, and a street pattern and scale that allowedconvenient walking distances to transit.11
MAJOR ELEMENTS OF TRANSIT-ORIENTED DEVELOPMENT
Transit-oriented development projects should, at the very least, encourage theuse of public transit by locating residential, commercial, or office uses, or acombination of all three, close to a transit node. However, successful TODinvolves more than simply placing a transit stop in a residential neighborhoodor a business park, or building a mixed-use TOD development next to a transithub. Transit-oriented development should not only provide transportationoptions but also improve the “livability” of communities and neighborhoods,while successfully being integrated into the economic pattern of the area. TOD
Mineta Transportation Institute
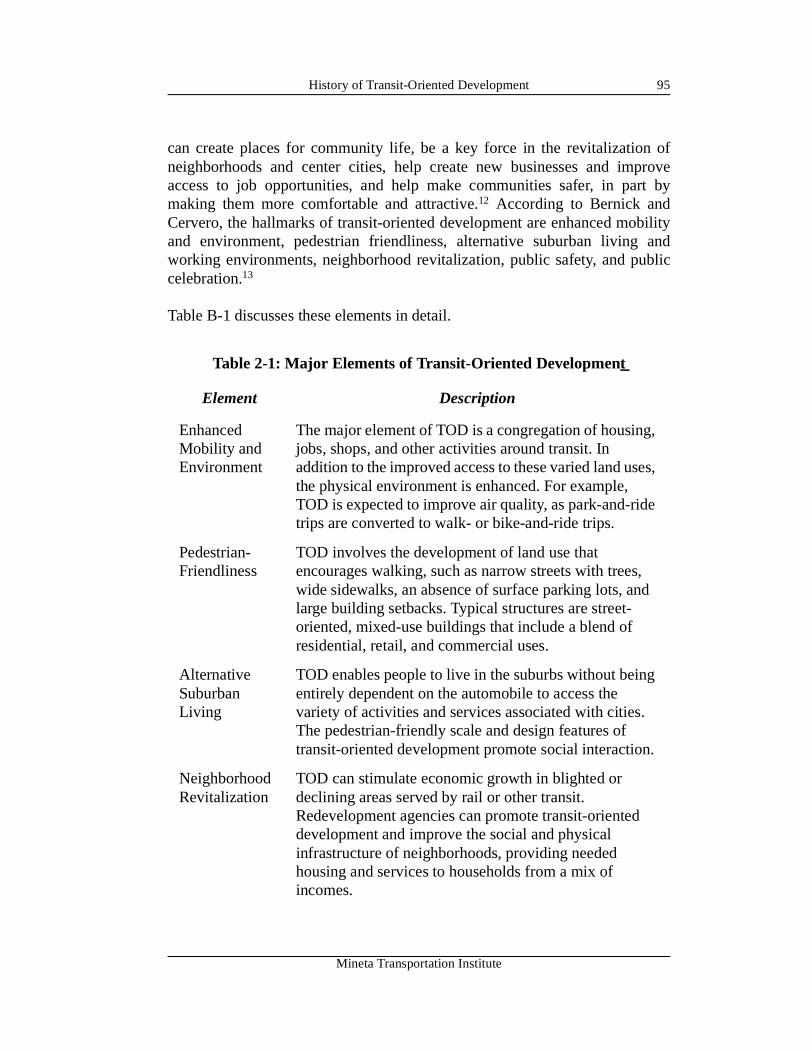
History of Transit-Oriented Development 95
can create places for community life, be a key force in the revitalization ofneighborhoods and center cities, help create new businesses and improveaccess to job opportunities, and help make communities safer, in part bymaking them more comfortable and attractive.12 According to Bernick andCervero, the hallmarks of transit-oriented development are enhanced mobilityand environment, pedestrian friendliness, alternative suburban living andworking environments, neighborhood revitalization, public safety, and publiccelebration.13
Table B-1 discusses these elements in detail.
Table 2-1: Major Elements of Transit-Oriented Development
Element Description
Enhanced Mobility and Environment
The major element of TOD is a congregation of housing, jobs, shops, and other activities around transit. In addition to the improved access to these varied land uses, the physical environment is enhanced. For example, TOD is expected to improve air quality, as park-and-ride trips are converted to walk- or bike-and-ride trips.
Pedestrian-Friendliness
TOD involves the development of land use that encourages walking, such as narrow streets with trees, wide sidewalks, an absence of surface parking lots, and large building setbacks. Typical structures are street-oriented, mixed-use buildings that include a blend of residential, retail, and commercial uses.
Alternative Suburban Living
TOD enables people to live in the suburbs without being entirely dependent on the automobile to access the variety of activities and services associated with cities. The pedestrian-friendly scale and design features of transit-oriented development promote social interaction.
Neighborhood Revitalization
TOD can stimulate economic growth in blighted or declining areas served by rail or other transit. Redevelopment agencies can promote transit-oriented development and improve the social and physical infrastructure of neighborhoods, providing needed housing and services to households from a mix of incomes.
Mineta Transportation Institute
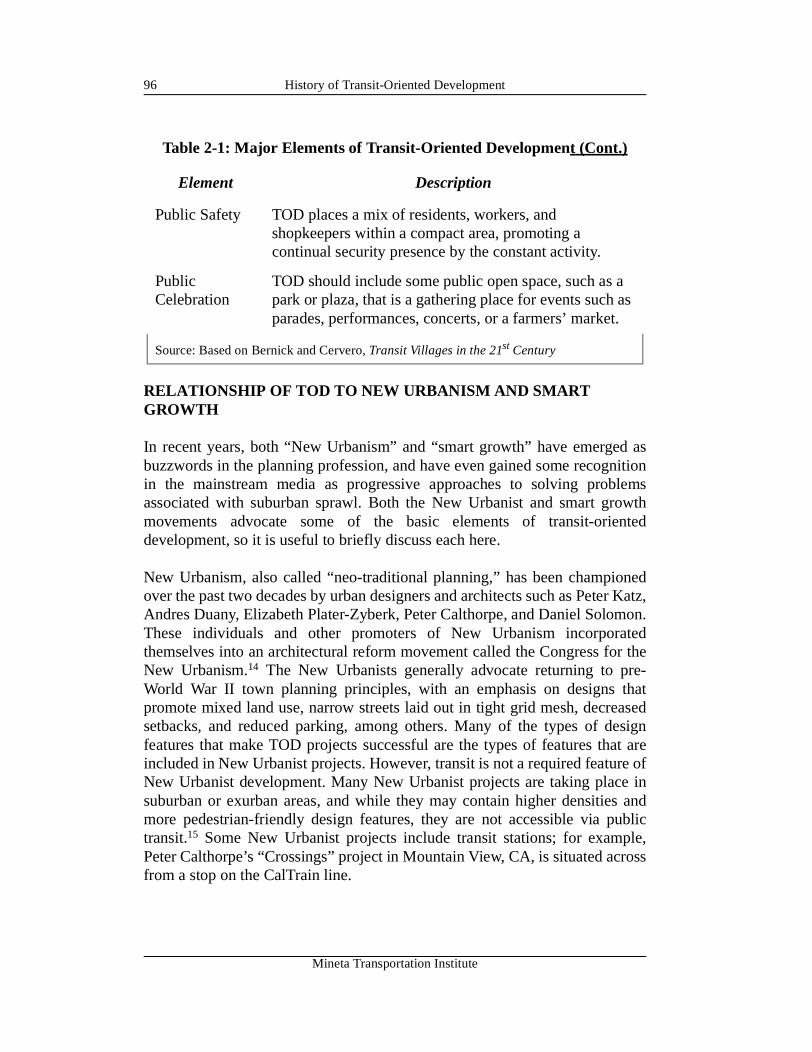
History of Transit-Oriented Development96
RELATIONSHIP OF TOD TO NEW URBANISM AND SMART GROWTH
In recent years, both “New Urbanism” and “smart growth” have emerged asbuzzwords in the planning profession, and have even gained some recognitionin the mainstream media as progressive approaches to solving problemsassociated with suburban sprawl. Both the New Urbanist and smart growthmovements advocate some of the basic elements of transit-orienteddevelopment, so it is useful to briefly discuss each here.
New Urbanism, also called “neo-traditional planning,” has been championedover the past two decades by urban designers and architects such as Peter Katz,Andres Duany, Elizabeth Plater-Zyberk, Peter Calthorpe, and Daniel Solomon.These individuals and other promoters of New Urbanism incorporatedthemselves into an architectural reform movement called the Congress for theNew Urbanism.14 The New Urbanists generally advocate returning to pre-World War II town planning principles, with an emphasis on designs thatpromote mixed land use, narrow streets laid out in tight grid mesh, decreasedsetbacks, and reduced parking, among others. Many of the types of designfeatures that make TOD projects successful are the types of features that areincluded in New Urbanist projects. However, transit is not a required feature ofNew Urbanist development. Many New Urbanist projects are taking place insuburban or exurban areas, and while they may contain higher densities andmore pedestrian-friendly design features, they are not accessible via publictransit.15 Some New Urbanist projects include transit stations; for example,Peter Calthorpe’s “Crossings” project in Mountain View, CA, is situated acrossfrom a stop on the CalTrain line.
Public Safety TOD places a mix of residents, workers, and shopkeepers within a compact area, promoting a continual security presence by the constant activity.
Public Celebration
TOD should include some public open space, such as a park or plaza, that is a gathering place for events such as parades, performances, concerts, or a farmers’ market.
Source: Based on Bernick and Cervero, Transit Villages in the 21st Century
Table 2-1: Major Elements of Transit-Oriented Development (Cont.)
Element Description
Mineta Transportation Institute
History of Transit-Oriented Development 97
Smart growth is a somewhat broader and more mainstream movement thatdraws on many of the principles of New Urbanism. There is no singledefinition of smart growth, but the common thread is development thatrevitalizes central cities and older suburbs, supports and enhances publictransit, and preserves open spaces and agricultural lands.16 The underlyingpremise is that much of the United States’ post-World War II suburbandevelopment, with its strict separation of land used, low densities, and heavyauto dependency, has contributed to such problems as increased trafficcongestion, loss of farmland, and the decline of traditional downtown areas.Smart growth generally calls for higher-density, transit-oriented development,with an emphasis on providing a balanced mix of housing, jobs, and shoppingopportunities within a community. The “Ahwahnee Principles,” which areoften cited as the basic tenents of smart growth, contain many of the elementsof successful transit-oriented development. (The New Urbanist architectsnoted earlier were instrumental in convening the conference at which theAhwahnee Principles were drawn up.) Key Ahwahnee principles (from theLocal Government Commission, Center for Livable Communities Web site)that relate to transit-oriented development are as follows:
• Community size should be designed so that housing, jobs, daily needs, andother activities are within easy walking distance of each other.
• As many activities as possible should be located within easy walkingdistance of transit stops.
• The location and character of the community should be consistent with alarger transit network.
• Streets, pedestrian paths, and bike paths should contribute to a system offully connected and interesting routes to all destinations. Their designshould encourage pedestrian and bicycle use by being small and spatiallydefined by buildings, trees, and lighting, and by discouraging high-speedtraffic.
• The regional land-use planning structure should be integrated within alarger transportation network built around transit rather than freeways.
SPECIFIC FEATURES OF TRANSIT-ORIENTED DEVELOPMENT
Design Features
In general, transit-oriented development should promote walking and transitriding and discourage automobile use. A common theme of TODs is to create
Mineta Transportation Institute
History of Transit-Oriented Development98
places that have design features such as landscaped sidewalks, parking in therear, and retail streetwalls that make walking and transit riding more enjoyable.Some commonly accepted TOD design features, as set forth by Bernick andCervero, are as follows:17
• Continuous and direct physical linkages between major activity centers;siting of buildings and complementary uses to minimize distances to transitstops.
• Streetwalls of ground-floor retail, and varied building heights, textures, andfacades, that enhance the walking experience; siting commercial buildingsnear the edge of sidewalks.
• Integration of major commercial centers with the transit facility.
• Gridlike street patterns that allow many origins and destinations to beconnected by foot; avoiding cul-de-sacs, serpentine streets, and othercurvilinear arrangements that create circuitous walks and force buses tomeander or retrace their paths; direct sight lines to transit stops.
• Minimizing off-street parking supplies—where land costs are high,tucking parking under buildings or placing it in peripheral structures; inother cases, siting parking at the rear of buildings instead of in front.
• Providing such pedestrian amenities as attractive landscaping, continuousand paved sidewalks, street furniture, urban art, screening of parking,building overhangs and weather protection, and safe street crossings.
• Convenient siting of transit shelters, benches, and route information.
• Creating public open spaces and pedestrian plazas that are convenient totransit.
As mentioned above, many of these pedestrian- and transit-friendly featuresare embodied in the designs of smart growth and New Urbanist projects.
Density Features
High density is another key element of transit-oriented development. If originsand destinations are spread throughout a region, those with access to a car willlikely drive rather than take transit.18 On the other hand, dense, compact TODplaces a critical mass of people in a single location, providing the ridershipnumbers necessary to make transit feasible and efficient. High density offersthree benefits to improved transit service: Routes to a relatively large numberof points can be offered; the cost per ride of operating transit is reduced when
Mineta Transportation Institute
History of Transit-Oriented Development 99
ridership increases; and increased density allows transit service to be providedmore frequently.19
A number of research efforts have shown a clear link between increasedresidential density and increased transit ridership. A widely cited studyconducted in 1977 by Pushkarev and Zupan20 concluded that sufficient railtransit demand requires residential densities averaging 12 units per acreconnected to a downtown with at least 50 million square feet of nonresidentialuses. That study also noted that residential densities in the range of two toseven units per acre produced only marginal transit use; densities of betweenseven and thirty units per acre were necessary to sustain significant transit use.With a density increase from seven to thirty dwelling units, transit demandroughly tripled and a sharp reduction in auto travel was noted. A 1984 study byWilbur Smith found a substantial increase in transit trips when residentialdensities increased from seven to sixteen units per acre.21 A 1994 study byHoltzclaw confirmed that residential density is the major explanatory variablein vehicle miles traveled. Holtzclaw found that doubling residential densitiesresulted in greater transit usage and a 20 to 30 percent reduction in annualhousehold vehicle miles traveled (VMTs).22
In general, the population and employment densities needed to support transitare significantly higher than the average densities in most U.S. suburbs.23
Typical suburban, single-family detached subdivision densities are betweenone and eight units per acre, with townhouse (single-family attached) densitiesranging from eight to twelve units per acre.
Based on the results of the above and other studies, some jurisdictions haveadopted minimum density thresholds to be used when evaluating new transitsystems or the extension of existing systems. For example, the Denver RapidTransit District has prepared the Suburban Mobility Design Manual, whichspells out the relationship of residential density to transit service. According tothe manual, densities of seven units per acre can support transit every 30minutes; 30 units per acre can support transit every 10 minutes; and 50 unitsper acre can support more bus trips than auto trips.24
When analyzing large areas, the minimum residential densities for transitservices also can be expressed in terms of population per square mile. In areport published in 1996 by the Transit Cooperative Research Program,Parsons Brinckerhoff Quade & Douglas, Inc., summarized the Pushkarev andZupan data in terms of minimum residential densities needed for three levels ofbus service (minimum, intermediate, and frequent), as well as for light rail and
Mineta Transportation Institute
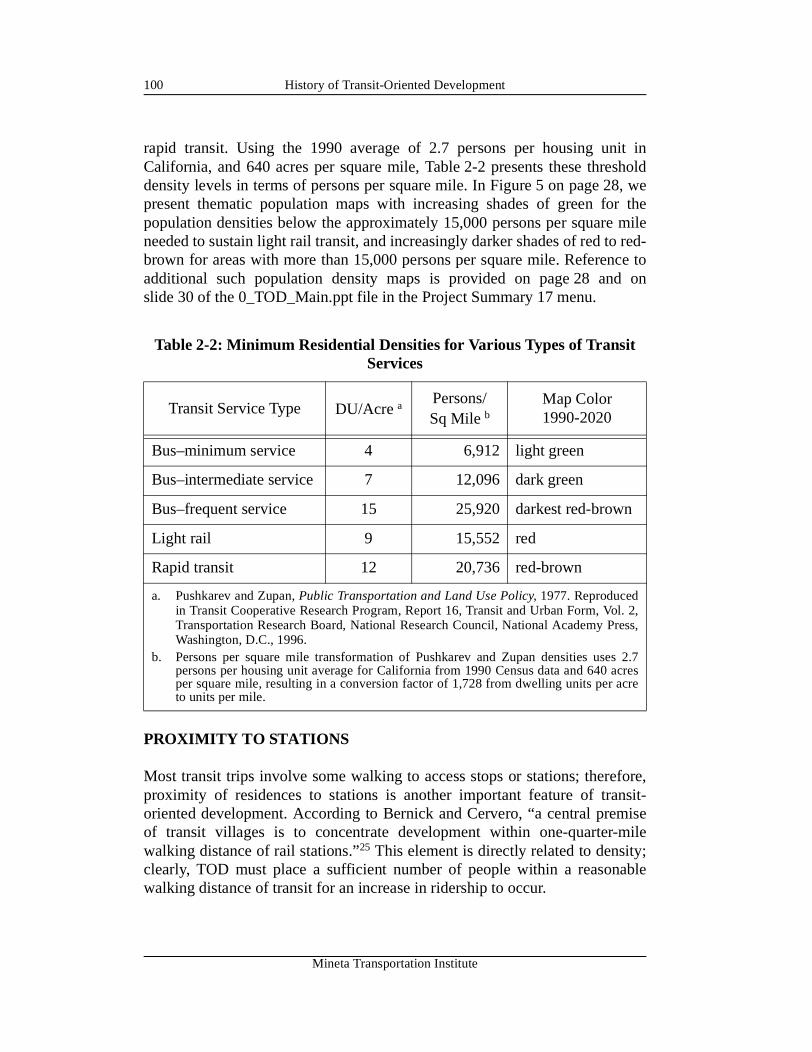
History of Transit-Oriented Development100
rapid transit. Using the 1990 average of 2.7 persons per housing unit inCalifornia, and 640 acres per square mile, Table 2-2 presents these thresholddensity levels in terms of persons per square mile. In Figure 5 on page 28, wepresent thematic population maps with increasing shades of green for thepopulation densities below the approximately 15,000 persons per square mileneeded to sustain light rail transit, and increasingly darker shades of red to red-brown for areas with more than 15,000 persons per square mile. Reference toadditional such population density maps is provided on page 28 and onslide 30 of the 0_TOD_Main.ppt file in the Project Summary 17 menu.
PROXIMITY TO STATIONS
Most transit trips involve some walking to access stops or stations; therefore,proximity of residences to stations is another important feature of transit-oriented development. According to Bernick and Cervero, “a central premiseof transit villages is to concentrate development within one-quarter-milewalking distance of rail stations.”25 This element is directly related to density;clearly, TOD must place a sufficient number of people within a reasonablewalking distance of transit for an increase in ridership to occur.
Table 2-2: Minimum Residential Densities for Various Types of Transit Services
Transit Service Type DU/Acre aPersons/Sq Mile b
Map Color 1990-2020
Bus–minimum service 4 6,912 light green
Bus–intermediate service 7 12,096 dark green
Bus–frequent service 15 25,920 darkest red-brown
Light rail 9 15,552 red
Rapid transit 12 20,736 red-brown
a. Pushkarev and Zupan, Public Transportation and Land Use Policy, 1977. Reproducedin Transit Cooperative Research Program, Report 16, Transit and Urban Form, Vol. 2,Transportation Research Board, National Research Council, National Academy Press,Washington, D.C., 1996.
b. Persons per square mile transformation of Pushkarev and Zupan densities uses 2.7persons per housing unit average for California from 1990 Census data and 640 acresper square mile, resulting in a conversion factor of 1,728 from dwelling units per acreto units per mile.
Mineta Transportation Institute
History of Transit-Oriented Development 101
Research by Untermann on walking behavior in the United States shows that2,300 feet is the maximum distance people are willing to walk for generalpurposes.26 Specific studies on transit proximity and ridership in the Bay Area,Washington, D.C., and Toronto and Edmonton, Canada, indicate that transitridership generally is the highest within about one-third mile from the station.27
Trip destination is also an important factor in transit ridership, as is the cost ofparking; those commuting to downtown areas (for example, San Francisco)who have to pay for parking are more likely to use transit than thosecommuting to suburban destinations (for example, Dublin/Pleasanton) whereparking is typically free. Overall, however, Bay Area residents living near railstations were found to be five to seven times more likely to commute by railtransit than the average worker in the city.28
NOTES
1. Michael Bernick and Robert Cervero. Transit Villages in the 21st Century. New York:McGraw Hill, 1997, p.5.
2. Scott Lafaver. Private Land with Public Partnerships for Transit Based Development. SanJose, CA.: Norman Y. Mineta International Institute for Surface Transportation PolicyStudies, 1997, p. 2.
3. Douglas Porter. Transit-Focused Development. Washington, D.C.: National AcademyPress, 1997, p. 1.
4. Steve Colman. San José State University, URBP 226 Course Reader, Fall 1999. San JoséState University Department of Urban and Regional Planning, p. 3-4.
5. Bernick and Cervero, p. 16.
6. Colman. p. 2-4.
7. ibid., p. 2-4.
8. Bernick and Cervero, p. 20.
9. ibid., p. 20
10. W. Middleton. The Time of the Trolley. Milwaukee: Kalmbeck Publishing, 1967, p. 44.
11. Robert Cervero. Transit-Supportive Development in the U.S. Washington, D.C.: FederalTransit Administration, 1993, p. 4.
12. Transit Cooperative Research Program. The Role of Transit in Creating LivableMetropolitan Communities. Washington, D.C.: National Academy Press, 1997, p. 20.
13. Bernick and Cervero, p. 7-11.
14. James Howard Kunster. Home From Nowhere. New York: Touchstone, 1996, p. 19.
15. Timothy Beatley and Kristy Manning. The Ecology of Place. Covelo, CA.: Island Press,1997, p. 116.
16. Association of Bay Area Governments. Theory in Action, Smart Growth Case Studies.Oakland: ABAG, 2000, p. i.
17. Bernick and Cervero, p. 91-94.
18. ibid., p. 74
Mineta Transportation Institute
History of Transit-Oriented Development102
19. Morris. Creating Transit-Supportive Land Use Regulations. Chicago: American PlanningAssociation, 1996, p. 41.
20. Boris S. Pushkarev and Jeffrey M. Zupan. Public Transportation and Land Use Policy.Bloomington: Indiana University Press, 1977, p. 30.
21. Wilbur Smith. “Mass Transit for High-Rise, High-Density Living,” Journal ofTransportation Engineering 110 (6), 1984.
22. John Holtzclaw. Using Residential Patterns and Transit.
23. Morris, p. 41.
24. Cervero, p. 50.
25. Bernick and Cervero, p. 121.
26. Richard Untermann. Accommodating the Pedestrian: Adapting Towns and Neighborhoodsfor Walking and Bicycling. New York: Van Nostrand Reinhold, 1984.
27. Bernick and Cervero, p. 126.
28. Ibid., p. 122.
REFERENCES
Association of Bay Area Governments. Projections 2000. Oakland: ABAG,2000.
_____. Theory in Action, Smart Growth Case Studies. Oakland: ABAG, 2000.
Barbour, Elisa, and Paul G. Lewis. California Cities and Local Sales Tax. SanFrancisco: Public Policy Institute of California, 1999.
Bay Area Rapid Transit District (BART), San Mateo County Transit District,U.S. Department of Transportation. BART-SFO Extension, FinalEnvironmental Impact Statement/Final Environmental Impact Report.June 1996.
The California Budget Project. State and Local Government Finance inCalifornia: A Primer. Sacramento: The California Budget Project,1996.
Beatty, David F., et.al. Redevelopment in California. Point Arena, CA: SolanoPress, 1995.
Beatley, Timothy, and Kristi Manning. The Ecology of Place. Covelo, CA.:Island Press, 1997.
Bernick, Michael, and Robert Cervero. Transit Villages in the 21st CenturyNew York: McGraw Hill, 1997.
Cervero, Robert. Transit-Supportive Development in the U.S. Washington,D.C.: Federal Transit Administration, 1993.
Mineta Transportation Institute
History of Transit-Oriented Development 103
City of South San Francisco. Draft Preliminary Report on the ProposedSecond Amendment to the Redevelopment Plan for the El CaminoCorridor Redevelopment Project. December 1999.
_____. El Camino Corridor General Plan Amendment and RedevelopmentPlan, Draft Environmental Impact Report. February 1993.
_____. El Camino Corridor Redevelopment Plan Amendment, DraftEnvironmental Impact Report. March 2000.
Transit Cooperative Research Program. The Role of Transit in CreatingLivable Metropolitan Communities. Washington, D.C.: NationalAcademy Press, 1997.
Untermann, Richard. Accommodating the Pedestrian: Adapting Towns andNeighborhoods for Walking and Bicycling. New York: Van NostrandReinhold, 1984.
Mineta Transportation Institute

History of Transit-Oriented Development104
Mineta Transportation Institute
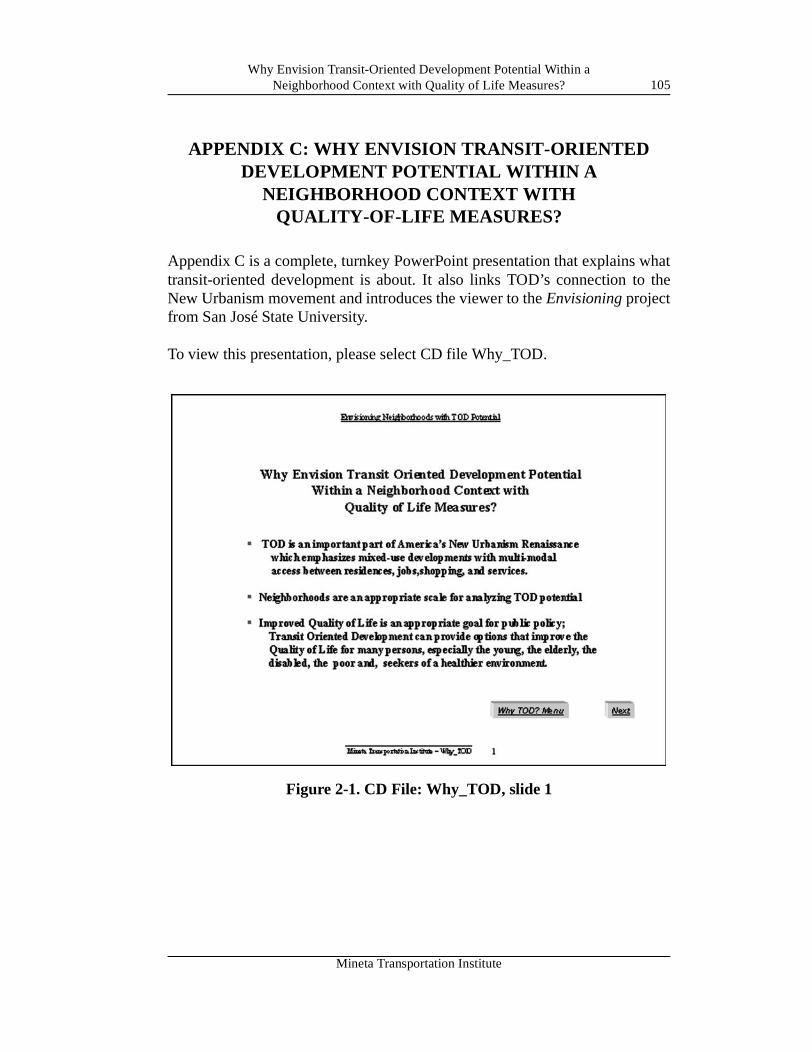
Why Envision Transit-Oriented Development Potential Within a Neighborhood Context with Quality of Life Measures? 105
APPENDIX C: WHY ENVISION TRANSIT-ORIENTED DEVELOPMENT POTENTIAL WITHIN A
NEIGHBORHOOD CONTEXT WITH QUALITY-OF-LIFE MEASURES?
Appendix C is a complete, turnkey PowerPoint presentation that explains whattransit-oriented development is about. It also links TOD’s connection to theNew Urbanism movement and introduces the viewer to the Envisioning projectfrom San José State University.
To view this presentation, please select CD file Why_TOD.
Figure 2-1. CD File: Why_TOD, slide 1
Mineta Transportation Institute

Why Envision Transit-Oriented Development Potential Within a Neighborhood Context with Quality of Life Measures?106
Mineta Transportation Institute
Operations Help 107
APPENDIX D: OPERATIONS HELP
For assistance in working with the PowerPoint files on the CD-ROM thataccompanies this report, see CD-ROM file: 0_Operating_Instructions.
OPERATING INSTRUCTIONS AND TECHNICAL NOTES
System Requirements
• Windows PC running Microsoft PowerPoint 2000
• 64 MB or more CPU (Fruitvale Summary and panorama views forHayward are the most demanding.)
• 200 MB hard disk space
• 17-inch or larger monitor with XGA resolution (1024 x 780)
• SVGA resolution (800 x 600) is generally OK, but has some graphicsproblems
• XGA resolution (640 x 480) shows most text, but graphics are poor
Microsoft PowerPoint 97 will run most of the options in this data set, but doesNOT handle transitions between the multiple files well. Users are encouragedto use either PowerPoint 2000 or XP.
The video clips and scrollable panorama views in the Hayward, Fruitvale, andRedwood City studies require video software that may not be on all PCs:Apple QuickTime for videos, Casio Panorama for panorama views, and GIFAnimator for animated population and job density maps.
Operating Instructions
1. Copy the entire contents of the CD-ROM into a file in the root directory ofyour hard drive entitled ETODP00; that is, create a folder in the C: drivecalled C:\ ETODP00 (for Envisioning TOD Potential 2000)
2. Confirm that the display resolution of your monitor is 1024 x 768 or higherby using the Windows>Settings>Control Panel>Display>Settings>ScreenArea command. (If the highest resolution is 800 x 600, some images willbe fuzzy; 640 x 480 resolution will produce many poor-quality presentationdisplays, although the presentation text should be readable.)
Mineta Transportation Institute
Operations Help108
3. Using PowerPoint 2000, open the file 0_TOD_Main.ppt. This is the onlyfile you should have open when accessing the set of linked presentationfiles. Note that PowerPoint 97 will run most files and operations, but doesnot return to the previous file after the ESC key is pressed, making itdifficult to transition between files.
4. The menu tree is from Main TOD_Menu out to Summary and Detailedfiles for each of the six study areas, with other choices for county andregion context information. There are also a set of theoretical slidesexplaining the Envisioning Neighborhoods Principles, a Why TOD? filediscussing the rationale for TOD, and a file presenting TOD History. Textnotes, located near the beginning of the O_TOD_Main file, explain theoperation of the Main TOD Menu. The “Understanding This Menu” linkon the bottom right of the TOD Main Menu displays a simplified menutree.
5. To navigate from screen to screen in this PowerPoint show, left click on theunderlined black text portion of the raised gray buttons on each screen.These buttons usually can be found along the bottom or right. When indoubt as to what to do on a screen, left click on the underlined text on agray background button with an appropriate label. It is important to clickon the text portion of the navigation buttons, because many presentationsuse multiple files with links out to other files.Note that suggestions and advice regarding navigation have been presentedwith blue text on very light gray boxes that are not raised buttons.
6. Press the ESC key to back out of any presentation file and return to theprevious presentation file. Files vary from 1 to 68 screens or slides.
7. The Hayward BART study area and Alameda County are the most fullydeveloped presentations and should be considered as the prototypeexamples, although each of the other study areas has some uniqueapplications of merit.
8. Directories identifying slide/screen components have been placed near theend of many files, and are compiled in a single file (1_Directory_Listings…) which can be used to access most slides/screens directly.
Suggested Paths Through the Envisioning Neighborhoods with TODPotential Files.
This multimedia collection of linked files is designed to be used interactivelywith multiple optimum paths that depend on the objectives of the user.Presented below are a few suggested possible approaches/paths that may be of
Mineta Transportation Institute
Operations Help 109
interest. With repeated use, you are likely to find and develop approaches thatbest meet your needs.
1. Suggestions for First-Time Users
First-time users are encouraged to read these notes, then view the1_Introductory_Presentation.ppt file to preview what is available.
To work with the full set of project files, close the 1-Introductory … fileand open only the 0_TOD_Main.ppt file and proceed through the ProjectOverview Presentation, clicking on the text portion of the Next buttons,which are near the bottom right of most presentation screens. In a fewcases, pressing Next takes you beyond the TOD_Main file you startedwith; in that case, press the ESC key to return to the TOD_ Main file andcontinue by clicking the Beyond Next button text. To see a text discussionof a presentation screen, click the “T” on a gray button, generally near theNext button. To view the presentation screen related to any text screen, youusually only need to click on the small miniature of the presentation screen,usually located in the top left of the first text screen that discusses it.
After completing the Project Overview, first-time users may want to reviewthe summary overview screens, perhaps starting with the Haywardexample.
2. Users interested in obtaining general background regarding TOD areencouraged to view the Why TOD? presentation accessed from the topright of the Main TOD menu. The TOD History paper provides moredetail regarding TOD, while Envisioning QOL presents theoreticalconcepts regarding Envisioning Neighborhoods with TOD potential. Bothof these presentations are accessed from the right side of the Main TODMenu.
3. Users interested in obtaining a better understanding of the rationalebehind Envisioning Neighborhoods principles are encouraged to accessthe presentation of that name.
The Detailed Views for several areas contain a variety of additionalmaterial beyond the materials in the summary overviews. The HaywardBART Downtown menu contains more than a dozen links to files atvarious scales, from easy walking out to broader regional contexts.
The County or Regional Contexts presentation files, accessed from thesecond column from the right of the Main TOD Menu, are best viewed
Mineta Transportation Institute
Operations Help110
either before or after the study area presentations, depending on the user’sknowledge of the region.
4. Advanced Users interested in finding the right neighborhood for aparticular possible TOD project might want to first review the regionaland county patterns and then view Summary Overviews to help decide thearea or areas worthy of additional attention. Then the Detailed Views forthose areas can be carefully pursued.
5. Advanced computer gurus may want to use the Directory of PrincipalFiles, which has direct links to 465 screens. A search for keywords likely tobe in screen titles could enable users to directly access screens withinformation they want.
Disclaimer: A goal of this study is to present examples of how digitalinformation can be used to understand local conditions, especially thesuitability of areas for TOD developments. In no case are the examplespresented in this project sufficiently comprehensive to be the basis of adefinitive decision regarding a place. Also, much of the data presentedin this study is based on 1990 census data. Once the 2000 census datais released, then the techniques demonstrated in this project can be usedmore effectively for real-world decisions.
FEEDBACK REQUEST
We would appreciate your views on the buttons and link procedures andfeedback regarding what seems to work well and what does not. Try thepresentation/text options in the main TOD file by first looking at a presentationscreen, then viewing the text discussion of it, then moving on to the nextpresentation screen. Does this work for you? How long could you view in thisway? Any suggestions for making a viable interactive way to view data will beappreciated. Please let us know the operating system, PowerPoint version, andCPU capacity of the PC you used, along with your comments or suggestions.
E-mail:[email protected]: 408-924-5882Fax: 408-924-5860
Mineta Transportation Institute
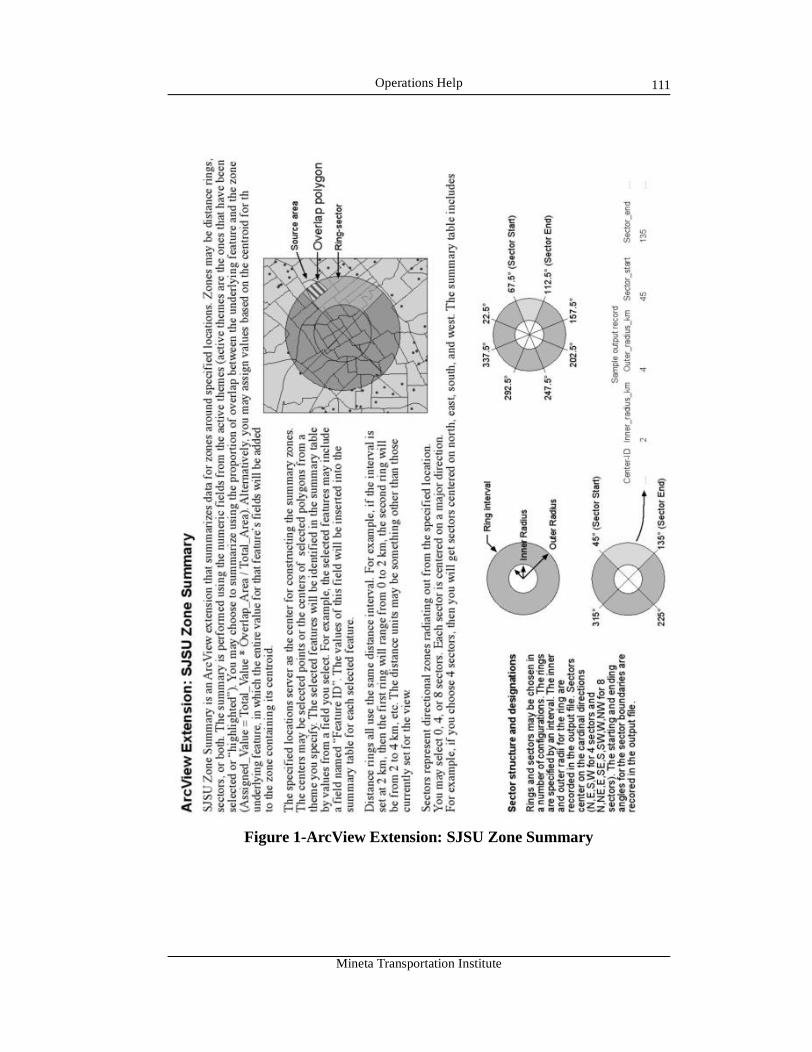
Operations Help 111
Figure 1-ArcView Extension: SJSU Zone Summary
Mineta Transportation Institute
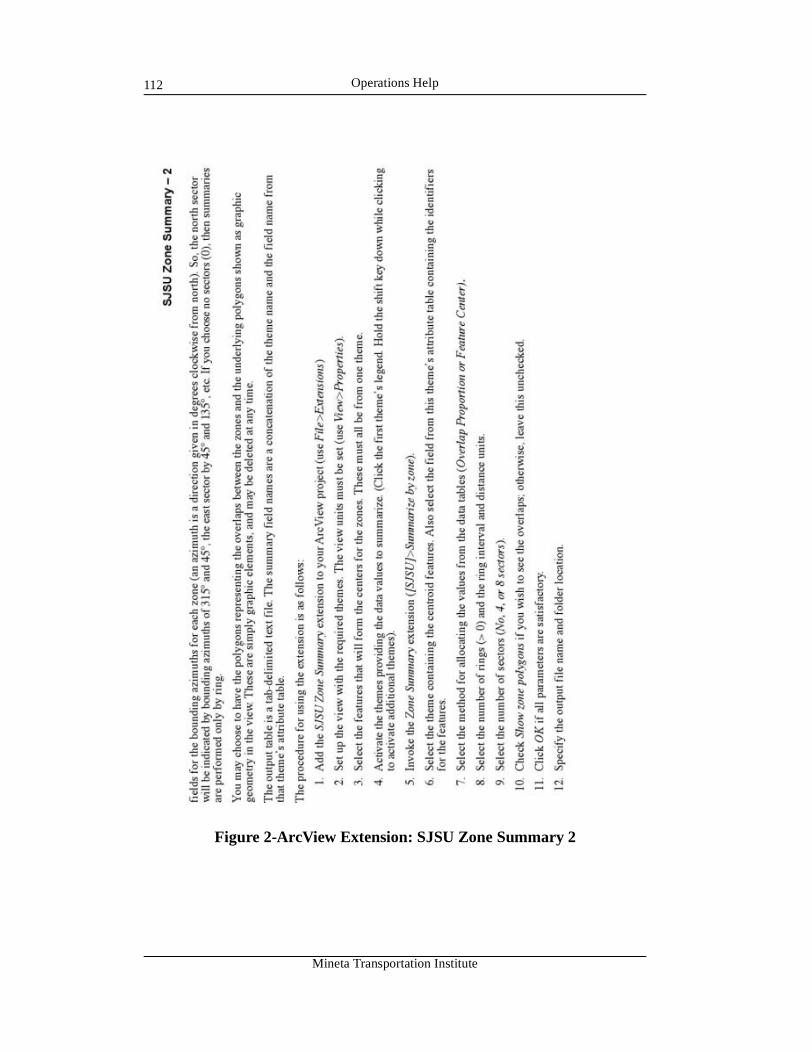
Operations Help112
Figure 2-ArcView Extension: SJSU Zone Summary 2
Mineta Transportation Institute
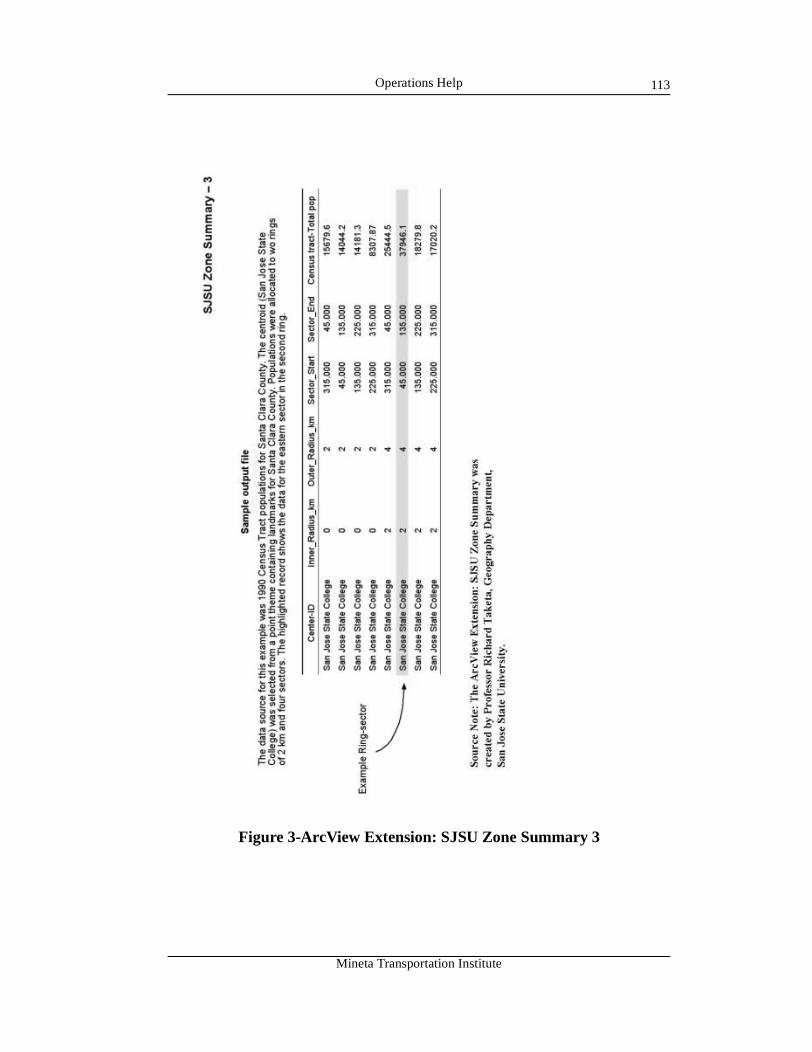
Operations Help 113
Figure 3-ArcView Extension: SJSU Zone Summary 3
Mineta Transportation Institute

Operations Help114
Mineta Transportation Institute
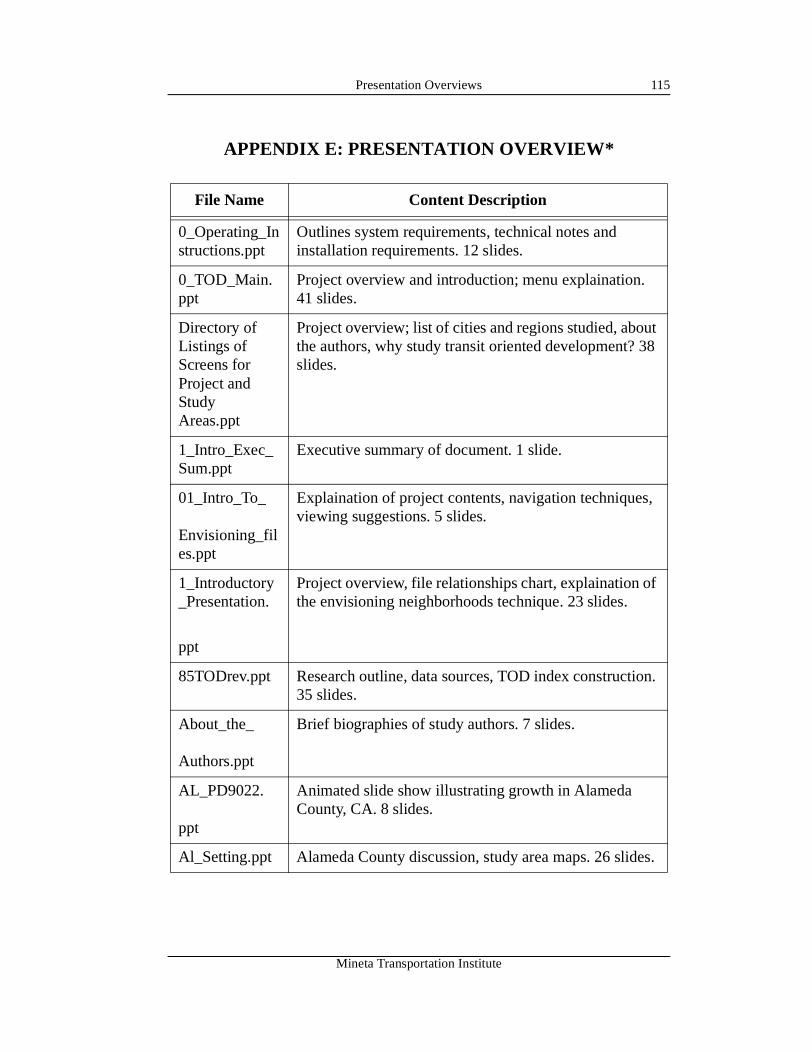
Presentation Overviews 115
APPENDIX E: PRESENTATION OVERVIEW*
File Name Content Description
0_Operating_Instructions.ppt
Outlines system requirements, technical notes and installation requirements. 12 slides.
0_TOD_Main.ppt
Project overview and introduction; menu explaination. 41 slides.
Directory of Listings of Screens for Project and Study Areas.ppt
Project overview; list of cities and regions studied, about the authors, why study transit oriented development? 38 slides.
1_Intro_Exec_Sum.ppt
Executive summary of document. 1 slide.
01_Intro_To_
Envisioning_files.ppt
Explaination of project contents, navigation techniques, viewing suggestions. 5 slides.
1_Introductory_Presentation.
ppt
Project overview, file relationships chart, explaination of the envisioning neighborhoods technique. 23 slides.
85TODrev.ppt Research outline, data sources, TOD index construction. 35 slides.
About_the_
Authors.ppt
Brief biographies of study authors. 7 slides.
AL_PD9022.
ppt
Animated slide show illustrating growth in Alameda County, CA. 8 slides.
Al_Setting.ppt Alameda County discussion, study area maps. 26 slides.
Mineta Transportation Institute
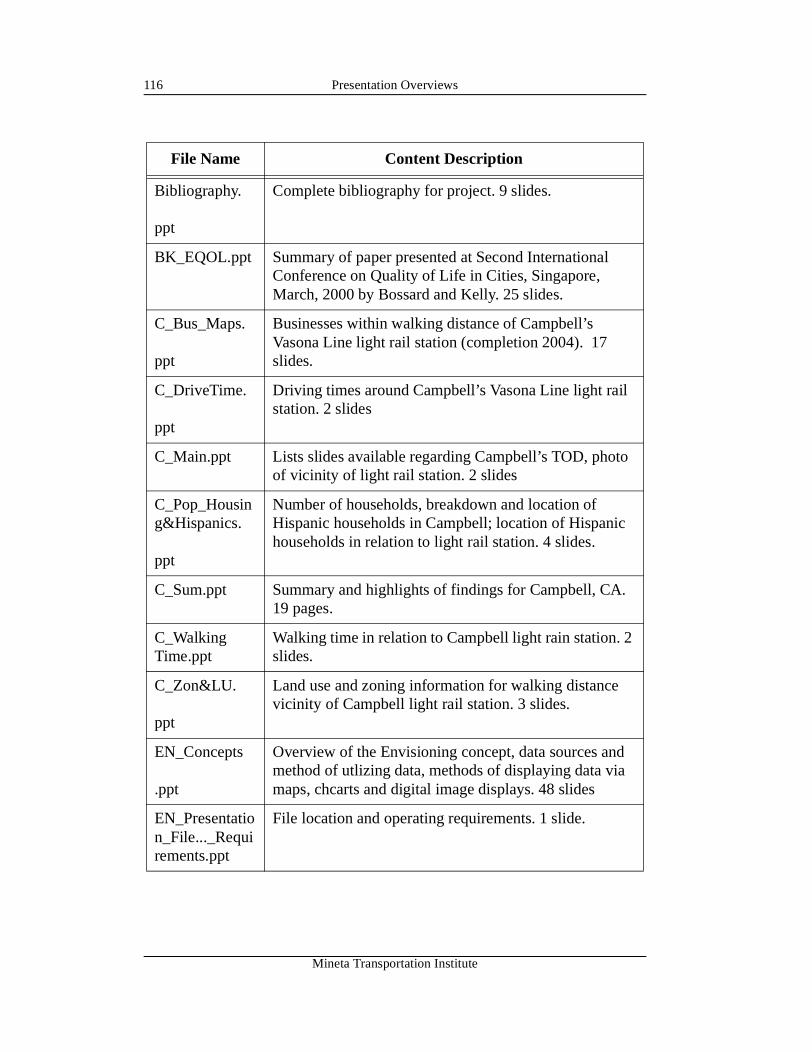
Presentation Overviews116
Bibliography.
ppt
Complete bibliography for project. 9 slides.
BK_EQOL.ppt Summary of paper presented at Second International Conference on Quality of Life in Cities, Singapore, March, 2000 by Bossard and Kelly. 25 slides.
C_Bus_Maps.
ppt
Businesses within walking distance of Campbell’s Vasona Line light rail station (completion 2004). 17 slides.
C_DriveTime.
ppt
Driving times around Campbell’s Vasona Line light rail station. 2 slides
C_Main.ppt Lists slides available regarding Campbell’s TOD, photo of vicinity of light rail station. 2 slides
C_Pop_Housing&Hispanics.
ppt
Number of households, breakdown and location of Hispanic households in Campbell; location of Hispanic households in relation to light rail station. 4 slides.
C_Sum.ppt Summary and highlights of findings for Campbell, CA. 19 pages.
C_Walking Time.ppt
Walking time in relation to Campbell light rain station. 2 slides.
C_Zon&LU.
ppt
Land use and zoning information for walking distance vicinity of Campbell light rail station. 3 slides.
EN_Concepts
.ppt
Overview of the Envisioning concept, data sources and method of utlizing data, methods of displaying data via maps, chcarts and digital image displays. 48 slides
EN_Presentation_File..._Requirements.ppt
File location and operating requirements. 1 slide.
File Name Content Description
Mineta Transportation Institute
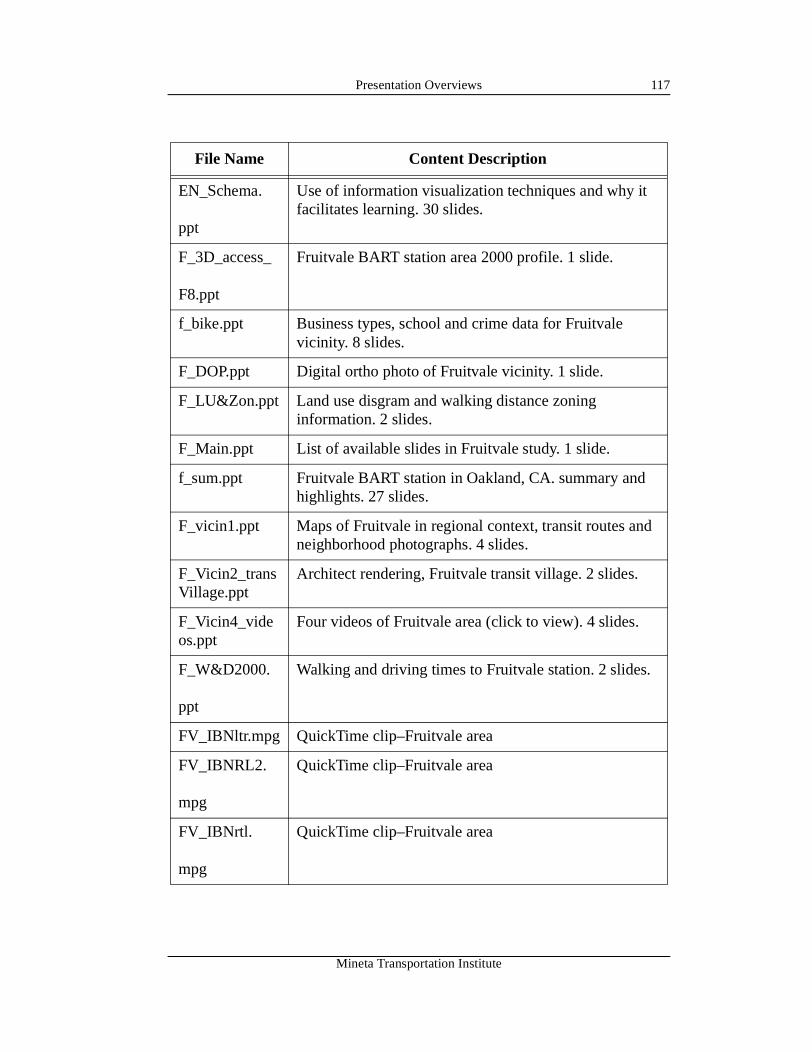
Presentation Overviews 117
EN_Schema.
ppt
Use of information visualization techniques and why it facilitates learning. 30 slides.
F_3D_access_
F8.ppt
Fruitvale BART station area 2000 profile. 1 slide.
f_bike.ppt Business types, school and crime data for Fruitvale vicinity. 8 slides.
F_DOP.ppt Digital ortho photo of Fruitvale vicinity. 1 slide.
F_LU&Zon.ppt Land use disgram and walking distance zoning information. 2 slides.
F_Main.ppt List of available slides in Fruitvale study. 1 slide.
f_sum.ppt Fruitvale BART station in Oakland, CA. summary and highlights. 27 slides.
F_vicin1.ppt Maps of Fruitvale in regional context, transit routes and neighborhood photographs. 4 slides.
F_Vicin2_transVillage.ppt
Architect rendering, Fruitvale transit village. 2 slides.
F_Vicin4_videos.ppt
Four videos of Fruitvale area (click to view). 4 slides.
F_W&D2000.
ppt
Walking and driving times to Fruitvale station. 2 slides.
FV_IBNltr.mpg QuickTime clip–Fruitvale area
FV_IBNRL2.
mpg
QuickTime clip–Fruitvale area
FV_IBNrtl.
mpg
QuickTime clip–Fruitvale area
File Name Content Description
Mineta Transportation Institute
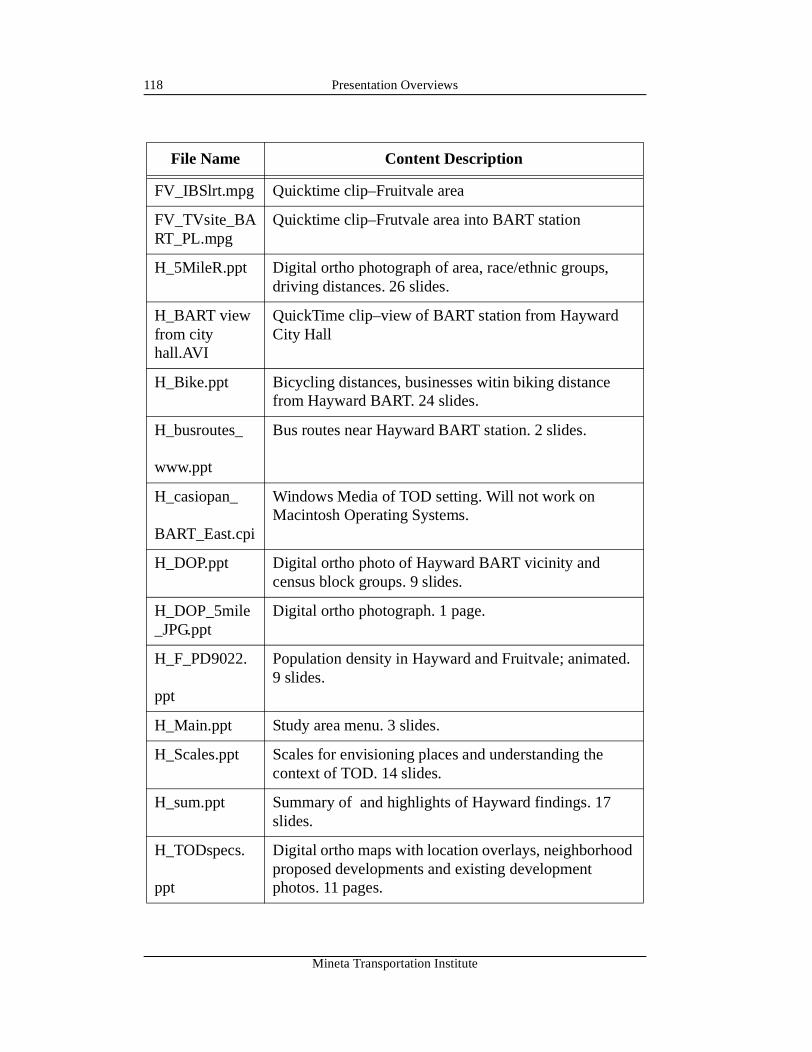
Presentation Overviews118
FV_IBSlrt.mpg Quicktime clip–Fruitvale area
FV_TVsite_BART_PL.mpg
Quicktime clip–Frutvale area into BART station
H_5MileR.ppt Digital ortho photograph of area, race/ethnic groups, driving distances. 26 slides.
H_BART view from city hall.AVI
QuickTime clip–view of BART station from Hayward City Hall
H_Bike.ppt Bicycling distances, businesses witin biking distance from Hayward BART. 24 slides.
H_busroutes_
www.ppt
Bus routes near Hayward BART station. 2 slides.
H_casiopan_
BART_East.cpi
Windows Media of TOD setting. Will not work on Macintosh Operating Systems.
H_DOP.ppt Digital ortho photo of Hayward BART vicinity and census block groups. 9 slides.
H_DOP_5mile_JPG.ppt
Digital ortho photograph. 1 page.
H_F_PD9022.
ppt
Population density in Hayward and Fruitvale; animated. 9 slides.
H_Main.ppt Study area menu. 3 slides.
H_Scales.ppt Scales for envisioning places and understanding the context of TOD. 14 slides.
H_sum.ppt Summary of and highlights of Hayward findings. 17 slides.
H_TODspecs.
ppt
Digital ortho maps with location overlays, neighborhood proposed developments and existing development photos. 11 pages.
File Name Content Description
Mineta Transportation Institute
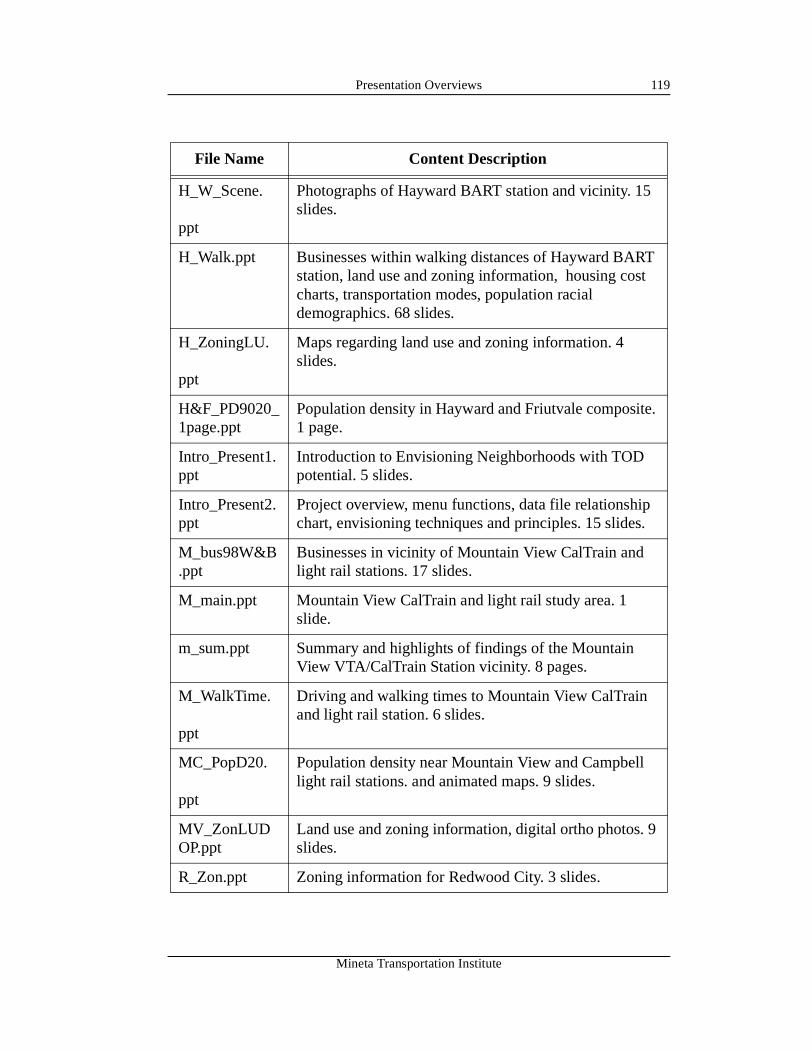
Presentation Overviews 119
H_W_Scene.
ppt
Photographs of Hayward BART station and vicinity. 15 slides.
H_Walk.ppt Businesses within walking distances of Hayward BART station, land use and zoning information, housing cost charts, transportation modes, population racial demographics. 68 slides.
H_ZoningLU.
ppt
Maps regarding land use and zoning information. 4 slides.
H&F_PD9020_1page.ppt
Population density in Hayward and Friutvale composite. 1 page.
Intro_Present1.ppt
Introduction to Envisioning Neighborhoods with TOD potential. 5 slides.
Intro_Present2.ppt
Project overview, menu functions, data file relationship chart, envisioning techniques and principles. 15 slides.
M_bus98W&B.ppt
Businesses in vicinity of Mountain View CalTrain and light rail stations. 17 slides.
M_main.ppt Mountain View CalTrain and light rail study area. 1 slide.
m_sum.ppt Summary and highlights of findings of the Mountain View VTA/CalTrain Station vicinity. 8 pages.
M_WalkTime.
ppt
Driving and walking times to Mountain View CalTrain and light rail station. 6 slides.
MC_PopD20.
ppt
Population density near Mountain View and Campbell light rail stations. and animated maps. 9 slides.
MV_ZonLUDOP.ppt
Land use and zoning information, digital ortho photos. 9 slides.
R_Zon.ppt Zoning information for Redwood City. 3 slides.
File Name Content Description
Mineta Transportation Institute
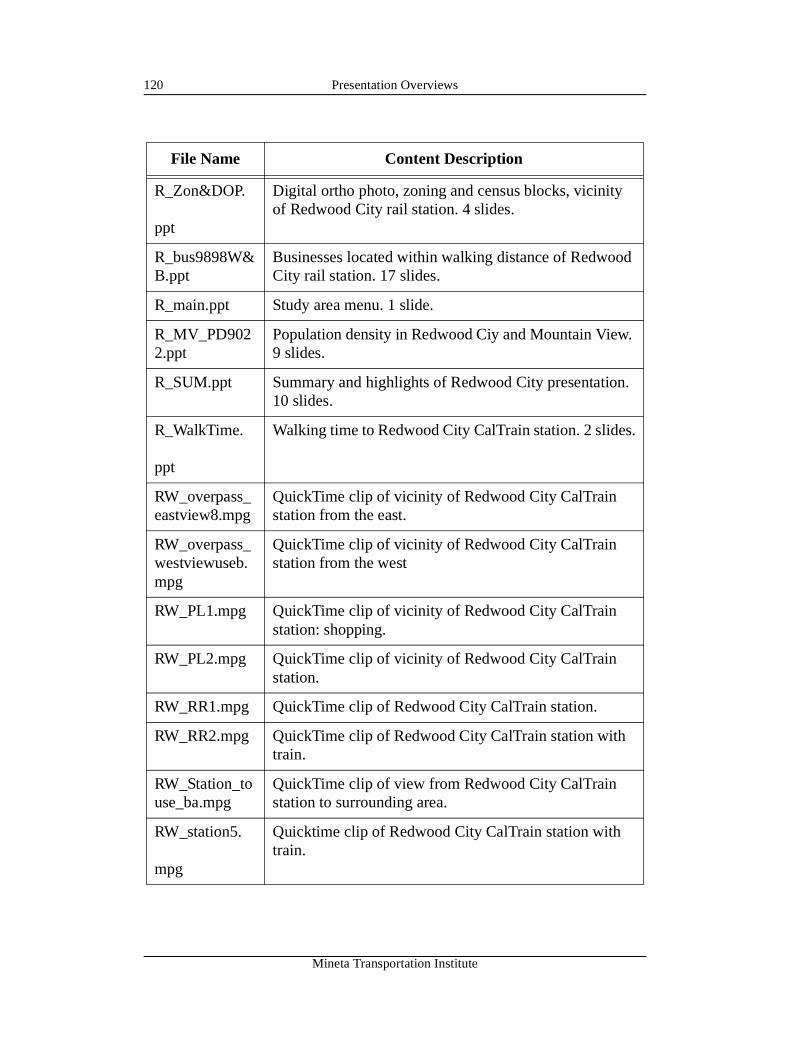
Presentation Overviews120
R_Zon&DOP.
ppt
Digital ortho photo, zoning and census blocks, vicinity of Redwood City rail station. 4 slides.
R_bus9898W&B.ppt
Businesses located within walking distance of Redwood City rail station. 17 slides.
R_main.ppt Study area menu. 1 slide.
R_MV_PD9022.ppt
Population density in Redwood Ciy and Mountain View. 9 slides.
R_SUM.ppt Summary and highlights of Redwood City presentation. 10 slides.
R_WalkTime.
ppt
Walking time to Redwood City CalTrain station. 2 slides.
RW_overpass_eastview8.mpg
QuickTime clip of vicinity of Redwood City CalTrain station from the east.
RW_overpass_westviewuseb.mpg
QuickTime clip of vicinity of Redwood City CalTrain station from the west
RW_PL1.mpg QuickTime clip of vicinity of Redwood City CalTrain station: shopping.
RW_PL2.mpg QuickTime clip of vicinity of Redwood City CalTrain station.
RW_RR1.mpg QuickTime clip of Redwood City CalTrain station.
RW_RR2.mpg QuickTime clip of Redwood City CalTrain station with train.
RW_Station_touse_ba.mpg
QuickTime clip of view from Redwood City CalTrain station to surrounding area.
RW_station5.
mpg
Quicktime clip of Redwood City CalTrain station with train.
File Name Content Description
Mineta Transportation Institute
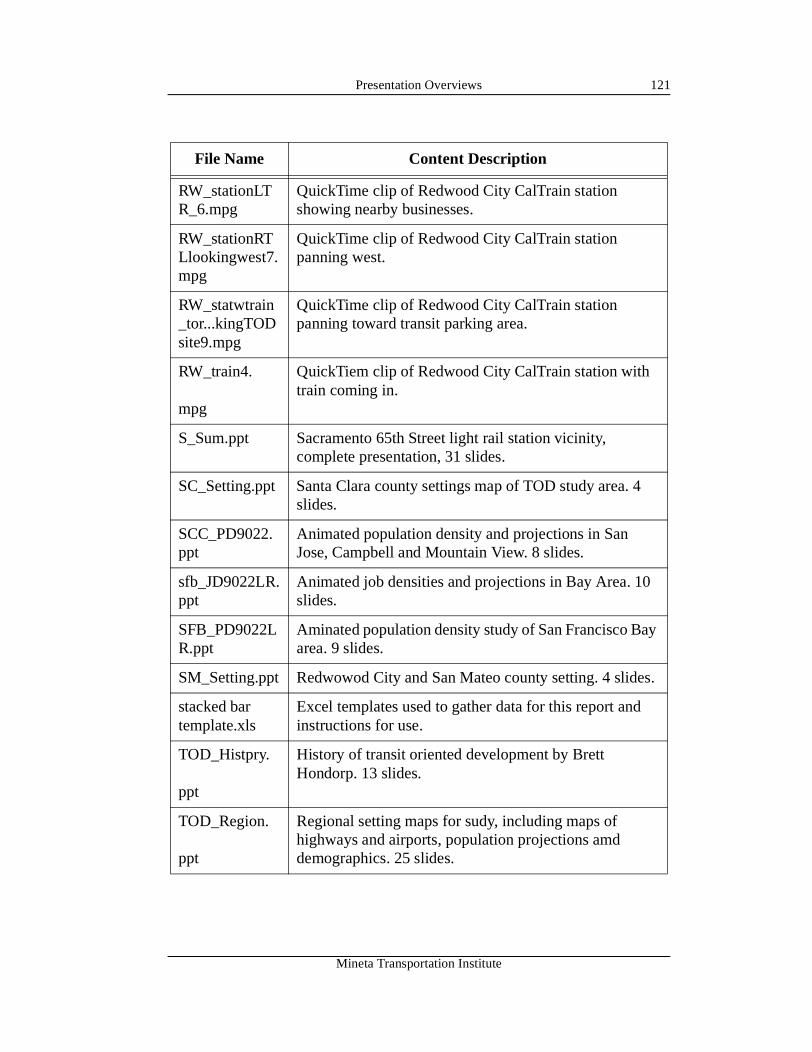
Presentation Overviews 121
RW_stationLTR_6.mpg
QuickTime clip of Redwood City CalTrain station showing nearby businesses.
RW_stationRTLlookingwest7.mpg
QuickTime clip of Redwood City CalTrain station panning west.
RW_statwtrain_tor...kingTODsite9.mpg
QuickTime clip of Redwood City CalTrain station panning toward transit parking area.
RW_train4.
mpg
QuickTiem clip of Redwood City CalTrain station with train coming in.
S_Sum.ppt Sacramento 65th Street light rail station vicinity, complete presentation, 31 slides.
SC_Setting.ppt Santa Clara county settings map of TOD study area. 4 slides.
SCC_PD9022.ppt
Animated population density and projections in San Jose, Campbell and Mountain View. 8 slides.
sfb_JD9022LR.ppt
Animated job densities and projections in Bay Area. 10 slides.
SFB_PD9022LR.ppt
Aminated population density study of San Francisco Bay area. 9 slides.
SM_Setting.ppt Redwowod City and San Mateo county setting. 4 slides.
stacked bar template.xls
Excel templates used to gather data for this report and instructions for use.
TOD_Histpry.
ppt
History of transit oriented development by Brett Hondorp. 13 slides.
TOD_Region.
ppt
Regional setting maps for sudy, including maps of highways and airports, population projections amd demographics. 25 slides.
File Name Content Description
Mineta Transportation Institute
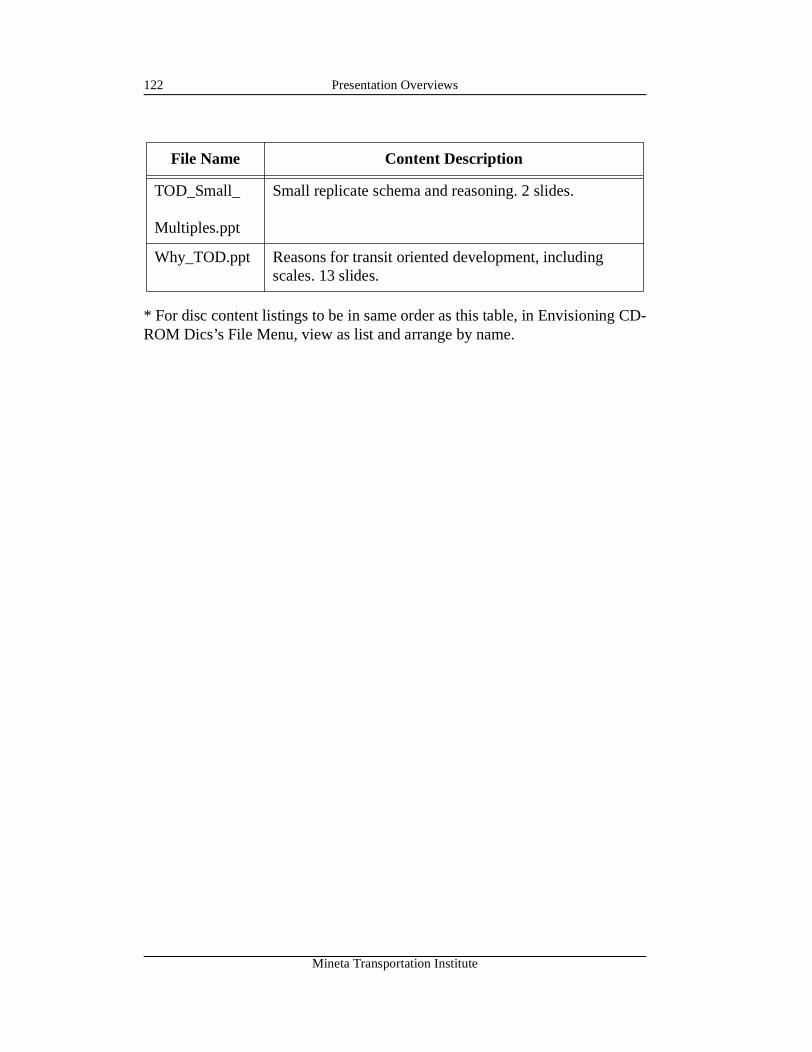
Presentation Overviews122
* For disc content listings to be in same order as this table, in Envisioning CD-ROM Dics’s File Menu, view as list and arrange by name.
TOD_Small_
Multiples.ppt
Small replicate schema and reasoning. 2 slides.
Why_TOD.ppt Reasons for transit oriented development, including scales. 13 slides.
File Name Content Description
Mineta Transportation Institute
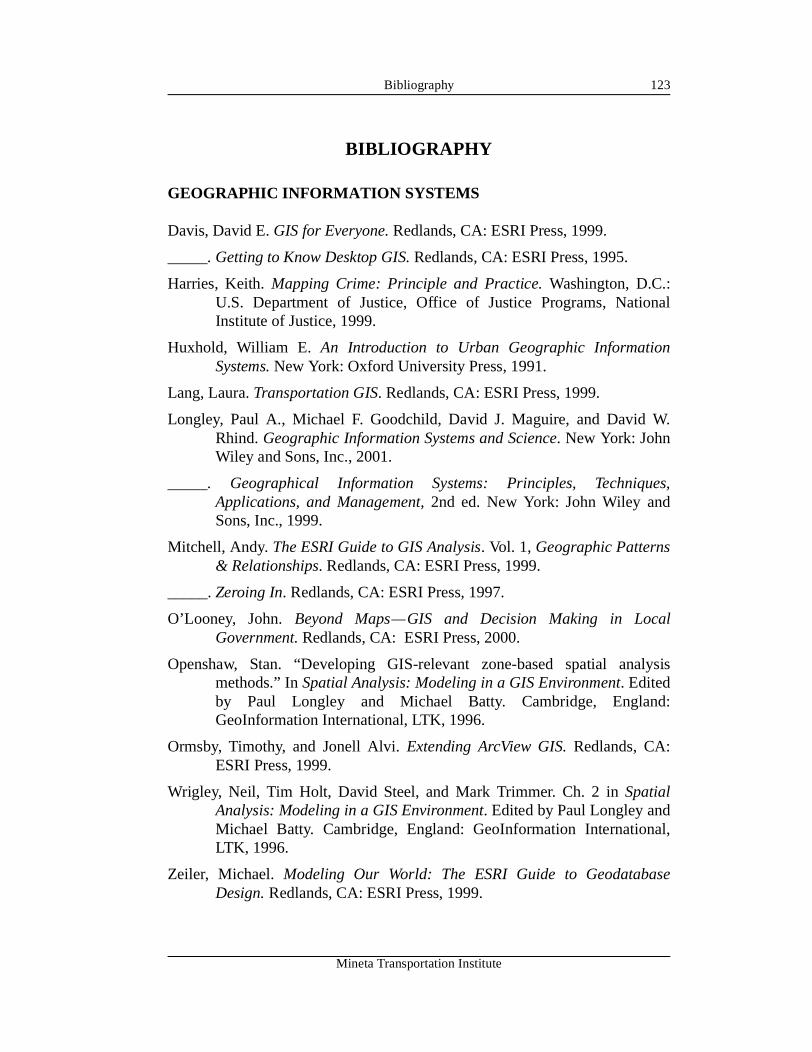
Bibliography 123
BIBLIOGRAPHY
GEOGRAPHIC INFORMATION SYSTEMS
Davis, David E. GIS for Everyone. Redlands, CA: ESRI Press, 1999.
_____. Getting to Know Desktop GIS. Redlands, CA: ESRI Press, 1995.
Harries, Keith. Mapping Crime: Principle and Practice. Washington, D.C.:U.S. Department of Justice, Office of Justice Programs, NationalInstitute of Justice, 1999.
Huxhold, William E. An Introduction to Urban Geographic InformationSystems. New York: Oxford University Press, 1991.
Lang, Laura. Transportation GIS. Redlands, CA: ESRI Press, 1999.
Longley, Paul A., Michael F. Goodchild, David J. Maguire, and David W.Rhind. Geographic Information Systems and Science. New York: JohnWiley and Sons, Inc., 2001.
_____. Geographical Information Systems: Principles, Techniques,Applications, and Management, 2nd ed. New York: John Wiley andSons, Inc., 1999.
Mitchell, Andy. The ESRI Guide to GIS Analysis. Vol. 1, Geographic Patterns& Relationships. Redlands, CA: ESRI Press, 1999.
_____. Zeroing In. Redlands, CA: ESRI Press, 1997.
O’Looney, John. Beyond Maps—GIS and Decision Making in LocalGovernment. Redlands, CA: ESRI Press, 2000.
Openshaw, Stan. “Developing GIS-relevant zone-based spatial analysismethods.” In Spatial Analysis: Modeling in a GIS Environment. Editedby Paul Longley and Michael Batty. Cambridge, England:GeoInformation International, LTK, 1996.
Ormsby, Timothy, and Jonell Alvi. Extending ArcView GIS. Redlands, CA:ESRI Press, 1999.
Wrigley, Neil, Tim Holt, David Steel, and Mark Trimmer. Ch. 2 in SpatialAnalysis: Modeling in a GIS Environment. Edited by Paul Longley andMichael Batty. Cambridge, England: GeoInformation International,LTK, 1996.
Zeiler, Michael. Modeling Our World: The ESRI Guide to GeodatabaseDesign. Redlands, CA: ESRI Press, 1999.
Mineta Transportation Institute
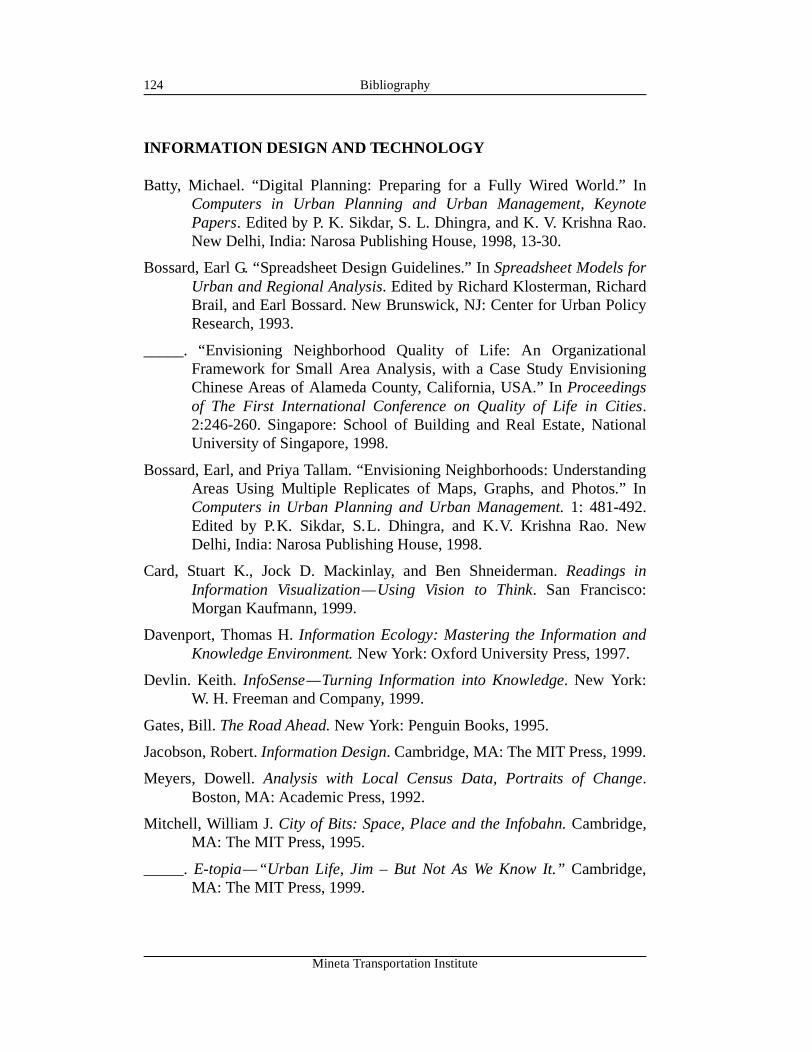
Bibliography124
INFORMATION DESIGN AND TECHNOLOGY
Batty, Michael. “Digital Planning: Preparing for a Fully Wired World.” InComputers in Urban Planning and Urban Management, KeynotePapers. Edited by P. K. Sikdar, S. L. Dhingra, and K. V. Krishna Rao.New Delhi, India: Narosa Publishing House, 1998, 13-30.
Bossard, Earl G. “Spreadsheet Design Guidelines.” In Spreadsheet Models forUrban and Regional Analysis. Edited by Richard Klosterman, RichardBrail, and Earl Bossard. New Brunswick, NJ: Center for Urban PolicyResearch, 1993.
_____. “Envisioning Neighborhood Quality of Life: An OrganizationalFramework for Small Area Analysis, with a Case Study EnvisioningChinese Areas of Alameda County, California, USA.” In Proceedingsof The First International Conference on Quality of Life in Cities.2:246-260. Singapore: School of Building and Real Estate, NationalUniversity of Singapore, 1998.
Bossard, Earl, and Priya Tallam. “Envisioning Neighborhoods: UnderstandingAreas Using Multiple Replicates of Maps, Graphs, and Photos.” InComputers in Urban Planning and Urban Management. 1: 481-492.Edited by P.K. Sikdar, S.L. Dhingra, and K.V. Krishna Rao. NewDelhi, India: Narosa Publishing House, 1998.
Card, Stuart K., Jock D. Mackinlay, and Ben Shneiderman. Readings inInformation Visualization—Using Vision to Think. San Francisco:Morgan Kaufmann, 1999.
Davenport, Thomas H. Information Ecology: Mastering the Information andKnowledge Environment. New York: Oxford University Press, 1997.
Devlin. Keith. InfoSense—Turning Information into Knowledge. New York:W. H. Freeman and Company, 1999.
Gates, Bill. The Road Ahead. New York: Penguin Books, 1995.
Jacobson, Robert. Information Design. Cambridge, MA: The MIT Press, 1999.
Meyers, Dowell. Analysis with Local Census Data, Portraits of Change.Boston, MA: Academic Press, 1992.
Mitchell, William J. City of Bits: Space, Place and the Infobahn. Cambridge,MA: The MIT Press, 1995.
_____. E-topia—“Urban Life, Jim – But Not As We Know It.” Cambridge,MA: The MIT Press, 1999.
Mineta Transportation Institute
Bibliography 125
Mulgan, Geoff. Connexity: How to Live in a Connected World. London:Chatto and Windus, 1997.
Negroponte, Nicholas. Being Digital. New York: Vintage Books, 1995.
Tufte, Edward R. Envisioning Information. Cheshire, CT: Graphics Press,1990.
_____. The Visual Display of Quantitative Information. Cheshire, CT:Graphics Press, 1983.
_____. Visual Explanations: Images and Quantities, Evidence and Narrative.Cheshire, CT: Graphics Press, 1997.
PLANNING AND TOD REFERENCES
Association of Bay Area Governments. Projections 1998. Oakland, CA:ABAG, 1998.
_____. Projections 2000. Oakland, CA: ABAG, 2000.
_____. Theory in Action, Smart Growth Case Studies. Oakland, CA: ABAG,2000.
Bauer, Raymond. Social Indicators. Cambridge, MA: The MIT Press, 1966.
Bay Area Rapid Transit District (BART), San Mateo County Transit District,U.S. Department of Transportation. BART-SFO Extension, FinalEnvironmental Impact Statement/Final Environmental Impact Report.June 1996.
Beatty, David F., et al. Redevelopment in California. Point Arena, CA: SolanoPress, 1995.
Beatley, Timothy, and Kristy Manning. The Ecology of Place. Covelo, CA:Island Press, 1997.
Bernick, Michael, and Robert Cervero. Transit Villages in the 21st Century.New York: McGraw-Hill, 1997.
Bossard, Earl G., and Tara Kelly. “Envisioning the Quality of Life and Contextfor Development in Neighborhoods with Transit OrientedDevelopment Potential.” In Proceedings of The Second InternationalConference on Quality of Life in Cities. 2:334-352. Singapore: Schoolof Building and Real Estate, National University of Singapore, 2000.(Reproduced as file BK_EQOL.ppt)
Mineta Transportation Institute
Bibliography126
Brower, Sidney. Good Neighborhoods—A Study of In-Town & SuburbanResidential Environments. Westport, CT: Praeger, 1996.
Calthorpe, Peter. The Next American Metropolis: Ecology, Community, andthe American Dream. New York: Princeton Architectural Press, 1993.
Cervero, Robert. The Transit Metropolis: A Global Inquiry. Covelo, CA:Island Press, 1998.
_____. Transit-Supportive Development in the U.S. Washington, D.C.: FederalTransit Administration, 1993.
Colman, Steve. San José State University, URBP 226 Course Reader. Fall1999. San José State University Department of Urban and RegionalPlanning.
Congress for the New Urbanism. Charter of the New Urbanism. New York:McGraw-Hill, 2000.
Corbett, Judy, and Michael Corbett. Designing Sustainable Communities:Learning from Village Homes. Covelo, CA: Island Press, 2000.
Duany, Andres, Elizabeth Plater-Zyberk, and Jeff Speck. Suburban Nation:The Rise of Sprawl and the Decline of the American Dream. New York:North Point Press, 2000.
Federal Transit Administration. Planning for Transit-Friendly Use: AHandbook for New Jersey Communities. 1994.
Frank, Lawrence D. “Land Use and Transportation Interaction: Implicationson Public Health and Quality of Life.” Journal of Planning Educationand Research, Fall 2000.
Fulton, William. Guide to California Planning. Point Arena, CA: SolanoPress, 1999.
Holtzclaw, John. Using Residential Patterns and Transit to Decrease AutoDependence and Costs. San Francisco: Natural Resources DefenseCouncil, 1994.
Katz, Peter. The New Urbanism—Toward an Architecture of Community. NewYork: McGraw-Hill, Inc. 1994.
Kunstler, James Howard. Home From Nowhere. New York: Touchstone, 1996.
Lefaver, Scott. Private Land with Public Partnerships for Transit-BasedDevelopment. San Jose, CA: Norman Y. Mineta International Institutefor Surface Transportation Policy Studies, 1997.
Mineta Transportation Institute
Bibliography 127
Lynch, Kevin. A Theory of Good City Form. Cambridge, MA: MIT Press,1981.
Morris, Marya. Creating Transit-Supportive Land Use Regulations. Chicago:American Planning Association, 1996.
Parsons Brinckerhoff Quade & Douglas, Inc. Transit and Urban Form. TransitCooperative Research Program Report 16. Washington, D.C.: NationalAcademy Press, 1996.
Partners for Livable Communities. The Livable City: Revitalizing UrbanCommunities. New York: McGraw-Hill, 2000.
Porter, Dougles. Transit-Focused Development. Washington, D.C.: NationalAcademy Press, 1997.
Pushkarev, Boris S., and Jefferey M. Zupan. Public Transportation and LandUse Policy. Bloomington: Indiana University Press, 1977.
Smith, Wilbur. “Mass Transit for High-Rise, High-Density Living.” Journal ofMetropolitan Communities. Washington, D.C.: National AcademyPress, 1997.
Transit Cooperative Research Program. The Role of Transit in CreatingLivable Metropolitan Communities. Washington, D.C.: NationalAcademy Press, 1997.
_____. TCRP Report 16: Transit and Urban Form Vol. 1-2. Washington, D.C.:National Academy Press, 1996.
Untermann, Richard. Accommodating the Pedestrian: Adapting Towns andNeighborhoods for Walking and Bicycling. New York: Van NostrandReinhold, 1984.
Van der Ryn, Sim, and Peter Calthorpe. Sustainable Communities—A NewDesign Synthesis for Cities, Suburbs, and Towns. San Francisco: SierraClub Books, 1986.
1000 Friends of Oregon. Making the Connections: A Summary of the LUTRAQProject. Portland: 1000 Friends of Oregon, 1997.
DATABASE SOURCES
San Francisco Bay Area 1990 U.S. Census datawww.census.gov (particularly CD-ROMs of STF 3A & 1B data)
Mineta Transportation Institute
Bibliography128
Association of Bay Area Governments Projections’98 data www.bag.org “Services,” “Bay Area Information,” “Bay Area TransitInformation,” and “Local Government”
Internet links to BADGER-based digital ortho photoshttp://Badger.parl.com
Internet links to other dataCalifornia School data: http://greatschools.net/gas/find.htmlOakland Crime data: http://Oaklandnet.com “Crime Watch”
Mineta Transportation Institute
Acronyms and Abbreviations 129
ACRONYMS AND ABBREVIATIONS
2-D two-dimensional
3-D three-dimensional
ABAG Association of Bay Area Governments
BART Bay Area Rapid Transit
CD-ROM compact disc, read-only memory
CUPUM Computers in Urban Planning and Urban Management
DOP digital ortho photograph
EN Envisioning Neighborhoods
GIS geographic information system
GPS global positioning systems
ICQOLC International Conference on Quality of Life in Cities
LRT Light Rail Transit
MAUP modifiable areal unit problem
PO Project Overview
QOL quality of life
TOD transit-oriented development
VMT vehicle miles traveled
VTA (Santa Clara County) Valley Transit Authority
Mineta Transportation Institute

Acronyms and Abbreviations130
Mineta Transportation Institute
About the Authors 131
ABOUT THE AUTHORS
Team Leader: Earl G. Bossard, AICP
Dr. Bossard is a professor of Urban and Regional Planning at San José StateUniversity. He holds B.S. and M.S. degrees in economics from the Universityof Wisconsin-Milwaukee, and a Ph.D. in City and Regional Planning fromHarvard. He has worked extensively on computer applications for urbananalysis and planning, with special emphasis on geographic informationsystems, spreadsheets, and census data. He produced the final report andoversaw production of all project components, created EnvisioningNeighborhood concepts, photographed site areas, and produced PowerPointpresentations.
Steve Colman, AICP
Steve Colman is an adjunct faculty member of Urban and Regional Planning atSan José State University, specializing in transportation planning. He providedtechnical advice and many of the key readings for the literature review.Colman holds a B.A. degree in economics and a M.S. degree in transportationengineering science from the University of California, Berkeley. He is aprincipal of Dowling Associates with more than 22 years of experience intransportation planning.
Jeff Hobbs
Jeff Hobbs is a geography department student at San José State University, andprovided ArcView database and map production expertise. He worked withdigital ortho quads and provided Internet sources of data and programs. Hobbshas worked as a computer applications and mapping specialist for a number oflocal governments, including the Santa Clara County Planning Department andthe city of San Jose.
Brett Hondorp
Brett Hondorp is a student volunteer from the Urban and Regional PlanningDepartment. He created the draft of the TOD literature overview, which waspart of his planning report for the Master in Urban Planning degree he receivedfrom San José State University in the summer of 2000. Hondrop has worked asa planner for several planning firms and celebrated completion of his studiesby bicycling across the country from San Francisco to Washington, D.C. Hecurrently works as a bicycle, pedestrian, and trail planner from AltaTranasportation Consulting.
Mineta Transportation Institute
About the Authors132
Tara Kelly
Tara Kelly is a student of the Urban and Regional Planning Department. Sheproduced Fruitvale BART vicinity area study, undertook lead with school andcrime data, and edited text of the report. Kelly holds a B.A. degree fromWellesley College and has worked as the grants manager for the SpanishSpeaking Unity Council, which has taken a lead role in expediting theFruitvale Transit Village. Since the fall of 2000, she has worked as a plannerfor the city of San Jose.
Erin Mayer
Erin Mayer is a student of Urban and Regional Planning at San José StateUniversity. She undertook the Excel spreadsheet processing of census data,collected land use and zoning information, and helped to film several studyareas. Mayer has a B.S. degree from California State University, Sonoma, andis currently working as a planner for the City of San Jose.
Scott Plambaeck
Scott Plambaeck is an Urban and Regional Planning Department student. Heproduced the Campbell area case study, which started as a class project in hisspring 2000 class on introduction to GIS techniques. His undergraduate workwas undertaken at Humboldt State University, and he has worked for theplanning departments of Santa Clara County and the City of Morgan Hill.
Dayana M. Salazar
Dayana Salazar is an associate professor of Urban and Regional Planning atSan José State University, and oversaw the land use and zoning data collectionfor study areas. She received a bachelor’s degree in architecture, a professionaldegree from the Universidad Javeriana in Bogota, Colombia, and a Master ofCommunity Planning from the University of Cincinnati. Salazar is an associatewith Eduardo Martinez Architects and has worked extensively on urban designand community planning issues in the greater San Jose area.
Richard Taketa
Richard Taketa is an associate professor of geography at San José StateUniversity. He provided consultation on ArcView mapping, summarizing datain rings and sectors, and oversaw map database design and creation. ProfessorTaketa holds B.A. and M.A. degrees in geography from San José StateUniversity and a Ph.D. in geography, specializing in cartography, from theUniversity of Washington.
Mineta Transportation Institute
About the Authors 133
Andrea Subotic
Andrea Subotic is a graduate student of geography at San José StateUniversity. She produced the Sacramento area study, creating a variety ofArcView maps, Excel charts, and data layers, using U.S. Census data.
Tung Tran
Tung Tran is an Urban and Regional Planning Department student and startedthe Mountain View area study. He holds a degree in landscape architecturefrom the University of California, Davis, and won best student poster at theBay Area Automated Mapping Association poster conference in Oakland inNovember 1999 for his poster envisioning the Mountain View CalTrain andLTR station areas.
Pin-Yuan Wang
Pin-Yuan Wang is a student of Urban and Regional Planning and produced theRedwood City area case study, coproduced the Mountain View area casestudy, and filmed several study areas. Wang holds bachelor’s and master’sdegrees in landscape architecture from National Taiwan University and hasworked for the Association of Bay Area Governments.
Dali Zheng
Dali Zheng is a student of Urban and Regional Planning. He produced all themaps, charts, and digital images for the Hayward study. He produced severalcounty and region maps, including the animated density maps and mapsshowing as embedded bars the estimated numbers of residents and workerswithin one-half mile of transit stations. Zheng has a bachelor’s degree fromTongji University in Shanghai, China, and a Master of Civil Engineeringdegree from Tokyo University.
Mineta Transportation Institute

About the Authors134
Mineta Transportation Institute