Environmentally Sustainable and Integrated Energy …. Gujarat Energy Plan - ES.pdf ·...
38
2015 Environmentally Sustainable and Integrated Energy Strategies for Gujarat
Transcript of Environmentally Sustainable and Integrated Energy …. Gujarat Energy Plan - ES.pdf ·...
GUJARAT ENERGY STRATEGIES
2015
Environmentally Sustainable and
Integrated Energy Strategies for Gujarat

GUJARAT ENERGY STRATEGIES
2 | P a g e
Environmentally Sustainable and Integrated
Energy Strategies for Gujarat
Prepared by
Integrated Research and Action for Development (IRADe)
Submitted to
Energy and Petrochemicals Department
Government of Gujarat
&
Gujarat Power Corporation Limited,
Gandhinagar
December 2015
GUJARAT ENERGY STRATEGIES
3 | P a g e
Preface
A nation needs sustainable energy for development. The planet and its people are already paying the price of relying extensively on non-renewable sources of energy for extended period. That is why the concerns of their impact on the environment have become extremely critical in examining energy requirements. These include concerns about the local environment – air, water and soil pollution – and also for the global environment, i.e., climate change and ozone layer depletion.
This report looks at Gujarat’s energy situation, its resources and likely requirements in future and explores the options to meet them. These are considered in the context of energy access to all, energy security and also environmental considerations.
Gujarat’s energy sector is the most advanced and progressive in comparison with other states in India. In 2011 was 90% of the households were electrified and 38% had clean cooking fuels whereas these figures were a mere 67% and 28.5%, respectively for all of India. Gujarat’s per capita electricity consumption in 2013-14 was 1708 kWh compared to 957 kWh for all India despite the fact that there are very few energy resources in the state. Most villages get electricity round-the-clock. Farmers get electricity at prescribed hours and at stable voltage. It has one of the highest installations of solar power in India.
Gujarat is the second highest coal consuming state in India. This is despite the fact that it has no domestic resources of coal. It handles 66% of the country’s imports of petroleum products, 36% of imports of coal and 98% imports of LNG; 77% of POL exports and 100% of coal exports pass through its shores. It’s Vibrant Gujarat and other programmes encouraging investment in the state may also lead to growth in energy demand. It is thus challenging to study the current situation, develop scenarios for the future and make policy recommendations. In this context, IRADe has carried out a detailed analysis of energy demand for industry, agriculture and services sectors with perspectives up to 2035 and also suggested a supply strategy and made recommendations. Energy projections were made assuming 8% and 10% growth rates of the state GDP; it was also assumed in alternative scenarios that services and industry will lead the growth. It is noted that electricity requirement jumps from the present 68
bkWh to 243 and 324 bkWh in 2035 under the 8% and 10% growth rates with falling elasticity scenarios; the required installed capacity jumps to 3-4 times the present capacity of 21,500 MW. In the long run Gujarat will benefit from service led growth that will curtail demand for a state with meagre fossil fuel reserves and will also provide more jobs. To address the challenges arising from Gujarat’s ambitious development plans, the report strongly recommends energy efficiency measures, aggressive efforts in renewable energy while taking care of grid balancing and also at the same time providing energy access at affordable prices. We were helped in our endeavour by the senior officials of Gujarat Government and Gujarat Power Corporation Limited, who sponsored the study. We are grateful for the support extended by Mr L. Chuaungo, IAS, Principal Secretary (Power), Energy and Power Department, Government of Gujarat. We thank all stakeholders from Gujarat for their participation in discussions and their guidance and help. We are also grateful to Mr Rajendra Mistry, Chief Project Officer and Mr Kunal Vatsyayan, Sr. Officer Projects, of GPCL and other colleagues for facilitating this project and going to great lengths in helping us get the required data. This report has been presented to industry stakeholders and to Gujarat government officials. The meeting was chaired by Shri Saurabhbhai Patel, Minister for Energy along Sh. Govindbhai Patel, State Minister for Energy and Sh.G.R. Aloria, IAS, Chief Secretary, Government of Gujarat. The report was released by Hon’ble Chief Minister of Gujarat, Smt. Anandiben Patel on 19th January 2016 at Gandhi Nagar, Gujarat in the presence of Ms.S. Aparna, IAS, Principal Secretary and Shri Ajay Bhadoo, IAS, Secretary to Hon’ble Chief Minister of Gujarat, Shri.L. Chuaungo, IAS, Principal Secretary (Energy), EPD and Shri S. J. Haider, Secretary, Climate Change department, Government of Gujarat.
I would also like to thank Dr. Kirit Parikh and IRADe staff for the tireless efforts to prepare this report in a short time. We hope this report will not only help Gujarat, but also inspire others to think about energy future.
December 30, 2015 Dr Jyoti Parikh Executive Director, IRADe

GUJARAT ENERGY STRATEGIES
4 | P a g e
Hon'ble Chief Minister of Gujarat Smt. Anandiben Patel releasing the report "Environmentally Sustainable Integrated Energy Strategies for Gujarat",
prepared by IRADe on January 19th, 2016 at Gandhi Nagar, Gujarat
Dr. Jyoti Parikh, Hon'ble Chief Minister of Gujarat Smt. Anandiben Patel and Dr. Kirit Parikh at the release function in Gandhi Nagar
Hon’ble Minister for Energy Sh.Saurabh Bhai Patel, Hon’ble State Minister for Energy Sh.Govindbhai Patel and Sh.G.R.Aloria, IAS, Chief Secretary, and Senior Government of Gujarat Officials at the Meeting to discuss the report results at
Gandhi Nagar, Gujarat on 21.12.2015

GUJARAT ENERGY STRATEGIES
5 | P a g e
Stakeholder Consultations Meeting on 24.05.2015 at Gandhi Nagar along with State Government and Private Sector Energy and Power Officials

GUJARAT ENERGY STRATEGIES
6 | P a g e
Acknowledgements
IRADe acknowledges the support and help it received from various organisations, departments and
officials of the Government of Gujarat. IRADe especially thanks the officials of Energy and Petrochemicals
Department-GoG, GPCL, GSECL, GUVNL, GIDR, MGVCL, PGVVN, UGVNL, DGVVL, GMDC, GIDB, GIDC,
INDEXTB, GSPC, Socio-Economics Department, GIPCL, GEDA, GIPCL, Adani Power, Torrent Power, Essar
Power, Tata Power for providing valuable data, insights and in meeting IRADe staff and sharing their views
on the future of power generation and other related issues.
Data and reports from various Central Government ministries and departments, like the Ministry of
Power, Ministry of Coal, Ministry of New and Renewable Energy, DG Census, Planning Commission, CEA,
Ministry of Statistics and Programme Implementation, Ministry of Road Transport and Highways, Ministry
of Port and Shipping are also acknowledged.
IRADe specially acknowledges the help and support it received from, Shri.G.R.Aloria, IAS, Chief Secretary,
Shri.L. Chuaungo, IAS, Principal Secretary (Energy), EPD, Ms.S.Aparna, IAS, Principal Secretary and Shri
Ajay Bhadoo, IAS, Secretary to Hon’ble Chief Minister Gujarat, , Shri.P.H.Rana (Director), Shri.D.J.Pandian,
IAS, Ex. Chief Secretary, Government of Gujarat, Mr.Rajendra Mistry, Chief Project Officer and Mr.Kunal
Vatsayayan, Sr. Project Officer, GPCL, Government of Gujarat.
Shri S.B. Khyalia, Managing Director , MGVCC; Dr. Jayanti S. Ravi, Secretary and Commissioner (Rural Development); Shri Dhananjay Dwivedi, Secretary , DST; Shri S. J. Haider, Secretary , Climate Change department; Smt. Shobhana Desai, Additional Secretary (Petrochemical), Energy & Petrochemicals Department, GoG., Shri H.F. Gandharva, Joint Secretary (Energy) Energy & Petrochemicals Department, GoG.; Shri P.L. Panchal, Dy. Secretary (Co-ordination) Energy & Petrochemicals Department; Shri Anupam Anand, Managing Director , UGVCL; Shri J. K. Vyas, Vice President (Corporate Affairs), GUDC Ltd; Shri Dipen Chauhan, Sr. V.P.(Commercial), Gujarat Gas Limited; Shri U. C. Patel, Chief Engineer (TR) , GETCO; M. B. Jadeja, Ex. Director (Technical ), PGVCL; Shri K. H. Chorera, OSD (Power) , Energy & Petrochemicals Department EPD; Smt. Shahmeena Husain, Director Administration, GUVNL; Shri A.B. Jaiswal, EE(Environment), GSECL Co , Vadodara; Shri C.C.Gandhi, Supdt. Engg, UGVCL; Shri. Shewtal Shah, Technical Advisor, Climate Change Department; Mr.Pankaj Kumar, IAS (MD), GMDC, Mr.R.N.Pandey, GM (R&D), GSPC, Mr.Jagdish Shah, GM (IP) I/C and Mr.Hemanshu Bhagat (PE), iNDEXTb (Vibrant Gujarat), Mr.S.P.Desai (CGM &CFO), and Mr.Y.J.Bhatt (AGM-BO), GIPCL, Mr.S.B.Patil (Dep. Dir I/C) and Mr.A.K.Chauhan (SPE), GEDA, Mr.B.P.Pati, IFS (CGM), and Mr.A.L.Thakor (GM-PRD/LPS), GMDC, Mr.K.P.Jangid (GM-Com), GUVNL, Mr.N.BoseBabu (GM-TS&OM), GSPL, Mr.P.K.Vishwanathan (Asso. Prof.), GIDR, Mr.Shiv Chaudhary (GM-Engg), Adani Power, Mr.Chetan Bundela (GM), Torrent Power, Mr.R.M.Bhadang (I/C CFM), Mr.Vijay Jani (CS), Ms.Bela Jani (EE-P&P), GSECL. Dr.Pradeep Kumar Dadhich, Deputy Director IRADe is acknowledged for sharing views and providing guidance on important aspects related to the project. Mr.Mohit Kumar Gupta, Project Associate and Mr.Pushkar Pandey, Research Associate IRADe are duly acknowledged for helping out with survey, data collection, and editing.
IRADe Project Team
Dr. Kirit Parikh, Chairman Dr. Jyoti Parikh, Executive Director
Er. Sharad Verma, Assistant Director Er. Bhaskar Roy Karmaker, Research Analyst
Er. Vinay Saini, Research Analyst
GUJARAT ENERGY STRATEGIES
7 | P a g e
Abbreviations
CAGR COMPOUNDED ANNUAL GROWTH RATE CC CDM
COMBINED CYCLE CLEAN DEVELOPMENT MECHANISM
CNG COMPRESSED NATURAL GAS CWET CENTRE FOR WIND ENERGY TECHNOLOGY DAU DYNAMICS AS USUAL DMIC DELHI-MUMBAI INDUSTRIAL CORRIDOR ECBC EPS GEDA
ENERGY CONSERVATION BUILDING CODE ELECTRIC POWER SURVEY GUJARAT ENERGY DEVELOPMENT AGENCY
GERC GUJARAT ELECTRICITY REGULATORY COMMISSION GETCO GUJARAT ENERGY TRANSMISSION CORPORATION GHG GREEN HOUSE GAS GIDB GUJARAT INDUSTRIAL DEVELOPMENT BOARD GIDR GUJARAT INSTITUTE FOR DEVELOPMENT RESEARCH GIPCL GUJARAT INDUSTRIAL POWER CORPORATION LIMITED GoG GOVERNMENT OF GUJARAT GoI GOVERNMENT OF INDIA GPCL GUJARAT POWER CORPORATION LIMITED GSDP GROSS STATE DOMESTIC PRODUCT GSEB GUJARAT STATE ELECTRICITY BOARD GSECL GUJARAT STATE ELECTRICITY CORPORATION LIMITED GSPC GUJARAT STATE PETROLEUM CORPORATION LIMITED GUVNL GUJARAT URJA VIKAS NIGAM LIMITED HHS HSDO
HOT HEAVY STOCK HIGH SPEED DIESEL OIL
IGCC INDEXTB
INTEGRATED GASIFICATION COMBINED CYCLE INDUSTRIAL EXTENSION BUREAU
IRADe INTEGRATED RESEARCH AND ACTION FOR DEVELOPMENT JGY JYOTIGRAM YOJANA km KILOMETRE LNG/LPG LIQUIFIED NATURAL GAS/ LIQUIFIED PETROLEUM GAS LSHS MCM MNRE
LOW SULPHUR HEAVY STOCK MILLION CUBIC METRES MINISTRY OF NEW AND RENEWABLE ENERGY
MoSPI MINISTRY OF STATISTICS AND PROGRAMME IMPLEMENTATION MoU MEMORANDUM OF UNDERSTANDING MSO MOTOR SPIRIT OIL mtoe MILLION TONNES OF OIL EQUIVALENT MU MILLION UNITS MW MEGA WATT NAPCC OC PAT PLF
NATIONAL ACTION PLAN ON CLIMATE CHANGE OPEN CYCLE PERFORM, ACHIEVE AND TRADE PLANT LOAD FACTOR
PNG PIPED NATURAL GAS POL PPA
PETROLEUM, OIL AND LUBRICANTS POWER PURCHASE AGREEMENT
GUJARAT ENERGY STRATEGIES
8 | P a g e
PV RE
PHOTOVOLTAIC RENEWABLE ENERGY
REC RENEWABLE ENERGY CERTIFICATES RES RENEWABLE ENERGY SOURCES RPO SEZ
RENEWABLE PORTFOLIO OBLIGATION SPECIAL ECONOMIC ZONES
SPV SOLAR PHOTO VOLTAIC

GUJARAT ENERGY STRATEGIES
9 | P a g e
Contents
PREFACE ................................................................................................................... 3
ACKNOWLEDGEMENTS ................................................................................................. 6
ABBREVIATIONS .......................................................................................................... 7
1. BACKGROUND ................................................................................................... 10
2. CHALLENGES ...................................................................................................... 10
3. ECONOMY .......................................................................................................... 10
4. ENERGY SCENE ................................................................................................... 11
5. OVERALL CONSUMPTION ................................................................................... 13
6. ENERGY RESOURCES OF THE STATE .................................................................... 13
7. PROJECTIONS OF ELECTRICITY REQUIREMENT .................................................... 14
8. PETROLEUM PRODUCTS AND NATURAL GAS REQUIREMENTS FOR GUJARAT ..... 16
9. ENERGY SUPPLY OPTIONS FOR GUJARAT ........................................................... 18
10. COSTS AND EMISSIONS .................................................................................... 22
11. POLICIES FOR GUJARAT .................................................................................... 27
12. CONCLUDING OBSERVATIONS .......................................................................... 35
GUJARAT ENERGY STRATEGIES
10 | P a g e
The study was sponsored by Gujarat Power
Corporation Limited (GPCL), an organisation
under the Energy and Petrochemicals
Department of Government of Gujarat.
1. Background
Integrated long term planning for Power and
Energy to sustain reliable supply is essential for
sustainable long-term socio-economic growth.
This energy policy document addresses various
challenges envisaged for the state of Gujarat,
assesses energy requirement for next 2 decades
and suggests policies formulated with an
integrated approach. The major objectives
envisaged for the project are:
To forecast the requirements of power and
energy in Gujarat for various sectors (industry,
agriculture and services) over the next 20 years
in tandem with economic development.
To suggest an integrated Energy Strategy for
the state, addressing supply options,
environmental impacts and energy efficiency
that ensure access to energy for every
household and to suggest policy to implement
the strategy.
2. Challenges
A robust energy strategy is essential for Gujarat
to continue to develop with double-digit growth
rate. Integrated long term planning for power
and energy to sustain reliable supply is critical
for sustainable socio-economic growth. This
energy strategy will address the following
challenges that are likely to come up:
Rapid industrialisation all over the
state. Vibrant Gujarat Model and its
impact on the structure of the
economy
Rapid urbanisation
Buoyant agriculture that requires
electricity
Constrained energy resources like coal
for energy generation; issues related to
gas supplies
Environmental concerns arising from
use of fossil fuels
Changing structure of energy and
power demand due to shift in economy
Increasing population and economic
improvement leading to higher demand
3. Economy
Gujarat’s GDP has been registering a growth of
around 10% during the past decade. Figure1
shows the trend of the State GDP while Figure2
shows the shares of sectors in the State GDP.
Shares of primary, secondary and tertiary
sectors have been reported at 11.10%, 39.2%
and 49.7%, respectively in the total State GDP in
2012-13 at 2004-05 prices. There is a marked
shift in the economy of the state from being
agriculture oriented to being industry and
services oriented.
Traditionally service sector included low cost
services, small traders and small and
medium scale activities including
transportation. Since the last 2 decades, there
has been a big boom of banking, financial and
tourism services. However, in the current
decade and forthcoming future, a big boost is
expected from IT, Knowledge industries and on-
line retail and booking activities. Thus the range
of service sector has expanded in terms of scope
and value. Indeed, the developed countries have
service sector share exceeding industry sector
and account for more than 50% share of GDP.

GUJARAT ENERGY STRATEGIES
11 | P a g e
Source: Socio-Economic review 2014-15, Government of Gujarat and Vibrant Gujarat, 2015 brochure
4. Energy Scene Energy consumption in Gujarat is predominan-
tly based on fossil fuels (petrol, diesel, kerosene,
LPG, coal, lignite, natural gas) and electricity,
which are the main commercial fuels. A detailed
analysis of these fuels is taken up with respect to
present consumption patterns, future
requirements and policies to meet these
requirements.
a. Electricity
Gujarat generates the bulk of electricity it needs
within the state; it also gets a share of electricity
from Central Sector plants. This share has
increased from 12% (@ 580MW) in 1990 to 21%
(@ 3,890 MW) in 2014. Thus development of the
Central Sector is of some relevance to Gujarat.
The state’s overall installed capacity of power
generation has increased from 4,823MW in 1990
to 18,510 MW in 2014 showing a compound
annual growth rate (CAGR) of 5.15% over the
past 2 decades. Over1990-2014 the CAGR of the
installed capacity of the state government run
power plants has been 1.54%, of the
autonomous public sector state government
companies 17.60%; the private independent
power producers’ plants (IPP) have shown a
robust growth of 11.55% and the Central Sector
power plants have grown at 7.85% annually. In
recent years, the maximum growth has been
registered by the public sector state government
sector followed by private sector.
It is interesting to note that the private sector
share has risen from 10% (495 MW) in 1990 to
41% (7,607 MW) in 2014. The private sector
continues to grow at a faster pace with a growth
rate exceeding 15% since 2002. The active
participation of the private sector is indicative of
the good functioning of the sector with
appropriate pricing policy and collection of bills.
A look at the fuel-wise capacity generation in the
state shows that fossil fuel still has the major
share (93%) whereas hydro and nuclear
comprise only 7% of the total power generation.
There is a huge dependence on conventional
fuels for power generation and hence the
environmental impact (land, air and water
pollution) of these plants is also large.
Even though Gujarat has no coal resource of its
own, it is the main fuel for power generation.
0
500000
1000000
1500000
2000000
2500000
3000000
3500000
4000000
4500000
5000000
19
91
-92
19
93
-94
19
95
-96
19
97
-98
19
99
-00
20
01
-02
20
03
-04
20
05
-06
20
07
-08
20
09
-10
20
11
-12
20
13
-14
Figure-1 Gujarat state GDP (in Million INR) at 2004-05 constant prices
0%
10%
20%
30%
40%
50%
60%
70%
80%
90%
100%
19
90-9
1
19
92-9
3
19
94-9
5
19
96-9
7
19
98-9
9
20
00-0
1
20
02-0
3
20
04-0
5
20
06-0
7
20
08-0
9
20
10-1
1
20
12-1
3
Figure-2 Sectoral shares of SGDP in Gujarat
Agriculture & Allied Industry Sector Services Sector
GUJARAT ENERGY STRATEGIES
12 | P a g e
Coal price and availability will continue to
remain of great importance to Gujarat.
Electricity Generation
The power supply of Gujarat has improved in the
last few years. Year 2012 showed nearly zero per
cent deficit. Since then Gujarat has been a power
sufficient state. The generation of electricity has
increased from 22,834 Million Units (MU) in
1990 to 86,221 MU in 2014, a fourfold jump. The
private sector power generation has jumped 19
fold.
Electricity Consumption
The total electricity consumption in Gujarat
shows an average growth of 5.81% during the
past two decades. Consumption increased from
17,875 MU in 1988 to 68,628 MU in 2014. The
per capita electricity consumption increased
from 363 kWh/year in 1988-89 to 1,708 kWh in
2013-14, which is nearly twice the national
average of around 957 kWh.
Rapid urbanisation, industrialisation, improved
electricity supply and improving economic
conditions have led to this rise in the
consumption rate over the decades. The Vibrant
Gujarat initiative, the Delhi Mumbai Industrial
Corridor (DMIC), development of Petroleum,
Chemicals and Petrochemical Investment Region
(PCPIR), Special Economic Zones (SEZ) and other
industries will further shoot up electricity
consumption in the coming years. With rising
per capita incomes and increasing electrical
assets in both rural and urban households the
power sector will play an important role in the
future.
Sector-wise share of electricity
consumption in Gujarat
In 2013-14 the share of electricity consumption
in various sectors for Gujarat was as follows:
Industry had the highest share with 43%
Agriculture sector followed with 22%
Domestic sector was 16%
Other sectors 13%
Commercial sector 2.5%
Public water works, public lighting and
railway traction constituted the balance
4%
While electricity consumption has doubled in a
few sectors like domestic, commercial and water
works over the past few decades, industrial
consumption has tripled, showing a trend
towards industrialisation.
Benefits of un-bundling of the electricity sector
in Gujarat
Gujarat is one of the few states in the country
that has successfully unbundled its electricity
sector. This has resulted in increase in profit for
all the group companies, improved service
delivery and customer satisfaction, increase in
revenue generation and revenue collection and
reduction in transmission and distribution (T&D)
losses with 100% metering and billing of all
consumers.
b. Fossil Fuels
Consumption of fossil fuels in Gujarat has been
analysed for various primary and secondary
fuels. Major fuels analysed are LPG, naphtha,
motor spirit/petrol, kerosene, high speed diesel
oil (HSDO), light diesel oil, furnace oil, low
sulphur heavy stock (LSHS)/hot heavy stock
(HHS) and natural gas. Interesting facts have
emerged while assessing the consumption
patterns of individual fuels. Several internal and
external factors play a role in fuel consumption
even at the state level. While some fuels have
shown a smooth growth trend like LPG and
petrol, some fuels, like naphtha, have shown
very abrupt changes in consumption patterns as
consumers react to changing relative prices and
switch fuels. Also, commissioning of a large
industrial unit, such as a fertiliser plant, can
substantially boost naphtha or gas consumption
as a feedstock.

GUJARAT ENERGY STRATEGIES
13 | P a g e
5. Overall Consumption
The overall energy consumption in the state has
increased from 10 to 36 million tonne of oil
equivalent (mtoe) over the last 25 years. It has
been growing at a CAGR of 5.19% during this
period; in the last 10 years it grew at 6.71% but
at only 2.17%in the last 5 years. The sudden
jump between 2007 and 2009 is mainly
attributed to the consumption of naphtha as a
fuel in power generation and as feedstock in
fertiliser and petrochemicals. Figure3 shows the
shares of various fuels consumed in Gujarat. As
can be seen there are marked differences in
consumption over a period of time in the shares
of naphtha, LSHS/HHS and kerosene. Figure4
shows the trends in the consumption of all the
fuels in mtoe.
It is seen that the share of electricity is around
48% in the state’s energy mix and is increasing.
The share of transport fuels, petrol plus diesel,
fluctuated between 12.9 % and 15.6%. The
share of naphtha increased from 5.42% in 1991
to nearly 18% in 2013. The share of kerosene
came down from 5.42% in 1992 to 1.57% in
2013, reflecting the success of Jyotigram Yojana
and the spread of LPG and piped natural gas.
Jyotigram Yojana is an initiative of the state
government to deliver 24-hour power supply to
rural areas.
6. Energy Resources of the State
Energy resources such as coal, oil gas and lignite
in India belong to the Central government. While
the state in which the resource lies gets a
royalty, it can be mined only with the permission
of the Centre; its allocation is also done by the
Centre. While Gujarat has hydrocarbon reserves
like lignite, crude oil and natural gas, its major
fuel source for generating power which is coal is
nil. Gujarat, therefore, has to depend largely on
renewable resources if it wants to reduce its
energy dependence on other states or imports.
The strategic location of Gujarat places it
amongst the top states as far as potential for
renewable energy (RE) resources is concerned.
As of FY 2013-14 the total RE potential in the
state is 36,956 MW (excluding solar) out of
which wind potential is 35,071 MW, small hydro
110 MW, biomass power is 1333 MW,
cogeneration 350 MW and waste to energy
(WTE) is 112 MW. The overall reserves and
potential energy resources for Gujarat are
presented in Table1.
0
50
100
19
89
19
91
19
93
19
95
19
97
19
99
20
01
20
03
20
05
20
07
20
09
20
11
20
13
Shar
e-
Pe
rce
nta
ge
Figure- 3 Annual share of fuels in Gujarat (mtoe)
LPG NapthaMS/ Petrol KeroseneHSDO LDOFurnace Oil Electricity (MU-kWh)LSHS/HHS Others
0
10
20
30
40
19
89
19
91
19
93
19
95
19
97
19
99
20
01
20
03
20
05
20
07
20
09
20
11
20
13
Co
nsu
mp
tio
n in
mto
e
Figure-4 Overall energy consumption in Gujarat (mtoe)
Electricity LPG MS/ Petrol Kerosene
HSDO LDO Furnace Oil LSHS/HHS
Natural Gas Naptha Others

GUJARAT ENERGY STRATEGIES
14 | P a g e
Table-1 Gujarat overall reserves and potentials
(Current production/capacity 2013-14)
Energy Source Unit Total
Gujarat India
Reserves
Coal Billion Tonnes 0 301.56
Lignite Billion Tonnes 2.72 43.24
Crude Oil Million Tonnes 135.72 762.74
Natural Gas BCM 72.96 1427.15
Potentials
Wind @80m (MW) 35071 102772
Solar (MW) 35770 748990
Small Hydro (MW) 202 19749
Biomass Power (MW) 1221 17538
Cogeneration (MW) 350 5000
Waste to Energy (MW) 112 2556
Source: Energy Statistics 2015, MOSPI, GoI, MNRE, GoI, MoP, MNRE, CWET, GEDA
7. Projections of Electricity
Requirement
While analysing the future requirement,
electricity has been given significant
importance, as it constitutes around 50% of the
overall energy requirement in the state. Energy
requirement projections are made keeping in
view various time-series data for different fuels
and presenting multiple scenarios like dynamics-
as-usual (DAU) with 8% growth rate of state GDP
(SGDP), with high growth rate of SGDP (10%),
energy efficiency (falling elasticities), etc. Other
parameters considered are population,
energy/SGDP, different sectoral growth
patterns, etc. The projections for the next 20
years are based on suitable projection methods
like regression framework that accounts for
auto-correlation. Constant elasticity and
assumption of falling elasticity is undertaken
with the idea of business-as-usual scenario and
a plausible improvement in energy efficiency the
period.
By 2035 the requirement for electricity is
projected to increase from 68 bkWh in 2013 to
274 bkWh with 8% growth rate of SGDP and to
378 bkWh with the higher growth rate of 10% in
case of constant elasticity. These imply that in 22
years electricity requirement would be 4 to 5.5
times. Correspondingly, the capacity will be 3.7
times to 4.5 times the 23.8 GW of installed
capacity in 2013. As can be seen in Table3 the
installed capacity needs to be scaled up faster to
meet the future electricity requirements.
Table-2 Elasticity of per capita total electricity consumption with respect to per capita SGDP
Nature of Elasticity Period Value of Elasticity
Constant 2004-2013 0.81~( Adjusted R-Square=0.99)
Falling 2014-2025 0.75*
2026-2035 0.70* Note: Estimated using data from 2004 to 2013. ~ indicates the estimated elasticity significant at 1% level and * indicates assumed elasticity.

GUJARAT ENERGY STRATEGIES
15 | P a g e
Table-3 Total electricity requirement projection with the assumption of constant elasticity
during 2014-2035 for 2 SGDP growth scenarios
Year Consumption (MU)
Losses (TD and others)
Generation at Bus Bar (MU)
Peak Demand (MW)
Installed Capacity(MW)*
Case: 8% SGDP Growth Rate
2020 107044 0.196 133139 21109 37089
2025 147150 0.184 180331 29408 50611
2030 201361 0.167 241730 39421 66700
2035 274477 0.150 322914 52660 76884
Case: 10% SGDP Growth Rate
2020 118491 0.196 147377 23366 37886
2025 175144 0.184 214637 35003 54581
2030 257706 0.167 309371 50452 76160
2035 377720 0.150 444376 72468 105933
* Includes capacity required for electricity imported in the state
The projections in Table 4, where falling
elasticities are assumed to reflect increasing
energy efficiency, show that in 2035 electricity
requirement would be 12% and 14% lower with
SGDP growth rates of 8% and 10%, respectively,
and that the required installed capacity would
be lower by 19 GW and 15 GW, respectively, as
compared to the constant elasticity scenario and
is much more likely be consistent with improving
energy efficiencies in all sectors.
Sectoral projections for electricity
Energy requirement depends not just on the
growth rate of the economy but also on its
sectoral composition. The share of industrial
GDP is much higher in Gujarat’s SGDP than in the
national economy. Under the Vibrant Gujarat
initiatives this share might become even larger.
This will impact electricity requirement. We now
explore this.
To project the electricity requirement in each
sector under two scenarios– 8% and 10% growth
rates–we assume for each scenario two
alternative compositions of sector-wise
contribution to total SGDP. In the first case, we
assume the share of agriculture, industry and
services in terms of SGDP are 10%, 35% and 55%,
respectively in 2035. In the second case, these
shares are assumed to be 7%, 50% and 43% for
agriculture, industry and services, respectively.
The first assumption of sector-wise composition
reflects an optimism of relatively higher growth
in the service sector and growth trajectory
observed in many industrialised countries. The
second assumption of sector-wise composition
takes into account the visionary approach of the
state government in creating investor friendly
ambience and possible resultant higher
contribution of the industry sector in state GDP;
it reflects the emphasis on industrial growth in
Vibrant Gujarat and Make-in-India campaigns of
the Prime Minister to make India a global
manufacturing hub. Gujarat can be expected to
spearhead this campaign.

GUJARAT ENERGY STRATEGIES
16 | P a g e
Table-4 Total electricity consumption projection with the assumption of falling elasticity during 2014-2035 for 2 SGDP growth scenarios
Year Consumption (MU)
Losses (TD and others)(MU)
Generation at Bus Bar(MU)
Peak Demand(MW)
Installed Capacity(MW)*
Case: 8% SGDP Growth Rate
2020 104032 0.196 129393 20515 33263
2025 140124 0.184 171721 28004 43668
2030 185091 0.167 222198 36236 54700
2035 243542 0.150 286520 46725 68302
Case: 10% SGDP Growth Rate
2020 114230 0.196 142077 22526 36524
2025 164489 0.184 201580 32873 51261
2030 231301 0.167 277672 45282 68357
2035 323993 0.150 381168 62161 90865
*Includes capacity required for electricity imported in the state
Electricity Requirement – Summary
Giving a summary of the projected
requirements, Table5 shows the projections of 4
scenarios.
a) DAU – Dynamics as usual with constant
elasticity
b) Energy Efficiency – Falling elasticity
c) Service Dominated Growth – based on
growing share of services in SGDP
d) Vibrant Gujarat /Make-In-India based
on industry dominated growth of SGDP
The table-5 also shows the projections made by
the 18thElectric Power Survey (EPS)of Gujarat,
are close to our DAU projection with constant
elasticities and 10% growth rate of SGDP. These
requirements depend upon policies and
measures introduced. While considering supply
strategies the impact on electricity requirement
of policies and growth pattern would be
appropriately adjusted.
Table-5 Electricity requirements of Gujarat in bkWh
Projection Parameter 8% SGDP Growth Rate 10% SGDP Growth Rate
2020 2025 2030 2035 2020 2025 2030 2035
Constant Elasticity 107 147 201 274 119 175 258 378
Falling Elasticity 104 140 185 243 114 164 231 324
Service led – Falling Elasticity
107 140 185 242 115 168 236 332
Industry led – Falling Elasticity
107 150 203 278 118 179 262 386
CEA 112 186* 256* --
* Figures interpolated from CEA data presented in Appendix
8. Petroleum Products and
Natural Gas Requirements for
Gujarat
Petroleum products are integral inputs for a
range of activities like transport, power
generation, industry, agriculture, mining and
construction, manufacturing, services,
chemicals and petroleum derivatives, etc. They
GUJARAT ENERGY STRATEGIES
17 | P a g e
form the backbone in the overall economic
growth and development. Petroleum products
are a major driver for many energy applications
and industries in the state. The demand for
petroleum products is also growing with
increasing number of vehicles, power plants,
industries and overall growth of infrastructure
projects in the state.
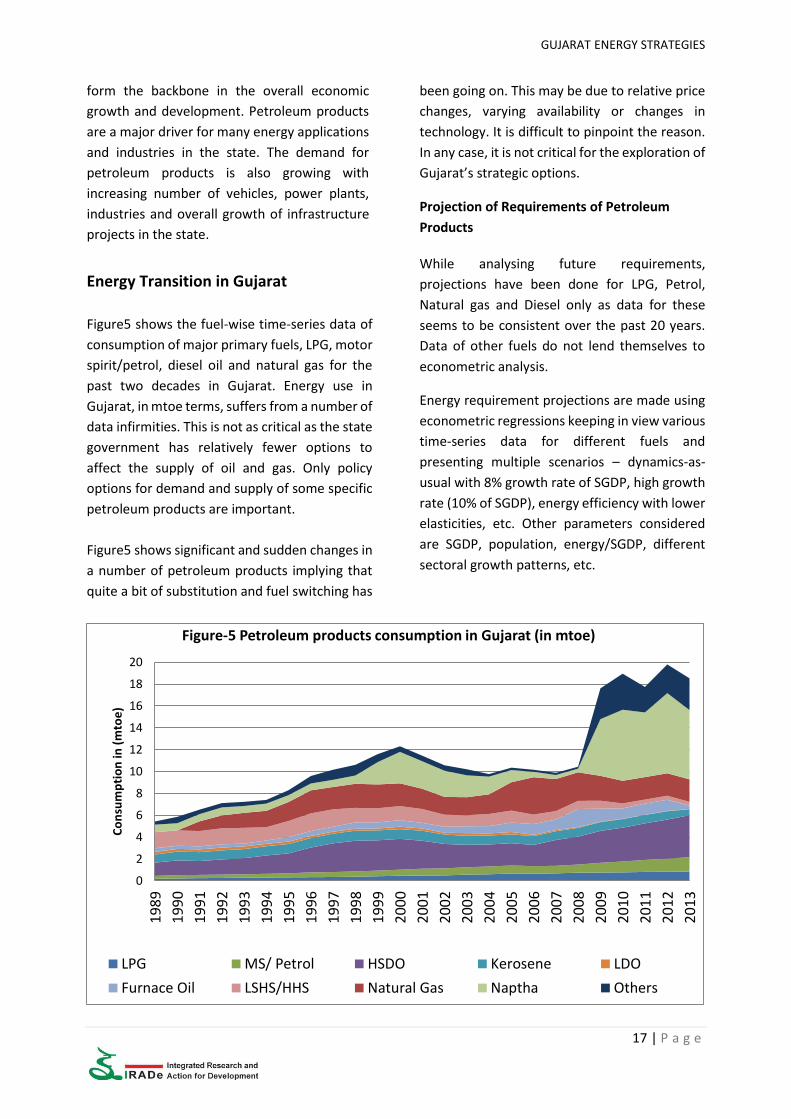
Energy Transition in Gujarat
Figure5 shows the fuel-wise time-series data of
consumption of major primary fuels, LPG, motor
spirit/petrol, diesel oil and natural gas for the
past two decades in Gujarat. Energy use in
Gujarat, in mtoe terms, suffers from a number of
data infirmities. This is not as critical as the state
government has relatively fewer options to
affect the supply of oil and gas. Only policy
options for demand and supply of some specific
petroleum products are important.
Figure5 shows significant and sudden changes in
a number of petroleum products implying that
quite a bit of substitution and fuel switching has
been going on. This may be due to relative price
changes, varying availability or changes in
technology. It is difficult to pinpoint the reason.
In any case, it is not critical for the exploration of
Gujarat’s strategic options.
Projection of Requirements of Petroleum
Products
While analysing future requirements,
projections have been done for LPG, Petrol,
Natural gas and Diesel only as data for these
seems to be consistent over the past 20 years.
Data of other fuels do not lend themselves to
econometric analysis.
Energy requirement projections are made using
econometric regressions keeping in view various
time-series data for different fuels and
presenting multiple scenarios – dynamics-as-
usual with 8% growth rate of SGDP, high growth
rate (10% of SGDP), energy efficiency with lower
elasticities, etc. Other parameters considered
are SGDP, population, energy/SGDP, different
sectoral growth patterns, etc.
0
2
4
6
8
10
12
14
16
18
20
19
89
19
90
19
91
19
92
19
93
19
94
19
95
19
96
19
97
19
98
19
99
20
00
20
01
20
02
20
03
20
04
20
05
20
06
20
07
20
08
20
09
20
10
20
11
20
12
20
13
Co
nsu
mp
tio
n in
(m
toe
)
Figure-5 Petroleum products consumption in Gujarat (in mtoe)
LPG MS/ Petrol HSDO Kerosene LDO
Furnace Oil LSHS/HHS Natural Gas Naptha Others

GUJARAT ENERGY STRATEGIES
18 | P a g e
Table-6 Projection of primary fuels under two different assumptions of growth rate of SGDP
Case: 8% SGDP growth rate
Fuel-wise requirement(mtoe) 2013 2020 2025 2030 2035
LPG 0.85 1.158 1.435 1.769 2.174
Petrol 1.31 1.912 2.488 3.224 4.161
HSDO 3.84 4.943 5.881 6.966 8.219
Natural Gas 2.05 2.503 2.869 3.273 3.719
Case: 10% SGDP growth rate
Fuel-wise requirement(mtoe) 2013 2020 2025 2030 2035
LPG 0.85 1.229 1.590 2.047 2.625
Petrol 1.31 2.071 2.853 3.913 5.347
HSDO 3.84 5.162 6.337 7.743 9.424
Natural Gas 2.05 2.575 3.010 3.504 4.062
The projected requirement of these products
with 8% and 10% growth rates are shown in
Table 6. It can be seen that petrol requirement
in 2035 with 10% growth rate is four times the
requirementin2013; with 8% growth rate it is
3.18 times the requirement in 2013. LPG
requirement in 2035 with 10% growth rate
would be more than tripled from the
requirement in 2013. With a growth rate of 10%
of SGDP Gujarat will need more than 21mtoe of
these products in 2035. The requirement can be
brought down with fuel substitution and fuel
efficiency. These will be explored when we look
at supply options.
9. Energy Supply Options for
Gujarat
The state’s energy supply strategy will depend
on its projected requirement. Since the state
government has more control over electricity
supply, we first explore alternatives for
electricity supply.
Electricity Supply Options
While exploring the electricity supply strategies
for Gujarat, the following need to be kept in
mind.
a. Energy Efficiency: Energy efficiency is the most
important resource as appropriate demand side
measures (DSM) could substantially reduce
electricity or capacity requirements. We have
assumed that the impact of DSM is reflected in
our falling elasticity assumption. The difference
in peak demand in 2035 between constant
elasticity and falling one is 11% for 8% growth
rate and 14% for 10% growth rate. We have,
therefore, explored supply options for scenarios
with only falling elasticity.
b. Own Resources: Among the conventional fossil
fuel resources coal is almost absent in Gujarat.
Lignite is limited to plants of about 5,000 MW
for their lifetime of 35 years. The share of
Gujarat in natural gas produced in the state
depends on the Central government’s policy on
imports and pricing. The same holds true for oil.
Hydro is limited and almost all aspects of
nuclear plants depend on central policy.
Nuclear plants usually take a long time to
complete, so there is an element of uncertainty.
c. Renewable: Renewables, wind and solar,
provide substantial scope but have their
limitations as they are not available on demand
and require balancing power from balancing
sources such as hydro, open cycle gas plants or
electricity storage. Thus, in exploring supply
options, we have given particular attention to
the absorption of substantial levels of
renewable capacities and their implications for
costs, balancing capacities and emissions.
GUJARAT ENERGY STRATEGIES
19 | P a g e
We have developed a capacity planning model
that minimises the cost of generating electricity
to meet the hourly demand for a peak demand
day. A representative load pattern
corresponding to a day in October, which is the
month with the highest demand over the past
few years, is taken with its daily load curve.
Electricity required at the bus bar is produced by
different types of plants to meet projected
demand for 2035 for every hour of the day. The
model determines capacities of different plants
by minimising levelized cost of generation. The
options considered are sub-critical coal plants,
super-critical coal plants, lignite, closed cycle
gas, open cycle gas, nuclear, hydro, small hydro
plants, biomass, on shore wind, solar
photovoltaic (PV), solar thermal and solar PV
with storage.
Upper bounds of the generating capacities of
different types of plants are prescribed to reflect
the resources availability. In different scenarios
minimum capacities of certain types of plants
are prescribed to reflect existing capacities and
planned development and to explore the
consequences of pushing in renewables. We do
not prescribe installed capacity, as it will depend
upon the mix of plants with their various
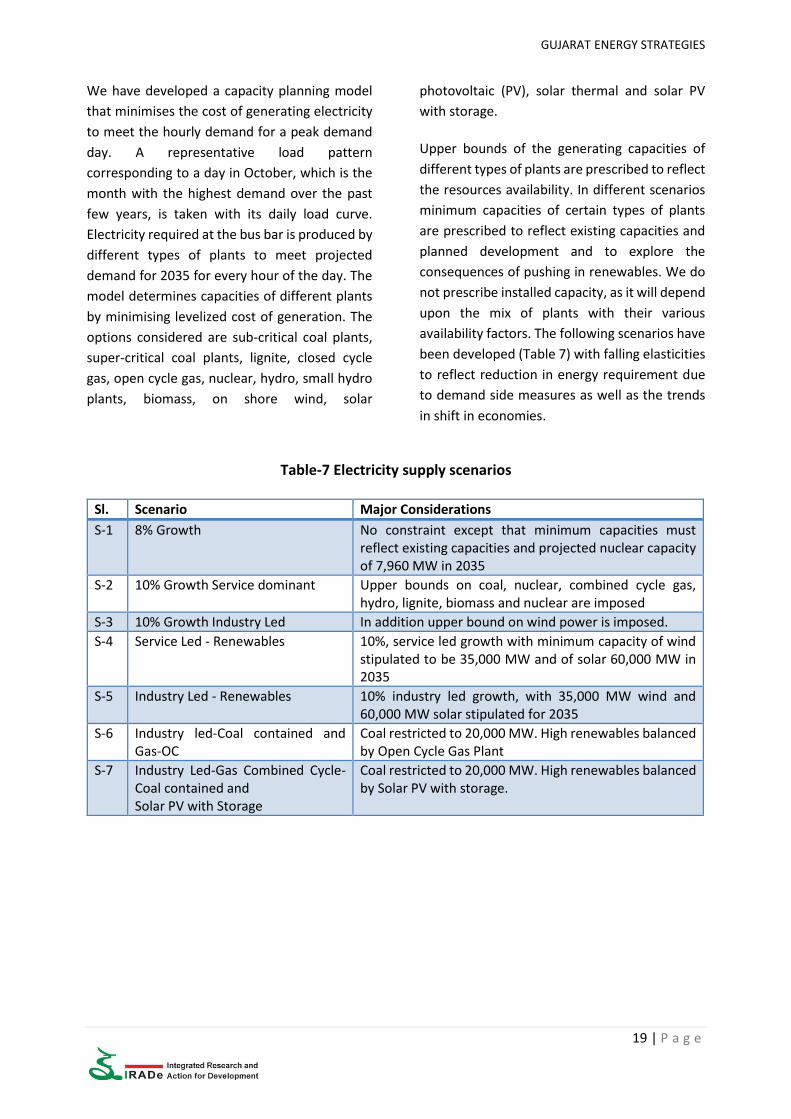
availability factors. The following scenarios have
been developed (Table 7) with falling elasticities
to reflect reduction in energy requirement due
to demand side measures as well as the trends
in shift in economies.
Table-7 Electricity supply scenarios
Sl. Scenario Major Considerations
S-1 8% Growth No constraint except that minimum capacities must reflect existing capacities and projected nuclear capacity of 7,960 MW in 2035
S-2 10% Growth Service dominant Upper bounds on coal, nuclear, combined cycle gas, hydro, lignite, biomass and nuclear are imposed
S-3 10% Growth Industry Led In addition upper bound on wind power is imposed.
S-4 Service Led - Renewables 10%, service led growth with minimum capacity of wind stipulated to be 35,000 MW and of solar 60,000 MW in 2035
S-5 Industry Led - Renewables 10% industry led growth, with 35,000 MW wind and 60,000 MW solar stipulated for 2035
S-6 Industry led-Coal contained and Gas-OC
Coal restricted to 20,000 MW. High renewables balanced by Open Cycle Gas Plant
S-7 Industry Led-Gas Combined Cycle-Coal contained and Solar PV with Storage
Coal restricted to 20,000 MW. High renewables balanced by Solar PV with storage.

GUJARAT ENERGY STRATEGIES
20 | P a g e
Table-8 Capacities (MW) needed in different demand scenarios for 2035 (falling elasticity)
Generation Technology/ Scenarios
8% SGDP Growth
10% SGDP Growth
Service Dominant
Industry Led
Service led High
Renewable
Industry led High
Renewable
Industry led- Restricted Coal
Gas Availability
SPV with Storage
1 2 3 4 5 6 7
Renewables 6364 11568 38833 98051 98051 79360 110471
Wind on Shore 3542 6682 26755 35000 35000 35000 50000
Biomass 41 959 1350 41 41 1350 1350
Small Hydro Power 10 10 10 10 10 10 10
Hydro Power 1854 3000 3000 3000 3000 3000 3000
Solar PV 917 917 7718 60000 60000 40000 40000
Solar PVST 0 0 0 0 0 0 16111
Nuclear 7960 7960 7960 7960 7960 7960 7960
Fossil Fuels 46210 70316 77224 65367 78344 76708 64000
Gas open cycle 0 1316 8224 6493 13068 22708 15000
Gas combined cycle 4874 15000 15000 4874 11277 20000 15000
Lignite 2566 5000 5000 5000 5000 5000 5000
Coal subcritical 8155 9000 9000 9000 9000 9000 9000
Coal supercritical 30615 40000 40000 40000 40000 20000 20000
Total 60534 89844 124017 171378 184356 164028 182431
Peak Demand (MW) 46725 68981 80266 68981 80266 80266 80266
Peak/installed (%) 77 77 65 40 44 49 44
Cost (Rs/kWh) 2.12 2.29 2.57 2.83 2.84 3.18 3.25
Each scenario and its implications are detailed in
Table 8. Some broad conclusions and
characteristics emerge from the scenarios
presented. Coal is the cheapest source, followed
by lignite and closed cycle gas. The cost of power
increases with demand, which increases with
growth rate and industrial growth. Renewables
increase the cost further and restricting coal
leads to an even higher cost. Balancing
renewables with open cycle gas costs less than
balancing with solar PV with storage. The peak
to installed ratio varies from 40% to 77%.
Figure6 presents the shares of
installed capacity and electricity generation for
different fuels for all the scenarios.
Impact of growth
In the scenarios capacities for 2035 are imposed
as minimum capacities to reflect existing
capacities, projected nuclear capacities and
what we impose as required for different
scenarios. The scenarios reflect the outcome of
the model that minimised cost and “upper
bounds” reflect limitation imposed due to the
availability of resources and policy
consideration.

GUJARAT ENERGY STRATEGIES
21 | P a g e
It is seen that with 8% growth rate only hydro
and super-critical coal are developed above the
minimum prescribed limit. It is mostly coal-
based generation that meets the electricity
requirement. Neither coal nor hydro reaches
their prescribed upper bound limits of installed
capacity. It is clear that coal is the cheapest
alternative. All new coal capacities are
supercritical plants as subcritical plants are
restricted to more or less the present capacity
level. As per government policy a small margin
was provided as refurbishing may increase
capacity of some plants.
With 10% service dominated growth rate, when
peak demand increases from 47,000 MW to
69,000 MW, coal, hydro, lignite, closed cycle gas,
all reach their prescribed bound, and some
onshore wind and a small amount of open cycle
gas come in. With 10% growth rate Gujarat will
need to bring in renewables. We can compare
8% growth rate with 10% service led growth as
the economic structure in the two scenarios is
the same as we see in chapter 4. With 8% growth
rate the upper bound for supercritical coal of
40,000 MW is not reached, but in the 10%
growth scenario it is reached. Also following
coal, gas based combined cycle plants are
preferred; only after bounds on conventional
plants, coal, lignite, hydro, nuclear and biomass
are reached that onshore wind is expanded.
Impact of Economic Structure
Scenario 3 is the 10 % growth rate with emphasis
on industry led growth reflecting the ‘Vibrant
Gujarat’ and ‘Make in India’ objectives. The peak
demand increases to 80,000MW compared to
69,000 MW in service led growth; 26,755 MW of
wind and 7,717 MW of solar capacities are
developed and to balance them open cycle gas
capacity increases to 8,224 MW. Industry led
growth requires significant increase in electricity
requirement and Gujarat needs to push
renewables substantially.
Impact of Renewables– Push for Solar and
Wind
Scenarios 4 and 5 can be compared with
scenarios 2 and 3 to see what greater emphasis
0%
10%
20%
30%
40%
50%
60%
70%
80%
90%
100%
8%
Fal
ling
Elas
tici
ty(M
W)
8%
Fal
ling
Elas
tici
ty(M
WH
)
SER
-DA
U(M
W)
SER
-DA
U(M
WH
)
IND
-DA
U(M
W)
IND
-DA
U(M
WH
)
SER
-HIG
H R
ES (
MW
)
SER
-HIG
H R
ES (
MW
H)
IND
-HIG
H R
ES (
MW
)
IND
-HIG
H R
ES (
MW
H)
IND
-HIG
H R
ES w
ith
so
lar
PV
(M
W)
IND
-HIG
H R
ES w
ith
so
lar
PV
(M
WH
)
IND
-HIG
H R
ES w
ith
SP
V+
SPV
Sto
rage
-N
orm
al(M
W)
IND
-HIG
H R
ES w
ith
SP
V+
SPV
Sto
rage
-N
orm
al(M
WH
)
IND
-HIG
H R
ES w
ith
SP
V &
GA
S_cc
red
uce
d t
o1
500
0 f
rom
20
000
(MW
)IN
D-H
IGH
RES
wit
h S
PV
& G
AS_
cc r
edu
ced
to
15
000
fro
m 2
00
00(M
WH
)
Figure-6 Shares of capacity and generation under various scenarios
Renewables Nuclear Large Hydro Thermal
GUJARAT ENERGY STRATEGIES
22 | P a g e
on renewables leads to. In these scenarios
minimum capacity for 2035 is prescribed at
35,000 MW for wind and at 60,000 MW for solar.
The targets for solar and wind are reached, but
the capacity of closed cycle (CC) gas does not
increase beyond the initial 4,874 MW and is
more or less replaced by open cycle (OC) gas
with its flexibility of operation that can help
balance the much larger capacities of solar and
wind. OC gas capacity reaches 6,493 MW. The
total gas capacities thus add up to 11,367 MW,
which is smaller than the gas capacity of 16,316
MW in the service led growth scenario. Even
though OC gas uses more gas per kWh, the total
amount of gas required in this scenario is less
than in scenario 2. Thus Gujarat can absorb
these ambitious levels of renewables. We will
discuss the issues of cost and transmission
capacity later.
In the industry led 10% growth scenario, with
the push for renewables (Figure6), the gas
capacities both for CC and OC increase. The total
gas capacities reach 24,345 MW.
Limiting Coal
In the scenarios so far coal capacity is around
9,000 MW of subcritical and 40,000 MW of
supercritical plants. If we restrict coal plants to
20,000 MW of supercritical plants, due to
concern over local air pollution and to limit
carbon emissions, in addition to the existing
9,000 MW subcritical plants, the results are seen
in scenarios 6 and 7.
We also specify in scenario 6 that onshore wind
and solar PV should be at least 35,000 MW and
40,000 MW, respectively in 2035. Wind and
solar capacities reach these minimum levels, but
do not go beyond it. This is feasible with a much
larger expansion of open cycle gas plants
requiring 27,708 MW of capacity. Thus the total
fossil fuel based capacity becomes 29,000 MW
coal and 42,700 MW of gas based plants.
If gas is not available or if its import is considered
undesirable from the point of view of costs or
energy security, and if we want to restrict coal to
29,000 MW and gas to 30000 MW, we have to
go for a storage system. We introduced solar PV
with storage, assuming a battery cost of US $200
per kWh in scenario 7.
In this scenario onshore wind reaches its upper
bound of 50,000 MW, solar PV without storage
remains at the minimum level of 40,000 MW,
but 16,111 MW of solar PV with storage is
added. Gas is restricted to 30,000 MW and coal
to 20,000 MW of super-critical plants. This
shows that with significant development of wind
and solar PV with and without storage it is
possible to restrict coal based generation,
provided either gas is available or storage
technology is developed.
10. Costs and Emissions
The cost of generation in the various scenarios,
at the bus bar, is calculated for each scenario
and presented in Table 9. The cost to the
consumer would have to factor in transmission
and distribution (T&D) losses and distribution
costs.
It is seen that the cost increases with growth
because to generate more electricity relatively
more expensive options have to be used. Thus
the cost of generating electricity in 2035 with 8%
growth is Rs 2.12/kWh, whereas with 10%
growth it becomes Rs 2.29/kWh. With industry
led growth it increases further to Rs 2.57/kWh.
Emphasis on renewables pushes the cost further
to Rs 2.83/kWh and restricting coal takes the
cost to Rs 3.18/kWh and Rs 3.25/kWh,
depending on whether gas or solar PV are the
balancing options. Thus restricting
GUJARAT ENERGY STRATEGIES
23 | P a g e
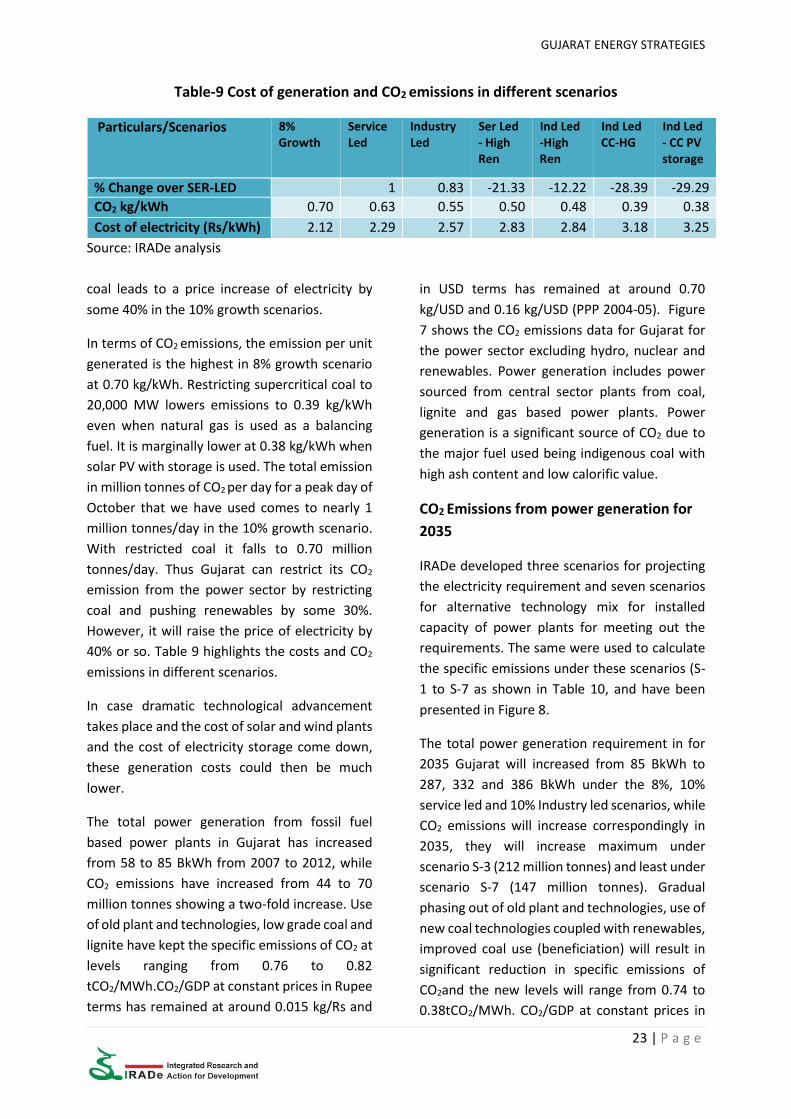
Table-9 Cost of generation and CO2 emissions in different scenarios
Particulars/Scenarios 8% Growth
Service Led
Industry Led
Ser Led - High Ren
Ind Led -High Ren
Ind Led CC-HG
Ind Led - CC PV storage
% Change over SER-LED 1 0.83 -21.33 -12.22 -28.39 -29.29
CO2 kg/kWh 0.70 0.63 0.55 0.50 0.48 0.39 0.38
Cost of electricity (Rs/kWh) 2.12 2.29 2.57 2.83 2.84 3.18 3.25
Source: IRADe analysis
coal leads to a price increase of electricity by
some 40% in the 10% growth scenarios.
In terms of CO2 emissions, the emission per unit
generated is the highest in 8% growth scenario
at 0.70 kg/kWh. Restricting supercritical coal to
20,000 MW lowers emissions to 0.39 kg/kWh
even when natural gas is used as a balancing
fuel. It is marginally lower at 0.38 kg/kWh when
solar PV with storage is used. The total emission
in million tonnes of CO2 per day for a peak day of
October that we have used comes to nearly 1
million tonnes/day in the 10% growth scenario.
With restricted coal it falls to 0.70 million
tonnes/day. Thus Gujarat can restrict its CO2
emission from the power sector by restricting
coal and pushing renewables by some 30%.
However, it will raise the price of electricity by
40% or so. Table 9 highlights the costs and CO2
emissions in different scenarios.
In case dramatic technological advancement
takes place and the cost of solar and wind plants
and the cost of electricity storage come down,
these generation costs could then be much
lower.
The total power generation from fossil fuel
based power plants in Gujarat has increased
from 58 to 85 BkWh from 2007 to 2012, while
CO2 emissions have increased from 44 to 70
million tonnes showing a two-fold increase. Use
of old plant and technologies, low grade coal and
lignite have kept the specific emissions of CO2 at
levels ranging from 0.76 to 0.82
tCO2/MWh.CO2/GDP at constant prices in Rupee
terms has remained at around 0.015 kg/Rs and
in USD terms has remained at around 0.70
kg/USD and 0.16 kg/USD (PPP 2004-05). Figure
7 shows the CO2 emissions data for Gujarat for
the power sector excluding hydro, nuclear and
renewables. Power generation includes power
sourced from central sector plants from coal,
lignite and gas based power plants. Power
generation is a significant source of CO2 due to
the major fuel used being indigenous coal with
high ash content and low calorific value.
CO2 Emissions from power generation for
2035
IRADe developed three scenarios for projecting
the electricity requirement and seven scenarios
for alternative technology mix for installed
capacity of power plants for meeting out the
requirements. The same were used to calculate
the specific emissions under these scenarios (S-
1 to S-7 as shown in Table 10, and have been
presented in Figure 8.
The total power generation requirement in for
2035 Gujarat will increased from 85 BkWh to
287, 332 and 386 BkWh under the 8%, 10%
service led and 10% Industry led scenarios, while
CO2 emissions will increase correspondingly in
2035, they will increase maximum under
scenario S-3 (212 million tonnes) and least under
scenario S-7 (147 million tonnes). Gradual
phasing out of old plant and technologies, use of
new coal technologies coupled with renewables,
improved coal use (beneficiation) will result in
significant reduction in specific emissions of
CO2and the new levels will range from 0.74 to
0.38tCO2/MWh. CO2/GDP at constant prices in

GUJARAT ENERGY STRATEGIES
24 | P a g e
Rupee terms will range from 0.004-0.009 kg/Rs.,
CO2/GDP in PPP terms will be highest in S-1
(0.10) and lowest in S-7 (0.047) showing
significant reductions on account of improved
energy efficiency and technology use
particularly renewables.
Table-10 Scenarios for power generation
Scenarios S-1 S-2 S-3 S-4 S-5 S-6 S-7
Growth rate 8% 10%
Elasticity Falling Elasticity (FE)
Parameters BAU
Service led
growth
Industry led
growth
Service led growth –
High
Renewable
Industry led growth –
High
renewable
Industry led growth-
Restricted
coal and Gas availability
Industry led growth-
Restricted coal and balancing
with SPV storage
0.000
0.100
0.200
0.300
0.400
0.500
0.600
0.700
0.800
0.900
CO2/GDP at Constantprices (kg/Rs.) 2004-05
CO2/GDP at Constantprices (kg/USD) 2004-05
Specific EmissionsTCO2/MWh (Guj)
Specific EmissionsTCO2/MWh (India)
CO
2/G
DP
Figure-7 CO2 per GDP comparision and specific emissions
2007-08 2008-09 2009-10 2010-11 2011-12 2012-13
0.0
0.2
0.4
0.6
0.8
Specific Emissions TCO2/MWh CO2/GDP at Constant prices(kg/Rs.)
CO2/GDP at Constant prices(kg/USD) PPP (2004-05)
Un
its
Figure-8 CO2 parameters under various power generation scenarios
S-1 S-2 S-3 S-4 S-5 S-6 S-7

GUJARAT ENERGY STRATEGIES
25 | P a g e
Overall emissions scenario of Gujarat in
2035 from energy sector
Overall CO2 emissions will see an uptrend with
improving economic activity and income levels.
The overall CO2 emissions scenario of Gujarat is
presented below in Table 4. Per capita CO2 will
increase from 1.74 to around
3.20tCO2/capita/year in 2035. CO2/GDP will see
a decreasing trend showing improving energy
intensities under all scenarios. Figure 10 shows
the per capita CO2 emissions globally in
2011,while India’s total per capita CO2 is well
below world average and also the lowest among
the top 10 emitters as seen in Figure 9, its CO2
intensity from energy sector has been increasing
gradually from 0.67tCO2/capita in 1990 it now
stands at 1.58tCO2/capita in 2012 1 , which is
marginally lower than Gujarat which has per
capita emissions at 1.74 tCO2/capita/year.
Increasing use of fossil fuels and reliance on coal
power will push up India’s and Gujarat’s Figures.
Gujarat will see a twofold jump under its
projected scenarios.
India’s INDC submitted to UNFCCC in October
2015 promises a reduction of 33 to 35 % in
emissions intensity in 2030 compared with 2005.
Compared with that our projection for Gujarat
shows emissions intensity of 0.5 (kg CO2/USD
PPP 2004-05) with 8 % growth rate and 0.29 (kg
CO2/USD PPP 2004-05) with 10 % growth rate in
2035. This is a reduction of up to 55% with 8 %
growth rate and nearly 75 % with 10% growth
rate. Gujarat can make a substantive
contribution to the country’s ambition for
sustainable development.
The first three scenarios S-1 to S-3 take into
account the Dynamics as Usual (DAU) aspect
of technology adoption wherein Coal power
are promoted with improved technological
1Agenda notes for the Subsidiary Body for Scientific and Technological Advice, Forty-third session, Paris, 1–4 December 2015, UNFCCC
options like super and ultra-super critical
coal, still it manages to achieve 20-35%
capacity through non-fossil technologies
(RES, Nuclear and Hydro). While scenarios S-
4 to S-7 with higher push for renewables
coupled with Nuclear and Gas result in non-
fossil installed capacity exceeding 40% and
reaching up to 65% far more than the 40%
committed by India’s INDCs.
Summary of Main Conclusion for Power
Sector
We summarize the main conclusions as follows:
Peak electricity demand for the year 2035 will
increase to 46,700 MW with 8% growth rate and
to 69,000 MW with 10% growth, a margin of
48%.
With Vibrant Gujarat mode of industry led 10%
growth the peak demand will be 80,300 MW
which is an increase of 16 per cent due to change
in the structure of the economy.
With emphasis on renewable, mainly wind and
solar, the share of renewable capacity can be
50% or more; 35,000 MW of wind and 60,000
MW of solar energy can be absorbed with gas
based plants providing balancing power.
Even when supercritical coal plants are
restricted to 20,000 MW compared to 40,000
MW in other scenarios, Gujarat can meet its
power requirement with some balancing by
natural gas or solar PV with storage.
Significant reduction of 30 per cent in total
power sector emissions is feasible, but with a
40% increase in the cost of electricity.
Gujarat should push for the development of
renewables. Its ability to restrict coal will
depend on the availability of natural gas or
development in electricity storage technology. It
can adapt its strategy to evolving technology.

GUJARAT ENERGY STRATEGIES
26 | P a g e
Table-11 CO2 Emissions in 2035 under 3 Scenarios - 8% and 10% growth of GDP
Scenarios 2013 S-1 S-2 S-3
Falling Elasticity
Parameters/Growth rate Actual 8% 10%
BAU Service led Industry led
Total emission of CO2/year (Million Tonnes) in Gujarat^
106 264 271 274
Per capita CO2 emission (Tonnes/year) (Gujarat)@
1.74 3.14 3.23 3.27
Per capita CO2 emission (Tonnes/year) (India incl. LULUCF)
1.70 -- -- --
Per capita CO2 emission (Tonnes/year) (India fuel combustion) (UNFCCC, 2012)
1.58
GSDP @ constant prices 2004-05 @8% GR (Billion Rs.)
4162 23226 34777 34777
CO2/GDP at Constant Prices (kg/Rs.) (2004-05) (Guj)
0.026 0.011 0.008 0.008
CO2/GDP at Constant prices (kg/USD) PPP ( in 2004-05) (Guj)
1.17 0.51 0.35 0.35
CO2/GDP at Constant prices (kg/USD) PPP ( in 2004-05) (Ind)” (2011 data)
1.60
Population in Gujarat 61.02 83.94 83.94 83.94 ^Only coal, lignite and NG and major fuels considered for projections in 2035
# Av Annual exchange rate (RBI) 2004-05 base year 1USD=44.93INR and 1USD=11.23INR (PPP).
@Excludes Agriculture, LULUC. “http://data.worldbank.org/indicator/EN.ATM.CO2E.PP.GD (2011)
Strategies to meet Demand for
Petroleum Products
The supply of petroleum products is largely
determined by the Central government. The
state government does not have much policy
space here. It can import petroleum products,
but that would be expensive as the quantity
would be small and would require setting up a
distribution company.
However, the state government can take
measures to reduce the demand for petroleum
products. An important step would be to charge
prices for petroleum products without any
subsidy thereby inducing consumers to use
them frugally. Opportunities to reduce the need
for petroleum products exist in the transport
sector, in industries, in households and in
agriculture. The measures the state can take are
described in Chapter 11.
Strategies for Gas Supply
In the gas sector, the state government has set
up a gas distribution company, which lays the
pipe network, imports LNG and distributes gas.
Thus gas import becomes a real option for the
state. If availability of domestic gas is restricted,
LNG import is an option. We have seen that gas
can play a critical role in absorbing renewable
power. Until cheap electricity storage
technology is developed gas would be vital for
Gujarat. Once a gas pipeline network is
established, it provides an option for combined
heat and power (CHP) generation that can
increase the use efficiency of gas to nearly 80%
compared to 50% or so in closed cycle gas
turbines. Thus a pipeline network and enabling
regulation for CHP use would make gas imports
at relatively high price economical compared to,
say, importing coal. Providing piped gas to
households can free up LPG for rural households
who need to be provided clean cooking fuel.
GUJARAT ENERGY STRATEGIES
27 | P a g e
11. Policies for Gujarat
We now bring together the policies required in
various areas based upon the detailed
calculations and scenarios worked out above.
Since power is the most critical sector and
provides maximum policy space, we look at it in
some detail. We also look at policies for securing
supply of various fuels, for providing energy
access to all, for dealing with environmental
issues and for issues of risk and infrastructure.
Policies for Power Sector
Even with falling elasticity, reflecting increased
energy efficiency due to various demand side
measures (DSM), Gujarat will need to expand its
installed capacity from 24,000 MW in 2014 to
around 65,500 MW with 8% growth of SGDP and
to around 100,000 MW with 10% growth of
SGDP. If the growth is primarily industrial, the
required capacity in 2035 could be as high as
131,000 MW. Also, the installed capacity
required depends on the shares of different type
of plants, particularly renewables. With a limit
on coal-based plants, the capacity needed with
industry led growth would be around 182,000
MW in 2035. Thus Gujarat faces a massive
challenge in the power sector if it aspires to
achieve a growth rate of 10% and restrict coal-
based generation.
We have seen that Gujarat will need to depend
on coal for some time. Renewables like wind and
solar can make significant contributions.
However, beyond some level balancing power
has to be provided either with open cycle gas
based plants or through some forms of
electricity storage.
The policy challenges are – how to promote
energy efficiency, how to access coal at the
minimum cost, how to procure natural gas and,
above all, how to promote renewable power and
absorb it.
DSM for Energy Efficiency
The falling elasticities used in projecting
electricity consumption in chapter4, implies a
reduction of 14% by 2035. This implies a
reduction in electricity use by 1% per year in
industry, households and commercial
establishments.
Increased absorption of labelled, star-rated
appliances by households can lead to such
reduction. What the state can do is to incentivise
households by the following measures:
a. Meter and charge for all electricity
b. Provide finance for purchasing high star-rated
appliances. Manufacturers could be incentivised
to provide finance.
c. Invite competitive bulk supply bids for high
energy consuming equipment for public sector
and government purchases. This could reduce
costs. This would also make it easy for public
sector and government procurement officers to
buy energy efficient products as otherwise they
buy the lowest priced products.
Energy use efficiency in industry can also be
increased through the government’s PAT
(Perform, Achieve and Trade) scheme. Gujarat
should ask the Bureau of Energy Efficiency (BEE),
a government energy conservation agency that
steers PAT, to launch a similar scheme for small
and medium enterprises, particularly when
these are located in an industrial park.
A growth rate of 10% implies that many new
commercial buildings would be built. If these
buildings are made to effectively follow the
Energy Conservation Building Code (ECBC), it
could result in 30% reduction in energy
consumption of new buildings. In order to
promote ECBC the state needs to incentivise
owners and builder-developers to build ECBC
compliant buildings. To overcome the problems
related to ECBC compliance the following needs
to be done:

GUJARAT ENERGY STRATEGIES
28 | P a g e
a. Gujarat needs to adopt the ECBC code with
modifications if they are found to be desirable
b. Make ECBC mandatory for all commercial
buildings above a certain size
c. Set up a certification mechanism in consultation
with urban local bodies
d. Introduce third party verification on a random
basis to ensure that inspectors of ULBs are doing
their job properly
e. Third party verifiers may be approved by a
professional body such as Institution of
Engineers or BEE
f. Builders may be provided incentives for building
ECBC compliant buildings such as:
Tax rebate
Permission for extra built-up area
(Increase in FAR)
Priority in electricity, water, sewerage
connections.
g. The challenge is to make such a system
corruption free. Thus compliance certification
with details should be made public and put on
the website.
h. Installation on smart meters with which energy
consumption per square meter of the house can
be monitored can help verify if the building is
ECBC compliant or not. Builders may be required
to post a bank guarantee when they are given
incentives
Time of the Day Pricing
The load curve of Gujarat is quite flat; the scope
to reduce peak demand by shaving the peaks
and filling valleys is limited. Yet time of the day
pricing should be introduced so that it remains
flat even when demand grows. With a lot of solar
power, the supply curve will also have peaks and
valleys and the time of the day pricing policy can
help match the shapes of demand curve and
supply curve.
Coal Power
Gujarat has no coal; it comes from outside.
Gujarat bears a higher cost for coal than it
should because of the irrational allocation of
coal linkages, which is further aggravated by the
distorted freight rates of Indian Railways that
cross-subsidises passenger movement by over-
charging freight movement.
Gujarat should make a strong case to the Centre
to:
i.Either rationalise the coal linkages
ii.Or make coal linkages tradable, and
iii.Rationalise railway freight rates
This can make a significant reduction in the
state’s expenditure on coal. But the catch is that
the attractiveness of coal power would increase
and would make it that much more difficult to
promote solar and wind power. The matter can
be resolved by providing higher feed-in tariff to
renewable power.
Gujarat needs to reduce the use of coal to
reduce air pollution and CO2emissions. Thus
policies need to promote clean coal
technologies and coal use efficiency. For
example:
a) Supercritical Plants: Every new coal-
based plant should be mandated to be a
super-critical plant. This is the first step.
b) Ultra Super-Critical Plants: These can
have efficiency of around 43 per cent
compared to around 38% of super-
critical plants. There is an active
programme to develop the technology
and once it is available, Gujarat should
seriously consider it.
c) IGCC: Integrated Gasification Combined
Cycle (IGCC) plants have higher
efficiency and lower emissions. They
also facilitate carbon capture, if and
when needed. Unfortunately, IGCC for
high ash Indian coal has not been
developed yet, though, Bharat Heavy
Electricals Limited (BHEL) is working on
it. However, since Gujarat imports coal
it can consider IGCC plants with
imported coal, even though its initial

GUJARAT ENERGY STRATEGIES
29 | P a g e
cost is higher than conventional plants.
It would be worthwhile particularly if
emission control is given due weight.
Lignite Power
Gujarat’s lignite resource can at most supply
5,000 MW of power plants over their lifetime of
35 years. Rajasthan, which is near enough for
Gujarat to import lignite, has resources that can
supply 10,000 MW. Given the projected
requirement of power, Gujarat should develop
its own lignite resource to generate power first.
Lignite’s role, however, is going to be limited.
If in-situ gasification technology can be
developed deeper seams can be exploited with
much less environmental consequences.
Unfortunately, even though Oil and Natural Gas
Commission (ONGC) has been trying to develop
the technology, the turf battle between
ministries of coal and oil has not allowed it to
make much progress.
Natural Gas
Availability of gas from domestic sources has
become more uncertain as supply has dwindled
from Krishna Godavari Dhirubhai 6 (KG-D6)
offshore gas field. On the other hand, with shale
gas production growing around the world, gas
supply in the international market should be
abundant.
Strategically, Gujarat needs to decide on the
level of imports it would like and build domestic
infrastructure for imports and if possible get into
long term commitments for importing gas.
The gas uses that the Gujarat Government may
want to encourage are the following:
i. Use of compressed natural gas (CNG)
for transport: With the expected
growth in motorised vehicles, urban air
pollution is a growing problem.
Many medium size cities are growing
rapidly and the state should encourage
them to set up efficient public
transport systems. CNG buses, three-
wheelers and taxis can help in limiting
the growth of air pollution.
The policies to encourage this would
include appropriate pricing of auto
fuels taking into account the
externality of air pollution they create.
Also it may be necessary to set
deadlines for conversion of the old
fleet and mandating that new vehicles
will only be based on CNG.
ii. Gas for CHP: Combined heat and power
(CHP) generation can significantly
increase efficiency with which gas is
used. Industries, commercial
establishments, large malls, etc., are
likely to find CHP and gas turbines to
generate power very attractive
because it will allow use of waste heat
for cooling or heating. A pipeline
network and assured supply of gas are
critically important to promote CHP.
Renewables
In the long term Gujarat has to depend on
renewable power from wind and solar energy if
it wants to reduce its dependence on imported
energy. Measures used to encourage
renewables includes capital subsidy in the form
of permitting accelerated depreciation, low
interest long-term loans and generation-based
subsidy in the form of feed-in tariff (FIT). The FIT
may be fixed upfront or may be determined by
the market through renewable portfolio
obligation (RPO). Many state electricity
regulatory commissions have announced RPO
and the renewable energy certificates, given to
those who achieve more than their obligation,
can be traded for which power exchanges
provide electronic trading platforms.

GUJARAT ENERGY STRATEGIES
30 | P a g e
Capital subsidy is not considered efficient as it
encourages gold plating and does not provide
any incentive to generate electricity. Long-term
low-interest loans are desirable as interest rate
in the country is high. It requires a mechanism to
ensure that the loan is used for the plant and not
diverted to other uses.
The FIT and RPO are two generation based
approaches and each has its advantages and
disadvantages.
Renewable Portfolio Obligation (RPO) vs. Feed-
In-Tariff (FIT)
FIT gives certainty to the plant owner because
the cash inflows are predictable. This makes it
easier to find finance and attain financial
closure. The disadvantage is that it is technology
specific –competitive efficiency may not be
realised even when FIT is competitively bid, as
one would not have a common bid for all kinds
of renewables.
The RPO has the advantage that all renewable
technologies compete. While it gives options to
grid managers and distribution companies, it
creates a lot of uncertainty for developers about
the price one would get in the future. Getting
finance becomes more difficult. The ability to
trade may lower some risks, but uncertainty
remains regarding not only price, but also
regarding buyers. To minimise this, the following
measures can be taken.
a) A uniform RPO across states: All states should
stipulate a uniform RPO level. If states are free
to set their RPO, the tendency would be to set it
too low, and all states would have surplus
renewable capacity and no buyer.
b) A floor price should be prescribed as minimum
FIT. This would at least ensure a minimum cash
flow and reduce uncertainty. A national
mechanism would have to be worked out to pay
for all unsold renewable power. This price
should be valid for at least 10 years to facilitate
financial closure for renewable energy (RE)
plants. It should be set at a level that provides
adequate return to the RE producer.
c) A forbearance price, an upper bound should also
be set. In case of short supply of RE, forced buy-
out at this price should be provided. The price
may be set at the highest level of other
subsidised power.
d) An effective penalty should be imposed on those
who do not meet the RPO. This should be a
multiple of, say, one-and-a-half times the
forbearance price.
e) Banking of RE certificates for a period of three
years should be permitted.
It should be clearly spelt out if the obligation to
build the needed transmission line is of the
distribution company or the plant operator.
Wind Power
The main problem with wind power is its
unpredictability. It varies not only from season
to season and day to day, but also from hour to
hour. The variability can be up to five times as is
seen in 2012-13, from a low of 172 MU in
October to a high of 901 MU in July.
Maximum variations are observed in the months
of May and December, when the hourly changes
can be as much as 3-5 times the lows Even the
daily load curves on some days how variations of
up to 10 times the day lows. October, November
and February are not only relatively low
variation months; these are also low generation
months.
Thus absorbing wind power is a big challenge
even when there is balancing capacity in the
system. Not only one needs a smart grid in the
sense that it can react quickly, switch generators
and manage the change in electricity flow in the
network.
Management of even such a smart grid would be
facilitated with advance warning of even a few
minutes. Wind power forecasting
methodologies have improved and one can
GUJARAT ENERGY STRATEGIES
31 | P a g e
predict wind energy with reasonable degree of
confidence 15 minutes ahead. European
countries have developed and improved
significantly the wind forecasting techniques.
Short-term wind forecasting models up to 15
minutes to several days are now available. These
rely on parameters such as wind speed, wind
direction, air pressure and humidity as the main
input for day-ahead forecasting. These models
can make fairly reasonable forecasts.
State-of-the-art Wind-forecasting models:
The latest models of forecasting wind are based
on three dimensional weather models and
numerical weather prediction (NWP) models
such as German Meteorology Service (DWD),
High Resolution Limited Area Model (HIRLAM),
and UK (Met) official Meso scale Model (UK
MESO).
Thus the following measures are indicated:
(a) Carry out load-flow and grid stability studies for
projected plans of wind power generation to
identify the kind of smart grid required.
(b) Initiate studies to forecast wind power ahead of
time, which can be a day ahead, an hour ahead
or even 15 minutes ahead.
The problem of absorption arises after wind
power plants are set up. Policies are needed to
encourage entrepreneurs to set up such plants
in the first place.
Gujarat wind power policy-2013 has many
attractive features that create an environment
conducive to the development of wind power in
the state.
It provides for evacuation line by Gujarat Energy
Transmission Corporation (GETCO), well defined
transmission charges and facility to sell power
directly to a third party. It also exempts wind
electricity from payment of electricity duty and
cross-subsidy charges. In addition, the newly
revised renewable portfolio obligations will
ensure adequate demand for wind electricity for
some time.
Solar Power
Solar power is more predictable than wind as
one knows the hours of its availability. The only
uncertainty is due to cloud or rains. There is
however variability from month to month.
During 2013-14, the minimum generation was in
July (75 MUs) and the maximum generation was
nearly twice as much in March (143 MUs) while
the installed capacity was 857 MW only.
Gujarat has been a pioneer in solar energy. Its
policies provide incentives, reduce uncertainty
and risk and provides infrastructure support that
creates ease of setting up plants and getting
them running.
The solar policy of 2009 guaranteed purchase at
an announced price for a period of 25 years (Rs
15 per unit for first 12 years and Rs 5 per unit for
next 13 years). The feed-in tariff has been lower
in subsequent rounds. In the assured FIT market
risk is not shared by the generator. It is borne
100%by the grid operator.
GETCO provided the transmission infrastructure
for power evacuation. The project developer
was also provided land at a solar park, which
frees him/her of the often difficult and time
consuming process of land acquisition.
Putting a number of plants together at a solar
park reduces the cost of transmission lines.
Being located at a solar park also helps to get
skilled workers and maintenance services. As a
result, in a short span of 13 months, ‘Asia’s
largest solar park’ at Charanka had 214 MW
capacity from 26 individual solar projects.
Gujarat should continue with its policies, except
perhaps it might consider reverse bidding for FIT
that is followed by the Central government
instead of announcing a fixed FIT upfront.

GUJARAT ENERGY STRATEGIES
32 | P a g e
Since Gujarat needs to push up solar energy by
an order of magnitude, finding appropriate land
for solar parks becomes a priority.
Canal-top Solar
Canal-top solar PV plants reduce the risk of land
acquisition. And because of cooling by water
underneath the panels, canal-top solar PV plants
increase the efficiency of generation,
compensating for the additional cost of
installation on a canal. This is an idea that needs
to be fully exploited.
Another option to reduce land requirement is to
have grid connection rooftop solar plants.
Rooftop Solar
There is a big push in the country to develop
rooftop solar power plants.Net metering is also
encouraged in many states. Gujarat was also
pioneered in this development with its
Gandhinagar rooftop programme. The main
policy issues here are:
(a) Should subsidy be provided?
(b) What should be the price of electricity
– for feeding electricity into the grid
and for withdrawing from it?
There may be some justification for subsidy for
rooftop installation installed on large
institutional or commercial buildings. Providing
subsidy to households installing a solar plant on
the rooftop is subsidising the relatively richer
households as they are the ones likely to have
appropriate roofs. Thus there is little
justification for it. Also with a target of 40,000
MW for rooftop solar set-up by the Government
of India, the outlay for subsidy would be huge.
A household, which installs a rooftop solar plant
would draw power from the grid only when solar
power is not adequate or available. The load
factor of its demand from the grid would be very
low. If the distribution company has to maintain
capacity to serve such a demand, its cost of
providing electricity would be high.
The price at which power is supplied by the grid
to households with rooftop solar plants should
account for this. A simple solution would be to
charge a capacity charge and then electricity
charge at normal rates.
Petroleum Products
Since the state can do little to augment supply,
the best strategy is to reduce need by taking a
number of measures that increase efficiency of
use and replace use by alternatives. The
measures the state can take are described
below:
A move towards electrification can reduce
dependence on petroleum products, be it for
transport or households.
Transport Sector
Providing mass transport, public transport and
facilitating and encouraging non fuel transport is
in the long run unavoidable if cities are not to
choke with traffic. Also cleaner vehicles have to
be promoted to keep air pollution in check.
Promoting better driving habits can reduce fuel
requirement. The following measures are
required:
Develop mass rapid transport systems and
solutions like Bus Rapid Transit System (BRTS),
Metro rail, mono rail for mass travel along with
end-of-mile connectivity options like e-
rickshaws, CNG auto rickshaws and mini vans.
Provide workable solutions for inter modal
connectivity.
Proper traffic management and road design,
satellite and GIS based traffic monitoring can
substantially improve road traffic and result in
reduced fuel consumptions.
Promote use of electric vehicles like cars and
scooters to reduce dependence on fossil fuels
and improve air quality and CO2 emissions.
Government can provide incentives for buying

GUJARAT ENERGY STRATEGIES
33 | P a g e
electric vehicles in the form of lower interest
rates and longer payback periods for loans to
consumers.
Night-time charging of electric vehicle batteries
can also improve grid stability. Solar charging
stations for the day-time can also be employed.
Promote non-fuel transport systems wherever
possible for short-distance travel like pedal
cycles and rickshaws by providing cycle paths.
Use of BS-IV and higher standards for vehicles
and fuels need to be adhered to and strict
timelines drawn up.
Promote better driving habit that can save fuel.
Education campaign should be mounted to
propagate measures drivers should take.
Industrial Sector
Industries can undertake the following
measures to improve and reduce their fossil fuel
requirements. Proper energy pricing will
encourage them to do so:
Regular energy audit to reduce energy
consumption and take into account oil leaks,
incomplete combustion to improve efficiency
and reduce fuel consumption.
Recover and utilise waste heat from furnace flue
gases for preheating of combustion of air.
Reduce heat losses through furnace openings,
recover heat from steam condensate.
Improve boiler efficiency by checking radiation
loss, incomplete combustion, blow down loss,
excess air and save up to 20% fuel.
Maintain steam pipe insulation to save
considerable amount of fuel.
Use solar water heaters for process hot water
requirement for up to 80oC and meet balance
requirement with conventional fuels.
Use SPV systems to meet at least 50% of lighting
needs through rooftop systems wherever space
is not a constraint.
Domestic Sector
Apart from transport, the main petroleum
products used by households are LPG and
kerosene for cooking and lighting. Electricity or
solar lights in remote villages are replacing use
of kerosene for lighting. The use of cooking fuels
can be reduced by a number of measures
improved stove design, efficient fuels, etc.
Agriculture Sector
24x7electricity supply has facilitated switching
from costlier diesel pumps to electric pumps.
Metered supply of electricity will encourage
farmers to use it efficiently. They can take the
following measures:
Use of a low friction ISI marked foot valve can
save up to 10% diesel consumption for irrigation
pump sets.
Bigger diameter rigid PVC Pipeline saves
considerable amount of energy in pump
irrigation systems as compared to flexible and
corrugated pipes.
Avoiding bends, in the irrigation pipeline
arrangement, suction and discharge pipe
lengths can save electricity and diesel
consumption.
Proper design as per site requirement should be
taken up.
Apart from energy saving from pumping, scope
to reduce diesel use in tractors also exists.
Running tractors efficiently, stopping diesel
leakage, turning off engine when not in use,
matching hauling capacity with tractor load and
driving in correct gear all save fuel. Excess smoke
indicates improper combustion, dirty engine,
increases fuel consumption and indicates need
for servicing.
Energy Access
With 24x7 electricity supply to most villages,
Gujarat has taken a giant stride in providing
energy access. This is reflected in the significant
reduction of use of kerosene for lighting. As per
the 2011 census around 1 million households,
out of a total of 112.2 million households, were
still using kerosene for lighting. These may be
mostly in remote rural areas or people living on
GUJARAT ENERGY STRATEGIES
34 | P a g e
the periphery of habitations. While some of the
un-electrified villages in 2011 may have been
electrified by now, others may be too difficult to
reach or supply restricted with the conventional
grid. They should be provided solar lighting
either through a small local level grid or through
home lighting systems.
Providing clean cooking fuel is the bigger
challenge. As per 2011 census, 69% of urban
households and only 15% of rural households
cooked with clean fuels, LPG, PNG, Biogas or
electricity. The objective should be to provide
clean fuels to all the households. The expansion
of PNG network frees up LPG use, which should
be expanded in rural areas. The Gujarat
government should provide at least 6 LPG
cylinders a year or equivalent to each
household. The poorer households will have to
be subsidised. The subsidy should be provided
through direct cash transfer and not through
subsidised cylinders. Cooking with dirty bio-fuels
leads to indoor air pollution with serious impact
on the health of family members, particularly
women and children. Subsidy for clean cooking
fuel is socially justified.
A district-wise drive with appropriate measures
is needed. Kerosene free Delhi scheme has
helped eliminating the use of the unclean fuel
leading to associated benefits to all.
PNG
Transporting bulk LPG and cylinders by tankers,
trucks, vans, burns up petroleum products that
increase congestion on roads and increases air
pollution, adding to the climate concern. All
cities greater than a million population should
be required to switch to piped natural gas (PNG).
The LPG cylinders thus spared can then be used
to provide clean cooking fuel in remote and rural
areas
Environment
The main environmental concerns related to
energy production and use are CO2 emissions,
local air pollution, fly ash disposal, water use and
quality, indoor air pollution and land
degradation.
The main options for cutting down CO2
emissions are reducing energy use through
efficiency measures, restricting the use of coal
power generation, using only super-critical and
ultra-super-critical plants for coal power
generation and pushing renewable and non-
fossil power as explored in Chapter 6. Also the
measures to reduce petroleum product
consumption as described above are also
important.
Measures to reduce CO2 emissions will also
reduce air pollution. In addition, a number of
steps are needed to reduce local air pollution.
Require coal power plants to trap all
particulates through electrostatic
precipitators or ash bags
Impose fuel efficiency norms on vehicles
using petroleum products
Have stricter PUC norms and enforce
them
A cement plant or a brick kiln located near, a
power plant can utilise the fly ash generated.
Otherwise, fly ash disposal has to be strictly
regulated. Fly ash ponds should be properly
lined to prevent water pollution through
leaching.
Water use in power plants need to be optimised.
Water used for ash washing should be cleaned
and recycled. Power plants should be charged
appropriate price for water so that they have the
incentive to reduce and reuse water. Zero
wastewater generation policy should be
promoted.
Indoor air pollution through use of biomass fuels
for cooking has to be replaced by cleaner fuels
as described above.
Proper disposal of fly ash is critical to prevent
land degradation.

GUJARAT ENERGY STRATEGIES
35 | P a g e
There is no reason why Gujarat cannot have an
energy system and a clean environment.
Risks and Hazards
Gujarat is subject to a number of hazards,
earthquakes, cyclones, flooding, droughts and
tsunamis. Different types of plants are
differently vulnerable to these hazards. Since a
hazard map of Gujarat is available, the potential
risk from hazards should be gauged before
deciding on the location of a power plant. After
the disaster that struck the nuclear power plant
in Fukushima, Japan, during an earthquake, this
cannot be neglected.
A vulnerability assessment should be carried out
even for existing plants and any measures
indicated to reduce the vulnerability should be
followed through.
Gujarat as India’s Energy Gateway
Gujarat is the key gateway for imports of energy
resources into India. It plays a major role in
India’s energy security and energy trade. In
FY13, Gujarat ports (major and non-major) alone
handled 66 per cent of India’s total imports of
POL and its products. As for coal, Gujarat ports
(major and non-major) handled 36 per cent of
India’s total coal imports. Similarly, Gujarat
Liquefied Natural Gas (LNG) terminals
accounted for 64 per cent of the installed LNG
re-gasification capacities of India. All these facts
highlight the importance of Gujarat’s ports in
overall energy imports and energy security of
India.
With economic growth, the energy trade will
increase for decades before substitution by
renewables reduces energy imports. Gujarat
needs to continue to develop its ports not only
for itself, but also for the country as a whole.
This also provides an opportunity to create
employment and earn revenue.
We have also stressed that ports should be
secured from all forms of risks and man-made or
natural vulnerabilities
12. Concluding Observations
If Gujarat is to progress as it aspires to
and achieve double digit growth rate,
led by industrial development, it faces a
huge challenge to meet its energy
needs.
Gujarat’s dependence on coal will
continue for some time. Hence moving
to more efficient supercritical and ultra-
supercritical plants are a must.
Today Gujarat is paying more than what
it should for coal because of the coal
linkage and railway freight rate policies
of the Government of India. It should
strongly ask for tradable coal linkages
and rationalisation of railway freight
rates.
With its limited resources of fossil fuels
its emphasis must be on renewable
power if it wants to restrict the level of
energy imports.
Fortunately, Gujarat has significant
potential of wind and solar power as
well as a good policy framework to
attract investment in these areas. With
some suggested measures renewables
have large potentials for growth in
Gujarat.
We have also seen that it is possible to
absorb significant amounts of solar and
wind power by balancing with open
cycle gas based plants. Also, if
advancement in electricity storage
technology brings down costs, solar PV
with storage can provide the needed
balancing power. More detailed studies
are needed in this sector.
While availability of natural gas is
limited, coal gasification based on
imported coal or in-situ gasification of
GUJARAT ENERGY STRATEGIES
36 | P a g e
lignite can provide gas. We have not
considered these in our analysis, as the
technology of in-situ gasification is not
yet commercially developed.
Apart from electricity, consumption of
petroleum products has to be
restrained. Here, development of mass
transport, encouragement of non-
motorised transport, discouragement of
use of private vehicles by providing the
option of efficient and convenient public
transport and imposing parking and
congestion charges, are required.
At the same time, increased fuel
efficiency from vehicles, more stringent
emission norms and facilitating electric
vehicles by providing supporting public
infrastructure are needed. Regular
environmental impact studies, with
modelling needs to be undertaken in
major cities.
While supply policies are important,
demand side measures to promote
energy efficiency are equally critical. The
state should push hard for more
efficient use of energy. Appropriate
pricing of energy is a vital element of
pushing energy efficiency. Education
and encouragement for saving energy
can be cost effective.
With 24x7 electricity supply, Gujarat has
come a long way in providing energy
access to all its residents. Even then
action is needed to provide clean
cooking fuel to a large segment of the
population. The spread of Gujarat gas
grid to all urban areas should help
replace LPG use in urban households
with PNG. The freed cylinders and LPG
should be used to provide them to rural
households. With 24x7 electricity and
significant expansion of solar power, it
might be more practical to provide
induction cookers where supplying LPG
may be difficult or impracticable.
We have also looked at the
environmental consequences of energy
use. With emphasis on energy
efficiency, mass transport, efficient
vehicles, stringent emission norms,
promotion of electric vehicles and large
thrust on renewable energy can provide
a much cleaner environment.
Finally, we have pointed out that Gujarat is the
country’s gateway for energy imports. Gujarat
should continue to develop its port
infrastructure and consider it an opportunity to
stimulate its own development.
GUJARAT ENERGY STRATEGIES
About IRADe
IRADe networks with the government, ministries/ departments, international organizations, public and
private sectors, academic experts, NGOs, and consultants to work on projects awarded by them.
The ministries include Ministry of Environment and Forests and Climate Change, Ministry of New and
Renewable Energy, Niti Aayog (formerly Planning Commission), Ministry of Power, Ministry of External
Affairs, Ministry of Earth Sciences, Ministry of Urban Development, Department of Science and
Technology, Central Statistical Organization under Ministry of Statistics and Programme Implementation,
Technology Information, Forecasting and Assessment Council (TIFAC), etc. for many national level
projects.
At the international level, IRADe has worked with multilateral organization like the World Bank, Asian
Development Bank (ADB), U.S. Agency for International Development (USAID); United Nations
Development Programme (UNDP); Stanford university, California and United States Environmental
Protection Agency (USEPA), Wuppertal Institute for Climate, Environment and Energy, (WISION) Germany;
Deutsche Gesellschaft für Internationale Zusammenarbeit (GIZ), Germany; Rockefeller Foundation; British
High Commission; International Institute for Applied Systems Analysis (IIASA), Austria; British High
Commission (BHC), Centre for Clean Air Policy (CCAP), USA; International Institute for Sustainable
Development (IISD), South North Trust (SSNT) etc.
IRADe has collaborated with private sector and multinational organizations and NGOs such as Shakti
Foundation, Indian Council of Social Science Research (ICSSR), SEWA, Petroleum Federation of India, Price
water House Coopers, ICF International, Rockefeller Foundation, Institute for Social and Environmental
Transition (ISET), Centre for Clean Air Policy (CCAP), Indian Council for Research on International Economic
Relations (ICRIER), InsPIRE Network for Environment, NATCOM and Sir Dorabji Tata Trust (SDTT) among
others.
IRADe has also developed strategic partnerships and is part of global networks like the USAID Low
Emissions Asian Development (LEAD) program - ASIA-LEDS, ENERGIA-International Network for Gender
and Sustainable Energy, Netherlands; Global Clean Cook Stoves Forum, UN Foundation; Asian Cities
Climate Change Resilience Network (ACCCRN), Global Technology Watch Group (GTWG-DST), Climate
Action Network South Asia (CANSA)
IRADe has carried out some pioneering work in the field of state level energy planning, city level climate
resilience planning and other climate change studies and livelihood studies in agriculturally vulnerable
flood prone areas.
Thematic Areas of operation:
Energy and Power System (EPS)
Climate Change and Environment (CCE)
Agriculture and Food Program (AFP)
Poverty Alleviation and Gender (PAG)
Sustainable Urban Development (SUD)

GUJARAT ENERGY STRATEGIES
Integrated Research and Action for Development
C-80, Shivalik, Malviya Nagar, New Delhi - 110017
www.irade.org
Tel: 011-26676180-81