Environmental Protection Expenditure by Industry: 2010 … questionnaire on a voluntary basis....
89
Environmental Protection Expenditure by Industry: 2010 UK Survey Prepared for: Department for Environment, Food and Rural Affairs June 2012 Ref. 49355201
Transcript of Environmental Protection Expenditure by Industry: 2010 … questionnaire on a voluntary basis....
Environmental
Protection
Expenditure by
Industry:
2010 UK Survey
Prepared for:
Department for
Environment, Food
and Rural Affairs
June 2012
Ref. 49355201
URS Ref. 49355201 i Final Report
June 2012
The views and recommendations expressed in this report are those of the authors and do not
necessarily represent the views of the Department for Environment, Food and Rural Affairs, its
ministers or officials.
URS Ref. 49355201 i Final Report
June 2012
Project Title: Environmental Protection Expenditure Survey by Industry
Report Title: 2010 UK Survey
Project No: 49355201
Status: Final Report
Client Contact Name: Louise Rawlings
Client Company Name: Department for Environment, Food and Rural Affairs (Defra)
Issued By: URS Infrastructure & Environment Limited
Document Production / Approval Record
Issue No: 3 Name Signature Date Position
Prepared by Anna Hatley
June 2012 Consultant
Checked by Laura Quinton
June 2012 Principal Consultant
Approved by Sally Vivian
June 2012 Associate Director
Document Revision Record
Issue No Date Details of Revisions
1 April 2012 First draft
2 May 2012 Final draft
3 June 2012 Final report
Environmental Protection Expenditure by Industry: 2010 UK Survey
URS Ref. 49355201 Final Report
i June 2012
EXECUTIVE SUMMARY
Introduction
This report presents the findings of a study commissioned by the Department for Environment, Food and
Rural Affairs (Defra) and undertaken by URS Infrastructure & Environment Limited (URS), to estimate
expenditure by UK industry on environmental protection in 2010.
The primary objectives of the study are:
• To provide Defra with annual estimates of environmental protection expenditure by UK industry; and
• To enable Defra to provide these estimates to the European Commission as required under the
European Union (EU) Structural Business Statistics Regulation 295/2008.
In addition to these broad objectives, data from the annual surveys may be used to assess how
expenditure is changing, and to compare the levels of industry expenditure in the UK relative to other EU
countries. The data also enables companies and trade associations to benchmark their own
environmental spending against that of the industry as a whole, both in the UK and the EU. Furthermore,
information on companies’ environmental expenditure can be used to support evidence based policy-
making.
This is the fourteenth survey of this type; previous surveys were carried out in 1994 (a pilot survey), 1997,
and annually between 1999 and 2009. As in previous years, the 2010 survey process was overseen by a
steering group with representatives from Defra and the Office for National Statistics (ONS).
Methodology
The 2010 survey was provided to companies within the following Standard Industrial Classification (SIC
2007) categories:
• Mining and Quarrying • Non-Metallic Minerals
• Food, Beverages and Tobacco Products • Basic and Fabricated Metals
• Textiles, Clothing and Leather Products • Computer, Electronic and Optical
Products and Other Manufacturing
• Wood and Wood Products • Machinery and Electrical Equipment
• Paper and Pulp • Transport Equipment
• Printing and Publishing • Furniture Manufacture
• Coke and Refined Petroleum • Repair and Installation
• Chemicals and Pharmaceuticals • Energy Production and Distribution
• Rubber and Plastics • Water Supply and Treatment
The UK Government’s Inter Departmental Business Register (IDBR) provided a stratified random sample
of 7,827 companies from these industry sectors, who were invited to complete and return a postal or
electronic questionnaire on a voluntary basis.
Environmental Protection Expenditure by Industry: 2010 UK Survey
URS Ref. 49355201 ii Final Report
June 2012
The total number of validated responses was 2,352, giving a valid response rate of 30 per cent (%), the
highest response rate reported since the survey started. The responses were subjected to a range of
detailed validation checks.
The survey analysed the following expenditure patterns in UK industry:
• Operating expenditure (Opex): In-house operating costs of a company’s own environmental
protection activities, as well as payments to others for environmental protection services (e.g. waste
disposal); and
• Capital expenditure (Capex): ‘End of pipe’ investments (e.g. equipment to clean up at the end of the
production process) and integrated investment expenditure (e.g. equipment to reduce or eliminate
emissions and discharges as part of the production process).
The following were also identified:
• By-product income and savings resulting from environmental protection activities carried out in 2010;
• The environmental media (areas) affected by the spending, namely waste water, air, solid waste,
soil/groundwater, noise/vibrations and nature protection; and
• The use and accreditation of an environmental management system (EMS).
Expenditure on health and safety equipment or services is excluded. Energy costs are also excluded from
the definition of environmental protection expenditure, except where energy is specifically used to run
environmental protection equipment or services. Annual savings related to energy are included.
Key findings from the 2010 survey
The following comprise a brief overview of key findings from the 2010 survey:
• Gross spending on environmental protection in 2010 by UK industry amounted to an estimated £2.9
billion (±£680 million at a 95% confidence level);
• The primary spending industry sectors were Food, Beverages and Tobacco Products (16% of total
spend), Water Supply and Treatment (15% of total spend) and Machinery and Electrical Equipment
(9% of total spend);
• Opex accounted for 77% of the total environmental protection expenditure, with Capex making up the
remainder;
• Excluding spend on research and development, the area of largest expenditure across Opex and
Capex was for solid waste measures, which totalled 34% of total spend. Expenditure on water
protection measures accounted for 23%. Air and ‘other’ protection measures totalled 14% and 12% of
the total spend respectively, with the remaining 17% split between soil/groundwater, noise and nature
protection;
• This spending was offset by an estimated income of £73 million from the sale of by-products and an
estimated cost saving of £166 million.
Environmental Protection Expenditure by Industry: 2010 UK Survey
URS Ref. 49355201 iii Final Report
June 2012
• Overall, 34% of responding companies had an environmental management system (EMS) in place in
2010. A total of 17% of responding companies had an EMS certified to ISO 14001, and 0.34%
certified to Eco-Management and Auditing Scheme (EMAS).
Comparisons between survey years
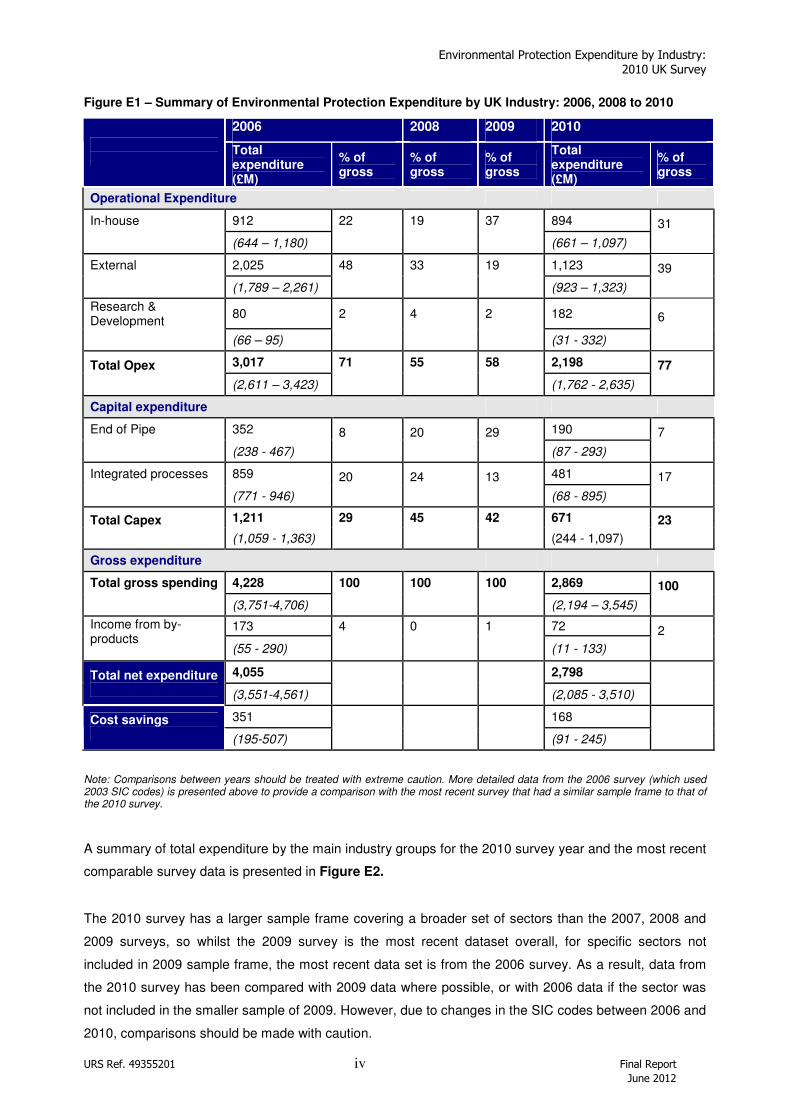
A summary of total environmental protection expenditure by businesses for 2006 and 2010 is presented
in Figure E1. Ranges indicating the 95% confidence intervals associated with each value are provided in
parenthesis.
Whilst efforts are made each year to increase confidence levels and to keep the survey questionnaire and
methodology consistent, direct comparisons between 2006 and 2010 survey years are not possible as:
• The 2003 Standard Industrial Classification (SIC) system was used during the 2006 survey
process, whereas 2007 SIC was used for the 2008, 2009 and 2010 surveys;
• The 2006 and 2010 survey sample frames were significantly larger than those for the 2008 and
2009 surveys;
• The 2006 and 2010 surveys also covered a greater number of SIC sectors than the 2008 and
2009 surveys; and
• Since 2006, a number of improvements have been made to the questionnaire design and layout.
In light of this, the following figures include a proportionate breakdown of total spend by Opex and Capex
reported in each year, as well as absolute figures.
Environmental Protection Expenditure by Industry: 2010 UK Survey
URS Ref. 49355201 iv Final Report
June 2012
Figure E1 – Summary of Environmental Protection Expenditure by UK Industry: 2006, 2008 to 2010
2006 2008 2009 2010
Total expenditure (£M)
% of gross
% of gross
% of gross
Total expenditure (£M)
% of gross
Operational Expenditure
In-house 912 22 19 37 894
(644 – 1,180) (661 – 1,097)
31
External 2,025 48 33 19 1,123
(1,789 – 2,261) (923 – 1,323)
39
Research & Development
80 2 4 2 182
(66 – 95) (31 - 332)
6
3,017 71 55 58 2,198 Total Opex (2,611 – 3,423) (1,762 - 2,635)
77
Capital expenditure
End of Pipe 352 190
(238 - 467)
8
20
29 (87 - 293)
7
Integrated processes 859 481
(771 - 946)
20
24
13 (68 - 895)
17
1,211 29 45 42 671 Total Capex (1,059 - 1,363) (244 - 1,097)
23
Gross expenditure
Total gross spending 4,228 100 100 100 2,869
(3,751-4,706) (2,194 – 3,545)
100
173 4 0 1 72 Income from by-products (55 - 290) (11 - 133)
2
4,055 2,798 Total net expenditure (3,551-4,561)
(2,085 - 3,510)
351 168 Cost savings (195-507)
(91 - 245)
Note: Comparisons between years should be treated with extreme caution. More detailed data from the 2006 survey (which used 2003 SIC codes) is presented above to provide a comparison with the most recent survey that had a similar sample frame to that of the 2010 survey.
A summary of total expenditure by the main industry groups for the 2010 survey year and the most recent
comparable survey data is presented in Figure E2.
The 2010 survey has a larger sample frame covering a broader set of sectors than the 2007, 2008 and
2009 surveys, so whilst the 2009 survey is the most recent dataset overall, for specific sectors not
included in 2009 sample frame, the most recent data set is from the 2006 survey. As a result, data from
the 2010 survey has been compared with 2009 data where possible, or with 2006 data if the sector was
not included in the smaller sample of 2009. However, due to changes in the SIC codes between 2006 and
2010, comparisons should be made with caution.
Environmental Protection Expenditure by Industry: 2010 UK Survey
URS Ref. 49355201 v Final Report
June 2012
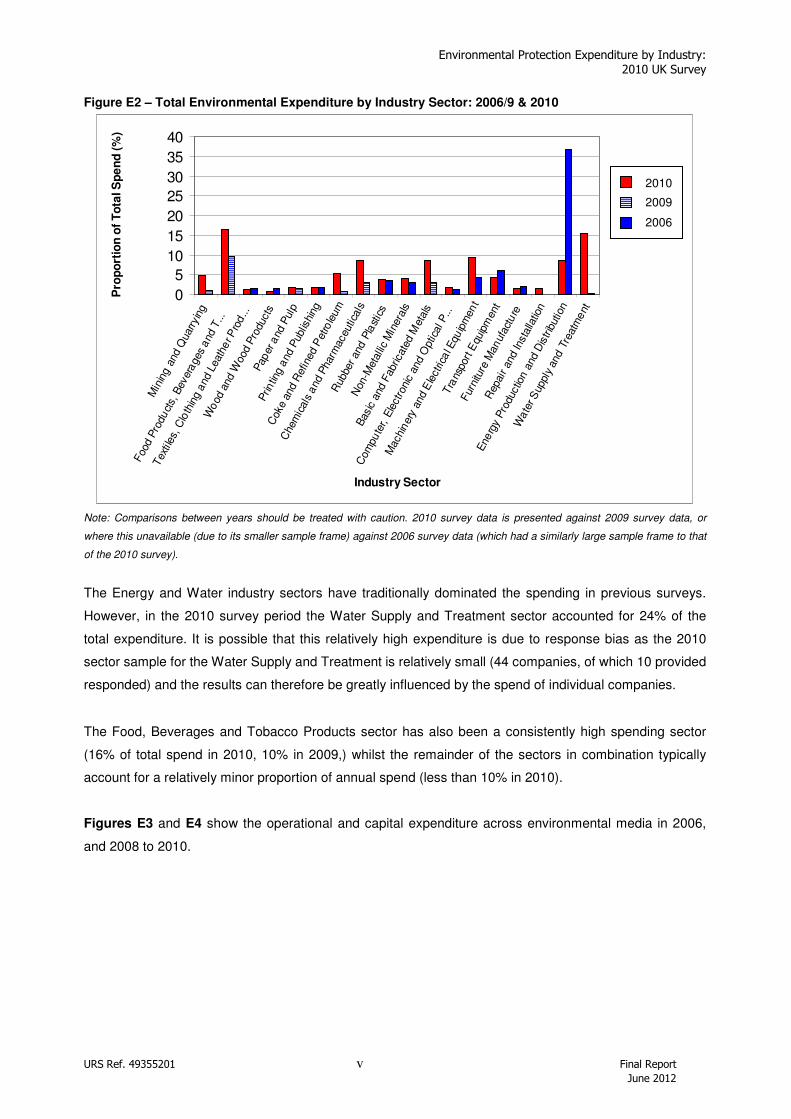
Figure E2 – Total Environmental Expenditure by Industry Sector: 2006/9 & 2010
Note: Comparisons between years should be treated with caution. 2010 survey data is presented against 2009 survey data, or
where this unavailable (due to its smaller sample frame) against 2006 survey data (which had a similarly large sample frame to that
of the 2010 survey).
The Energy and Water industry sectors have traditionally dominated the spending in previous surveys.
However, in the 2010 survey period the Water Supply and Treatment sector accounted for 24% of the
total expenditure. It is possible that this relatively high expenditure is due to response bias as the 2010
sector sample for the Water Supply and Treatment is relatively small (44 companies, of which 10 provided
responded) and the results can therefore be greatly influenced by the spend of individual companies.
The Food, Beverages and Tobacco Products sector has also been a consistently high spending sector
(16% of total spend in 2010, 10% in 2009,) whilst the remainder of the sectors in combination typically
account for a relatively minor proportion of annual spend (less than 10% in 2010).
Figures E3 and E4 show the operational and capital expenditure across environmental media in 2006,
and 2008 to 2010.
0
5
10
15
20
25
30
35
40M
inin
g an
d Q
uar
ryin
g
Foo
d P
roduct
s, B
ever
ages
and
T...
Tex
tile
s, C
loth
ing
and
Leat
her P
rod...
Wood
and
Wood
Pro
duct
sPap
er a
nd P
ulp
Prin
ting
and
Pub
lishi
ng
Coke
and
Ref
ined
Pet
role
um
Che
mic
als
and
Phar
mac
eutic
als
Rub
ber and
Pla
stic
s
Non
-Met
allic
Min
era
ls
Bas
ic a
nd F
abric
ated
Met
als
Com
pute
r, E
lect
roni
c an
d O
ptic
al P
...
Mach
inery
and
Ele
ctric
al E
quip
ment
Tra
nspor
t Equ
ipm
ent
Fur
nitu
re M
anuf
act
ure
Rep
air and
Inst
alla
tion
Energ
y P
roduc
tion a
nd D
istrib
utio
n
Wate
r S
uppl
y an
d T
reat
ment
Industry Sector
Pro
po
rtio
n o
f T
ota
l S
pe
nd
(%
)
2010
2009
2006
Environmental Protection Expenditure by Industry: 2010 UK Survey
URS Ref. 49355201 vi Final Report
June 2012
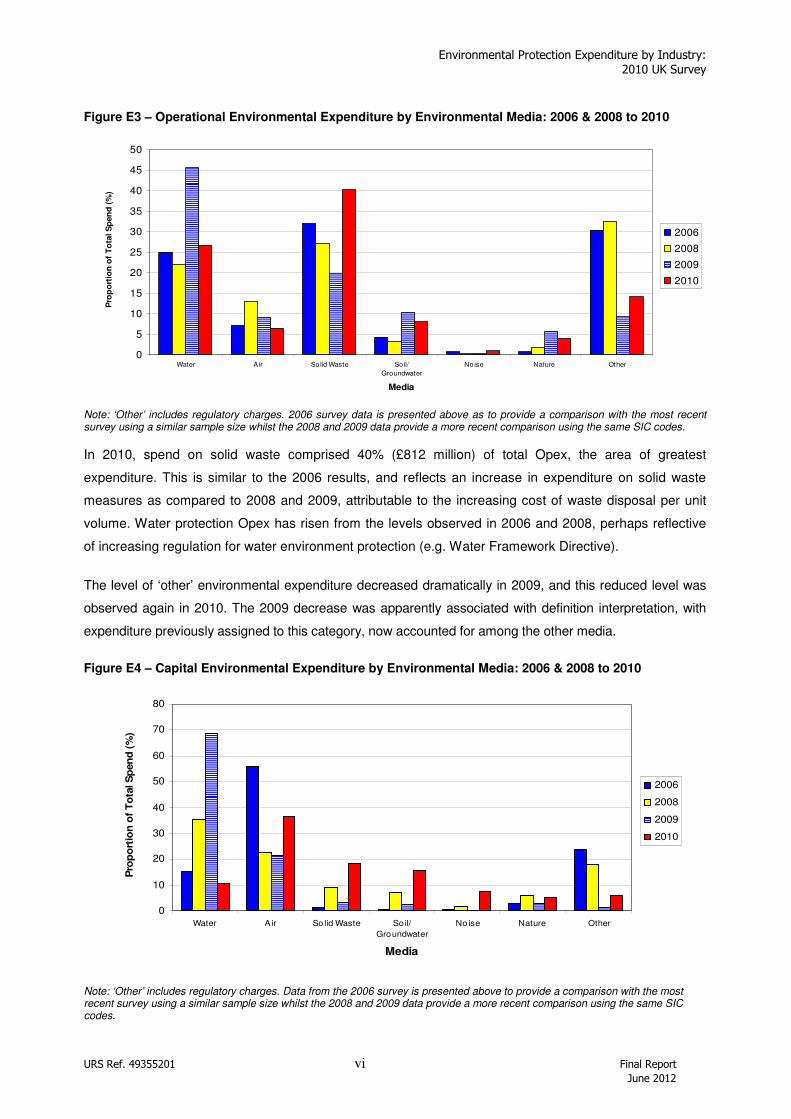
Figure E3 – Operational Environmental Expenditure by Environmental Media: 2006 & 2008 to 2010
0
5
10
15
20
25
30
35
40
45
50
Water A ir So lid Waste Soil/
Groundwater
Noise Nature Other
Media
Pro
po
rtio
n o
f T
ota
l S
pen
d (
%)
2006
2008
2009
2010
Note: ‘Other’ includes regulatory charges. 2006 survey data is presented above as to provide a comparison with the most recent survey using a similar sample size whilst the 2008 and 2009 data provide a more recent comparison using the same SIC codes.
In 2010, spend on solid waste comprised 40% (£812 million) of total Opex, the area of greatest
expenditure. This is similar to the 2006 results, and reflects an increase in expenditure on solid waste
measures as compared to 2008 and 2009, attributable to the increasing cost of waste disposal per unit
volume. Water protection Opex has risen from the levels observed in 2006 and 2008, perhaps reflective
of increasing regulation for water environment protection (e.g. Water Framework Directive).
The level of ‘other’ environmental expenditure decreased dramatically in 2009, and this reduced level was
observed again in 2010. The 2009 decrease was apparently associated with definition interpretation, with
expenditure previously assigned to this category, now accounted for among the other media.
Figure E4 – Capital Environmental Expenditure by Environmental Media: 2006 & 2008 to 2010
0
10
20
30
40
50
60
70
80
Water Air So lid Waste Soil/
Groundwater
Noise Nature Other
Media
Pro
po
rtio
n o
f T
ota
l S
pen
d (
%)
2006
2008
2009
2010
Note: ‘Other’ includes regulatory charges. Data from the 2006 survey is presented above to provide a comparison with the most recent survey using a similar sample size whilst the 2008 and 2009 data provide a more recent comparison using the same SIC codes.
Environmental Protection Expenditure by Industry: 2010 UK Survey
URS Ref. 49355201 vii Final Report
June 2012
Spend associated with air accounted for 37% of the total Capex (£247 million). Capex on solid waste
accounted for 18% of the total spend (£124 million), mirroring the increase seen in Opex in this area. Soil
and groundwater, and water protection measures contributed 16% and 11% respectively, whilst the
remaining 3 categories (noise, nature protection and other) made up the residual 18%.
Environmental Management Systems
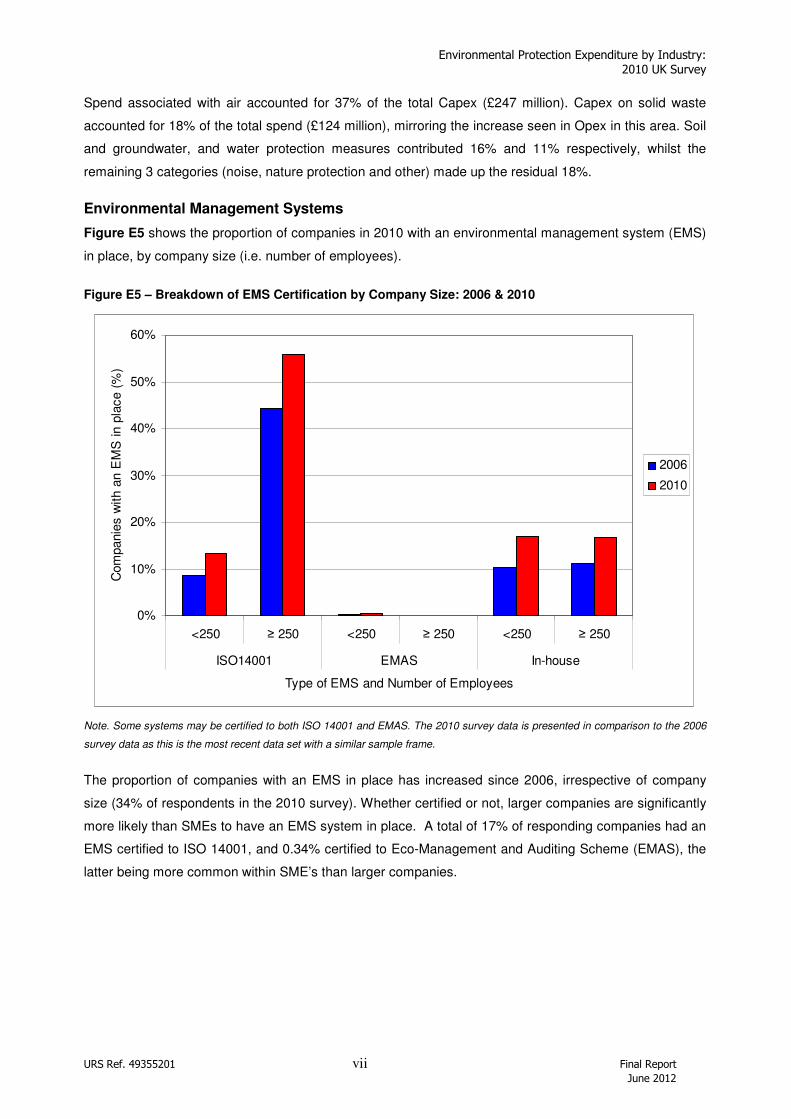
Figure E5 shows the proportion of companies in 2010 with an environmental management system (EMS)
in place, by company size (i.e. number of employees).
Figure E5 – Breakdown of EMS Certification by Company Size: 2006 & 2010
0%
10%
20%
30%
40%
50%
60%
<250 ≥ 250 <250 ≥ 250 <250 ≥ 250
ISO14001 EMAS In-house
Type of EMS and Number of Employees
Com
panie
s w
ith a
n E
MS
in p
lace (
%)
2006
2010
Note. Some systems may be certified to both ISO 14001 and EMAS. The 2010 survey data is presented in comparison to the 2006
survey data as this is the most recent data set with a similar sample frame.
The proportion of companies with an EMS in place has increased since 2006, irrespective of company
size (34% of respondents in the 2010 survey). Whether certified or not, larger companies are significantly
more likely than SMEs to have an EMS system in place. A total of 17% of responding companies had an
EMS certified to ISO 14001, and 0.34% certified to Eco-Management and Auditing Scheme (EMAS), the
latter being more common within SME’s than larger companies.
Environmental Protection Expenditure by Industry: 2010 UK Survey
URS Ref. 49355201 1 Final Report
June 2012
TABLE OF CONTENTS Page No
EXECUTIVE SUMMARY I
1 INTRODUCTION 3
1.1 OBJECTIVES 4
1.2 SCOPE AND BACKGROUND 4
1.3 DEFINITION OF ENVIRONMENTAL PROTECTION EXPENDITURE 5
1.4 REPORT STRUCTURE 6
2 SURVEY METHODOLOGY AND PREPARATION 8
2.1 MODIFICATIONS INTRODUCED SINCE THE 2006 SURVEY 9
2.2 SAMPLING METHODOLOGY 11
2.3 DATABASE DESIGN 12
3 CONDUCTING THE SURVEY 13
3.1 METHODOLOGY 13
3.2 TOP COMPANY FOCUS 14
3.2.1 Lessons learnt from the Dedicated Top Company Follow-up 14
3.2.2 Impact of the Top Company Focus 15
3.3 HELPDESK SUPPORT 15
4 ANALYSIS OF RESPONSES 17
4.1 RESPONSE RATES 17
4.2 WEIGHTED RESPONSE RATES 19
4.3 RESPONSE BIAS 19
4.4 ANALYSIS METHODOLOGY 19
4.5 SURVEY COMPLETION TIME 20
5 SURVEY RESULTS AND ANALYSIS 21
5.1 TOTAL EXPENDITURE 21
5.2 EXPENDITURE BY ENVIRONMENTAL MEDIA 23
5.3 OVERVIEW OF EXPENDITURE BY INDUSTRY SECTOR 26
5.4 COST SAVINGS AND INCOME 27
5.5 EXPENDITURE BY INDUSTRY SECTOR 29
5.5.1 SIC 05 to 09: Mining and Quarrying 31
5.5.2 SIC 10 to 12: Food, Beverages and Tobacco Products 33
5.5.3 SIC 13 to 15: Textiles, Clothing and Leather Products 35
5.5.4 SIC 16: Wood and Wood Products 37
5.5.5 SIC 17: Paper and Pulp 39
5.5.6 SIC 18: Printing and Publishing 41
5.5.7 SIC 19: Coke and Refined Petroleum 43
5.5.8 SIC 20 & 21: Chemicals and Pharmaceuticals 46
5.5.9 SIC 22: Rubber and Plastics 49
5.5.10 SIC 23: Non-Metallic Minerals 51
5.5.11 SIC 24 & 25: Basic and Fabricated Metals 53
5.5.12 SIC 26 & 32: Computer, Electronic and Optical Products, and Other Manufacturing 55
5.5.13 SIC 27 & 28: Machinery and Electrical Equipment 57
5.5.14 SIC 29 & 30: Transport Equipment 59
5.5.15 SIC 31: Furniture Manufacture 62
Environmental Protection Expenditure by Industry: 2010 UK Survey
URS Ref. 49355201 2 Final Report
June 2012
5.5.16 SIC 33: Repair and Installation 63
5.5.17 SIC 35: Energy Production and Distribution 65
5.5.18 SIC 36: Water Supply and Treatment 68
5.7 DRIVERS FOR CAPITAL EXPENDITURE 71
5.8 ENVIRONMENTAL MANAGEMENT SYSTEMS 72
5.8.1 Expenditure within EMS systems 73
5.8.2 EMS Implementation and Maintenance Cost 74
6 RECOMMENDATIONS FOR FUTURE SURVEY 76
LIST OF ACCRONYMS 78
LIST OF STANDARD INDUSTRIAL CLASSIFICATION (SIC) CODES 79
Environmental Protection Expenditure by Industry: 2010 UK Survey
URS Ref. 49355201 3 Final Report
June 2012
1 INTRODUCTION
This report relates to the fourteenth annual study commissioned by the Department for Environment,
Food and Rural Affairs (Defra) and undertaken by URS Infrastructure & Environment Limited (URS),
to estimate the annual expenditure by UK industry on environmental protection.
This report presents results from the analysis of the 2010 survey data returned by participating UK
companies. Previous surveys were carried out to estimate expenditure in 1994 (a pilot survey), 1997,
and 1999 to 2009. Throughout this report, surveys are referred by the year for which the expenditure
data was collected (normally two years in arrears of actual spend).
The 2010 survey was distributed to a total of 7,827 companies across the mining and quarrying,
manufacturing, energy production and water sectors, as defined by the UK Standard Industry
Classifications for Business (SIC) in 2007. This signifies a return to the larger sample size used in the
2006 survey, a reduced sample having been used during interim surveys to increase efficiency and to
reduce ‘survey fatigue’.
To provide some context and to allow broad trends to be established, grossed figures from the 2010
survey are presented with those from the 2006 survey, the last survey that had a similarly large
sample frame. Sector specific figures are presented along side those from 2006, and also 2008 and
2009 (i.e. the two preceding surveys, which had limited sample frames).
However, direct comparisons between survey years should be treated with extreme caution for the
following reasons:
• Most importantly, the main classification system used to analyse the 2006 data has since
been updated to reflect changes in UK industry. The 2006 data was classified using the SIC
2003 system, whilst the 2008, 2009 and 2010 survey data used the SIC 2007 system.
Although the survey methodology is broadly consistent across all years, a small number of
companies have been reclassified into a different main SIC grouping under the new
classification;
• As a consequence of the above point, a change was applied to the validation method of
survey returns for 2010 for the Water Supply and Treatment sector (SIC 36). This was
adjusted to reduce likelihood of double counting for the treatment of waste water
which is captured across all sectors. These adjustments have not been applied
retrospectively to the corresponding 2008 and 2009 figures in this report;
• Additionally, the sample size of the 2008 and 2009 surveys was restricted to a more limited
number of industry sectors than the 2006 and 2010 surveys, requiring certain individual
sectors to be compared to 2006 data;
Environmental Protection Expenditure by Industry: 2010 UK Survey
URS Ref. 49355201 4 Final Report
June 2012
• A number of improvements have been made to the survey design and layout since the 2006
survey; and
• The process of generating estimates of sectoral expenditure means that it is possible for one
company’s spending to affect the final figure to a considerable degree; it is possible that an
individual company may make a large, ‘one-off’ investment during the active survey period
and then return a small or even a zero response in the following survey. With the smaller
sample sizes in the 2008 and 2009 surveys, the potential is greater for sectoral estimates to
be skewed in this way.
In light of these issues, comparisons include confidence ranges for the total spending reported in each
year or are shown as percentage shares of total spend, as well as absolute figures. However,
comparisons between years should still be treated with caution.
1.1 OBJECTIVES
The primary objectives of the study were:
• To provide Defra with annual estimates of environmental protection expenditure by UK
industry; and
• To enable the UK Government to meet the requirements of the European Union (EU)
Structural Business Statistics Regulation 295/2008, which provides a framework for regular
data collection on economic activities and for providing information on the service sector.
In addition to these broad objectives, annual data from the surveys may be used to assess how
expenditure is changing and to compare the levels of expenditure of UK industries relative to other EU
countries. The data enables companies and trade associations to benchmark their own environmental
spending against that of the industry as a whole, both in the UK and the EU.
1.2 SCOPE AND BACKGROUND
The current 2010 survey covers expenditure incurred in the financial year 2010/2011. In accordance
with EU regulations, industries that have been surveyed are those in NACE1 sections C, D and E
(extraction, manufacturing, and energy and water supply). Expenditure estimates across these
sectors are provided for the following:
� In-house and external operating costs (including research and development, regulatory
charges etc);
� End-of-pipe capital investments;
� Integrated or ‘clean’ technology capital investments; and
1 NACE: ‘Nomenclature Générale des Activités Economiques dans les Communautés Européennes
Environmental Protection Expenditure by Industry: 2010 UK Survey
URS Ref. 49355201 5 Final Report
June 2012
� By-product income and environmental cost savings.
This expenditure is also reported by the environmental media to which they relate:
� Waste water: Collection and transport of waste water, the prevention or reduction in quantity
of waste water and of substances in waste water, the prevention of incidental water pollution,
the treatment of cooling water before draining to the surface or groundwater and monitoring
of surface water.
� Air: Prevention or reduction of gaseous, liquid or particulate emissions to the atmosphere
and the monitoring of air emissions.
� Solid Waste: Prevention or reduction of wastes including the collection, transport, treatment
and disposal and monitoring of waste.
� Soil/groundwater: Decontamination of polluted soils and cleansing of polluted ground water.
Includes the protection of soil and groundwater against pollution infiltration, monitoring of soil
and groundwater and the transport and disposal of contaminated soil.
� Noise/vibration: Measures to decrease noise and vibration levels at source, to isolate
receivers from noise/vibration and the monitoring of levels. Protection of the workplace is
excluded.
� Nature protection: Protection of species, landscapes and habitats; rehabilitation of damaged
landscapes due to past or current actions (including reforestation).
This survey succeeds the Defra surveys carried out for spend in 1997 and 1999 to 2009, and
research on environmental protection expenditure in 1994 (pilot study). The current report and those
from these surveys can be downloaded at: www.defra.gov.uk/statistics/environment/environmental-
survey/survey-results/
1.3 DEFINITION OF ENVIRONMENTAL PROTECTION EXPENDITURE
The definition of environmental protection expenditure used for this survey was established by the
Statistical Office of the European Community (SOEC) as follows:
‘Environmental protection expenditure is the sum of capital and current expenditure on
environmental protection activities. Environmental protection is an action or activity
(involving the use of equipment, labour, manufacturing techniques and practices,
information networks or products) where the main purpose is to collect, treat, reduce,
prevent, or eliminate pollutants and pollution or any other degradation of the environment
resulting from the activity of the company. Environmental protection expenditure may
relate to activities that generate marketable by-products, or results in savings, or are
financed by subsidies or capital allowances. In such cases, environmental protection
expenditure should be reported gross of any such cost offsets.’
Environmental Protection Expenditure by Industry: 2010 UK Survey
URS Ref. 49355201 6 Final Report
June 2012
Environmental protection expenditure includes: expenditure to reduce or prevent emission to air and
water; expenditure to protect or clean up soil and groundwater; expenditure to prevent noise and
vibration; and expenditure to reduce, treat and dispose of waste materials.
Expenditure may be operating expenditure (Opex) or capital expenditure (Capex):
� Opex includes the operating costs of a company’s own environmental protection equipment
and services and also payments to others for environmental protection services (including
waste disposal and sewage treatment).
� Capex consists of end-of-pipe expenditure and expenditure on integrated processes. End-
of-pipe capital expenditure is defined as expenditure on equipment used to treat, handle,
measure or dispose of emissions and wastes from production. Examples include effluent
treatment plants, exhaust air scrubbing systems and solid waste compactors.
� Capex on integrated processes relates to new or modified production facilities designed to
integrate environmental protection into the production process. This might include adaptation
of an existing installation/process whereby the integrated expenditure is then the total
purchase cost of the adaptation. It also includes installing a new process in which the design
takes environmental protection into account. In this case the expenditure counted is only the
extra cost compared with installing a less environmental friendly alternative.
Expenditure on health and safety equipment or services is excluded. Energy costs are also excluded
from the definition of environmental protection expenditure, except where energy is specifically used
to run environmental protection equipment or services. Annual savings relating to energy are
included.
1.4 REPORT STRUCTURE
This report consists of the following sections:
Section 1 Introduction
Section 2 Survey Methodology and Preparation
Section 3 Conducting the Survey
Section 4 Analysis of Responses
Section 5 Survey Results and Analysis
Section 6 Recommendations for Future Surveys
This main report is supplemented by detailed annexes, which are presented as separate documents:
Annex 1 Technical Guidance Note and Cover Letters
Annex 2 Validation of Responses
Annex 3 Response Codes for Sorting Correspondence
Annex 4 Drivers Behind Participation
Annex 5 Output of Data Analysis

Environmental Protection Expenditure by Industry: 2010 UK Survey
URS Ref. 49355201 7 Final Report
June 2012
Annex 6 Grossing-up Procedure
Annex 7 Method for Derivation of Standard Error and Confidence Intervals
This report and Annexes can be downloaded from the Defra website at:
www.defra.gov.uk/statistics/environment/environmental-survey/survey-results/
Environmental Protection Expenditure by Industry: 2010 UK Survey
URS Ref. 49355201 8 Final Report
June 2012
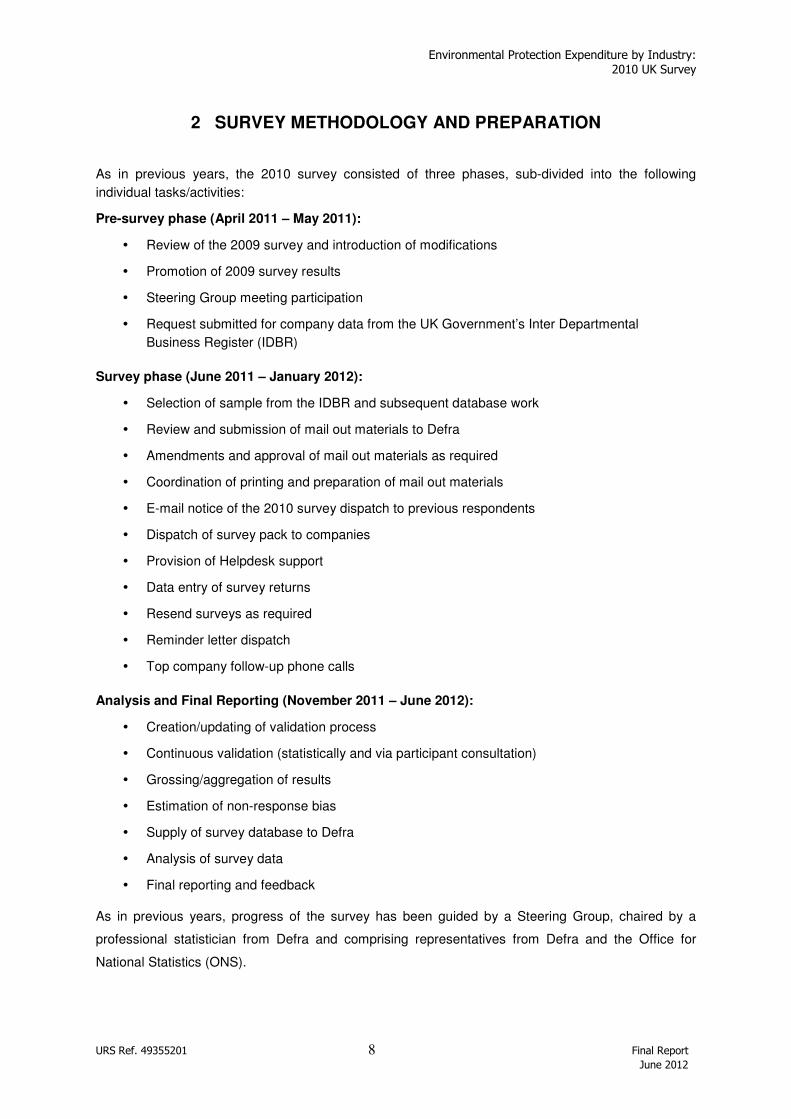
2 SURVEY METHODOLOGY AND PREPARATION
As in previous years, the 2010 survey consisted of three phases, sub-divided into the following
individual tasks/activities:
Pre-survey phase (April 2011 – May 2011):
� Review of the 2009 survey and introduction of modifications
� Promotion of 2009 survey results
� Steering Group meeting participation
� Request submitted for company data from the UK Government’s Inter Departmental
Business Register (IDBR)
Survey phase (June 2011 – January 2012):
� Selection of sample from the IDBR and subsequent database work
� Review and submission of mail out materials to Defra
� Amendments and approval of mail out materials as required
� Coordination of printing and preparation of mail out materials
� E-mail notice of the 2010 survey dispatch to previous respondents
� Dispatch of survey pack to companies
� Provision of Helpdesk support
� Data entry of survey returns
� Resend surveys as required
� Reminder letter dispatch
� Top company follow-up phone calls
Analysis and Final Reporting (November 2011 – June 2012):
� Creation/updating of validation process
� Continuous validation (statistically and via participant consultation)
� Grossing/aggregation of results
� Estimation of non-response bias
� Supply of survey database to Defra
� Analysis of survey data
� Final reporting and feedback
As in previous years, progress of the survey has been guided by a Steering Group, chaired by a
professional statistician from Defra and comprising representatives from Defra and the Office for
National Statistics (ONS).
Environmental Protection Expenditure by Industry: 2010 UK Survey
URS Ref. 49355201 9 Final Report
June 2012
Certain activities outlined above are described in more detail in Section 2.1 below. These include
modifications introduced since the 2006 survey (when a larger sample size was last used),
preparation of sampling methodology, and updates to the database design.
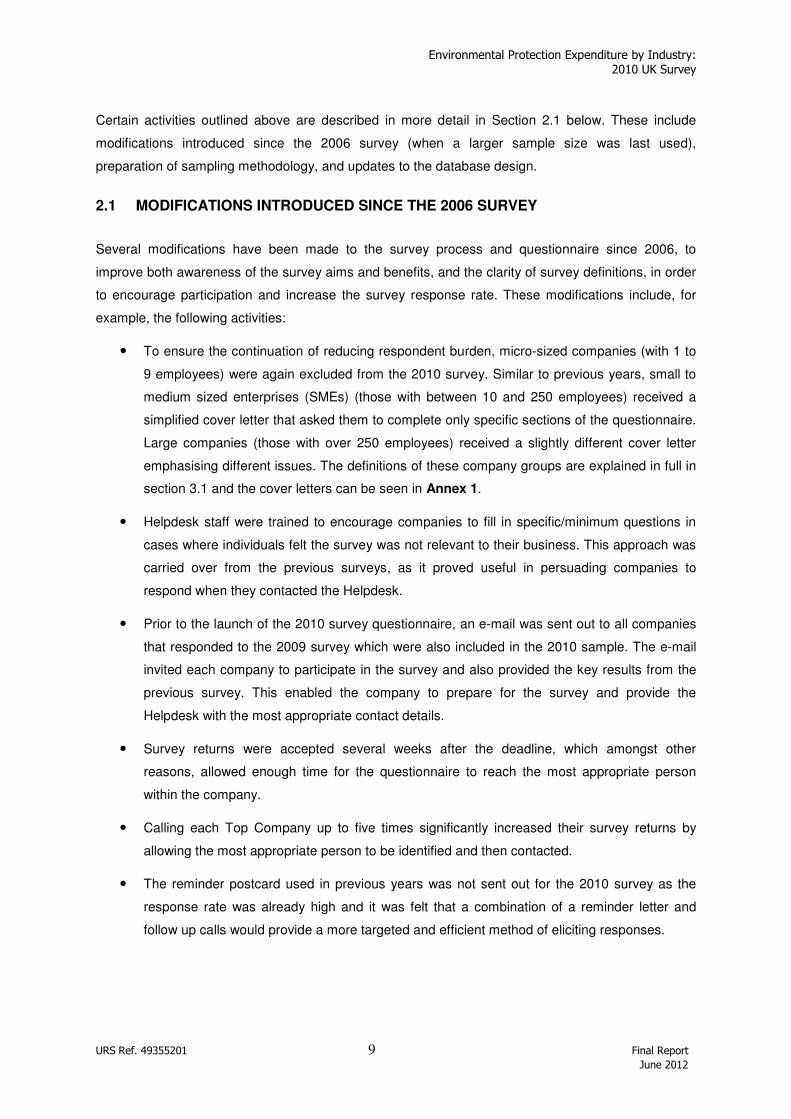
2.1 MODIFICATIONS INTRODUCED SINCE THE 2006 SURVEY
Several modifications have been made to the survey process and questionnaire since 2006, to
improve both awareness of the survey aims and benefits, and the clarity of survey definitions, in order
to encourage participation and increase the survey response rate. These modifications include, for
example, the following activities:
• To ensure the continuation of reducing respondent burden, micro-sized companies (with 1 to
9 employees) were again excluded from the 2010 survey. Similar to previous years, small to
medium sized enterprises (SMEs) (those with between 10 and 250 employees) received a
simplified cover letter that asked them to complete only specific sections of the questionnaire.
Large companies (those with over 250 employees) received a slightly different cover letter
emphasising different issues. The definitions of these company groups are explained in full in
section 3.1 and the cover letters can be seen in Annex 1.
• Helpdesk staff were trained to encourage companies to fill in specific/minimum questions in
cases where individuals felt the survey was not relevant to their business. This approach was
carried over from the previous surveys, as it proved useful in persuading companies to
respond when they contacted the Helpdesk.
• Prior to the launch of the 2010 survey questionnaire, an e-mail was sent out to all companies
that responded to the 2009 survey which were also included in the 2010 sample. The e-mail
invited each company to participate in the survey and also provided the key results from the
previous survey. This enabled the company to prepare for the survey and provide the
Helpdesk with the most appropriate contact details.
• Survey returns were accepted several weeks after the deadline, which amongst other
reasons, allowed enough time for the questionnaire to reach the most appropriate person
within the company.
• Calling each Top Company up to five times significantly increased their survey returns by
allowing the most appropriate person to be identified and then contacted.
• The reminder postcard used in previous years was not sent out for the 2010 survey as the
response rate was already high and it was felt that a combination of a reminder letter and
follow up calls would provide a more targeted and efficient method of eliciting responses.
Environmental Protection Expenditure by Industry: 2010 UK Survey
URS Ref. 49355201 10 Final Report
June 2012
Minor, limited updates were made to the 2009 format for use in the 2010 survey. This was generally to
allow for the larger sample size in the 2010 survey, which was of a similar size to that used in the
2006 survey.
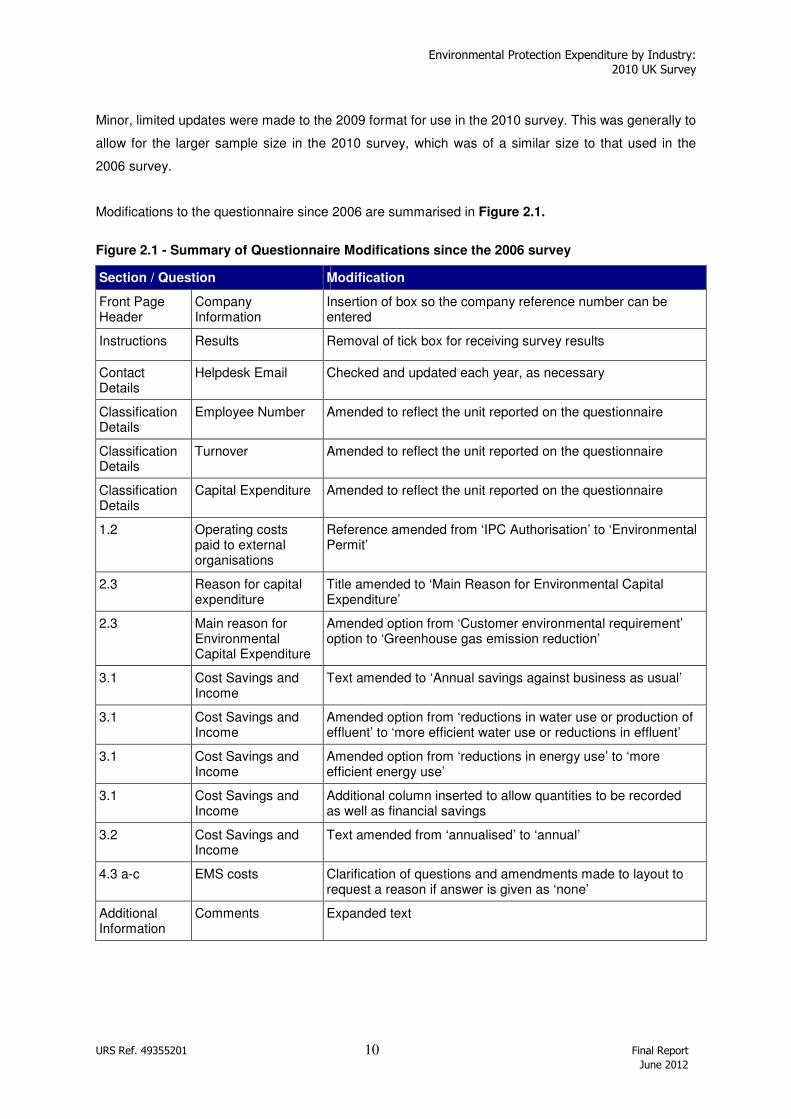
Modifications to the questionnaire since 2006 are summarised in Figure 2.1.
Figure 2.1 - Summary of Questionnaire Modifications since the 2006 survey
Section / Question Modification
Front Page Header
Company Information
Insertion of box so the company reference number can be entered
Instructions Results Removal of tick box for receiving survey results
Contact Details
Helpdesk Email Checked and updated each year, as necessary
Classification Details
Employee Number Amended to reflect the unit reported on the questionnaire
Classification Details
Turnover Amended to reflect the unit reported on the questionnaire
Classification Details
Capital Expenditure Amended to reflect the unit reported on the questionnaire
1.2 Operating costs paid to external organisations
Reference amended from ‘IPC Authorisation’ to ‘Environmental Permit’
2.3 Reason for capital expenditure
Title amended to ‘Main Reason for Environmental Capital Expenditure’
2.3 Main reason for Environmental Capital Expenditure
Amended option from ‘Customer environmental requirement’ option to ‘Greenhouse gas emission reduction’
3.1 Cost Savings and Income
Text amended to ‘Annual savings against business as usual’
3.1 Cost Savings and Income
Amended option from ‘reductions in water use or production of effluent’ to ‘more efficient water use or reductions in effluent’
3.1 Cost Savings and Income
Amended option from ‘reductions in energy use’ to ‘more efficient energy use’
3.1 Cost Savings and Income
Additional column inserted to allow quantities to be recorded as well as financial savings
3.2 Cost Savings and Income
Text amended from ‘annualised’ to ‘annual’
4.3 a-c EMS costs Clarification of questions and amendments made to layout to request a reason if answer is given as ‘none’
Additional Information
Comments Expanded text
Environmental Protection Expenditure by Industry: 2010 UK Survey
URS Ref. 49355201 11 Final Report
June 2012
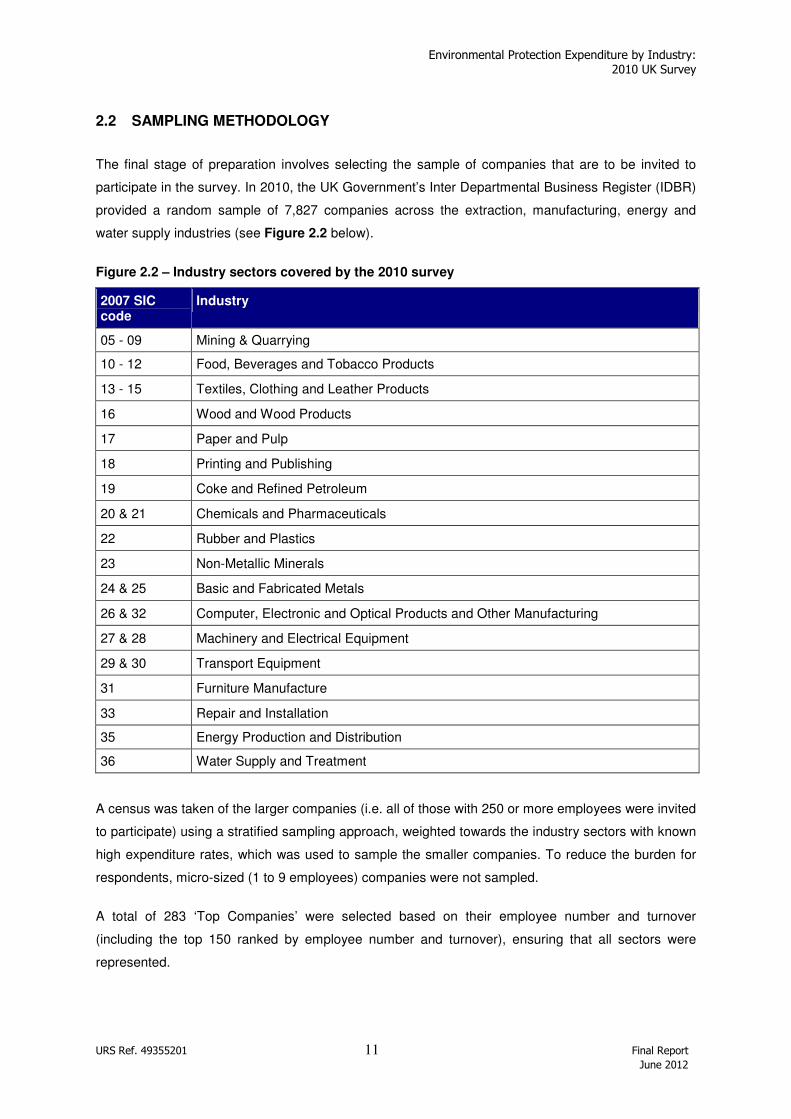
2.2 SAMPLING METHODOLOGY
The final stage of preparation involves selecting the sample of companies that are to be invited to
participate in the survey. In 2010, the UK Government’s Inter Departmental Business Register (IDBR)
provided a random sample of 7,827 companies across the extraction, manufacturing, energy and
water supply industries (see Figure 2.2 below).
Figure 2.2 – Industry sectors covered by the 2010 survey
2007 SIC code
Industry
05 - 09 Mining & Quarrying
10 - 12 Food, Beverages and Tobacco Products
13 - 15 Textiles, Clothing and Leather Products
16 Wood and Wood Products
17 Paper and Pulp
18 Printing and Publishing
19 Coke and Refined Petroleum
20 & 21 Chemicals and Pharmaceuticals
22 Rubber and Plastics
23 Non-Metallic Minerals
24 & 25 Basic and Fabricated Metals
26 & 32 Computer, Electronic and Optical Products and Other Manufacturing
27 & 28 Machinery and Electrical Equipment
29 & 30 Transport Equipment
31 Furniture Manufacture
33 Repair and Installation
35 Energy Production and Distribution
36 Water Supply and Treatment
A census was taken of the larger companies (i.e. all of those with 250 or more employees were invited
to participate) using a stratified sampling approach, weighted towards the industry sectors with known
high expenditure rates, which was used to sample the smaller companies. To reduce the burden for
respondents, micro-sized (1 to 9 employees) companies were not sampled.
A total of 283 ‘Top Companies’ were selected based on their employee number and turnover
(including the top 150 ranked by employee number and turnover), ensuring that all sectors were
represented.
Environmental Protection Expenditure by Industry: 2010 UK Survey
URS Ref. 49355201 12 Final Report
June 2012
In previous years, the Water Supply and Treatment (SIC 36) and Energy Production and Distribution
(SIC 35) sectors have been combined for the purposes of the survey. However, as these two sectors
have demonstrated very different expenditure trends, it was considered likely that grouping them
together would mask any trends for the two sectors within one total. Therefore, the two sectors were
disaggregated and treated as two individual sectors for the current 2010 survey.
2.3 DATABASE DESIGN
A database was specifically designed and built using Microsoft Access to store information from the
surveys and intended for use by URS personnel to:
• Gather information from postal questionnaires and other correspondence;
• Carry out continuous validation checks of the data entry process; and
• Conduct statistical analysis of each year’s data.
The 2009 survey database was updated for use during the 2010 survey through inputting the sample
data from the IDBR and making limited, minor updates to the user form.
As described in Annex 2, certain validation checks are incorporated into the database, which has a
number of advantages:
• Checks can be run more frequently and consistently;
• Validation tests take account of the data types and conversions;
• There is no delay between the data entry and the return of the validation checks, as the whole
process is undertaken within the same programme;
• Companies could be contacted promptly after returning their completed questionnaires with
any queries; and
• Results of validation calls or changes are input into the database.
After the validation tests were run, the results were stored for manual validation. The records within
the database would not change until the validation tests were run again.
Environmental Protection Expenditure by Industry: 2010 UK Survey
URS Ref. 49355201 13 Final Report
June 2012
3 CONDUCTING THE SURVEY
3.1 METHODOLOGY
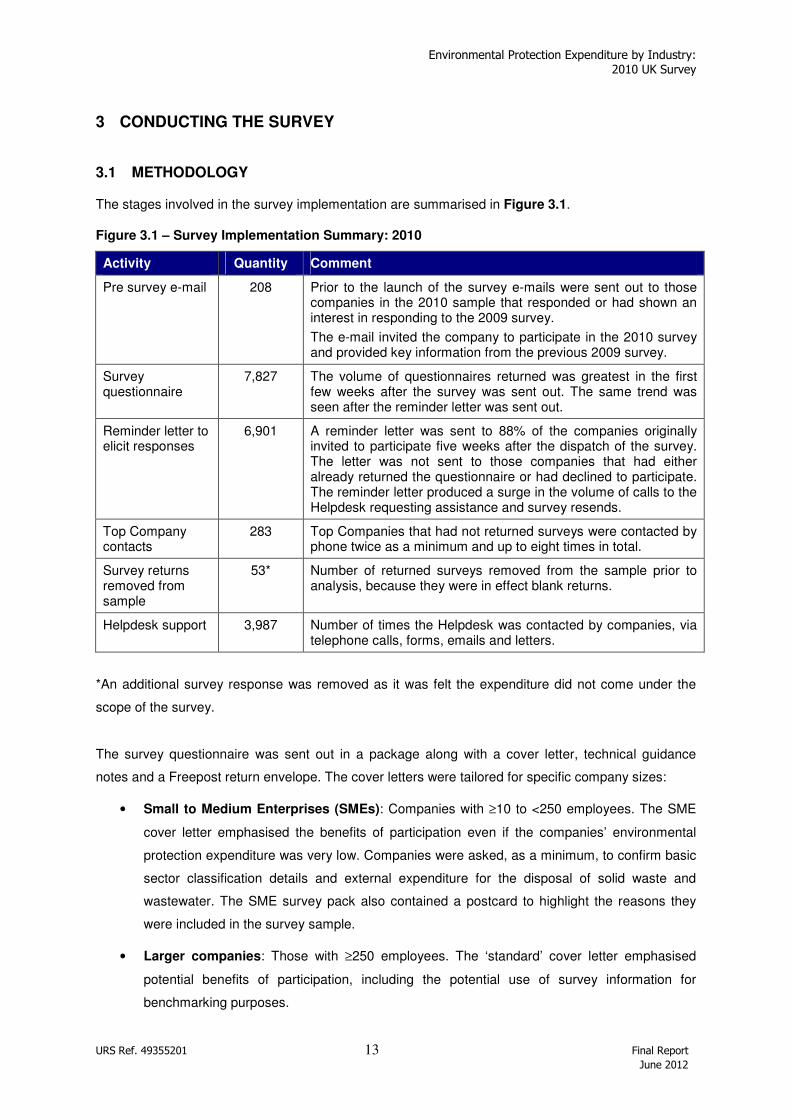
The stages involved in the survey implementation are summarised in Figure 3.1.
Figure 3.1 – Survey Implementation Summary: 2010
Activity Quantity Comment
Pre survey e-mail 208 Prior to the launch of the survey e-mails were sent out to those companies in the 2010 sample that responded or had shown an interest in responding to the 2009 survey.
The e-mail invited the company to participate in the 2010 survey and provided key information from the previous 2009 survey.
Survey questionnaire
7,827 The volume of questionnaires returned was greatest in the first few weeks after the survey was sent out. The same trend was seen after the reminder letter was sent out.
Reminder letter to elicit responses
6,901 A reminder letter was sent to 88% of the companies originally invited to participate five weeks after the dispatch of the survey. The letter was not sent to those companies that had either already returned the questionnaire or had declined to participate. The reminder letter produced a surge in the volume of calls to the Helpdesk requesting assistance and survey resends.
Top Company contacts
283 Top Companies that had not returned surveys were contacted by phone twice as a minimum and up to eight times in total.
Survey returns removed from sample
53*
Number of returned surveys removed from the sample prior to analysis, because they were in effect blank returns.
Helpdesk support 3,987 Number of times the Helpdesk was contacted by companies, via telephone calls, forms, emails and letters.
*An additional survey response was removed as it was felt the expenditure did not come under the
scope of the survey.
The survey questionnaire was sent out in a package along with a cover letter, technical guidance
notes and a Freepost return envelope. The cover letters were tailored for specific company sizes:
• Small to Medium Enterprises (SMEs): Companies with ≥10 to <250 employees. The SME
cover letter emphasised the benefits of participation even if the companies’ environmental
protection expenditure was very low. Companies were asked, as a minimum, to confirm basic
sector classification details and external expenditure for the disposal of solid waste and
wastewater. The SME survey pack also contained a postcard to highlight the reasons they
were included in the survey sample.
• Larger companies: Those with ≥250 employees. The ‘standard’ cover letter emphasised
potential benefits of participation, including the potential use of survey information for
benchmarking purposes.
Environmental Protection Expenditure by Industry: 2010 UK Survey
URS Ref. 49355201 14 Final Report
June 2012
Copies of the 2010 survey questionnaire, cover letters and technical guidance notes are provided in
Annex 1.
3.2 TOP COMPANY FOCUS
Owing to its success in increasing participation levels, dedicated Top Company follow-up (repeat
calls/reminder emails) has been continued for all post-1999 surveys. The following advantages have
been consistently identified:
• The telephone calls enable the survey team to build on their existing contact lists, and help
minimise future issues normally experienced in identifying and contacting the right person
within the different organisations.
• The calls offer the opportunity to increase the profile of the survey, encourage companies to
allocate time/resources to complete the survey, and to offer assistance in doing so, where
possible.
• Follow-up telephone conversations are helpful in data validation and quality control processes
and also provide an insight into the way companies interpreted the questions and presented
their data as responses.
• Feedback received from companies is an integral part of the questionnaire design for the
following year.
3.2.1 Lessons learnt from the Dedicated Top Company Follow-up
For those Top Companies that declined to participate in this year’s survey (2010), the most common
reasons were similar to previous surveys; that they did not have the resources or time available at
present to complete the survey and that the information required was not readily available. Related to
this response was that due to the size and nature of the companies, gathering the required
information would necessitate too much time to be devoted to it and the company’s accounting
procedures did not separately identify environmental protection expenditure.
Calling each Top Company at least twice and up to eight times increased the response rate. The
phone calls also enabled the most appropriate person within the organisation to be identified and
contacted. In total, 9% of 2010 Top Companies were classed as uncontactable (including instances
where no message could be left). Following the initial deadline, calls were made to Top Companies to
let them know that survey returns would still be accepted until the end of January 2012. These calls
were prioritised based on whether they had shown an interest in participating and a viable contact
identified. The follow up calls after the final deadline to companies that had indicated they would fill in
the survey but failed to return it, also increased the response rate.
Environmental Protection Expenditure by Industry: 2010 UK Survey
URS Ref. 49355201 15 Final Report
June 2012
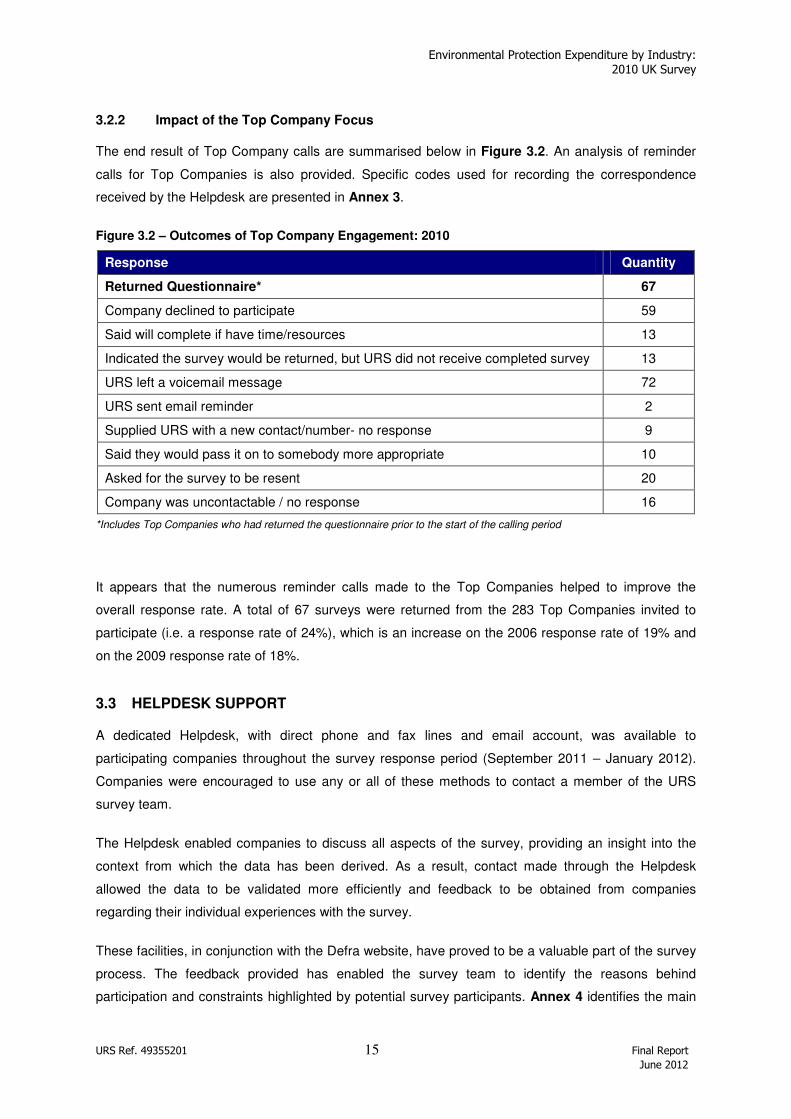
3.2.2 Impact of the Top Company Focus
The end result of Top Company calls are summarised below in Figure 3.2. An analysis of reminder
calls for Top Companies is also provided. Specific codes used for recording the correspondence
received by the Helpdesk are presented in Annex 3.
Figure 3.2 – Outcomes of Top Company Engagement: 2010
Response Quantity
Returned Questionnaire* 67
Company declined to participate 59
Said will complete if have time/resources 13
Indicated the survey would be returned, but URS did not receive completed survey 13
URS left a voicemail message 72
URS sent email reminder 2
Supplied URS with a new contact/number- no response 9
Said they would pass it on to somebody more appropriate 10
Asked for the survey to be resent 20
Company was uncontactable / no response 16
*Includes Top Companies who had returned the questionnaire prior to the start of the calling period
It appears that the numerous reminder calls made to the Top Companies helped to improve the
overall response rate. A total of 67 surveys were returned from the 283 Top Companies invited to
participate (i.e. a response rate of 24%), which is an increase on the 2006 response rate of 19% and
on the 2009 response rate of 18%.
3.3 HELPDESK SUPPORT
A dedicated Helpdesk, with direct phone and fax lines and email account, was available to
participating companies throughout the survey response period (September 2011 – January 2012).
Companies were encouraged to use any or all of these methods to contact a member of the URS
survey team.
The Helpdesk enabled companies to discuss all aspects of the survey, providing an insight into the
context from which the data has been derived. As a result, contact made through the Helpdesk
allowed the data to be validated more efficiently and feedback to be obtained from companies
regarding their individual experiences with the survey.
These facilities, in conjunction with the Defra website, have proved to be a valuable part of the survey
process. The feedback provided has enabled the survey team to identify the reasons behind
participation and constraints highlighted by potential survey participants. Annex 4 identifies the main
Environmental Protection Expenditure by Industry: 2010 UK Survey
URS Ref. 49355201 16 Final Report
June 2012
drivers behind participation and also the reasons why companies declined to participate. This
feedback will be considered when designing future surveys.
Companies that used the Helpdesk service commented that it had provided useful information,
clarification and assistance in completing the survey questionnaire.
The Defra website has been maintained and supported throughout the 2010 survey period:
www.defra.gov.uk/statistics/environment/environmental-survey/. The website has been used, in
conjunction with the Helpdesk, to provide companies with additional copies of the questionnaire,
technical guidance notes and other information relating to the survey. When requested, the website
was used as a primary means of providing additional, digital copies of the survey questionnaire, a
digital copy sent by e-mail was used as a secondary means, and a paper copy by post was only
offered as a final resort.
Environmental Protection Expenditure by Industry: 2010 UK Survey
URS Ref. 49355201 17 Final Report
June 2012
4 ANALYSIS OF RESPONSES
4.1 RESPONSE RATES
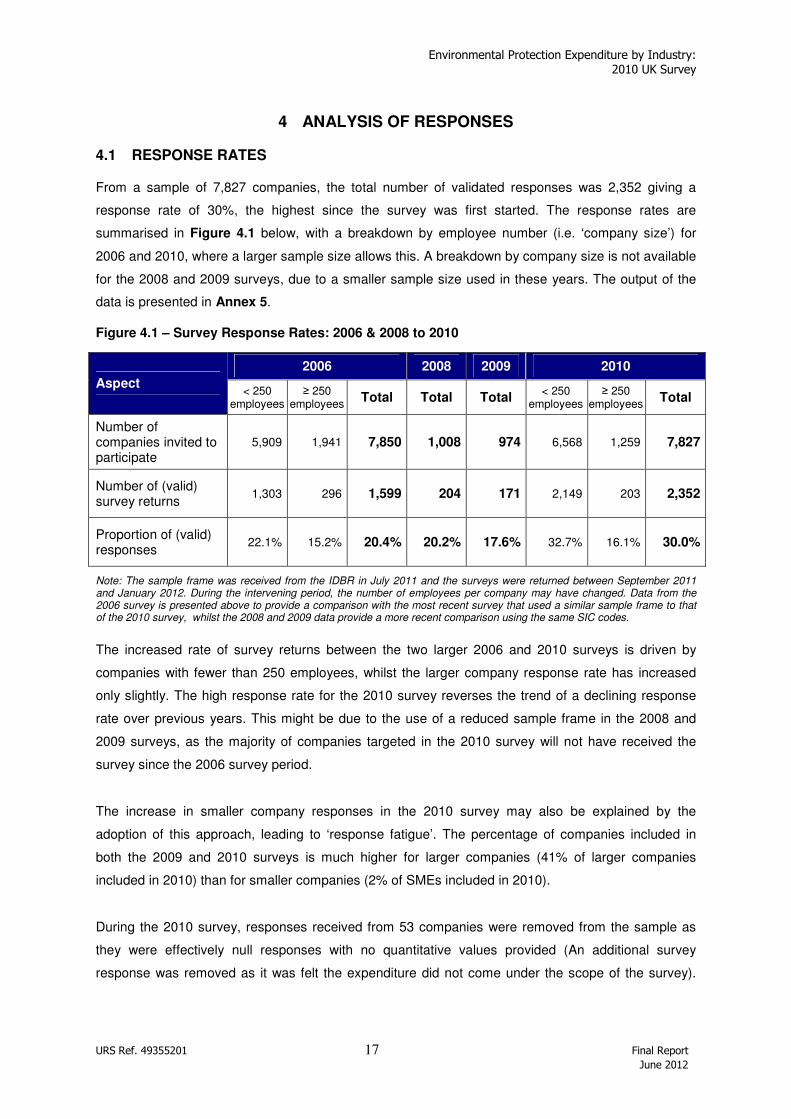
From a sample of 7,827 companies, the total number of validated responses was 2,352 giving a
response rate of 30%, the highest since the survey was first started. The response rates are
summarised in Figure 4.1 below, with a breakdown by employee number (i.e. ‘company size’) for
2006 and 2010, where a larger sample size allows this. A breakdown by company size is not available
for the 2008 and 2009 surveys, due to a smaller sample size used in these years. The output of the
data is presented in Annex 5.
Figure 4.1 – Survey Response Rates: 2006 & 2008 to 2010
Note: The sample frame was received from the IDBR in July 2011 and the surveys were returned between September 2011 and January 2012. During the intervening period, the number of employees per company may have changed. Data from the 2006 survey is presented above to provide a comparison with the most recent survey that used a similar sample frame to that of the 2010 survey, whilst the 2008 and 2009 data provide a more recent comparison using the same SIC codes.
The increased rate of survey returns between the two larger 2006 and 2010 surveys is driven by
companies with fewer than 250 employees, whilst the larger company response rate has increased
only slightly. The high response rate for the 2010 survey reverses the trend of a declining response
rate over previous years. This might be due to the use of a reduced sample frame in the 2008 and
2009 surveys, as the majority of companies targeted in the 2010 survey will not have received the
survey since the 2006 survey period.
The increase in smaller company responses in the 2010 survey may also be explained by the
adoption of this approach, leading to ‘response fatigue’. The percentage of companies included in
both the 2009 and 2010 surveys is much higher for larger companies (41% of larger companies
included in 2010) than for smaller companies (2% of SMEs included in 2010).
During the 2010 survey, responses received from 53 companies were removed from the sample as
they were effectively null responses with no quantitative values provided (An additional survey
response was removed as it was felt the expenditure did not come under the scope of the survey).
2006 2008 2009 2010
Aspect < 250
employees ≥ 250
employees Total Total Total
< 250 employees
≥ 250 employees
Total
Number of companies invited to participate
5,909 1,941 7,850 1,008 974 6,568 1,259 7,827
Number of (valid) survey returns
1,303 296 1,599 204 171 2,149 203 2,352
Proportion of (valid) responses
22.1% 15.2% 20.4% 20.2% 17.6% 32.7% 16.1% 30.0%
Environmental Protection Expenditure by Industry: 2010 UK Survey
URS Ref. 49355201 18 Final Report
June 2012
Reasons given by companies for returning such responses included that the company no longer
operated, participation was declined, or the company had ‘nothing to report’.
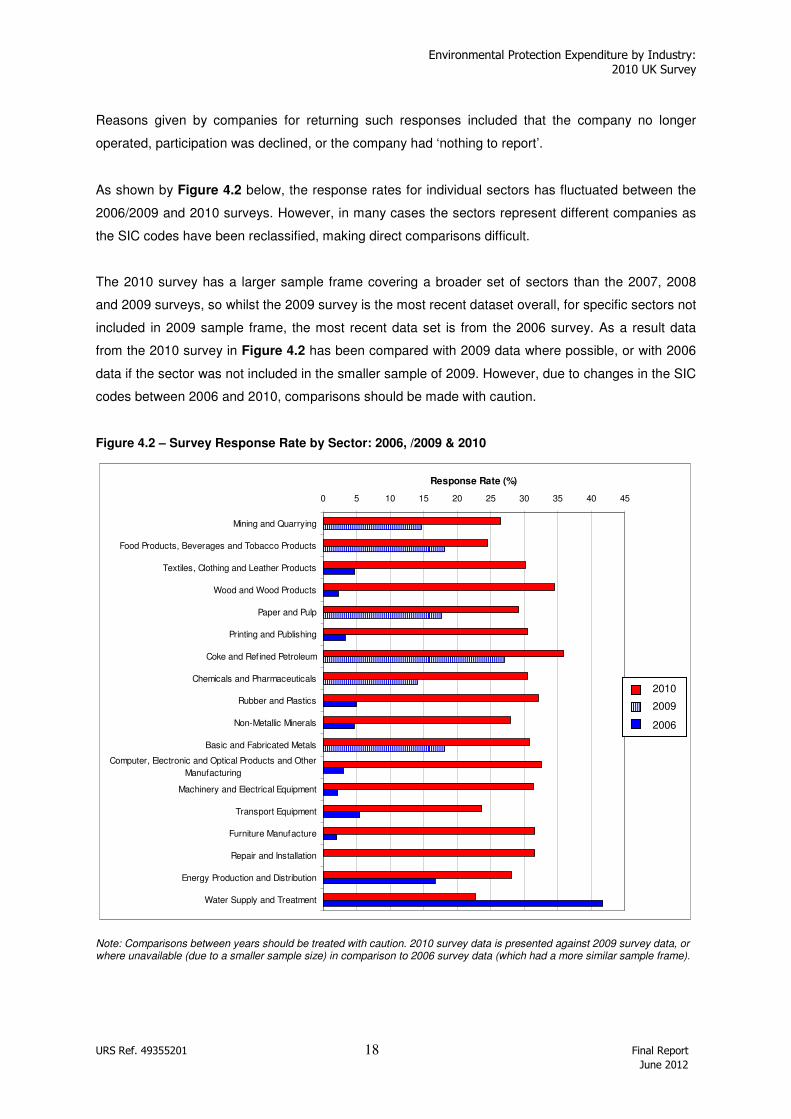
As shown by Figure 4.2 below, the response rates for individual sectors has fluctuated between the
2006/2009 and 2010 surveys. However, in many cases the sectors represent different companies as
the SIC codes have been reclassified, making direct comparisons difficult.
The 2010 survey has a larger sample frame covering a broader set of sectors than the 2007, 2008
and 2009 surveys, so whilst the 2009 survey is the most recent dataset overall, for specific sectors not
included in 2009 sample frame, the most recent data set is from the 2006 survey. As a result data
from the 2010 survey in Figure 4.2 has been compared with 2009 data where possible, or with 2006
data if the sector was not included in the smaller sample of 2009. However, due to changes in the SIC
codes between 2006 and 2010, comparisons should be made with caution.
Figure 4.2 – Survey Response Rate by Sector: 2006, /2009 & 2010
Note: Comparisons between years should be treated with caution. 2010 survey data is presented against 2009 survey data, or where unavailable (due to a smaller sample size) in comparison to 2006 survey data (which had a more similar sample frame).
0 5 10 15 20 25 30 35 40 45
Mining and Quarrying
Food Products, Beverages and Tobacco Products
Textiles, Clothing and Leather Products
Wood and Wood Products
Paper and Pulp
Printing and Publishing
Coke and Refined Petroleum
Chemicals and Pharmaceuticals
Rubber and Plastics
Non-Metallic Minerals
Basic and Fabricated Metals
Computer, Electronic and Optical Products and Other
Manufacturing
Machinery and Electrical Equipment
Transport Equipment
Furniture Manufacture
Repair and Installation
Energy Production and Distribution
Water Supply and Treatment
Response Rate (%)
2010
2006/9
2010
2009
2006
Environmental Protection Expenditure by Industry: 2010 UK Survey
URS Ref. 49355201 19 Final Report
June 2012
In the 2010 survey, the Coke and Refined Petroleum sector had the highest response rate of just over
35%. The sector with the lowest response rate is that of the Water Supply and Treatment sector, with
around 23% of invited companies responding to the 2010 survey. For the Water Supply and
Treatment sector, which has seen a reduction from 42% in 2006 to 23% in 2010, the response rates
have been consistently higher than in previous years across all sectors.
4.2 WEIGHTED RESPONSE RATES
The overall response rate given above considers each company as an equal contributor to the final
results. The survey sample has, however, been designed to target higher spending sectors and the
largest employers. This means that the effective response rate measures may be somewhat higher, in
terms of expenditure covered.
4.3 RESPONSE BIAS
As in previous surveys, the following potential response biases have been identified in the 2010
survey:
• Companies with zero or low expenditure are more likely to respond, as it takes less time and
effort to complete the questionnaire;
• Companies with dedicated environmental resource are more likely to respond, due to greater data
and resource availability; and
• Companies that have completed the survey in previous years are more likely to participate and
return a completed questionnaire.
The effect of these possible biases is likely to be reduced by the stratified sampling and grossing
arrangements (refer to Annex 6 for further details). This means that using a relatively large number of
cells (determined by size of company and SIC) to categorise companies with similar characteristics
that any bias is then ‘contained’ within the cell.
4.4 ANALYSIS METHODOLOGY
In comparing the data sets from different survey years, a number of factors need to be considered.
The ranges indicated by the confidence intervals for the total expenditure are relatively large, and
there have been improvements made to the questionnaire design and estimation procedure. Hence,
comparing the absolute values should be undertaken with caution.
The process of generating estimates of expenditure from the sample sets means that it is possible for
one company’s expenditure to affect the final figure to a considerable degree. Furthermore the nature
of environmental protection expenditure is such that an individual company may make a large “one-
off” investment (e.g. capital equipment upgrade). Therefore, whilst these large figures may make a
considerable difference in the final expenditure, they should still be included. This principally relates to

Environmental Protection Expenditure by Industry: 2010 UK Survey
URS Ref. 49355201 20 Final Report
June 2012
Capex rather than operating expenditure, which would be expected to be generally more consistent
from one year to the next. Details of the derivation of standard error and confidence interval are
presented in Annex 7.
4.5 SURVEY COMPLETION TIME
The breakdown of survey completion time as compared to previous survey years is presented in
Figure 4.3. Responses indicate that companies with:
• Less than 50 employees took on average 1 hour 10 minutes to complete the 2010 survey
questionnaire (compared to 1 hour 7 minutes for the 2009 survey)
• Between 50 and 250 employees spent an average of 1 hour 51 minutes completing the
questionnaire (compared to 2 hours 17 minutes for the 2009 survey).
• Between 250 and 500 employees took, on average, almost three times as long as those with less
than 50 employees, with an average completion time of approximately 3 hours 16 minutes
(comparative to the 2009 average of 2 hours 39 minutes).
• For companies with over 500 employees, completion time increased considerably compared to
previous years, with an average completion time of approximately 6 hours.
For the 2010 survey, the average reported time taken for companies with more than 500 employees
to complete the questionnaire has significantly increased compared to previous years.
Figure 4.3 – Breakdown of Mean Survey Completion Time by Company Size: 2006 & 2008 to 2010
0:00
0:30
1:00
1:30
2:00
2:30
3:00
3:30
4:00
4:30
5:00
5:30
6:00
<50 50-249 250-499 >500
Mean
Tim
e T
aken
(H
ou
rs a
nd
Min
ute
s)
2006
2008
2009
2010
Environmental Protection Expenditure by Industry: 2010 UK Survey
URS Ref. 49355201 21 Final Report
June 2012
5 SURVEY RESULTS AND ANALYSIS
5.1 TOTAL EXPENDITURE
The estimated total gross spending on environmental protection in 2010 by UK industry amounted to
an estimated £2.9 billion (±£0.68 billion at the 95% confidence level), which equates to a 32%
decrease on 2006 spend (£4.2 billion).
In 2010, Opex accounted for approximately 77% (£2.2 billion) of the total spending, with Capex at
23% (£0.7 billion). This majority spend on Opex is similar to that observed in previous years, with
external Opex accounting for a greater proportion than in-house Opex reflecting the split seen in 2006
and 2008.
Capex in 2010 also followed a similar trend to that of 2006, with spending on integrated processes
accounting for 17% of the total spend (20% in 2006), and end-of-pipe costs less than half at 7% (8%
in 2006). As in previous years, spend on environmental research and development (R&D) continues
to be a minor element of total spend (6% in 2010).
Following a relative increase for 2008 (45%) and 2009 (42%), Capex in 2010 as a proportion of total
environmental spend has returned to a level similar to that in 2006 (29%).
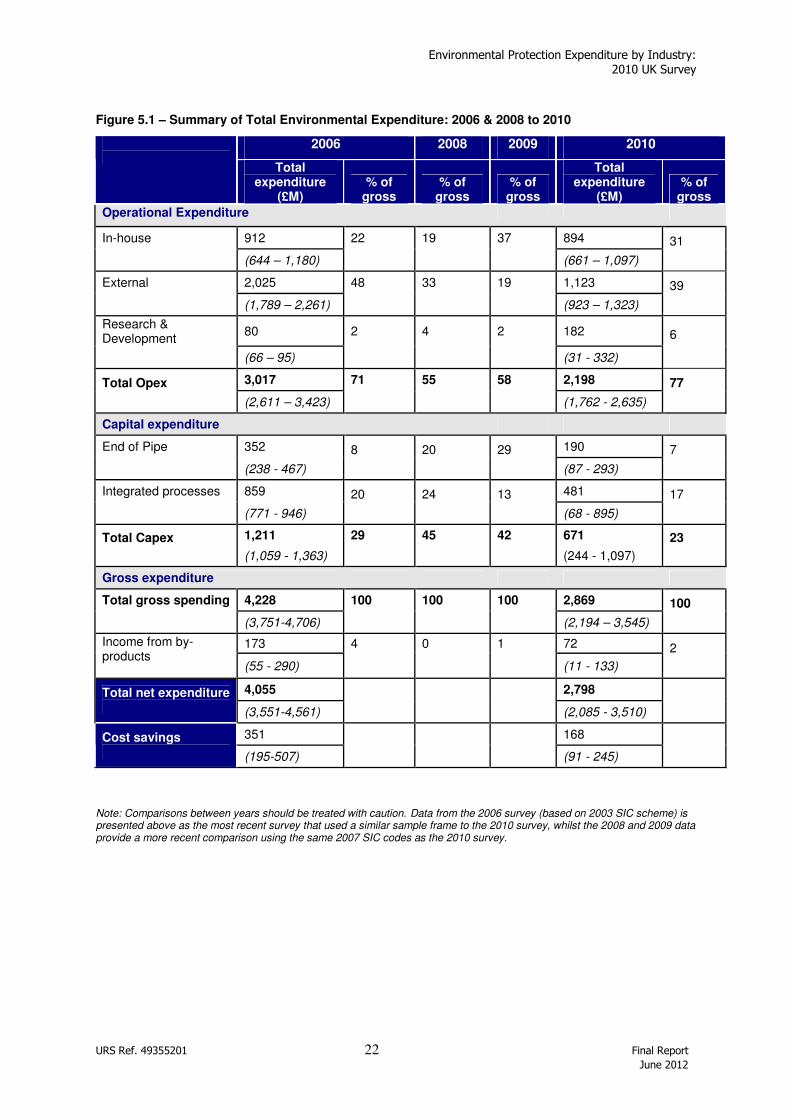
A summary of 2010 environmental expenditure is presented in Figure 5.1, along with equivalent data
for 2006, 2008 and 2009. Ranges indicating the 95% confidence intervals associated with each value
are provided in parenthesis.
As noted previously comparisons between years should be treated with extreme caution due to
variances in the sample frame (size and sectors) across the survey years, as well as improvements
made to the questionnaire design and layout.
Environmental Protection Expenditure by Industry: 2010 UK Survey
URS Ref. 49355201 22 Final Report
June 2012
Figure 5.1 – Summary of Total Environmental Expenditure: 2006 & 2008 to 2010
2006 2008 2009 2010
Total expenditure
(£M) % of
gross % of
gross % of
gross
Total expenditure
(£M) % of
gross
Operational Expenditure
In-house 912 22 19 37 894
(644 – 1,180) (661 – 1,097)
31
External 2,025 48 33 19 1,123
(1,789 – 2,261) (923 – 1,323)
39
Research & Development
80 2 4 2 182
(66 – 95) (31 - 332)
6
3,017 71 55 58 2,198 Total Opex (2,611 – 3,423) (1,762 - 2,635)
77
Capital expenditure
End of Pipe 352 190
(238 - 467)
8
20
29 (87 - 293)
7
Integrated processes 859 481
(771 - 946)
20
24
13 (68 - 895)
17
1,211 29 45 42 671 Total Capex (1,059 - 1,363) (244 - 1,097)
23
Gross expenditure
Total gross spending 4,228 100 100 100 2,869
(3,751-4,706) (2,194 – 3,545)
100
173 4 0 1 72 Income from by-products (55 - 290) (11 - 133)
2
4,055 2,798 Total net expenditure (3,551-4,561)
(2,085 - 3,510)
351 168 Cost savings (195-507)
(91 - 245)
Note: Comparisons between years should be treated with caution. Data from the 2006 survey (based on 2003 SIC scheme) is presented above as the most recent survey that used a similar sample frame to the 2010 survey, whilst the 2008 and 2009 data provide a more recent comparison using the same 2007 SIC codes as the 2010 survey.
Environmental Protection Expenditure by Industry: 2010 UK Survey
URS Ref. 49355201 Final Report June 2012
23
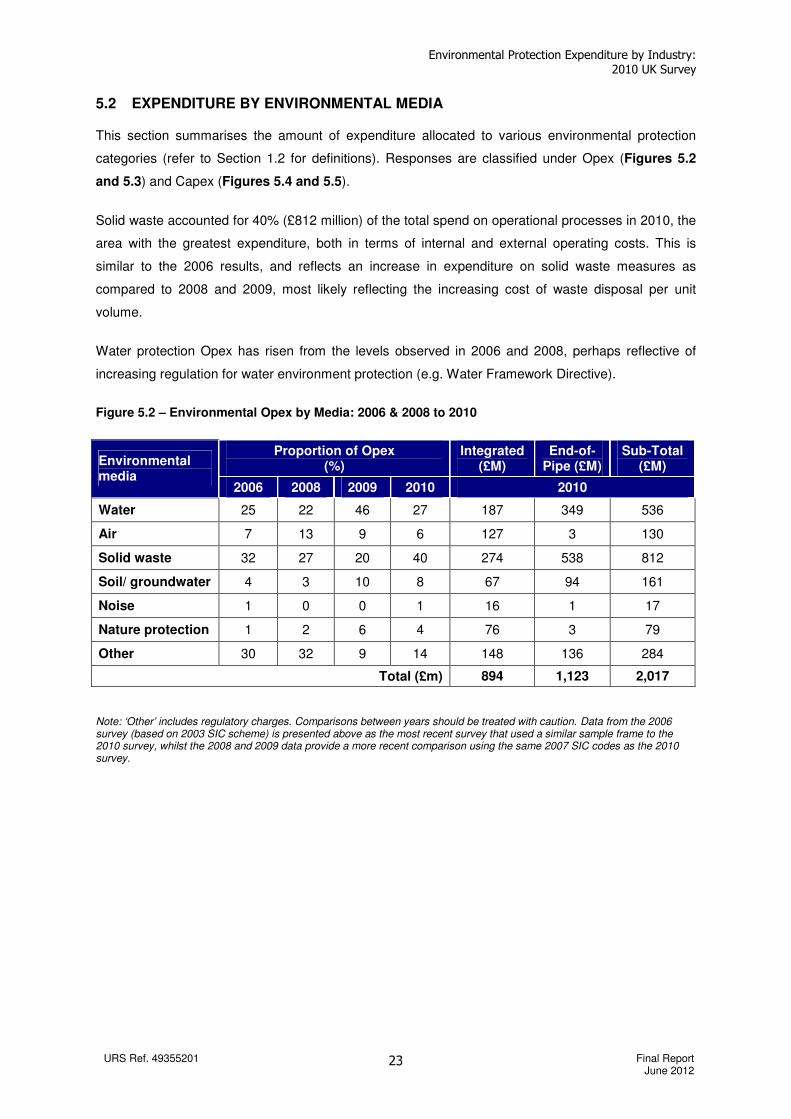
5.2 EXPENDITURE BY ENVIRONMENTAL MEDIA
This section summarises the amount of expenditure allocated to various environmental protection
categories (refer to Section 1.2 for definitions). Responses are classified under Opex (Figures 5.2
and 5.3) and Capex (Figures 5.4 and 5.5).
Solid waste accounted for 40% (£812 million) of the total spend on operational processes in 2010, the
area with the greatest expenditure, both in terms of internal and external operating costs. This is
similar to the 2006 results, and reflects an increase in expenditure on solid waste measures as
compared to 2008 and 2009, most likely reflecting the increasing cost of waste disposal per unit
volume.
Water protection Opex has risen from the levels observed in 2006 and 2008, perhaps reflective of
increasing regulation for water environment protection (e.g. Water Framework Directive).
Figure 5.2 – Environmental Opex by Media: 2006 & 2008 to 2010
Note: ‘Other’ includes regulatory charges. Comparisons between years should be treated with caution. Data from the 2006 survey (based on 2003 SIC scheme) is presented above as the most recent survey that used a similar sample frame to the 2010 survey, whilst the 2008 and 2009 data provide a more recent comparison using the same 2007 SIC codes as the 2010 survey.
Proportion of Opex (%)
Integrated (£M)
End-of-Pipe (£M)
Sub-Total (£M) Environmental
media 2006 2008 2009 2010 2010
Water 25 22 46 27 187 349 536
Air 7 13 9 6 127 3 130
Solid waste 32 27 20 40 274 538 812
Soil/ groundwater 4 3 10 8 67 94 161
Noise 1 0 0 1 16 1 17
Nature protection 1 2 6 4 76 3 79
Other 30 32 9 14 148 136 284
Total (£m) 894 1,123 2,017
Environmental Protection Expenditure by Industry: 2010 UK Survey
URS Ref. 49355201 Final Report June 2012
24
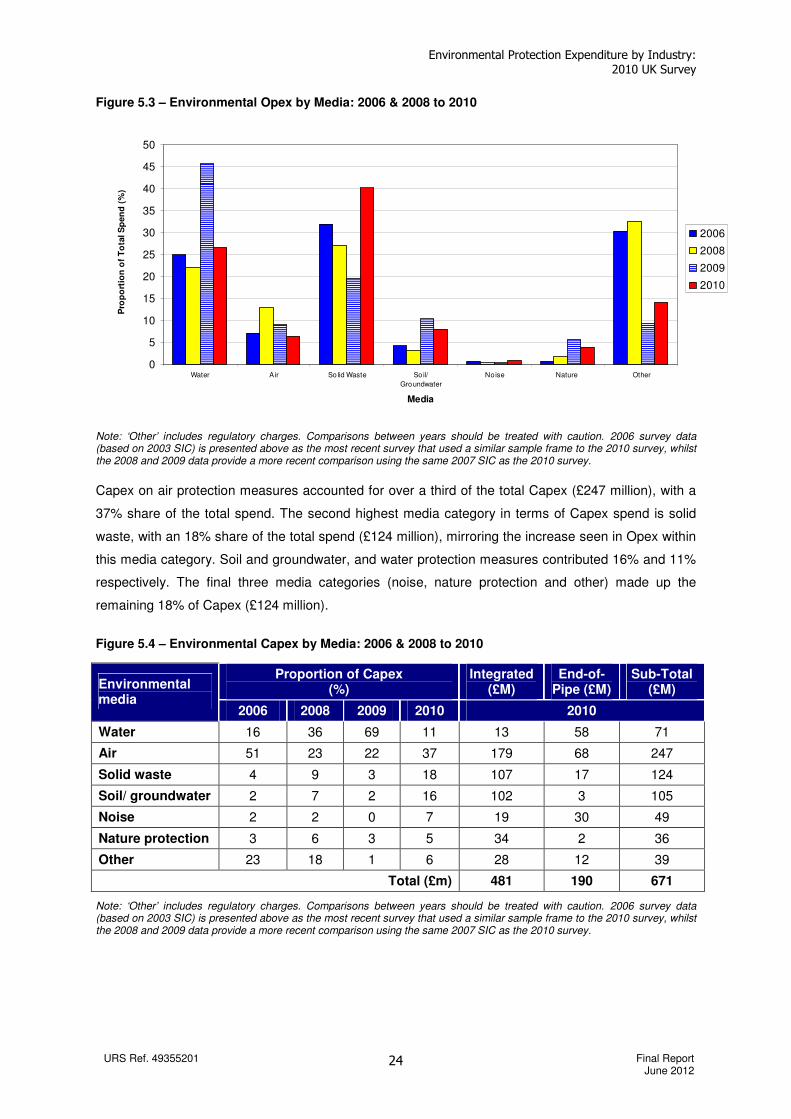
Figure 5.3 – Environmental Opex by Media: 2006 & 2008 to 2010
0
5
10
15
20
25
30
35
40
45
50
Water Air So lid Waste So il/
Groundwater
Noise Nature Other
Media
Pro
po
rtio
n o
f T
ota
l S
pen
d (
%)
2006
2008
2009
2010
Note: ‘Other’ includes regulatory charges. Comparisons between years should be treated with caution. 2006 survey data (based on 2003 SIC) is presented above as the most recent survey that used a similar sample frame to the 2010 survey, whilst the 2008 and 2009 data provide a more recent comparison using the same 2007 SIC as the 2010 survey.
Capex on air protection measures accounted for over a third of the total Capex (£247 million), with a
37% share of the total spend. The second highest media category in terms of Capex spend is solid
waste, with an 18% share of the total spend (£124 million), mirroring the increase seen in Opex within
this media category. Soil and groundwater, and water protection measures contributed 16% and 11%
respectively. The final three media categories (noise, nature protection and other) made up the
remaining 18% of Capex (£124 million).
Figure 5.4 – Environmental Capex by Media: 2006 & 2008 to 2010
Note: ‘Other’ includes regulatory charges. Comparisons between years should be treated with caution. 2006 survey data (based on 2003 SIC) is presented above as the most recent survey that used a similar sample frame to the 2010 survey, whilst the 2008 and 2009 data provide a more recent comparison using the same 2007 SIC as the 2010 survey.
Proportion of Capex (%)
Integrated (£M)
End-of-Pipe (£M)
Sub-Total (£M) Environmental
media 2006 2008 2009 2010 2010
Water 16 36 69 11 13 58 71
Air 51 23 22 37 179 68 247
Solid waste 4 9 3 18 107 17 124
Soil/ groundwater 2 7 2 16 102 3 105
Noise 2 2 0 7 19 30 49
Nature protection 3 6 3 5 34 2 36
Other 23 18 1 6 28 12 39
Total (£m) 481 190 671
Environmental Protection Expenditure by Industry: 2010 UK Survey
URS Ref. 49355201 Final Report June 2012
25
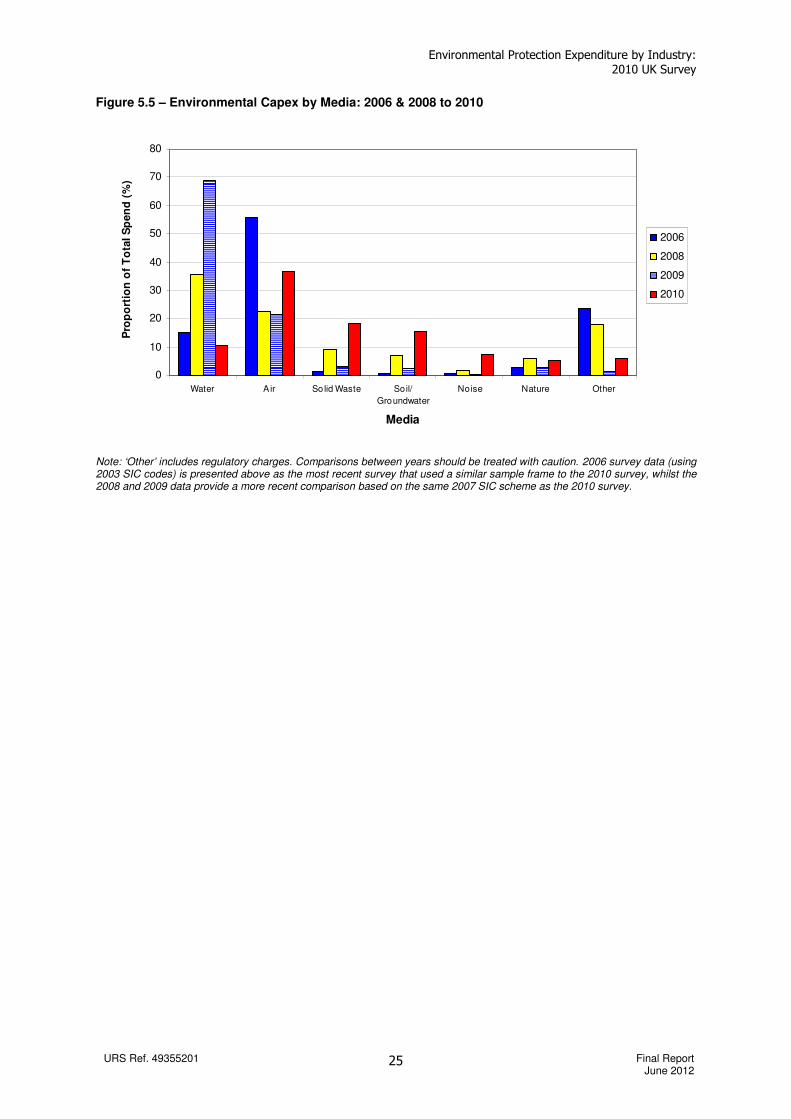
Figure 5.5 – Environmental Capex by Media: 2006 & 2008 to 2010
0
10
20
30
40
50
60
70
80
Water A ir So lid Waste Soil/
Groundwater
Noise Nature Other
Media
Pro
po
rtio
n o
f T
ota
l S
pen
d (
%)
2006
2008
2009
2010
Note: ‘Other’ includes regulatory charges. Comparisons between years should be treated with caution. 2006 survey data (using 2003 SIC codes) is presented above as the most recent survey that used a similar sample frame to the 2010 survey, whilst the 2008 and 2009 data provide a more recent comparison based on the same 2007 SIC scheme as the 2010 survey.
Environmental Protection Expenditure by Industry: 2010 UK Survey
URS Ref. 49355201 Final Report June 2012
26
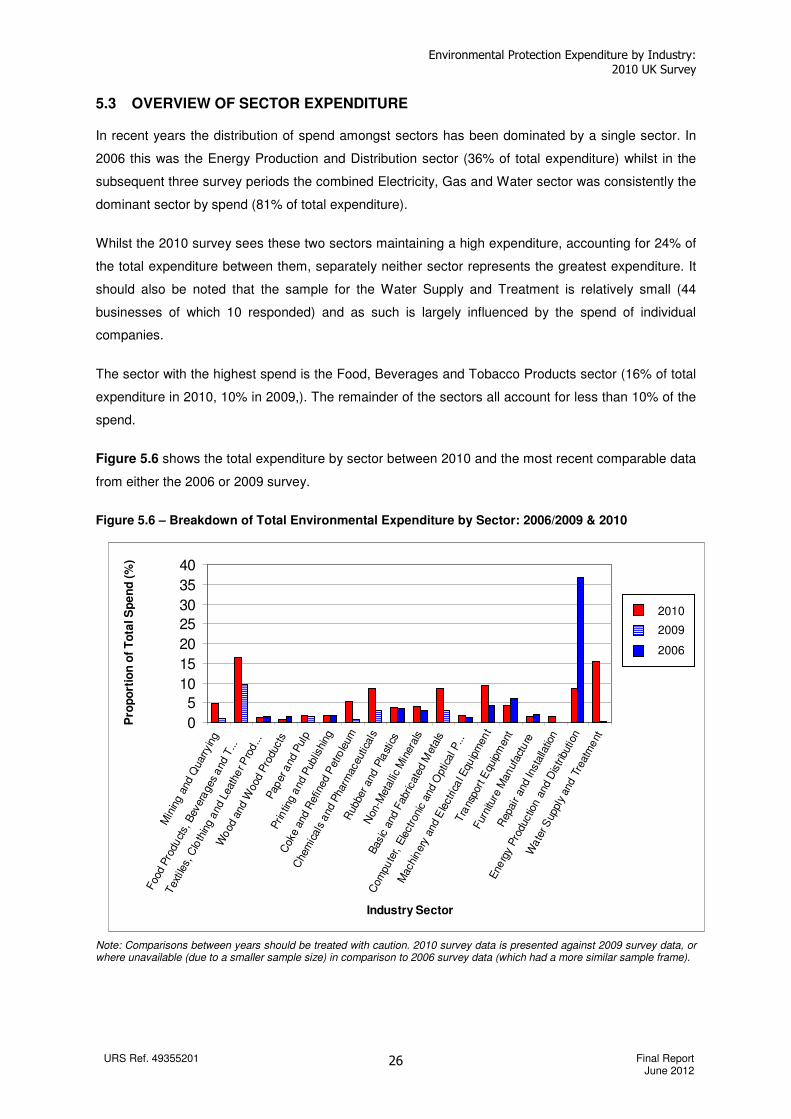
5.3 OVERVIEW OF SECTOR EXPENDITURE
In recent years the distribution of spend amongst sectors has been dominated by a single sector. In
2006 this was the Energy Production and Distribution sector (36% of total expenditure) whilst in the
subsequent three survey periods the combined Electricity, Gas and Water sector was consistently the
dominant sector by spend (81% of total expenditure).
Whilst the 2010 survey sees these two sectors maintaining a high expenditure, accounting for 24% of
the total expenditure between them, separately neither sector represents the greatest expenditure. It
should also be noted that the sample for the Water Supply and Treatment is relatively small (44
businesses of which 10 responded) and as such is largely influenced by the spend of individual
companies.
The sector with the highest spend is the Food, Beverages and Tobacco Products sector (16% of total
expenditure in 2010, 10% in 2009,). The remainder of the sectors all account for less than 10% of the
spend.
Figure 5.6 shows the total expenditure by sector between 2010 and the most recent comparable data
from either the 2006 or 2009 survey.
Figure 5.6 – Breakdown of Total Environmental Expenditure by Sector: 2006/2009 & 2010
Note: Comparisons between years should be treated with caution. 2010 survey data is presented against 2009 survey data, or where unavailable (due to a smaller sample size) in comparison to 2006 survey data (which had a more similar sample frame).
0
5
10
15
20
25
30
35
40
Min
ing
and
Quar
ryin
g
Foo
d P
roduct
s, B
ever
ages
and
T...
Tex
tile
s, C
loth
ing
and
Leat
her P
rod...
Wood
and
Wood
Pro
duct
sPap
er a
nd P
ulp
Prin
ting
and
Pub
lishi
ng
Coke
and
Ref
ined
Pet
role
um
Che
mic
als
and
Phar
mac
eutic
als
Rub
ber and
Pla
stic
s
Non
-Met
allic
Min
era
ls
Bas
ic a
nd F
abric
ated
Met
als
Com
pute
r, E
lect
roni
c an
d O
ptic
al P
...
Mach
inery
and
Ele
ctric
al E
quip
ment
Tra
nspor
t Equ
ipm
ent
Fur
nitu
re M
anuf
act
ure
Rep
air and
Inst
alla
tion
Energ
y P
roduc
tion a
nd D
istrib
utio
n
Wate
r S
uppl
y an
d T
reat
ment
Industry Sector
Pro
po
rtio
n o
f T
ota
l S
pe
nd
(%
)
2010
2009
2006
Environmental Protection Expenditure by Industry: 2010 UK Survey
URS Ref. 49355201 Final Report June 2012
27
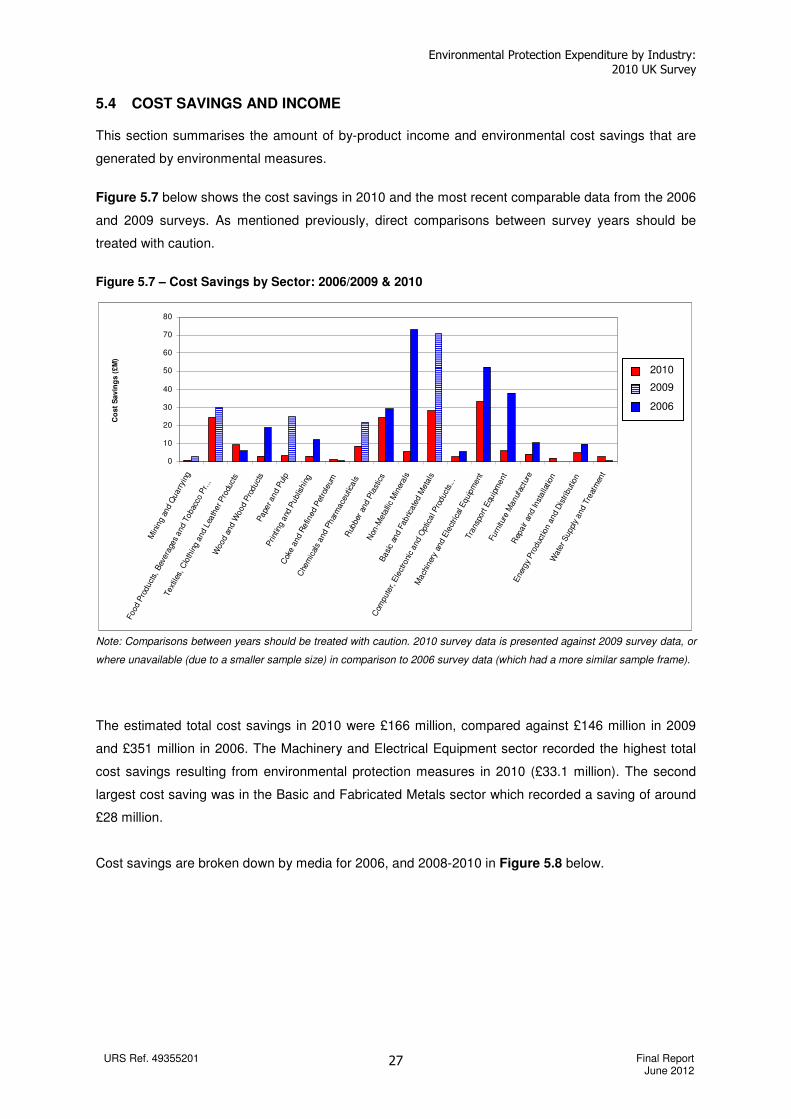
5.4 COST SAVINGS AND INCOME
This section summarises the amount of by-product income and environmental cost savings that are
generated by environmental measures.
Figure 5.7 below shows the cost savings in 2010 and the most recent comparable data from the 2006
and 2009 surveys. As mentioned previously, direct comparisons between survey years should be
treated with caution.
Figure 5.7 – Cost Savings by Sector: 2006/2009 & 2010
Note: Comparisons between years should be treated with caution. 2010 survey data is presented against 2009 survey data, or
where unavailable (due to a smaller sample size) in comparison to 2006 survey data (which had a more similar sample frame).
The estimated total cost savings in 2010 were £166 million, compared against £146 million in 2009
and £351 million in 2006. The Machinery and Electrical Equipment sector recorded the highest total
cost savings resulting from environmental protection measures in 2010 (£33.1 million). The second
largest cost saving was in the Basic and Fabricated Metals sector which recorded a saving of around
£28 million.
Cost savings are broken down by media for 2006, and 2008-2010 in Figure 5.8 below.
0
10
20
30
40
50
60
70
80
Min
ing
and Q
uarr
ying
Food
Pro
duct
s, B
evera
ges
and T
obac
co P
r...
Text
iles,
Clo
thin
g a
nd L
eath
er P
rodu
cts
Wood
and W
ood
Pro
duct
sP
ape
r and
Pul
p
ing a
nd P
ublis
hin
g
Cok
e a
nd
Refin
ed
Pet
role
um
Che
mic
als
and P
har
mace
utic
als
Rub
ber
and P
last
ics
Non
-Meta
llic
Min
erals
Basi
c an
d F
abric
ate
d M
eta
ls
Com
pute
r, E
lect
roni
c and O
ptic
al P
roduct
s...
Mach
iner
y an
d E
lect
rica
l Equip
ment
Tra
nsp
ort E
quip
ment
Furn
iture
Manuf
actu
re
Rep
air
and In
stalla
tion
Ener
gy
Pro
duc
tion a
nd
Dis
trib
utio
n
Wate
r S
uppl
y and
Tre
atm
ent
Co
st
Savin
gs (
£M
)
2010
2009
2006

Environmental Protection Expenditure by Industry: 2010 UK Survey
URS Ref. 49355201 Final Report June 2012
28
Figure 5.8 – Cost Savings by Environmental Media: 2006 & 2008 to 2010
2006 2008 2009 2010 Environmental media
Total Cost Savings
(£M)
% of Total
Total Cost Savings
(£M)
% of Total
Total Cost Savings
(£M)
% of Total
Total Cost Savings
(£M)
% of Total
Raw materials 114.9 33 18.7 20 15.2 10 62.0 37
Water use 18.7 5 9.4 10 10.5 7 10.6 6
Energy use 152.5 43 26.1 28 43.2 30 58.4 35
Waste 56.4 16 39.5 42 72.6 50 33.1 20
Other 8.8 3 1.2 1 4.5 3 2.3 1
Total 351.3 100 95.1 100 145.9 100 166.4 100
Note: ‘Other’ includes regulatory charges. Data from the 2006 survey is presented above to provide a comparison with the most recent survey using a similar sample size whilst the 2008 and 2009 data provide a more recent comparison using the same 2007 SIC scheme.
The highest cost savings were associated with improved use or substitution of raw materials in 2010
(37%), reflecting an increase in this area compared to previous years. This was followed by improved
energy use with approximately one-third of the overall saving attributed to this category (35%), and
waste with 20% of the total cost savings. The remaining seven percent result from cost savings from
water usage and ‘other’ improvements. Overall the top three media categories with the highest cost
savings have remained constant over the survey years (raw materials, energy use and waste),
although the relative proportions for each have fluctuated.
Income received as a result from by-products for 2010 as well as the most recent comparable data
from the 2006 and 2009 surveys is shown in Figure 5.9 below.
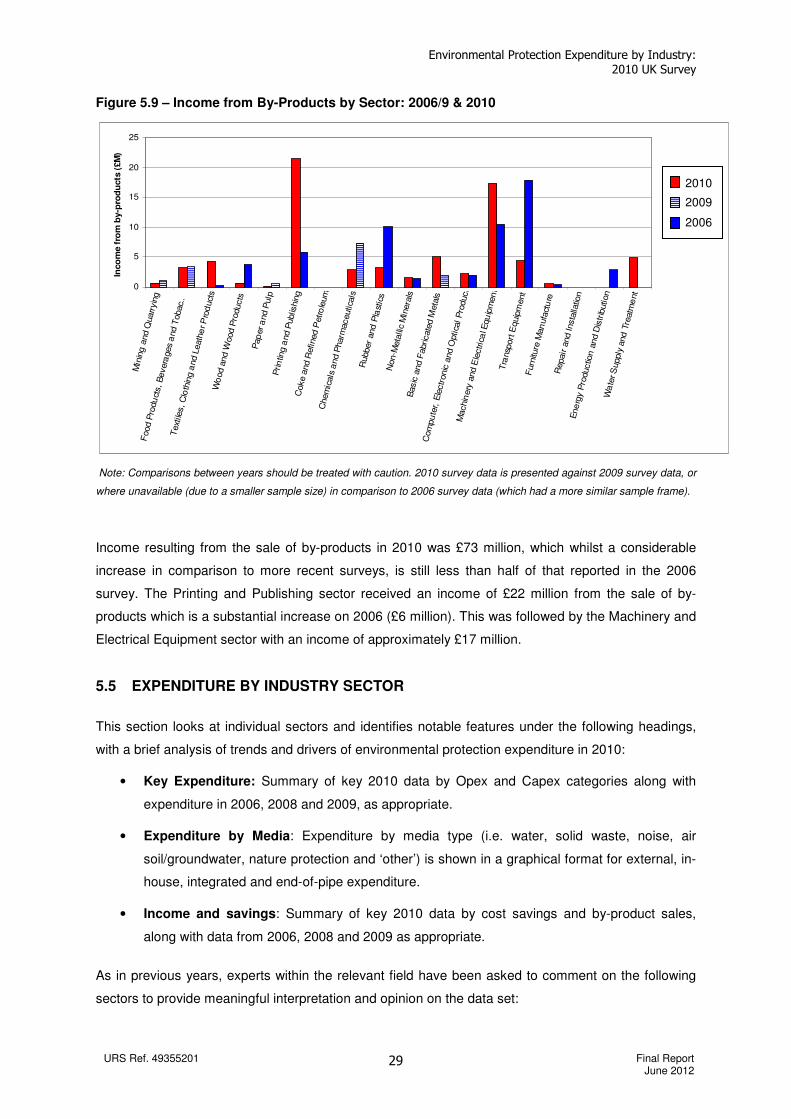
Environmental Protection Expenditure by Industry: 2010 UK Survey
URS Ref. 49355201 Final Report June 2012
29
Figure 5.9 – Income from By-Products by Sector: 2006/9 & 2010
Note: Comparisons between years should be treated with caution. 2010 survey data is presented against 2009 survey data, or
where unavailable (due to a smaller sample size) in comparison to 2006 survey data (which had a more similar sample frame).
Income resulting from the sale of by-products in 2010 was £73 million, which whilst a considerable
increase in comparison to more recent surveys, is still less than half of that reported in the 2006
survey. The Printing and Publishing sector received an income of £22 million from the sale of by-
products which is a substantial increase on 2006 (£6 million). This was followed by the Machinery and
Electrical Equipment sector with an income of approximately £17 million.
5.5 EXPENDITURE BY INDUSTRY SECTOR
This section looks at individual sectors and identifies notable features under the following headings,
with a brief analysis of trends and drivers of environmental protection expenditure in 2010:
• Key Expenditure: Summary of key 2010 data by Opex and Capex categories along with
expenditure in 2006, 2008 and 2009, as appropriate.
• Expenditure by Media: Expenditure by media type (i.e. water, solid waste, noise, air
soil/groundwater, nature protection and ‘other’) is shown in a graphical format for external, in-
house, integrated and end-of-pipe expenditure.
• Income and savings: Summary of key 2010 data by cost savings and by-product sales,
along with data from 2006, 2008 and 2009 as appropriate.
As in previous years, experts within the relevant field have been asked to comment on the following
sectors to provide meaningful interpretation and opinion on the data set:
0
5
10
15
20
25M
inin
g a
nd Q
uarr
yin
g
Food P
rodu
cts, B
evera
ges
and T
obac.
.T
ext
iles, C
loth
ing a
nd L
eath
er P
rod
uct
sW
ood a
nd W
ood P
roducts
Pap
er a
nd P
ulp
Prin
ting a
nd P
ublis
hin
gC
oke a
nd R
efined P
etro
leum
Chem
icals
and P
harm
aceutica
lsR
ubber
and
Pla
stic
sN
on-M
eta
llic
Min
era
lsB
asic
and F
abricate
d M
eta
ls
Com
pu
ter, E
lectr
onic
and O
ptica
l P
roducts
and
Oth
er
Ma
nufa
cturing
Machin
ery
and E
lectric
al E
qu
ipm
en
tT
ransp
ort
Equip
ment
Furn
iture
Man
ufa
ctu
reR
epair a
nd Insta
llatio
nE
ne
rgy P
roductio
n a
nd D
istr
ibution
Wa
ter S
upply
and
Tre
atm
ent
Inco
me f
rom
by-p
rod
ucts
(£M
)
2010
2009
2006

Environmental Protection Expenditure by Industry: 2010 UK Survey
URS Ref. 49355201 Final Report June 2012
30
Figure 5.10 – Sectors Receiving Expert Comment
Sector 2007 SIC code Page Number
Mining and Quarrying 5-9 28
Food, Beverages and Tobacco Products 10-12 30
Paper and Pulp 17 36
Printing and Publishing 18 38
Coke and Refined Petroleum 19 39
Chemicals and Pharmaceuticals 20 & 21 42
Basic and Fabricated Metals 24 & 25 48
Energy Production and Distribution 35 60
Water Supply and Treatment 36 63
When looking at the sector analyses, it should be remembered that direct comparisons between
survey years are not possible due to changes in the classification system used to analyse survey
data, variances in the sample size between the smaller 2008 and 2009 surveys and the larger 2006
and 2010 surveys, and the improvements made to the questionnaire design and estimation
procedures.
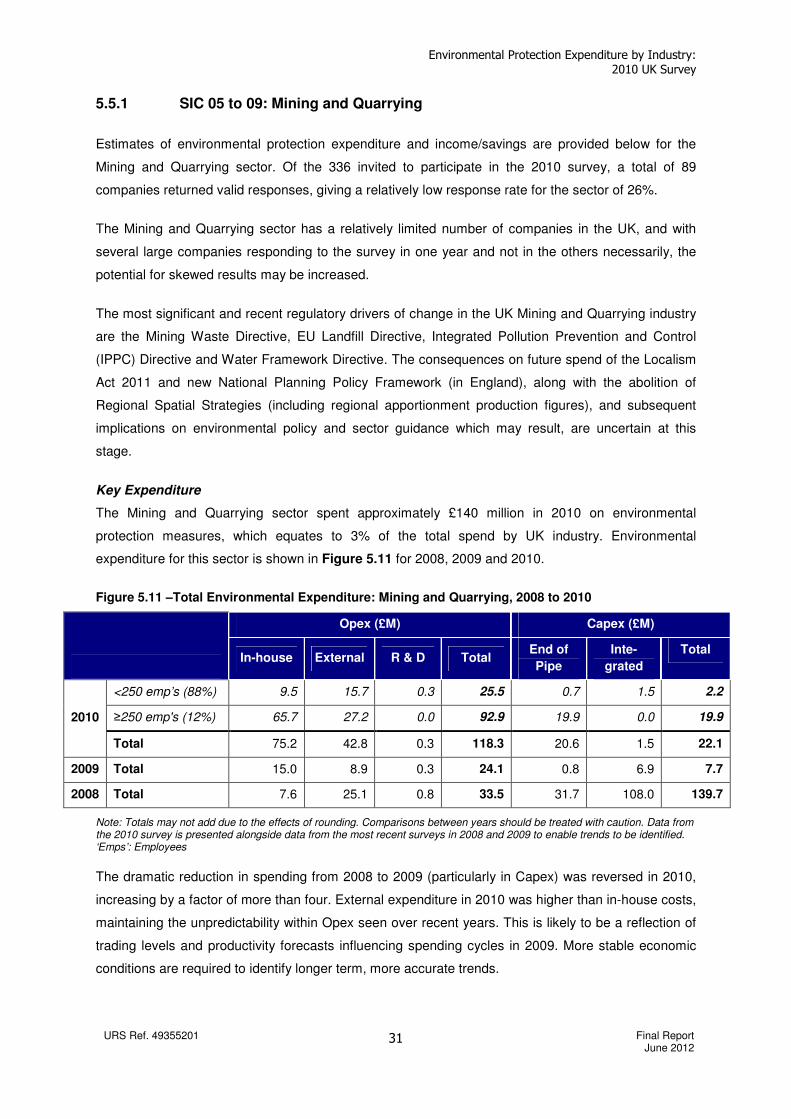
Environmental Protection Expenditure by Industry: 2010 UK Survey
URS Ref. 49355201 Final Report June 2012
31
5.5.1 SIC 05 to 09: Mining and Quarrying
Estimates of environmental protection expenditure and income/savings are provided below for the
Mining and Quarrying sector. Of the 336 invited to participate in the 2010 survey, a total of 89
companies returned valid responses, giving a relatively low response rate for the sector of 26%.
The Mining and Quarrying sector has a relatively limited number of companies in the UK, and with
several large companies responding to the survey in one year and not in the others necessarily, the
potential for skewed results may be increased.
The most significant and recent regulatory drivers of change in the UK Mining and Quarrying industry
are the Mining Waste Directive, EU Landfill Directive, Integrated Pollution Prevention and Control
(IPPC) Directive and Water Framework Directive. The consequences on future spend of the Localism
Act 2011 and new National Planning Policy Framework (in England), along with the abolition of
Regional Spatial Strategies (including regional apportionment production figures), and subsequent
implications on environmental policy and sector guidance which may result, are uncertain at this
stage.
Key Expenditure
The Mining and Quarrying sector spent approximately £140 million in 2010 on environmental
protection measures, which equates to 3% of the total spend by UK industry. Environmental
expenditure for this sector is shown in Figure 5.11 for 2008, 2009 and 2010.
Figure 5.11 –Total Environmental Expenditure: Mining and Quarrying, 2008 to 2010
Opex (£M) Capex (£M)
In-house External R & D Total
End of
Pipe
Inte-
grated
Total
<250 emp’s (88%) 9.5 15.7 0.3 25.5 0.7 1.5 2.2
≥250 emp's (12%) 65.7 27.2 0.0 92.9 19.9 0.0 19.9 2010
Total 75.2 42.8 0.3 118.3 20.6 1.5 22.1
2009 Total 15.0 8.9 0.3 24.1 0.8 6.9 7.7
2008 Total 7.6 25.1 0.8 33.5 31.7 108.0 139.7
Note: Totals may not add due to the effects of rounding. Comparisons between years should be treated with caution. Data from the 2010 survey is presented alongside data from the most recent surveys in 2008 and 2009 to enable trends to be identified. ‘Emps’: Employees
The dramatic reduction in spending from 2008 to 2009 (particularly in Capex) was reversed in 2010,
increasing by a factor of more than four. External expenditure in 2010 was higher than in-house costs,
maintaining the unpredictability within Opex seen over recent years. This is likely to be a reflection of
trading levels and productivity forecasts influencing spending cycles in 2009. More stable economic
conditions are required to identify longer term, more accurate trends.
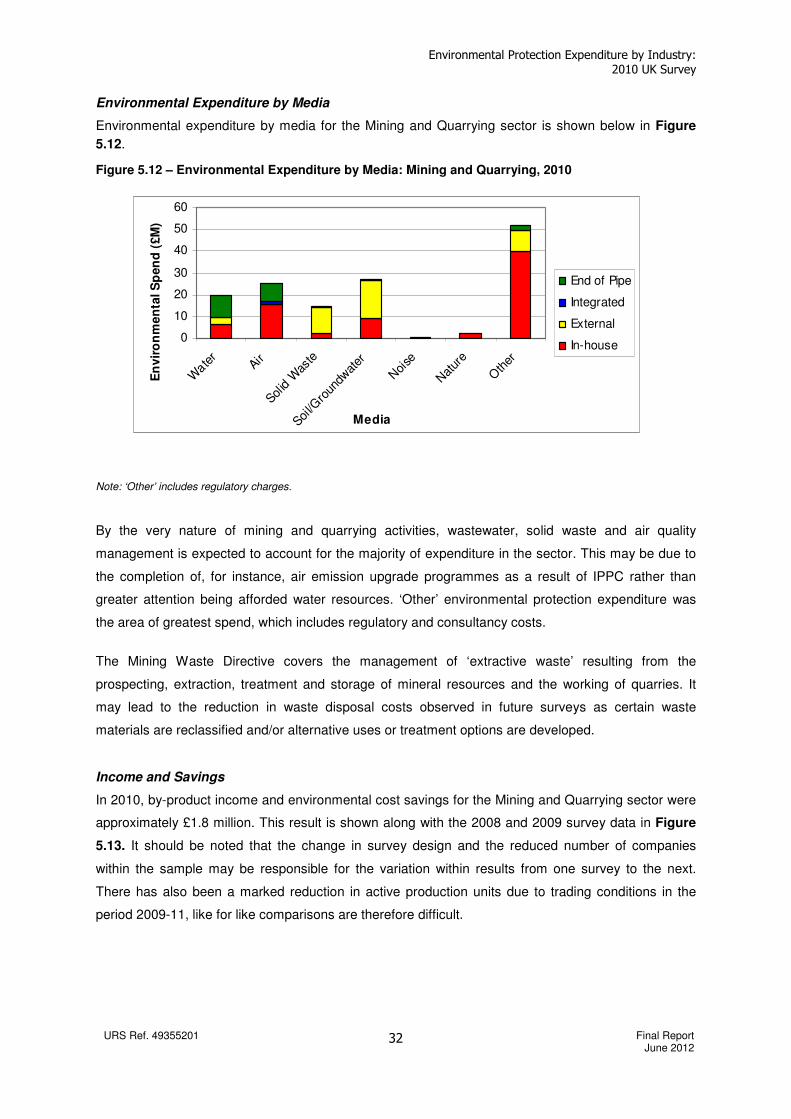
Environmental Protection Expenditure by Industry: 2010 UK Survey
URS Ref. 49355201 Final Report June 2012
32
Environmental Expenditure by Media
Environmental expenditure by media for the Mining and Quarrying sector is shown below in Figure
5.12.
Figure 5.12 – Environmental Expenditure by Media: Mining and Quarrying, 2010
Note: ‘Other’ includes regulatory charges.
By the very nature of mining and quarrying activities, wastewater, solid waste and air quality
management is expected to account for the majority of expenditure in the sector. This may be due to
the completion of, for instance, air emission upgrade programmes as a result of IPPC rather than
greater attention being afforded water resources. ‘Other’ environmental protection expenditure was
the area of greatest spend, which includes regulatory and consultancy costs.
The Mining Waste Directive covers the management of ‘extractive waste’ resulting from the
prospecting, extraction, treatment and storage of mineral resources and the working of quarries. It
may lead to the reduction in waste disposal costs observed in future surveys as certain waste
materials are reclassified and/or alternative uses or treatment options are developed.
Income and Savings
In 2010, by-product income and environmental cost savings for the Mining and Quarrying sector were
approximately £1.8 million. This result is shown along with the 2008 and 2009 survey data in Figure
5.13. It should be noted that the change in survey design and the reduced number of companies
within the sample may be responsible for the variation within results from one survey to the next.
There has also been a marked reduction in active production units due to trading conditions in the
period 2009-11, like for like comparisons are therefore difficult.
0
10
20
30
40
50
60
Wate
rAir
Solid W
aste
Soil/G
roun
dwat
er
Noi
se
Nat
ure
Oth
er
Media
En
vir
on
men
tal S
pen
d (
£M
)
End of Pipe
Integrated
External
In-house
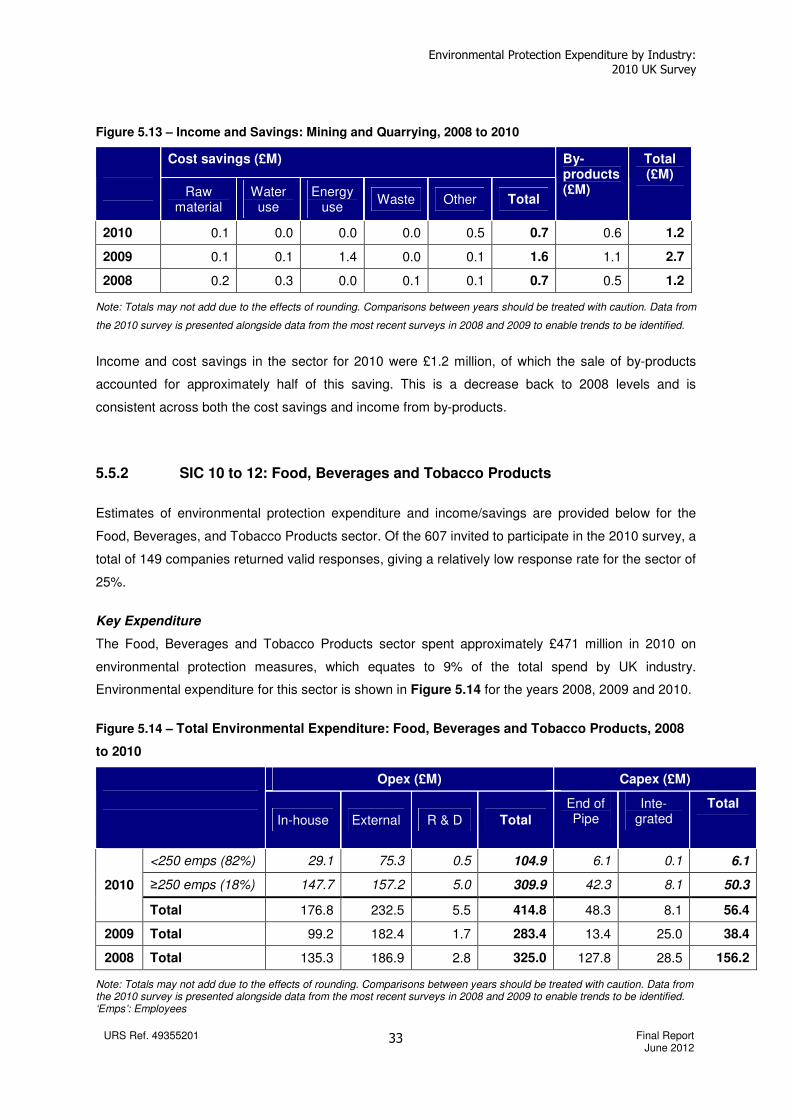
Environmental Protection Expenditure by Industry: 2010 UK Survey
URS Ref. 49355201 Final Report June 2012
33
Figure 5.13 – Income and Savings: Mining and Quarrying, 2008 to 2010
Cost savings (£M)
Raw material
Water use
Energy use
Waste Other Total
By-products (£M)
Total (£M)
2010 0.1 0.0 0.0 0.0 0.5 0.7 0.6 1.2
2009 0.1 0.1 1.4 0.0 0.1 1.6 1.1 2.7
2008 0.2 0.3 0.0 0.1 0.1 0.7 0.5 1.2
Note: Totals may not add due to the effects of rounding. Comparisons between years should be treated with caution. Data from
the 2010 survey is presented alongside data from the most recent surveys in 2008 and 2009 to enable trends to be identified.
Income and cost savings in the sector for 2010 were £1.2 million, of which the sale of by-products
accounted for approximately half of this saving. This is a decrease back to 2008 levels and is
consistent across both the cost savings and income from by-products.
5.5.2 SIC 10 to 12: Food, Beverages and Tobacco Products
Estimates of environmental protection expenditure and income/savings are provided below for the
Food, Beverages, and Tobacco Products sector. Of the 607 invited to participate in the 2010 survey, a
total of 149 companies returned valid responses, giving a relatively low response rate for the sector of
25%.
Key Expenditure
The Food, Beverages and Tobacco Products sector spent approximately £471 million in 2010 on
environmental protection measures, which equates to 9% of the total spend by UK industry.
Environmental expenditure for this sector is shown in Figure 5.14 for the years 2008, 2009 and 2010.
Figure 5.14 – Total Environmental Expenditure: Food, Beverages and Tobacco Products, 2008
to 2010
Opex (£M) Capex (£M)
In-house External R & D Total
End of Pipe
Inte-grated
Total
<250 emps (82%) 29.1 75.3 0.5 104.9 6.1 0.1 6.1
≥250 emps (18%) 147.7 157.2 5.0 309.9 42.3 8.1 50.3 2010
Total 176.8 232.5 5.5 414.8 48.3 8.1 56.4
2009 Total 99.2 182.4 1.7 283.4 13.4 25.0 38.4
2008 Total 135.3 186.9 2.8 325.0 127.8 28.5 156.2
Note: Totals may not add due to the effects of rounding. Comparisons between years should be treated with caution. Data from the 2010 survey is presented alongside data from the most recent surveys in 2008 and 2009 to enable trends to be identified. ‘Emps’: Employees
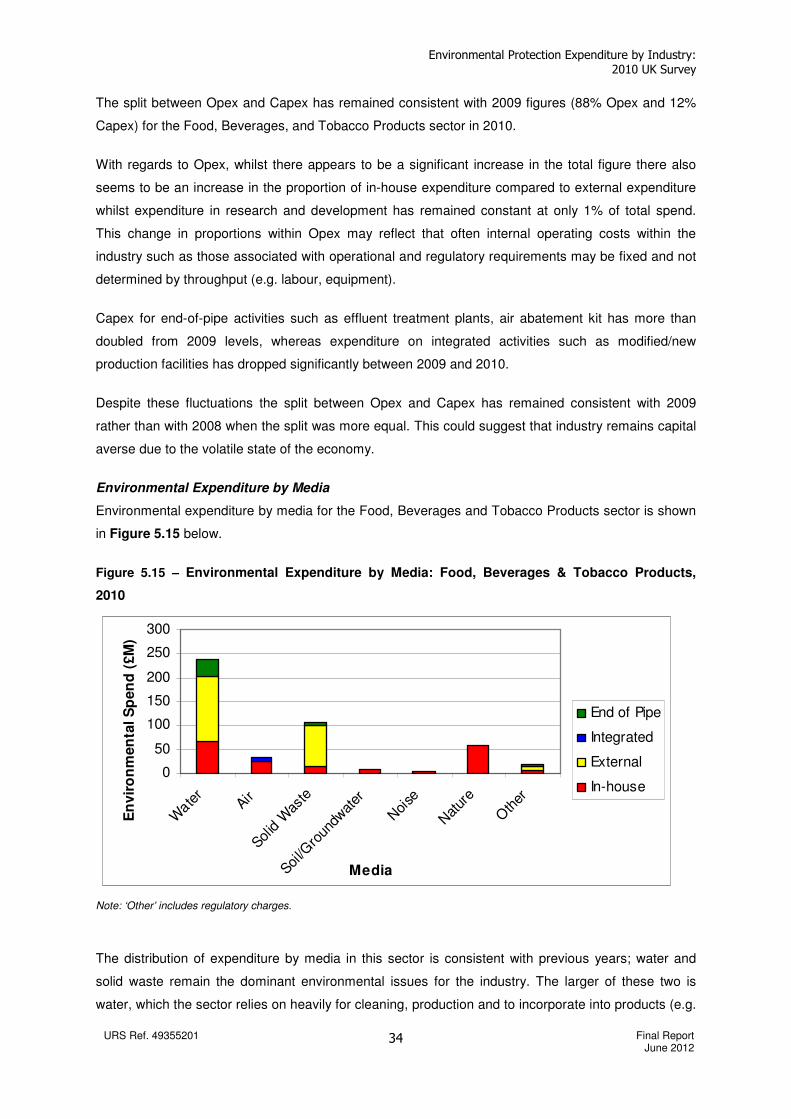
Environmental Protection Expenditure by Industry: 2010 UK Survey
URS Ref. 49355201 Final Report June 2012
34
The split between Opex and Capex has remained consistent with 2009 figures (88% Opex and 12%
Capex) for the Food, Beverages, and Tobacco Products sector in 2010.
With regards to Opex, whilst there appears to be a significant increase in the total figure there also
seems to be an increase in the proportion of in-house expenditure compared to external expenditure
whilst expenditure in research and development has remained constant at only 1% of total spend.
This change in proportions within Opex may reflect that often internal operating costs within the
industry such as those associated with operational and regulatory requirements may be fixed and not
determined by throughput (e.g. labour, equipment).
Capex for end-of-pipe activities such as effluent treatment plants, air abatement kit has more than
doubled from 2009 levels, whereas expenditure on integrated activities such as modified/new
production facilities has dropped significantly between 2009 and 2010.
Despite these fluctuations the split between Opex and Capex has remained consistent with 2009
rather than with 2008 when the split was more equal. This could suggest that industry remains capital
averse due to the volatile state of the economy.
Environmental Expenditure by Media
Environmental expenditure by media for the Food, Beverages and Tobacco Products sector is shown
in Figure 5.15 below.
Figure 5.15 – Environmental Expenditure by Media: Food, Beverages & Tobacco Products,
2010
0
50
100
150
200
250
300
Wate
rAir
Solid W
aste
Soil/G
roun
dwat
er
Noi
se
Nat
ure
Oth
er
Media
En
vir
on
men
tal S
pen
d (
£M
)
End of Pipe
Integrated
External
In-house
Note: ‘Other’ includes regulatory charges.
The distribution of expenditure by media in this sector is consistent with previous years; water and
solid waste remain the dominant environmental issues for the industry. The larger of these two is
water, which the sector relies on heavily for cleaning, production and to incorporate into products (e.g.
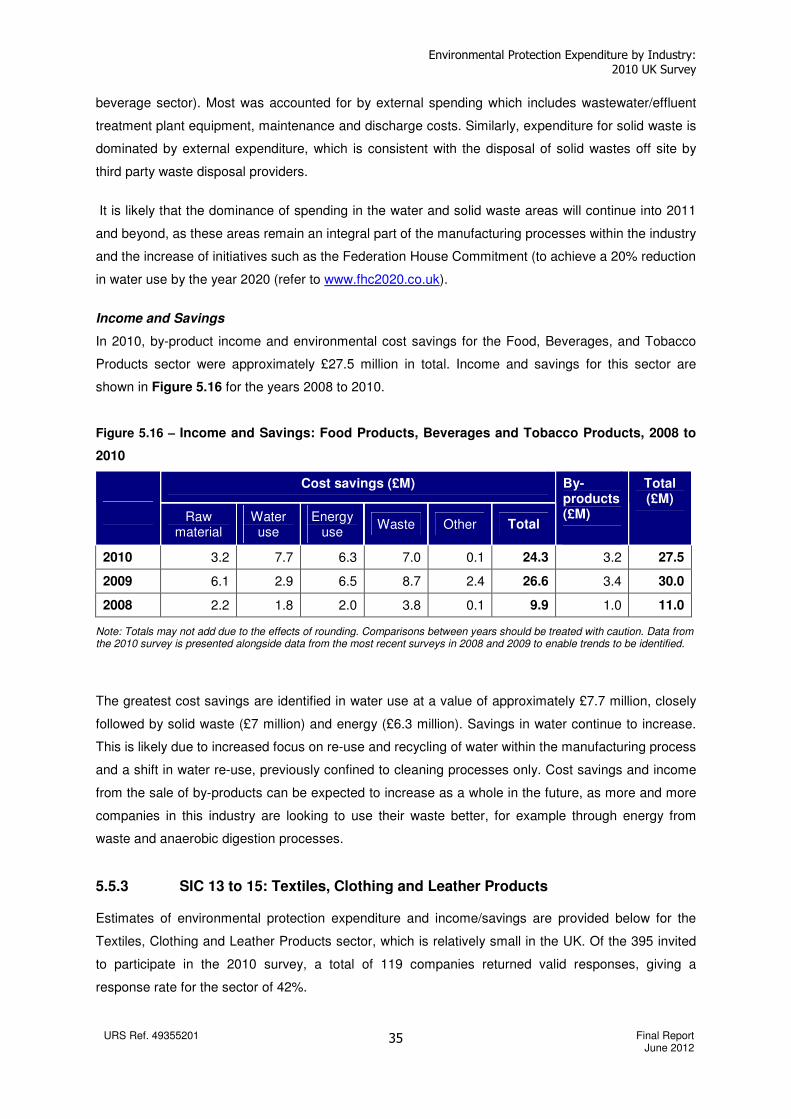
Environmental Protection Expenditure by Industry: 2010 UK Survey
URS Ref. 49355201 Final Report June 2012
35
beverage sector). Most was accounted for by external spending which includes wastewater/effluent
treatment plant equipment, maintenance and discharge costs. Similarly, expenditure for solid waste is
dominated by external expenditure, which is consistent with the disposal of solid wastes off site by
third party waste disposal providers.
It is likely that the dominance of spending in the water and solid waste areas will continue into 2011
and beyond, as these areas remain an integral part of the manufacturing processes within the industry
and the increase of initiatives such as the Federation House Commitment (to achieve a 20% reduction
in water use by the year 2020 (refer to www.fhc2020.co.uk).
Income and Savings
In 2010, by-product income and environmental cost savings for the Food, Beverages, and Tobacco
Products sector were approximately £27.5 million in total. Income and savings for this sector are
shown in Figure 5.16 for the years 2008 to 2010.
Figure 5.16 – Income and Savings: Food Products, Beverages and Tobacco Products, 2008 to
2010
Cost savings (£M)
Raw material
Water use
Energy use
Waste Other Total
By-products (£M)
Total (£M)
2010 3.2 7.7 6.3 7.0 0.1 24.3 3.2 27.5
2009 6.1 2.9 6.5 8.7 2.4 26.6 3.4 30.0
2008 2.2 1.8 2.0 3.8 0.1 9.9 1.0 11.0
Note: Totals may not add due to the effects of rounding. Comparisons between years should be treated with caution. Data from the 2010 survey is presented alongside data from the most recent surveys in 2008 and 2009 to enable trends to be identified.
The greatest cost savings are identified in water use at a value of approximately £7.7 million, closely
followed by solid waste (£7 million) and energy (£6.3 million). Savings in water continue to increase.
This is likely due to increased focus on re-use and recycling of water within the manufacturing process
and a shift in water re-use, previously confined to cleaning processes only. Cost savings and income
from the sale of by-products can be expected to increase as a whole in the future, as more and more
companies in this industry are looking to use their waste better, for example through energy from
waste and anaerobic digestion processes.
5.5.3 SIC 13 to 15: Textiles, Clothing and Leather Products
Estimates of environmental protection expenditure and income/savings are provided below for the
Textiles, Clothing and Leather Products sector, which is relatively small in the UK. Of the 395 invited
to participate in the 2010 survey, a total of 119 companies returned valid responses, giving a
response rate for the sector of 42%.
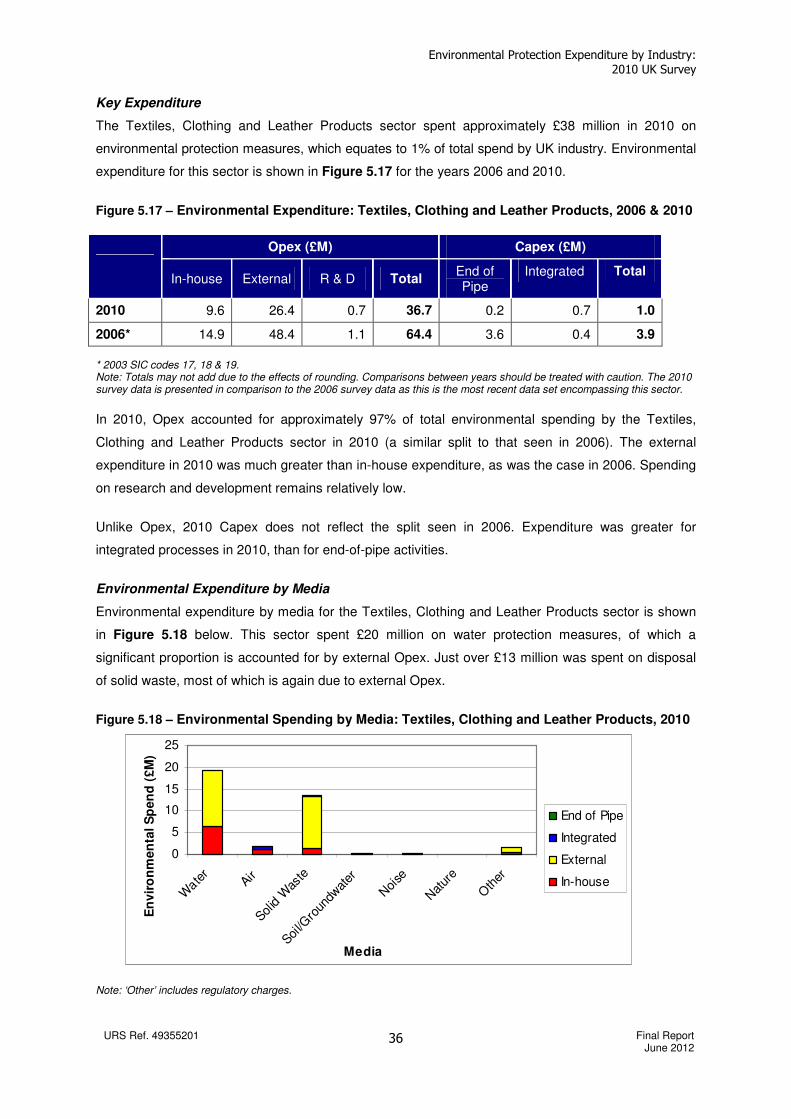
Environmental Protection Expenditure by Industry: 2010 UK Survey
URS Ref. 49355201 Final Report June 2012
36
Key Expenditure
The Textiles, Clothing and Leather Products sector spent approximately £38 million in 2010 on
environmental protection measures, which equates to 1% of total spend by UK industry. Environmental
expenditure for this sector is shown in Figure 5.17 for the years 2006 and 2010.
Figure 5.17 – Environmental Expenditure: Textiles, Clothing and Leather Products, 2006 & 2010
* 2003 SIC codes 17, 18 & 19. Note: Totals may not add due to the effects of rounding. Comparisons between years should be treated with caution. The 2010 survey data is presented in comparison to the 2006 survey data as this is the most recent data set encompassing this sector.
In 2010, Opex accounted for approximately 97% of total environmental spending by the Textiles,
Clothing and Leather Products sector in 2010 (a similar split to that seen in 2006). The external
expenditure in 2010 was much greater than in-house expenditure, as was the case in 2006. Spending
on research and development remains relatively low.
Unlike Opex, 2010 Capex does not reflect the split seen in 2006. Expenditure was greater for
integrated processes in 2010, than for end-of-pipe activities.
Environmental Expenditure by Media
Environmental expenditure by media for the Textiles, Clothing and Leather Products sector is shown
in Figure 5.18 below. This sector spent £20 million on water protection measures, of which a
significant proportion is accounted for by external Opex. Just over £13 million was spent on disposal
of solid waste, most of which is again due to external Opex.
Figure 5.18 – Environmental Spending by Media: Textiles, Clothing and Leather Products, 2010
Note: ‘Other’ includes regulatory charges.
Opex (£M) Capex (£M)
In-house External R & D Total
End of Pipe
Integrated Total
2010 9.6 26.4 0.7 36.7 0.2 0.7 1.0
2006* 14.9 48.4 1.1 64.4 3.6 0.4 3.9
0
5
10
15
20
25
Wate
rAir
Solid W
aste
Soil/G
roun
dwat
er
Noi
se
Nat
ure
Oth
er
Media
En
vir
on
men
tal S
pen
d (
£M
)
End of Pipe
Integrated
External
In-house
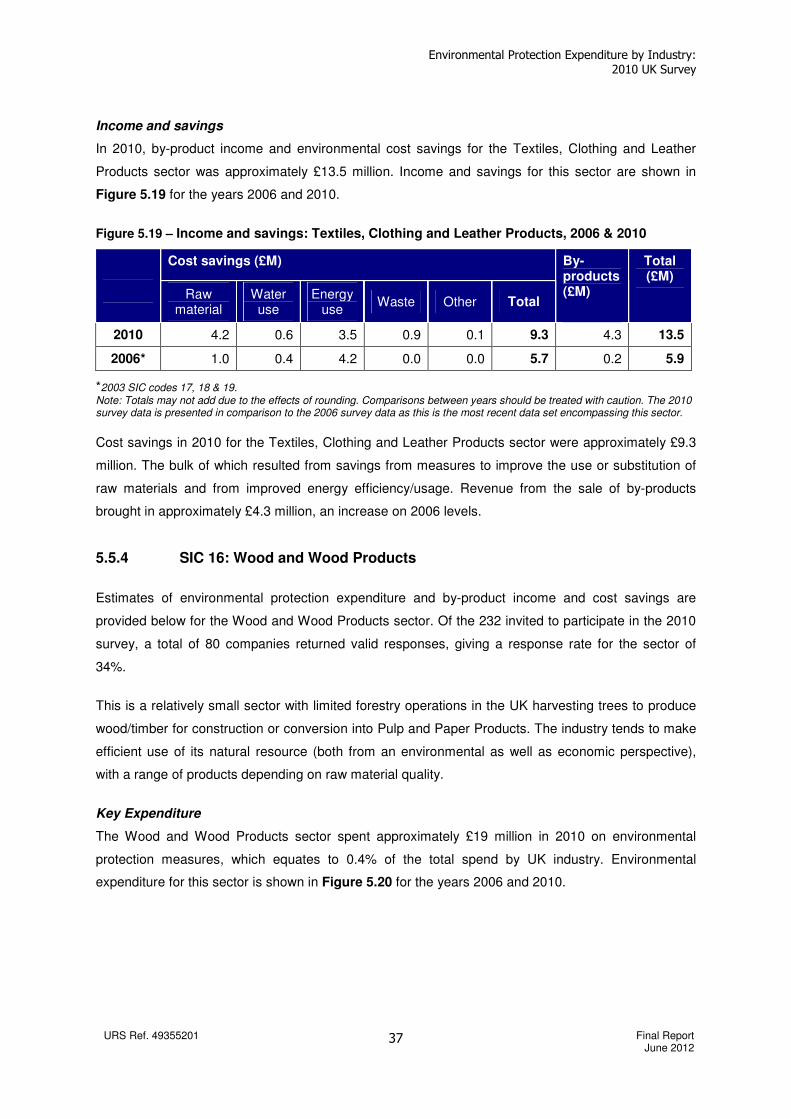
Environmental Protection Expenditure by Industry: 2010 UK Survey
URS Ref. 49355201 Final Report June 2012
37
Income and savings
In 2010, by-product income and environmental cost savings for the Textiles, Clothing and Leather
Products sector was approximately £13.5 million. Income and savings for this sector are shown in
Figure 5.19 for the years 2006 and 2010.
Figure 5.19 – Income and savings: Textiles, Clothing and Leather Products, 2006 & 2010
Cost savings (£M)
Raw material
Water use
Energy use
Waste Other Total
By-products (£M)
Total (£M)
2010 4.2 0.6 3.5 0.9 0.1 9.3 4.3 13.5
2006* 1.0 0.4 4.2 0.0 0.0 5.7 0.2 5.9
*2003 SIC codes 17, 18 & 19. Note: Totals may not add due to the effects of rounding. Comparisons between years should be treated with caution. The 2010 survey data is presented in comparison to the 2006 survey data as this is the most recent data set encompassing this sector.
Cost savings in 2010 for the Textiles, Clothing and Leather Products sector were approximately £9.3
million. The bulk of which resulted from savings from measures to improve the use or substitution of
raw materials and from improved energy efficiency/usage. Revenue from the sale of by-products
brought in approximately £4.3 million, an increase on 2006 levels.
5.5.4 SIC 16: Wood and Wood Products
Estimates of environmental protection expenditure and by-product income and cost savings are
provided below for the Wood and Wood Products sector. Of the 232 invited to participate in the 2010
survey, a total of 80 companies returned valid responses, giving a response rate for the sector of
34%.
This is a relatively small sector with limited forestry operations in the UK harvesting trees to produce
wood/timber for construction or conversion into Pulp and Paper Products. The industry tends to make
efficient use of its natural resource (both from an environmental as well as economic perspective),
with a range of products depending on raw material quality.
Key Expenditure
The Wood and Wood Products sector spent approximately £19 million in 2010 on environmental
protection measures, which equates to 0.4% of the total spend by UK industry. Environmental
expenditure for this sector is shown in Figure 5.20 for the years 2006 and 2010.
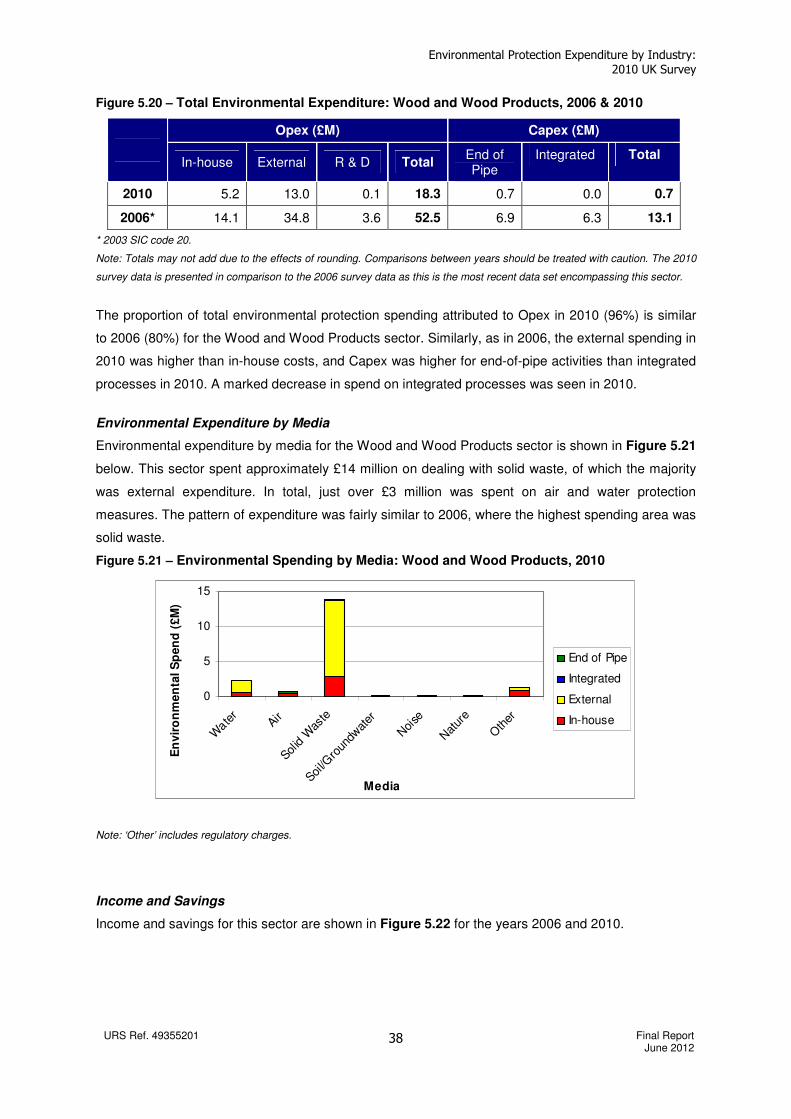
Environmental Protection Expenditure by Industry: 2010 UK Survey
URS Ref. 49355201 Final Report June 2012
38
Figure 5.20 – Total Environmental Expenditure: Wood and Wood Products, 2006 & 2010
Opex (£M) Capex (£M)
In-house External R & D Total
End of Pipe
Integrated Total
2010 5.2 13.0 0.1 18.3 0.7 0.0 0.7
2006* 14.1 34.8 3.6 52.5 6.9 6.3 13.1
* 2003 SIC code 20.
Note: Totals may not add due to the effects of rounding. Comparisons between years should be treated with caution. The 2010
survey data is presented in comparison to the 2006 survey data as this is the most recent data set encompassing this sector.
The proportion of total environmental protection spending attributed to Opex in 2010 (96%) is similar
to 2006 (80%) for the Wood and Wood Products sector. Similarly, as in 2006, the external spending in
2010 was higher than in-house costs, and Capex was higher for end-of-pipe activities than integrated
processes in 2010. A marked decrease in spend on integrated processes was seen in 2010.
Environmental Expenditure by Media
Environmental expenditure by media for the Wood and Wood Products sector is shown in Figure 5.21
below. This sector spent approximately £14 million on dealing with solid waste, of which the majority
was external expenditure. In total, just over £3 million was spent on air and water protection
measures. The pattern of expenditure was fairly similar to 2006, where the highest spending area was
solid waste.
Figure 5.21 – Environmental Spending by Media: Wood and Wood Products, 2010
0
5
10
15
Wate
rAir
Solid W
aste
Soil/G
roun
dwat
er
Noi
se
Nat
ure
Oth
er
Media
En
vir
on
me
nta
l S
pen
d (
£M
)
End of Pipe
Integrated
External
In-house
Note: ‘Other’ includes regulatory charges.
Income and Savings
Income and savings for this sector are shown in Figure 5.22 for the years 2006 and 2010.
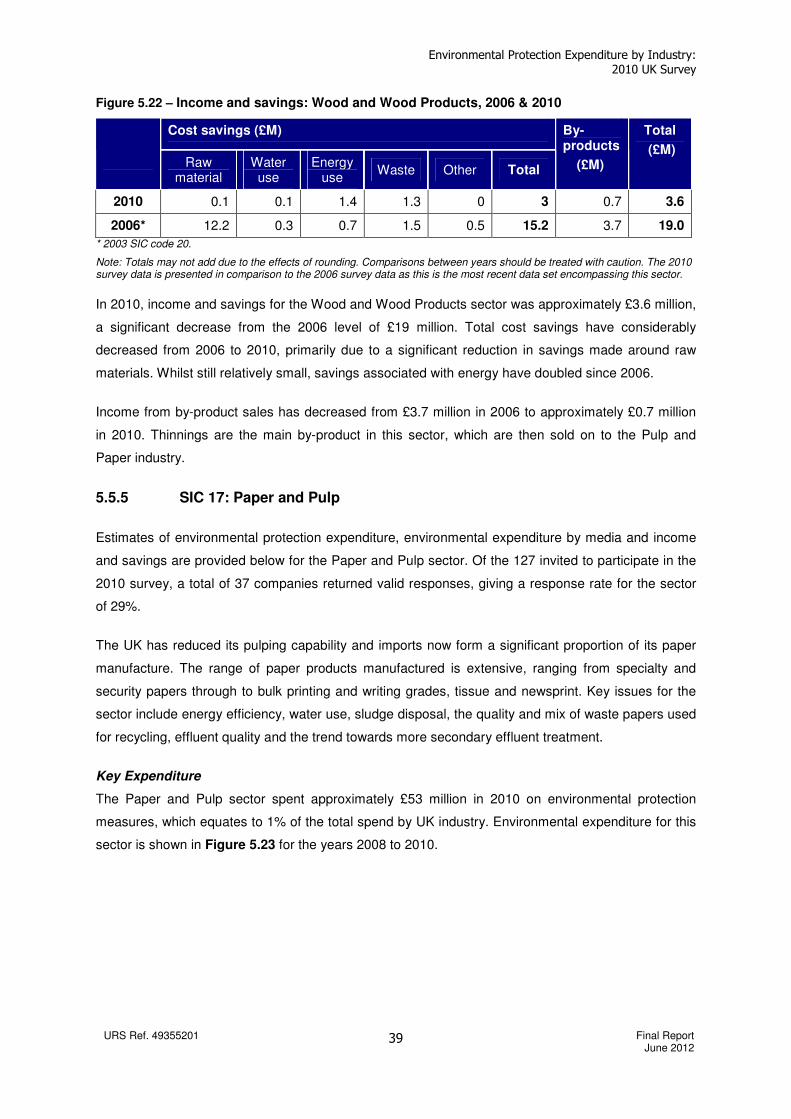
Environmental Protection Expenditure by Industry: 2010 UK Survey
URS Ref. 49355201 Final Report June 2012
39
Figure 5.22 – Income and savings: Wood and Wood Products, 2006 & 2010
Cost savings (£M)
Raw
material Water use
Energy use
Waste Other Total
By-products
(£M)
Total
(£M)
2010 0.1 0.1 1.4 1.3 0 3 0.7 3.6
2006* 12.2 0.3 0.7 1.5 0.5 15.2 3.7 19.0
* 2003 SIC code 20.
Note: Totals may not add due to the effects of rounding. Comparisons between years should be treated with caution. The 2010 survey data is presented in comparison to the 2006 survey data as this is the most recent data set encompassing this sector.
In 2010, income and savings for the Wood and Wood Products sector was approximately £3.6 million,
a significant decrease from the 2006 level of £19 million. Total cost savings have considerably
decreased from 2006 to 2010, primarily due to a significant reduction in savings made around raw
materials. Whilst still relatively small, savings associated with energy have doubled since 2006.
Income from by-product sales has decreased from £3.7 million in 2006 to approximately £0.7 million
in 2010. Thinnings are the main by-product in this sector, which are then sold on to the Pulp and
Paper industry.
5.5.5 SIC 17: Paper and Pulp
Estimates of environmental protection expenditure, environmental expenditure by media and income
and savings are provided below for the Paper and Pulp sector. Of the 127 invited to participate in the
2010 survey, a total of 37 companies returned valid responses, giving a response rate for the sector
of 29%.
The UK has reduced its pulping capability and imports now form a significant proportion of its paper
manufacture. The range of paper products manufactured is extensive, ranging from specialty and
security papers through to bulk printing and writing grades, tissue and newsprint. Key issues for the
sector include energy efficiency, water use, sludge disposal, the quality and mix of waste papers used
for recycling, effluent quality and the trend towards more secondary effluent treatment.
Key Expenditure
The Paper and Pulp sector spent approximately £53 million in 2010 on environmental protection
measures, which equates to 1% of the total spend by UK industry. Environmental expenditure for this
sector is shown in Figure 5.23 for the years 2008 to 2010.
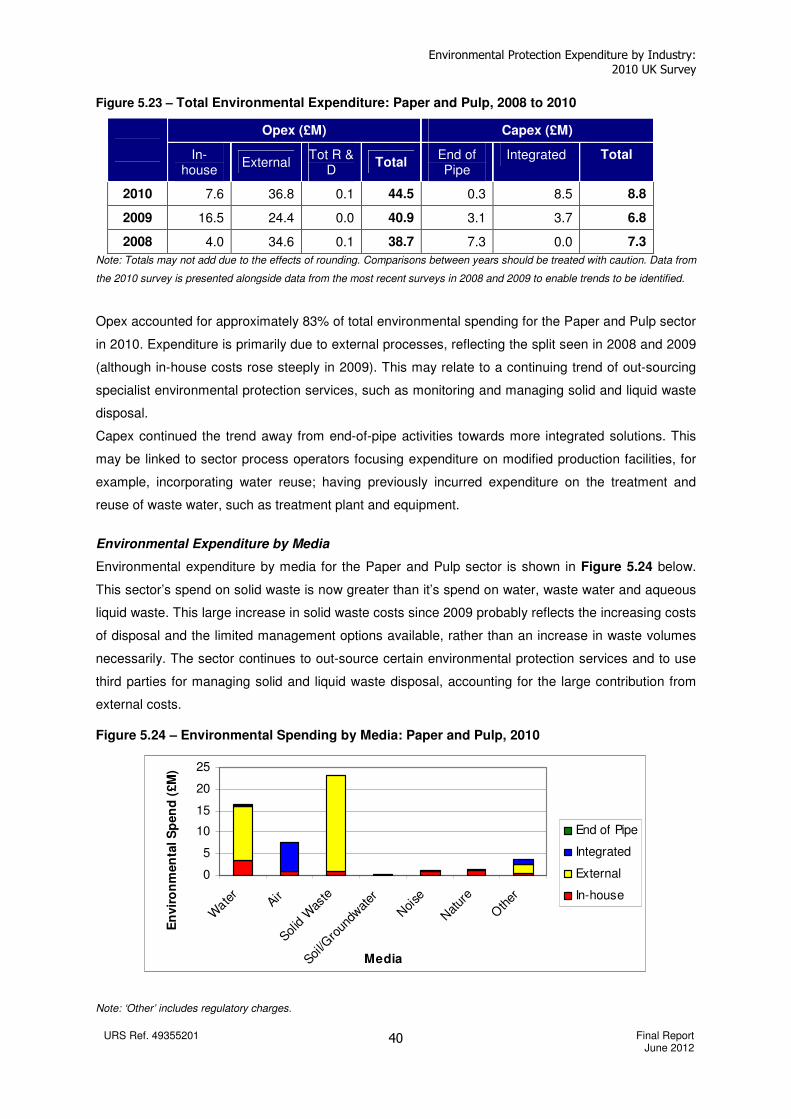
Environmental Protection Expenditure by Industry: 2010 UK Survey
URS Ref. 49355201 Final Report June 2012
40
Figure 5.23 – Total Environmental Expenditure: Paper and Pulp, 2008 to 2010
Opex (£M) Capex (£M)
In-
house External
Tot R & D
Total End of Pipe
Integrated Total
2010 7.6 36.8 0.1 44.5 0.3 8.5 8.8
2009 16.5 24.4 0.0 40.9 3.1 3.7 6.8
2008 4.0 34.6 0.1 38.7 7.3 0.0 7.3
Note: Totals may not add due to the effects of rounding. Comparisons between years should be treated with caution. Data from
the 2010 survey is presented alongside data from the most recent surveys in 2008 and 2009 to enable trends to be identified.
Opex accounted for approximately 83% of total environmental spending for the Paper and Pulp sector
in 2010. Expenditure is primarily due to external processes, reflecting the split seen in 2008 and 2009
(although in-house costs rose steeply in 2009). This may relate to a continuing trend of out-sourcing
specialist environmental protection services, such as monitoring and managing solid and liquid waste
disposal.
Capex continued the trend away from end-of-pipe activities towards more integrated solutions. This
may be linked to sector process operators focusing expenditure on modified production facilities, for
example, incorporating water reuse; having previously incurred expenditure on the treatment and
reuse of waste water, such as treatment plant and equipment.
Environmental Expenditure by Media
Environmental expenditure by media for the Paper and Pulp sector is shown in Figure 5.24 below.
This sector’s spend on solid waste is now greater than it’s spend on water, waste water and aqueous
liquid waste. This large increase in solid waste costs since 2009 probably reflects the increasing costs
of disposal and the limited management options available, rather than an increase in waste volumes
necessarily. The sector continues to out-source certain environmental protection services and to use
third parties for managing solid and liquid waste disposal, accounting for the large contribution from
external costs.
Figure 5.24 – Environmental Spending by Media: Paper and Pulp, 2010
0
5
10
15
20
25
Wate
rAir
Solid W
aste
Soil/G
roun
dwat
er
Noi
se
Nat
ure
Oth
er
Media
En
vir
on
men
tal
Sp
en
d (
£M
)
End of Pipe
Integrated
External
In-house
Note: ‘Other’ includes regulatory charges.

Environmental Protection Expenditure by Industry: 2010 UK Survey
URS Ref. 49355201 Final Report June 2012
41
Income and Savings
In 2010, by-product income and environmental cost savings for the Paper and Pulp sector were
approximately £6.5 million. Income and savings for this sector are shown in Figures 5.25 for the 2008
to 2010 period.
Figure 5.25 – Income and Savings: Paper and Pulp, 2008 to 2010
Cost savings (£M)
Raw
material Water use
Energy use
Waste Other Total
By-products
(£M)
Total (£M)
2010 0.6 0.0 2.3 0.6 0.0 3.5 0.1 3.6
2009 3.2 7.2 13.8 0.1 0.0 24.2 0.5 24.7
2008 6.6 0.0 0.0 0.2 0.0 6.8 0.8 7.6
Note: Totals may not add due to the effects of rounding. Comparisons between years should be treated with caution. Data from
the 2010 survey is presented alongside data from the most recent surveys in 2008 and 2009 to enable trends to be identified.
Income and cost savings for the Paper and Pulp sector decreased to £6.5 million in 2010, from £24.7
million in 2009. This may reflect the completion of major projects to reduce overheads and a shift
away from cost savings towards production, in line with an anticipated upturn in the sector.
Sales of by-products continue to decrease. As predicted in the 2009 report, this is likely to continue
until the quality protocol for end-of-waste criteria for Paper Sludge Ash (PSA) is agreed (currently
under review by the Environment Agency). Waste cost savings should also increase as a result of
diversion of PSA from landfills.
5.5.6 SIC 18: Printing and Publishing
Estimates of environmental protection expenditure and income/savings are provided below for the
Printing and Publishing. Of the 416 invited to participate in the 2010 survey, a total of 127 companies
returned valid responses, giving a response rate for the sector of 31%.
The Printing and Publishing sector remains under pressure from digital and electronic media. This is
likely to increase in the coming years with a move away from paper-based printing and publishing,
which will impact on the nature and level of investment in environmental protection measures.
Key Expenditure
The Printing and Publishing sector spent almost £49 million in 2010 on environmental
protection measures, which equates to 1% of the total spend by UK industry. Environmental
expenditure for this sector is shown in Figure 5.26 for 2006 and 2010.
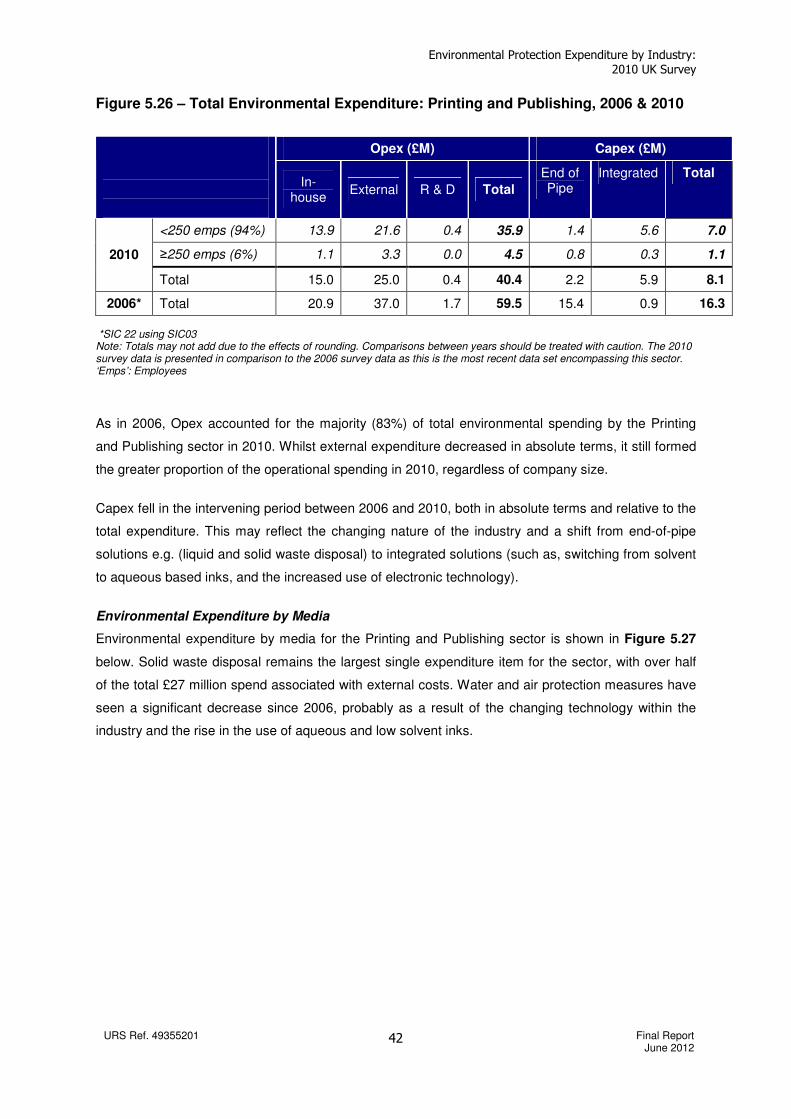
Environmental Protection Expenditure by Industry: 2010 UK Survey
URS Ref. 49355201 Final Report June 2012
42
Figure 5.26 – Total Environmental Expenditure: Printing and Publishing, 2006 & 2010
Opex (£M) Capex (£M)
In-house
External R & D Total
End of Pipe
Integrated Total
<250 emps (94%) 13.9 21.6 0.4 35.9 1.4 5.6 7.0
≥250 emps (6%) 1.1 3.3 0.0 4.5 0.8 0.3 1.1 2010
Total 15.0 25.0 0.4 40.4 2.2 5.9 8.1
2006* Total 20.9 37.0 1.7 59.5 15.4 0.9 16.3
*SIC 22 using SIC03 Note: Totals may not add due to the effects of rounding. Comparisons between years should be treated with caution. The 2010 survey data is presented in comparison to the 2006 survey data as this is the most recent data set encompassing this sector. ‘Emps’: Employees
As in 2006, Opex accounted for the majority (83%) of total environmental spending by the Printing
and Publishing sector in 2010. Whilst external expenditure decreased in absolute terms, it still formed
the greater proportion of the operational spending in 2010, regardless of company size.
Capex fell in the intervening period between 2006 and 2010, both in absolute terms and relative to the
total expenditure. This may reflect the changing nature of the industry and a shift from end-of-pipe
solutions e.g. (liquid and solid waste disposal) to integrated solutions (such as, switching from solvent
to aqueous based inks, and the increased use of electronic technology).
Environmental Expenditure by Media
Environmental expenditure by media for the Printing and Publishing sector is shown in Figure 5.27
below. Solid waste disposal remains the largest single expenditure item for the sector, with over half
of the total £27 million spend associated with external costs. Water and air protection measures have
seen a significant decrease since 2006, probably as a result of the changing technology within the
industry and the rise in the use of aqueous and low solvent inks.
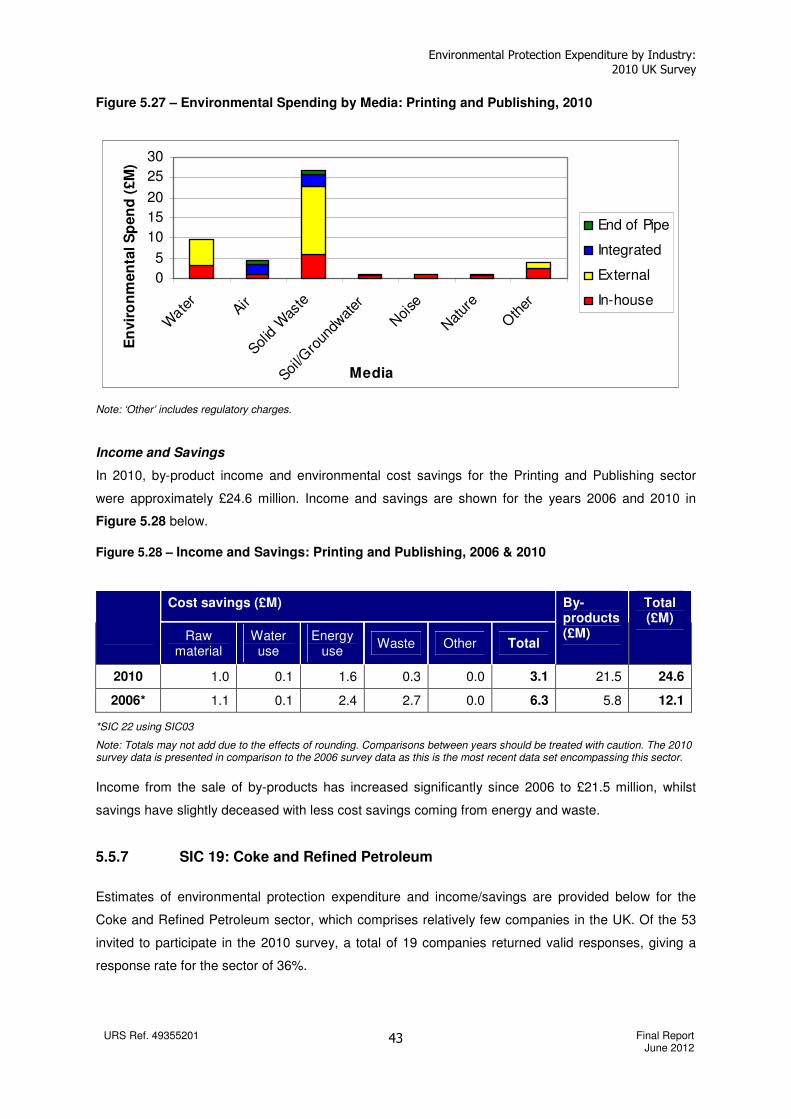
Environmental Protection Expenditure by Industry: 2010 UK Survey
URS Ref. 49355201 Final Report June 2012
43
Figure 5.27 – Environmental Spending by Media: Printing and Publishing, 2010
0
5
10
15
20
25
30
Wate
rAir
Solid W
aste
Soil/G
roun
dwat
er
Noi
se
Nat
ure
Oth
er
Media
En
vir
on
men
tal S
pen
d (
£M
)
End of Pipe
Integrated
External
In-house
Note: ‘Other’ includes regulatory charges.
Income and Savings
In 2010, by-product income and environmental cost savings for the Printing and Publishing sector
were approximately £24.6 million. Income and savings are shown for the years 2006 and 2010 in
Figure 5.28 below.
Figure 5.28 – Income and Savings: Printing and Publishing, 2006 & 2010
Cost savings (£M)
Raw material
Water use
Energy use
Waste Other Total
By-products (£M)
Total (£M)
2010 1.0 0.1 1.6 0.3 0.0 3.1 21.5 24.6
2006* 1.1 0.1 2.4 2.7 0.0 6.3 5.8 12.1
*SIC 22 using SIC03
Note: Totals may not add due to the effects of rounding. Comparisons between years should be treated with caution. The 2010 survey data is presented in comparison to the 2006 survey data as this is the most recent data set encompassing this sector.
Income from the sale of by-products has increased significantly since 2006 to £21.5 million, whilst
savings have slightly deceased with less cost savings coming from energy and waste.
5.5.7 SIC 19: Coke and Refined Petroleum
Estimates of environmental protection expenditure and income/savings are provided below for the
Coke and Refined Petroleum sector, which comprises relatively few companies in the UK. Of the 53
invited to participate in the 2010 survey, a total of 19 companies returned valid responses, giving a
response rate for the sector of 36%.
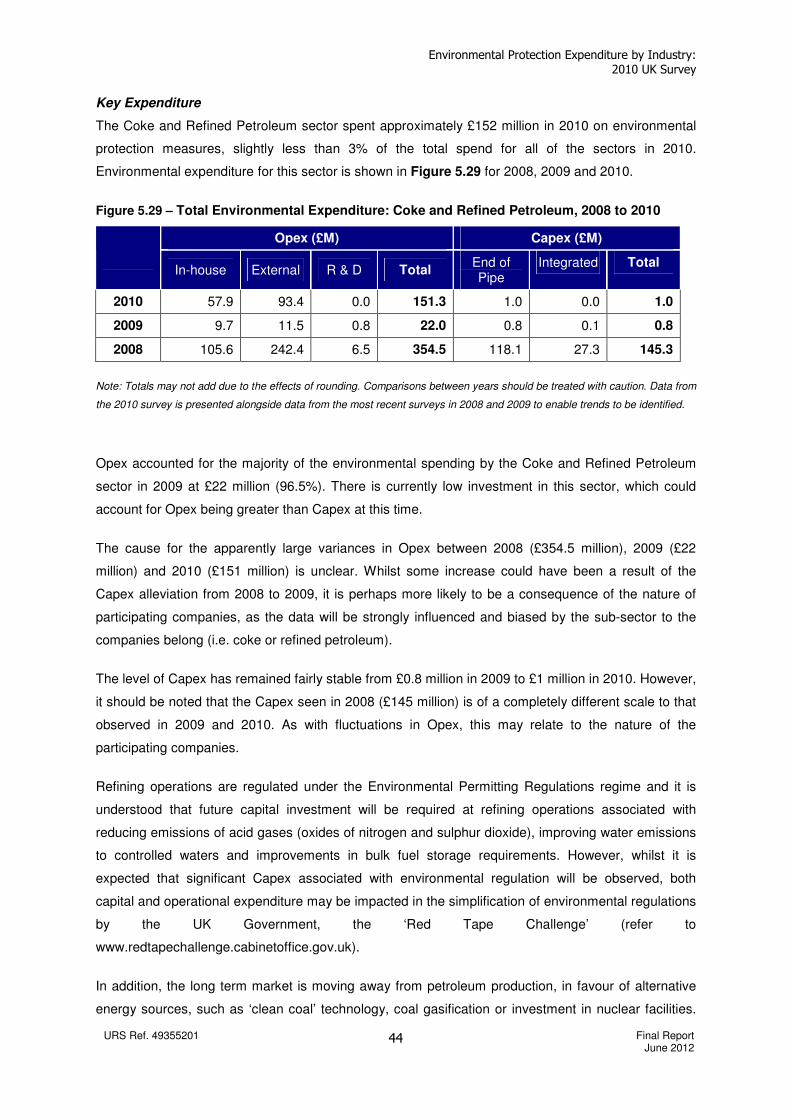
Environmental Protection Expenditure by Industry: 2010 UK Survey
URS Ref. 49355201 Final Report June 2012
44
Key Expenditure
The Coke and Refined Petroleum sector spent approximately £152 million in 2010 on environmental
protection measures, slightly less than 3% of the total spend for all of the sectors in 2010.
Environmental expenditure for this sector is shown in Figure 5.29 for 2008, 2009 and 2010.
Figure 5.29 – Total Environmental Expenditure: Coke and Refined Petroleum, 2008 to 2010
Opex (£M) Capex (£M)
In-house External R & D Total
End of Pipe
Integrated Total
2010 57.9 93.4 0.0 151.3 1.0 0.0 1.0
2009 9.7 11.5 0.8 22.0 0.8 0.1 0.8
2008 105.6 242.4 6.5 354.5 118.1 27.3 145.3
Note: Totals may not add due to the effects of rounding. Comparisons between years should be treated with caution. Data from
the 2010 survey is presented alongside data from the most recent surveys in 2008 and 2009 to enable trends to be identified.
Opex accounted for the majority of the environmental spending by the Coke and Refined Petroleum
sector in 2009 at £22 million (96.5%). There is currently low investment in this sector, which could
account for Opex being greater than Capex at this time.
The cause for the apparently large variances in Opex between 2008 (£354.5 million), 2009 (£22
million) and 2010 (£151 million) is unclear. Whilst some increase could have been a result of the
Capex alleviation from 2008 to 2009, it is perhaps more likely to be a consequence of the nature of
participating companies, as the data will be strongly influenced and biased by the sub-sector to the
companies belong (i.e. coke or refined petroleum).
The level of Capex has remained fairly stable from £0.8 million in 2009 to £1 million in 2010. However,
it should be noted that the Capex seen in 2008 (£145 million) is of a completely different scale to that
observed in 2009 and 2010. As with fluctuations in Opex, this may relate to the nature of the
participating companies.
Refining operations are regulated under the Environmental Permitting Regulations regime and it is
understood that future capital investment will be required at refining operations associated with
reducing emissions of acid gases (oxides of nitrogen and sulphur dioxide), improving water emissions
to controlled waters and improvements in bulk fuel storage requirements. However, whilst it is
expected that significant Capex associated with environmental regulation will be observed, both
capital and operational expenditure may be impacted in the simplification of environmental regulations
by the UK Government, the ‘Red Tape Challenge’ (refer to
www.redtapechallenge.cabinetoffice.gov.uk).
In addition, the long term market is moving away from petroleum production, in favour of alternative
energy sources, such as ‘clean coal’ technology, coal gasification or investment in nuclear facilities.

Environmental Protection Expenditure by Industry: 2010 UK Survey
URS Ref. 49355201 Final Report June 2012
45
Investment in Carbon Capture and Storage (CCS) is also increasing with high Capex costs likely
going forward. It is anticipated that CSS will show in the ‘air protection’ measures section of future
surveys, even with the recent demonstration projects being abandoned.
Environmental Expenditure by Media
Environmental expenditure by media for the Coke and Refined Petroleum sector is shown in Figure
5.30 below.
Figure 5.30 – Spending by Media: Coke and Refined Petroleum, 2010
010
20304050
6070
Wate
rAir
Solid W
aste
Soil/G
roun
dwat
er
Noi
se
Nat
ure
Oth
er
Media
En
vir
on
men
tal S
pen
d (
£M
)
End of Pipe
Integrated
External
In-house
Note: ‘Other’ includes regulatory charges.
Over one third of spend during 2010 (£62 million) has occurred in ‘other’ areas of environmental
protection measures and provisions (e.g. regulator charges) not covered by the specified media
categories. Soil/groundwater has seen a spend of £38 million during the same period. Both these
spends have similar profiles in that the majority of the Opex was undertaken by external processes.
The capital spend (£1 million) related solely to air protection measures/provisions.
Income and Savings
In 2010, by-product income and environmental cost savings for the Coke and Refined Petroleum
sector was £1.2 million. Income and savings for this sector are shown in Figure 5.31 for the years
2008, 2009 and 2010.
Figure 5.31 – Income and Savings: Coke and Refined Petroleum, 2008 to 2010
Cost savings (£M)
Raw material
Water use
Energy use
Waste Other Total
By-products (£M)
Total (£M)
2010 0.0 0.0 0.0 1.2 0.0 1.2 0.0 1.2
2009 0.1 0.0 0.3 0.2 0.0 0.5 0.0 0.5
2008 6.2 5.3 10.7 32.8 0.9 55.9 5.3 61.3
Note: Totals may not add due to the effects of rounding. Comparisons between years should be treated with caution. Data from
the 2010 survey is presented alongside data from the most recent surveys in 2008 and 2009 to enable trends to be identified.
Environmental Protection Expenditure by Industry: 2010 UK Survey
URS Ref. 49355201 Final Report June 2012
46
The level of income and cost savings has increased from £0.5 million in 2009 to £1.2 million in 2010.
It is noted that all these savings have primarily been made in waste costs, which could be as a result
of more efficient processes and better waste management controls and procedures.
Income and savings in 2010 and 2009 are considerably lower than that observed in 2008 (£61.3
million). This may be a consequence of the weak economic climate and/or the nature of participating
companies (i.e. coke or refined petroleum based).
Refining operations are regulated under the Environmental Permitting Regulations regime and the
assets and infrastructure are mature. As a consequence they have, in the main, investigated and
exploited income and savings opportunities. The assets are therefore understood to be operating as
efficiency as is practicable. This is consistent with the 2010 and 2009 income and savings figures.
Consequently, future improvements in cost savings and income are therefore likely to be linked to
major Capex projects, which will be primarily business and fuel strategy driven. The relatively weak
economic climate, moving into 2011, and the anticipated slow economic recovery is likely to limit
Capex and, hence, cost saving and income in the coming years.
5.5.8 SIC 20 & 21: Chemicals and Pharmaceuticals
Estimates of environmental protection expenditure and income/savings are provided below for the
Chemicals and Pharmaceuticals sector. Of the 1113 invited to participate in the 2010 survey, a total of
340 companies returned valid responses, giving a response rate for the sector of 31%.
This sector is made up of two sub-sectors which can be summarised as:
• Basic chemicals: high volume and low margin bulk chemicals; and
• Pharmaceuticals: high-margin products manufactured in stringent clean conditions, supported
by substantial research and development.
The Chemicals and Pharmaceuticals sector continues to struggle to remain competitive with
competitors based in China, and to a lesser extent, Eastern Europe. This is believed to be particularly
prevalent in basic chemical manufacture, with a number of large basic chemicals manufacturing sites
ceasing operation, e.g. Nylon, Ethylene Oxide etc.
Key Expenditure
The Chemicals and Pharmaceuticals sector spent approximately £246 million in 2010 on
environmental protection measures, which equates to 5% of the total spend by UK industry.
Environmental expenditure for this sector is shown in Figure 5.32 for the years 2008, 2009 and 2010.
The 2010 data is also broken down by company size.
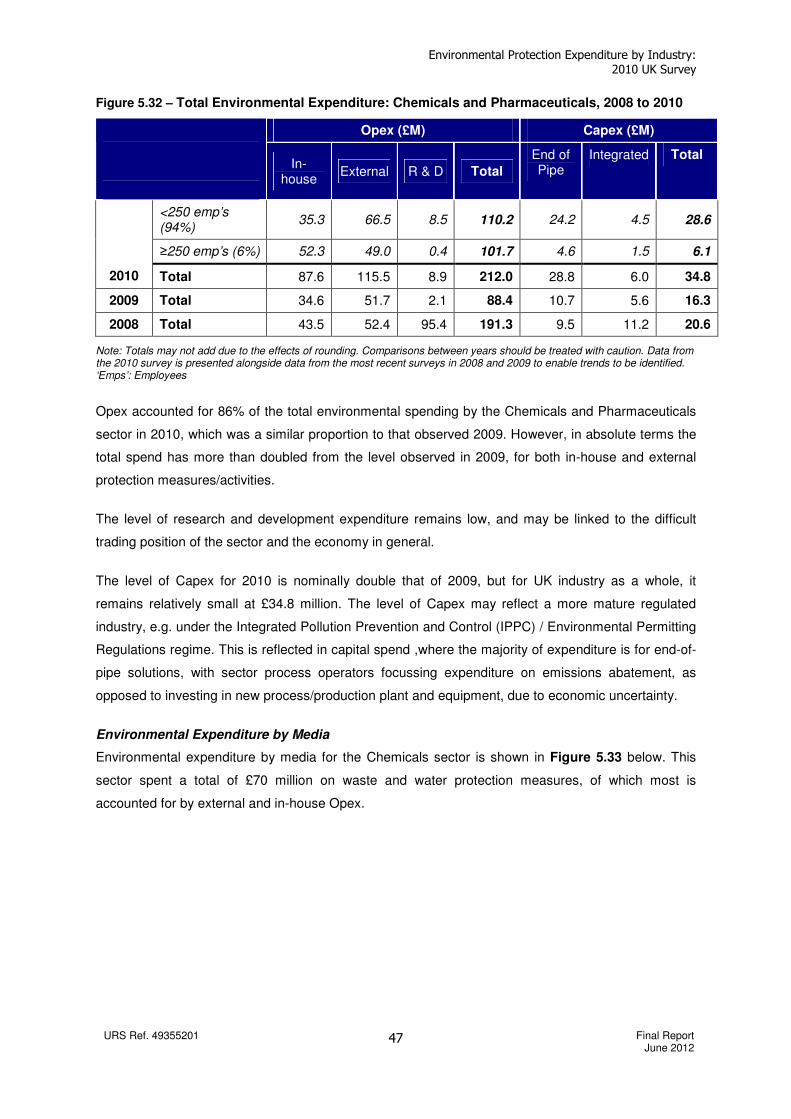
Environmental Protection Expenditure by Industry: 2010 UK Survey
URS Ref. 49355201 Final Report June 2012
47
Figure 5.32 – Total Environmental Expenditure: Chemicals and Pharmaceuticals, 2008 to 2010
Opex (£M) Capex (£M)
In-house
External R & D Total
End of Pipe
Integrated Total
<250 emp’s (94%)
35.3 66.5 8.5 110.2 24.2 4.5 28.6
≥250 emp’s (6%) 52.3 49.0 0.4 101.7 4.6 1.5 6.1
2010 Total 87.6 115.5 8.9 212.0 28.8 6.0 34.8
2009 Total 34.6 51.7 2.1 88.4 10.7 5.6 16.3
2008 Total 43.5 52.4 95.4 191.3 9.5 11.2 20.6
Note: Totals may not add due to the effects of rounding. Comparisons between years should be treated with caution. Data from the 2010 survey is presented alongside data from the most recent surveys in 2008 and 2009 to enable trends to be identified. ‘Emps’: Employees
Opex accounted for 86% of the total environmental spending by the Chemicals and Pharmaceuticals
sector in 2010, which was a similar proportion to that observed 2009. However, in absolute terms the
total spend has more than doubled from the level observed in 2009, for both in-house and external
protection measures/activities.
The level of research and development expenditure remains low, and may be linked to the difficult
trading position of the sector and the economy in general.
The level of Capex for 2010 is nominally double that of 2009, but for UK industry as a whole, it
remains relatively small at £34.8 million. The level of Capex may reflect a more mature regulated
industry, e.g. under the Integrated Pollution Prevention and Control (IPPC) / Environmental Permitting
Regulations regime. This is reflected in capital spend ,where the majority of expenditure is for end-of-
pipe solutions, with sector process operators focussing expenditure on emissions abatement, as
opposed to investing in new process/production plant and equipment, due to economic uncertainty.
Environmental Expenditure by Media
Environmental expenditure by media for the Chemicals sector is shown in Figure 5.33 below. This
sector spent a total of £70 million on waste and water protection measures, of which most is
accounted for by external and in-house Opex.
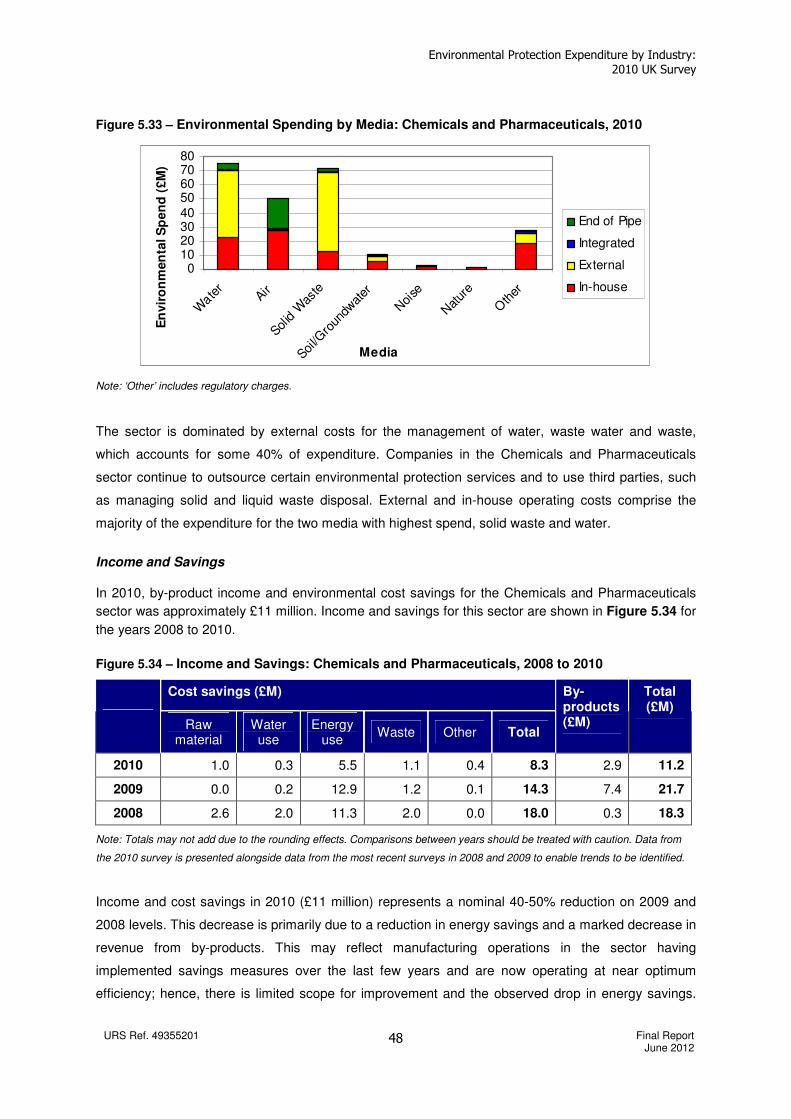
Environmental Protection Expenditure by Industry: 2010 UK Survey
URS Ref. 49355201 Final Report June 2012
48
Figure 5.33 – Environmental Spending by Media: Chemicals and Pharmaceuticals, 2010
01020304050607080
Wate
rAir
Solid W
aste
Soil/G
roun
dwat
er
Noi
se
Nat
ure
Oth
er
Media
En
vir
on
men
tal S
pen
d (
£M
)
End of Pipe
Integrated
External
In-house
Note: ‘Other’ includes regulatory charges.
The sector is dominated by external costs for the management of water, waste water and waste,
which accounts for some 40% of expenditure. Companies in the Chemicals and Pharmaceuticals
sector continue to outsource certain environmental protection services and to use third parties, such
as managing solid and liquid waste disposal. External and in-house operating costs comprise the
majority of the expenditure for the two media with highest spend, solid waste and water.
Income and Savings
In 2010, by-product income and environmental cost savings for the Chemicals and Pharmaceuticals
sector was approximately £11 million. Income and savings for this sector are shown in Figure 5.34 for
the years 2008 to 2010.
Figure 5.34 – Income and Savings: Chemicals and Pharmaceuticals, 2008 to 2010
Cost savings (£M)
Raw material
Water use
Energy use
Waste Other Total
By-products (£M)
Total (£M)
2010 1.0 0.3 5.5 1.1 0.4 8.3 2.9 11.2
2009 0.0 0.2 12.9 1.2 0.1 14.3 7.4 21.7
2008 2.6 2.0 11.3 2.0 0.0 18.0 0.3 18.3
Note: Totals may not add due to the rounding effects. Comparisons between years should be treated with caution. Data from
the 2010 survey is presented alongside data from the most recent surveys in 2008 and 2009 to enable trends to be identified.
Income and cost savings in 2010 (£11 million) represents a nominal 40-50% reduction on 2009 and
2008 levels. This decrease is primarily due to a reduction in energy savings and a marked decrease in
revenue from by-products. This may reflect manufacturing operations in the sector having
implemented savings measures over the last few years and are now operating at near optimum
efficiency; hence, there is limited scope for improvement and the observed drop in energy savings.
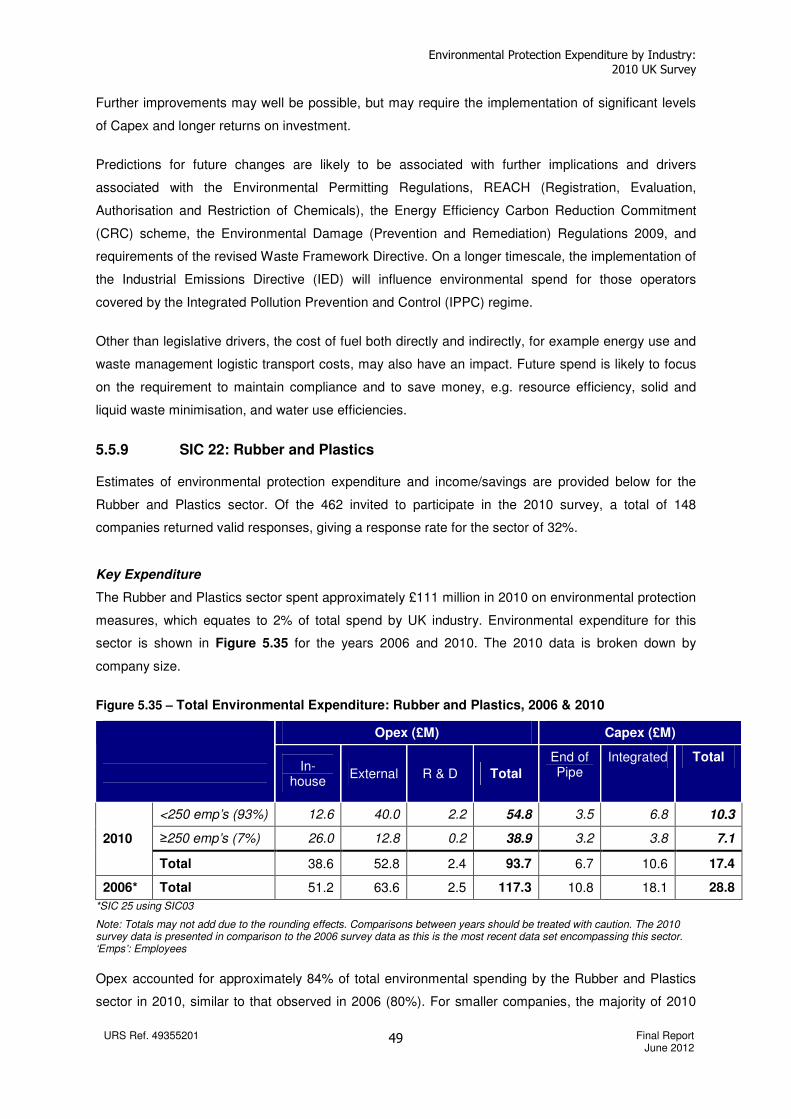
Environmental Protection Expenditure by Industry: 2010 UK Survey
URS Ref. 49355201 Final Report June 2012
49
Further improvements may well be possible, but may require the implementation of significant levels
of Capex and longer returns on investment.
Predictions for future changes are likely to be associated with further implications and drivers
associated with the Environmental Permitting Regulations, REACH (Registration, Evaluation,
Authorisation and Restriction of Chemicals), the Energy Efficiency Carbon Reduction Commitment
(CRC) scheme, the Environmental Damage (Prevention and Remediation) Regulations 2009, and
requirements of the revised Waste Framework Directive. On a longer timescale, the implementation of
the Industrial Emissions Directive (IED) will influence environmental spend for those operators
covered by the Integrated Pollution Prevention and Control (IPPC) regime.
Other than legislative drivers, the cost of fuel both directly and indirectly, for example energy use and
waste management logistic transport costs, may also have an impact. Future spend is likely to focus
on the requirement to maintain compliance and to save money, e.g. resource efficiency, solid and
liquid waste minimisation, and water use efficiencies.
5.5.9 SIC 22: Rubber and Plastics
Estimates of environmental protection expenditure and income/savings are provided below for the
Rubber and Plastics sector. Of the 462 invited to participate in the 2010 survey, a total of 148
companies returned valid responses, giving a response rate for the sector of 32%.
Key Expenditure
The Rubber and Plastics sector spent approximately £111 million in 2010 on environmental protection
measures, which equates to 2% of total spend by UK industry. Environmental expenditure for this
sector is shown in Figure 5.35 for the years 2006 and 2010. The 2010 data is broken down by
company size.
Figure 5.35 – Total Environmental Expenditure: Rubber and Plastics, 2006 & 2010
Opex (£M) Capex (£M)
In-house
External R & D Total
End of Pipe
Integrated Total
<250 emp’s (93%) 12.6 40.0 2.2 54.8 3.5 6.8 10.3
≥250 emp’s (7%) 26.0 12.8 0.2 38.9 3.2 3.8 7.1 2010
Total 38.6 52.8 2.4 93.7 6.7 10.6 17.4
2006* Total 51.2 63.6 2.5 117.3 10.8 18.1 28.8
*SIC 25 using SIC03
Note: Totals may not add due to the rounding effects. Comparisons between years should be treated with caution. The 2010 survey data is presented in comparison to the 2006 survey data as this is the most recent data set encompassing this sector. ‘Emps’: Employees
Opex accounted for approximately 84% of total environmental spending by the Rubber and Plastics
sector in 2010, similar to that observed in 2006 (80%). For smaller companies, the majority of 2010
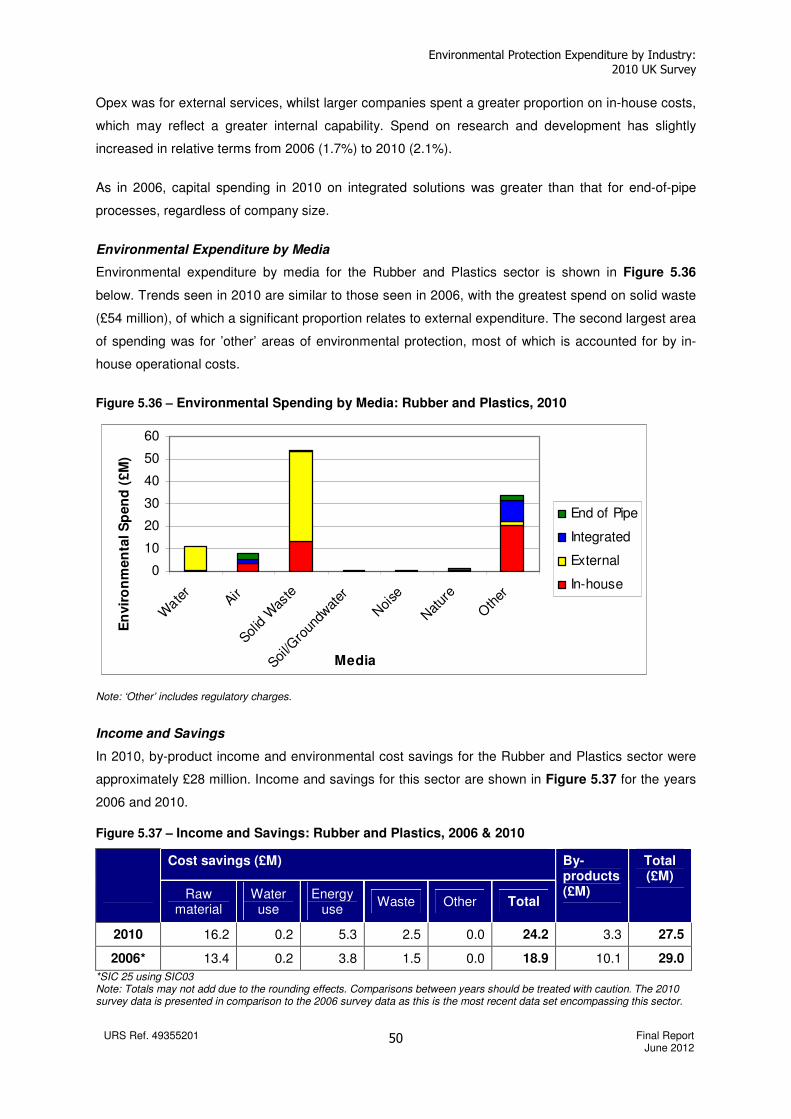
Environmental Protection Expenditure by Industry: 2010 UK Survey
URS Ref. 49355201 Final Report June 2012
50
Opex was for external services, whilst larger companies spent a greater proportion on in-house costs,
which may reflect a greater internal capability. Spend on research and development has slightly
increased in relative terms from 2006 (1.7%) to 2010 (2.1%).
As in 2006, capital spending in 2010 on integrated solutions was greater than that for end-of-pipe
processes, regardless of company size.
Environmental Expenditure by Media
Environmental expenditure by media for the Rubber and Plastics sector is shown in Figure 5.36
below. Trends seen in 2010 are similar to those seen in 2006, with the greatest spend on solid waste
(£54 million), of which a significant proportion relates to external expenditure. The second largest area
of spending was for ’other’ areas of environmental protection, most of which is accounted for by in-
house operational costs.
Figure 5.36 – Environmental Spending by Media: Rubber and Plastics, 2010
0
10
20
30
40
50
60
Wate
rAir
Solid W
aste
Soil/G
roun
dwat
er
Noi
se
Nat
ure
Oth
er
Media
En
vir
on
men
tal S
pen
d (
£M
)
End of Pipe
Integrated
External
In-house
Note: ‘Other’ includes regulatory charges.
Income and Savings
In 2010, by-product income and environmental cost savings for the Rubber and Plastics sector were
approximately £28 million. Income and savings for this sector are shown in Figure 5.37 for the years
2006 and 2010.
Figure 5.37 – Income and Savings: Rubber and Plastics, 2006 & 2010
Cost savings (£M)
Raw material
Water use
Energy use
Waste Other Total
By-products (£M)
Total (£M)
2010 16.2 0.2 5.3 2.5 0.0 24.2 3.3 27.5
2006* 13.4 0.2 3.8 1.5 0.0 18.9 10.1 29.0
*SIC 25 using SIC03 Note: Totals may not add due to the rounding effects. Comparisons between years should be treated with caution. The 2010 survey data is presented in comparison to the 2006 survey data as this is the most recent data set encompassing this sector.
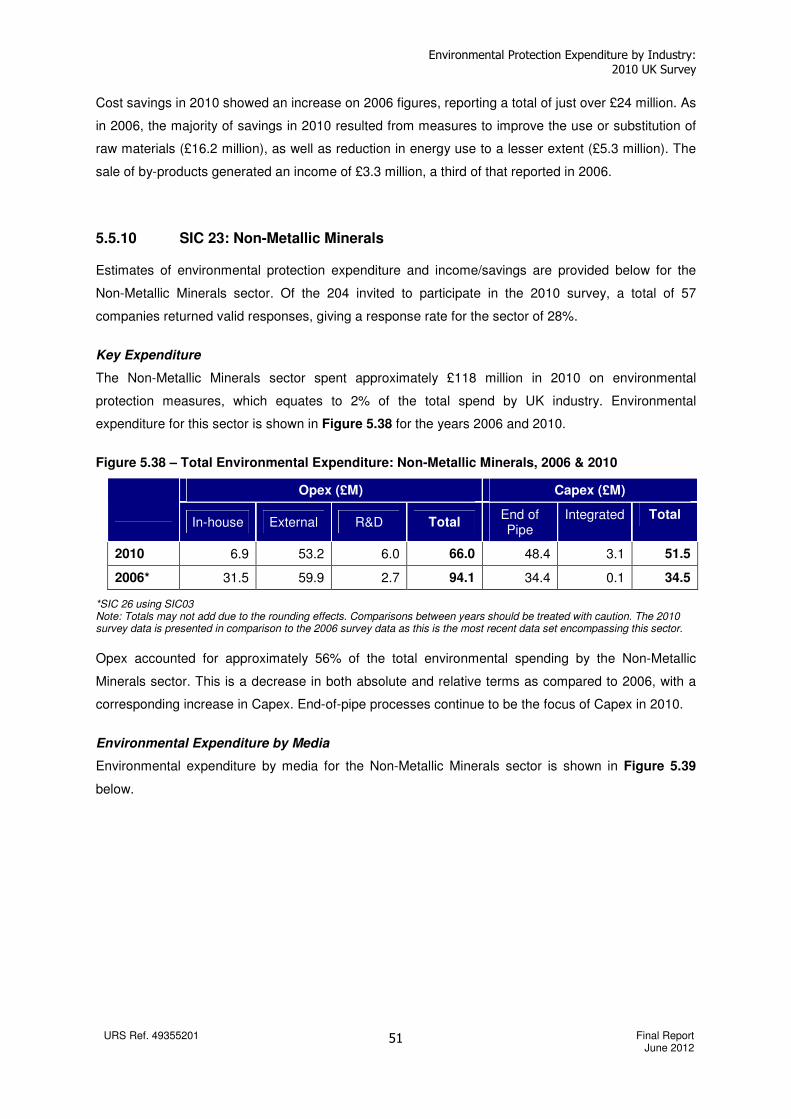
Environmental Protection Expenditure by Industry: 2010 UK Survey
URS Ref. 49355201 Final Report June 2012
51
Cost savings in 2010 showed an increase on 2006 figures, reporting a total of just over £24 million. As
in 2006, the majority of savings in 2010 resulted from measures to improve the use or substitution of
raw materials (£16.2 million), as well as reduction in energy use to a lesser extent (£5.3 million). The
sale of by-products generated an income of £3.3 million, a third of that reported in 2006.
5.5.10 SIC 23: Non-Metallic Minerals
Estimates of environmental protection expenditure and income/savings are provided below for the
Non-Metallic Minerals sector. Of the 204 invited to participate in the 2010 survey, a total of 57
companies returned valid responses, giving a response rate for the sector of 28%.
Key Expenditure
The Non-Metallic Minerals sector spent approximately £118 million in 2010 on environmental
protection measures, which equates to 2% of the total spend by UK industry. Environmental
expenditure for this sector is shown in Figure 5.38 for the years 2006 and 2010.
Figure 5.38 – Total Environmental Expenditure: Non-Metallic Minerals, 2006 & 2010
Opex (£M) Capex (£M)
In-house External R&D Total
End of Pipe
Integrated Total
2010 6.9 53.2 6.0 66.0 48.4 3.1 51.5
2006* 31.5 59.9 2.7 94.1 34.4 0.1 34.5
*SIC 26 using SIC03 Note: Totals may not add due to the rounding effects. Comparisons between years should be treated with caution. The 2010 survey data is presented in comparison to the 2006 survey data as this is the most recent data set encompassing this sector.
Opex accounted for approximately 56% of the total environmental spending by the Non-Metallic
Minerals sector. This is a decrease in both absolute and relative terms as compared to 2006, with a
corresponding increase in Capex. End-of-pipe processes continue to be the focus of Capex in 2010.
Environmental Expenditure by Media
Environmental expenditure by media for the Non-Metallic Minerals sector is shown in Figure 5.39
below.
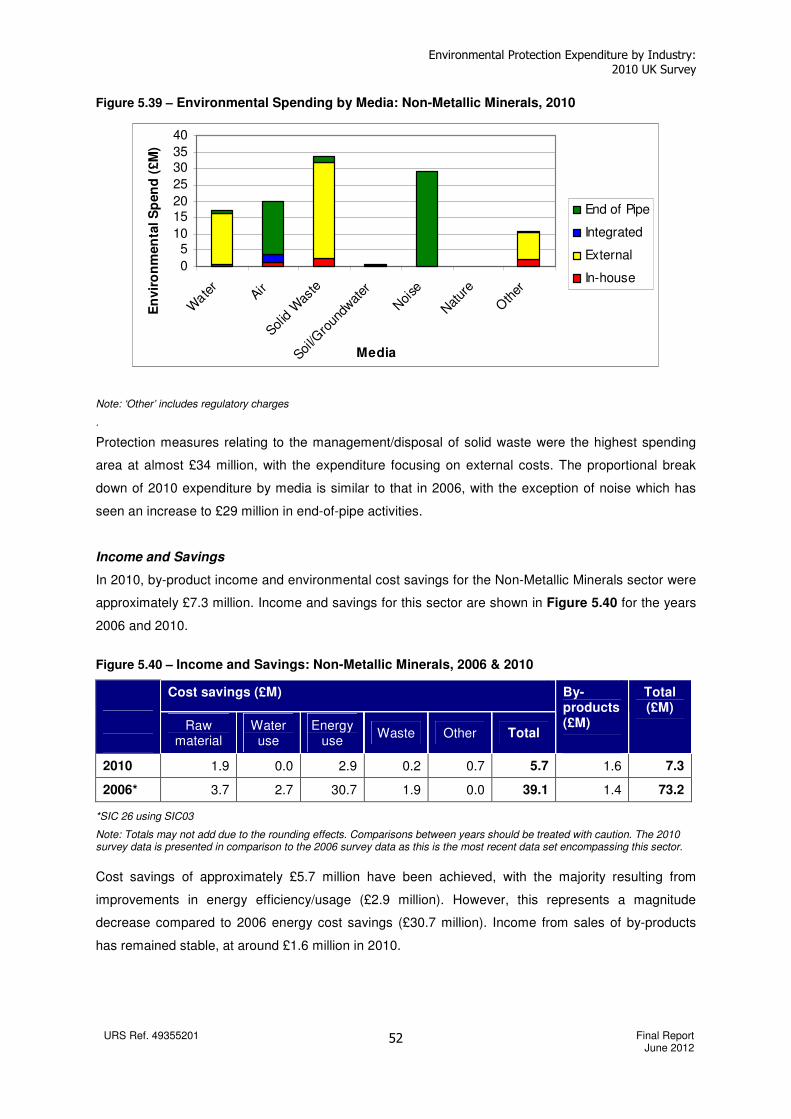
Environmental Protection Expenditure by Industry: 2010 UK Survey
URS Ref. 49355201 Final Report June 2012
52
Figure 5.39 – Environmental Spending by Media: Non-Metallic Minerals, 2010
0
510
1520
25
3035
40
Wate
rAir
Solid W
aste
Soil/G
roun
dwat
er
Noi
se
Nat
ure
Oth
er
Media
En
vir
on
men
tal S
pen
d (
£M
)
End of Pipe
Integrated
External
In-house
Note: ‘Other’ includes regulatory charges
.
Protection measures relating to the management/disposal of solid waste were the highest spending
area at almost £34 million, with the expenditure focusing on external costs. The proportional break
down of 2010 expenditure by media is similar to that in 2006, with the exception of noise which has
seen an increase to £29 million in end-of-pipe activities.
Income and Savings
In 2010, by-product income and environmental cost savings for the Non-Metallic Minerals sector were
approximately £7.3 million. Income and savings for this sector are shown in Figure 5.40 for the years
2006 and 2010.
Figure 5.40 – Income and Savings: Non-Metallic Minerals, 2006 & 2010
Cost savings (£M)
Raw material
Water use
Energy use
Waste Other Total
By-products (£M)
Total (£M)
2010 1.9 0.0 2.9 0.2 0.7 5.7 1.6 7.3
2006* 3.7 2.7 30.7 1.9 0.0 39.1 1.4 73.2
*SIC 26 using SIC03
Note: Totals may not add due to the rounding effects. Comparisons between years should be treated with caution. The 2010 survey data is presented in comparison to the 2006 survey data as this is the most recent data set encompassing this sector.
Cost savings of approximately £5.7 million have been achieved, with the majority resulting from
improvements in energy efficiency/usage (£2.9 million). However, this represents a magnitude
decrease compared to 2006 energy cost savings (£30.7 million). Income from sales of by-products
has remained stable, at around £1.6 million in 2010.
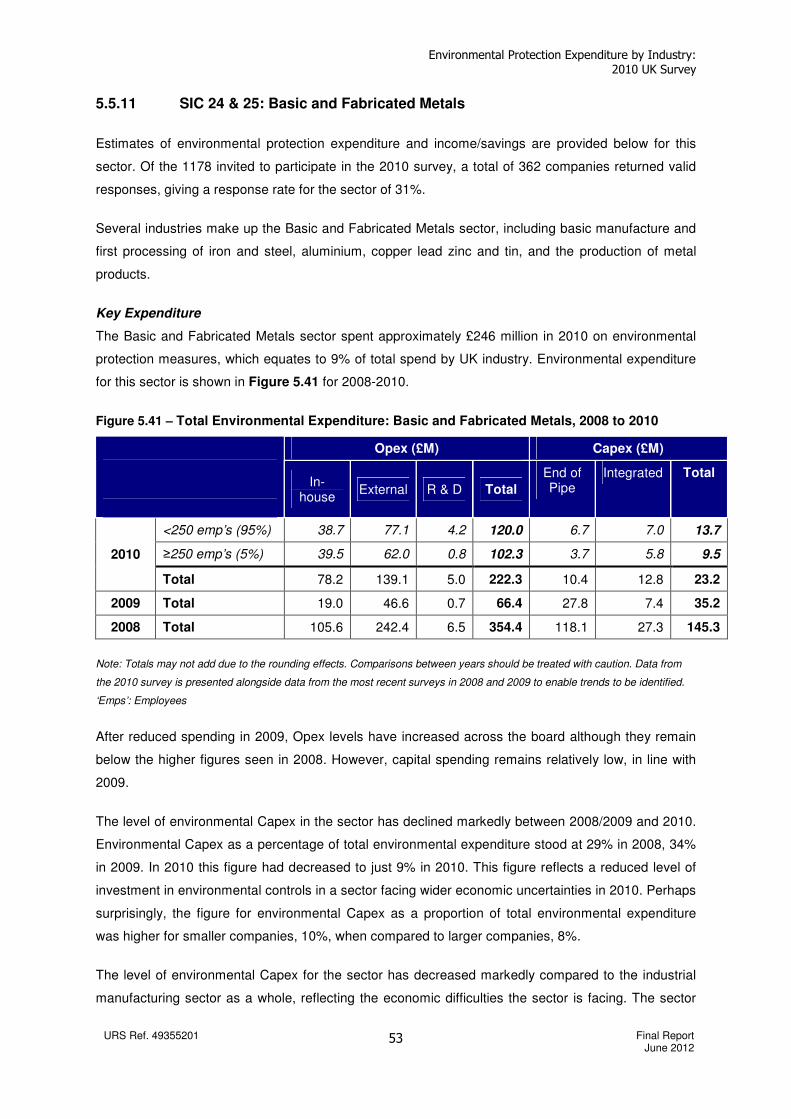
Environmental Protection Expenditure by Industry: 2010 UK Survey
URS Ref. 49355201 Final Report June 2012
53
5.5.11 SIC 24 & 25: Basic and Fabricated Metals
Estimates of environmental protection expenditure and income/savings are provided below for this
sector. Of the 1178 invited to participate in the 2010 survey, a total of 362 companies returned valid
responses, giving a response rate for the sector of 31%.
Several industries make up the Basic and Fabricated Metals sector, including basic manufacture and
first processing of iron and steel, aluminium, copper lead zinc and tin, and the production of metal
products.
Key Expenditure
The Basic and Fabricated Metals sector spent approximately £246 million in 2010 on environmental
protection measures, which equates to 9% of total spend by UK industry. Environmental expenditure
for this sector is shown in Figure 5.41 for 2008-2010.
Figure 5.41 – Total Environmental Expenditure: Basic and Fabricated Metals, 2008 to 2010
Opex (£M) Capex (£M)
In-house
External R & D Total
End of Pipe
Integrated Total
<250 emp’s (95%) 38.7 77.1 4.2 120.0 6.7 7.0 13.7
≥250 emp’s (5%) 39.5 62.0 0.8 102.3 3.7 5.8 9.5 2010
Total 78.2 139.1 5.0 222.3 10.4 12.8 23.2
2009 Total 19.0 46.6 0.7 66.4 27.8 7.4 35.2
2008 Total 105.6 242.4 6.5 354.4 118.1 27.3 145.3
Note: Totals may not add due to the rounding effects. Comparisons between years should be treated with caution. Data from
the 2010 survey is presented alongside data from the most recent surveys in 2008 and 2009 to enable trends to be identified.
‘Emps’: Employees
After reduced spending in 2009, Opex levels have increased across the board although they remain
below the higher figures seen in 2008. However, capital spending remains relatively low, in line with
2009.
The level of environmental Capex in the sector has declined markedly between 2008/2009 and 2010.
Environmental Capex as a percentage of total environmental expenditure stood at 29% in 2008, 34%
in 2009. In 2010 this figure had decreased to just 9% in 2010. This figure reflects a reduced level of
investment in environmental controls in a sector facing wider economic uncertainties in 2010. Perhaps
surprisingly, the figure for environmental Capex as a proportion of total environmental expenditure
was higher for smaller companies, 10%, when compared to larger companies, 8%.
The level of environmental Capex for the sector has decreased markedly compared to the industrial
manufacturing sector as a whole, reflecting the economic difficulties the sector is facing. The sector

Environmental Protection Expenditure by Industry: 2010 UK Survey
URS Ref. 49355201 Final Report June 2012
54
appears to be investing only about one third the amount of environmental capital when compared to
manufacturing as a whole.
The proportion of Opex on research and development has remained fairly stable between 2008
(1.8%) and 2010 (2.2%). This compares unfavourably with UK industry as a whole where research
and development spend in 2010 stood at 6% of total environmental expenditure.
The figures for both Capex and research and development are indicative of a lack of investment, and
possibly confidence in the future of the sector as a whole, especially when compared to the
manufacturing sector generally.
Environmental Expenditure by Media
Environmental expenditure by media for the Basic and Fabricated Metals sector is shown in Figure
5.42 below.
Figure 5.42 – Environmental Expenditure by Media: Basic and Fabricated Metals, 2010
0
20
40
60
80
100
120
140
Wate
rAir
Solid W
aste
Soil/G
roun
dwat
er
Noi
se
Nat
ure
Oth
er
Media
En
vir
on
men
tal S
pen
d (
£M
)
End of Pipe
Integrated
External
In-house
Note: ‘Other’ includes regulatory charges.
Processes to deal with solid waste continue to be the largest area of environmental spend for the
sector, totalling £129 million in 2010 (mostly Opex). This area will continue to be the dominant area of
spend, given the nature of the sector and increasing waste disposal costs in the UK. It also
emphasises the importance of waste reduction in driving down costs for the sector.
Many firms still face significant regulatory and practical barriers when it comes to dealing with their
waste cost-effectively. These include the economic viability of recycling and recovering residual
waste, especially when only low volumes are present. Linked to this is a lack of local or regional
treatment infrastructure, which can force companies to accept higher costs for disposal.
Environmental Protection Expenditure by Industry: 2010 UK Survey
URS Ref. 49355201 Final Report June 2012
55
Income and Savings
In 2010, by-product income and savings for the Basic and Fabricated Metals sector were
approximately £33.3 million. Income and savings for this sector are shown in Figure 5.43 for the
years 2008 to 2010.
Figure 5.43 – Income and Savings: Basic and Fabricated Metals, 2008 to 2010
Cost savings (£M)
Raw material
Water use
Energy use
Waste Other Total
By-products (£M)
Total (£M)
2010 0.7 0.6 15.5 11.4 0.0 28.2 5.1 33.3
2009 3.6 0.1 1.8 61.2 2.0 68.7 1.9 70.6
2008 6.2 5.3 10.6 32.7 0.9 55.7 5.3 61.1
Note: Totals may not add due to the rounding effects. Comparisons between years should be treated with caution. Data from
the 2010 survey is presented alongside data from the most recent surveys in 2008 and 2009 to enable trends to be identified.
In 2010 cost savings in energy use and waste dominated total cost savings, representing 55% and
40% of the total respectively. This partly reflects the prominence of waste disposal and recycling as
an issue for the sector as a whole.
The figures suggest that there have been fluctuations across all of the environmental media
categories when considering cost savings over the past few surveys.
Income and savings as a proportion of Opex are similar between 2010 and 2008 (15% in 2010
compared with 17% in 2008) whereas the 2009 figures appear to be anomalous in that savings
relative to Opex for the year are at 106% and are difficult to explain in the absence of identifiable
internal or external factors.
5.5.12 SIC 26 & 32: Computer, Electronic and Optical Products, and Other Manufacturing
Estimates of environmental protection expenditure, environmental expenditure by media and income
and savings are provided below for the Computer, Electronic and Optical Products and Other
Manufacturing sector. Of the 1,004 invited to participate in the 2010 survey, a total of 327 companies
returned valid responses, giving a response rate for the sector of 33%.
This sector manufactures electronic components and products including optical equipment such as
photographic and optical precision equipment and medical and dental instruments.
Key Expenditure
The Computer, Electronic and Optical Products and Other Manufacturing sector spent approximately
£50 million in 2010 on environmental protection measures, which equates to 1% of total spend by UK
industry. Environmental expenditure for this sector is shown in Figure 5.44 for the years 2006 and
2010.
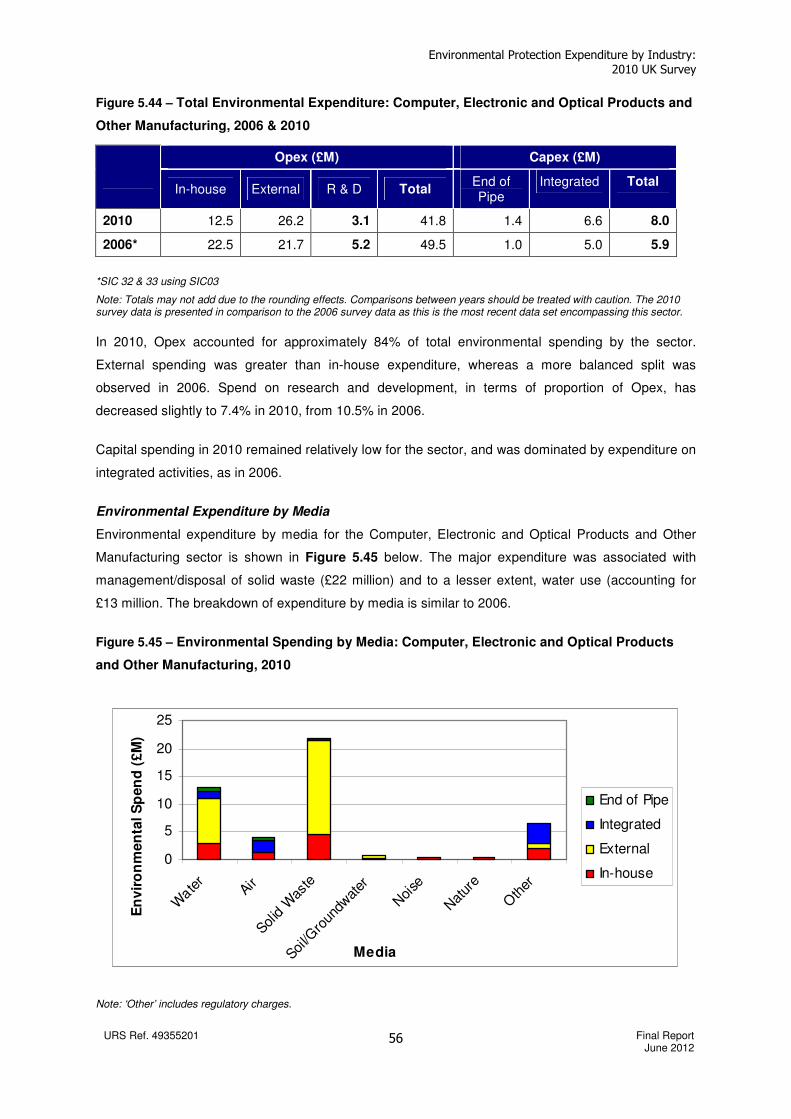
Environmental Protection Expenditure by Industry: 2010 UK Survey
URS Ref. 49355201 Final Report June 2012
56
Figure 5.44 – Total Environmental Expenditure: Computer, Electronic and Optical Products and
Other Manufacturing, 2006 & 2010
Opex (£M) Capex (£M)
In-house External R & D Total
End of Pipe
Integrated Total
2010 12.5 26.2 3.1 41.8 1.4 6.6 8.0
2006* 22.5 21.7 5.2 49.5 1.0 5.0 5.9
*SIC 32 & 33 using SIC03
Note: Totals may not add due to the rounding effects. Comparisons between years should be treated with caution. The 2010 survey data is presented in comparison to the 2006 survey data as this is the most recent data set encompassing this sector.
In 2010, Opex accounted for approximately 84% of total environmental spending by the sector.
External spending was greater than in-house expenditure, whereas a more balanced split was
observed in 2006. Spend on research and development, in terms of proportion of Opex, has
decreased slightly to 7.4% in 2010, from 10.5% in 2006.
Capital spending in 2010 remained relatively low for the sector, and was dominated by expenditure on
integrated activities, as in 2006.
Environmental Expenditure by Media
Environmental expenditure by media for the Computer, Electronic and Optical Products and Other
Manufacturing sector is shown in Figure 5.45 below. The major expenditure was associated with
management/disposal of solid waste (£22 million) and to a lesser extent, water use (accounting for
£13 million. The breakdown of expenditure by media is similar to 2006.
Figure 5.45 – Environmental Spending by Media: Computer, Electronic and Optical Products
and Other Manufacturing, 2010
0
5
10
15
20
25
Wate
rAir
Solid W
aste
Soil/G
roun
dwat
er
Noi
se
Nat
ure
Oth
er
Media
En
vir
on
men
tal S
pen
d (
£M
)
End of Pipe
Integrated
External
In-house
Note: ‘Other’ includes regulatory charges.
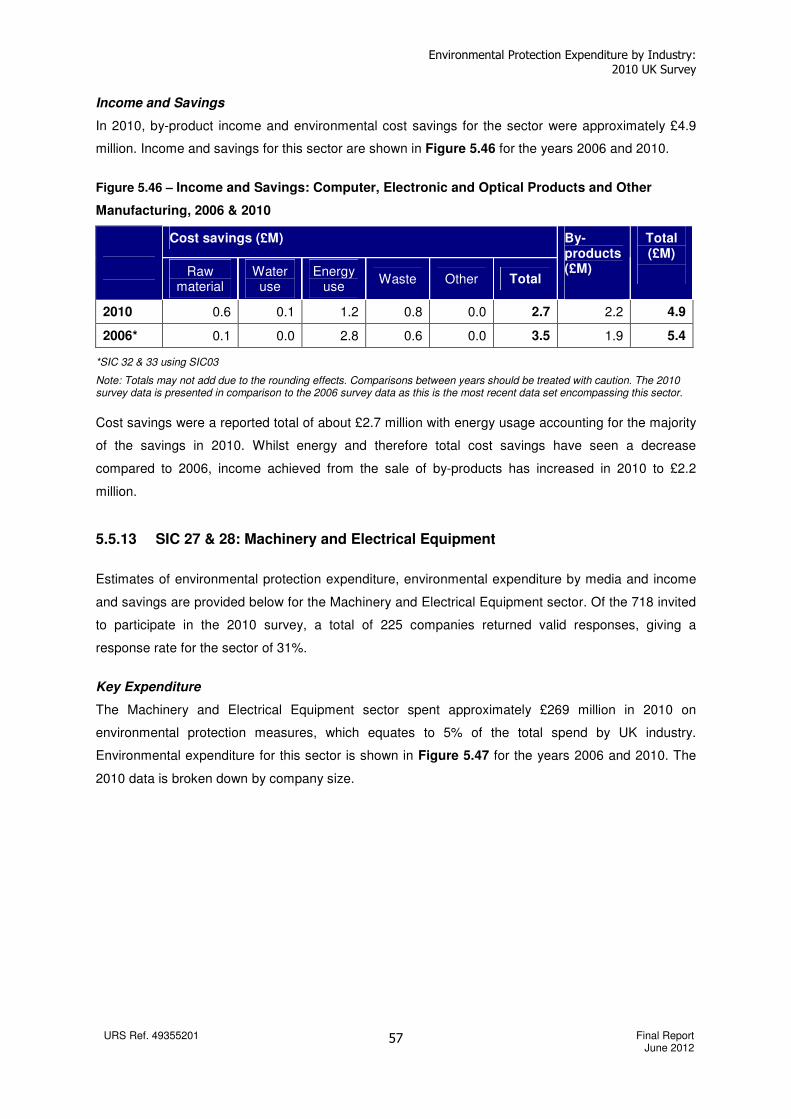
Environmental Protection Expenditure by Industry: 2010 UK Survey
URS Ref. 49355201 Final Report June 2012
57
Income and Savings
In 2010, by-product income and environmental cost savings for the sector were approximately £4.9
million. Income and savings for this sector are shown in Figure 5.46 for the years 2006 and 2010.
Figure 5.46 – Income and Savings: Computer, Electronic and Optical Products and Other
Manufacturing, 2006 & 2010
Cost savings (£M)
Raw material
Water use
Energy use
Waste Other Total
By-products (£M)
Total (£M)
2010 0.6 0.1 1.2 0.8 0.0 2.7 2.2 4.9
2006* 0.1 0.0 2.8 0.6 0.0 3.5 1.9 5.4
*SIC 32 & 33 using SIC03
Note: Totals may not add due to the rounding effects. Comparisons between years should be treated with caution. The 2010 survey data is presented in comparison to the 2006 survey data as this is the most recent data set encompassing this sector.
Cost savings were a reported total of about £2.7 million with energy usage accounting for the majority
of the savings in 2010. Whilst energy and therefore total cost savings have seen a decrease
compared to 2006, income achieved from the sale of by-products has increased in 2010 to £2.2
million.
5.5.13 SIC 27 & 28: Machinery and Electrical Equipment
Estimates of environmental protection expenditure, environmental expenditure by media and income
and savings are provided below for the Machinery and Electrical Equipment sector. Of the 718 invited
to participate in the 2010 survey, a total of 225 companies returned valid responses, giving a
response rate for the sector of 31%.
Key Expenditure
The Machinery and Electrical Equipment sector spent approximately £269 million in 2010 on
environmental protection measures, which equates to 5% of the total spend by UK industry.
Environmental expenditure for this sector is shown in Figure 5.47 for the years 2006 and 2010. The
2010 data is broken down by company size.
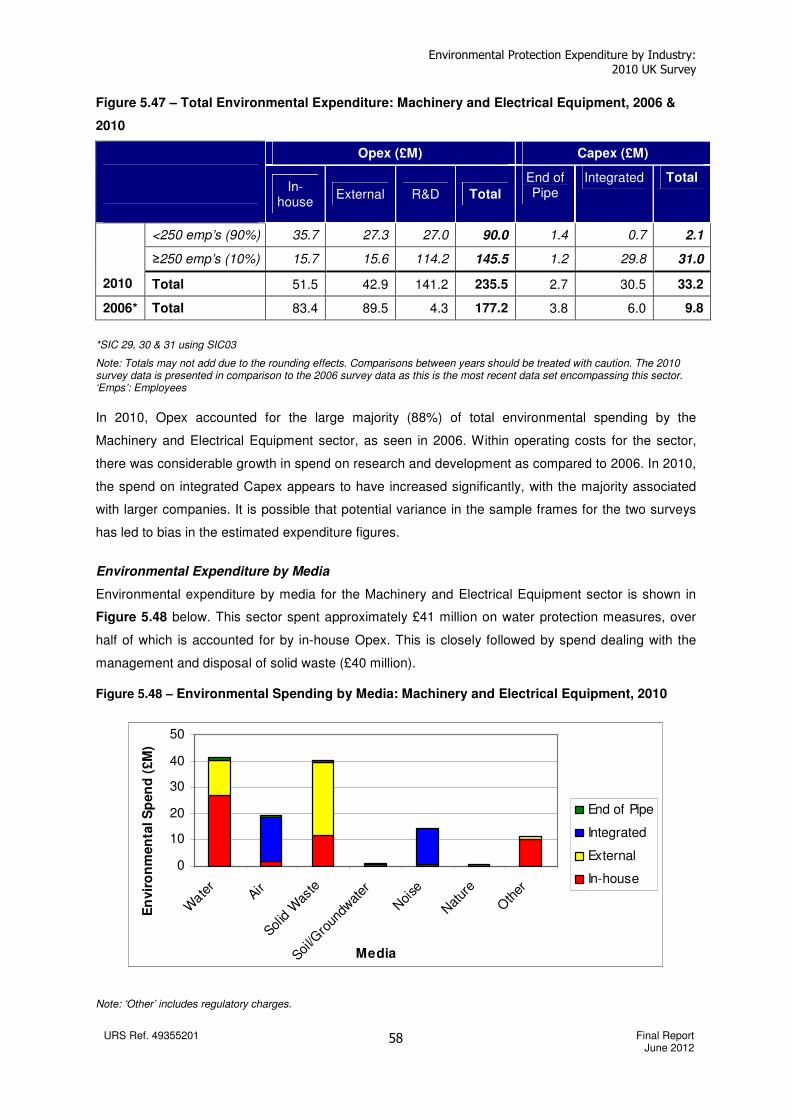
Environmental Protection Expenditure by Industry: 2010 UK Survey
URS Ref. 49355201 Final Report June 2012
58
Figure 5.47 – Total Environmental Expenditure: Machinery and Electrical Equipment, 2006 &
2010
Opex (£M) Capex (£M)
In-house
External R&D Total
End of Pipe
Integrated Total
<250 emp’s (90%) 35.7 27.3 27.0 90.0 1.4 0.7 2.1
≥250 emp’s (10%) 15.7 15.6 114.2 145.5 1.2 29.8 31.0
2010 Total 51.5 42.9 141.2 235.5 2.7 30.5 33.2
2006* Total 83.4 89.5 4.3 177.2 3.8 6.0 9.8
*SIC 29, 30 & 31 using SIC03
Note: Totals may not add due to the rounding effects. Comparisons between years should be treated with caution. The 2010 survey data is presented in comparison to the 2006 survey data as this is the most recent data set encompassing this sector. ‘Emps’: Employees
In 2010, Opex accounted for the large majority (88%) of total environmental spending by the
Machinery and Electrical Equipment sector, as seen in 2006. Within operating costs for the sector,
there was considerable growth in spend on research and development as compared to 2006. In 2010,
the spend on integrated Capex appears to have increased significantly, with the majority associated
with larger companies. It is possible that potential variance in the sample frames for the two surveys
has led to bias in the estimated expenditure figures.
Environmental Expenditure by Media
Environmental expenditure by media for the Machinery and Electrical Equipment sector is shown in
Figure 5.48 below. This sector spent approximately £41 million on water protection measures, over
half of which is accounted for by in-house Opex. This is closely followed by spend dealing with the
management and disposal of solid waste (£40 million).
Figure 5.48 – Environmental Spending by Media: Machinery and Electrical Equipment, 2010
0
10
20
30
40
50
Wate
rAir
Solid W
aste
Soil/G
roun
dwat
er
Noi
se
Nat
ure
Oth
er
Media
En
vir
on
men
tal S
pen
d (
£M
)
End of Pipe
Integrated
External
In-house
Note: ‘Other’ includes regulatory charges.

Environmental Protection Expenditure by Industry: 2010 UK Survey
URS Ref. 49355201 Final Report June 2012
59
Income and Savings
In 2010, by-product income and environmental cost savings for the Machinery and Electrical
Equipment sector were approximately £51 million. Income and savings for this sector are shown in
Figure 5.49 for the years 2006 and 2010.
Figure 5.49 – Income and Savings: Machinery and Electrical Equipment, 2006 & 2010
Cost savings (£M)
Raw
material
Water
use
Energy
use Waste Other Total
By-
products
(£M)
Total
(£M)
2010 28.2 0.4 3.2 1.4 0.0 33.1 17.4 50.6
2006* 4.6 0.6 8.0 28.1 0.4 41.7 10.5 52.2
*SIC 29, 30 & 31 using SIC03 Note: Totals may not add due to the rounding effects. Comparisons between years should be treated with caution. The 2010 survey data is presented in comparison to the 2006 survey data as this is the most recent data set encompassing this sector.
Whilst cost savings appear to have decreased for the sector from 2006 to 2010, the sale of by-
products has noticeably increased. The majority of savings in 2010 resulted from improved use of or
substitution of raw materials, whereas in 2006, savings were primarily related to reduced waste costs.
5.5.14 SIC 29 & 30: Transport Equipment
Estimates of environmental protection expenditure, environmental expenditure by media and income
and savings are provided below for the Transport Equipment sector. Of the 368 invited to participate
in the 2010 survey, a total of 87 companies returned valid responses, giving a relatively low response
rate for the sector of 24%.
Key Expenditure
The Transport Equipment sector spent approximately £123 million in 2010 on environmental
protection measures, which equates to 2% of total spend by UK industry. Environmental expenditure
for this sector is shown in Figure 5.50 for the years 2006 and 2010. The 2010 data is broken down by
company size.
Environmental Protection Expenditure by Industry: 2010 UK Survey
URS Ref. 49355201 Final Report June 2012
60
Figure 5.50 – Total Environmental Expenditure: Transport Equipment, 2006 & 2010
Opex (£M) Capex (£M)
In-house
External R & D Total
End of Pipe
Integrated Total
<250 emp’s (71%) 7.3 19.7 1.2 28.2 0.6 1.3 2.0
≥250 emp’s (29%) 20.7 58.4 1.3 80.4 7.5 4.9 12.4 2010
Total 28.0 78.1 2.5 108.6 8.2 6.2 14.4
2006* Total 170.3 69.5 3.2 243.0 11.3 3.1 14.4
*SIC 34 & 35 using SIC03 Note: Totals may not add due to the rounding effects. Comparisons between years should be treated with caution. The 2010 survey data is presented in comparison to the 2006 survey data as this is the most recent data set encompassing this sector. ‘Emps’: Employees
In 2010, Opex accounted for the large majority (88%) of total environmental spending by the
Transport Equipment sector, as in 2006. Regardless of company size, a higher proportion of Opex in
2010 was for external rather than internal costs, which contrasts with the split observed in 2006.
Whilst in absolute terms Capex has remained stable between 2006 and 2010, relative to total spend it
has decreased over this period. The proportion of capital spend on end-of-pipe processes appears to
have decreased, whilst integrated expenditure has increased compared to 2006.
It is possible that the relatively low response rate (24%) for the 2010 survey has introduced bias to the
estimated expenditure figures.
Environmental Expenditure by Media
Environmental expenditure by media for the Transport Equipment sector is shown in Figure 5.51
below. This sector spent approximately £76 million dealing with solid waste, most of which is
accounted for by external costs, which contrasts with the in-house spend seen in 2006. The high
costs for solid waste are likely to be associated with increasing external disposal/waste management
costs, and not necessarily a factor increased waste volumes
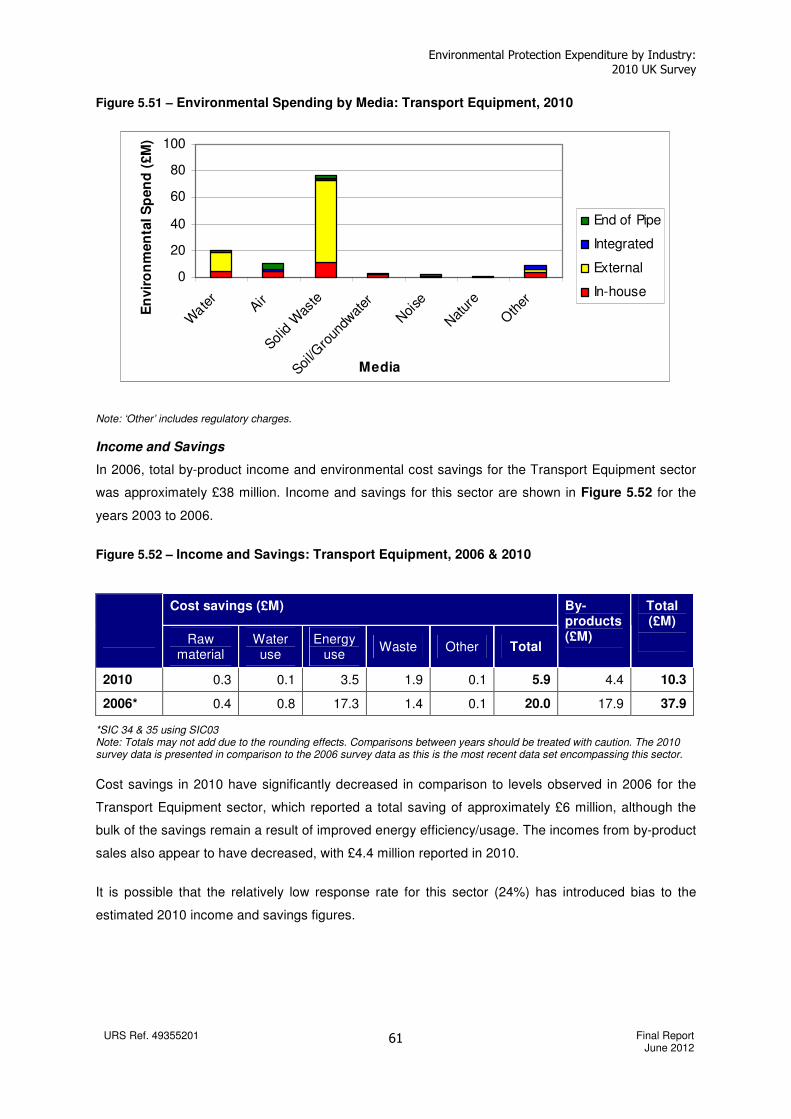
Environmental Protection Expenditure by Industry: 2010 UK Survey
URS Ref. 49355201 Final Report June 2012
61
Figure 5.51 – Environmental Spending by Media: Transport Equipment, 2010
0
20
40
60
80
100
Wate
rAir
Solid W
aste
Soil/G
roun
dwat
er
Noi
se
Nat
ure
Oth
er
Media
En
vir
on
men
tal S
pen
d (
£M
)
End of Pipe
Integrated
External
In-house
Note: ‘Other’ includes regulatory charges.
Income and Savings
In 2006, total by-product income and environmental cost savings for the Transport Equipment sector
was approximately £38 million. Income and savings for this sector are shown in Figure 5.52 for the
years 2003 to 2006.
Figure 5.52 – Income and Savings: Transport Equipment, 2006 & 2010
Cost savings (£M)
Raw material
Water use
Energy use
Waste Other Total
By-products (£M)
Total (£M)
2010 0.3 0.1 3.5 1.9 0.1 5.9 4.4 10.3
2006* 0.4 0.8 17.3 1.4 0.1 20.0 17.9 37.9
*SIC 34 & 35 using SIC03 Note: Totals may not add due to the rounding effects. Comparisons between years should be treated with caution. The 2010 survey data is presented in comparison to the 2006 survey data as this is the most recent data set encompassing this sector.
Cost savings in 2010 have significantly decreased in comparison to levels observed in 2006 for the
Transport Equipment sector, which reported a total saving of approximately £6 million, although the
bulk of the savings remain a result of improved energy efficiency/usage. The incomes from by-product
sales also appear to have decreased, with £4.4 million reported in 2010.
It is possible that the relatively low response rate for this sector (24%) has introduced bias to the
estimated 2010 income and savings figures.
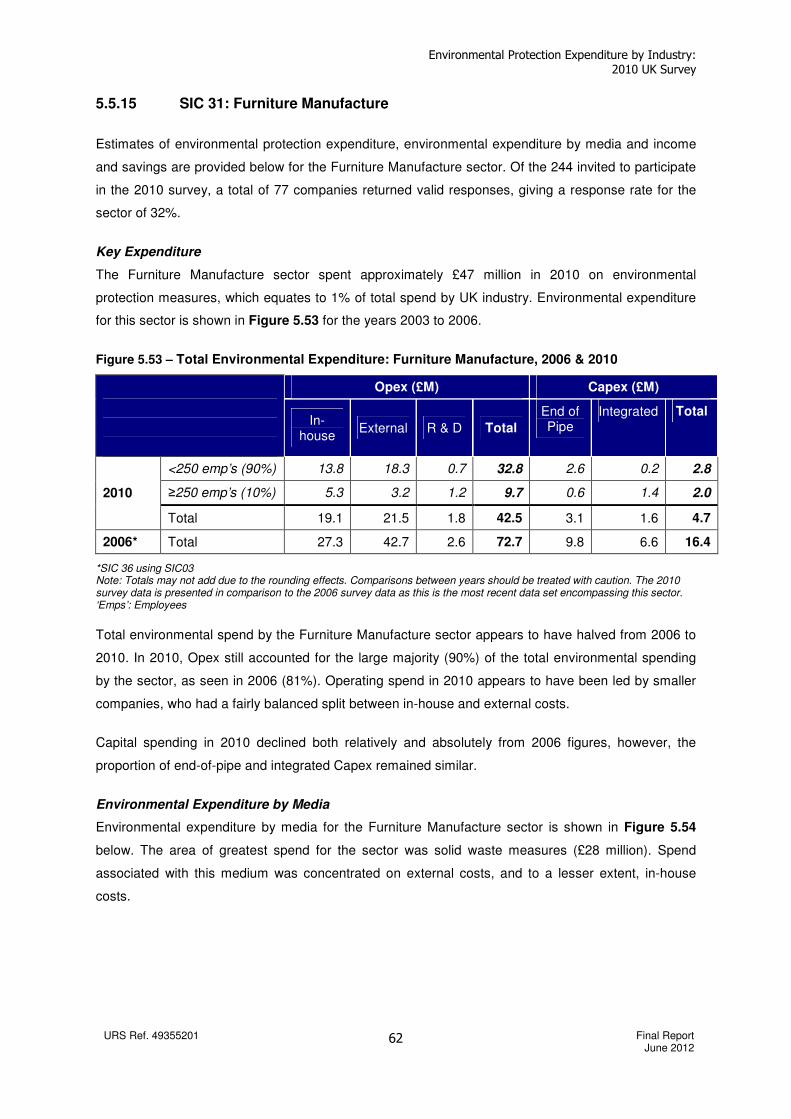
Environmental Protection Expenditure by Industry: 2010 UK Survey
URS Ref. 49355201 Final Report June 2012
62
5.5.15 SIC 31: Furniture Manufacture
Estimates of environmental protection expenditure, environmental expenditure by media and income
and savings are provided below for the Furniture Manufacture sector. Of the 244 invited to participate
in the 2010 survey, a total of 77 companies returned valid responses, giving a response rate for the
sector of 32%.
Key Expenditure
The Furniture Manufacture sector spent approximately £47 million in 2010 on environmental
protection measures, which equates to 1% of total spend by UK industry. Environmental expenditure
for this sector is shown in Figure 5.53 for the years 2003 to 2006.
Figure 5.53 – Total Environmental Expenditure: Furniture Manufacture, 2006 & 2010
Opex (£M) Capex (£M)
In-house
External R & D Total
End of Pipe
Integrated Total
<250 emp’s (90%) 13.8 18.3 0.7 32.8 2.6 0.2 2.8
≥250 emp’s (10%) 5.3 3.2 1.2 9.7 0.6 1.4 2.0 2010
Total 19.1 21.5 1.8 42.5 3.1 1.6 4.7
2006* Total 27.3 42.7 2.6 72.7 9.8 6.6 16.4
*SIC 36 using SIC03 Note: Totals may not add due to the rounding effects. Comparisons between years should be treated with caution. The 2010 survey data is presented in comparison to the 2006 survey data as this is the most recent data set encompassing this sector. ‘Emps’: Employees
Total environmental spend by the Furniture Manufacture sector appears to have halved from 2006 to
2010. In 2010, Opex still accounted for the large majority (90%) of the total environmental spending
by the sector, as seen in 2006 (81%). Operating spend in 2010 appears to have been led by smaller
companies, who had a fairly balanced split between in-house and external costs.
Capital spending in 2010 declined both relatively and absolutely from 2006 figures, however, the
proportion of end-of-pipe and integrated Capex remained similar.
Environmental Expenditure by Media
Environmental expenditure by media for the Furniture Manufacture sector is shown in Figure 5.54
below. The area of greatest spend for the sector was solid waste measures (£28 million). Spend
associated with this medium was concentrated on external costs, and to a lesser extent, in-house
costs.
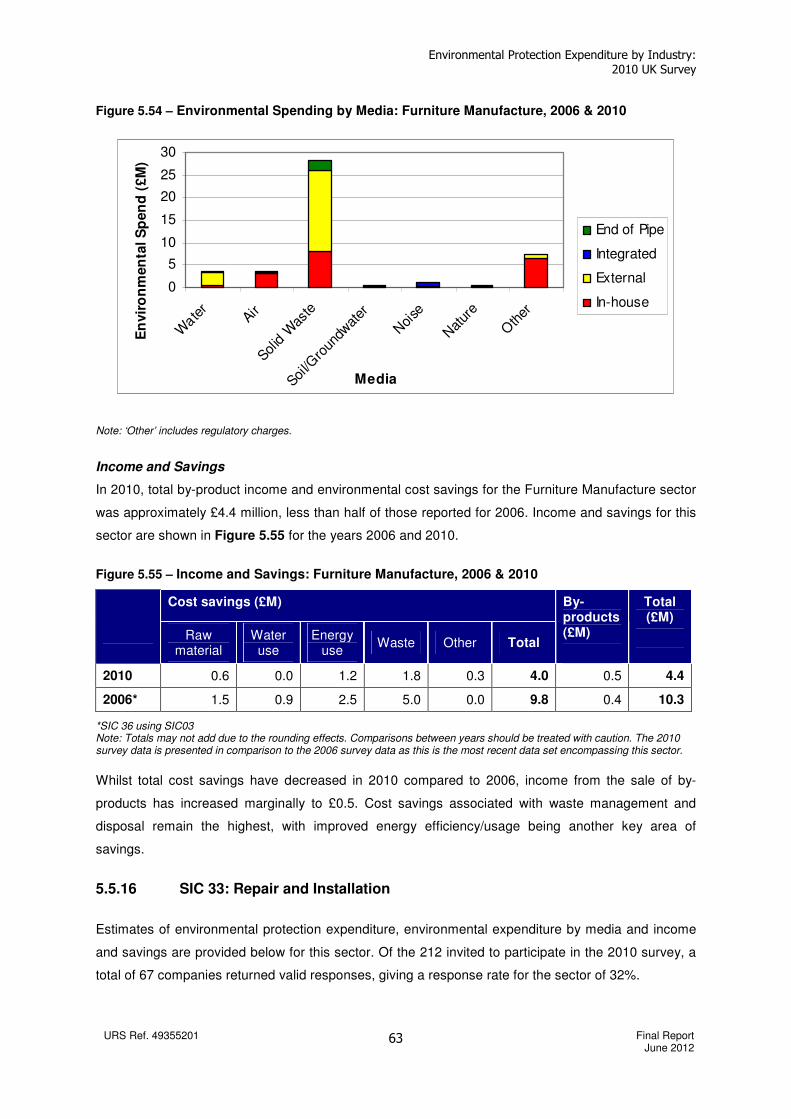
Environmental Protection Expenditure by Industry: 2010 UK Survey
URS Ref. 49355201 Final Report June 2012
63
Figure 5.54 – Environmental Spending by Media: Furniture Manufacture, 2006 & 2010
0
5
10
15
20
25
30
Wate
rAir
Solid W
aste
Soil/G
roun
dwat
er
Noi
se
Nat
ure
Oth
er
Media
En
vir
on
men
tal S
pen
d (
£M
)
End of Pipe
Integrated
External
In-house
Note: ‘Other’ includes regulatory charges.
Income and Savings
In 2010, total by-product income and environmental cost savings for the Furniture Manufacture sector
was approximately £4.4 million, less than half of those reported for 2006. Income and savings for this
sector are shown in Figure 5.55 for the years 2006 and 2010.
Figure 5.55 – Income and Savings: Furniture Manufacture, 2006 & 2010
Cost savings (£M)
Raw material
Water use
Energy use
Waste Other Total
By-products (£M)
Total (£M)
2010 0.6 0.0 1.2 1.8 0.3 4.0 0.5 4.4
2006* 1.5 0.9 2.5 5.0 0.0 9.8 0.4 10.3
*SIC 36 using SIC03 Note: Totals may not add due to the rounding effects. Comparisons between years should be treated with caution. The 2010 survey data is presented in comparison to the 2006 survey data as this is the most recent data set encompassing this sector.
Whilst total cost savings have decreased in 2010 compared to 2006, income from the sale of by-
products has increased marginally to £0.5. Cost savings associated with waste management and
disposal remain the highest, with improved energy efficiency/usage being another key area of
savings.
5.5.16 SIC 33: Repair and Installation
Estimates of environmental protection expenditure, environmental expenditure by media and income
and savings are provided below for this sector. Of the 212 invited to participate in the 2010 survey, a
total of 67 companies returned valid responses, giving a response rate for the sector of 32%.
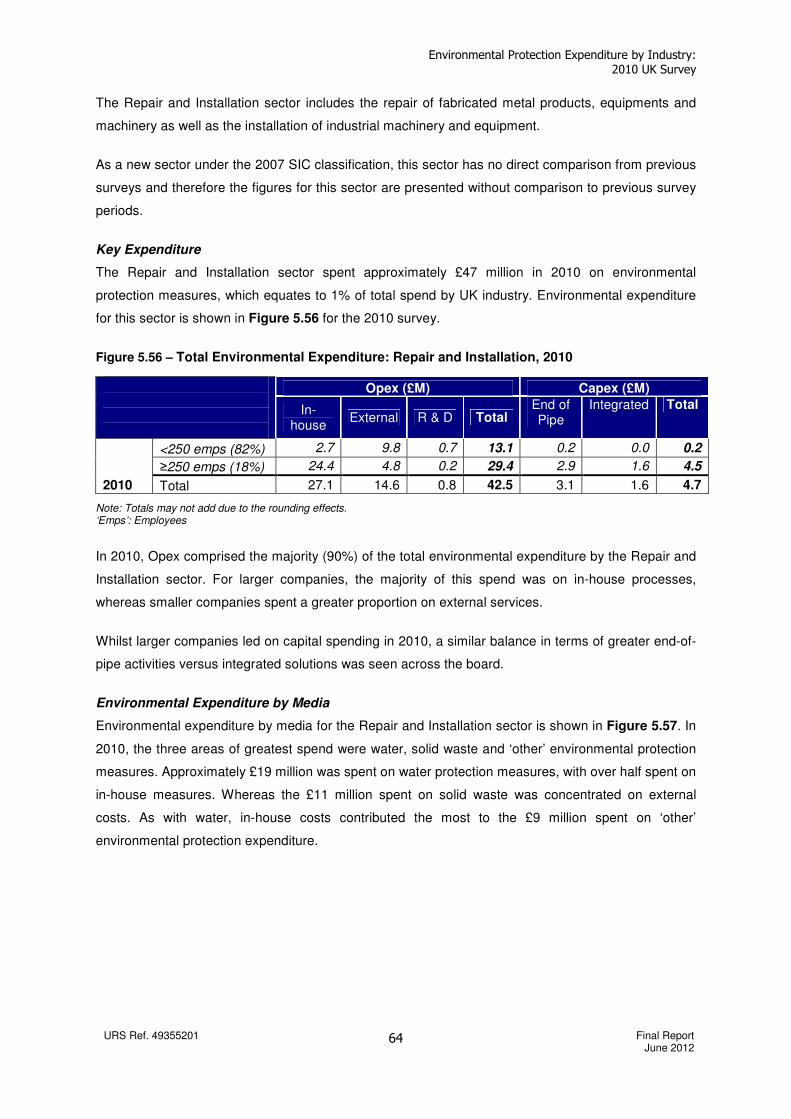
Environmental Protection Expenditure by Industry: 2010 UK Survey
URS Ref. 49355201 Final Report June 2012
64
The Repair and Installation sector includes the repair of fabricated metal products, equipments and
machinery as well as the installation of industrial machinery and equipment.
As a new sector under the 2007 SIC classification, this sector has no direct comparison from previous
surveys and therefore the figures for this sector are presented without comparison to previous survey
periods.
Key Expenditure
The Repair and Installation sector spent approximately £47 million in 2010 on environmental
protection measures, which equates to 1% of total spend by UK industry. Environmental expenditure
for this sector is shown in Figure 5.56 for the 2010 survey.
Figure 5.56 – Total Environmental Expenditure: Repair and Installation, 2010
Opex (£M) Capex (£M)
In-house
External R & D Total End of Pipe
Integrated Total
<250 emps (82%) 2.7 9.8 0.7 13.1 0.2 0.0 0.2
≥250 emps (18%) 24.4 4.8 0.2 29.4 2.9 1.6 4.5
2010 Total 27.1 14.6 0.8 42.5 3.1 1.6 4.7
Note: Totals may not add due to the rounding effects. ‘Emps’: Employees
In 2010, Opex comprised the majority (90%) of the total environmental expenditure by the Repair and
Installation sector. For larger companies, the majority of this spend was on in-house processes,
whereas smaller companies spent a greater proportion on external services.
Whilst larger companies led on capital spending in 2010, a similar balance in terms of greater end-of-
pipe activities versus integrated solutions was seen across the board.
Environmental Expenditure by Media
Environmental expenditure by media for the Repair and Installation sector is shown in Figure 5.57. In
2010, the three areas of greatest spend were water, solid waste and ‘other’ environmental protection
measures. Approximately £19 million was spent on water protection measures, with over half spent on
in-house measures. Whereas the £11 million spent on solid waste was concentrated on external
costs. As with water, in-house costs contributed the most to the £9 million spent on ‘other’
environmental protection expenditure.
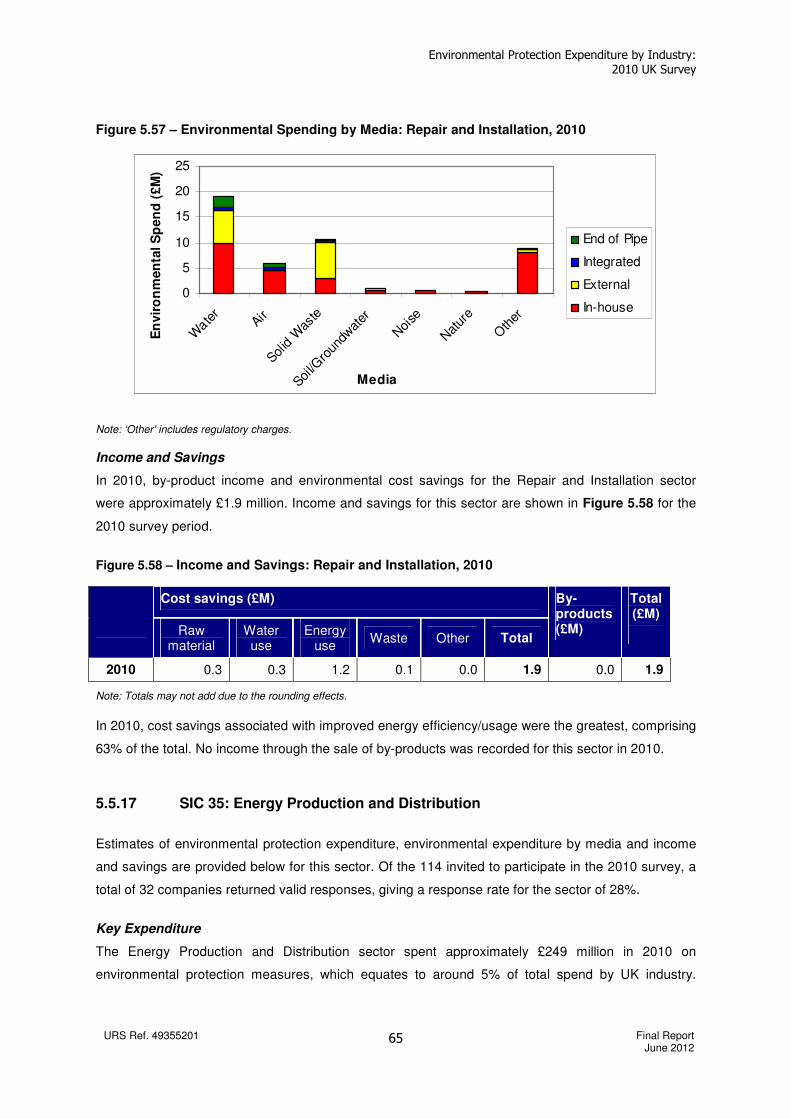
Environmental Protection Expenditure by Industry: 2010 UK Survey
URS Ref. 49355201 Final Report June 2012
65
Figure 5.57 – Environmental Spending by Media: Repair and Installation, 2010
0
5
10
15
20
25
Wate
rAir
Solid W
aste
Soil/G
roun
dwat
er
Noi
se
Nat
ure
Oth
er
Media
En
vir
on
men
tal S
pen
d (
£M
)
End of Pipe
Integrated
External
In-house
Note: ‘Other’ includes regulatory charges.
Income and Savings
In 2010, by-product income and environmental cost savings for the Repair and Installation sector
were approximately £1.9 million. Income and savings for this sector are shown in Figure 5.58 for the
2010 survey period.
Figure 5.58 – Income and Savings: Repair and Installation, 2010
Note: Totals may not add due to the rounding effects.
In 2010, cost savings associated with improved energy efficiency/usage were the greatest, comprising
63% of the total. No income through the sale of by-products was recorded for this sector in 2010.
5.5.17 SIC 35: Energy Production and Distribution
Estimates of environmental protection expenditure, environmental expenditure by media and income
and savings are provided below for this sector. Of the 114 invited to participate in the 2010 survey, a
total of 32 companies returned valid responses, giving a response rate for the sector of 28%.
Key Expenditure
The Energy Production and Distribution sector spent approximately £249 million in 2010 on
environmental protection measures, which equates to around 5% of total spend by UK industry.
Cost savings (£M)
Raw
material Water use
Energy use
Waste Other Total
By-products (£M)
Total (£M)
2010 0.3 0.3 1.2 0.1 0.0 1.9 0.0 1.9
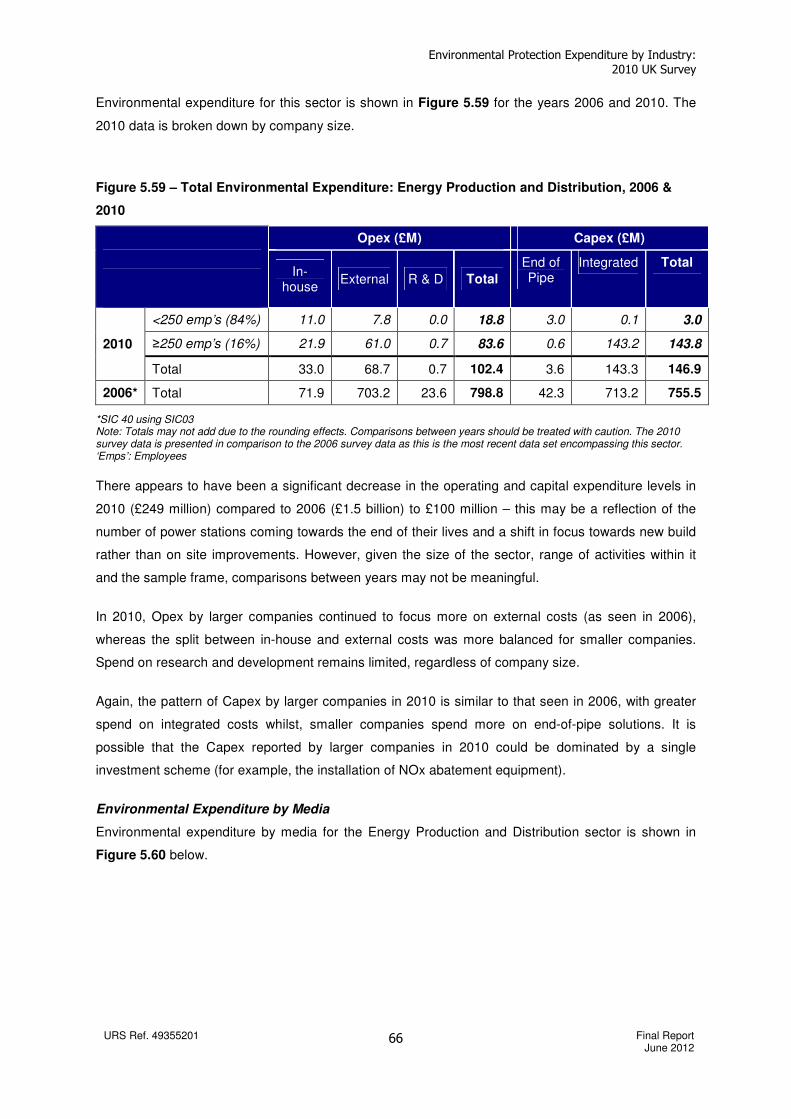
Environmental Protection Expenditure by Industry: 2010 UK Survey
URS Ref. 49355201 Final Report June 2012
66
Environmental expenditure for this sector is shown in Figure 5.59 for the years 2006 and 2010. The
2010 data is broken down by company size.
Figure 5.59 – Total Environmental Expenditure: Energy Production and Distribution, 2006 &
2010
Opex (£M) Capex (£M)
In-house
External R & D Total
End of Pipe
Integrated Total
<250 emp’s (84%) 11.0 7.8 0.0 18.8 3.0 0.1 3.0
≥250 emp’s (16%) 21.9 61.0 0.7 83.6 0.6 143.2 143.8 2010
Total 33.0 68.7 0.7 102.4 3.6 143.3 146.9
2006* Total 71.9 703.2 23.6 798.8 42.3 713.2 755.5
*SIC 40 using SIC03 Note: Totals may not add due to the rounding effects. Comparisons between years should be treated with caution. The 2010 survey data is presented in comparison to the 2006 survey data as this is the most recent data set encompassing this sector. ‘Emps’: Employees
There appears to have been a significant decrease in the operating and capital expenditure levels in
2010 (£249 million) compared to 2006 (£1.5 billion) to £100 million – this may be a reflection of the
number of power stations coming towards the end of their lives and a shift in focus towards new build
rather than on site improvements. However, given the size of the sector, range of activities within it
and the sample frame, comparisons between years may not be meaningful.
In 2010, Opex by larger companies continued to focus more on external costs (as seen in 2006),
whereas the split between in-house and external costs was more balanced for smaller companies.
Spend on research and development remains limited, regardless of company size.
Again, the pattern of Capex by larger companies in 2010 is similar to that seen in 2006, with greater
spend on integrated costs whilst, smaller companies spend more on end-of-pipe solutions. It is
possible that the Capex reported by larger companies in 2010 could be dominated by a single
investment scheme (for example, the installation of NOx abatement equipment).
Environmental Expenditure by Media
Environmental expenditure by media for the Energy Production and Distribution sector is shown in
Figure 5.60 below.
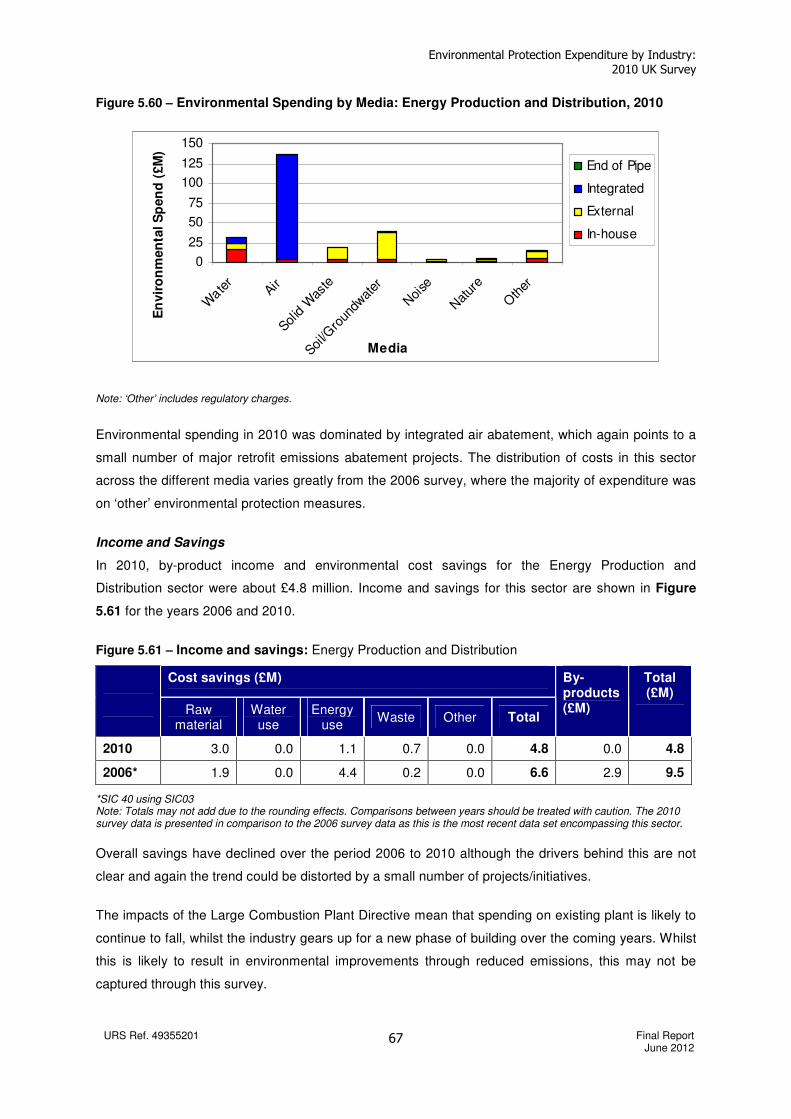
Environmental Protection Expenditure by Industry: 2010 UK Survey
URS Ref. 49355201 Final Report June 2012
67
Figure 5.60 – Environmental Spending by Media: Energy Production and Distribution, 2010
0
25
50
75
100
125
150
Wate
rAir
Solid W
aste
Soil/G
roun
dwat
er
Noi
se
Nat
ure
Oth
er
Media
En
vir
on
men
tal S
pen
d (
£M
)End of Pipe
Integrated
External
In-house
Note: ‘Other’ includes regulatory charges.
Environmental spending in 2010 was dominated by integrated air abatement, which again points to a
small number of major retrofit emissions abatement projects. The distribution of costs in this sector
across the different media varies greatly from the 2006 survey, where the majority of expenditure was
on ‘other’ environmental protection measures.
Income and Savings
In 2010, by-product income and environmental cost savings for the Energy Production and
Distribution sector were about £4.8 million. Income and savings for this sector are shown in Figure
5.61 for the years 2006 and 2010.
Figure 5.61 – Income and savings: Energy Production and Distribution
Cost savings (£M)
Raw
material Water use
Energy use
Waste Other Total
By-products (£M)
Total (£M)
2010 3.0 0.0 1.1 0.7 0.0 4.8 0.0 4.8
2006* 1.9 0.0 4.4 0.2 0.0 6.6 2.9 9.5
*SIC 40 using SIC03 Note: Totals may not add due to the rounding effects. Comparisons between years should be treated with caution. The 2010 survey data is presented in comparison to the 2006 survey data as this is the most recent data set encompassing this sector.
Overall savings have declined over the period 2006 to 2010 although the drivers behind this are not
clear and again the trend could be distorted by a small number of projects/initiatives.
The impacts of the Large Combustion Plant Directive mean that spending on existing plant is likely to
continue to fall, whilst the industry gears up for a new phase of building over the coming years. Whilst
this is likely to result in environmental improvements through reduced emissions, this may not be
captured through this survey.
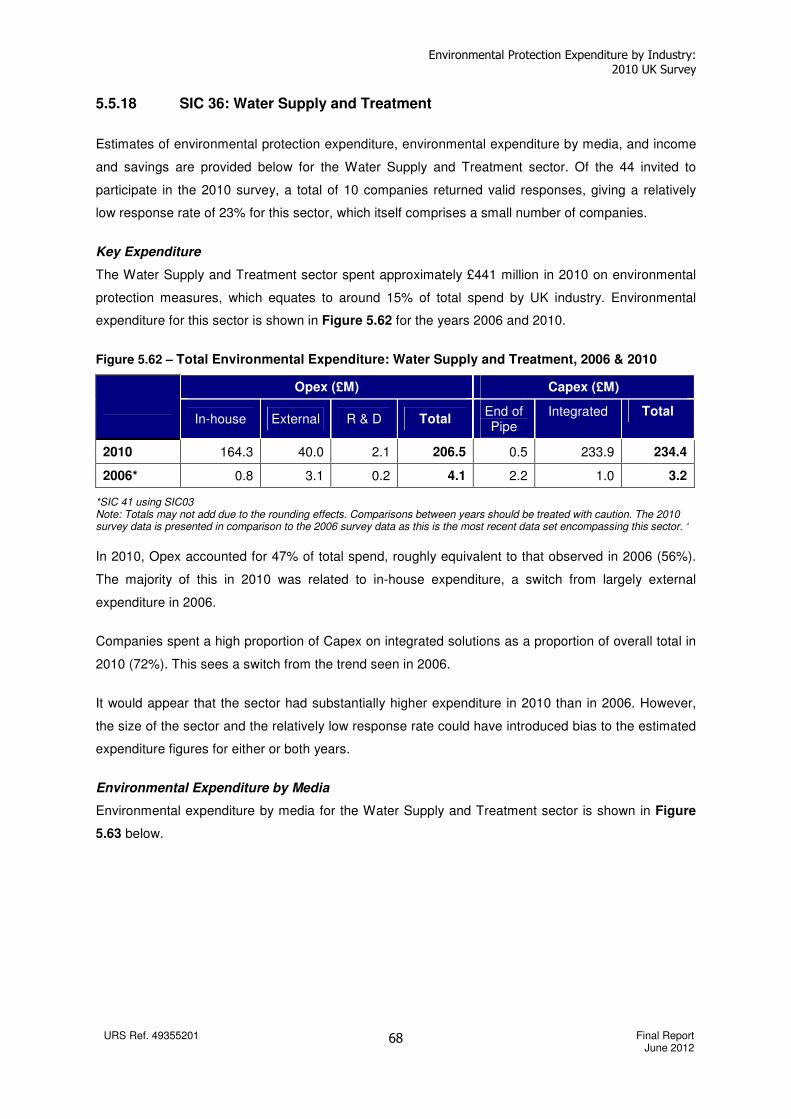
Environmental Protection Expenditure by Industry: 2010 UK Survey
URS Ref. 49355201 Final Report June 2012
68
5.5.18 SIC 36: Water Supply and Treatment
Estimates of environmental protection expenditure, environmental expenditure by media, and income
and savings are provided below for the Water Supply and Treatment sector. Of the 44 invited to
participate in the 2010 survey, a total of 10 companies returned valid responses, giving a relatively
low response rate of 23% for this sector, which itself comprises a small number of companies.
Key Expenditure
The Water Supply and Treatment sector spent approximately £441 million in 2010 on environmental
protection measures, which equates to around 15% of total spend by UK industry. Environmental
expenditure for this sector is shown in Figure 5.62 for the years 2006 and 2010.
Figure 5.62 – Total Environmental Expenditure: Water Supply and Treatment, 2006 & 2010
Opex (£M) Capex (£M)
In-house External R & D Total
End of Pipe
Integrated Total
2010 164.3 40.0 2.1 206.5 0.5 233.9 234.4
2006* 0.8 3.1 0.2 4.1 2.2 1.0 3.2
*SIC 41 using SIC03 Note: Totals may not add due to the rounding effects. Comparisons between years should be treated with caution. The 2010 survey data is presented in comparison to the 2006 survey data as this is the most recent data set encompassing this sector. ‘
In 2010, Opex accounted for 47% of total spend, roughly equivalent to that observed in 2006 (56%).
The majority of this in 2010 was related to in-house expenditure, a switch from largely external
expenditure in 2006.
Companies spent a high proportion of Capex on integrated solutions as a proportion of overall total in
2010 (72%). This sees a switch from the trend seen in 2006.
It would appear that the sector had substantially higher expenditure in 2010 than in 2006. However,
the size of the sector and the relatively low response rate could have introduced bias to the estimated
expenditure figures for either or both years.
Environmental Expenditure by Media
Environmental expenditure by media for the Water Supply and Treatment sector is shown in Figure
5.63 below.

Environmental Protection Expenditure by Industry: 2010 UK Survey
URS Ref. 49355201 Final Report June 2012
69
5.63 – Environmental Spending by Media: Water Supply and Treatment, 2010
0
50
100
150
200
250
Wate
rAir
Solid W
aste
Soil/G
roun
dwat
er
Noi
se
Nat
ure
Oth
er
Media
En
vir
on
men
tal S
pen
d (
£M
)End of Pipe
Integrated
External
In-house
Note: ‘Other’ includes regulatory charges.
The sector spent approximately £231 million on solid waste management and disposal in 2010, which
is mainly accounted for by in-house and integrated processes. Waste water treatment costs are not
encompassed in these figures as costs associated with such protection measures are captured within
individual company’s returns as payments to water service companies for sewage and water
treatment.
The high proportion of in-house expenditure in 2010 may reflect the larger size of companies in the
sector, as these are more likely to have the resources and skills to deliver internal solutions for
environmental protection.
Income and Savings
In 2010, total by-product income and environmental cost savings for the Water Supply and Treatment
was £7.4 million. Income and savings for this sector are shown in Figure 5.64 for the years 2006 and
2010.
Figure 5.64 – Income and Savings: Water Supply and Treatment, 2006 & 2010
Cost savings (£M)
Raw material
Water use
Energy use
Waste Other Total
By-products
(£M)
Total (£M)
2010 0.0 0.0 2.5 0.0 0.0 2.5 4.9 7.4
2006* 0.0 0.0 0.2 0.0 0.0 0.3 0.0 0.3
*SIC 41 using SIC03 Note: Totals may not add due to the rounding effects. Comparisons between years should be treated with caution. The 2010 survey data is presented in comparison to the 2006 survey data as this is the most recent data set encompassing this sector.
As with total expenditure, by-product revenue and cost savings for the sector in 2010 were
substantially higher than in 2006. Savings on energy use made in 2010 were 0.6% of overall
expenditure compared to 4% of overall expenditure in 2006.
Environmental Protection Expenditure by Industry: 2010 UK Survey
URS Ref. 49355201 Final Report June 2012
70
Whilst the energy cost savings may be in response to an increase in targeted measures to improve
energy efficiency and usage, it is interesting to note that the revenue from by-product sales has also
increased substantially.
It is possible that the size of the sector and the relatively low response rate have introduced bias to
the estimated income and savings figures for either or both years. The data may also be skewed by
the larger companies responding to the 2010 survey.
Environmental Protection Expenditure by Industry: 2010 UK Survey
URS Ref. 49355201 Final Report June 2012
71
5.7 DRIVERS FOR CAPITAL EXPENDITURE
Approximately 28% of responding companies listed at least one reason for their capital expenditure in
the 2010 survey (655 companies in total). Regardless of company size, the most common drivers
described were compliance with environmental regulation/legislation (55%), and equipment upgrades
(20%). This mirrors the primary Capex drivers reported in previous years.
Owner or parent company corporate responsibility policy was cited by 12% of companies as the primary
driver behind their capital expenditure, whilst environmental taxes and greenhouse gas emission
reduction were given as a reason by 3% and 4% of companies respectively. ‘Other’ reasons were given
by 7% of companies and included expenditure to reduce waste production, and to implement an EMS.
For the large majority of sectors, regulatory compliance was cited as the main driver behind capital
expenditure in 2010. A notable exception was the Non-Metallic Minerals sector, where equipment
upgrade was the main driver for the majority of companies.
Whilst there are some differences between sectors in terms of the primary drivers for capital
expenditure, it is should be noted that there is a potential for simple random variation within the sample
frame to impact findings, especially where sectors comprise a limited number of companies and/or have
had a relatively low survey response rate.
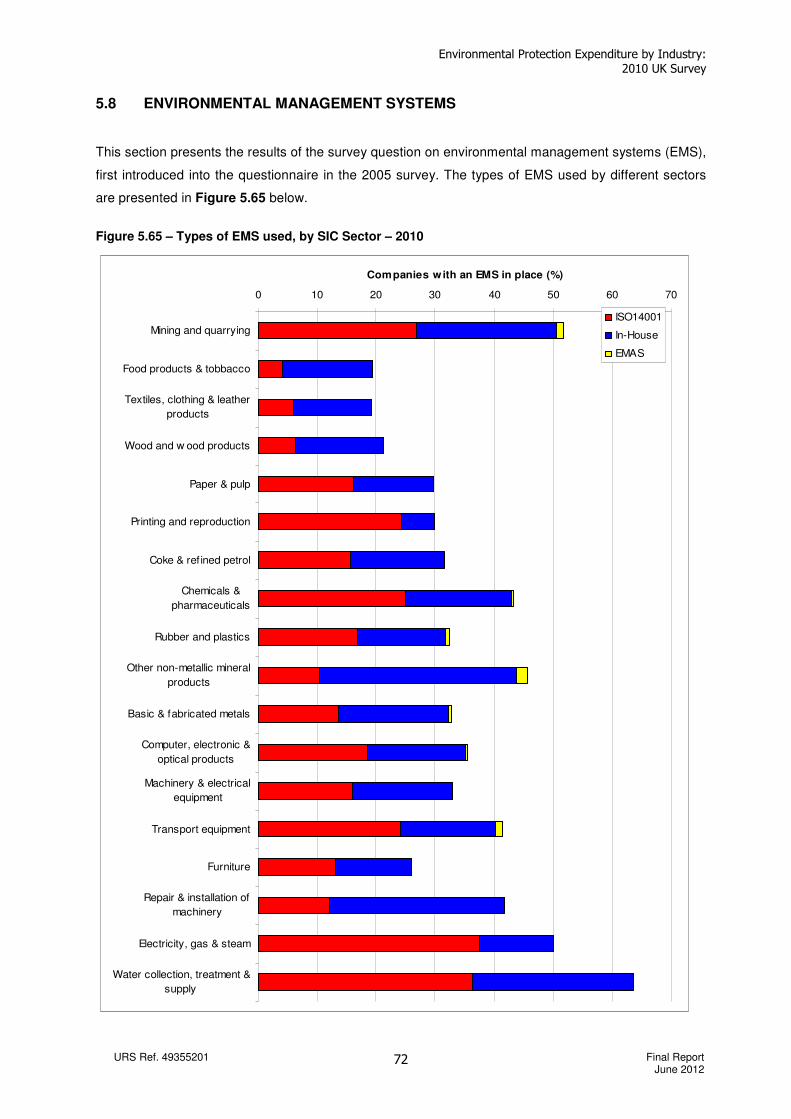
Environmental Protection Expenditure by Industry: 2010 UK Survey
URS Ref. 49355201 Final Report June 2012
72
5.8 ENVIRONMENTAL MANAGEMENT SYSTEMS
This section presents the results of the survey question on environmental management systems (EMS),
first introduced into the questionnaire in the 2005 survey. The types of EMS used by different sectors
are presented in Figure 5.65 below.
Figure 5.65 – Types of EMS used, by SIC Sector – 2010
0 10 20 30 40 50 60 70
Mining and quarrying
Food products & tobbacco
Textiles, clothing & leather
products
Wood and w ood products
Paper & pulp
Printing and reproduction
Coke & refined petrol
Chemicals &
pharmaceuticals
Rubber and plastics
Other non-metallic mineral
products
Basic & fabricated metals
Computer, electronic &
optical products
Machinery & electrical
equipment
Transport equipment
Furniture
Repair & installation of
machinery
Electricity, gas & steam
Water collection, treatment &
supply
Companies with an EMS in place (%)
ISO14001
In-House
EMAS
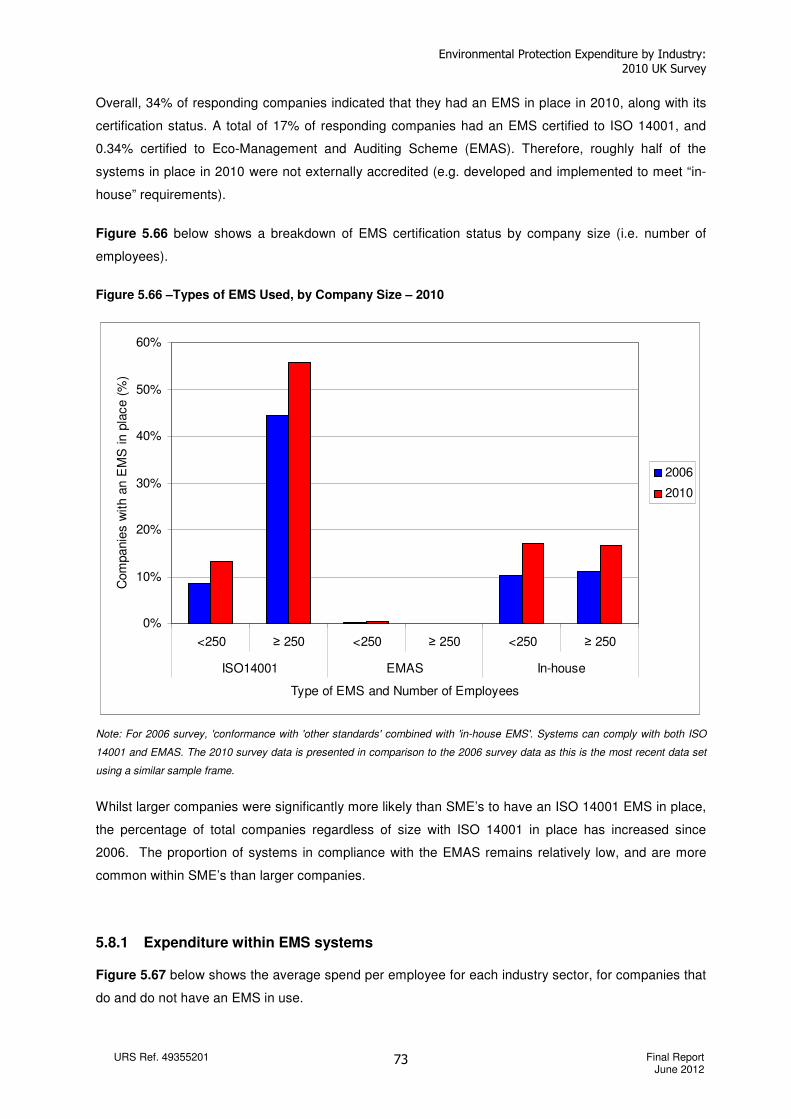
Environmental Protection Expenditure by Industry: 2010 UK Survey
URS Ref. 49355201 Final Report June 2012
73
Overall, 34% of responding companies indicated that they had an EMS in place in 2010, along with its
certification status. A total of 17% of responding companies had an EMS certified to ISO 14001, and
0.34% certified to Eco-Management and Auditing Scheme (EMAS). Therefore, roughly half of the
systems in place in 2010 were not externally accredited (e.g. developed and implemented to meet “in-
house” requirements).
Figure 5.66 below shows a breakdown of EMS certification status by company size (i.e. number of
employees).
Figure 5.66 –Types of EMS Used, by Company Size – 2010
0%
10%
20%
30%
40%
50%
60%
<250 ≥ 250 <250 ≥ 250 <250 ≥ 250
ISO14001 EMAS In-house
Type of EMS and Number of Employees
Com
panie
s w
ith a
n E
MS
in p
lace (
%)
2006
2010
Note: For 2006 survey, 'conformance with 'other standards' combined with 'in-house EMS'. Systems can comply with both ISO
14001 and EMAS. The 2010 survey data is presented in comparison to the 2006 survey data as this is the most recent data set
using a similar sample frame.
Whilst larger companies were significantly more likely than SME’s to have an ISO 14001 EMS in place,
the percentage of total companies regardless of size with ISO 14001 in place has increased since
2006. The proportion of systems in compliance with the EMAS remains relatively low, and are more
common within SME’s than larger companies.
5.8.1 Expenditure within EMS systems
Figure 5.67 below shows the average spend per employee for each industry sector, for companies that
do and do not have an EMS in use.
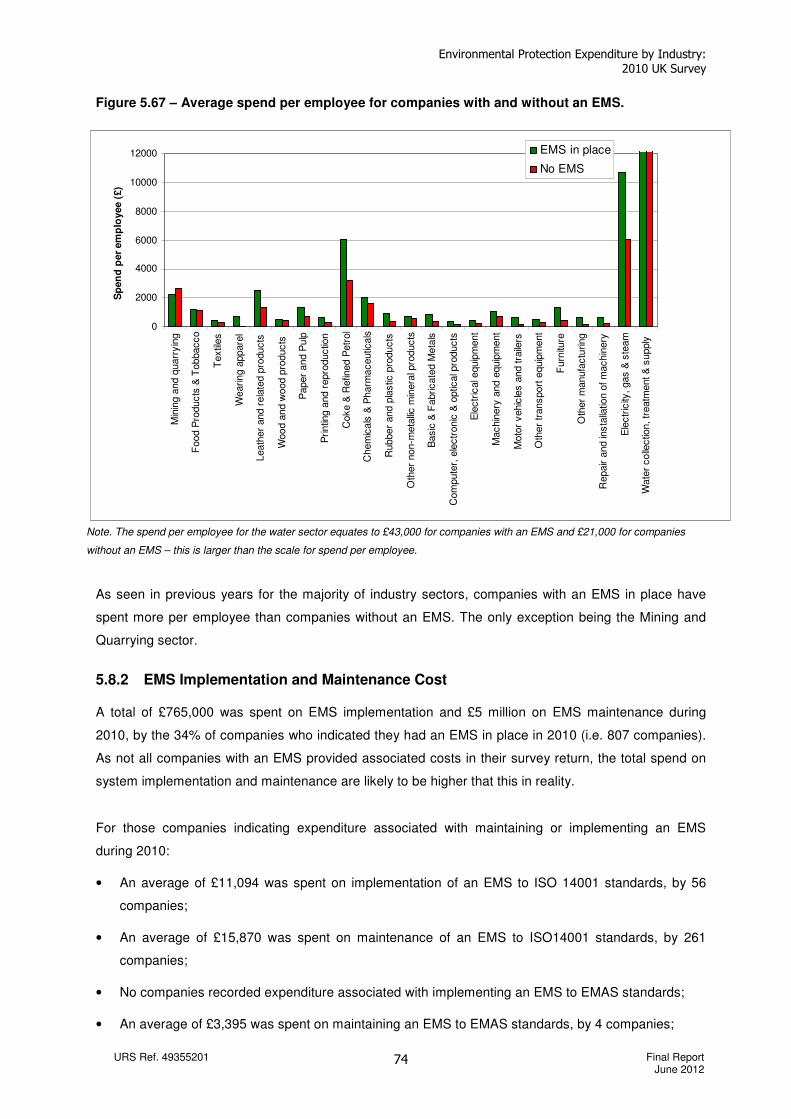
Environmental Protection Expenditure by Industry: 2010 UK Survey
URS Ref. 49355201 Final Report June 2012
74
Figure 5.67 – Average spend per employee for companies with and without an EMS.
0
2000
4000
6000
8000
10000
12000
Min
ing a
nd q
uarr
yin
g
Food P
roducts
& T
obbacco
Textil
es
Wearin
g a
ppare
l
Leath
er
and r
ela
ted p
roducts
Woo
d a
nd w
ood p
roduc
ts
Paper
and P
ulp
Prin
ting a
nd r
epro
ductio
n
Coke &
Refin
ed P
etr
ol
Chem
ica
ls &
Pharm
aceutic
als
Rubbe
r and p
lastic
pro
du
cts
Oth
er
non-m
eta
llic m
inera
l pro
ducts
Basic
& F
abricate
d M
eta
ls
Com
pute
r, e
lectr
onic
& o
ptic
al p
roducts
Ele
ctr
ical e
quip
ment
Machin
ery
and e
quip
ment
Moto
r vehic
les a
nd tra
ilers
Oth
er
trans
port
equip
ment
Furn
iture
Oth
er
manufa
ctu
ring
Repair a
nd in
sta
llatio
n o
f m
achin
ery
Ele
ctr
icity
, gas &
ste
am
Wa
ter
co
llectio
n, tr
eatm
ent &
supply
Sp
en
d p
er
em
plo
yee (
£)
EMS in place
No EMS
Note. The spend per employee for the water sector equates to £43,000 for companies with an EMS and £21,000 for companies
without an EMS – this is larger than the scale for spend per employee.
As seen in previous years for the majority of industry sectors, companies with an EMS in place have
spent more per employee than companies without an EMS. The only exception being the Mining and
Quarrying sector.
5.8.2 EMS Implementation and Maintenance Cost
A total of £765,000 was spent on EMS implementation and £5 million on EMS maintenance during
2010, by the 34% of companies who indicated they had an EMS in place in 2010 (i.e. 807 companies).
As not all companies with an EMS provided associated costs in their survey return, the total spend on
system implementation and maintenance are likely to be higher that this in reality.
For those companies indicating expenditure associated with maintaining or implementing an EMS
during 2010:
• An average of £11,094 was spent on implementation of an EMS to ISO 14001 standards, by 56
companies;
• An average of £15,870 was spent on maintenance of an EMS to ISO14001 standards, by 261
companies;
• No companies recorded expenditure associated with implementing an EMS to EMAS standards;
• An average of £3,395 was spent on maintaining an EMS to EMAS standards, by 4 companies;
Environmental Protection Expenditure by Industry: 2010 UK Survey
URS Ref. 49355201 Final Report June 2012
75
• An average of £5,120 was spent on implementation of an EMS to in-house specifications, by 28
companies; and
• An average of £8,710 was spent on maintenance of an EMS to in-house specifications/standards,
by 99 companies.
In 2010, annual maintenance costs were, on average, greater than those for implementation. Whilst a
number of companies with an EMS did not record their expenditure on the returned questionnaire, it is
considered likely that this trend is correct, as it reflects that observed in previous years.
Environmental Protection Expenditure by Industry: 2010 UK Survey
URS Ref. 49355201 Final Report June 2012
76
6 RECOMMENDATIONS FOR FUTURE SURVEY
The following section provides recommendations for subsequent surveys based on the experience of
the URS project team in conducting the study, and feedback received during the 2010 survey process.
The main sources of feedback were phone calls made by companies to the Survey Helpdesk, and
phone calls made by the URS project team during Top Company follow-up and during data validation.
Useful feedback was also obtained from comments made within returned questionnaires, and letters
from companies to the Helpdesk to indicate non-participation. All such feedback was recorded in the
survey database.
Recommendations for future surveys comprise:
Response Rates
• When looking at the response rate over the survey period, there are three clear peaks of activity:
1. In the first couple of weeks after the survey was initially sent out.
2. Between the fifth and seventh weeks of the survey period following the issue of a reminder
letter.
3. Around the eleventh and twelfth weeks following some 390 calls made to Top Companies
over the preceding two-week period.
Based on these peaks of return activity and the high response rate for the 2010 survey overall, it is
recommended that a similar strategy concerning the timing of reminder letter dispatch and the
timing and number of Top Company Calls is carried forward for future surveys.
• The reason behind the effectiveness of the reminder letters in increasing the response rate appears
twofold:
1. They act as a prompt for companies who may have put the questionnaire aside;
2. They act as a prompt for other companies to contact the Helpdesk, for instance where the
original survey did not reach the most appropriate person. This allowed the Helpdesk to
obtain the correct contact details and provided an opportunity to encourage the company to
complete and return the questionnaire.
Based on the latter and the high response rate for the 2010 survey overall, it is recommended that
similar reminder letters are used in future surveys.
• In previous years, a reminder postcard was issued following the reminder letter. However, the
postcard was not issued during the 2010 survey, as the response rate was already high and it was
felt that a combination of the follow up calls would provide a more targeted and efficient method of
eliciting responses. As the final response rate for the 2010 survey was greater than in previous
Environmental Protection Expenditure by Industry: 2010 UK Survey
URS Ref. 49355201 Final Report June 2012
77
years, it is recommended that future surveys should follow a similar pragmatic approach to the
issuing of reminder postcards, based on the response rate at that time.
Questionnaire Availability
• A digital version of the questionnaire was available via the Defra website for download by
participating companies. Where companies contacted the Helpdesk for an additional copy of the
questionnaire, they were in the first instance directed to the Defra website. It is recommended that
this approach is carried forward in future surveys, so as to minimise the number of hard copies re-
sent by post.
Survey Benefits
• As in previous years, larger companies have reported more logistical issues such as the co-
ordination of all the data from various sites, whilst smaller companies tend to question the
relevance of the questionnaire to their company and seek assistance with technical questions.
Further promotion of the benefits of collecting such data will improve the response rate both
through encouraging better data collation at a company level and secondly through providing a
business case for completing the questionnaire. This can be done through the initial mail out
material and also through the website text. This is particularly important in the current economic
climate when cut backs are being made across industry.
Survey Sample
• As recommended in the 2009 survey report, the electricity and gas (SIC 35) and water (SIC 36)
sectors were segregated for the 2010 survey. Due to the different nature of companies in these
groupings, this allowed more meaningful analysis to be conducted and it is recommended that this
is repeated in subsequent surveys where the number of returns allows.
Validation Process
• It is recommended that, where possible, the validation process is carried out as soon as the data
are entered for each company. This enables companies to remember their responses and minimise
the changes in personnel responsible between submitting the survey and being called for validation
checks.
Environmental Protection Expenditure by Industry: 2010 UK Survey
URS Ref. 49355201 Final Report June 2012
78
LIST OF ACCRONYMS
Acronym
Capex Capital Expenditure
Defra Department for Environment, Food and Rural Affairs
EMS Environmental Management System
EU European Union
IDBR Inter Departmental Business Register
IPPC Integrated Pollution Prevention and Control
NACE Nomenclature Générale des Activités Economiques dans les Communautés Européennes
ONS Office for National Statistics
Opex Operating Expenditure
SIC Standard Industrial Classification
SMEs Small or Medium Sized Enterprises
TGN Technical Guidance Notes
URS URS Infrastructure & Environnent UK Limited
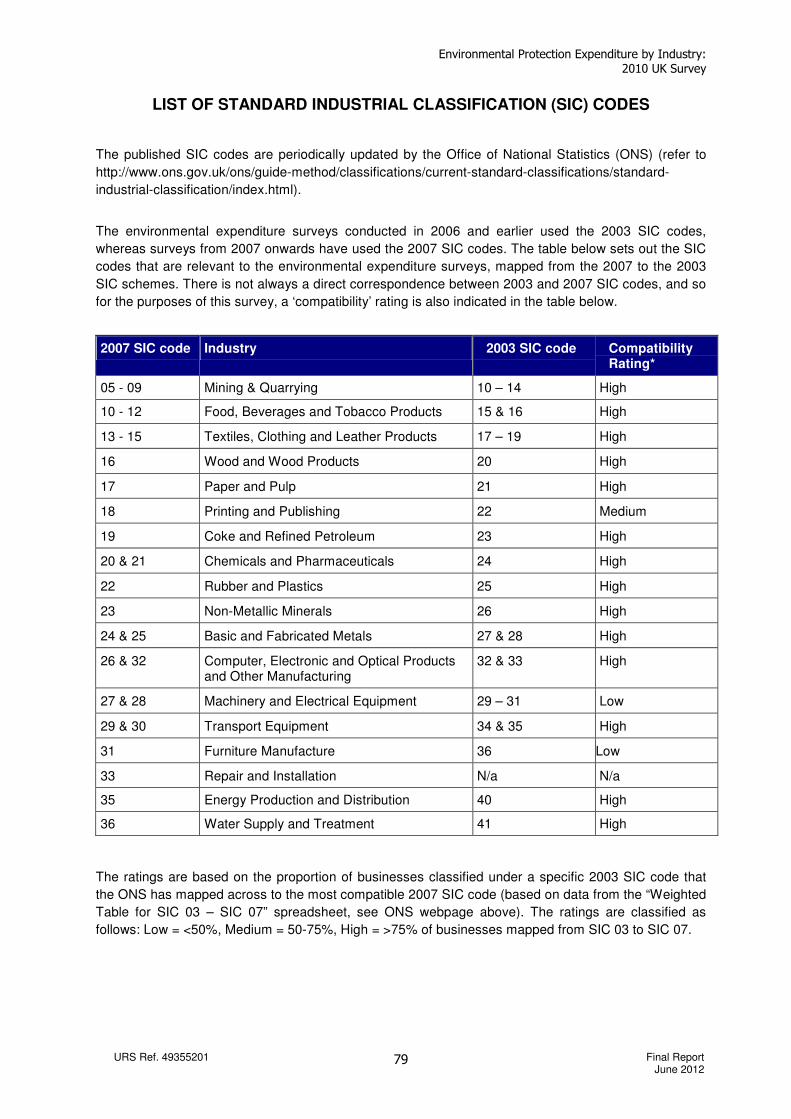
Environmental Protection Expenditure by Industry: 2010 UK Survey
URS Ref. 49355201 Final Report June 2012
79
LIST OF STANDARD INDUSTRIAL CLASSIFICATION (SIC) CODES
The published SIC codes are periodically updated by the Office of National Statistics (ONS) (refer to
http://www.ons.gov.uk/ons/guide-method/classifications/current-standard-classifications/standard-
industrial-classification/index.html).
The environmental expenditure surveys conducted in 2006 and earlier used the 2003 SIC codes,
whereas surveys from 2007 onwards have used the 2007 SIC codes. The table below sets out the SIC
codes that are relevant to the environmental expenditure surveys, mapped from the 2007 to the 2003
SIC schemes. There is not always a direct correspondence between 2003 and 2007 SIC codes, and so
for the purposes of this survey, a ‘compatibility’ rating is also indicated in the table below.
2007 SIC code Industry 2003 SIC code Compatibility Rating*
05 - 09 Mining & Quarrying 10 – 14 High
10 - 12 Food, Beverages and Tobacco Products 15 & 16 High
13 - 15 Textiles, Clothing and Leather Products 17 – 19 High
16 Wood and Wood Products 20 High
17 Paper and Pulp 21 High
18 Printing and Publishing 22 Medium
19 Coke and Refined Petroleum 23 High
20 & 21 Chemicals and Pharmaceuticals 24 High
22 Rubber and Plastics 25 High
23 Non-Metallic Minerals 26 High
24 & 25 Basic and Fabricated Metals 27 & 28 High
26 & 32 Computer, Electronic and Optical Products and Other Manufacturing
32 & 33 High
27 & 28 Machinery and Electrical Equipment 29 – 31 Low
29 & 30 Transport Equipment 34 & 35 High
31 Furniture Manufacture 36 Low
33 Repair and Installation N/a N/a
35 Energy Production and Distribution 40 High
36 Water Supply and Treatment 41 High
The ratings are based on the proportion of businesses classified under a specific 2003 SIC code that
the ONS has mapped across to the most compatible 2007 SIC code (based on data from the “Weighted
Table for SIC 03 – SIC 07” spreadsheet, see ONS webpage above). The ratings are classified as
follows: Low = <50%, Medium = 50-75%, High = >75% of businesses mapped from SIC 03 to SIC 07.