Environmental Overview Complete Life Cycle Assessment … - GPI2010 - compressed.pdf ·...
11
E n v i r o n me n t a l O v e rv i e w C o mp l e t e L i f e C y c l e A ss e ss me n t o f No r t h A me r i ca n C o n t a i n e r G l a ss
Transcript of Environmental Overview Complete Life Cycle Assessment … - GPI2010 - compressed.pdf ·...
Environmental OverviewComplete Life Cycle Assessment of North American Container Glass
Cradle-to-Cradle: The Complete Life Cycle Assessment of North American Container Glass
Glass is the only food and beverage packaging material that is endlessly recyclable back to its original use. Made from all-natural resources—sand, soda ash, limestone, and recycled glass—and with a 400-year history in the Americanmarketplace, glass has been and continues to be a safe container. While it is an established industry, glass containermanufacturers have never rested in their efforts to enhance sustainable practices by finding new ways to reduce energy,waste and water usage in production and distribution practices. Now the North American glass industry is taking apioneering step in producing the first complete and thorough cradle-to-cradle life cycle assessment (LCA) ever conductedby any food and beverage packaging industry.
While policymakers, industry and the public are all hungry for credible data, a good deal of confusion and skepticism hasbeen injected into the sustainability debate. This is particularly true regarding the life cycle assessment methods used today.Such assessments vary greatly in their scope and approach, making it difficult to accurately and objectively compare onepackaging material with that of another.
That is why, to address current LCA shortcomings, the glass container industry reached out to the leading global consultingfirm and software provider specializing in sustainability — PE Americas. Not only were all established scientific protocolsadhered to by PE Americas, but a top independent scientific panel was recurred to observe methodologies and peerreviewed the findings. In addition, unlike many food and beverage packaging LCAs, this report examines the impact ofevery stage in the life cycle of glass containers, from raw material extraction to end-use.
The industry took the position that since the Earth is a closed-loop environment only a closed looped or cradle-to-cradleLCA can accurately reveal the whole picture and measure the carbon footprint of any industry. These findings provide keynew insights into glass packaging’s environmental profile. The cradle-to-cradle LCA is one very important element to befully considered by policy makers, industry and the public as they pursue greater understanding of sustainable packaging.However, even this LCA is not the end of the glass story. There are many areas that an LCA is not designed to study andwhere glass excels for both the consumer and the environment, such as not leaching toxins into our food and beverages,maintaining the flavor and shelf-life of food and beverages longer than any other commercial container; and the intrinsic“image” and “trust” glass holds with consumers.
Today, by establishing a high standard of environmental accountability, this cradle-to-cradle LCA represents anunprecedented step forward in the packaging industry. We hope other consumer packaging industries will join us in ourcommitment to clarity and completeness.
Joseph J. CattaneoPresidentGlass Packaging Institute (GPI)
2 Cradle-to-Cradle Life Cycle Assessment of North American Container Glass
The Glass Packaging Institute | 2010 3
The Glass Packaging Institute (GPI) complete life cycleassessment (LCA) represents the most comprehensivecollection of data and analysis ever conducted on theenvironmental impact of the glass container industry inNorth America. The research collected data from 105furnaces representing 75 percent of North American glasscontainer production. The North American glasscontainer industry creates glass containers for wines,beers, foods, jams, condiments, spirits, non-alcoholicbeverages, and cosmetics.
GPI container manufacturers provided current life cycleinventory data on container glass production for thisstudy. The study was conducted in parallel with a studyfor the European Container Glass Federation (FEVE)and its member companies. This approach generated aninternationally comprehensive set of data on theproduction of container glass. The methods employed indeveloping the life cycle impacts are comparablebetween the two studies, and life cycle assessment andglass experts conducted both studies according to strictISO 14040/44 guidelines; both studies also underwent arigorous critical independent peer review.
Life Cycle Assessments allow for analysis at various stagesof a product’s life cycle:
1) Gate-to-gate — focusing on one particular plant oroperation
2) Cradle-to-gate — gate-to-gate findings with theaddition of up-stream providers (mining of rawmaterials, processing and transportation); and
3) Cradle-to-grave —encompassing the entire linear lifecycle of the product from extraction through disposal.
4) Cradle-to-cradle —that includes the entire cradle-to-grave life cycle of the product with the addition ofrecycling the product back to its original purpose.
To obtain a clear and accurate picture of the entire lifecycle of container glass, the Glass Packaging Institute(GPI) chose to look at the results of the surveyed glassfurnaces in North America from a full cradle-to-cradleassessment.
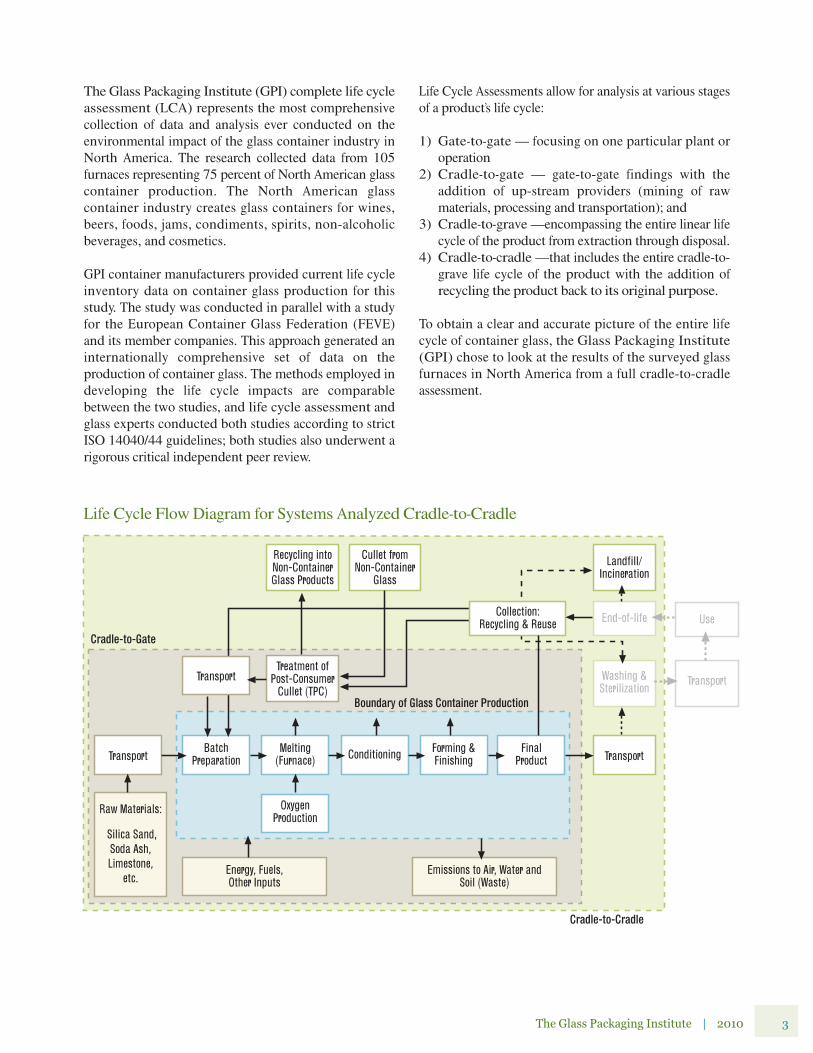
Life Cycle Flow Diagram for Systems Analyzed Cradle-to-Cradle
Recycling intoNon-ContainerGlass Products
Cullet fromNon-Container
Glass
Landfill/Incineration
End-of-life
Treatment ofPost-Consumer
Cullet (TPC)
BatchPreparation
Melting(Furnace) Conditioning Forming &
FinishingFinal
Product
OxygenProduction
Transport
Raw Materials:
Silica Sand,Soda Ash,Limestone,
etc.Energy, Fuels,Other Inputs
Emissions to Air, Water andSoil (Waste)
Transport
Washing &Sterilization
Use
Transport
Cradle-to-Cradle
Boundary of Glass Container Production
Cradle-to-Gate
Transport
Collection:Recycling & Reuse
The Whole Picture Measuring the Complete Life Cycle
Objectives of the StudiesGPI initiated the life cycle assessment process toestablish a clear understanding of the environmentalimpact of container glass at all stages of the life cycle, andto develop realistic and tangible targets for improvement.Other objectives included:
• Participating in and contributing to LCA discussionswith customers, distributors, retailers, industry,regulators and other stakeholders
• Engendering complete life cycle thinking in thepackaging industry
• Measuring the importance of recycling of glass in lifecycle analysis
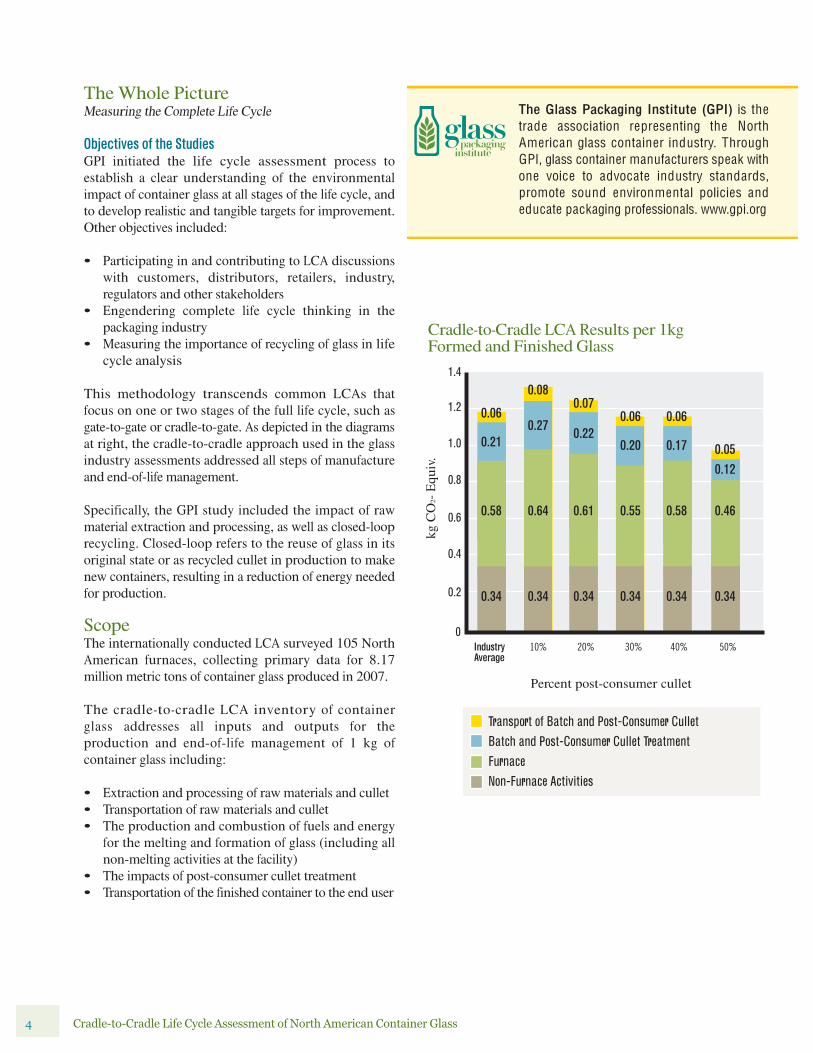
This methodology transcends common LCAs thatfocus on one or two stages of the full life cycle, such asgate-to-gate or cradle-to-gate. As depicted in the diagramsat right, the cradle-to-cradle approach used in the glassindustry assessments addressed all steps of manufactureand end-of-life management.
Specifically, the GPI study included the impact of rawmaterial extraction and processing, as well as closed-looprecycling. Closed-loop refers to the reuse of glass in itsoriginal state or as recycled cullet in production to makenew containers, resulting in a reduction of energy neededfor production.
ScopeThe internationally conducted LCA surveyed 105 NorthAmerican furnaces, collecting primary data for 8.17million metric tons of container glass produced in 2007.
The cradle-to-cradle LCA inventory of containerglass addresses all inputs and outputs for theproduction and end-of-life management of 1 kg ofcontainer glass including:
• Extraction and processing of raw materials and cullet• Transportation of raw materials and cullet• The production and combustion of fuels and energy
for the melting and formation of glass (including allnon-melting activities at the facility)
• The impacts of post-consumer cullet treatment • Transportation of the finished container to the end user
4 Cradle-to-Cradle Life Cycle Assessment of North American Container Glass
The Glass Packaging Institute (GPI) is thetrade association representing the NorthAmerican glass container industry. ThroughGPI, glass container manufacturers speak withone voice to advocate industry standards,promote sound environmental policies andeducate packaging professionals. www.gpi.org
0.06
0.21
0.58
0.34
1.4
1.2
1.0
0.8
0.6
0.4
0.2
0
kg C
O2-
Equ
iv.
Transport of Batch and Post-Consumer CulletBatch and Post-Consumer Cullet TreatmentFurnaceNon-Furnace Activities
IndustryAverage
0.08
0.27
0.64
0.34
10%
0.07
0.22
0.61
0.34
20%
0.06
0.20
0.55
0.34
30%
0.06
0.17
0.58
0.34
40%
0.050.12
0.46
0.34
50%
Percent post-consumer cullet
Cradle-to-Cradle LCA Results per 1kg Formed and Finished Glass
The Glass Packaging Institute | 2010 5
• Collection and different end-of-life managementoptions:
For glass packaging the following end-of-lifemanagement scenarios are considered:1. Closed-loop of glass packaging back to new
packaging 2. Recycling of glass packaging into non-
packaging products or fiberglass3. Losses via aggressive landfill cover, incineration
The cradle-to-cradle analysis addressed the environmentalimpacts of container glass recycling with the goal ofquantifying the effects.
Key FindingThe key environmental impacts and indicators studiedin the life cycle impact assessment were selected by GPI toaddress these key issue areas head-on with completenessand integrity. The indicators below reflect this commitment.
• Primary energy demand (PED) – the total fossil energyconsumed
• Global warming potential (GWP) – climate change
Overall, the increase of recovery and recycling results in adecrease of the primary energy demand (PED) and aneven greater decrease of global warming potential (GWP).The greater benefit for GWP is related to the fact that, in
addition to lower energy numbers, the CO2 emissionsalso decrease from the reduction of batch materials.
Through the use of cullet, the glass container industry isalready contributing to the savings of energyconsumption and the reduction of greenhouse gases(GHG) in manufacturing.
The environmental impact of recycling in this cradle-to-cradle scenario can have a demonstrable impact ongreenhouse gases. In base year 2007, the industry inNorth America produces 8.17 million metric tons offormed and finished glass, incorporating an averagepost-consumer recycle input rate of 23 percent (baselineyear 2007). This recycling effort saves 894-thousandmetric tons of CO2e (“e” equivalent number) from beingemitted, compared to using strictly virgin materials.
The key environmental impacts and indicator results:The impact in the manufacturing of glass containerscomes from the melting of glass in the furnace, followedby non-melting activities such as heating and cooling ofplants, compressors and finishing steps of the glasscontainers. This is followed by virgin material extractionand finally transportation of these materials. Meltingcontributes the largest percentage to each impactcategory considered, but the exact contribution varies byimpact category.
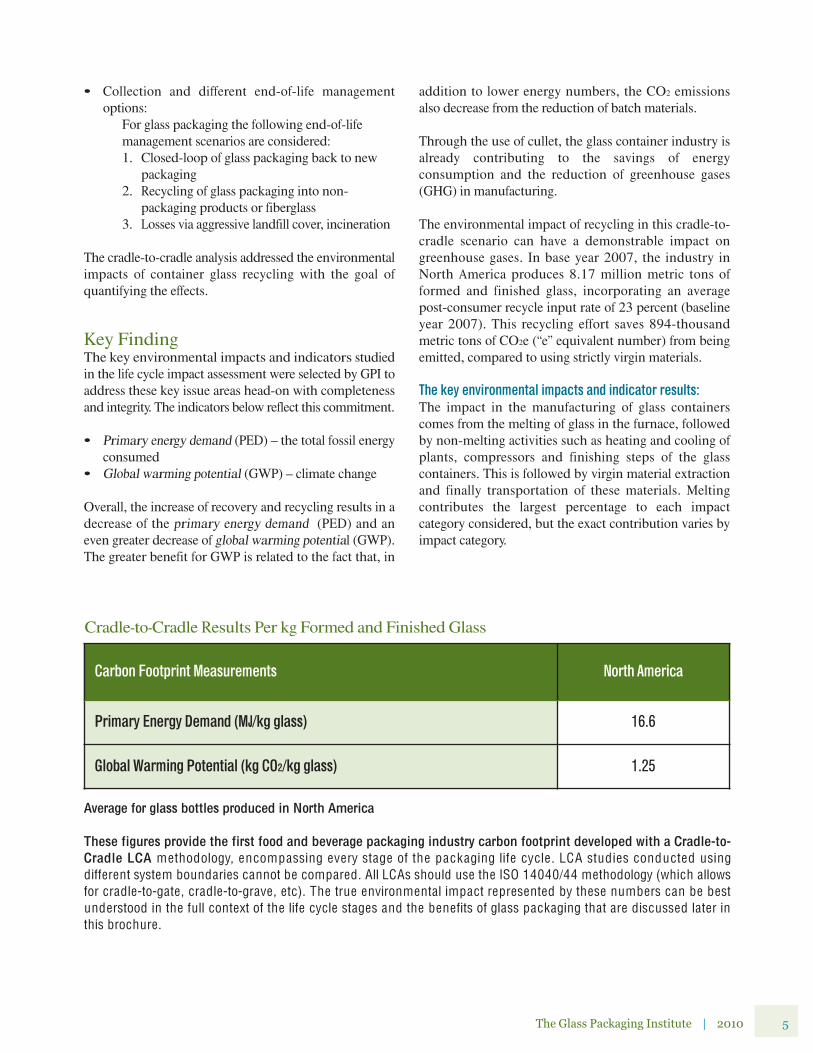
Carbon Footprint Measurements North America
Primary Energy Demand (MJ/kg glass) 16.6
Global Warming Potential (kg CO2/kg glass) 1.25
Cradle-to-Cradle Results Per kg Formed and Finished Glass
Average for glass bottles produced in North America
These figures provide the first food and beverage packaging industry carbon footprint developed with a Cradle-to-Cradle LCA methodology, encompassing every stage of the packaging life cyc le . LCA stud ies conducted usingdifferent system boundaries cannot be compared. All LCAs should use the ISO 14040/44 methodology (which allowsfor cradle-to-gate, cradle-to-grave, etc). The true environmental impact represented by these numbers can be bestunderstood in the full context of the life cycle stages and the benefits of glass packaging that are discussed later inthis brochure.
6 Cradle-to-Cradle Life Cycle Assessment of North American Container Glass
Key Environmental Concerns about GlassOne of the primary findings of the LCA is the relativelysmall energy impact resulting from transportation of glasspackaging within the full scope of the environmental lifecycle of glass. Transportation of raw materials and culletused in glass production represents less than 10 percentof the total energy used in the production of containerglass. Even at current industry recycled content rates, it isclear that the transportation emissions are offset by theenergy savings gained from the use of recycled glass inthe manufacturing process.
The CO2 savings from glass recycling are as large, orlarger, than the transportation emissions.
Glass containers are end lessly recyc lab le , made fromall-natural ingredients (sand, soda ash, limestone, andrecyc led glass), and is the on ly packaging materia laccepted by the U .S. FDA as “GRAS” or “generallyrecognized as safe” for food and beverage contact.G lass is nonporous and impermeab le , so there are nointeractions between the glass packaging and thecontained products that could affect the flavor of foodsand beverages.
Recycling glass containers provides for unmatchedproduction efficiencies and significant environmentalbenefits: decreases the amount of raw materials used ,lessens the demand for energy, cuts CO2 emissions,extends furnace life without any processing by-productsand saves on overall manufacturing costs.
Much of glass conta iner recyc ling is in a c losed loop ,which means that a glass container becomes the sameproduct again and again. Though some glass containersare recyc led into non-conta iner products, the end lessrecycling of glass back to its original use without loss ofqua lity or purity is the true defin ition of a recyc lab lematerial.
The glass container industry, its companies, and thousandsof employees, recognize the growing importance of
protecting the environment and conserving valuable energyresources. In recognition of the environmenta l va lue ofpost-consumer cullet, or recycled glass, the U .S. glassconta iner industry has set a goa l of using at least 50percent recycled glass in the manufacture of new glassbottles and jars by 2013 . Part of the ongoing effort toreach the industry goals can be seen in the on-premisebar, restaurant, and hote l recyc ling in itiatives. Morethan 18 percent of beverages packaged in glass aresold in restaurants and other away-from-home venues.Glass container manufacturers also support innovativecurbside collection practices and will continue to workwith policymakers to improve and expand state beveragedeposit programs.
In add ition , many recovered glass processing fac ilitiesthat supp ly cu llet are located near glass conta inermanufacturing p lants. These fac ilities use impactcrushing, air classification, screening, metal separation,vacuum extraction , and dust control to removecontam inants such as paper, p lastic and meta l, andthen crush the glass. Optica l sorting and ceram icdetection equ ipment are a lso used to benefic iate therecovered cullet.
Why Recycling is Good for Industry and the Environment:
LCA was Conducted by:PE Americas is an independent consultancy with extensiveexperience in conducting life cycle assessment (LCA) studiesand facilitating critical stakeholder review processes. It is amarket leader in strategic consultancy and software solutions- www.gabi-software.com GaB i for product sustainability andwww.sofii-software.com SoF i for corporate sustainability.
The Glass Packaging Institute | 2010 7
Making Glass
The glass container industry is very diverse and covers avariety of different types of technology to produce glassbottles and jars.
Container glass begins with melting together severallargely naturally occurring minerals. The most commonraw materials used to produce glass are:
• Cullet (recycled glass)• Silica sand• Soda ash (brings down melting temperatures)• Limestone (enhances durability)• Materials can be added to produce different colors
Container glass furnaces are generally designed to meltlarge quantities of glass over a continuous period of morethan 20 years and range in output from 150 tons of glassper day to over 600 tons of glass per day.
Materials are heated to 2350 ˚F at a constant temperatureand the glass gob cools slowly to a working temperaturearound 2150 ˚F. Then the glass goes through a two-stagemolding process by using either the press-and-blow orthe blow-and-blow techniques.
The stages for this are:1. Obtain a gob of molten glass at the correct weight
and temperature2. Form the primary shape in a first or blank mold by
pressure from compressed air or metal plunger3. Transfer the primary shape into the final mold4. Complete the shaping process by blowing the
container with compressed air to the shape of thefinal mold
5. Remove the finished product from the post forming process
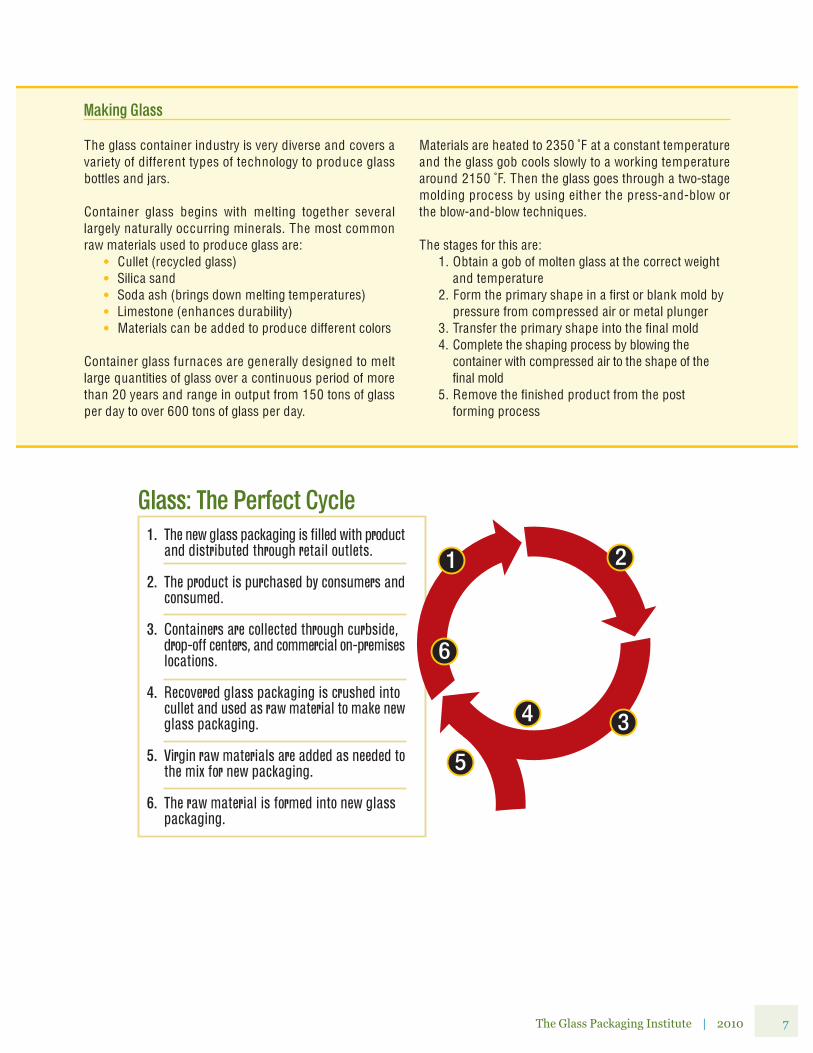
The new glass packaging is filled with productand distributed through retail outlets.
The product is purchased by consumers andconsumed.
Containers are collected through curbside,drop-off centers, and commercial on-premiseslocations.
Recovered glass packaging is crushed intocullet and used as raw material to make newglass packaging.
Virgin raw materials are added as needed tothe mix for new packaging.
The raw material is formed into new glasspackaging.
Glass: The Perfect Cycle1.
2.
3.
4.
5.
6.
1 2
34
5
6
8 Cradle-to-Cradle Life Cycle Assessment of North American Container Glass
18
16
0
MJ
(Net
Cal
onfic
Val
ue)
14
12
10
8
6
4
2
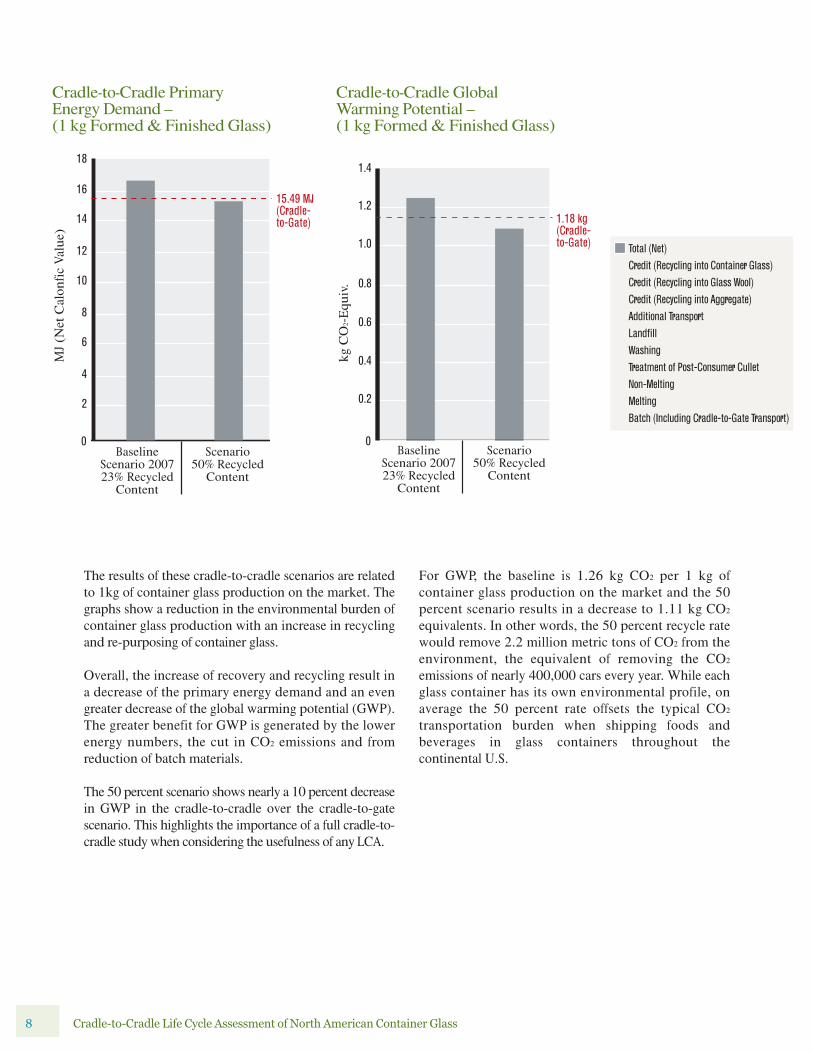
15.49 MJ(Cradle-to-Gate)
BaselineScenario 200723% Recycled
Content
Scenario50% Recycled
Content
Total (Net)Credit (Recycling into Container Glass)Credit (Recycling into Glass Wool)Credit (Recycling into Aggregate)Additional TransportLandfillWashingTreatment of Post-Consumer CulletNon-MeltingMeltingBatch (Including Cradle-to-Gate Transport)
Cradle-to-Cradle Primary Energy Demand –(1 kg Formed & Finished Glass)
1.4
1.2
0
kg C
O2-Equ
iv.
1.18 kg(Cradle-to-Gate)1.0
0.8
0.6
0.4
0.2
BaselineScenario 200723% Recycled
Content
Scenario50% Recycled
Content
Cradle-to-Cradle Global Warming Potential –(1 kg Formed & Finished Glass)
The results of these cradle-to-cradle scenarios are relatedto 1kg of container glass production on the market. Thegraphs show a reduction in the environmental burden ofcontainer glass production with an increase in recyclingand re-purposing of container glass.
Overall, the increase of recovery and recycling result ina decrease of the primary energy demand and an evengreater decrease of the global warming potential (GWP).The greater benefit for GWP is generated by the lowerenergy numbers, the cut in CO2 emissions and fromreduction of batch materials.
The 50 percent scenario shows nearly a 10 percent decreasein GWP in the cradle-to-cradle over the cradle-to-gatescenario. This highlights the importance of a full cradle-to-cradle study when considering the usefulness of any LCA.
For GWP, the baseline is 1.26 kg CO2 per 1 kg ofcontainer glass production on the market and the 50percent scenario results in a decrease to 1.11 kg CO2
equivalents. In other words, the 50 percent recycle ratewould remove 2.2 million metric tons of CO2 from theenvironment, the equivalent of removing the CO2
emissions of nearly 400,000 cars every year. While eachglass container has its own environmental profile, onaverage the 50 percent rate offsets the typical CO2
transportation burden when shipping foods andbeverages in glass containers throughout thecontinental U.S.

The Glass Packaging Institute | 2010 9
Glass container manufacturers continue to look for waysto strengthen glass, through new surface treatments andbetter designs, without sacrificing the improvements inmaterial reduction. Improvements in coatingtechnologies have helped to make glass more durable andversatile for consumer use.
Lightweighting has become one of the single mostimportant innovations in the industry. Improvedtechnology has led to lighter weight glass containersthat are remarkably strong and safe. Lightweighting hasmultiple environmental benefits, since lower containerweight means fewer emissions from both containerproduction and shipping. As lightweighting continueswithin the industry, the CO2 savings will increase. (SeeLightweighting)
Lightweighting The glass packaging industry continues to look for waysto strengthen glass through new surface treatments andbetter designs, without sacrificing improvements inmaterial reduction. The industry term is lightweighting.Improvements in coating technologies have helped tomake glass more durable and versatile for consumer use.
Sample Weight Reductions Since 1985• 7 oz. Beer – 30%
• 12 oz. Long Neck Beer – 24%
• 1 L Liquor – 23%
• 16 oz. Juice – 22%
• 32 oz. Vinegar – 32%
• 19 oz. BBQ – 33%
• 14 oz. Catsup – 32%
• 375 mL F lask – 27%
The Many Benefits from Lightweighting• By reducing the weight, companies are able to save on
raw materials and melting costs.
• Production lines can run at a much faster pacebecause there is less glass per container and lessenergy needed for cooling. As a result oflightweighting, glass containers can be moreeconomical and competitively priced with lowerenvironmental impact.
• The introduction of the Narrow Neck Press and B low(NNPB) forming process is widely credited withhelping to reduce the overall manufacturing weightand thickness of glass containers, thereby increasingproductivity (on production and filling lines).
• Since 1985, the glass packaging industry has reducedthe weight of glass containers and improvedproductivity by as much as 15 to 25 percent.
• In the manufacturing process, the bottle is pressedinto its initial shape while still in the blank mold.
• Manufacturers are able to exert greater control overthe desired thickness of a glass container.
• Excess glass from the neck and other parts of thebottle where thickness is not critical is shifted intoareas where it is needed most.
• The result is a reduction in the amount of glassrequired in a given container and more uniform glassdistribution throughout the container.
The Glass Packaging Institute (GPI) is the trade association representing the North American glass container industry. Through GPI, glass container manufacturers speak with one voice to advocate industry standards, promote sound environmental policies and educate packaging professionals. www.gpi.org
To ensure the highest integrity and objectivity of the data, the LCA was conducted by PE Americas. The studyused comparable methods in evaluating life cycle impacts, and was performed in accordance to ISO 14040/44guidelines. This LCA differs from those of other packaging industries in that it includes detailed end-of-life managementresults, which take into account the impact of recycling of glass packaging.
The analysis was based on a state-of-the-art modeling methodology developed by:
Roland Geyer, Ph.D., Donald Bren School of Environmental Science & Management, University of California at SantaBarbara, U.S., developed ISO methodology on end of life.
The assessment underwent an extensive critical peer-review by a panel of four independent experts, including:
• Prof. Dr. Ir. Ruud Beerkens, TNO Science & Industry, Eindhoven, The Netherlands
• Dr. Arpad Horvath, Berkeley, California
• Prof. Matthias Finkbeiner, Institute of Environmental Technology, Technical University of Berlin, Germany
• C. Philip Ross, President, Glass Industry Consulting International, Laguna Niguel, California
10 Cradle-to-Cradle Life Cycle Assessment of North American Container Glass

www.gpi.org