Environmental monitoring methods, practices
27
ENVIRONMENTAL MONITORING: MODELS, METHODS, AND SYSTEMS Oliver Günther Humboldt Universität zu Berlin Spandauer Str. 1, 10178 Berlin, Germany Email: [email protected] Franz Josef Radermacher and Wolf-Fritz Riekert FAW (Research Institute for Applied Knowledge Processing) Ulm P.O.Box 2060, 89010 Ulm, Germany Email: {radermac|riekert}@faw.uni-ulm.de ABSTRACT: Environmental monitoring is the continuous, automated observation of changes in the environment. Powerful models, methods, and systems that have been developed for the purpose of environmental monitoring are now leaving the laboratory setting, and some of them are already being applied. When they are applied in countries that have well established environmental authorities and a high population density, these applications are actually additional measures to protect the environment. However, the situation in less developed or less densely populated coun- tries is quite different. For these countries, the new techniques of environmental monitoring can offer totally new opportunities for better environmental protection. 1 Environmental Monitoring and its Global Range 1.1 THE PRESENT SITUATION The global environmental situation of the Earth is becoming increasingly problematic and critical. The outlook for our future is increasingly gloomy. The major reason for this pessimistic outlook is the exploding number of people. Since 1970 the world’s population has risen from 3.5 to 5.5 billion people. At the same time, the consumption per person has risen tremendously in the developed countries [STIF91]. Both trends historically have been regarded as something positive, and they have led to an ever-growing improvement of human living conditions, an effect that individuals can perceive directly. At the same time, the responsible institutions have had greater oppor- tunities to develop and gain power. For these reasons, both the increase in the number of people and the increase in the consumption rates have generally been regarded as favor- able. But now we have reached a turning point. Today, more than half of the world’s population is not yet capable of reproduction, which means that a kind of time bomb, of which we will have hardly any control, is developing within the global demographic structure [EHRL75, EHRL91, FAW92]. Furthermore, the consumption rates reached in In: N.M. Avouris, B. Page (eds). Environmental Informatics – Methodology and Applications of Environmental Information Processing, Kluwer Academic, Dordrecht, 1995.
description
Environmental monitoring methods, practices methods, practices
Transcript of Environmental monitoring methods, practices
ENVIRONMENTAL MONITORING:MODELS, METHODS, AND SYSTEMS
Oliver GüntherHumboldt Universität zu BerlinSpandauer Str. 1, 10178 Berlin, GermanyEmail: [email protected]
Franz Josef Radermacher and Wolf-Fritz RiekertFAW (Research Institute for Applied Knowledge Processing) UlmP.O.Box 2060, 89010 Ulm, GermanyEmail: {radermac|riekert}@faw.uni-ulm.de
ABSTRACT: Environmental monitoring is the continuous, automated observation of changes inthe environment. Powerful models, methods, and systems that have been developed for the purposeof environmental monitoring are now leaving the laboratory setting, and some of them are alreadybeing applied. When they are applied in countries that have well established environmentalauthorities and a high population density, these applications are actually additional measures toprotect the environment. However, the situation in less developed or less densely populated coun-tries is quite different. For these countries, the new techniques of environmental monitoring canoffer totally new opportunities for better environmental protection.
1 Environmental Monitoring and its Global Range
1.1 THE PRESENT SITUATION
The global environmental situation of the Earth is becoming increasingly problematic andcritical. The outlook for our future is increasingly gloomy. The major reason for thispessimistic outlook is the exploding number of people. Since 1970 the world’s populationhas risen from 3.5 to 5.5 billion people. At the same time, the consumption per person hasrisen tremendously in the developed countries [STIF91].
Both trends historically have been regarded as something positive, and they have ledto an ever-growing improvement of human living conditions, an effect that individuals canperceive directly. At the same time, the responsible institutions have had greater oppor-tunities to develop and gain power. For these reasons, both the increase in the number ofpeople and the increase in the consumption rates have generally been regarded as favor-able. But now we have reached a turning point. Today, more than half of the world’spopulation is not yet capable of reproduction, which means that a kind of time bomb, ofwhich we will have hardly any control, is developing within the global demographicstructure [EHRL75, EHRL91, FAW92]. Furthermore, the consumption rates reached in
In: N.M. Avouris, B. Page (eds). Environmental Informatics – Methodology and Applications ofEnvironmental Information Processing, Kluwer Academic, Dordrecht, 1995.
- 2 -
the developed countries are taken as a standard measure by the people in the developingworld. Billions of people are striving to achieve this living-standard, which is communi-cated to them constantly, particularly via modern mass media.
There is no doubt that the Earth will not be able to satisfy such increasing demands.We recognize that the growth of the world’s population and the increase in demands areprobably the most significant effects of technological progress and should therefore beelaborated on in the general discussion of the effects of technological progress. However,we must not forget that this technological development was driven by the growth ofpopulation and by demands resulting from the pressure and the innovation potentials theyinduced.
Today, we have reached the end of the age of “lighthearted” growth, but many ofus have not yet come to realize this. A number of nonrenewable resources, such as theamount of cultivable land, is decreasing globally. Another example is the twenty-yearChinese government program 1980-2000 [OEHM92], according to which energy produc-tion will be enormously increased by coal combustion. It is very likely that these increaseswill over-ride the overall reductions in carbon dioxide output planned by the westerncountries. The crucial point is that the developed countries are not in a position to blamethe other countries for such effects since they have created the highest degree of environ-mental degradation per person, not only at present but particularly in the last decades.Most of the activities causing environmental degradation take place in the developednorthern hemisphere; thus, it is very hard to set any kind of restrictions on the developingcountries.
Against this background, one can see how alarming the situation is, and the real ex-tent of the problems is generally not acknowledged. If we do not agree on and carry outdrastic programs to reduce the number of people inhabitating our planet [HUMA92], forwhich, however, our mental readiness is not yet apparent, the problems can be solved onlyby transferring resources from the rich countries to the poorer countries on a very largescale in order to align living-standards globally at a lower level.
1.2 EFFECTS
Because of the developments described above, radical changes to the global situation andespecially to the ecology are ahead. Air pollution, the greenhouse effect, and the notice-able impact of both on coastal areas, especially in the Third World, have already beenmentioned. Densely populated areas, such as Bangladesh [SONT92] among others, are hitby such developments, and it is very likely that the number of people who die as a resultwill dramatically rise. The loss of agriculturally productive land has several causes: forexample, excessive cultivation of the Sahel brought about its subsequent degeneration intosteppe [WELT92]. The situation in tropical regions is also dramatic as deforestation isgoing on causing the rapid loss of one of the most valuable biological assets on our planet,that of an enormous genetic variety. Biotopes that have grown over the course of manycenturies and that cannot be regenerated or reproduced within a short time are beingdestroyed although it is known that with deforestation land often loses much of its fertilityvery quickly, thus being of no use for any form of sustainable development afterwards.
- 3 -
This process of environmental degradation is closely linked to the development ofmega-cities, a trend that can be seen in developing countries where metropolitan areas arespreading rampantly and forming the greatest conglomerates of humans on Earth[HUMA92]. The consequences of this process are sanitary and social conditions that seemcompletely intolerable from the western point of view.
1.3 SUSTAINABILITY OF DEVELOPMENT
Because of the effects of the developments described above, the responsible authoritiesand those organizations – both governmental and nongovernmental – that deal with thisissue agreed on a political program at the Earth Summit in Rio, for which the term“sustainable development” was coined. The term is meant to describe the intention that allpeople should act in such a way to ensure that a development is possible that “meets theneeds of the present without compromising the ability of future generations to meet theirown needs” [WORL87]. The key concept of “sustainability” is certainly well-groundedethically but the consequences and limitations that this claim bears for all of us are not yetfully understood nor elaborated. We will not reach the goal of sustainable development ifthe present growth of both the world’s population and the consumption rates continue orif the developing countries succeed in their claim to living conditions similiar to those inthe developed part of the world without a drastic reduction in the global population num-bers over some generations. Thus, sustainability calls for a decisive reduction in thegrowth rates of the global population.
The twenty-year program of the Chinese government mentioned earlier is an exam-ple of consequences that can result from a rise of worldwide consumption. Certainly, it isnot legitimate for us to argue against an improvement in the living conditions of billions ofpeople. However, in such a complex situation the necessary stability of the global envi-ronmental situation cannot be guaranteed – even if we were to limit consumption in theindustrial countries to an extent clearly much lower than today. We will succeed only if wemanage to set up a dramatic program to slow down the growth of population numbers.To be politically feasibile in the long run, this goal requires reductions in the number ofpeople in both the developed and the developing countries.
1.4 THE VALUE OF INFORMATION
A program for a truly sustainable development, in which a reduction in the number ofpeople in industrialized as well as in developing countries is the core element (as men-tioned in the preceding paragraph), is not politically feasible (at the moment). Indeed, forsome it is not even worth discussing. This is partly because a great number of people donot have a clear idea of the severity of the global environmental threat.
The reasons for this situation are manyfold. First of all, complex, interacting systemsand nonlinear phenomena that contain hidden time dynamics are not easily understood byhumans because we have not been equipped with such a skill in the course of our evolu-tionary history. As stated before, one of the particular problems of the dynamics of over-population is that growth has always been experienced as something reasonable, and as
- 4 -
offering new opportunities to develop and gain power. Only recently have there been signsthat the situation is about to lose its balance for the simple reason that the Earth is aboutto become overloaded. It is extremely difficult for citizens and politicians to cast asidelong-standing attitudes towards this issue, which touch on basic experiences, traditional"self-evident" facts, and even religious taboos.
Moreover, it is extremely difficult to receive truly credible information on the globalprocesses that are ahead, information that can be made available and understood by citi-zens on a broad scale. In fact, there is a great variety of approaches and also much con-troversy among experts in such fields as environmental modeling, environmental monitor-ing, and statistics with regard to the proper methodology and the adequate model toapply. Furthermore, even the amount of information is simply too big, so that sometimesone cannot see the wood for the trees. Some important global models are described inBREM89, where the seminal models of the Club of Rome [HERR76, MEAD72,MEAD74, MESA74] are thoroughly studied. The environmental databases on Earth alsoclearly show a certain degree of inconsistency, which is the reason why the internationalproject “Harmonization of Environmental Measurement (HEM)” has been established.Germany strongly participates in this project that is coordinated by the United NationsEnvironmental Programme (UNEP) [KEUN91]. Furthermore, many of the politicallyresponsible authorities involved in these processes – e.g., national or local authorities notonly in the Third World but also in the developed countries – are sometimes not willing tomake the necessary information available. Thus, everything depends on the particular localcircumstances, on the ups and downs of politics, on the granting of funds, and so on.
1.5 ENVIRONMENTAL MONITORING
Today, the opportunity has fallen to us that we can try to get the necessary information onthe overall situation by means of modern remote sensing methods. This information willbe useful even if these remote sensing information sources do not provide as much detailas wanted. The advantage of this kind of environmental data supply is that information isobtained worldwide by a single standard, and at regular, short intervals, applying compa-rable measures. These aspects of regularity and comparability offer great potential becausethey provide the possibility of producing “snapshots” of the environmental situation atregular intervals. The relevant information can be obtained via satellite or – just as well oreven better – via less expensive sensors, which could, for example, be mounted on shipsand planes, thus collecting relevant sensor data in the course of the general operation ofthese means of transport. (The cultivation of wheat could, for example, be controlled bymeans of remote sensing methods; see [MYER83]).
The regularity and global aspect of the data supply promise enormous benefits evenif the information given is not as detailed as wanted. Using this data, we could, for in-stance, illustrate the effects of the expansion of the mega-cities over several years ordecades by means of time-lapse comparisons, the reduction in the rain forest stand, the airpollution, desertification, desiccation of lakes, and many other environmental processes.(Examples of remote sensing approaches are described in the third part of this chapter.)
- 5 -
Since the supply of information and the transparency that comes out of it are the precon-ditions for a change at the political level, they carry considerable potential.
Modern remote sensing techniques – in combination with suitable information man-agement – are in the long run the only possible means towards effective environmentalmonitoring, both at a global and a local level, especially in the Third World. In the indus-trialized part of the world, for example, in the countries of the European Union, theseremote sensing techniques are a valuable additional measure to traditional methods ofenvironmental observation:
• At the level of the European Union, for example, the cultivation of land, the state ofthe seas, and climate changes are being studied increasingly by means of remotesensing systems via satellites.
• In a growing number of countries and regions of the European Union, environ-mental information systems are being established to analyze environmental data ob-tained by traditional methods and sensing techniques. The information provided bythese data is made available to the governmental organizations. One such system isdescribed in more detail in section 2.2.
• Today, many local authorities, public utilities, and owners of plants apply remotesensing and information technology in order to control drainage systems, powerstations, or incinerators.
1.6 OPTIMISTIC MODELING AND STANDARDIZED REFERENCE DATA
At FAW (Research Institute for Applied Knowledge Processing) in Ulm, Germany, thesequestions have been intensively studied, and a great number of contributions have beenproduced by integrating the processing of environmental data and environmental monitor-ing applying different sorts of sensors. What follows is a description and discussion of thiswork.
FAW is particularly devoted to global issues. In particular, in cooperation with theInstitute for Occupational and Social Medicine and the Central Institute for BiomedicalEngineering at the University of Ulm, FAW has elaborated a concept for the World HealthOrganization (WHO) on how to approach the global issues desribed here and how toprovide the needed transparency. The starting point for this approach is that very roughmodels can provide enough information in many cases, often even if nonlinear effects areinvolved.
Rough optimistic modeling, that is, a kind of estimates [RADE92] that alwaysmakes the most favourable assumptions, on the basis of which the most optimistic impactsare derived, can be highly valuable because they can help redirect discussion. Instead ofexamining the adequacy of specialized models, rough optimistic modeling can give us agenerally acknowledged certainty that specific predicted developments will actually takeplace, such as prognoses concerning the minimum growth of the mega-cities, populationgrowth, and the availability of nonrenewable resources per person.
This problem is addressed at FAW in the SCOPE project (Standard-Reference Dataand Policy Assistance Systems for Global Health Evolution), which aims particularly at
- 6 -
the establishment of a network to link scientists all over the world who concentrate onsuch optimistic scenarios for various basic figures, e.g., population growth, gross nationalproduct, increase in the transfer of resources from the north to the south, and who make –based on corresponding optimistic models – optimistic predictions concerning many fur-ther derived figures, such as the size of the mega-cities or the rain forest stand [FLIE93].The relevant figures and estimates for the next decades should be published annually andshould in retrospect prove to be optimistic so that the community can experience a feelingof reliability of the prognoses made. For the calibration of statements, constant feedbackand the information supply from remote sensing systems and worldwide monitoring play adecisive role.
2 Techniques for Environmental Monitoring
As mentioned above, people usually have major difficulties in perceiving the kind of slow,gradual developments that are typical of environmental processes. Nevertheless, the gen-eral awareness of environmental issues has increased considerably in the past decade,especially in the western industrial countries. In this section, we will focus on the situationin the Federal Republic of Germany. In addition to numerous actions at the political levelto improve the quality of the environment, one can observe that both industry and publicadministration are increasingly taking advantage of modern technology for the recognitionand containment of environmental damage. Examples, among others, are the utilization ofextensive measuring networks and the use of remote sensing technology for civilian pur-poses. Data about noise, soil, water, and air quality are captured periodically at manydifferent locations, and these data create a solid base for efficient environmental manage-ment and monitoring.
Data capture, however, is not the only task in this context. Time series of measure-ments and raw image data need to be aggregated and enriched by appropriate semanticsbefore they can be used in environmental decision making. Additional information aboutthe measuring process or the conditions of the probe-taking are especially valuable for thispurpose. In addition, one needs to compare the information obtained with the current legalrequirements and to design possible choices for the policy- and decision-making bodies.
These kinds of complex analysis tasks are currently carried out by highly qualifiedexperts, such as analytical chemists, geodesists, or ecologists. In many cases, the person-nel and equipment available for this kind of work is nowhere near sufficient to process theever-increasing volume of data. Modern information technology can make major contri-butions to making this task faster, safer, and more cost-effective. However, questionsregarding the privacy and security of this process need to be taken into account early inthe planning stage.
In the German public sector, these kinds of activities are being pursued through ahierarchy of environmental information systems at the federal, state, and county level.These systems should not be thought of as all-purpose monolithical programs, but asflexible collections of organizational and software tools for the efficient processing of
- 7 -
environmental information. Besides supporting the administration in their day-to-daywork, these systems also play a major role in providing the public with up-to-date infor-mation about the environment.
Similar activities can be observed on the part of private industry. More and morecompanies are considering extensions to their internal information systems to capture theenvironmental costs and hazards related to their activities. This trend towards the“ecological balance sheet” has been reinforced by some recent legislation on environ-mental liability as well as more concise guidelines set by the European Union.
In the following paragraphs of this section, a detailed overview of the informationflow that is typical of environmental monitoring tasks is presented, followed by a surveyon how environmental monitoring is used in the German public sector, using the Environ-mental Information System of the State of Baden-Württemberg as an example. Finally,several related research projects carried out at FAW in cooperation with the Baden-Württemberg Environmental Ministry and other partners from government and industry,are described.
2.1 INFORMATION FLOW
Most environmental applications of information technology display an information flowthat bears a close resemblance to the data flow in classical business applications. Wedistinguish between four phases: data capture, data aggregation, data storage, and dataanalysis.
The first phase, data capture, revolves around the collection of extraordinaryamounts of raw data, such as measurement time series or imagery, in particular aerialphotographs and remote sensing data. NASA estimates that in a few years we will receiveup to 10 terabytes of image data per day [CAMP90]. It is obvious that such large amountsof data can only be processed by appropriate hardware and software tools based on state-of-the-art computer science research.
In the second phase, data aggregation, the raw data are condensed and enriched inorder to extract semantically meaningful entities. In the case of image data this includes,for example, the recognition of geometric primitives (such as lines and vertices) in anarray of pixels, the comparison of the resulting geometric objects with available maps,and, finally, the identification of geographic objects – such as cities or rivers – on thepicture. The information can then be represented in a much more compact format (in thiscase, a vector-based data format, as opposed to the original raster data). Measurementtime series also need to be aggregated and possibly evaluated by means of some standardstatistical procedures.
The aggregated data are stored – possibly in some compressed format – in a file, adatabase, or a geographic information system (GIS). In this phase of data storage, it isimportant to choose a database design and suitable physical storage structures that willoptimize the overall system performance. Because of the complexity and heterogeneity ofenvironmental data, this often necessitates substantial extensions to classical databasetechnology.
- 8 -
In the data analysis phase, the available information is used for decision support.This may require access to data that are geographically distributed, stored on heteroge-nous hardware, and organized along a wide variety of data models. The data analysis istypically based on complex statistical methods, scenarios, and simulation tools. Only thesynthesis of the input data and these kinds of models allows us to judge the state of theenvironment and the potential of actions, both planned and already implemented.
No doubt there are many parallels between this kind of sequential data processingand the data flow in traditional business applications, where data are collected, stored, andprocessed in order to provide efficient decision support for management. In environmentalmonitoring, however, we encounter a few very special requirements that make parts of theprocessing much more difficult.
First, the amount of data to be processed is unusually large. As was mentioned, inthe case of image data we expect several terabytes per day, a quantity that is about twoorders of magnitude beyond what is currently typical for large high-transaction databases,such as are used in banking or airline reservation systems. These kinds of large data setsare causing major problems in both storage and processing.
Second, much of the work to be done in this context is routine, including tasks suchas the identification of common substances in chemical probes or the deletion of satelliteimagery that contains too many clouds. Knowledge-based systems (also called expertsystems) may provide some efficient support for this kind of routine work. In particular,these systems can be used interactively by less-skilled personnel to evaluate given datasets. Most data could then be processed semi- or fully-automatical, and only the difficultcases would be forwarded to a more qualified human expert.
Another problem area, especially in the data analysis phase, is the extreme heteroge-neity and distribution of the information required. As in many private companies, mostpublic environmental agencies work with a collection of isolated special-purpose softwaresystems rather than an integrated framework of tools. Collecting the required data fromsuch a heterogenous installation is a major problem.
At the physical level, powerful netware that privides safe transfer of large amountsof data from one location to another is required. The task involves both the question ofsimple connectivity and also the need for more sophisticated protocols to allow complexqueries over the net. Ideally, the distribution should be completely transparent to the user,that is, local and non-local information should be accessible using the same commandsequence. A useful paradigm for this kind of architecture is provided by the Local AreaNetworks (LANs) used, for example, for the networking of UNIX workstations.
A more difficult task is the management of heterogeneous networks, where comput-ers of different vendors, different sizes (PC – workstation – mainframe), and differentoperating systems are put together, using a variety of network technologies. Up to now,most of the work has been done on the special case at hand, but the search is beginningfor more general solutions.
The most difficult problem, however, concerns the semantic issues that often arisewhen data sets from different sources are joined and used together in some complex appli-cation. In addition to problems of at least partial redundance and related contradictions,
- 9 -
often the same things are differently named in different applications and, vice versa, thatis, different things bear the same name.
Some significant progress on these semantic issues is needed in order to improvedatabase interoperability over the long term. Data models need to be extended to providemuch more semantic information about the meaning of each piece of data. Inconsistenciesmust be detected and described in an appropriate language that is machine-readable andthat can be used for the correct interpretation of user queries. This kind of semantic datais often called metadata [RADE91].
Data analysis techniques are not only useful for decision makers in environmentalagencies or private companies. In environmental protection, the public demand for open-ness and transparency is unusually high, and this is increasingly reflected in legislation,especially at the European level. According to the recent EU recommendation on envi-ronmental information (which is modelled after the American Freedom of InformationAct), almost all data stored at public agencies should be made available to any citizen ondemand [COUN90]. The few exceptions refer to privacy issues, such as the protection ofindustrial secrets, which need to be shielded from public view by appropriate authorizationmechanisms. In general, however, public records on private companies are not exemptedfrom this ruling.
Citizen inquiries will rarely refer only to raw data, which could be provided by mostmodern administrations fairly easily by means of a few database queries. A typical inquirywill ask rather for high-level information, which can be provided only by joining and ag-gregating the raw data as described above. To see how much additional work this cancause for the public administration, one needs only to remember that right now it is notunusual for public agencies to take several months to answer a parliamentary request forinformation. The skills needed for this kind of synthesis require highly trained personnel,which are typically hard to find and relatively expensive. As a result, there is a majordemand for appropriate tools to manage and aggregate distributed information in a het-erogenous network.
In summary, environmental information management requires the most sophisticatedcomputer technology available. Recent results from research in areas such as databases,artificial intelligence, computational geometry, computer graphics, and other subdisci-plines of computer science are finding their way into commercial geographic and environ-mental information systems within just a few years. Such modern techniques as knowl-edge-based systems or object-oriented programming are received with great interest byusers in environmental applications. In such a situation, it is increasingly important to keepboth the technological limitations and possibilities in mind when designing a complexenvironmental information system. This can only be achieved by close cooperation be-tween the areas of research and application, which is exactly what is being done throughthe cooperation between FAW, the State of Baden-Württemberg, and several privatecompanies.
- 10 -
2.2 ENVIRONMENTAL MONITORING IN THE UIS BADEN-WÜRTTEMBERG
FAW’s most important partner in the area of environmental information systems is theEnvironmental Ministry of the State of Baden-Württemberg. Since its foundation in 1987,this ministry has been conducting a major project to design and implement an Environ-mental Information System for the entire state [MAYE93]. This large-scale project, calledUIS, is concerned with a gradual integration of the variety of hardware and softwarecurrently used in Baden-Württemberg’s environmental administration. The project is alsocommitted to using state-of-the-art information technology and keeping close contact withcomputer science research in order to employ the best information management solutionscurrently available. A first design of the complete system architecture was presented in1990. Since then, the ministry has been working on more detailed design studies and onthe prototypical implementation of several selected components.
Each of these components belongs to one of three functional levels:
1. analysis and presentation tools for management information purposes,2. base components for data capture and data analysis at the department level,3. infrastructure and hardware/software environments.
The management information tools at level 1 include strategically oriented systemsfor decision support at the executive level as well as integrated reporting and planningtools for middle management. In particular, the Executive Environmental InformationSystem (UFIS) serves to collect information from the department level, aggregate it, andpresent it in an appropriate format [HENN93]. Typical users of this system include thehighest-level management of the Environmental Ministry and the State EnvironmentalProtection Agency. On the other hand, some reporting systems are geared mainly towardssupporting day-to-day work at the middle management level. Examples include TULIS,the Technosphere and Air Information System [KOHM93], or ALBIS, the InformationSystem on Species, Landscapes, and Biotopes [MUELL92]. With regard to environmentalmonitoring, these systems have the important function of fast recognition of unusualdevelopments, even those that occur at a pace too slow for human perception. Finally,level 1 components include several planning and control systems such as RIPS, the SpatialInformation and Planning System, which provides and controls access to spatial data bythe public administration.
The base components at level 2 serve mainly for data capture, storage, and somepreliminary analysis at the department level. Examples include VIKOLUM, a network forair quality measurements, and KIWI, an information system for the water managementagencies. The information managed by these systems serves two purposes. First, it is animportant basis for efficient environmental monitoring at the local level. Second, it servesas input for the management information systems at level 1, which are connected to thebase components through computer networks.
Infrastructure (level 3) means, in particular, systems that are used not only by theenvironmental administration but by other government agencies as well. Examples include
- 11 -
the Measurement Series Management System (MEROS) of the State EnvironmentalProtection Agency, the Official Topographic-Cartographic Information System (ATKIS),and the Official Cadastral Map (ALK) of the State Survey.
2.3 ENVIRONMENTAL MONITORING PROJECTS AT FAW ULM
At FAW Ulm we have conducted several projects on the capture and storage of environ-mental data. The goal of the ZEUS project (phases II and III) was the design and imple-mentation of a method base for managing a groundwater measuring network. In the proj-ects WANDA and RESEDA, we built two knowledge-based systems for capturing watermeasurement and remote sensing information. Both systems are designed as interactivedesktop assistants. They have a user-friendly interface that allows users to evaluate thedata input more thoroughly and efficiently. In addition to these projects, FAW is workingon the architecture of future geographic information systems for effectively storing spa-tially and temporally related environmental information. In all of these research projects,FAW has cooperated closely with the State of Baden-Württemberg as well as severalcompanies, including Digital Equipment, ESRI, Hewlett-Packard, IBM, Siemens, SiemensNixdorf, and strässle.
The objective of ZEUS (phases II and III) was the construction of a method basethat supports the installation and management of a statewide network to measuregroundwater quality [SOKO93]. The network allows the government to monitor thegroundwater at a large number of different locations, covering a broad spectrum of landuse and sources of toxic substances. The network also provides a convenient testbed forevaluating the efficiency of legal and other administrational actions. ZEUS makes availablea large number of classification tools and (geo)statistical methods. Examples includealgorithms to compute the hydraulics around any particular probing point or to estimatethe protective function of the groundwater coverage. Before evaluating the hydrochemicaldata, the system performs a plausibility check involving data about land use in the region.Because most data in this context are associated with some location and a spatial exten-sion, the methods are linked together under the roof of a commercial geographic informa-tion system. Non-spatial data are being held in a relational database, which has been ex-tended by a versioning mechanism to minimize redundancies. A prototype of the system iscurrently undergoing testing at the State Environmental Protection Agency and the Geo-logical State Office of Baden-Württemberg. Introduction into the field is planned for late1994.
Project WANDA (Water Analysis Data Advisor) has been concerned with the designand implementation of a knowledge-based system to support laboratory personnel in theinterpretation of water analysis measurement data [SCHE93]. Based on one or morechromatograms, the system is able to identify and quantify a large number of specificsubstances. Until now, this interpretation process has been extremely time-consuming andhas required the expertise of experienced analytical chemists. In this process, chemiststypically introduce background information into the analysis, such as general experience,
- 12 -
or knowledge about the circumstances of the probe. In WANDA parts of this expertiseare represented in a knowledge-based system that simulates the cognitive synthesis per-formed by the human expert. As is typical for an expert system approach, the knowledgeacquisition phase was quite long and cumbersome. Even so, it is of course not possible tocome even close to capturing the complete knowledge of an experienced chemist. Thesolution is to concentrate on some clearly defined subdomains that are most relevant tothe task at hand.
In addition to the measurements, WANDA takes the following data into account:
• information about the probe (location, time, local land use),• knowledge about commonly used fertilizers,• information about the measurement setup,• general properties of relevant substances, and• reference libraries of chromatographic measurements.
Most of the data are qualified by some kind of uncertainty measure. By combiningthe data (including their uncertainties) with the measurements, WANDA generates a list ofcandidate substances, which is again weighted according to certainty of prediction. Notethat this list of candidates may contain substances that cannot even be detected by thechosen measurement methodology. Based on this list, chemists may then choose to tryanother type of analysis; that is, they receive some support for further analysis planning. Inthis project, the FAW cooperated closely with the State Environmental Protection Agencyand the Department of Analytical and Environmental Chemistry of the University of Ulm.A prototype is currently undergoing testing at the Agency.
Finally, the RESEDA project has been concerned with the evaluation of remote sen-sor data. This project will be discussed in detail in the following section.
3 Techniques for Remote Sensing of Environmental Features
Remote sensing data, that is, digital satellite images and scanned aerial photographs,are important information sources for monitoring the environment. Airborne and space-borne recording systems offer up-to-date and large-scale representations of the Earth’ssurface. Radar and infrared sensors go beyond the limits of the visual part of the electro-magnetic spectrum. Remote sensing usually is defined as measuring the physical propertiesof remote objects without being in contact with them. In the following we will use theterm “remote sensing” in a restricted sense. The target of the observation is always thesurface of the Earth. Electromagnetic radiation is measured in a form that can be inter-preted as “image information.”
Remote sensing data implicitly contain large amounts of information that is relevantto the state of the environment. Such features include surface temperatures, degree ofvegetation, percentage of impervious area, or land coverage classes (e.g., various kinds of
- 13 -
cultivation, water bodies, and built-up areas), and how each changes over time. The deri-vation of this kind of information from the data sources, however, is not a trivial process,but requires complex analyzing techniques. Recently, advanced computer-based proce-dures have been developed for this purpose. All these procedures are based on the inte-gration of three basic technologies, namely, image processing, geographic informationsystems, and knowledge-based systems.
3.1 REMOTE SENSING DATA
Digital image processing is the most important technique for processing remote sensingdata. Satellite data or digitized aerial photographs, which are available in the form ofraster image data, are input into the analysis process. Raster image data decompose theplane into a two-dimensional grid of picture elements known as pixels. Raster image datamay consist of several layers of information, each of which is represented by a two-dimensional matrix of numeric values. These numeric values may be interpreted as colorsor gray values.
Traditional black and white or color images are restricted to a number of one orthree layers of information in the visual part of the spectrum. In contrast, remotely sensedenvironmental data usually are multispectral data that are also related to non-visual spec-tral bands, e.g., those from the infrared part of the spectrum. By definition, the collectionof all these data that are related to a certain time and a certain geographic region is alsocalled a scene.
The possible manifestations of intensities from the particular information layers,which are also known as channels, span a feature space whose dimensionality is given bythe number of existing information layers. Therefore, multispectral raster image data maybe considered as a (mathematical) mapping that associates any pixel of a two-dimensionallocation space with an element of a multidimensional feature space.
Two different types of remote sensing systems can be differentiated: active and pas-sive systems. Active remote sensing systems independently produce electromagneticradiation and measure its reflected part. Passive remote sensing systems, however, aredependent on foreign radiation. Radiation that can be detected by remote sensors may bedivided into two categories depending on its origin:
1. Reflected radiation originally stems from the sun (e.g., light or infrared radiation) orfrom an emitter of an active remote sensing system (typically microwaves from a ra-dar system). The sensor measures the part of this radiation that has been reflected bythe Earth.
2. Emitted radiation is radiation whose source is on the Earth’s surface. The mostimportant examples for emitted radiation are heat, that is, thermal radiation from theinfrared part of the spectrum, or light from sources on the Earth’s surface which, inparticular, may be detected during the night.
It is important to know that electromagnetic radiation (whether reflected or emittedby the Earth) is subjected to various influences (e.g., atmospheric) on its way to the sensor
- 14 -
and that its intensity depends on many parameters which are independent from the data ofactual interest, namely, the reflectance or emittance of the Earth’s surface. (See the Man-ual of Remote Sensing [COLW75] for a detailed discussion of these parameters.) Experi-ence shows that, because of these influences on radiation, the same phenomenon looksdifferent on two different satellite scenes or aerial photographs. In other words, remotesensing produces relative rather than absolute measures of reflectance and emittance.Therefore, a calibration is necessary for every new analysis in order to determine quanti-tative results.
In the discussion that follows we will repeatedly refer to the Thematic Mapper (TM)sensor of the Landsat Earth observation satellites [FRED83]. This sensor has been espe-cially designed for observation of vegetation states on the Earth’s surface; therefore, it isperfectly suited for remotely sensing environmental features of the Earth’s surface. TheTM sensor is a passive system with seven different spectral channels, which producesimage data consisting of seven layers of information. Landsat’s TM sensor scans the entiresurface of the Earth within a period of 16 days. The image information recorded is aggre-gated into scenes consisting of 40 million pixels and is transmitted to the Earth. A Landsatscene stands for an area of about 180 × 180 km²; a single pixel corresponds to an area of30 × 30 m². The seven channels of the Landsat TM sensor are sensitive to three visual andfour infrared frequency bands. One of the infrared channels, channel 6, is sensitive tothermal emission.
3.2 PROCESSING METHODS
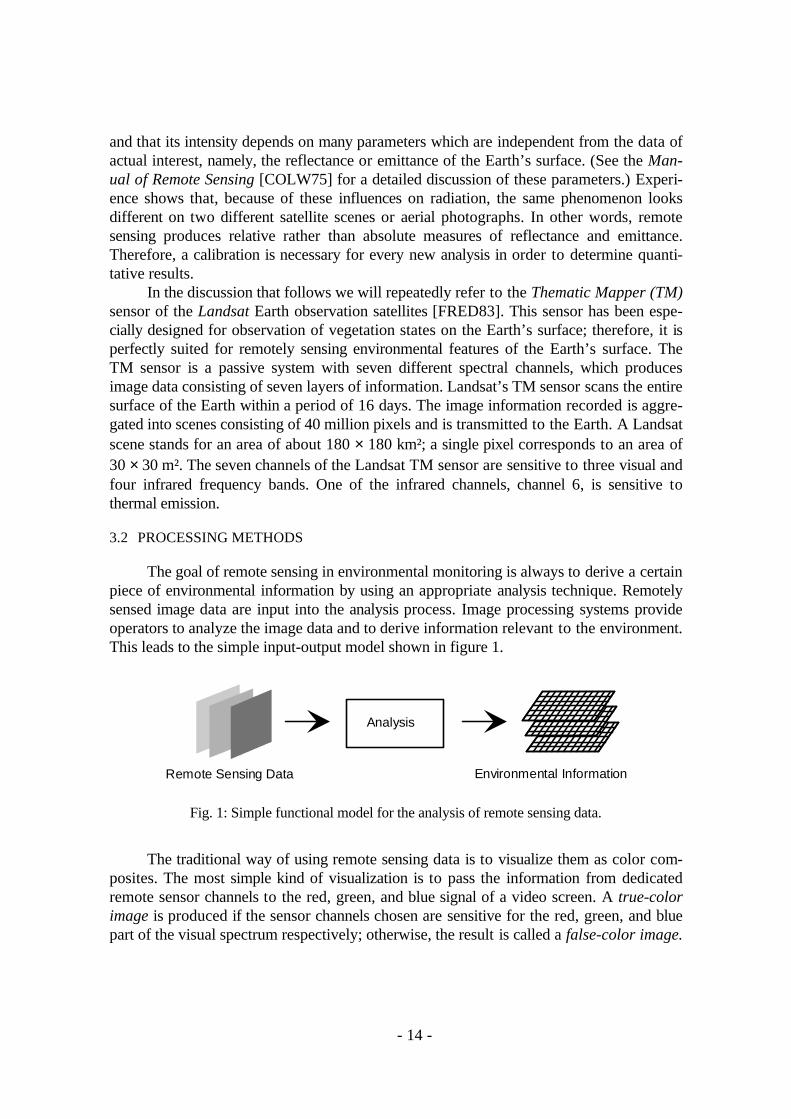
The goal of remote sensing in environmental monitoring is always to derive a certainpiece of environmental information by using an appropriate analysis technique. Remotelysensed image data are input into the analysis process. Image processing systems provideoperators to analyze the image data and to derive information relevant to the environment.This leads to the simple input-output model shown in figure 1.
The traditional way of using remote sensing data is to visualize them as color com-posites. The most simple kind of visualization is to pass the information from dedicatedremote sensor channels to the red, green, and blue signal of a video screen. A true-colorimage is produced if the sensor channels chosen are sensitive for the red, green, and bluepart of the visual spectrum respectively; otherwise, the result is called a false-color image.
Environmental InformationRemote Sensing Data
Analysis
Fig. 1: Simple functional model for the analysis of remote sensing data.
- 15 -
This way of using remote sensor data for producing images is also called iconic imageprocessing. There are many iconic methods for processing remote sensing data, such ascoordinate transforms, contrast-enhancement methods, and logical-arithmetical combina-tions of certain image layers. Iconic processing may lead to many meaningful results, suchas “vegetation images,” “thermal images,” or “contrast-enhanced presentations of water-bodies”; all of them are visualizations that can yield valuable environmental informationafter being interpreted by an expert.
The disadvantage of iconic processing is that it always remains on the surface of thephenomena observed. The results are only images that still require interpretation by aperson. For consistent automation, it has been found necessary to process the remotesensing data as a source of symbolic information rather than as pictures. This leads to animage processing technique known as symbolic or knowledge-based image processing.Symbolic techniques aim at reconstructing the objects and facts that underlie the images.For this purpose, a transition is necessary from the numeric representation of the rasterimages to a symbolic description of all components shown on the images, including theirattributes and relationships and, if necessary, an interpretation of their importance[NIEM87].
A process known as segmentation provides a transition from iconic processing to-wards symbolic processing. Individual pixels are classified according to their features andare combined into components with uniform features known as “segments.” Starting fromthe segments built corresponding to phenological criteria, the goal of symbolic processingis to derive and identify objects that correspond to the target categories of the user. In-stead of processing single, numerically coded raster-form picture elements, symbolicprocessing deals with semantic objects which are important for understanding the image.These objects belong to an object class and possess various attributes. They are associatedwith one another by relationships (e.g., neighborhood) and can be aggregated to formcomplex objects.
Most environmental objects can be identified better by the properties of their surfacerather than by their shape. Since multispectral satellite data reflect the properties of thesurface of environmental objects, symbolic information may be derived by using classifica-tion techniques which decompose the image into segments of uniform spectral signature.The intensities measured by the channels of a multispectral sensor form a multidimensionalfeature space. If the pixels from the location space are mapped into the feature space,regions of the same class (e.g., land-use class) will be typically concentrated in a cluster(fig. 2). A mathematical description of such a cluster can be given by a probability func-tion, which is typically approximated by the density function of a Gaussian normal distri-bution.
Additional geographic information (also known as ground truth) is needed in orderto identify which cluster in feature space corresponds to a land-use class in question. Anapproach often used is based on an algorithm known as supervised classification. Thisalgorithm requires training data, that is, data about regions of known land use. In the firstphase of the algorithm, also known as training phase, the cluster parameters for everyland-use class of interest are estimated from the training data. In the second phase, knownas classification phase, every pixel from the location space is mapped to the feature
- 16 -
space. The class of the pixel is determined by identifying the cluster to which it belongs[SWAI73].
A problem with this technique is that, in general, there is no one-to-one corre-spondence between the spectral classes (which can be determined from the remote sensingdata) and the land-use classes (in which users are interested). Different land-use classesmay have the same spectral properties (spectral ambiguity). Regions of the same land-useclass may have differing spectral properties (spectral variability). The task of harmonizingthe object classes to be differentiated and the reflection classes that can actually be sepa-rated is a lengthy and difficult process, which becomes necessary for every new scene tobe analyzed and is very demanding on the image analyst.
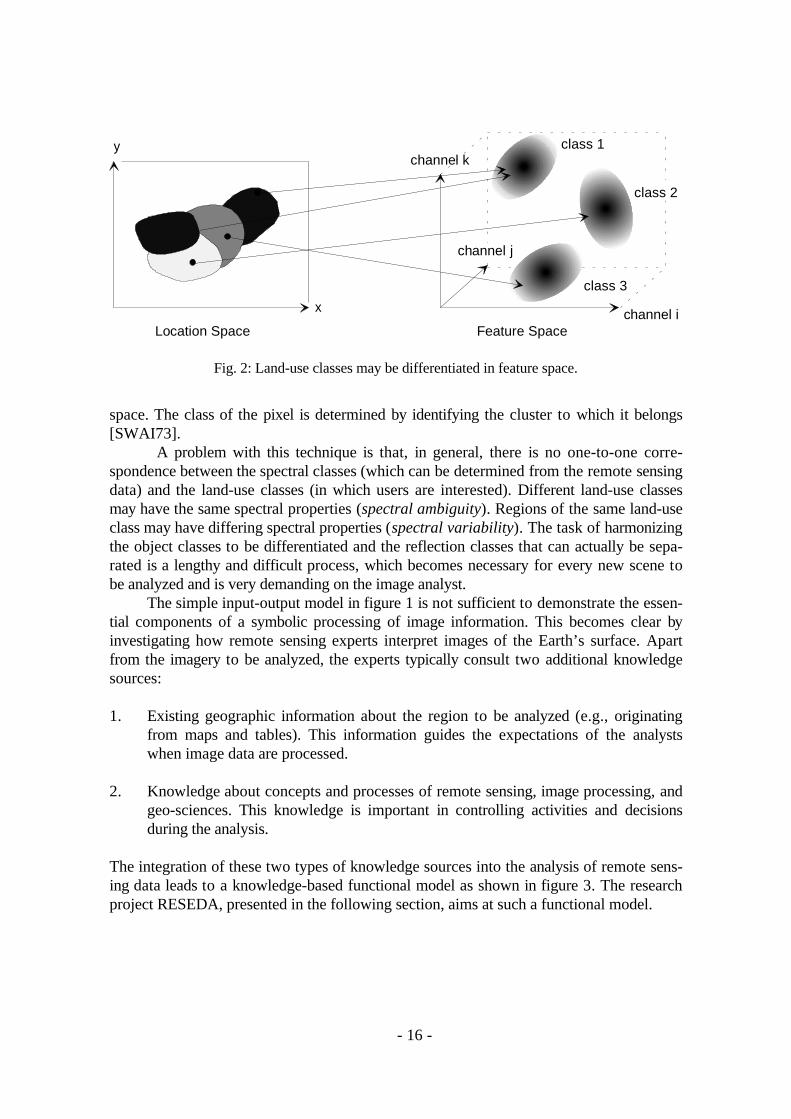
The simple input-output model in figure 1 is not sufficient to demonstrate the essen-tial components of a symbolic processing of image information. This becomes clear byinvestigating how remote sensing experts interpret images of the Earth’s surface. Apartfrom the imagery to be analyzed, the experts typically consult two additional knowledgesources:
1. Existing geographic information about the region to be analyzed (e.g., originatingfrom maps and tables). This information guides the expectations of the analystswhen image data are processed.
2. Knowledge about concepts and processes of remote sensing, image processing, and
geo-sciences. This knowledge is important in controlling activities and decisionsduring the analysis.
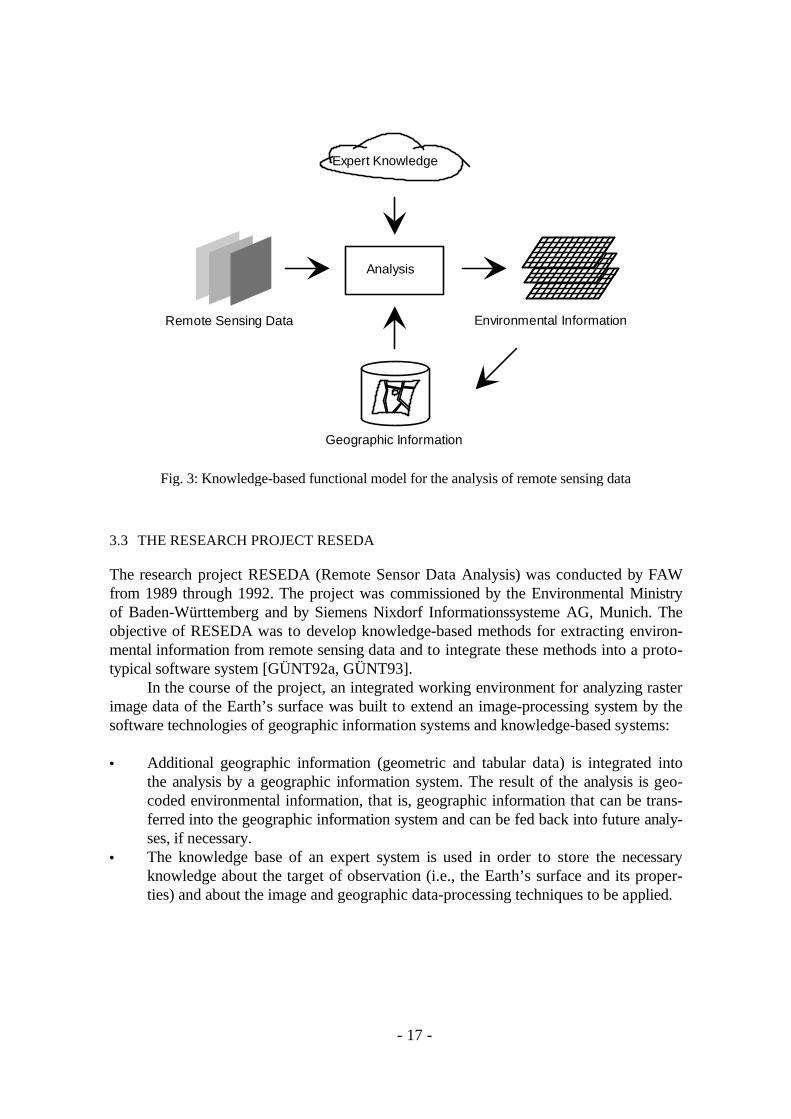
The integration of these two types of knowledge sources into the analysis of remote sens-ing data leads to a knowledge-based functional model as shown in figure 3. The researchproject RESEDA, presented in the following section, aims at such a functional model.
Location Space Feature Space
x
ychannel k
channel i
class 2
class 1
class 3
channel j
Fig. 2: Land-use classes may be differentiated in feature space.
- 17 -
3.3 THE RESEARCH PROJECT RESEDA
The research project RESEDA (Remote Sensor Data Analysis) was conducted by FAWfrom 1989 through 1992. The project was commissioned by the Environmental Ministryof Baden-Württemberg and by Siemens Nixdorf Informationssysteme AG, Munich. Theobjective of RESEDA was to develop knowledge-based methods for extracting environ-mental information from remote sensing data and to integrate these methods into a proto-typical software system [GÜNT92a, GÜNT93].
In the course of the project, an integrated working environment for analyzing rasterimage data of the Earth’s surface was built to extend an image-processing system by thesoftware technologies of geographic information systems and knowledge-based systems:
• Additional geographic information (geometric and tabular data) is integrated intothe analysis by a geographic information system. The result of the analysis is geo-coded environmental information, that is, geographic information that can be trans-ferred into the geographic information system and can be fed back into future analy-ses, if necessary.
• The knowledge base of an expert system is used in order to store the necessaryknowledge about the target of observation (i.e., the Earth’s surface and its proper-ties) and about the image and geographic data-processing techniques to be applied.
Environmental Information
Geographic Information
Remote Sensing Data
Analysis
Expert Knowledge
Fig. 3: Knowledge-based functional model for the analysis of remote sensing data
- 18 -
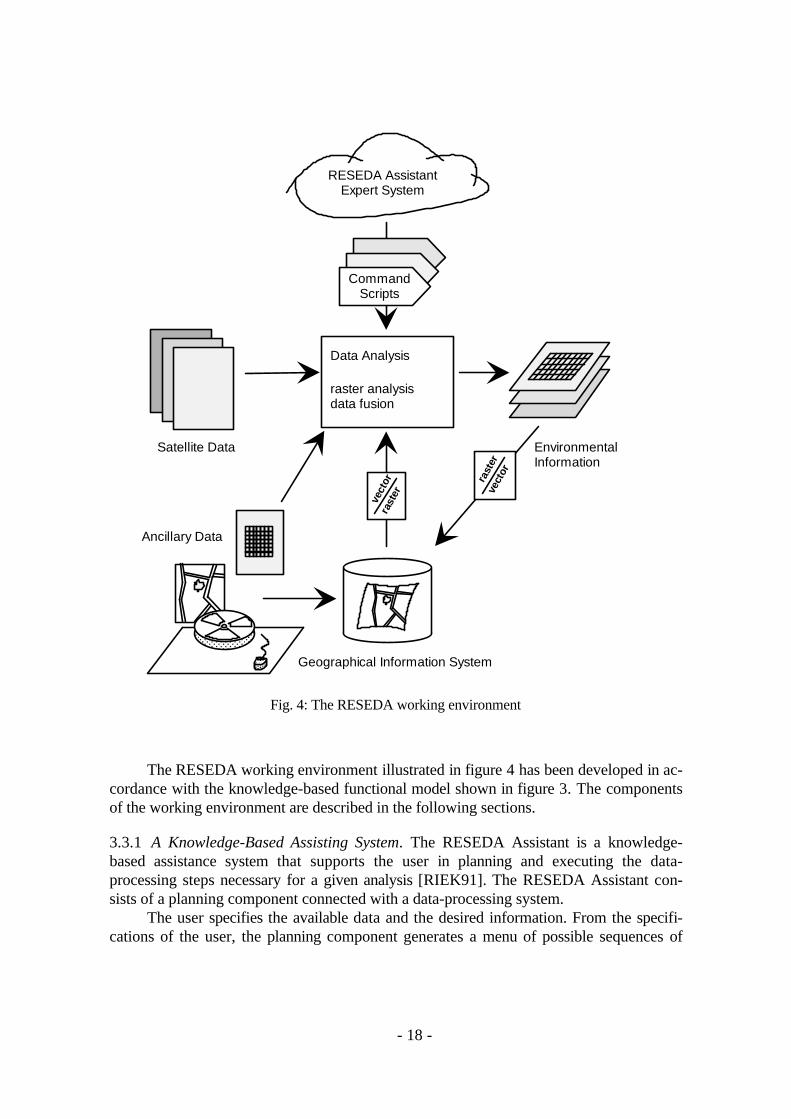
The RESEDA working environment illustrated in figure 4 has been developed in ac-cordance with the knowledge-based functional model shown in figure 3. The componentsof the working environment are described in the following sections.
3.3.1 A Knowledge-Based Assisting System. The RESEDA Assistant is a knowledge-based assistance system that supports the user in planning and executing the data-processing steps necessary for a given analysis [RIEK91]. The RESEDA Assistant con-sists of a planning component connected with a data-processing system.
The user specifies the available data and the desired information. From the specifi-cations of the user, the planning component generates a menu of possible sequences of
Ancillary Data
AAAAAAAAAAAAAAAAAAAAAAAAAAAAAAAAAAAA
AAAAAAAAAAAA
AAAAAAAAAAAAAAAAAAAAAAAAAAAA
AAAAAAAAAAAAAAAAAAAAAAAAAAAA
AAAAAAAAAAAAAAAAAAAAAAAAAAAA
AAAAAAAAAAAAAAAAAAAAAAAAAAAA
Satellite Data Environmental Information
Geographical Information System
Data Analysis
raster analysisdata fusion
RESEDA AssistantExpert System
vect
orra
ster ve
ctor
rast
er
CommandScripts
Fig. 4: The RESEDA working environment
- 19 -
data-processing steps, known as processing plans. From this menu, the user can choose aprocessing plan, which will then be executed by the data-processing system. The data-processing system includes an image-processing system and a geographic informationsystem; it consists of components of Siemens Nixdorf’s SICAD product family [SIEM93]and of project-specific extensions.
The global control strategy of the planning component is backward chaining. Thesystem first asks for the desired information. This information typically is a piece of geo-graphic information. The desired information may be described by the thematic feature ofinterest (i.e., which target classes or target attributes are to be recognized), its format(e.g., image, map, or tabular data), and by its accuracy (i.e., qualitative or quantitativeresults required). The system checks whether data with the desired properties are alreadyavailable, e.g., image data or geographic information stored in a geographic database. Ifnot available, the system tries to identify a computer-supported method that is suited tocompute the desired information from other data. If these data are not present either, thesystem recursively tries to determine methods that are able to compute these data. Therecursion stops when the system tries to determine data items that are explicitely labeledas primary data, that is, data that can immediately be used. A derivation of the requestedinformation is found if these data are also available. During this process it is possible thatmultiple alternate methods will be identified at some recursion level. If this is the case, allof these methods will be subsequently investigated. This process finally results in a deriva-tion tree that combines all possible computation methods.
After computing the derivation tree, the assistant extracts processing plans and pre-sents them to the user. The user may select a processing plan. This processing plan will betranslated into a UNIX command procedure (also known as shell script) by a plan com-piler. This shell script can be executed by the UNIX command interpreter (the shell)without the assistant expert system being active.
The expert knowledge required for planning the data-processing sequences is repre-sented in a knowledge base. Data objects and processing models are the most importantunits of this knowledge base.
Data objects represent the various kinds of data that will be computed during a dataanalysis: examples are image data or geographic data, and also tabular data such asground control point coordinates or statistical data. Data objects are knowledge baseobjects that, in addition to files of physical data, provide metainformation, that is, a de-scription of the semantics of these data.
Processing models are abstract descriptions of computer-supported methods. Fromthese descriptions, the RESEDA Assistant determines which data can be computed fromthe existing data by using a method available to the system. Processing models describethe input and output data of the method as well as how to activate a computer programthat implements this method. Constraints are defined on the attributes of the input andoutput data. These constraints are predicates which are to be fulfilled if the method isbeing applied. Constraints serve two purposes: on one hand, they can be used to checkwhether a processing model can be applied; on the other hand, missing attribute valuescan be computed by means of these constraints.
- 20 -
3.3.2 Fusion of Image Data and Geographic Information. The RESEDA working envi-ronment integrates an image-processing system and a geographic information system(GIS) thereby combining the remote sensing data with background information from aGIS. This process of combining different data sources is also called data fusion. Thegeographic background information that can be input into this data fusion includes thefollowing:
• strata, i.e., parts of the region to be analyzed in a uniform way; these parts can bedefined according to environmental, cultural, or climatic criteria;
• training regions for a supervised classification;• sampling data for calibrating regression functions, e.g., for estimating the parame-
ters used to transform thermal infrared sensor data into surface temperature values;• additional data to be included into the classification, e.g., a digital elevation model;• the geometry of the geographic objects to be investigated [BURG92, JANS90];• additional evidence for the presence of a class, e.g., a classification result from the
previous year [MIDD91].
The background information may be given in the form of raster data (i.e., digitalelevation models or scanned topographic maps) or of vector data, particularly from theAuthoritative Cadastral Map ALK or the Authoritative Topographic-Cartographic Infor-mation System ATKIS [ADV89] of the State Survey.
A particular advantage of integrating the GIS is that the results of an analysis maybe stored back into the GIS and can be reused in at least one of the two following ways:First, the results may be further analyzed by using the GIS and may be presented to theuser in a cartographic or tabular form. Second, the results may serve as background in-formation for future analyses and can be fed back into the processing system. A commer-cial database system may be used to manage and to store the background information andthe results of the analysis.
Data processing in RESEDA is typically raster-based. This is advantageous, becauseremote sensing data are always given in raster format and additional geographic data areeither already rastered or may be rastered by using an appropriate conversion program.Often it is necessary to apply formulas or short program fragments on multiple layers ofinformation on a pixel-by-pixel basis. Particularly in this way a fusion of raster data fromvarious sources is possible, as, for example, during the analysis of satellite data usingadditional geographic information. Toward this end, a tool is required that allows the userto apply definable analysis functions on raster data. The UNIX tool awk used originally toallow definition of line-by-line operations on sequential data files, was adapted to pixel-by-pixel operations on raster image data. Vector/raster and raster/vector conversion software[RIEK93] was developed to allow the integration of vector-oriented geographic data-bases. The classification of remote sensing data by integrating additional geographic in-formation is a major research issue in RESEDA. In this context, the integration of geo-graphic data during the classification process looks very promising. For this reason, theBayes classificator, which is commonly used for supervised classification, was modified.As opposed to traditional classification programs which only possess a single output file
- 21 -
containing the most probable class in a pixel-by-pixel coding, the RESEDA classifiergenerates for any class a dedicated output file which denotes for any pixel the conditionalprobability of the case that it belongs to the respective class. These probabilities may thenbe combined with additional evidence from geographic data (e.g., corresponding to themethod of Dempster and Schafer [SHAF76]). The calculations required for these methodscan be performed using the user-defined raster data analysis functions described above.
3.3.3 Prototypical application. An important part of the work in the RESEDA projectwas related to a working area known as Prototypical Application. Here FAW cooperatedwith officials from environmental agencies in Baden-Württemberg. Concrete user re-quirements were derived to support the development of new methods, and the methodswere verified in the course of practical applications. In addition, FAW explored the possi-ble use of satellite-based observation of the Earth for environmental agencies in the Stateof Baden-Württemberg [MUTZ92]. Two selected examples for monitoring the environ-ment are presented below; these were developed as part of the prototypical applicationactivities. In accordance with the mission of the project, these examples were developed inthe context of the Environmental Information System of Baden-Württemberg; their appli-cability, however, is not limited to the State territory.
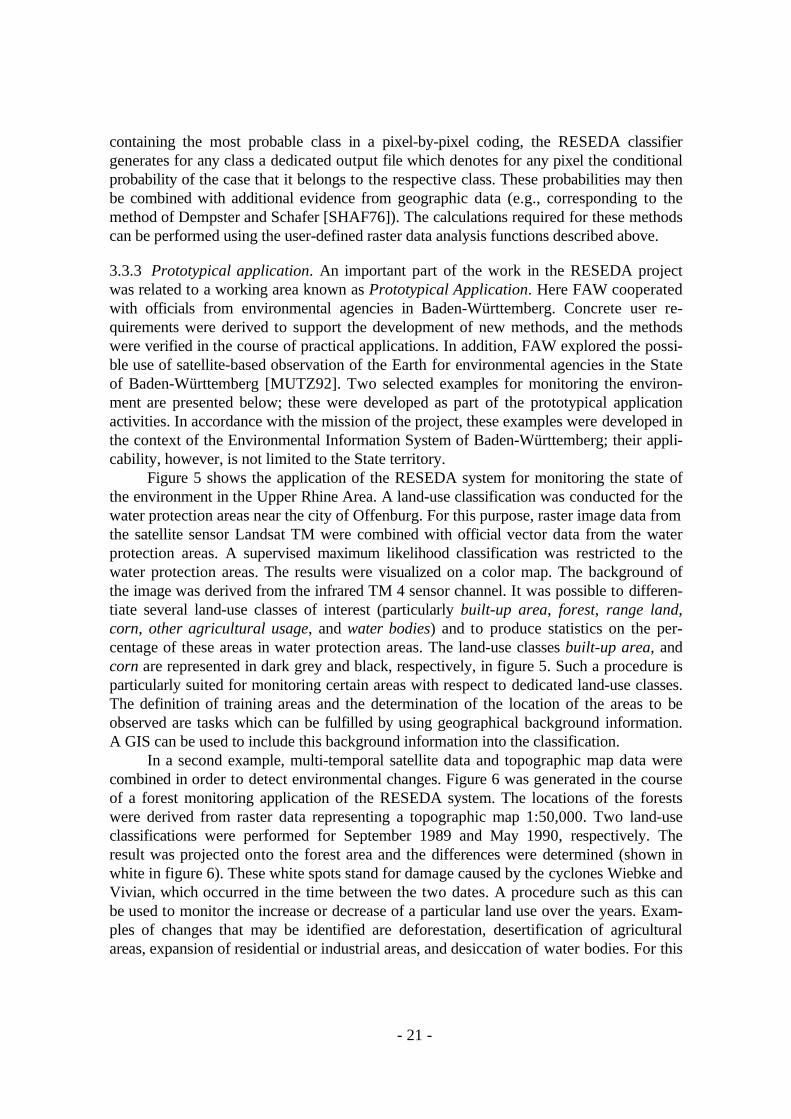
Figure 5 shows the application of the RESEDA system for monitoring the state ofthe environment in the Upper Rhine Area. A land-use classification was conducted for thewater protection areas near the city of Offenburg. For this purpose, raster image data fromthe satellite sensor Landsat TM were combined with official vector data from the waterprotection areas. A supervised maximum likelihood classification was restricted to thewater protection areas. The results were visualized on a color map. The background ofthe image was derived from the infrared TM 4 sensor channel. It was possible to differen-tiate several land-use classes of interest (particularly built-up area, forest, range land,corn, other agricultural usage, and water bodies) and to produce statistics on the per-centage of these areas in water protection areas. The land-use classes built-up area, andcorn are represented in dark grey and black, respectively, in figure 5. Such a procedure isparticularly suited for monitoring certain areas with respect to dedicated land-use classes.The definition of training areas and the determination of the location of the areas to beobserved are tasks which can be fulfilled by using geographical background information.A GIS can be used to include this background information into the classification.
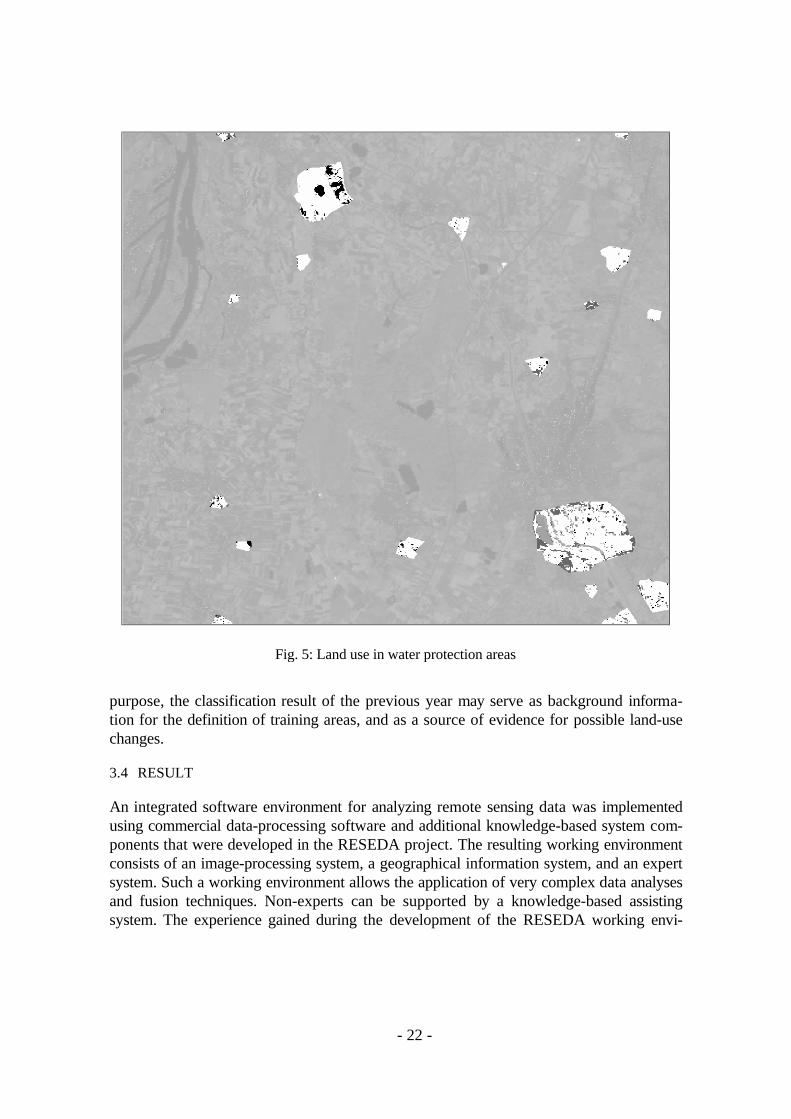
In a second example, multi-temporal satellite data and topographic map data werecombined in order to detect environmental changes. Figure 6 was generated in the courseof a forest monitoring application of the RESEDA system. The locations of the forestswere derived from raster data representing a topographic map 1:50,000. Two land-useclassifications were performed for September 1989 and May 1990, respectively. Theresult was projected onto the forest area and the differences were determined (shown inwhite in figure 6). These white spots stand for damage caused by the cyclones Wiebke andVivian, which occurred in the time between the two dates. A procedure such as this canbe used to monitor the increase or decrease of a particular land use over the years. Exam-ples of changes that may be identified are deforestation, desertification of agriculturalareas, expansion of residential or industrial areas, and desiccation of water bodies. For this
- 22 -
purpose, the classification result of the previous year may serve as background informa-tion for the definition of training areas, and as a source of evidence for possible land-usechanges.
3.4 RESULT
An integrated software environment for analyzing remote sensing data was implementedusing commercial data-processing software and additional knowledge-based system com-ponents that were developed in the RESEDA project. The resulting working environmentconsists of an image-processing system, a geographical information system, and an expertsystem. Such a working environment allows the application of very complex data analysesand fusion techniques. Non-experts can be supported by a knowledge-based assistingsystem. The experience gained during the development of the RESEDA working envi-
Fig. 5: Land use in water protection areas
- 23 -
ronment, as well as parts of the software developed, were adopted by Siemens Nixdorf’sGIS development department [REIN92].
The decision to focus one part of the project on the prototypical application of thetechniques under investigation was of crucial importance for the successful developmentof computer-based remote sensing techniques. By working on examples that are represen-tative of environmental administration tasks, FAW elaborated the potential of theRESEDA system for deriving environmental information from satellite data, and verifiedthe use of this system in cooperation with experts from environmental authorities. Al-though the methods developed were primarily designed for integration into the Environ-mental Information of System Baden-Württemberg, they are also applicable in the globalcontext.
Fig. 6: Forest monitoring using remote sensing
- 24 -
4 Conclusions and Outlook
Regular global environmental monitoring is a necessary prerequisite to preserving Earth’snatural resources. Modern techniques of environmental computer science can make animportant contribution. Efficient models, methods, and systems for environmental moni-toring are about to leave the arena of research and development; some have already beenput into practice. There are more and more initiatives worldwide on this subject, althoughthe financing is often difficult. In countries with a widely established environmental ad-ministration and a dense population, these techniques would add to the existing environ-mental protection practices, whereas in less developed or scarcely populated countries,new techniques of environmental computer science would provide totally new potentialsfor more effective environmental protection. This is particularly important for the develop-ing countries, where the respective financial requirements for a thorough environmentalmonitoring can be solved, however, only with the help of the industrial nations and com-petent international organizations (e.g., United Nations, World Bank).
The research projects described here aim at better and more reliable ways to gainextensive information over time on the state of our environment. Such information isparticularly important given the current global situation and its rapid and, in some respect,threatening development. Reliable information, including derived prognoses, is a keyprerequisite to planning useful action. Taking this into account, one aim is the establish-ment of socially agreed-upon models, based on worldwide environmental information, ofthe imminent global changes. Only after reaching this goal might there be a chance oftackling measures for the protection of humanity’s natural basis of living. “Sustainabledevelopment” can only become a real political option – and not only a slogan – if thesemeasures are factually sound and politically achievable.
REFERENCES
ADV89 Arbeitsgemeinschaft der Vermessungsverwaltungen der Länder der BundesrepublikDeutschland (AdV): Amtliches Topographisch-Kartographisches InformationssystemATKIS. Landesvermessungsamt NRW. Bonn, 1989
BREM89 Bremer, S.A.: Computer Modeling in Global and International Relations: The State ofthe Art. Social Science Computer Review 7(4), 1989
BURG92 Burger, R.; Mutz, M.: Enrichment of Governmental Surveying Data (ATKIS) byFusion with Multispectral Space-Borne Sensor Data. Extended Abstract and PosterPresentation. In: Proc. EGIS’92, Third European Conference and Exhibition on Geo-graphical Information Systems, Munich, Germany, March 23-26, 1992
CAMP90 Campbell, W.J.; Cromp, R.F.. Evolution of an Intelligent Information Fusion System.Photogrammetric Engineering and Remote Sensing 56(6):867-870, 1990
COLW83 Colwell, R.N. (ed.): Manual Of Remote Sensing. Second Edition. American Society ofPhotogrammetry. Falls Church, Virginia, USA, 1983
COUN90 Council of the European Communities: Council Directive (90/313/EEC) of 7 June1990 on the freedom of access to information on the environment. Official Journal ofthe European Communities, L158:56-58, 23 July 1990.
- 25 -
EHRL75 Ehrlich, P.R.: Population Bomb. New rev. ed. (Orig.), Ballantine Books Inc., 1975EHRL91 Ehrlich, P.R., Ehrlich A.: The Population Explosion. Touchstone Bks., Simon &
Schuster Trade, 04/1991FAW92 Forschungsinstitut für anwendungsorientierte Wissensverarbeitung (Ed.): Men-
schenbild und Überbevölkerung. Wissensverarbeitung und Gesellschaft, Vol. 4. Uni-versitätsverlag Ulm GmbH, Ulm, 1992
FLIE93 Fliedner, T.M.; Radermacher, F.J.; Greiner, C.; Bayer, U.; Edrich, J.: Identifyingresearch topics with critical significance for global trends concerning human healthand the environment. Interim Report: Standard reference data and policy assistancesystems for global health evolution. Günzburg/Donau: WHO Collaborating Center forGlobal Modeling of Health Perspectives of the International Institute for Scientific Co-operation, Schloß Reisensburg, 1993
FRED83 Freden, S.C.; Gordon Jr., F.: Landsat Satellites. In: COLW83, Vol. I, pp. 517-570GÜNT91 Günther, O.; Kuhn, H.; Mayer-Föll, R.; Radermacher, F.J. (Eds.): Konzeption und
Einsatz von Umweltinformationssystemen. Informatik-Fachberichte 301. Springer-Verlag, Berlin – Heidelberg – New York, 1991
GÜNT92aGünther, O.; Riekert, W.-F. (eds.): Wissensbasierte Methoden zur Fernerkundung derUmwelt. Wichmann-Verlag, Karlsruhe, 1992
GÜNT92bGünther, O.; Schulz, K.-P.; Seggelke, J. (eds.): Umweltanwendungen geographischerInformationssysteme. Wichmann-Verlag, Karlsruhe, 1992
GÜNT93 Günther, O.; Hess, G.; Mutz, M.; Riekert, W.-F.; Ruwwe, T.: RESEDA: A Knowl-edge-Based Advisory System for Remote Sensing. Journal of Applied Intelligence3(4):317-341, 1993.
HENN93 Henning, I.: “Von Sachdaten zur Führungsinformation” Das Umwelt-Führungs-Informationssystem Baden-Württemberg. In: JAES93, pp. 349-358
HERR76 Herrera, A.O. et al.: Catastrophe or New Society? A Latin American World Model.International Development Research Center, Ottawa, 1976
HUM92 Human Development Report 1992, published for the United Nations DevelopmentProgramme (UNDP). Oxford University Press, New York, 1992
JAES93 Jaeschke, A.; Kämpke, T.; Page, B.; Radermacher, F.J.: Informatik für den Umwelt-schutz. Springer-Verlag, Berlin – Heidelberg – New York, 1993
JANS90 Janssen, L.L.F.: GIS Supported Land Cover Classification of Satellite Images. In:Proceedings of the EGIS’90 Conference, Amsterdam, 1990
KEUN91 Keune, H.; Murray, A.B.; Benking, H.: Harmonization of Environmental Meas-urement. GeoJournal 23(3):249-255. Kluwer Academic Publishers, Dordrecht – Bos-ton, 1991
KOHM93 Kohm, J.: Das Technosphäre- und Luft-Informationssystem als Instrument für dieEntscheider in der Umweltschutzverwaltung. In: JAES93, pp. 369-380
MAYE93 Mayer-Föll, R.: Das Umweltinformationssystem Baden-Württemberg; Zielsetzung undStand der Realisierung. In: JAES93, pp. 313-337
MEAD72 Meadows, D.L. et al.: The Limits to Growth. Universe Books, New York, 1972MEAD74 Meadows, D.L. et al.: Dynamics of Growth in a Finite World. Wright-Allen Press,
Cambridge, MA, 1974MESA74 Mesarovic, M.; Pestel, E.: Mankind at the Turning Point. Hutchinson, London, 1974MIDD91 Middelkoop, H.; Janssen, L.L.F.: Knowledge-Based Image Classification. In:
GÜNT91, pp. 303-327MINI90 Ministerium für Umwelt Baden-Württemberg, McKinsey and Company, Inc.: Konzep-
tion des ressortübergreifenden Umweltinformationssystems (UIS) im Rahmen desLandessystemkonzepts Baden-Württemberg. Vol. 1-12, Stuttgart, 1987-1990.
- 26 -
MÜLL92 Müller, M.: Entwicklung des Arten-Landschafts-Biotopinformationssystems (ALBIS)als übergreifende Komponente des Umweltinformationssystems Baden-Württemberg.In: GÜNT92b, pp. 64-70
MÜLL93 Müller, M.: Entwicklung des Räumlichen Informations- und Planungssystems (RIPS)als übergreifende Komponente des Umweltinformationssystems Baden-Württemberg.In: JAES93, pp. 359-368
MUTZ92 Mutz, M.: GIS-unterstützte Auswertungen von Satellitendaten für die Zwecke derUmweltverwaltung des Landes Baden-Württemberg. In: GÜNT92a, pp. 91-110
MYER83 Myers, V.I.: Remote Sensing Applications in Agriculture. In: COLW83, Vol. II, pp.2111-2228
NIEM87 Niemann, H; Bunke, H.: Künstliche Intelligenz in Bild- und Sprachanalyse. B.G.Teubner, Stuttgart, 1987.
OEHM90 Oehme, W.: Energie und Umwelt – Die Herausforderung des nächsten Jahrhunderts. In:FAW92, pp. 159-177
PILL90 Pillmann, W.; Jaeschke, A. (eds.): Informatik für den Umweltschutz. Informatik-Fachberichte 256. Springer-Verlag, Berlin – Heidelberg – New York, 1990.
RADE91 Radermacher, F.J.: The Importance of Metaknowledge for Environmental InformationSystems. In: Günther, O.; Schek, H.-J. (eds.): Large Spatial Databases. Proceedings.LNCS 525, pp. 35-44, Springer-Verlag, Berlin – Heidelberg – New York, 1991
RADE92 Radermacher, F.J.: Identifying Research Topics with Critical Significance for GlobalTrends Concerning Environment and Human Health. In: Modeling Global Develop-ment Processes and their Relevance to Human Health. WHO-Workshop. FAW Ulm,10.-12. Sept. 1992
REIN92 Reinhardt, W.; Speer, T.; Yang, H.: Combined Vector and Raster Data Processing forEnvironmental Applications Using SICAD. Geo-Informations-Systeme 5(2):24-32.Wichmann-Verlag, Karlsruhe, 1992.
RIEK91 Riekert, W.-F.: Providing Declarative Access to a Processing System for SatelliteImage Data. In: Boley, H.; Richter, M.M. (eds.): Processing Declarative Knowledge.LNCS 567. Springer-Verlag, Berlin – Heidelberg – New York, 1991
RIEK93 Riekert, W.-F.: Extracting Area Objects from Raster Image Data. IEEE ComputerGraphics and Applications 13(2):68-73. IEEE Computer Society, Los Alamitos, CA,1993
SCHE93 Scheuer, K.: Knowledge-based Interpretation of Gas Chromatographic Data.Chemometrics and Intelligent Laboratory Systems 19:201-216, Elsevier Science Pub-lishers B.V., Amsterdam, 1993.
SHAF76 Shafer, G.: A Mathematical Theory of Evidence. University Press, Princeton, 1976SIEM93 SICAD-open. Siemens Nixdorf Informationssysteme AG, München, 1993STIF91 Stiftung Entwicklung und Frieden: Globale Trends, Daten zur Weltentwicklung.
Düsseldorf, 1991SOKO93 Sokol, G.: The Research Project ZEUS: A Method Base for Groundwater Quality
Network Design. 1994 ESRI User Conference. Proceedings. Environmental SystemsResearch Institute, Inc. (ESRI), Redlands, CA, 1994
SONT92 Sontheimer, M.: Die Erde ist voll. In: FAW92, pp. 69-84SWAI73 Swain, P.H.; Davis, S.M. (eds.): Remote Sensing: The Quantitative Approach.
McGraw-Hill, New York – Toronto, 1978WELT92 Weltentwicklungsbericht 1992, Entwicklung und Umwelt. Weltbank. Washington,
D.C., 1992WORL87 World Commission on Environment and Development: Our Common Future. Oxford
University Press, New York, 1987
- 27 -
Authors:
Oliver Günther received his Ph.D. in Computer Science from the University of Californiaat Berkeley in 1987. From 1989 until 1993, he headed the Environmental InformationSystems Division of FAW (Research Institute for Applied Knowledge Processing) in Ulm,Germany. Since 1993, he has been Professor and Director of the Institute of InformationSystems at Humboldt University in Berlin. He serves as a consultant to various govern-ment agencies and industrial companies on issues relating to information systems andenvironmental data management.
Franz Josef Radermacher is the Scientific Director and Chairman of the Board of FAW(Research Institute for Applied Knowledge Processing) in Ulm, Germany, and also Pro-fessor of Computer Science at the University of Ulm. FAW aims at the mastery of com-plex systems in application fields such as computer integrated manufacturing, enterpriseintegration / decision support systems, environmental information systems, assisting sys-tems / traffic management, communication systems / industrial software production,autonomous systems / mechatronics. FAW’s current sponsors are the State of Baden-Württemberg and the industrial companies Daimler Benz AG, Digital Equipment GmbH,Hewlett-Packard GmbH, IBM Germany GmbH, Robert Bosch GmbH, Siemens NixdorfInformationssysteme GmbH, and strässle Informationssysteme GmbH.
Wolf-Fritz Riekert is a Senior Scientist at FAW (Research Institute for Applied Knowl-edge Processing) in Ulm, Germany, where he heads the Environmental Information Sys-tems Division. He received his degree in mathematics from the University of Stuttgart in1976. After working for some time as a software consultant, he completed his doctorateon knowledge-based human-computer interaction at the University of Stuttgart in 1986.Since 1987, he has managed several projects on programming systems, image processingsystems, geographic information systems, and object-oriented databases for Siemens,Siemens Nixdorf, and the Environmental Ministry of Baden Württemberg. One of theseprojects was RESEDA (Remote Sensor Data Analysis), which was conducted at FAWUlm.


![Rep Server Monitoring Best Practices[1]](https://static.fdocuments.net/doc/165x107/55cf97f5550346d03394ac10/rep-server-monitoring-best-practices1.jpg)