ENVIRONMENTAL MANAGEMENT 0680/12 - GCE Guide
20
Cambridge IGCSE ™ This document has 20 pages. Blank pages are indicated. DC (DH/FC) 192726/4 © UCLES 2020 [Turn over *6656774929* ENVIRONMENTAL MANAGEMENT 0680/12 Paper 1 Theory October/November 2020 1 hour 45 minutes You must answer on the question paper. No additional materials are needed. INSTRUCTIONS ● Answer all questions. ● Use a black or dark blue pen. You may use an HB pencil for any diagrams or graphs. ● Write your name, centre number and candidate number in the boxes at the top of the page. ● Write your answer to each question in the space provided. ● Do not use an erasable pen or correction fluid. ● Do not write on any bar codes. ● You may use a calculator. ● You should show all your working and use appropriate units. INFORMATION ● The total mark for this paper is 80. ● The number of marks for each question or part question is shown in brackets [ ].
Transcript of ENVIRONMENTAL MANAGEMENT 0680/12 - GCE Guide

Cambridge IGCSE™
This document has 20 pages. Blank pages are indicated.
DC (DH/FC) 192726/4© UCLES 2020 [Turn over
*6656774929*
ENVIRONMENTAL MANAGEMENT 0680/12
Paper 1 Theory October/November 2020
1 hour 45 minutes
You must answer on the question paper.
No additional materials are needed.
INSTRUCTIONS ● Answer all questions. ● Use a black or dark blue pen. You may use an HB pencil for any diagrams or graphs. ● Write your name, centre number and candidate number in the boxes at the top of the page. ● Write your answer to each question in the space provided. ● Do not use an erasable pen or correction fluid. ● Do not write on any bar codes. ● You may use a calculator. ● You should show all your working and use appropriate units.
INFORMATION ● The total mark for this paper is 80. ● The number of marks for each question or part question is shown in brackets [ ].

2
0680/12/O/N/20© UCLES 2020
Section A
1 The diagram shows how electricity can be generated using hydroelectric power.
dam wall
water inreservoir
sluicegate generator
turbine
groundground
(a) Use the diagram to explain how electricity is generated using a hydroelectric power station.
...................................................................................................................................................
...................................................................................................................................................
...................................................................................................................................................
...................................................................................................................................................
...................................................................................................................................................
............................................................................................................................................. [3]
(b) State one impact of a hydroelectric power station on the environment.
...................................................................................................................................................
............................................................................................................................................. [1]
(c) Other than impact on the environment, suggest reasons why some countries do not have any hydroelectric power stations.
...................................................................................................................................................
...................................................................................................................................................
...................................................................................................................................................
............................................................................................................................................. [2]
[Total: 6]

3
0680/12/O/N/20© UCLES 2020 [Turn over
2 The photograph shows mesh tanks in the sea where fish are farmed.
mesh tank
(a) Suggest the purpose of the mesh tanks shown in the photograph.
...................................................................................................................................................
............................................................................................................................................. [1]
(b) Fish farming can help to reduce the number of wild fish caught.
State two other strategies to reduce overfishing of wild fish.
1 ................................................................................................................................................
...................................................................................................................................................
2 ................................................................................................................................................
................................................................................................................................................... [2]
(c) Suggest two negative effects of fish farming on the environment.
1 ................................................................................................................................................
...................................................................................................................................................
2 ................................................................................................................................................
................................................................................................................................................... [2]
[Total: 5]
4
0680/12/O/N/20© UCLES 2020
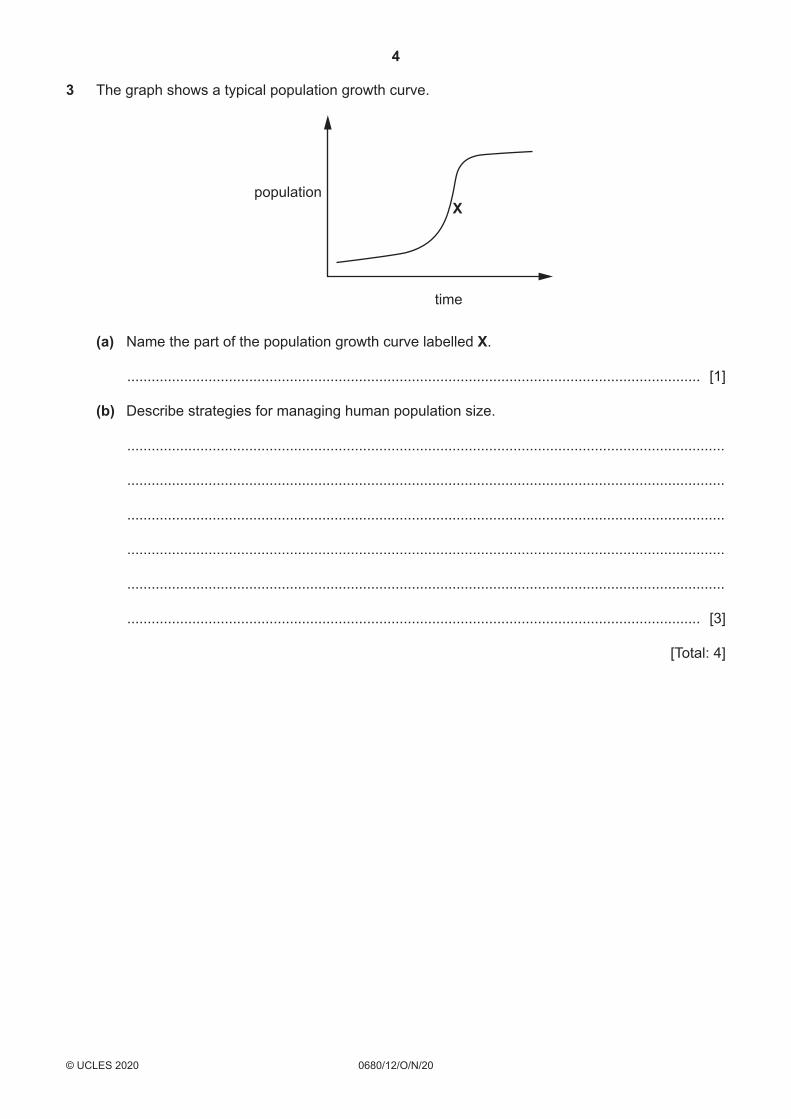
3 The graph shows a typical population growth curve.
population
time
X
(a) Name the part of the population growth curve labelled X.
............................................................................................................................................. [1]
(b) Describe strategies for managing human population size.
...................................................................................................................................................
...................................................................................................................................................
...................................................................................................................................................
...................................................................................................................................................
...................................................................................................................................................
............................................................................................................................................. [3]
[Total: 4]
5
0680/12/O/N/20© UCLES 2020 [Turn over
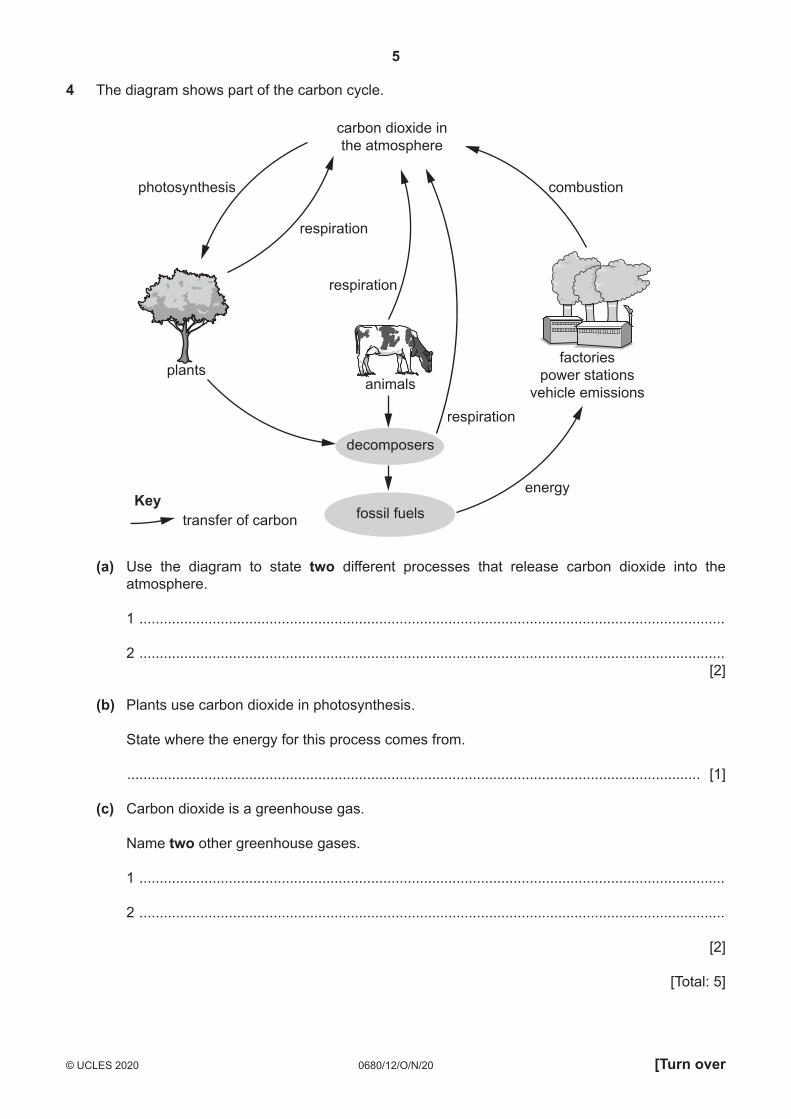
4 The diagram shows part of the carbon cycle.
carbon dioxide inthe atmosphere
respiration
respiration
respiration
energy
plants
Key
animals
decomposers
fossil fuelstransfer of carbon
photosynthesis combustion
factoriespower stations
vehicle emissions
(a) Use the diagram to state two different processes that release carbon dioxide into the atmosphere.
1 ................................................................................................................................................
2 ................................................................................................................................................ [2]
(b) Plants use carbon dioxide in photosynthesis.
State where the energy for this process comes from.
............................................................................................................................................. [1]
(c) Carbon dioxide is a greenhouse gas.
Name two other greenhouse gases.
1 ................................................................................................................................................
2 ................................................................................................................................................
[2]
[Total: 5]

6
0680/12/O/N/20© UCLES 2020
Section B
5 (a) Access to safe drinking water is different around the world.
(i) Suggest reasons why fewer people have access to safe drinking water in Africa than in North America.
...........................................................................................................................................
...........................................................................................................................................
...........................................................................................................................................
..................................................................................................................................... [2]
(ii) A well is one way for people to access fresh water.
State three other sources of fresh water.
1 ........................................................................................................................................
...........................................................................................................................................
2 ........................................................................................................................................
...........................................................................................................................................
3 ........................................................................................................................................
........................................................................................................................................... [3]
7
0680/12/O/N/20© UCLES 2020 [Turn over
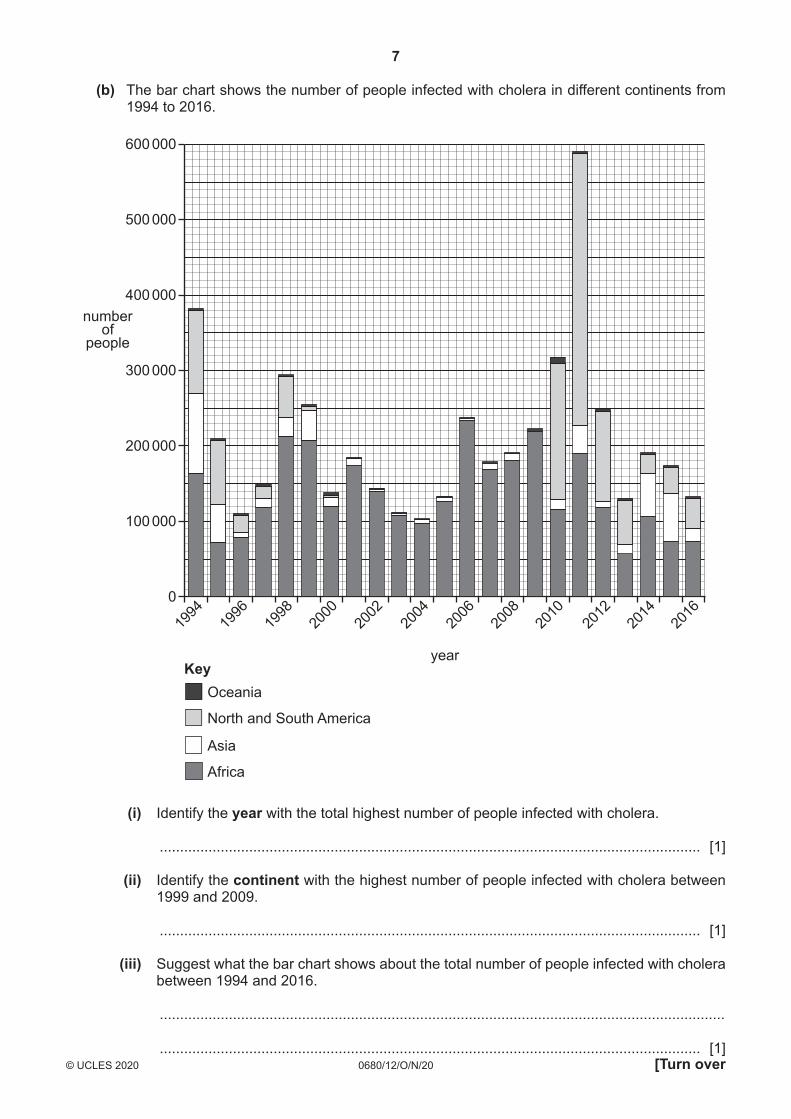
(b) The bar chart shows the number of people infected with cholera in different continents from 1994 to 2016.
1994
1996
1998
2000
2002
2004
2006
2008
2010
2012
2014
2016
year
OceaniaKey
North and South America
Asia
Africa
0
100 000
200 000
300 000
numberof
people
400 000
500 000
600 000
(i) Identify the year with the total highest number of people infected with cholera.
..................................................................................................................................... [1]
(ii) Identify the continent with the highest number of people infected with cholera between 1999 and 2009.
..................................................................................................................................... [1]
(iii) Suggest what the bar chart shows about the total number of people infected with cholera between 1994 and 2016.
...........................................................................................................................................
..................................................................................................................................... [1]

8
0680/12/O/N/20© UCLES 2020
(c) Suggest reasons why there can be an outbreak of cholera after a natural disaster.
...................................................................................................................................................
...................................................................................................................................................
...................................................................................................................................................
............................................................................................................................................. [2]
[Total: 10]

9
0680/12/O/N/20© UCLES 2020 [Turn over
6 (a) A food chain in a forest ecosystem is shown.
tree caterpillar small bird hawk
(i) Explain what the arrow represents in this food chain.
...........................................................................................................................................
..................................................................................................................................... [1]
(ii) Name the tertiary consumer in this food chain.
..................................................................................................................................... [1]
(iii) Suggest what could happen to the number of caterpillars in this food chain if all the small birds died.
Give a reason for your answer.
number of caterpillars ........................................................................................................
reason ...............................................................................................................................
........................................................................................................................................... [1]
(b) The fact sheet shows information about wetlands.
Wetlands
Wetlands are important in many ways:
● Wetlands provide a habitat for a variety of different plants and animals.
● Wetlands control flooding by taking up water from tides and rivers.
● Wetlands act as filters, cleaning water and trapping toxins.
● Wetlands provide leisure facilities such as canoeing, fishing and birdwatching.
(i) Use the fact sheet to explain why wetlands are important for maintaining biodiversity.
...........................................................................................................................................
...........................................................................................................................................
...........................................................................................................................................
..................................................................................................................................... [2]
10
0680/12/O/N/20© UCLES 2020
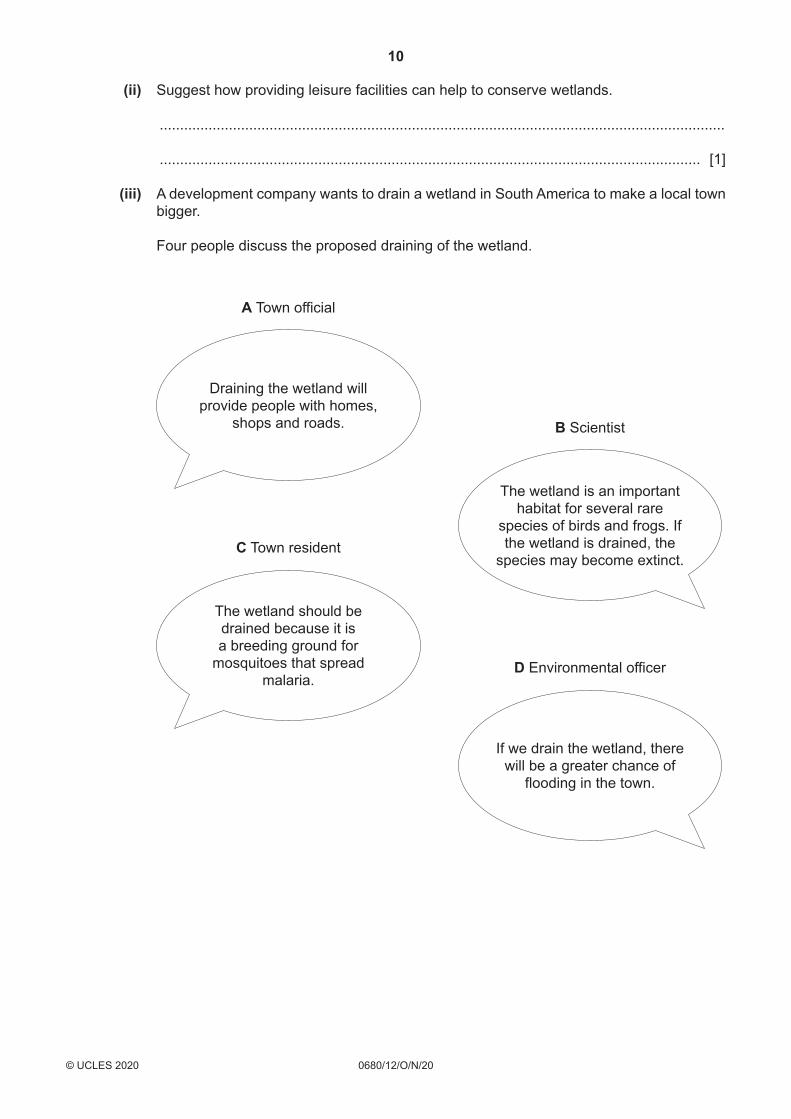
(ii) Suggest how providing leisure facilities can help to conserve wetlands.
...........................................................................................................................................
..................................................................................................................................... [1]
(iii) A development company wants to drain a wetland in South America to make a local town bigger.
Four people discuss the proposed draining of the wetland.
Draining the wetland will provide people with homes,
shops and roads.
A Town official
The wetland is an important habitat for several rare
species of birds and frogs. If the wetland is drained, the
species may become extinct.
B Scientist
The wetland should be drained because it is a breeding ground for
mosquitoes that spread malaria.
C Town resident
If we drain the wetland, there will be a greater chance of
flooding in the town.
D Environmental officer

11
0680/12/O/N/20© UCLES 2020 [Turn over
Do you think the wetland should be drained?
Support your view with reference to the comments made by the different people.
...........................................................................................................................................
...........................................................................................................................................
...........................................................................................................................................
...........................................................................................................................................
...........................................................................................................................................
...........................................................................................................................................
...........................................................................................................................................
...........................................................................................................................................
...........................................................................................................................................
...........................................................................................................................................
...........................................................................................................................................
...........................................................................................................................................
...........................................................................................................................................
..................................................................................................................................... [7]
[Total: 13]

12
0680/12/O/N/20© UCLES 2020
7 (a) Marble and slate are metamorphic rocks.
Describe the formation of metamorphic rocks.
...................................................................................................................................................
...................................................................................................................................................
...................................................................................................................................................
............................................................................................................................................. [2]
(b) The bar chart shows the number of people employed in the coal mining industry in the USA from 2012 to 2016.
year2012 2013 2014 2015 2016
total number of people employed in coal mining
Key
number of people working underground in coal mining
0
20 000
40 000
60 000number
ofpeople
80 000
100 000
10 000
30 000
50 000
70 000
90 000
(i) Complete the bar chart to show that the number of people working underground in coal mining in 2015 was 40 100. [1]
(ii) In 2013, a total of 89 900 people were employed in the coal mining industry in the USA. The number of people working underground in coal mining was 54 500.
Calculate the percentage of people working underground in coal mining in 2013.
...................................................... % [1]

13
0680/12/O/N/20© UCLES 2020 [Turn over
(iii) Suggest reasons why the total number of people employed in the coal mining industry in the USA decreased after 2013.
...........................................................................................................................................
...........................................................................................................................................
...........................................................................................................................................
..................................................................................................................................... [2]
(c) The photograph shows part of an opencast coal mine.
(i) The coal mine provides employment for local people.
Describe other benefits a coal mine can have for local people.
...........................................................................................................................................
...........................................................................................................................................
...........................................................................................................................................
...........................................................................................................................................
...........................................................................................................................................
..................................................................................................................................... [3]
(ii) State two ways the land can be used after the coal mine closes.
1 ........................................................................................................................................
2 ........................................................................................................................................ [2]

14
0680/12/O/N/20© UCLES 2020
(d) Some countries are burning less coal to reduce carbon dioxide emissions. These countries are using other energy resources such as nuclear, wind and solar power.
Suggest reasons why some countries continue to use coal as an energy resource.
...................................................................................................................................................
...................................................................................................................................................
...................................................................................................................................................
...................................................................................................................................................
...................................................................................................................................................
............................................................................................................................................. [3]
[Total: 14]

15
0680/12/O/N/20© UCLES 2020 [Turn over
BLANK PAGE

16
0680/12/O/N/20© UCLES 2020
8 A scientist investigates the effect of nitrogen fertiliser on the yield of corn plants.
The table shows the results.
mass of nitrogen fertiliser applied/ kg per hectare
yield of corn/ kg per hectare
increase in yield of corn/ kg
0 814 0
10 1142 328
20 1305 .............
30 1393 579
40 1417 603
50 1441 627
60 1441 627
(a) (i) Complete the table to calculate the increase in yield of corn when 20 kg per hectare of nitrogen fertiliser is applied compared to 0 kg per hectare. [1]
(ii) Plot, on the grid, a line graph of the increase in yield of corn against mass of nitrogen fertiliser applied.
[4]
17
0680/12/O/N/20© UCLES 2020 [Turn over
(iii) Use the data to predict what will happen to the yield of corn if 70 kg per hectare of nitrogen fertiliser is applied.
...........................................................................................................................................
..................................................................................................................................... [1]
(iv) Suggest two environmental factors that can cause a change in the yield of corn.
1 ........................................................................................................................................
...........................................................................................................................................
2 ........................................................................................................................................
........................................................................................................................................... [2]
(b) Overuse of fertilisers can cause river pollution.
Explain how fertilisers get into rivers.
...................................................................................................................................................
...................................................................................................................................................
...................................................................................................................................................
............................................................................................................................................. [2]
(c) Crop yield can be increased by using genetically modified plants.
Explain two ways genetically modified plants can increase yield.
1 ................................................................................................................................................
...................................................................................................................................................
2 ................................................................................................................................................
................................................................................................................................................... [2]
[Total: 12]

18
0680/12/O/N/20© UCLES 2020
9 A student reads some information about flooding in Bangladesh.
Flooding in Bangladesh
Bangladesh is a very low-lying country in Asia. Bangladesh has large rivers that split into many smaller rivers near the sea. These smaller rivers are surrounded by flood plains. Flood plains are areas of land that are covered by water when rivers overflow.
Every year, during the wet season, there is flooding. After flooding, a layer of nutrient-rich sediment is left on the land. This makes the soil very fertile.
In some years, the flooding in Bangladesh is very large-scale. In 1987, 57 300 km2 of land was flooded. In 1988, another big flood covered 82 000 km2 of land. The flood of 1998 covered 77 700 km2 of land. In 2004, about 70 800 km2 of land was flooded.
(a) (i) State the meaning of flood plain.
...........................................................................................................................................
..................................................................................................................................... [1]
(ii) Use the information about flooding in Bangladesh to give one reason why flood plains are important.
...........................................................................................................................................
..................................................................................................................................... [1]
(b) Present the data from the information in a suitable table to show the area of land flooded in each year given.
[3]

19
0680/12/O/N/20© UCLES 2020
(c) The student says,
Small-scale flooding is a good thing, even though it
can cause damage.
To what extent do you agree with this statement? Give reasons for your answer.
...................................................................................................................................................
...................................................................................................................................................
...................................................................................................................................................
...................................................................................................................................................
...................................................................................................................................................
...................................................................................................................................................
...................................................................................................................................................
...................................................................................................................................................
...................................................................................................................................................
...................................................................................................................................................
...................................................................................................................................................
...................................................................................................................................................
...................................................................................................................................................
...................................................................................................................................................
............................................................................................................................................. [6]
[Total: 11]

20
0680/12/O/N/20© UCLES 2020
BLANK PAGE
The boundaries and names shown, the designations used and the presentation of material on the maps contained in this question paper/insert do not imply official endorsement or acceptance by Cambridge Assessment International Education concerning the legal status of any country, territory, or area or any of its authorities, or of the delimitation of its frontiers or boundaries.
Permission to reproduce items where third-party owned material protected by copyright is included has been sought and cleared where possible. Every reasonable effort has been made by the publisher (UCLES) to trace copyright holders, but if any items requiring clearance have unwittingly been included, the publisher will be pleased to make amends at the earliest possible opportunity.
To avoid the issue of disclosure of answer-related information to candidates, all copyright acknowledgements are reproduced online in the Cambridge Assessment International Education Copyright Acknowledgements Booklet. This is produced for each series of examinations and is freely available to download at www.cambridgeinternational.org after the live examination series.
Cambridge Assessment International Education is part of the Cambridge Assessment Group. Cambridge Assessment is the brand name of the University of Cambridge Local Examinations Syndicate (UCLES), which itself is a department of the University of Cambridge.