Environmental Impact Statement - · PDF fileCM04 and Dredging Method Statement 14.7...
153
Environmental Impact Statement Volume 3 Upgrading Double Bay Marina 8 Castra Place, Double Bay Date of Issue: 10 th December, 2007 Project No: 05027 Status: Submission to Woollahra Council Issue No: 1
Transcript of Environmental Impact Statement - · PDF fileCM04 and Dredging Method Statement 14.7...

Environmental Impact Statement
Volume 3
Upgrading Double Bay Marina 8 Castra Place, Double Bay
Date of Issue: 10th December, 2007 Project No: 05027 Status: Submission to Woollahra Council Issue No: 1

UPGRADING DOUBLE BAY MARINA ENVIRONMENTAL IMPACT STATEMENT
Contents Volume 1 1. Scope
2. Executive Summary
3. Proposed Development
4. Justification for the Proposal
5. Community Consultation
6. Statutory Context
7. Requirements of The Director General of The Department of Planning
8. The Location
9. Affected Environment
10. Existing Marina
11. Assessment of Alternatives
12. Identified Issues
13. Environmental Assessment
13.1 Land Surface 13.2 Maritime Issues 13.3 Water Quality & Waste Management Issues 13.4 Air Quality 13.5 Noise 13.6 Visual Impact 13.7 Aquatic Flora Issues 13.8 Aquatic Fauna Issues 13.9 Social Issues 13.10 Land Transport and Parking Issues 13.11 Water Transport Issues 13.12 Hazard Assessment 13.13 Economic Issues 13.14 Cumulative Impacts
TAYLOR LAUDER BERSTEN PTY LTD PAGE 1 PROJECT NO: 05027 SUBMISSION TO WOOLLAHRA COUNCIL 10TH DECEMBER, 2007

UPGRADING DOUBLE BAY MARINA ENVIRONMENTAL IMPACT STATEMENT
TAYLOR LAUDER BERSTEN PTY LTD PROJECT NO: 05027
PAGE 2 SUBMISSION TO WOOLLAHRA COUNCIL
10TH DECEMBER, 2007
13.15 Approvals and Licences 13.16 Mitigating Measures
14. Attachments
14.1 Drawings DA01, DA02, DA03, DA04, DA05, DA06, DA07, DA08, DA09, DA10, DA11, DA12, DA100, DA101, DA103, SI-1
14.2 Street Map 14.3 NSW Maritime Authority Plans 14.4 Hydrographic Survey Drawing by Harvey Hydrographic Surveys 14.5 Site Survey Plan 14.6 Construction Management Plan – Drawings CM01, CM02, CM03,
CM04 and Dredging Method Statement 14.7 Photographs of Indicative Elements
Volume 2 14.8 Community Consultation Report by Mediate Today
14.9 Visual Assessment Report by Richard Lamb and Associates 14.10 Parking and Traffic Report by Christopher Hallam and Associates
Volume 3 14.11 Sediment Assessment and Waste Classification Report by URS 14.12 Berth Demand Report by Australian Marina Management Pty. Ltd. 14.13 Coastal Processes Reports by Gary Blumberg & Associates Pty. Ltd.
Volume 4
14.14 Aquatic Ecology Report by W.S. Rooney & Associates Pty. Ltd. 14.15 Noise Assessment Report by Heggies Pty Ltd 14.16 Heritage Report by Planning Workshop 14.17 Development Consent for Current Marina 14.18 Berth Waiting List 14.19 Minutes of Pre DA Meeting 14.20 Letter from The Director General of The Department of Planning with
attachments 14.21 Letter from the Department of Planning confirming that Woollahra is
the Consent Authority

UPGRADING DOUBLE BAY MARINA ENVIRONMENTAL IMPACT STATEMENT
14.11 SEDIMENT ASSESSMENT & WASTE CLASSIFICATION REPORT BY URS
TAYLOR LAUDER BERSTEN PTY LTD SUBMISSION TO WOOLLAHRA COUNCIL 10TH DECEMBER, 2007 PROJECT NO: 05027

F I N A L R E P O R T
Upgrading Double Bay Marina Castra Place, Double Bay Assessment of Sediment Contamination and Waste Classification
Prepared for
Taylor Lauder Bersten Pty Ltd 514 Miller Street, Cammeray, NSW, 2062
1 May 2007
43217511


Contents
J:\JOBS\43217511\TLB- DOUBLE BAY MARINA\DELIVERABLES\FINAL REPORT\FINAL REPORT R001.DOC\
i
1 Introduction------------------------------------------------------------------------------------------------- 1-1
1.1 Background 1-1 1.2 Site Description 1-1
1.2.1 Site Location 1-1 1.2.2 Site History and Proposed Marina Upgrade 1-1
1.3 Objective 1-1 1.4 Scope of Works 1-2
2 Methodology------------------------------------------------------------------------------------------------ 2-1
2.1 Assessment Guidelines 2-1 2.2 Sediment Sampling 2-2 2.3 Sediment Analysis 2-3 2.4 Water Quality Sampling 2-3
3 Results-------------------------------------------------------------------------------------------------------- 3-1
3.1 Sediment Grain Size 3-1 3.2 Sediment Chemistry (March 2006 Sampling Round) 3-1
3.2.1 Contaminant Concentrations 3-1 3.2.2 AVS/SEM Analysis 3-2 3.2.3 SPOCAS Analysis 3-2
3.3 Sediment Chemistry (May 2006 Sampling Round) 3-3 3.4 Water Quality (Dry Weather – Wet Weather) 3-3
4 Discussion -------------------------------------------------------------------------------------------------- 4-1
4.1 Sediment Waste Classification 4-1 4.2 Sediment Disposal Options 4-2 4.3 Water Quality 4-2
5 Conclusions ------------------------------------------------------------------------------------------------ 5-1
6 References -------------------------------------------------------------------------------------------------- 6-1
7 Limitations -------------------------------------------------------------------------------------------------- 7-1

List of Tables, Figure & Appendices
J:\JOBS\43217511\TLB- DOUBLE BAY MARINA\DELIVERABLES\FINAL REPORT\FINAL REPORT R001.DOC\
ii
Figure
Figure 1 Sediment and Water Sample Locations
Tables
Table 1. Details of Sediment Sampling
Table 2. Fine Fraction (<63 μm) in Sediment Samples
Table 3. Analytical Results and Waste Classification
Table 4. Water Quality Sampling Data at Sites 1 and 2 During Dry Weather and Wet Weather (all in mg/L unless specified otherwise)
Appendix A
Particle Size Distribution Test Reports and Percent Carbonate Test Report
Appendix B
Laboratory Certificates of Analysis for Chemical Analysis of Sediment Samples
Appendix C
Laboratory Certificates of Analysis for TCLP Testing of Sediment Samples
Appendix D
Laboratory Certificates of Analysis for Water Samples
Appendix E
Laboratory Certificates of Analysis for AVS/SEM Analysis of Sediment Samples
Appendix F
Laboratory Certificates of Analysis for Acid Sulphate Soil Testing for Sediment Samples
Appendix G
95% UCL Calculations

SECTION 1 Introduction
J:\JOBS\43217511\TLB- DOUBLE BAY MARINA\DELIVERABLES\FINAL REPORT\FINAL REPORT R001.DOC\
1-1
1 Introduction
1.1 Background
URS Australia Pty Ltd (URS) and W.S. Rooney and Associates Pty Ltd were commissioned jointly by Taylor Lauder Bersten Pty Ltd (TLB) to undertake a site contamination assessment of sediments, as part of a proposed upgrading of the existing marina at 8 Castra Place, Double Bay. The work carried out by URS was undertaken in accordance with a proposal dated 12 April 2006.
1.2 Site Description
1.2.1 Site Location
Double Bay Marina is situated in southwestern Double Bay, approximately 4 km east of the Sydney CBD. Site access by land is from Castra Place.
1.2.2 Site History and Proposed Marina Upgrade
The existing marina consists of 51 wet berths in a fixed structure and 14 swing moorings with a maximum size of vessel as 15.5 m. The existing structure has deteriorated to such an extent that rebuilding the structure will be necessary in the next two years (Taylor Lauder Bersten, 2006). Sedimentation has caused a significant reduction in water depth around the marina making maintenance dredging and the removal of bed material necessary. Double Bay Marina proposes to replace the existing fixed structures with a new floating structure containing 65 wet berths. The 25 swing mooring sites will be forfeited.
The marina is adjacent to the exits of two large stormwater drains which collect water from Woollahra, Bellevue Hill and parts of North Bondi (Laxton, 1993).
The works proposed for upgrading the marina include:
a) Removal of the existing structures;
b) Construction of a new floating structure;
c) Replacement of the existing slab in the boat maintenance area with a new bunded slab and waste water treatment system to satisfy DEC, NSW requirements; and
d) Removal of 3,800 m3 of in situ bed material and off-site disposal to a suitably licensed landfill.
1.3 Objective
The objective of the current investigation is:

SECTION 1 Introduction
J:\JOBS\43217511\TLB- DOUBLE BAY MARINA\DELIVERABLES\FINAL REPORT\FINAL REPORT R001.DOC\
1-2
• Assess contamination of existing sediments within the proposed dredge footprint area at Double Bay Marina;
• Classify the sediments proposed for dredging in accordance with DEC NSW (2004) guidelines; and
• Assess the disposal options of dredged bed material.
1.4 Scope of Works
The scope of works includes:
• Assess the distribution of contaminants in sediment proposed for dredging;
• Classify sediment in accordance with DEC NSW (2004) waste assessment guidelines; and
• Outline possible disposal options, using screening under relevant environmental guidelines.

SECTION 2 Methodology
J:\JOBS\43217511\TLB- DOUBLE BAY MARINA\DELIVERABLES\FINAL REPORT\FINAL REPORT R001.DOC\
2-1
2 Methodology
2.1 Assessment Guidelines
The assessment methodology for sediment quality investigations is dependent on the disposal methods, relevant guidance document and dredging/transport options. Assessment of sediment for disposal to landfill under the Environmental Guidelines: Assessment, Classification and Management of Liquid and Non-Liquid Wastes (NSW DEC, 2004) (the ‘Waste Guidelines’) requires assessment of representative material proposed for disposal. Waste classification for disposal at landfill would be undertaken on ex situ material stockpiled following dredging, and treated in accordance with landfill requirements (notably for materials with high moisture content and acid generating potential).
Previous investigations of sediment quality in Double Bay by Patterson Britton & Partners Pty Ltd (PBP) (2003) and Taylor (2000) indicated that in the samples taken east of the existing marina, concentrations of some contaminants (lead (Pb), benzo(a)pyrene and, to a lesser extent, arsenic (As), mercury (Hg) and nickel (Ni)), exceed ANZECC/ARMCANZ (2000) sediment quality guidelines values.
A hierarchical assessment of the sediment contamination at Double Bay Marina is being undertaken, adopting the Waste Guidelines, which stipulate a range of contaminant threshold (CT) values for waste classification of non-liquid wastes (NSW DEC, 2004). This classification allows for an assessment of the sediment contamination in terms of possible disposal of the dredged sediments at landfill. The initial waste classifications range from inert waste (<CT1) to solid waste (>CT1), industrial waste (>CT2) and hazardous waste (>CT3). Exceedences of the solid phase total concentrations (CT1 to CT3) of individual contaminants require a further assessment of the leachable (TCLP) fraction of total contaminant concentrations (SCC) to assess the final waste classification of the material.
Waste materials with analyte concentrations that exceed Solid Waste and Industrial Waste guideline values can go direct to landfill, although some contaminants (i.e. mercury) may trigger the requirement for treatment.
Waste classifications in the NSW DEC (2004) Waste Guidelines involve analysis of a large range of contaminants (Table A3 (with Addendum), Table A4 and Table A7). These contaminants include organic and inorganic compounds - herbicides, fungicides, polycyclic aromatic hydrocarbons (PAHs), chlorinated hydrocarbons, chlorinated phenols, organochlorine pesticides (OCs), phenols, polychlorinated biphenyls, phthalates, organophosphate pesticides, scheduled chemicals, total petroleum hydrocarbons (TPHs), volatile organic compounds, cyanide and heavy metals.
The current assessment of the contaminant concentrations in the sediments within the proposed dredge footprint area at Double Bay Marina is for the purpose of assessing the overall waste classification using the Waste Guidelines (NSW DEC, 2004). Further chemical testing of the sediment will be necessary prior to the disposal of the dredged sediments at landfill at a rate of 1 sample per 100 m3 for classification. In addition, it should be noted that the disposal of dredged sediments from the proposed dredge footprint area with an in situ volume of 3,800 m3 of sediments, may represent a lower environmental impact compared with the maintenance dredging of 5,500 m3 of sediments from the maintenance dredge area.

SECTION 2 Methodology
J:\JOBS\43217511\TLB- DOUBLE BAY MARINA\DELIVERABLES\FINAL REPORT\FINAL REPORT R001.DOC\
2-2
2.2 Sediment Sampling
As part of this study, W.S. Rooney and Associates Pty Ltd were engaged to collect sediment cores from four sites (to a depth of 1.3 m) for chemical analysis. Sediments were sampled on 23 March 2006 at four locations using polycarbonate pushcores (Sites 1-4). The locations were selected at the northeastern (Site 1), southeastern (Site 2), southwestern (Site 3) and northwestern (Site 4) corners inside the proposed dredge footprint area, approximately equidistant to location DB5, which was sampled by PBP (2003) and which is located in the centre of the proposed dredge footprint area (Figure 1 and the drawings prepared by TLB).
Sediment pushcores were collected in pairs and depending on the depth of penetration of the sediment, between one and three subsamples were collected at each of the four locations, totalling eight sediment samples. Field descriptions of the cores are provided in Table 1. Sediment in each sampling interval was homogenized in the field. The samples were analysed by the Australian Government National Measurement Institute (NMI), a NATA accredited laboratory, for chemical analysis. Refer to Table 1 for the depths of subsamples within each core.
Additional sediment sampling using pushcores was conducted on 26 May 2006 by W.S. Rooney and Associates Pty Ltd, following the interpretation of the analytical data from the first round of sampling in March 2006. The additional sediment samples were collected near the two locations where the chemical criteria for Solid Waste were exceeded (i.e. Sites 2 and 4) (Figure 1). At Site 2, three additional sediment cores were collected about 5 m to the north and south and 10 m to the west of Site 2 (2N, 2S, 2W). At Site 4, two additional sediment cores were collected about 5 m to the north and south of Site 4 (4N and 4S). The cores were subsampled as outlined below:
• Core 2N: Length: 0.76m; strong sulphide smell from top to bottom; Subsample 2Na: 0.0-0.2m (black ooze with organic fibres and some sand); Subsample 2Nb: 0.2-0.43m (coarse grey sand with some organics); Subsample 2Nc: 0.43-0.76m (black cohesive, dense, dry clayey mud with glass fragments, few fibres, no shell or sand);
• Core 2S: Length: 1.14m (slight sulphide smell on extrusion); Subsample 2Sa: 0.0-0.34m (black mud with plant/leaf litter); Subsample 2Sb: 0.47-1.14m (light grey coarse sand with trace of mud, no organics or shells);
• Core 2W: Length: 0.45m (uniform black mud with slight sulphide smell on extrusion); Homogenised entire sample since there were no distinct sediment horizons;
• Core 4N: Length: 0.55m (clean smell and a clean dark grey fine sand grading into medium fine sand with plant fibres and shell grit); Subsample 4Na: 0.0-0.30m (clean dark grey fine sand; no shell grit or organics); Subsample 4Nb: 0.30-0.55m (medium fine sand with plant fibres and shell grit); and
• Core 4S: Length: 0.40m (dark grey to black fine clean sand with clean smell); Subsample 4Sa: 0.0-0.23m (dark grey to black fine clean sand with some mud); Subsample 4Sb: 0.23-0.40m (light grey coarse sand with trace of mud, shell grit and plant fibres).

SECTION 2 Methodology
J:\JOBS\43217511\TLB- DOUBLE BAY MARINA\DELIVERABLES\FINAL REPORT\FINAL REPORT R001.DOC\
2-3
2.3 Sediment Analysis
A historical site assessment for the Double Bay Marina site was not available. An initial analysis of the sediments on 23 March 2006 required an inclusion of the entire suite of contaminants included in Table A3 (and Addendum) plus Table A7 of the Waste Guidelines (NSW DEC, 2004). Additional analyses were performed for Cu, Zn, organotins (mono- di- and tributyltin), phosphorus, nitrogen, grain size, percent carbonate and a Suspension Peroxide Oxidation Combined Acidity and Sulfur (SPOCAS) (net acid generating potential - NAGP) determination to assess the potential acid-generating capacity of the sediments in the dredge footprint area.
Based on the exceedences of the Industrial Waste guideline values of the Waste Guidelines the additional samples collected on 26 May 2006 near Sites 2 and 4 were analysed only for the analytes that exceeded the Industrial Waste Guideline values (i.e. benzo(a)pyrene and lead).
2.4 Water Quality Sampling
Sampling and chemical analysis of surface water in the marina was completed by WS Rooney and Associates Pty Ltd at two locations at Double Bay Marina during dry weather (11 April 2006) and immediately following a wet weather event (15 May 2006). This was undertaken to provide a baseline water quality assessment in the Bay. The analytes for the water analyses were:
• Total Petroleum Hydrocarbons (C6-C9, C10-C14, C15-C28 and C29-C36 fractions);
• Total and dissolved metals (As, Co, Cu, Ni, Pb, Zn, Hg);
• Oxidised nitrogen;
• Ttotal Kjeldahl nitrogen;
• Ammonia;
• Total phosphorus; and
• Physicochemical parameters (pH, electrical conductivity, suspended solids and turbidity).

SECTION 3 Results
J:\JOBS\43217511\TLB- DOUBLE BAY MARINA\DELIVERABLES\FINAL REPORT\FINAL REPORT R001.DOC\
3-1
3 Results
3.1 Sediment Grain Size
Sediments in the upper 0.4 m at Sites 1 and 2 are clayey sands in contrast to the surface sediments at Sites 3 and 4 which are fine to coarse sands. Grain size determinations showed that the sediments at Sites 1, 2, 3 and 4 include 69%, 21-39%, 8-11% and 7-12% mud (<63 μm grain size), respectively (Table 2) (Appendix A).
Carbonate contents are <5% in all sediment from Sites 1 and 2 and the surface sediment at Sites 3 and 4; but substantially higher in the lower portion of sediment at Sites 3 and 4 (28% to 33%, respectively) due to abundant coarse shell grit (Appendix A).
3.2 Sediment Chemistry (March 2006 Sampling Round)
3.2.1 Contaminant Concentrations
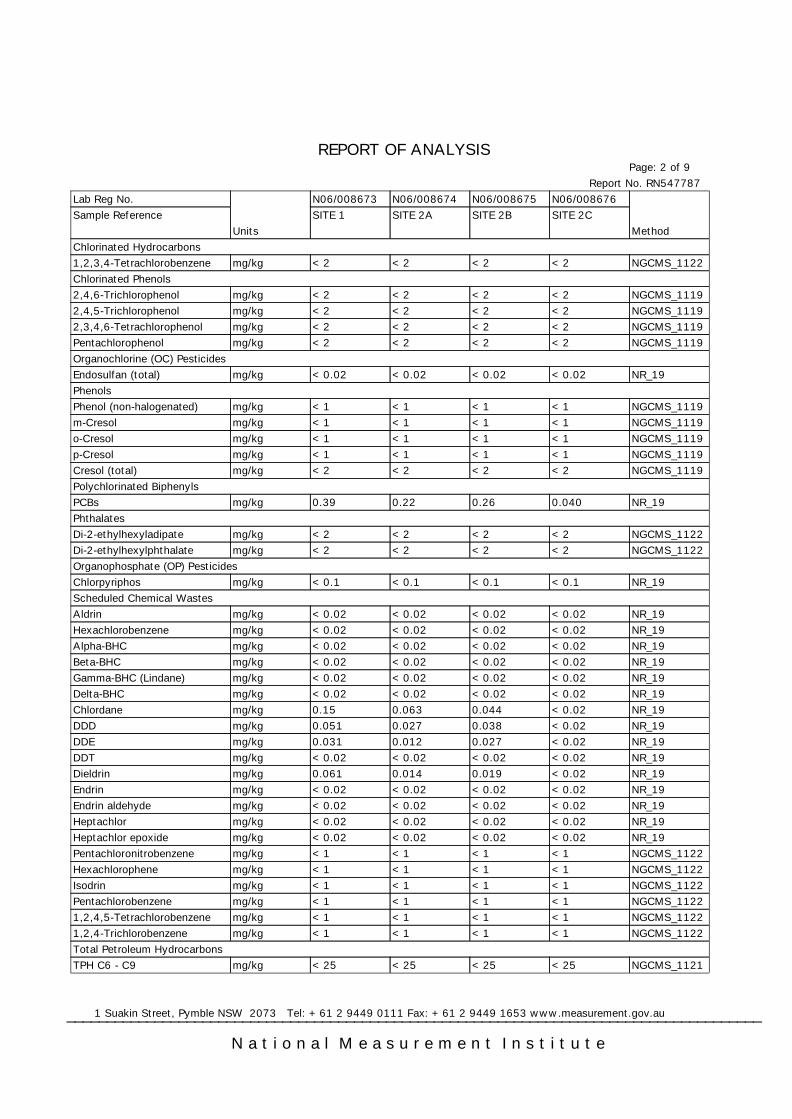
Previous work by PBP (2003) has shown that As, Hg, Ni, Pb and benzo(a)pyrene in sediments east of Double Bay Marina were present at concentrations that exceed Solid, Industrial and Hazardous Waste classification values in the Waste Guidelines (NSW DEC, 2004) at a number of locations. The current investigation provides a more detailed contamination assessment of sediments within the proposed dredge footprint area, which includes determinations of total and selected leachable concentrations of contaminants as used in the Waste Guidelines.
The contamination assessment of the sediments at Double Bay Marina is summarised in Table 3 and the laboratory certificates of analysis are provided in Appendix B. Following the analysis of the solid phase of the sediments to determine the total concentrations of the contaminants, further testing of the leachable concentrations of some analytes (TCLP analyses – Appendix C) was undertaken to enable a waste classification of the sediments in the proposed dredge footprint area.
Total analyte concentrations exceeded CT1 concentrations for the following analytes in one or more samples from the four sites:
• Benzo(a)pyrene (Site 1, 2, 3 and 4);
• Total PAHs (Sites 2 and 4);
• Arsenic (Sites 1 and 2);
• Cadmium (Site 2);
• Lead (Sites 1, 2, 3 and 4);
• Mercury (Sites 1, 2 and 3); and
• Nickel (Sites 1 and 2).

SECTION 3 Results
J:\JOBS\43217511\TLB- DOUBLE BAY MARINA\DELIVERABLES\FINAL REPORT\FINAL REPORT R001.DOC\
3-2
A toxicity characteristics leaching procedure (TCLP) was undertaken on those samples which exceeded the CT1 concentration, followed by analysis for the listed contaminants of concern. Some analyte concentrations exceeded the TCLP1 or SCC1 concentrations in Table A4 of the Waste Guidelines for the following analytes:
• Benzo(a)pyrene (Sites1, 2, 3 and 4);
• Total PAH (Sites 2 and 4); and
• Lead (Site 2).
3.2.2 AVS/SEM Analysis
Acid-volatile sulfides (AVS) and simultaneously extracted metals (SEM) were determined for three samples of sediment (Appendix E). Trace metals in sediments are generally believed to react with FeS (the major component of AVS) to form metal sulfides. In general, appreciable concentrations of Cd, Cu, Ni, Pb and Zn will not be observed in pore waters until the reservoir of FeS is exhausted (Simpson et al., 2005). Measurement of AVS concentrations and comparison against the molar sum of acid-soluble metals (SEM) is an indicator of bioavailability of metals in sediments. If AVS is greater than SEM, the metals are likely to be bound in sulfide complexes with greatly limited bioavailability. However, if AVS is less than SEM, metals may or may not be toxic due to other controlling factors (e.g. total organic carbon, iron hydroxides) (Simpson et al., 2005).
SEM is calculated as Σ(Cd, Cu, Ni, Pb, Zn) in mmol/kg (dry weight). An SEM-AVS value of 5 mmol/kg is recommended as a screening value for identification of sediments of concern with regard to potential effect from metals (Simpson et al., 2005). The three sediment samples analysed in the current investigation have an AVS concentration range between 34 and 87 mmol/kg and a total SEM concentration range of 11 to 17 mmol/kg, indicating that these sediments exceed the recommended screening value of 5 mmol/kg. However, the SEM/AVS ratios in the three sediment samples range between 0.15 and 0.49, which suggests that the metals are likely to be bound up in sulfide complexes, hence reducing the potential bioavailability.
3.2.3 SPOCAS Analysis
A SPOCAS profile was established for seven sediment samples from Sites 1, 2 (2A and 2B), 3 (3A and 3B) and 4 (4A and 4B) (Appendix F). The net acid-generating potential (NAGP) is very high to extreme (Total Potential Acidity: 126 to 558 mol H+/t) in sediment samples from Sites 1 and 2. In contrast, the NAGP is very slight (<2 to 2 mol H+/t) in the four sediment samples from Sites 3 and 4.
Similarly, the sulphuric acidity risk is very significant to extreme (%SPOS 0.94 to 1.53) in three sediment samples from Sites 1 and 2 (2A and 2B) compared to some potential for sulphuric activity in four samples from Sites 3 (3A and 3B) and 4 (4A and 4B) (0.28 to 0.41 %SPOS). The lime requirement ranges from 9.3 kg/t to 41.7 kg/t at Sites 1 and 2 and is nil in sediments at Sites 3 and 4.

SECTION 3 Results
J:\JOBS\43217511\TLB- DOUBLE BAY MARINA\DELIVERABLES\FINAL REPORT\FINAL REPORT R001.DOC\
3-3
The SPOCAS analyses have shown that sediment samples from Sites 1 and 2, located on the eastern side of the proposed dredge area, display very significant to extreme potential acidity risks and should be treated as a high to very high risk PASS soil. In contrast, sediment samples from Sites 3 and 4 produce some sulphuric activity upon oxidation but there is more than sufficient buffering capacity (carbonate contents of up to 28% and 33% at sites 3 and 4, respectively) in the sediment itself to neutralise all the released acidity and the sediment remains alkaline. The sediment from sites 3 and 4 does therefore not need to be managed as an acid sulphate risk.
It is recommended to develop an acid sulphate soil management plan (ASSMP) which provides a methodology for mitigation of the impacts of acid sulphate soil disturbance. Given the implementation of the appropriate ASS Management Procedures as specified in an ASSMP, it is considered that the associated potential risk of harm to the surrounding water in the vicinity of Double Bay would be low.
3.3 Sediment Chemistry (May 2006 Sampling Round)
The analysis of sediment samples collected near Sites 2 and 4 during the second round of sampling in May 2006 included only a total sediment analysis for benzo(a)pyrene and lead and the results are shown in Table 3.
3.4 Water Quality (Dry Weather – Wet Weather)
The chemical data for the surface water samples collected during the two sampling occasions (wet weather and dry weather sampling) are presented in Appendix D. The concentrations of the majority of analytes were below the limit of reporting (LOR) at both sites, during dry and wet weather sampling and for total recoverable metals in water and dissolved metals in water (Table 4). Analytes below the LOR in all samples collected include TPH (all fractions), all analytes for total recoverable metals in water, i.e. arsenic, cobalt, copper, nickel, lead, zinc and mercury and lead and mercury (dissolved metals in water).
Dissolved concentrations of copper were higher (0.006-0.007 mg/L) during dry weather compared to wet weather (0.002 mg/L). These concentrations exceed the ANZECC/ARMCANZ (2000) water quality guideline value for marine waters (0.0013 mg/L).
Dissolved concentrations of arsenic were below the LOR during dry weather and 0.002 mg/L during wet weather, which is below the ANZECC/ARMCANZ (2000) indicative interim working level (IIWL) of 0.0023 mg/L (As III) and 0.0045 mg/L (As V).
Dissolved concentrations of nickel were below the LOR during dry weather sampling and 0.001 mg/L during wet weather, which is below the ANZECC/ARMCANZ (2000) water quality guideline value of 0.007 mg/L.
Dissolved concentrations of zinc during dry and wet weather sampling exceeded the ANZECC/ARMCANZ (2000) water quality guideline value of 0.015 mg/L, with concentrations of 0.017 mg/L to 0.022 mg/L.

SECTION 3 Results
J:\JOBS\43217511\TLB- DOUBLE BAY MARINA\DELIVERABLES\FINAL REPORT\FINAL REPORT R001.DOC\
3-4
Concentrations of NOX appear to be slightly higher during wet weather (0.05-0.11 mg/L) compared to dry weather (0.03-0.05 mg/L). In contrast, the concentrations of TKN are higher during dry weather (0.5-0.9 mg/L) compared to wet weather (<0.5 mg/L).
Ammonia concentrations are higher during wet weather (0.10-0.18 mg/L) compared to dry weather (<0.01-0.02 mg/L), but all concentrations are below the ANZECC/ARMCANZ (2000) water quality guideline value of 0.91 mg/L (at pH 8.0).
The pH is similar during dry and wet weather (7.8-7.9) and electrical conductivity was lower during dry weather (36,000-38,000 μS/cm) compared to wet weather (41,000-44,000 μS/cm).
Total phosphorus concentrations were higher during dry weather sampling (0.14-0.22 mg/L) compared to wet weather (<0.05 mg/L).

SECTION 4 Discussion
J:\JOBS\43217511\TLB- DOUBLE BAY MARINA\DELIVERABLES\FINAL REPORT\FINAL REPORT R001.DOC\
4-1
4 Discussion
4.1 Sediment Waste Classification
The identified contaminants of concern are benzo(a)pyrene, lead and total PAHs.
The sediment investigation indicates that generally higher concentrations of contaminants occur in sediments on the eastern side of the proposed dredge footprint area (Sites 1 and 2). However, the chemical analysis of the sediments and an assessment against the ‘Waste Guidelines’ has shown that the sediments at two of the four sampling locations (Sites 1 and 3) may be classified as Solid Waste under the Waste Guidelines (Table 3).
Following the waste classification assessment of the sediments after the first round of sampling in March 2006, the concentrations of benzo(a)pyrene, lead (TCLP) and total PAH at the southeastern location (Site 2) and benzo(a)pyrene and Total PAH at the northwestern location (Site 4) within the proposed dredge footprint showed an exceedence of the Solid Waste classification of the Waste Guidelines and would be classified as Industrial Waste (Site 4) and Hazardous Waste (Site 2) (Table 3).
Additional sampling of sediments near Sites 2 and 4 in May 2006 for benzo(a)pyrene and lead resulted in additional data for the waste classification assessment of the sediments (Table 3). The additional data resulted in an Industrial Waste classification of the sediments at Sites 2 and 4, based on the exceedences of the guideline values of benzo(a)pyrene at both sites. Although a TCLP leachate analysis was not conducted for sediment samples collected during the second round of sampling, Table A4 of the Waste Guidelines was applied since the leachable concentrations of benzo(a)pyrene were below the limits of reporting in sediments collected during the first round of sampling and concentrations of lead in the TCLP leachates were below the Hazardous Waste Guideline value.
A Hazardous Waste Classification of sediments at Site 2 would be a result of a single benzo(a)pyrene concentration of 23 mg/kg in a subsurface sediment sample from a depth of 0.70 to 0.87 m. However, the corresponding TCLP concentration of benzo(a)pyrene is less than TCLP1. In addition, the 95% upper confidence limit (UCL) concentration of benzo(a)pyrene in sediments at Site 2 is 20.4 mg/kg (n = 10 samples from Site 2, 2N, 2S and 2W), as determined by ProUCLTM (Appendix G), which is within the Industrial Waste Guideline concentration range of Table A4 in the ‘Waste Guidelines’. Similarly, the 95% UCL concentration of lead in sediments at Site 2 is 691 mg/kg (n = 10 samples from Site 2, 2N, 2S and 2W), which is within the Industrial Waste Guideline concentration range of Table A4 in the ‘Waste Guidelines’.
The 95% UCL concentrations of benzo(a)pyrene and lead in sediments from Site 4 (n = 8 samples from Site 4, 4S and 4N) are 10.8 mg/kg and 132 mg/kg, respectively. Therefore the classification under the ‘Waste Guidelines’ for sediments at Site 4 is Industrial Waste.
The current waste classification based on the combined first and second round of sampling at Sites 1, 2, 3 and 4 is therefore Solid Waste (Sites 1 and 3) and Industrial Waste (Sites 2 and 4). However, the spatial extent of the areas that comprise Solid Waste at Sites 1 and 3 and Industrial Waste at Sites 2 and 4 is unknown and would require additional sampling and analysis of sediments. In addition, the small-scale spatial variability of the concentrations of benzo(a)pyrene and lead are likely to be high, both laterally and

SECTION 4 Discussion
J:\JOBS\43217511\TLB- DOUBLE BAY MARINA\DELIVERABLES\FINAL REPORT\FINAL REPORT R001.DOC\
4-2
vertically, making a separate waste stream determination and a separation into Solid Waste and Industrial Waste difficult. It is therefore recommended to consider the entire dredge area as a single waste stream with a classification as Industrial Waste. A reassessment of the dredged sediments following dredging may be considered, but this would require additional sampling and analysis of the material prior to disposal at landfill. This approach requires storage of the dredged material pending the resampling. reanalysis and reassessment of the dredged sediments.
4.2 Sediment Disposal Options
The waste classification prior to landfill disposal requires additional sampling of dewatered dredged material that is of spadable consistency. The current sampling density is not be sufficient to classify the dredged materials for landfill disposal and additional sampling and analysis would be required to minimize the uncertainty associated with the analytical determinations of the contaminant concentrations, resulting from inhomogeneities of contaminant concentrations within the sediment.
It is recommended to develop and put into place an acid sulphate soil management plan (ASSMP) which provides a methodology for mitigation of the impacts of acid sulphate soil disturbance.
The Alternative Waste Treatment facility in association with the SITA landfill facility at Kemps Creek, Penrith LGA, would be a possible recipient of the Industrial Waste. The rates for the Industrial Waste disposal at landfill may vary and be up to about $250 per metric ton of waste.
4.3 Water Quality
The water sampling at Sites 1 and 2 has shown that the water at both locations exceeds the ANZECC/ARMCANZ (2000) water quality guideline values for marine waters for copper and zinc during both wet weather and dry weather. Although the water sampling was conducted on one occasion only and single samples were collected at each site (as opposed to time-dependent or discrete sampling), the exceedence of the water quality guideline value may suggest a contribution from stormwater-related contaminants, in particular copper and zinc, from the stormwater drain at the Double Bay Marina site.
However, the possible effects of stormwater and contributions of contaminants during low-flow on the contaminant concentrations in waters at Double Bay Marina are not quantifiable from a single sampling event and may require additional geochemical sampling and assessments to establish causality between the contributions of stormwater and contributions during low-flow.

SECTION 5 Conclusions
J:\JOBS\43217511\TLB- DOUBLE BAY MARINA\DELIVERABLES\FINAL REPORT\FINAL REPORT R001.DOC\
5-1
5 Conclusions
Following the contamination assessment it is possible to draw the following conclusions:
• Contamination assessment of sediments in the proposed dredge footprint area at Double Bay Marina has been performed using the Environmental Guidelines: Assessment, Classification & Management of Liquid & Non-liquid Wastes (NSW DEC, 2004);
• Sediments at Sites 1 and 3 would be classified as Solid Waste and sediments at Sites 2 and 4 would be classified as Industrial Waste;
• Further sediment sampling and analysis would be required to determine the vertical and lateral extent of the Industrial Waste at sites 2 and 4. Therefore an overall classification of Industrial Waste for dredged material within the proposed dredge area is recommended in order to generate a single waste stream; and
• An acid sulphate soil management plan (ASSMP) is recommended to provide a methodology for mitigation of the impacts of acid sulphate soil disturbance.

SECTION 6 References
J:\JOBS\43217511\TLB- DOUBLE BAY MARINA\DELIVERABLES\FINAL REPORT\FINAL REPORT R001.DOC\
6-1
6 References
ANZECC/ARMCANZ (2000). Australia and New Zealand Guidelines for Fresh and Marine Water Quality, National Water Quality Management Strategy, Australian and New Zealand Environment Conservation Council and Agriculture and Resource Management Council of Australia and New Zealand.
Laxton, J.H. (1993). Double Bay Marina, Statement of environmental effects of the proposed shifting of sediment from areas to the east of Double Bay Marina, J.H. & E.S. Laxton, Environmental Consultants Pty. Ltd., March 1993, Sydney.
NSW DEC (2004). Environmental Guidelines: Assessment, Classification & Management of Liquid & Non-liquid Wastes, Department of Environment and Conservation (NSW), Sydney, NSW.
Patterson Britton and Partners Pty Ltd (2003). Memo report to Double Bay Marina on the characterisation of material to be dredged (Facsimile dated 28 May 2003).
Simpson, S.L., Batley, G.E., Chariton, A.A., Stauber, J.L., King, C.K., Chapman, J.C., Hyne, R.V., Gale, S.A., Roach, A.C. and Maher, W.A. (2005). Handbook for Sediment Quality Assessment (CSIRO: Bangor, NSW).
Stone, Y., Ahern, C.R. and Blunden, B. (1998). Acid Sulfate Soils Manual 1998. Acid Sulfate Soil Management Advisoy Committee (ASSMAC), Wollongong, NSW, Australia.
Taylor Lauder Bersten (2006). Outline of proposed works, Upgrading Double Bay Marina, Castra Place, Double Bay, Project No. 05027, Draft Report.
Taylor, S. E. (2000). The Source and Remobilisation of Contaminanted Sediment in Port Jackson, Australia. Unpublished PhD Thesis, University of Sydney, 367 pp.

SECTION 7 Limitations
J:\JOBS\43217511\TLB- DOUBLE BAY MARINA\DELIVERABLES\FINAL REPORT\FINAL REPORT R001.DOC\
7-1
7 Limitations
URS Australia Pty Ltd (URS) in association with W.S. Rooney & Associates Pty Ltd, has prepared this Draft Final Report in accordance with the usual care and thoroughness of the consulting profession for the use of Taylor Lauder Bersten Pty Ltd and only those third parties who have been authorised in writing by URS to rely on the draft report. It is based on generally accepted practices and standards at the time it was prepared. No other warranty, expressed or implied, is made as to the professional advice included in this draft report. It is prepared in accordance with the Proposal dated 12 April 2006.
The methodology adopted and sources of information used by URS are outlined in this Draft Final Report. All sediment samples were collected by W.S. Rooney & Associates Pty Ltd and analysed by a third party laboratory. URS has made no independent verification of this information beyond the agreed scope of works and URS assumes no responsibility for any inaccuracies or omissions. No indications were found during our investigations that information contained in this Draft Final Report as provided to URS was false.
This Draft Final Report was prepared between 20 April 2006 and 1 May 2007 and is based on the conditions encountered and information reviewed at the time of preparation. URS disclaims responsibility for any changes that may have occurred after this time.
This report should be read in full. No responsibility is accepted for use of any part of this report in any other context or for any other purpose or by third parties. This report does not purport to give legal advice. Legal advice can only be given by qualified legal practitioners.

Tables
J:\JOBS\43217511\TLB- DOUBLE BAY MARINA\DELIVERABLES\FINAL REPORT\FINAL REPORT R001.DOC\1-MAY-07

TABLES
J:\JOBS\43217511\TLB- DOUBLE BAY MARINA\DELIVERABLES\FINAL REPORT\FINAL REPORT R001.DOC\
Table 1. Details of Sediment Sampling
Sample Location
(refer to Figure 1)
Total depth of recovery [m]
Core depth after extrusion and
compaction (m)
Subsample intervals [m]
Site 1: northeast 0.40 in core 1;
0.40 in core 2;
0.40 in core 3
0.40 in core 1;
0.40 in core 2;
0.40 in core 3
0.00-0.40 composited from all cores
Site 2: southeast 0.90 in core 1;
0.44 in core 2
0.87 in core 1;
0.43 in core 2
a) 0.00-0.40 composited
b) 0.40-0.70 composited
c) 0.70-0.87 from core 1
Site 3: southwest 0.90 in core 1;
1.30 in core 2
0.90 in core 1;
1.16 in core 2
a) 0.15-0.33* composited
b) 0.33-1.02** composited
Site 4: northwest 0.75 in core 1;
0.80 in core 2
0.75 in core 1;
0.80 in core 2
a) 0.15-0.40* composited
b) 0.40-0.80 composited
*Interval between 0.00-0.15 m was subsampled for grainsize analysis
**Material from 1.02 m to 1.16 m was clean sand and was not sampled for testing.

TABLES
J:\JOBS\43217511\TLB- DOUBLE BAY MARINA\DELIVERABLES\FINAL REPORT\FINAL REPORT R001.DOC\
Table 2. Fine Fraction (<63 μm) in Sediment Samples
Sample No. Fine fraction (%)
Site 1 0-0.4 m 69
Site 2 0-0.4 m 21
Site 2 0.4-0.7 m 39
Site 3 0.0.15 m 8
Site 3 0.35-0.9 , 11
Site 4 0-0.15 m 12
Site 4 0.4-0.8 m 7

Table 3 Analytical Results and Waste Classification
Location SITE 1 SITE 2 SITE 2 SITE 2 SITE 2 SITE 2 SITE 2 SITE 2 SITE 2 SITE 2 SITE 2 SITE 3 SITE 3 SITE 4 SITE 4 SITE 4 SITE 4 SITE 4 SITE 4 SITE 4 SITE 4 Sample ID SITE 1 SITE 2A SITE 2B SITE 2C 2N 2NA 2NB 2NC 2S 2SA 2W SITE 3A SITE 3B SITE 4A SITE 4B 4S 4SA 4SB 4N 4NA 4NBDate Sampled 23/3/06 23/3/06 23/3/06 23/3/06 26/5/06 26/5/06 26/5/06 26/5/06 26/5/06 26/5/06 26/5/06 23/3/06 23/3/06 23/3/06 23/3/06 26/5/06 26/5/06 26/5/06 26/5/06 26/5/06 26/5/06
Analyte LOR Units INERT SOLID INDUSTRIALTotal Petroleum HydrocarbonsC6-C9 fraction 25 mg/kg 650 650 2600 <25 <25 <25 <25 NA NA NA NA NA NA NA <25 <25 <25 <25 NA NA NA NA NA NAC10-C14 fraction 50 mg/kg - - - <50 <50 <50 <50 NA NA NA NA NA NA NA <50 <50 <50 <50 NA NA NA NA NA NAC15-C28 fraction 100 mg/kg - - - 140 460 700 940 NA NA NA NA NA NA NA <100 <100 410 <100 NA NA NA NA NA NAC29-C36 fraction 100 mg/kg - - - 260 400 560 550 NA NA NA NA NA NA NA <100 <100 130 <100 NA NA NA NA NA NAC10-C36 fraction 250 mg/kg 5000 10000 40000 400 860 1300 1500 NA NA NA NA NA NA NA <250 <250 500 <250 NA NA NA NA NA NABTEX CompoundsBenzene 1 mg/kg 1 10 40 <1 <1 <1 <1 NA NA NA NA NA NA NA <1 <1 <1 <1 NA NA NA NA NA NAToluene 1 mg/kg 28.8 288 1152 <1 <1 <1 <1 NA NA NA NA NA NA NA <1 <1 <1 <1 NA NA NA NA NA NAEthylbenzene 1 mg/kg 60 600 2400 <1 <1 <1 <1 NA NA NA NA NA NA NA <1 <1 <1 <1 NA NA NA NA NA NATotal Xylenes 2 mg/kg 100 1000 4000 <2 <2 <2 <2 NA NA NA NA NA NA NA <2 <2 <2 <2 NA NA NA NA NA NAPolycyclic Aromatic HydrocarbonsNaphthalene 1 mg/kg - - - 1.1 <1 <1 1.8 NA NA NA NA NA NA NA <1 <1 1.1 <1 NA NA NA NA NA NAAcenaphthylene 1 mg/kg - - - <1 1.4 2.1 4.3 NA NA NA NA NA NA NA <1 <1 4.1 <1 NA NA NA NA NA NAAcenaphthene 1 mg/kg - - - <1 <1 <1 1.7 NA NA NA NA NA NA NA <1 <1 <1 <1 NA NA NA NA NA NAFluorene 1 mg/kg - - - <1 <1 1.6 4.1 NA NA NA NA NA NA NA <1 <1 6.7 <1 NA NA NA NA NA NAPhenanthrene 1 mg/kg - - - 5.2 12 18 39 NA NA NA NA NA NA NA 4 <1 50 <1 NA NA NA NA NA NAAnthracene 1 mg/kg - - - 1.2 3 4.4 9.4 NA NA NA NA NA NA NA 1.1 <1 14 <1 NA NA NA NA NA NAFluoranthene 1 mg/kg - - - 11 23 37 71 NA NA NA NA NA NA NA 8.7 <1 53 <1 NA NA NA NA NA NAPyrene 1 mg/kg - - - 12 24 38 70 NA NA NA NA NA NA NA 8.6 <1 45 <1 NA NA NA NA NA NABenz(a)anthracene 1 mg/kg - - - 5.6 9.2 17 31 NA NA NA NA NA NA NA 4.1 <1 23 <1 NA NA NA NA NA NAChrysene 1 mg/kg - - - 5.3 8.3 15 27 NA NA NA NA NA NA NA 3.8 <1 16 <1 NA NA NA NA NA NABenzo(b)&(k)fluoranthene 1 mg/kg - - - 10 17 31 57 NA NA NA NA NA NA NA 7.3 <2 29 <2 NA NA NA NA NA NABenzo(a)pyrene* 1 mg/kg 1* 10* 23* 6.3 10 20 36 2.8 6.5 1.8 11 1.1 6.5 12 4.7 <1 18 <1 4.3 7.6 <1 8.5 11 5TCLP Benzo(a)pyrene* mg/L 0.004* 0.04* 0.16* <0.001 <0.001 <0.001 <0.001 NA NA NA NA NA NA NA <0.001 - <0.001 - NA NA NA NA NA NAIndeno(1,2,3-cd)pyrene 1 mg/kg - - - 2.7 4.6 8.1 15 NA NA NA NA NA NA NA 1.9 <1 6.9 <1 NA NA NA NA NA NADibenz(a,h)anthracene 1 mg/kg - - - <1 1.2 2.7 4.8 NA NA NA NA NA NA NA <1 <1 2.3 <1 NA NA NA NA NA NABenzo(g,h,i)perylene 1 mg/kg - - - 2.7 4.4 8 15 NA NA NA NA NA NA NA 1.9 <1 6.2 <1 NA NA NA NA NA NASum of reported PAHs* 1 mg/kg 200* 200* 800* 63 118 200 390 NA NA NA NA NA NA NA 46 <1 270 <1 NA NA NA NA NA NAPhenolic CompoundsPhenol 1 mg/kg 28.8 288 1152 <1 <1 <1 <1 NA NA NA NA NA NA NA <1 <1 <1 <1 NA NA NA NA NA NA2,4,6-Trichlorophenol 2 mg/kg 4 40 160 <2 <2 <2 <2 NA NA NA NA NA NA NA <2 <2 <2 <2 NA NA NA NA NA NA2,4,5-Trichlorophenol 2 mg/kg 800 8000 32000 <2 <2 <2 <2 NA NA NA NA NA NA NA <2 <2 <2 <2 NA NA NA NA NA NA2,3,4,6 Tetrachlorophenol 2 mg/kg - - - <2 <2 <2 <2 NA NA NA NA NA NA NA <2 <2 <2 <2 NA NA NA NA NA NAPentachlorophenol 2 mg/kg - - - <2 <2 <2 <2 NA NA NA NA NA NA NA <2 <2 <2 <2 NA NA NA NA NA NAInorganicsArsenic 1 mg/kg 10 100 400 8 NA NA NA NA NA NA NA 4.8 6.2 7.8 9.1 NA NA NA NA NA NAArsenic* 1 mg/kg 500* 500* 2000* 15 26 22 NA NA NA NA NA NA NA NA NA NA NA NA NAArsenic TCLP* 0.05 mg/L 0.5* 5* 20* <0.05 <0.05 <0.05 <0.05 NA NA NA NA NA NA NA NA NA <0.05 NA NA NA NA NA NA NABeryllium 0.5 mg/kg 2 20 80 0.52 <0.5 <0.5 <0.5 NA NA NA NA NA NA NA <0.5 <0.5 <0.5 <0.5 NA NA NA NA NA NACadmium 0.1 mg/kg 2 20 80 1.3 0.9 1.7 NA NA NA NA NA NA NA 0.18 0.11 0.13 0.11 NA NA NA NA NA NACadmium* 0.1 mg/kg 100* 100* 400* 2.3 NA NA NA NA NA NA NA NA NA NA NA NA NACadmium TCLP* 0.05 mg/L 0.1* 1* 4* NA NA <0.05 NA NA NA NA NA NA NA NA NA NA NA NA NA NA NA NA NA NAChromium VI 1 mg/kg 10 100 400 2.1 3.7 3.2 1.7 NA NA NA NA NA NA NA 0.56 <0.5 <0.5 <0.5 NA NA NA NA NA NACopper 2 mg/kg - - - 210 120 260 190 NA NA NA NA NA NA NA 56 3.1 27 1.8 NA NA NA NA NA NALead 2 mg/kg 10 100 400 NA NA NA NA NA NA NA 7.2 4.1 NA NA NA NA NA NALead* 2 mg/kg 1500* 1500* 6000* 880 510 850 530 600 710 250 940 54 480 470 100 88 130 200 11 65 140 59TCLP Lead* 0.05 mg/L 0.5* 5* 20* 0.43 1.1 6.1 1.4 NA NA NA NA NA NA NA 0.21 NA <0.05 NA NA NA NA NA NA NAMercury 0.1 mg/kg 0.4 4 16 NA NA NA NA NA NA NA <0.1 0.28 <0.1 NA NA NA NA NA NAMercury* 0.1 mg/kg 50* 50* 200* 2.7 2.3 6 12 NA NA NA NA NA NA NA 0.83 NA NA NA NA NA NATCLP Mercury* 0.1 mg/L 0.02* 0.2* 0.8* <0.01 <0.01 <0.01 <0.01 NA NA NA NA NA NA NA <0.01 NA NA NA NA NA NA NA NA NAMolybdenum 1 mg/kg 10 100 400 5.2 4.4 6.8 5.7 NA NA NA NA NA NA NA 1.5 2.2 1 3 NA NA NA NA NA NANickel 1 mg/kg 4 40 160 NA NA NA NA NA NA NA 3.6 2.5 3.9 2.4 NA NA NA NA NA NANickel* 1 mg/kg 1050* 1050* 4200* 18 12 55 12 NA NA NA NA NA NA NA NA NA NA NA NA NATCLP Nickel* 0.05 mg/L 0.2* 2* 8* <0.05 <0.05 0.12 0.052 NA NA NA NA NA NA NA NA NA <0.05 NA NA NA NA NA NA NASelenium 0.5 mg/kg 2 20 80 1.3 0.64 0.96 0.93 NA NA NA NA NA NA NA <0.5 0.5 <0.5 0.51 NA NA NA NA NA NASilver 0.5 mg/kg 10 100 400 1.4 0.55 1.1 0.89 NA NA NA NA NA NA NA <0.5 <0.5 <0.5 <0.5 NA NA NA NA NA NAZinc 5 mg/kg - - - 930 480 1000 720 NA NA NA NA NA NA NA 130 9.2 77 5.5 NA NA NA NA NA NAPhosphorus 10 mg/kg - - - 840 420 610 550 NA NA NA NA NA NA NA 190 96 250 63 NA NA NA NA NA NACyanide (total) 0.5 mg/kg 32 320 1280 <0.5 <0.5 <0.5 <0.5 NA NA NA NA NA NA NA <0.5 <0.5 <0.5 <0.5 NA NA NA NA NA NANitrogen (total) 50 mg/kg - - - 7900 2000 2200 2300 NA NA NA NA NA NA NA 590 280 470 220 NA NA NA NA NA NAFluoride 50 mg/kg 300 3000 12000 290 93 140 160 NA NA NA NA NA NA NA 81 <50 <50 <50 NA NA NA NA NA NAPolychlorinated biphenylsPolychlorinated biphenyls* 0.2 mg/kg 2 <50 <50 0.39 0.22 0.26 0.04 NA NA NA NA NA NA NA 0.042 <0.2 0.042 <0.2 NA NA NA NA NA NAOrganochlorine PesticidesEndosulfan (total) 0.05 mg/kg - - - <0.02 <0.02 <0.02 <0.02 NA NA NA NA NA NA NA <0.02 <0.02 <0.02 <0.02 NA NA NA NA NA NAm-Cresol 1 mg/kg - - - <1 <1 <1 <1 NA NA NA NA NA NA NA <1 <1 <1 <1 NA NA NA NA NA NAo-Cresol 1 mg/kg - - - <1 <1 <1 <1 NA NA NA NA NA NA NA <1 <1 <1 <1 NA NA NA NA NA NAp-Cresol 1 mg/kg - - - <1 <1 <1 <1 NA NA NA NA NA NA NA <1 <1 <1 <1 NA NA NA NA NA NACresol (total) 2 mg/kg - - - <2 <2 <2 <2 NA NA NA NA NA NA NA <2 <2 <2 <2 NA NA NA NA NA NAChlorinated hydrocarbons1,2,3,4-Tetra-chloro-benzene <2 <2 <2 <2 NA NA NA NA NA NA NA <2 <2 <2 <2 NA NA NA NA NA NAOrganotinsMono-butyltin 0.5 ng/g - - - <0.5 <0.5 <0.5 <0.5 NA NA NA NA NA NA NA 1.6 <0.5 <0.5 <0.5 NA NA NA NA NA NADi-butyltin 0.5 ng/g - - - 0.66 6.4 1.8 <0.5 NA NA NA NA NA NA NA 7.3 <0.5 2.1 <0.5 NA NA NA NA NA NATri-butyltin 0.5 ng/g - - - 3.6 29 5.6 <0.5 NA NA NA NA NA NA NA 6.2 <0.5 1.8 <0.5 NA NA NA NA NA NAPhthalatesDi-2-ethyl-hexyl-adipate 2 - - - <2 <2 <2 <2 NA NA NA NA NA NA NA <2 <2 <2 <2 NA NA NA NA NA NADi-2-ethyl-hexyl-phthalate 2 - - - <2 <2 <2 <2 NA NA NA NA NA NA NA <2 <2 <2 <2 NA NA NA NA NA NAOrganophosphate (OP) PesticidesChlorpyriphos 0.1 mg/kg - - - <0.1 <0.1 <0.1 <0.1 NA NA NA NA NA NA NA <0.1 <0.1 <0.1 <0.1 NA NA NA NA NA NAHerbicidesFluroxypyr 0.1 mg/kg - - - <0.1 <0.1 <0.1 <0.1 NA NA NA NA NA NA NA <0.1 <0.1 <0.1 <0.1 NA NA NA NA NA NAPicloram 0.1 mg/kg - - - <0.1 <0.1 <0.1 <0.1 NA NA NA NA NA NA NA <0.1 <0.1 <0.1 <0.1 NA NA NA NA NA NATriclopyr 0.1 mg/kg - - - <0.1 <0.1 <0.1 <0.1 NA NA NA NA NA NA NA <0.1 <0.1 <0.1 <0.1 NA NA NA NA NA NA2,4-D 0.1 mg/kg - - - <0.1 <0.1 <0.1 <0.1 NA NA NA NA NA NA NA <0.1 <0.1 <0.1 <0.1 NA NA NA NA NA NA2,4,5-T 0.1 mg/kg - - - <0.1 <0.1 <0.1 <0.1 NA NA NA NA NA NA NA <0.1 <0.1 <0.1 <0.1 NA NA NA NA NA NAFungicidesTebuconazole 1 mg/kg - - - <1 <1 <1 <1 NA NA NA NA NA NA NA <1 <1 <1 <1 NA NA NA NA NA NAVolatile Organic CompoundsVinyl chloride 1 mg/kg - - - <1 <1 <1 <1 NA NA NA NA NA NA NA <1 <1 <1 <1 NA NA NA NA NA NA1,1-Dichloroethylene 1 mg/kg - - - <1 <1 <1 <1 NA NA NA NA NA NA NA <1 <1 <1 <1 NA NA NA NA NA NA1,1-Dichloromethane 1 mg/kg - - - <1 <1 <1 <1 NA NA NA NA NA NA NA <1 <1 <1 <1 NA NA NA NA NA NAChloroform 1 mg/kg - - - <1 <1 <1 <1 NA NA NA NA NA NA NA <1 <1 <1 <1 NA NA NA NA NA NA1,1,1-Trichloroethane 1 mg/kg - - - <1 <1 <1 <1 NA NA NA NA NA NA NA <1 <1 <1 <1 NA NA NA NA NA NACarbon tetrachloride 1 mg/kg - - - <1 <1 <1 <1 NA NA NA NA NA NA NA <1 <1 <1 <1 NA NA NA NA NA NA1,2-Dichloroethane 1 mg/kg - - - <1 <1 <1 <1 NA NA NA NA NA NA NA <1 <1 <1 <1 NA NA NA NA NA NATrichloroethylene 1 mg/kg - - - <1 <1 <1 <1 NA NA NA NA NA NA NA <1 <1 <1 <1 NA NA NA NA NA NA1,1,2-Trichloroethane 1 mg/kg - - - <1 <1 <1 <1 NA NA NA NA NA NA NA <1 <1 <1 <1 NA NA NA NA NA NATetrachloroethylene 1 mg/kg - - - <1 <1 <1 <1 NA NA NA NA NA NA NA <1 <1 <1 <1 NA NA NA NA NA NAChlorobenzene 1 mg/kg - - - <1 <1 <1 <1 NA NA NA NA NA NA NA <1 <1 <1 <1 NA NA NA NA NA NA1,1,1,2-Tetrachloroethane 1 mg/kg - - - <1 <1 <1 <1 NA NA NA NA NA NA NA <1 <1 <1 <1 NA NA NA NA NA NAStyrene (vinyl benzene) 1 mg/kg - - - <1 <1 <1 <1 NA NA NA NA NA NA NA <1 <1 <1 <1 NA NA NA NA NA NA1,1,2,2-Tetrachloroethane 1 mg/kg - - - <1 <1 <1 <1 NA NA NA NA NA NA NA <1 <1 <1 <1 NA NA NA NA NA NA1,4-Di-chlorobenzene 1 mg/kg - - - <1 <1 <1 <1 NA NA NA NA NA NA NA <1 <1 <1 <1 NA NA NA NA NA NA1,2-Dichlorobenzene 1 mg/kg - - - <1 <1 <1 <1 NA NA NA NA NA NA NA <1 <1 <1 <1 NA NA NA NA NA NA2,4-Dinitrotoluene 2 mg/kg - - - <2 <2 <2 <2 NA NA NA NA NA NA NA <2 <2 <2 <2 NA NA NA NA NA NAMethyl ethyl ketone 5 mg/kg - - - <5 <5 <5 <5 NA NA NA NA NA NA NA <5 <5 <5 <5 NA NA NA NA NA NANitrobenzene 2 mg/kg - - - <2 <2 <2 <2 NA NA NA NA NA NA NA <2 <2 <2 <2 NA NA NA NA NA NAScheduled ChemicalsAldrin 0.02 mg/kg - - - <0.02 <0.02 <0.02 <0.02 NA NA NA NA NA NA NA <0.02 <0.02 <0.02 <0.02 NA NA NA NA NA NAHexachlorobenzene 0.02 mg/kg - - - <0.02 <0.02 <0.02 <0.02 NA NA NA NA NA NA NA <0.02 <0.02 <0.02 <0.02 NA NA NA NA NA NAAlpha-BHC 0.02 mg/kg - - - <0.02 <0.02 <0.02 <0.02 NA NA NA NA NA NA NA <0.02 <0.02 <0.02 <0.02 NA NA NA NA NA NABeta-BHC 0.02 mg/kg - - - <0.02 <0.02 <0.02 <0.02 NA NA NA NA NA NA NA <0.02 <0.02 <0.02 <0.02 NA NA NA NA NA NAGamma-BHC (Lindane) 0.02 mg/kg - - - <0.02 <0.02 <0.02 <0.02 NA NA NA NA NA NA NA <0.02 <0.02 <0.02 <0.02 NA NA NA NA NA NADelta-BHC 0.02 mg/kg - - - <0.02 <0.02 <0.02 <0.02 NA NA NA NA NA NA NA <0.02 <0.02 <0.02 <0.02 NA NA NA NA NA NAChlor-dane 0.02 mg/kg - - - 0.15 0.063 0.044 <0.02 NA NA NA NA NA NA NA <0.02 <0.02 <0.02 <0.02 NA NA NA NA NA NADDD 0.02 mg/kg - - - 0.051 0.027 0.038 <0.02 NA NA NA NA NA NA NA <0.02 <0.02 <0.02 <0.02 NA NA NA NA NA NADDE 0.02 mg/kg - - - 0.031 0.012 0.027 <0.02 NA NA NA NA NA NA NA <0.02 <0.02 <0.02 <0.02 NA NA NA NA NA NADDT 0.02 mg/kg - - - <0.02 <0.02 <0.02 <0.02 NA NA NA NA NA NA NA <0.02 <0.02 <0.02 <0.02 NA NA NA NA NA NADieldrin 0.02 mg/kg - - - 0.061 0.014 0.019 <0.02 NA NA NA NA NA NA NA <0.02 <0.02 <0.02 <0.02 NA NA NA NA NA NAEndrin 0.02 mg/kg - - - <0.02 <0.02 <0.02 <0.02 NA NA NA NA NA NA NA <0.02 <0.02 <0.02 <0.02 NA NA NA NA NA NAEndrin aldehyde 0.02 mg/kg - - - <0.02 <0.02 <0.02 <0.02 NA NA NA NA NA NA NA <0.02 <0.02 <0.02 <0.02 NA NA NA NA NA NAHeptachlor 0.02 mg/kg - - - <0.02 <0.02 <0.02 <0.02 NA NA NA NA NA NA NA <0.02 <0.02 <0.02 <0.02 NA NA NA NA NA NAHeptachlor epoxide 0.02 mg/kg - - - <0.02 <0.02 <0.02 <0.02 NA NA NA NA NA NA NA <0.02 <0.02 <0.02 <0.02 NA NA NA NA NA NAPentachloronitrobenzene 1 mg/kg - - - <1 <1 <1 <1 NA NA NA NA NA NA NA <1 <1 <1 <1 NA NA NA NA NA NAHexachlorophene 1 mg/kg - - - <1 <1 <1 <1 NA NA NA NA NA NA NA <1 <1 <1 <1 NA NA NA NA NA NAIsodrin 1 mg/kg - - - <1 <1 <1 <1 NA NA NA NA NA NA NA <1 <1 <1 <1 NA NA NA NA NA NAPenta-chlorobenzene 1 mg/kg - - - <1 <1 <1 <1 NA NA NA NA NA NA NA <1 <1 <1 <1 NA NA NA NA NA NA1,2,4,5-Tetrachlorobenzene 1 mg/kg - - - <1 <1 <1 <1 NA NA NA NA NA NA NA <1 <1 <1 <1 NA NA NA NA NA NA1,2,4-Trichlorobenzene 1 mg/kg - - - <1 <1 <1 <1 NA NA NA NA NA NA NA <1 <1 <1 <1 NA NA NA NA NA NASum of Analysed Scheduled Chemicals* mg/kg 1* 50* 50* 0.293 0.116 0.128 ND NA NA NA NA NA NA NA ND ND ND ND NA NA NA NA NA NA
Solid Waste
Solid Waste
Industrial Waste
Hazardous Waste
Solid Waste
Solid Waste
Solid Waste
Industrial Waste
Solid Waste
Solid Waste
Industrial Waste
Solid Waste
Inert Waste
Industrial Waste
Inert Waste
Solid Waste
Solid Waste
Solid Waste
Solid Waste
Industrial Waste
Solid Waste
Legend
"-" Not available NA - Not analysed ND - Not detected
Waste Classification
* - Maximum Leachable concentration (TCLP) and total concentration (SCC) values together for non-liquid waste classification
Total concentration less than or equal to inert waste criteria as outlined in the NSW DEC 2004 Waste Classification - CLASSIFIED AS INERT WASTE
Total Concentration less than or equal to solid waste criteria as outlined in the NSW DEC 2004 Waste Classification - CLASSIFIED AS SOLID WASTE
Total Concentration less than or equal to industruial waste criteria as outlined in the NSW DEC 2004 Waste Classification - CLASSIFIED AS INDUSTRIAL WASTE
Total Concentration exceeds industrial waste criteria as outlined in the NSW DEC 2004 Waste Classification - Classifiedas Hazardous Waste
J:\JOBS\43217511\TLB- Double Bay Marina\Deliverables\Final Report\Table 3.xls 1Prepared by: SMChecked by: CH

TABLES
J:\JOBS\43217511\TLB- DOUBLE BAY MARINA\DELIVERABLES\FINAL REPORT\FINAL REPORT R001.DOC\
Table 4. Water Quality Sampling Data at Sites 1 and 2 During Dry Weather and Wet Weather (all in mg/L unless specified otherwise)
Analyte Dry Weather Sampling Wet Weather Sampling
Sampling Location Site 1 Site 2 Site 1 Site 2 Sampling Date 11/04/2006 11/04/2006 15/05/2006 15/05/2006TPH (μg/L) TPH C6-C9 <20 <20 <20 <20 TPH C10-C14 <20 <20 <20 <20 TPH C15-C28 <100 <100 <100 <100 TPH (C29-C36) <100 <100 <100 <100 Total Recoverable Metals in Water (mg/L) Arsenic <0.025 <0.025 <0.01 <0.01 Cobalt <0.025 <0.025 <0.025 <0.025 Copper <0.025 <0.025 <0.025 <0.025 Nickel <0.025 <0.025 <0.025 <0.025 Lead <0.01 <0.01 <0.01 <0.01 Zinc <0.05 <0.05 <0.05 <0.05 Mercury <0.001 <0.001 <0.001 <0.001 Dissolved Metals in Water (mg/L) Arsenic <0.005 <0.005 0.002 0.002 Cobalt <0.005 <0.005 0.002 0.002 Copper 0.006 0.007 0.002 0.002 Nickel <0.005 <0.005 0.001 0.001 Lead <0.005 <0.005 <0.001 <0.001 Zinc 0.017 0.019 0.022 0.017 Mercury <0.001 <0.001 <0.001 <0.001 NOX 0.03 0.05 0.05 0.11 TKN 0.5 0.9 <0.5 <0.5 Ammonia 0.02 <0.01 0.18 0.1 pH 7.8 7.9 7.9 7.9 Conductivity (μS/cm) 38000 36000 44000 41000 Total Phosphorus 0.14 0.22 <0.05 <0.05 Suspended Solids (mg/L) 3 7 5 <1 Turbidity (NTU) 1.2 1.6 0.8 1.4

Figure
J:\JOBS\43217511\TLB- DOUBLE BAY MARINA\DELIVERABLES\FINAL REPORT\FINAL REPORT R001.DOC\1-MAY-07

Figure:
DOUBLE BAY MARINA SEDIMENTASSESSMENT
43217511
TAYLOR LAUDER BERSTEN
SEDIMENT AND WATER
SAMPLE LOCATIONS
N
This drawing is subject to COPYRIGHT. It remains the property of URS Australia Pty Ltd.
Approved:
File: 43217511.002
1
Client
Project
Title
Job No:
Date:Drawn: FINALCM
Legend:
25/07/2007
T:\JOBS
Double Bay
Marina
2W2W2W2W2W2W2W2W2W
WQ2WQ2WQ2WQ2WQ2WQ2WQ2WQ2WQ22N2N2N2N2N2N2N2N2N
Site 2Site 2Site 2Site 2Site 2Site 2Site 2Site 2Site 2
4N4N4N4N4N4N4N4N4N
4S4S4S4S4S4S4S4S4S
Site 4Site 4Site 4Site 4Site 4Site 4Site 4Site 4Site 4
Site 1Site 1Site 1Site 1Site 1Site 1Site 1Site 1Site 1
WQ1WQ1WQ1WQ1WQ1WQ1WQ1WQ1WQ1
Site 3Site 3Site 3Site 3Site 3Site 3Site 3Site 3Site 32S2S2S2S2S2S2S2S2S
Imagery Provided by Google Earth
Imagery Provided by Google EarthImage 2007 Digital Globe
Water Sample Locations(Dry Weather and Wet Weather)
Sediment Sample Locations(May 2006)
Sediment Sample Locations(March 2006)

Appendix A Particle Size Distribution Test Reports
and Percent Carbonate Test Report
J:\JOBS\43217511\TLB- DOUBLE BAY MARINA\DELIVERABLES\FINAL REPORT\FINAL REPORT R001.DOC\1-MAY-07


Appendix B Laboratory Certificates of Analysis for
Chemical Analysis of Sediment Samples
J:\JOBS\43217511\TLB- DOUBLE BAY MARINA\DELIVERABLES\FINAL REPORT\FINAL REPORT R001.DOC\1-MAY-07

CERTIFICATE OF ANALYSISCERTIFICATE OF ANALYSIS 45834583Client:Client:
National Measurement InstituteNational Measurement Institute
1 Suakin St1 Suakin St
PymblePymble
NSWNSW 20732073
Attention:Attention: Geoff ThurtellGeoff Thurtell
Sample log in details:Sample log in details:
Your Reference:Your Reference: N06/008673-N06/008680N06/008673-N06/008680
No. of samples:No. of samples: 8 Sediment Samples8 Sediment Samples
Date samples received:Date samples received: 27/03/0627/03/06
Date completed instructions received:Date completed instructions received: 27/03/0627/03/06
Analysis Details:Analysis Details:
Please refer to the following pages for results, methodology summary and quality control data.Please refer to the following pages for results, methodology summary and quality control data.
Samples were analysed as received from the client. Results relate specifically to the samples as received.Samples were analysed as received from the client. Results relate specifically to the samples as received.
Results are reported on a dry weight basis for solids and on an as received basis for other matrices.Results are reported on a dry weight basis for solids and on an as received basis for other matrices.
Please refer to the last page of this report for any comments relating to the results.Please refer to the last page of this report for any comments relating to the results.
Report Details:Report Details:
Date results requested by:Date results requested by: 3/04/063/04/06
Date of Preliminary Report:Date of Preliminary Report: NilNil
Issue Date:Issue Date: 29/03/0629/03/06
NATA accreditation number 2901. This document shall not be reproduced except in full.NATA accreditation number 2901. This document shall not be reproduced except in full.
This document is issued in accordance with NATA's accreditation requirements.This document is issued in accordance with NATA's accreditation requirements.
Accredited for compliance with ISO/IEC 17025.Accredited for compliance with ISO/IEC 17025.
Tests not covered by NATA are denoted with *.Tests not covered by NATA are denoted with *.
Results Approved By:Results Approved By:
Page 1 of 5Page 1 of 5Envirolab Reference:Envirolab Reference: 45834583
Revision No: RRevision No: R 0000

Client Reference:Client Reference: N06/008673-N06/008680N06/008673-N06/008680
Miscellaneous Inorg - soil
Our Reference: UNITS 4583-1 4583-2 4583-3 4583-4 4583-5
Your Reference ------------- N06/008673/S N06/008674/S N06/008675/S N06/008676/S N06/008677/S
Type of sample ------------ Sediment Sediment Sediment Sediment Sediment
Total Fluoride mg/kg 290 93 140 160 81
Miscellaneous Inorg - soil
Our Reference: UNITS 4583-6 4583-7 4583-8
Your Reference ------------- N06/008678/S N06/008679/S N06/008680/S
Type of sample ------------ Sediment Sediment Sediment
Total Fluoride mg/kg <50 <50 <50
Page 2 of 5Page 2 of 5Envirolab Reference:Envirolab Reference: 45834583
Revision No: RRevision No: R 0000

Client Reference:Client Reference: N06/008673-N06/008680N06/008673-N06/008680
Method ID Methodology Summary
NEPM-404 Analysed by ISE after caustic fusion at 600degC.
Page 3 of 5Page 3 of 5Envirolab Reference:Envirolab Reference: 45834583
Revision No: RRevision No: R 0000

Client Reference:Client Reference: N06/008673-N06/008680N06/008673-N06/008680
QUALITY CONTROL UNITS PQL METHOD Blank Duplicate Sm# Duplicate results Spike Sm# Spike %
Recovery
Miscellaneous Inorg - soil Base ll Duplicate ll %RPD
Total Fluoride mg/kg 50 NEPM-404 <50 4583-1 290 || 220 || RPD: 27 4583-1 76%
QUALITY CONTROL UNITS Dup. Sm# Duplicate Spike Sm# Matrix Spike %
Recovery
Miscellaneous Inorg - soil Base + Duplicate + %RPD
Total Fluoride mg/kg [NT] [NT] LCS 91%
Page 4 of 5Page 4 of 5Envirolab Reference:Envirolab Reference: 45834583
Revision No: RRevision No: R 0000

Client Reference:Client Reference: N06/008673-N06/008680N06/008673-N06/008680
Report Comments:Report Comments:
INS: Insufficient sample for this testINS: Insufficient sample for this test NT: Not testedNT: Not tested
NR: Not requestedNR: Not requested PQL: Practical Quanitation LimitPQL: Practical Quanitation Limit
<: Less than<: Less than >: Greater than>: Greater than
NA: Test not requiredNA: Test not required
Quality Control DefinitionsQuality Control Definitions
LCS: Laboratory Control SampleLCS: Laboratory Control Sample RPD: Relative Percent DifferenceRPD: Relative Percent Difference
Blank: This is the component of the analytical signal which is not derived from the sample but from reagents,
glassware etc, can be determined by processing solvents and reagents in exactly the same manner as for samples. glassware etc, can be determined by processing solvents and reagents in exactly the same manner as for samples.
Duplicate: This is the complete duplicate analysis of a sample from the process batch. If possible, the sample
selected should be one where the analyte concentration is easily measurable. selected should be one where the analyte concentration is easily measurable.
Matrix Spike: A portion of the sample is spiked with a known concentration of target analyte. The purpose of the matrix
spike is to monitor the performance of the analytical method used and to determine whether matrix interferences exist. spike is to monitor the performance of the analytical method used and to determine whether matrix interferences exist.
LCS (Laboratory Control Sample): This comprises either a standard reference material or a control matrix (such as a blank
sand or water) fortified with analytes representative of the analyte class. It is simply a check sample. sand or water) fortified with analytes representative of the analyte class. It is simply a check sample.
Surrogate Spike: Surrogates are known additions to each sample, blank, matrix spike and LCS in a batch, of compounds
which are similar to the analyte of interest, however are not expected to be found in real samples.which are similar to the analyte of interest, however are not expected to be found in real samples.
Laboratory Acceptance Criteria:Laboratory Acceptance Criteria:
Duplicates: <5xPQL - any RPD is acceptable;Duplicates: <5xPQL - any RPD is acceptable; >5xPQL - 0-50% RPD is acceptable.>5xPQL - 0-50% RPD is acceptable.
Matrix Spikes and LCS: Generally 70-130% for inorganics/metals & 60-140% for organics is acceptable.Matrix Spikes and LCS: Generally 70-130% for inorganics/metals & 60-140% for organics is acceptable.
Envirolab Reference:Envirolab Reference: 45834583
Revision No: RRevision No: R 0000

Australian Government____________________________________________National Measurement Institute
REPORT OF ANALYSISPage: 1 of 9
Report No. RN547787Client : W.S. ROONEY & ASSOCIATES P/L Job No. : WSRO01/060324
156 BARRENJOEY ROAD Quote No. : QT-01222 NEWPORT NSW 2106 Order No. : Date Sampled : 23-MAR-2006 Date Received : 24-MAR-2006
Attention : BILL ROONEY Sampled By : CLIENTProject Name : Your Client Services Manager : BRIAN WOODWARD Phone : (02) 94490151
Lab Reg No. Sample Ref Sample DescriptionN06/008673 SITE 1 MARINE SEDIMENT DOUBLE BAYN06/008674 SITE 2A MARINE SEDIMENT DOUBLE BAYN06/008675 SITE 2B MARINE SEDIMENT DOUBLE BAYN06/008676 SITE 2C MARINE SEDIMENT DOUBLE BAY
Lab Reg No. N06/008673 N06/008674 N06/008675 N06/008676Sample Reference SITE 1 SITE 2A SITE 2B SITE 2C
Units MethodHerbicides Fluroxypyr mg/kg <0.1 <0.1 <0.1 <0.1 NGCMS_1117 Picloram mg/kg <0.1 <0.1 <0.1 <0.1 NGCMS_1117 Triclopyr mg/kg <0.1 <0.1 <0.1 <0.1 NGCMS_1117 2,4-D mg/kg <0.1 <0.1 <0.1 <0.1 NGCMS_1117 2,4,5-T mg/kg <0.1 <0.1 <0.1 <0.1 NGCMS_1117 Fungicides Tebuconazole mg/kg <1 <1 <1 <1 NGCMS_1122 Poly Aromatic Hydrocarbons Napthalene mg/kg 1.1 <1 <1 1.8 NGCMS_1111 Acenaphthylene mg/kg <1 1.4 2.1 4.3 NGCMS_1111 Acenaphthene mg/kg <1 <1 <1 1.7 NGCMS_1111 Fluorene mg/kg <1 <1 1.6 4.1 NGCMS_1111 Phenanthrene mg/kg 5.2 12 18 39 NGCMS_1111 Anthracene mg/kg 1.2 3.0 4.4 9.4 NGCMS_1111 Fluoranthene mg/kg 11 23 37 71 NGCMS_1111 Pyrene mg/kg 12 24 38 70 NGCMS_1111 Benzo(a)anthracene mg/kg 5.6 9.2 17 31 NGCMS_1111 Chrysene mg/kg 5.3 8.3 15 27 NGCMS_1111 Benzo(b)&(k)fluoranthene mg/kg 10 17 31 57 NGCMS_1111 Benzo(a)pyrene mg/kg 6.3 10 20 36 NGCMS_1111 Indeno(1,2,3-cd)pyrene mg/kg 2.7 4.6 8.1 15 NGCMS_1111 Dibenzo(a,h)anthracene mg/kg <1 1.2 2.7 4.8 NGCMS_1111 Benzo(g,h,i)perylene mg/kg 2.7 4.4 8.0 15 NGCMS_1111 Total PAH mg/kg 63 118 200 390 NGCMS_1111 Organotins Monobutyltin as Sn ng/g <0.5 <0.5 <0.5 <0.5 NR_35 Dibutyltin as Sn ng/g 0.66 6.4 1.8 <0.5 NR_35 Tributyltin as Sn ng/g 3.6 29 5.6 <0.5 NR_35
1 Suakin Street, Pymble NSW 2073 Tel: +61 2 9449 0111 Fax: +61 2 9449 1653 www.measurement.gov.au_______________________________________________________________________________________
N a t i o n a l M e a s u r e m e n t I n s t i t u t e
REPORT OF ANALYSISPage: 2 of 9
Report No. RN547787Lab Reg No. N06/008673 N06/008674 N06/008675 N06/008676Sample Reference SITE 1 SITE 2A SITE 2B SITE 2C
Units MethodChlorinated Hydrocarbons 1,2,3,4-Tetrachlorobenzene mg/kg <2 <2 <2 <2 NGCMS_1122 Chlorinated Phenols 2,4,6-Trichlorophenol mg/kg <2 <2 <2 <2 NGCMS_1119 2,4,5-Trichlorophenol mg/kg <2 <2 <2 <2 NGCMS_1119 2,3,4,6-Tetrachlorophenol mg/kg <2 <2 <2 <2 NGCMS_1119 Pentachlorophenol mg/kg <2 <2 <2 <2 NGCMS_1119 Organochlorine (OC) Pesticides Endosulfan (total) mg/kg <0.02 <0.02 <0.02 <0.02 NR_19 Phenols Phenol (non-halogenated) mg/kg <1 <1 <1 <1 NGCMS_1119 m-Cresol mg/kg <1 <1 <1 <1 NGCMS_1119 o-Cresol mg/kg <1 <1 <1 <1 NGCMS_1119 p-Cresol mg/kg <1 <1 <1 <1 NGCMS_1119 Cresol (total) mg/kg <2 <2 <2 <2 NGCMS_1119 Polychlorinated Biphenyls PCBs mg/kg 0.39 0.22 0.26 0.040 NR_19 Phthalates Di-2-ethylhexyladipate mg/kg <2 <2 <2 <2 NGCMS_1122 Di-2-ethylhexylphthalate mg/kg <2 <2 <2 <2 NGCMS_1122 Organophosphate (OP) Pesticides Chlorpyriphos mg/kg <0.1 <0.1 <0.1 <0.1 NR_19 Scheduled Chemical Wastes Aldrin mg/kg <0.02 <0.02 <0.02 <0.02 NR_19 Hexachlorobenzene mg/kg <0.02 <0.02 <0.02 <0.02 NR_19 Alpha-BHC mg/kg <0.02 <0.02 <0.02 <0.02 NR_19 Beta-BHC mg/kg <0.02 <0.02 <0.02 <0.02 NR_19 Gamma-BHC (Lindane) mg/kg <0.02 <0.02 <0.02 <0.02 NR_19 Delta-BHC mg/kg <0.02 <0.02 <0.02 <0.02 NR_19 Chlordane mg/kg 0.15 0.063 0.044 <0.02 NR_19 DDD mg/kg 0.051 0.027 0.038 <0.02 NR_19 DDE mg/kg 0.031 0.012 0.027 <0.02 NR_19 DDT mg/kg <0.02 <0.02 <0.02 <0.02 NR_19 Dieldrin mg/kg 0.061 0.014 0.019 <0.02 NR_19 Endrin mg/kg <0.02 <0.02 <0.02 <0.02 NR_19 Endrin aldehyde mg/kg <0.02 <0.02 <0.02 <0.02 NR_19 Heptachlor mg/kg <0.02 <0.02 <0.02 <0.02 NR_19 Heptachlor epoxide mg/kg <0.02 <0.02 <0.02 <0.02 NR_19 Pentachloronitrobenzene mg/kg <1 <1 <1 <1 NGCMS_1122 Hexachlorophene mg/kg <1 <1 <1 <1 NGCMS_1122 Isodrin mg/kg <1 <1 <1 <1 NGCMS_1122 Pentachlorobenzene mg/kg <1 <1 <1 <1 NGCMS_1122 1,2,4,5-Tetrachlorobenzene mg/kg <1 <1 <1 <1 NGCMS_1122 1,2,4-Trichlorobenzene mg/kg <1 <1 <1 <1 NGCMS_1122 Total Petroleum Hydrocarbons TPH C6 - C9 mg/kg <25 <25 <25 <25 NGCMS_1121
1 Suakin Street, Pymble NSW 2073 Tel: +61 2 9449 0111 Fax: +61 2 9449 1653 www.measurement.gov.au_______________________________________________________________________________________
N a t i o n a l M e a s u r e m e n t I n s t i t u t e

REPORT OF ANALYSISPage: 3 of 9
Report No. RN547787Lab Reg No. N06/008673 N06/008674 N06/008675 N06/008676Sample Reference SITE 1 SITE 2A SITE 2B SITE 2C
Units MethodTotal Petroleum Hydrocarbons TPH C10 - C14 mg/kg <50 <50 <50 <50 NGCMS_1112 TPH C15 - C28 mg/kg 140 460 700 940 NGCMS_1112 TPH C29 - C36 mg/kg 260 400 560 550 NGCMS_1112 Total C10 - C36 mg/kg 400 860 1300 1500 NGCMS_1112 Volatile Organic Compounds Vinyl chloride mg/kg <1 <1 <1 <1 NGCMS_1120 1,1-Dichloroethylene mg/kg <1 <1 <1 <1 NGCMS_1120 1,1-Dichloromethane mg/kg <1 <1 <1 <1 NGCMS_1120 Chloroform mg/kg <1 <1 <1 <1 NGCMS_1120 1,1,1-Trichloroethane mg/kg <1 <1 <1 <1 NGCMS_1120 Carbon tetrachloride mg/kg <1 <1 <1 <1 NGCMS_1120 Benzene mg/kg <1 <1 <1 <1 NGCMS_1120 1,2-Dichloroethane mg/kg <1 <1 <1 <1 NGCMS_1120 Trichloroethylene mg/kg <1 <1 <1 <1 NGCMS_1120 Toluene mg/kg <1 <1 <1 <1 NGCMS_1120 1,1,2-Trichloroethane mg/kg <1 <1 <1 <1 NGCMS_1120 Tetrachloroethylene mg/kg <1 <1 <1 <1 NGCMS_1120 Chlorobenzene mg/kg <1 <1 <1 <1 NGCMS_1120 1,1,1,2-Tetrachloroethane mg/kg <1 <1 <1 <1 NGCMS_1120 Ethylbenzene mg/kg <1 <1 <1 <1 NGCMS_1120 Xylenes (total) mg/kg <2 <2 <2 <2 NGCMS_1120 Styrene (vinyl benzene) mg/kg <1 <1 <1 <1 NGCMS_1120 1,1,2,2-Tetrachloroethane mg/kg <1 <1 <1 <1 NGCMS_1120 1,4-Dichlorobenzene mg/kg <1 <1 <1 <1 NGCMS_1120 1,2-Dichlorobenzene mg/kg <1 <1 <1 <1 NGCMS_1120 2,4-Dinitrotoluene mg/kg <2 <2 <2 <2 NGCMS_1120 Methyl ethyl ketone mg/kg <5 <5 <5 <5 NGCMS_1120 Nitrobenzene mg/kg <2 <2 <2 <2 NGCMS_1120 Surrogate Surrogate semivolatile Rec. % 141 131 113 134 Surrogate volatile Rec % 109 98 95 92 Dates Date extracted 24-MAR-2006 24-MAR-2006 24-MAR-2006 24-MAR-2006 Date analysed 24-MAR-2006 24-MAR-2006 24-MAR-2006 24-MAR-2006
Danny Slee, Section ManagerOrganics - NSW (Accreditation No. 198)
4-MAY-2006
1 Suakin Street, Pymble NSW 2073 Tel: +61 2 9449 0111 Fax: +61 2 9449 1653 www.measurement.gov.au_______________________________________________________________________________________
N a t i o n a l M e a s u r e m e n t I n s t i t u t e

REPORT OF ANALYSISPage: 4 of 9
Report No. RN547787Lab Reg No. N06/008673 N06/008674 N06/008675 N06/008676Sample Reference SITE 1 SITE 2A SITE 2B SITE 2C
Units MethodTrace Elements Arsenic mg/kg 15 8 26 22 NT2_49 Beryllium mg/kg 0.53 <0.5 <0.5 <0.5 NT2_49 Cadmium mg/kg 1.3 0.9 2.3 1.7 NT2_49 Chromium - Hexavalent mg/kg 2.1 3.7 3.2 1.7 NT2_58 Copper mg/kg 210 120 260 190 NT2_49 Lead mg/kg 880 510 850 530 NT2_49 Mercury mg/kg 2.7 2.3 6 12 NT2_49 Molybdenum mg/kg 5.2 4.4 6.8 5.7 NT2_49 Nickel mg/kg 18 12 55 12 NT2_49 Phosphorus mg/kg 840 420 610 550 NT2_49 Selenium mg/kg 1.3 0.64 0.96 0.93 NT2_49 Silver mg/kg 1.4 0.55 1.1 0.89 NT2_49 Zinc mg/kg 930 480 1000 720 NT2_49 Total Solids % 39.4 62.7 60.5 68.4 NT2_49
Dr. Honway Louie, Section ManagerInorganics - NSW (Accreditation No. 198)
4-MAY-2006
Lab Reg No. N06/008673 N06/008674 N06/008675 N06/008676Sample Reference SITE 1 SITE 2A SITE 2B SITE 2C
Units MethodMiscellaneous Cyanide (total) mg/kg <0.5 <0.5 <0.5 <0.5 NW_S5A_B20 Nitrogen-Total mg/kg 7900 2000 2200 2300 NW_SL3_SL8
Dr. Honway Louie, Section ManagerInorganics - NSW (Accreditation No. 198)
4-MAY-2006
1 Suakin Street, Pymble NSW 2073 Tel: +61 2 9449 0111 Fax: +61 2 9449 1653 www.measurement.gov.au_______________________________________________________________________________________
N a t i o n a l M e a s u r e m e n t I n s t i t u t e

REPORT OF ANALYSISPage: 5 of 9
Report No. RN547787Client : W.S. ROONEY & ASSOCIATES P/L Job No. : WSRO01/060324
156 BARRENJOEY ROAD Quote No. : QT-01222 NEWPORT NSW 2106 Order No. : Date Sampled : 23-MAR-2006 Date Received : 24-MAR-2006
Attention : BILL ROONEY Sampled By : CLIENTProject Name : Your Client Services Manager : BRIAN WOODWARD Phone : (02) 94490151
Lab Reg No. Sample Ref Sample DescriptionN06/008677 SITE 3A MARINE SEDIMENT DOUBLE BAYN06/008678 SITE 3B MARINE SEDIMENT DOUBLE BAYN06/008679 SITE 4A MARINE SEDIMENT DOUBLE BAYN06/008680 SITE 4B MARINE SEDIMENT DOUBLE BAY
Lab Reg No. N06/008677 N06/008678 N06/008679 N06/008680Sample Reference SITE 3A SITE 3B SITE 4A SITE 4B
Units MethodHerbicides Fluroxypyr mg/kg <0.1 <0.1 <0.1 <0.1 NGCMS_1117 Picloram mg/kg <0.1 <0.1 <0.1 <0.1 NGCMS_1117 Triclopyr mg/kg <0.1 <0.1 <0.1 <0.1 NGCMS_1117 2,4-D mg/kg <0.1 <0.1 <0.1 <0.1 NGCMS_1117 2,4,5-T mg/kg <0.1 <0.1 <0.1 <0.1 NGCMS_1117 Fungicides Tebuconazole mg/kg <1 <1 <1 <1 NGCMS_1122 Poly Aromatic Hydrocarbons Napthalene mg/kg <1 <1 1.1 <1 NGCMS_1111 Acenaphthylene mg/kg <1 <1 4.1 <1 NGCMS_1111 Acenaphthene mg/kg <1 <1 <1 <1 NGCMS_1111 Fluorene mg/kg <1 <1 6.7 <1 NGCMS_1111 Phenanthrene mg/kg 4.0 <1 50 <1 NGCMS_1111 Anthracene mg/kg 1.1 <1 14 <1 NGCMS_1111 Fluoranthene mg/kg 8.7 <1 53 <1 NGCMS_1111 Pyrene mg/kg 8.6 <1 45 <1 NGCMS_1111 Benzo(a)anthracene mg/kg 4.1 <1 23 <1 NGCMS_1111 Chrysene mg/kg 3.8 <1 16 <1 NGCMS_1111 Benzo(b)&(k)fluoranthene mg/kg 7.3 <2 29 <2 NGCMS_1111 Benzo(a)pyrene mg/kg 4.7 <1 18 <1 NGCMS_1111 Indeno(1,2,3-cd)pyrene mg/kg 1.9 <1 6.9 <1 NGCMS_1111 Dibenzo(a,h)anthracene mg/kg <1 <1 2.3 <1 NGCMS_1111 Benzo(g,h,i)perylene mg/kg 1.9 <1 6.2 <1 NGCMS_1111 Total PAH mg/kg 46 <1 270 <1 NGCMS_1111 Organotins Monobutyltin as Sn ng/g 1.6 <0.5 <0.5 <0.5 NR_35 Dibutyltin as Sn ng/g 7.3 <0.5 2.1 <0.5 NR_35 Tributyltin as Sn ng/g 6.2 <0.5 1.8 <0.5 NR_35 Chlorinated Hydrocarbons 1,2,3,4-Tetrachlorobenzene mg/kg <2 <2 <2 <2 NGCMS_1122
1 Suakin Street, Pymble NSW 2073 Tel: +61 2 9449 0111 Fax: +61 2 9449 1653 www.measurement.gov.au_______________________________________________________________________________________
N a t i o n a l M e a s u r e m e n t I n s t i t u t e

REPORT OF ANALYSISPage: 6 of 9
Report No. RN547787Lab Reg No. N06/008677 N06/008678 N06/008679 N06/008680Sample Reference SITE 3A SITE 3B SITE 4A SITE 4B
Units MethodChlorinated Phenols 2,4,6-Trichlorophenol mg/kg <2 <2 <2 <2 NGCMS_1119 2,4,5-Trichlorophenol mg/kg <2 <2 <2 <2 NGCMS_1119 2,3,4,6-Tetrachlorophenol mg/kg <2 <2 <2 <2 NGCMS_1119 Pentachlorophenol mg/kg <2 <2 <2 <2 NGCMS_1119 Organochlorine (OC) Pesticides Endosulfan (total) mg/kg <0.02 <0.02 <0.02 <0.02 NR_19 Phenols Phenol (non-halogenated) mg/kg <1 <1 <1 <1 NGCMS_1119 m-Cresol mg/kg <1 <1 <1 <1 NGCMS_1119 o-Cresol mg/kg <1 <1 <1 <1 NGCMS_1119 p-Cresol mg/kg <1 <1 <1 <1 NGCMS_1119 Cresol (total) mg/kg <2 <2 <2 <2 NGCMS_1119 Polychlorinated Biphenyls PCBs mg/kg 0.042 <0.2 0.042 <0.2 NR_19 Phthalates Di-2-ethylhexyladipate mg/kg <2 <2 <2 <2 NGCMS_1122 Di-2-ethylhexylphthalate mg/kg <2 <2 <2 <2 NGCMS_1122 Organophosphate (OP) Pesticides Chlorpyriphos mg/kg <0.1 <0.1 <0.1 <0.1 NR_19 Scheduled Chemical Wastes Aldrin mg/kg <0.02 <0.02 <0.02 <0.02 NR_19 Hexachlorobenzene mg/kg <0.02 <0.02 <0.02 <0.02 NR_19 Alpha-BHC mg/kg <0.02 <0.02 <0.02 <0.02 NR_19 Beta-BHC mg/kg <0.02 <0.02 <0.02 <0.02 NR_19 Gamma-BHC (Lindane) mg/kg <0.02 <0.02 <0.02 <0.02 NR_19 Delta-BHC mg/kg <0.02 <0.02 <0.02 <0.02 NR_19 Chlordane mg/kg <0.02 <0.02 <0.02 <0.02 NR_19 DDD mg/kg <0.02 <0.02 <0.02 <0.02 NR_19 DDE mg/kg <0.02 <0.02 <0.02 <0.02 NR_19 DDT mg/kg <0.02 <0.02 <0.02 <0.02 NR_19 Dieldrin mg/kg <0.02 <0.02 <0.02 <0.02 NR_19 Endrin mg/kg <0.02 <0.02 <0.02 <0.02 NR_19 Endrin aldehyde mg/kg <0.02 <0.02 <0.02 <0.02 NR_19 Heptachlor mg/kg <0.02 <0.02 <0.02 <0.02 NR_19 Heptachlor epoxide mg/kg <0.02 <0.02 <0.02 <0.02 NR_19 Pentachloronitrobenzene mg/kg <1 <1 <1 <1 NGCMS_1122 Hexachlorophene mg/kg <1 <1 <1 <1 NGCMS_1122 Isodrin mg/kg <1 <1 <1 <1 NGCMS_1122 Pentachlorobenzene mg/kg <1 <1 <1 <1 NGCMS_1122 1,2,4,5-Tetrachlorobenzene mg/kg <1 <1 <1 <1 NGCMS_1122 1,2,4-Trichlorobenzene mg/kg <1 <1 <1 <1 NGCMS_1122 Total Petroleum Hydrocarbons TPH C6 - C9 mg/kg <25 <25 <25 <25 NGCMS_1121 TPH C10 - C14 mg/kg <50 <50 <50 <50 NGCMS_1112
1 Suakin Street, Pymble NSW 2073 Tel: +61 2 9449 0111 Fax: +61 2 9449 1653 www.measurement.gov.au_______________________________________________________________________________________
N a t i o n a l M e a s u r e m e n t I n s t i t u t e

REPORT OF ANALYSISPage: 7 of 9
Report No. RN547787Lab Reg No. N06/008677 N06/008678 N06/008679 N06/008680Sample Reference SITE 3A SITE 3B SITE 4A SITE 4B
Units MethodTotal Petroleum Hydrocarbons TPH C15 - C28 mg/kg <100 <100 410 <100 NGCMS_1112 TPH C29 - C36 mg/kg <100 <100 130 <100 NGCMS_1112 Total C10 - C36 mg/kg <250 <250 500 <250 NGCMS_1112 Volatile Organic Compounds Vinyl chloride mg/kg <1 <1 <1 <1 NGCMS_1120 1,1-Dichloroethylene mg/kg <1 <1 <1 <1 NGCMS_1120 1,1-Dichloromethane mg/kg <1 <1 <1 <1 NGCMS_1120 Chloroform mg/kg <1 <1 <1 <1 NGCMS_1120 1,1,1-Trichloroethane mg/kg <1 <1 <1 <1 NGCMS_1120 Carbon tetrachloride mg/kg <1 <1 <1 <1 NGCMS_1120 Benzene mg/kg <1 <1 <1 <1 NGCMS_1120 1,2-Dichloroethane mg/kg <1 <1 <1 <1 NGCMS_1120 Trichloroethylene mg/kg <1 <1 <1 <1 NGCMS_1120 Toluene mg/kg <1 <1 <1 <1 NGCMS_1120 1,1,2-Trichloroethane mg/kg <1 <1 <1 <1 NGCMS_1120 Tetrachloroethylene mg/kg <1 <1 <1 <1 NGCMS_1120 Chlorobenzene mg/kg <1 <1 <1 <1 NGCMS_1120 1,1,1,2-Tetrachloroethane mg/kg <1 <1 <1 <1 NGCMS_1120 Ethylbenzene mg/kg <1 <1 <1 <1 NGCMS_1120 Xylenes (total) mg/kg <2 <2 <2 <2 NGCMS_1120 Styrene (vinyl benzene) mg/kg <1 <1 <1 <1 NGCMS_1120 1,1,2,2-Tetrachloroethane mg/kg <1 <1 <1 <1 NGCMS_1120 1,4-Dichlorobenzene mg/kg <1 <1 <1 <1 NGCMS_1120 1,2-Dichlorobenzene mg/kg <1 <1 <1 <1 NGCMS_1120 2,4-Dinitrotoluene mg/kg <2 <2 <2 <2 NGCMS_1120 Methyl ethyl ketone mg/kg <5 <5 <5 <5 NGCMS_1120 Nitrobenzene mg/kg <2 <2 <2 <2 NGCMS_1120 Surrogate Surrogate semivolatile Rec. % 118 105 132 123 Surrogate volatile Rec % 96 95 99 111 Dates Date extracted 24-MAR-2006 24-MAR-2006 24-MAR-2006 24-MAR-2006 Date analysed 24-MAR-2006 24-MAR-2006 24-MAR-2006 24-MAR-2006
Danny Slee, Section ManagerOrganics - NSW (Accreditation No. 198)
4-MAY-2006
1 Suakin Street, Pymble NSW 2073 Tel: +61 2 9449 0111 Fax: +61 2 9449 1653 www.measurement.gov.au_______________________________________________________________________________________
N a t i o n a l M e a s u r e m e n t I n s t i t u t e

REPORT OF ANALYSISPage: 8 of 9
Report No. RN547787Lab Reg No. N06/008677 N06/008678 N06/008679 N06/008680Sample Reference SITE 3A SITE 3B SITE 4A SITE 4B
Units MethodTrace Elements Arsenic mg/kg 4.8 6.2 7.8 9.1 NT2_49 Beryllium mg/kg <0.5 <0.5 <0.5 <0.5 NT2_49 Cadmium mg/kg 0.18 0.11 0.13 0.11 NT2_49 Chromium - Hexavalent mg/kg 0.56 <0.5 <0.5 <0.5 NT2_58 Copper mg/kg 56 3.1 27 1.8 NT2_49 Lead mg/kg 100 7.2 88 4.1 NT2_49 Mercury mg/kg 0.83 <0.1 0.28 <0.1 NT2_49 Molybdenum mg/kg 1.5 2.2 1 3 NT2_49 Nickel mg/kg 3.6 2.5 3.9 2.4 NT2_49 Phosphorus mg/kg 190 96 250 63 NT2_49 Selenium mg/kg <0.5 0.5 <0.5 0.51 NT2_49 Silver mg/kg <0.5 <0.5 <0.5 <0.5 NT2_49 Zinc mg/kg 130 9.2 77 5.5 NT2_49 Total Solids % 76.4 72.8 73.5 74.7 NT2_49
Dr. Honway Louie, Section ManagerInorganics - NSW (Accreditation No. 198)
4-MAY-2006
Lab Reg No. N06/008677 N06/008678 N06/008679 N06/008680Sample Reference SITE 3A SITE 3B SITE 4A SITE 4B
Units MethodMiscellaneous Cyanide (total) mg/kg <0.5 <0.5 <0.5 <0.5 NW_S5A_B20 Nitrogen-Total mg/kg 590 280 470 220 NW_SL3_SL8
Dr. Honway Louie, Section ManagerInorganics - NSW (Accreditation No. 198)
4-MAY-2006
1 Suakin Street, Pymble NSW 2073 Tel: +61 2 9449 0111 Fax: +61 2 9449 1653 www.measurement.gov.au_______________________________________________________________________________________
N a t i o n a l M e a s u r e m e n t I n s t i t u t e

REPORT OF ANALYSISPage: 9 of 9
Report No. RN547787All results are expressed on a dry weight basis. This report supersedes RN544267.
Sample/s analysed as received.ND = Not Detected.This Report supersedes reports: RN542496 RN543613 RN544245
1 Suakin Street, Pymble NSW 2073 Tel: +61 2 9449 0111 Fax: +61 2 9449 1653 www.measurement.gov.au_______________________________________________________________________________________
N a t i o n a l M e a s u r e m e n t I n s t i t u t e

Australian Government____________________________________________National Measurement Institute
REPORT OF ANALYSISPage: 1 of 5
Report No. RN553710Client : W.S. ROONEY & ASSOCIATES P/L Job No. : WSRO01/060526
156 BARRENJOEY ROAD Quote No. : QT-00782 NEWPORT NSW 2106 Order No. : Date Sampled : Date Received : 26-MAY-2006
Attention : BILL ROONEY Sampled By : CLIENTProject Name : Your Client Services Manager : BRIAN WOODWARD Phone : (02) 94490151
Lab Reg No. Sample Ref Sample DescriptionN06/016927 2N MARINE SEDIMENT DOUBLE BAYN06/016928 2NA MARINE SEDIMENT DOUBLE BAYN06/016929 2NB MARINE SEDIMENT DOUBLE BAYN06/016930 2NC MARINE SEDIMENT DOUBLE BAY
Lab Reg No. N06/016927 N06/016928 N06/016929 N06/016930Sample Reference 2N 2NA 2NB 2NC
Units MethodPoly Aromatic Hydrocarbons Benzo(a)pyrene mg/kg 2.8 6.5 1.8 11 NGCMS_1111 Surrogate Surrogate semivolatile Rec. % 106 108 103 109 Dates Date extracted 29-MAY-2006 29-MAY-2006 29-MAY-2006 29-MAY-2006 Date analysed 31-MAY-2006 31-MAY-2006 31-MAY-2006 31-MAY-2006
Danny Slee, Section ManagerOrganics - NSW (Accreditation No. 198)
7-JUN-2006
Lab Reg No. N06/016927 N06/016928 N06/016929 N06/016930Sample Reference 2N 2NA 2NB 2NC
Units MethodTrace Elements Lead mg/kg 600 710 250 940 NT2_49 Total Solids % 61.4 48.7 74.0 55.3 NT2_49
Dr. Honway Louie, Section ManagerInorganics - NSW (Accreditation No. 198)
7-JUN-2006
1 Suakin Street, Pymble NSW 2073 Tel: +61 2 9449 0111 Fax: +61 2 9449 1653 www.measurement.gov.au_______________________________________________________________________________________
N a t i o n a l M e a s u r e m e n t I n s t i t u t e

REPORT OF ANALYSISPage: 2 of 5
Report No. RN553710Client : W.S. ROONEY & ASSOCIATES P/L Job No. : WSRO01/060526
156 BARRENJOEY ROAD Quote No. : QT-00782 NEWPORT NSW 2106 Order No. : Date Sampled : Date Received : 26-MAY-2006
Attention : BILL ROONEY Sampled By : CLIENTProject Name : Your Client Services Manager : BRIAN WOODWARD Phone : (02) 94490151
Lab Reg No. Sample Ref Sample DescriptionN06/016931 2SA MARINE SEDIMENT DOUBLE BAYN06/016933 2S MARINE SEDIMENT DOUBLE BAYN06/016934 2W MARINE SEDIMENT DOUBLE BAYN06/016935 4S MARINE SEDIMENT DOUBLE BAY
Lab Reg No. N06/016931 N06/016933 N06/016934 N06/016935Sample Reference 2SA 2S 2W 4S
Units MethodPoly Aromatic Hydrocarbons Benzo(a)pyrene mg/kg 6.5 1.1 12 4.3 NGCMS_1111 Surrogate Surrogate semivolatile Rec. % 113 122 107 117 Dates Date extracted 29-MAY-2006 29-MAY-2006 29-MAY-2006 29-MAY-2006 Date analysed 31-MAY-2006 31-MAY-2006 31-MAY-2006 31-MAY-2006
Danny Slee, Section ManagerOrganics - NSW (Accreditation No. 198)
7-JUN-2006
Lab Reg No. N06/016931 N06/016933 N06/016934 N06/016935Sample Reference 2SA 2S 2W 4S
Units MethodTrace Elements Lead mg/kg 480 54 470 130 NT2_49 Total Solids % 39.9 74.0 53.8 72.4 NT2_49
Dr. Honway Louie, Section ManagerInorganics - NSW (Accreditation No. 198)
7-JUN-2006
1 Suakin Street, Pymble NSW 2073 Tel: +61 2 9449 0111 Fax: +61 2 9449 1653 www.measurement.gov.au_______________________________________________________________________________________
N a t i o n a l M e a s u r e m e n t I n s t i t u t e

REPORT OF ANALYSISPage: 3 of 5
Report No. RN553710Client : W.S. ROONEY & ASSOCIATES P/L Job No. : WSRO01/060526
156 BARRENJOEY ROAD Quote No. : QT-00782 NEWPORT NSW 2106 Order No. : Date Sampled : Date Received : 26-MAY-2006
Attention : BILL ROONEY Sampled By : CLIENTProject Name : Your Client Services Manager : BRIAN WOODWARD Phone : (02) 94490151
Lab Reg No. Sample Ref Sample DescriptionN06/016936 4SA MARINE SEDIMENT DOUBLE BAYN06/016937 4SB MARINE SEDIMENT DOUBLE BAYN06/016938 4N MARINE SEDIMENT DOUBLE BAYN06/016939 4NA MARINE SEDIMENT DOUBLE BAY
Lab Reg No. N06/016936 N06/016937 N06/016938 N06/016939Sample Reference 4SA 4SB 4N 4NA
Units MethodPoly Aromatic Hydrocarbons Benzo(a)pyrene mg/kg 7.6 <1 8.5 11 NGCMS_1111 Surrogate Surrogate semivolatile Rec. % 129 124 121 127 Dates Date extracted 29-MAY-2006 29-MAY-2006 29-MAY-2006 29-MAY-2006 Date analysed 31-MAY-2006 31-MAY-2006 31-MAY-2006 31-MAY-2006
Danny Slee, Section ManagerOrganics - NSW (Accreditation No. 198)
7-JUN-2006
Lab Reg No. N06/016936 N06/016937 N06/016938 N06/016939Sample Reference 4SA 4SB 4N 4NA
Units MethodTrace Elements Lead mg/kg 200 11 65 140 NT2_49 Total Solids % 69.0 76.9 73.5 73.7 NT2_49
Dr. Honway Louie, Section ManagerInorganics - NSW (Accreditation No. 198)
7-JUN-2006
1 Suakin Street, Pymble NSW 2073 Tel: +61 2 9449 0111 Fax: +61 2 9449 1653 www.measurement.gov.au_______________________________________________________________________________________
N a t i o n a l M e a s u r e m e n t I n s t i t u t e
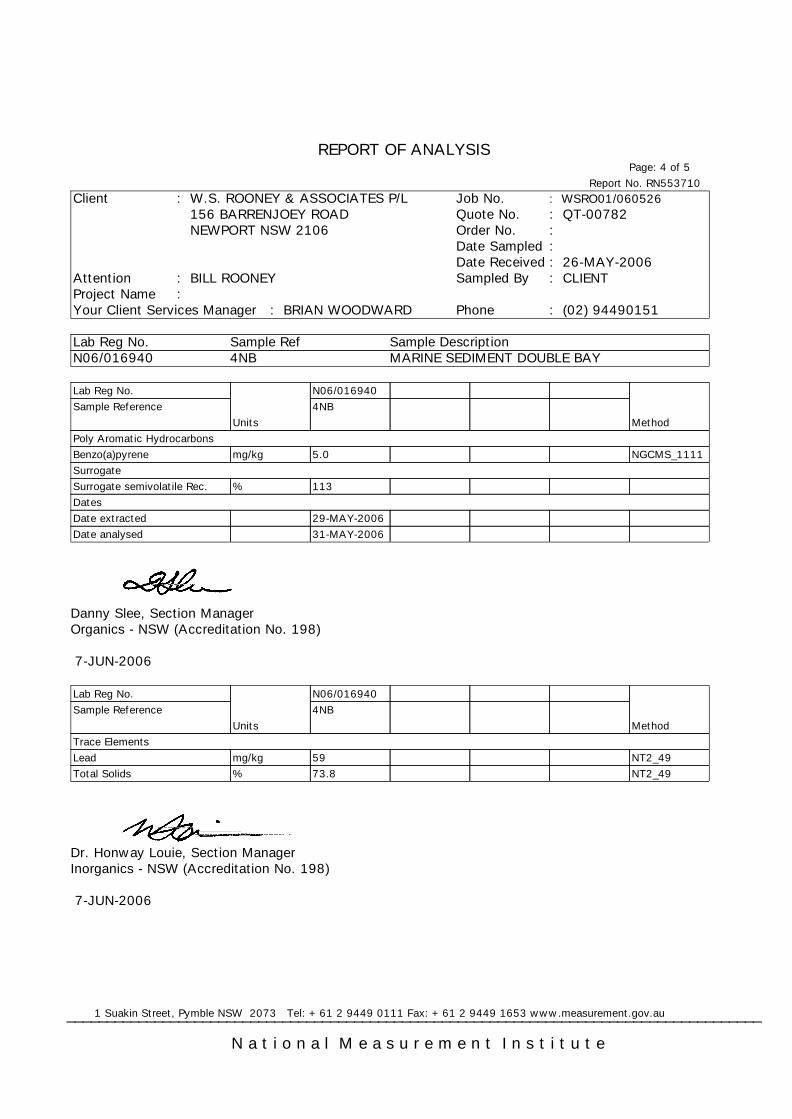
REPORT OF ANALYSISPage: 4 of 5
Report No. RN553710Client : W.S. ROONEY & ASSOCIATES P/L Job No. : WSRO01/060526
156 BARRENJOEY ROAD Quote No. : QT-00782 NEWPORT NSW 2106 Order No. : Date Sampled : Date Received : 26-MAY-2006
Attention : BILL ROONEY Sampled By : CLIENTProject Name : Your Client Services Manager : BRIAN WOODWARD Phone : (02) 94490151
Lab Reg No. Sample Ref Sample DescriptionN06/016940 4NB MARINE SEDIMENT DOUBLE BAY
Lab Reg No. N06/016940Sample Reference 4NB
Units MethodPoly Aromatic Hydrocarbons Benzo(a)pyrene mg/kg 5.0 NGCMS_1111 Surrogate Surrogate semivolatile Rec. % 113 Dates Date extracted 29-MAY-2006 Date analysed 31-MAY-2006
Danny Slee, Section ManagerOrganics - NSW (Accreditation No. 198)
7-JUN-2006
Lab Reg No. N06/016940Sample Reference 4NB
Units MethodTrace Elements Lead mg/kg 59 NT2_49 Total Solids % 73.8 NT2_49
Dr. Honway Louie, Section ManagerInorganics - NSW (Accreditation No. 198)
7-JUN-2006
1 Suakin Street, Pymble NSW 2073 Tel: +61 2 9449 0111 Fax: +61 2 9449 1653 www.measurement.gov.au_______________________________________________________________________________________
N a t i o n a l M e a s u r e m e n t I n s t i t u t e

REPORT OF ANALYSISPage: 5 of 5
Report No. RN553710All results are expressed on a dry weight basis.
This report is issued in accordance with NATA’saccreditation requirementsAccreditation for compliance with ISO/IEC 17025.This report shall not be reproduced except in full.Results relate only to the sample(s) tested.
ND = Not Detected.This Report supersedes reports: RN553271 RN553447
1 Suakin Street, Pymble NSW 2073 Tel: +61 2 9449 0111 Fax: +61 2 9449 1653 www.measurement.gov.au_______________________________________________________________________________________
N a t i o n a l M e a s u r e m e n t I n s t i t u t e

Australian Government____________________________________________National Measurement Institute
REPORT OF ANALYSISPage: 1 of 1
Report No. RN554540Client : W.S. ROONEY & ASSOCIATES P/L Job No. : WSRO01/060526
156 BARRENJOEY ROAD Quote No. : QT-00782 NEWPORT NSW 2106 Order No. : Date Sampled : Date Received : 26-MAY-2006
Attention : BILL ROONEY Sampled By : CLIENTProject Name : Your Client Services Manager : BRIAN WOODWARD Phone : (02) 94490151
Lab Reg No. Sample Ref Sample DescriptionN06/016927/S 2N MARINE SEDIMENT DOUBLE BAYN06/016931/S 2SA MARINE SEDIMENT DOUBLE BAYN06/016934/S 2W MARINE SEDIMENT DOUBLE BAY
Lab Reg No. N06/016927/S N06/016931/S N06/016934/SSample Reference 2N 2SA 2W
Units MethodSubcontracted Analysis Subcontract Analysis See comment See comment See comment
N06/016927/Sand N06/016931/S and N06/016934/S
Samples were sent to and a report received from:Envirolab Services Pty Ltd, Willoughby NSW 2068.
Envirolab report no. 5522 is attached to this cover report.
Dr. Honway Louie, Section ManagerInorganics - NSW (Accreditation No. 198)
13-JUN-2006
Sample/s analysed as received.ND = Not Detected.This Report shall not be reproduced except in full.
1 Suakin Street, Pymble NSW 2073 Tel: +61 2 9449 0111 Fax: +61 2 9449 1653 www.measurement.gov.au_______________________________________________________________________________________
N a t i o n a l M e a s u r e m e n t I n s t i t u t e

Appendix C Laboratory Certificates of Analysis for
TCLP Testing of Sediment Samples
J:\JOBS\43217511\TLB- DOUBLE BAY MARINA\DELIVERABLES\FINAL REPORT\FINAL REPORT R001.DOC\1-MAY-07

Australian Government____________________________________________National Measurement Institute
REPORT OF ANALYSISPage: 1 of 2
Report No. RN548147Client : W.S. ROONEY & ASSOCIATES P/L Job No. : WSRO01/060324
156 BARRENJOEY ROAD Quote No. : QT-01222 NEWPORT NSW 2106 Order No. : Date Sampled : 23-MAR-2006 Date Received : 1-MAY-2006
Attention : BILL ROONEY Sampled By : CLIENTProject Name : Your Client Services Manager : BRIAN WOODWARD Phone : (02) 94490151
Lab Reg No. Sample Ref Sample DescriptionN06/008673/T SITE 1 MARINE SEDIMENT LEACHATE DOUBLE BAY
Lab Reg No. N06/008673/TSample Reference SITE 1
Units MethodSemi Volatile Organic Compounds Benzo(a)pyrene ug/L <1 NGCMS_1111 Surrogate Surrogate semivolatile Rec. % 88 Dates Date extracted 4-MAY-2006 Date analysed 4-MAY-2006
Danny Slee, Section ManagerOrganics - NSW (Accreditation No. 198)
5-MAY-2006
Lab Reg No. N06/008673/TSample Reference SITE 1
Units MethodTrace Elements Arsenic ug/L <50 NT247_251 Lead ug/L 430 NT2_47 Mercury ug/L <10 NT2_47_244 Nickel ug/L <50 NT2_47
Dr. Honway Louie, Section ManagerInorganics - NSW (Accreditation No. 198)
5-MAY-2006
1 Suakin Street, Pymble NSW 2073 Tel: +61 2 9449 0111 Fax: +61 2 9449 1653 www.measurement.gov.au_______________________________________________________________________________________
N a t i o n a l M e a s u r e m e n t I n s t i t u t e

REPORT OF ANALYSISPage: 2 of 2
Report No. RN54814730g sample was leached for 20 hours with 600 ml buffer at pH 4.93 and the leachate tested for the above analytes.
Sample/s analysed as received.ND = Not Detected.This Report supersedes reports: RN548062 RN548134
1 Suakin Street, Pymble NSW 2073 Tel: +61 2 9449 0111 Fax: +61 2 9449 1653 www.measurement.gov.au_______________________________________________________________________________________
N a t i o n a l M e a s u r e m e n t I n s t i t u t e

Australian Government____________________________________________National Measurement Institute
REPORT OF ANALYSISPage: 1 of 2
Report No. RN548151Client : W.S. ROONEY & ASSOCIATES P/L Job No. : WSRO01/060324
156 BARRENJOEY ROAD Quote No. : QT-01222 NEWPORT NSW 2106 Order No. : Date Sampled : 23-MAR-2006 Date Received : 1-MAY-2006
Attention : BILL ROONEY Sampled By : CLIENTProject Name : Your Client Services Manager : BRIAN WOODWARD Phone : (02) 94490151
Lab Reg No. Sample Ref Sample DescriptionN06/008674/T SITE 2A MARINE SEDIMENT LEACHATE DOUBLE BAY
Lab Reg No. N06/008674/TSample Reference SITE 2A
Units MethodSemi Volatile Organic Compounds Benzo(a)pyrene ug/L <1 NGCMS_1111 Surrogate Surrogate semivolatile Rec. % 96 Dates Date extracted 4-MAY-2006 Date analysed 4-MAY-2006
Danny Slee, Section ManagerOrganics - NSW (Accreditation No. 198)
5-MAY-2006
Lab Reg No. N06/008674/TSample Reference SITE 2A
Units MethodTrace Elements Lead ug/L 1100 NT2_47 Mercury ug/L <10 NT2_47_244 Nickel ug/L <50 NT2_47
Dr. Honway Louie, Section ManagerInorganics - NSW (Accreditation No. 198)
5-MAY-2006
1 Suakin Street, Pymble NSW 2073 Tel: +61 2 9449 0111 Fax: +61 2 9449 1653 www.measurement.gov.au_______________________________________________________________________________________
N a t i o n a l M e a s u r e m e n t I n s t i t u t e

REPORT OF ANALYSISPage: 2 of 2
Report No. RN54815130g sample was leached for 20 hours with 600 ml buffer at pH 4.93 and the leachate tested for the above analytes.
Sample/s analysed as received.ND = Not Detected.This Report supersedes reports: RN548062 RN548134
1 Suakin Street, Pymble NSW 2073 Tel: +61 2 9449 0111 Fax: +61 2 9449 1653 www.measurement.gov.au_______________________________________________________________________________________
N a t i o n a l M e a s u r e m e n t I n s t i t u t e

Australian Government____________________________________________National Measurement Institute
REPORT OF ANALYSISPage: 1 of 2
Report No. RN548153Client : W.S. ROONEY & ASSOCIATES P/L Job No. : WSRO01/060324
156 BARRENJOEY ROAD Quote No. : QT-01222 NEWPORT NSW 2106 Order No. : Date Sampled : 23-MAR-2006 Date Received : 1-MAY-2006
Attention : BILL ROONEY Sampled By : CLIENTProject Name : Your Client Services Manager : BRIAN WOODWARD Phone : (02) 94490151
Lab Reg No. Sample Ref Sample DescriptionN06/008675/T SITE 2B MARINE SEDIMENT LEACHATE DOUBLE BAY
Lab Reg No. N06/008675/TSample Reference SITE 2B
Units MethodSemi Volatile Organic Compounds Benzo(a)pyrene ug/L <1 NGCMS_1111 Surrogate Surrogate semivolatile Rec. % 98 Dates Date extracted 4-MAY-2006 Date analysed 4-MAY-2006
Danny Slee, Section ManagerOrganics - NSW (Accreditation No. 198)
5-MAY-2006
Lab Reg No. N06/008675/TSample Reference SITE 2B
Units MethodTrace Elements Arsenic ug/L <50 NT247_251 Cadmium ug/L <50 NT2_47 Lead ug/L 6100 NT2_47 Mercury ug/L <10 NT2_47_244 Nickel ug/L 120 NT2_47
Dr. Honway Louie, Section ManagerInorganics - NSW (Accreditation No. 198)
5-MAY-2006
1 Suakin Street, Pymble NSW 2073 Tel: +61 2 9449 0111 Fax: +61 2 9449 1653 www.measurement.gov.au_______________________________________________________________________________________
N a t i o n a l M e a s u r e m e n t I n s t i t u t e

REPORT OF ANALYSISPage: 2 of 2
Report No. RN54815330g sample was leached for 20 hours with 600 ml buffer at pH 4.93 and the leachate tested for the above analytes.
Sample/s analysed as received.ND = Not Detected.This Report supersedes reports: RN548062 RN548134
1 Suakin Street, Pymble NSW 2073 Tel: +61 2 9449 0111 Fax: +61 2 9449 1653 www.measurement.gov.au_______________________________________________________________________________________
N a t i o n a l M e a s u r e m e n t I n s t i t u t e

Australian Government____________________________________________National Measurement Institute
REPORT OF ANALYSISPage: 1 of 2
Report No. RN548154Client : W.S. ROONEY & ASSOCIATES P/L Job No. : WSRO01/060324
156 BARRENJOEY ROAD Quote No. : QT-01222 NEWPORT NSW 2106 Order No. : Date Sampled : 23-MAR-2006 Date Received : 1-MAY-2006
Attention : BILL ROONEY Sampled By : CLIENTProject Name : Your Client Services Manager : BRIAN WOODWARD Phone : (02) 94490151
Lab Reg No. Sample Ref Sample DescriptionN06/008676/T SITE 2C MARINE SEDIMENT LEACHATE DOUBLE BAY
Lab Reg No. N06/008676/TSample Reference SITE 2C
Units MethodSemi Volatile Organic Compounds Benzo(a)pyrene ug/L <1 NGCMS_1111 Surrogate Surrogate semivolatile Rec. % 97 Dates Date extracted 4-MAY-2006 Date analysed 4-MAY-2006
Danny Slee, Section ManagerOrganics - NSW (Accreditation No. 198)
5-MAY-2006
Lab Reg No. N06/008676/TSample Reference SITE 2C
Units MethodTrace Elements Arsenic ug/L <50 NT247_251 Lead ug/L 1400 NT2_47 Mercury ug/L <10 NT2_47_244 Nickel ug/L 52 NT2_47
Dr. Honway Louie, Section ManagerInorganics - NSW (Accreditation No. 198)
5-MAY-2006
1 Suakin Street, Pymble NSW 2073 Tel: +61 2 9449 0111 Fax: +61 2 9449 1653 www.measurement.gov.au_______________________________________________________________________________________
N a t i o n a l M e a s u r e m e n t I n s t i t u t e

REPORT OF ANALYSISPage: 2 of 2
Report No. RN54815430g sample was leached for 20 hours with 600 ml buffer at pH 4.93 and the leachate tested for the above analytes.
Sample/s analysed as received.ND = Not Detected.This Report supersedes reports: RN548062 RN548134
1 Suakin Street, Pymble NSW 2073 Tel: +61 2 9449 0111 Fax: +61 2 9449 1653 www.measurement.gov.au_______________________________________________________________________________________
N a t i o n a l M e a s u r e m e n t I n s t i t u t e

Australian Government____________________________________________National Measurement Institute
REPORT OF ANALYSISPage: 1 of 2
Report No. RN548155Client : W.S. ROONEY & ASSOCIATES P/L Job No. : WSRO01/060324
156 BARRENJOEY ROAD Quote No. : QT-01222 NEWPORT NSW 2106 Order No. : Date Sampled : 23-MAR-2006 Date Received : 1-MAY-2006
Attention : BILL ROONEY Sampled By : CLIENTProject Name : Your Client Services Manager : BRIAN WOODWARD Phone : (02) 94490151
Lab Reg No. Sample Ref Sample DescriptionN06/008677/T SITE 3A MARINE SEDIMENT LEACHATE DOUBLE BAY
Lab Reg No. N06/008677/TSample Reference SITE 3A
Units MethodSemi Volatile Organic Compounds Benzo(a)pyrene ug/L <1 NGCMS_1111 Surrogate Surrogate semivolatile Rec. % 114 Dates Date extracted 4-MAY-2006 Date analysed 4-MAY-2006
Danny Slee, Section ManagerOrganics - NSW (Accreditation No. 198)
5-MAY-2006
Lab Reg No. N06/008677/TSample Reference SITE 3A
Units MethodTrace Elements Lead ug/L 210 NT2_47 Mercury ug/L <10 NT2_47_244
Dr. Honway Louie, Section ManagerInorganics - NSW (Accreditation No. 198)
5-MAY-2006
1 Suakin Street, Pymble NSW 2073 Tel: +61 2 9449 0111 Fax: +61 2 9449 1653 www.measurement.gov.au_______________________________________________________________________________________
N a t i o n a l M e a s u r e m e n t I n s t i t u t e

REPORT OF ANALYSISPage: 2 of 2
Report No. RN54815530g sample was leached for 20 hours with 600 ml buffer at pH 4.93 and the leachate tested for the above analytes.
Sample/s analysed as received.ND = Not Detected.This Report supersedes reports: RN548062 RN548134
1 Suakin Street, Pymble NSW 2073 Tel: +61 2 9449 0111 Fax: +61 2 9449 1653 www.measurement.gov.au_______________________________________________________________________________________
N a t i o n a l M e a s u r e m e n t I n s t i t u t e

Australian Government____________________________________________National Measurement Institute
REPORT OF ANALYSISPage: 1 of 2
Report No. RN548156Client : W.S. ROONEY & ASSOCIATES P/L Job No. : WSRO01/060324
156 BARRENJOEY ROAD Quote No. : QT-01222 NEWPORT NSW 2106 Order No. : Date Sampled : 23-MAR-2006 Date Received : 1-MAY-2006
Attention : BILL ROONEY Sampled By : CLIENTProject Name : Your Client Services Manager : BRIAN WOODWARD Phone : (02) 94490151
Lab Reg No. Sample Ref Sample DescriptionN06/008679/T SITE 4A MARINE SEDIMENT LEACHATE DOUBLE BAY
Lab Reg No. N06/008679/TSample Reference SITE 4A
Units MethodSemi Volatile Organic Compounds Benzo(a)pyrene ug/L <1 NGCMS_1111 Surrogate Surrogate semivolatile Rec. % 123 Dates Date extracted 4-MAY-2006 Date analysed 4-MAY-2006
Danny Slee, Section ManagerOrganics - NSW (Accreditation No. 198)
5-MAY-2006
Lab Reg No. N06/008679/TSample Reference SITE 4A
Units MethodTrace Elements Lead ug/L 61 NT2_47
Dr. Honway Louie, Section ManagerInorganics - NSW (Accreditation No. 198)
5-MAY-2006
1 Suakin Street, Pymble NSW 2073 Tel: +61 2 9449 0111 Fax: +61 2 9449 1653 www.measurement.gov.au_______________________________________________________________________________________
N a t i o n a l M e a s u r e m e n t I n s t i t u t e

REPORT OF ANALYSISPage: 2 of 2
Report No. RN54815630g sample was leached for 20 hours with 600 ml buffer at pH 4.93 and the leachate tested for the above analytes.
Sample/s analysed as received.ND = Not Detected.This Report supersedes reports: RN548062 RN548134
1 Suakin Street, Pymble NSW 2073 Tel: +61 2 9449 0111 Fax: +61 2 9449 1653 www.measurement.gov.au_______________________________________________________________________________________
N a t i o n a l M e a s u r e m e n t I n s t i t u t e

Australian Government____________________________________________National Measurement Institute
REPORT OF ANALYSISPage: 1 of 2
Report No. RN548161Client : W.S. ROONEY & ASSOCIATES P/L Job No. : WSRO01/060324
156 BARRENJOEY ROAD Quote No. : QT-01222 NEWPORT NSW 2106 Order No. : Date Sampled : 23-MAR-2006 Date Received : 1-MAY-2006
Attention : BILL ROONEY Sampled By : CLIENTProject Name : Your Client Services Manager : BRIAN WOODWARD Phone : (02) 94490151
Lab Reg No. Sample Ref Sample DescriptionN06/008674/E SITE 2A MARINE SEDIMENT SEAWATER ELUTRIATE
DOUBLE BAY
Lab Reg No. N06/008674/ESample Reference SITE 2A
Units MethodSemi Volatile Organic Compounds Benzo(a)pyrene ug/L <1 NGCMS_1111 Surrogate Surrogate semivolatile Rec. % 124 Dates Date extracted 4-MAY-2006 Date analysed 4-MAY-2006
Danny Slee, Section ManagerOrganics - NSW (Accreditation No. 198)
5-MAY-2006
Lab Reg No. N06/008674/ESample Reference SITE 2A
Units MethodTrace Elements Arsenic ug/L <50 NT247_251 Lead ug/L 82 NT2_47 Nickel ug/L <50 NT2_47
Dr. Honway Louie, Section ManagerInorganics - NSW (Accreditation No. 198)
5-MAY-2006
1 Suakin Street, Pymble NSW 2073 Tel: +61 2 9449 0111 Fax: +61 2 9449 1653 www.measurement.gov.au_______________________________________________________________________________________
N a t i o n a l M e a s u r e m e n t I n s t i t u t e

REPORT OF ANALYSISPage: 2 of 2
Report No. RN54816130g sample was leached for 20 hours with 600 ml seawater and the leachate tested for the above analytes.
Sample/s analysed as received.ND = Not Detected.This Report supersedes reports: RN548063 RN548135
1 Suakin Street, Pymble NSW 2073 Tel: +61 2 9449 0111 Fax: +61 2 9449 1653 www.measurement.gov.au_______________________________________________________________________________________
N a t i o n a l M e a s u r e m e n t I n s t i t u t e

Australian Government____________________________________________National Measurement Institute
REPORT OF ANALYSISPage: 1 of 2
Report No. RN548162Client : W.S. ROONEY & ASSOCIATES P/L Job No. : WSRO01/060324
156 BARRENJOEY ROAD Quote No. : QT-01222 NEWPORT NSW 2106 Order No. : Date Sampled : 23-MAR-2006 Date Received : 1-MAY-2006
Attention : BILL ROONEY Sampled By : CLIENTProject Name : Your Client Services Manager : BRIAN WOODWARD Phone : (02) 94490151
Lab Reg No. Sample Ref Sample DescriptionN06/008675/E SITE 2B MARINE SEDIMENT SEAWATER ELUTRIATE
DOUBLE BAYN06/008675/E SITE 2B DUP MARINE SEDIMENT SEAWATER ELUTRIATE
DUPLICATE DOUBLE BAY
Lab Reg No. N06/008675/E N06/008675/ESample Reference SITE 2B SITE 2B DUP
Units MethodSemi Volatile Organic Compounds Benzo(a)pyrene ug/L <1 <1 NGCMS_1111 Surrogate Surrogate semivolatile Rec. % 107 98 Dates Date extracted 4-MAY-2006 4-MAY-2006 Date analysed 4-MAY-2006 4-MAY-2006
Danny Slee, Section ManagerOrganics - NSW (Accreditation No. 198)
5-MAY-2006
Lab Reg No. N06/008675/E N06/008675/ESample Reference SITE 2B SITE 2B DUP
Units MethodTrace Elements Arsenic ug/L <50 <50 NT247_251 Lead ug/L 320 470 NT2_47 Nickel ug/L <50 <50 NT2_47
1 Suakin Street, Pymble NSW 2073 Tel: +61 2 9449 0111 Fax: +61 2 9449 1653 www.measurement.gov.au_______________________________________________________________________________________
N a t i o n a l M e a s u r e m e n t I n s t i t u t e

REPORT OF ANALYSISPage: 2 of 2
Report No. RN548162Lab Reg No. N06/008675/E N06/008675/ESample Reference SITE 2B SITE 2B DUP
Units Method
Dr. Honway Louie, Section ManagerInorganics - NSW (Accreditation No. 198)
5-MAY-2006
30g sample was leached for 20 hours with 600 ml seawater and the leachate tested for the above analytes.
Sample/s analysed as received.ND = Not Detected.This Report supersedes reports: RN548063 RN548135
1 Suakin Street, Pymble NSW 2073 Tel: +61 2 9449 0111 Fax: +61 2 9449 1653 www.measurement.gov.au_______________________________________________________________________________________
N a t i o n a l M e a s u r e m e n t I n s t i t u t e

Australian Government____________________________________________National Measurement Institute
REPORT OF ANALYSISPage: 1 of 2
Report No. RN548163Client : W.S. ROONEY & ASSOCIATES P/L Job No. : WSRO01/060324
156 BARRENJOEY ROAD Quote No. : QT-01222 NEWPORT NSW 2106 Order No. : Date Sampled : 23-MAR-2006 Date Received : 1-MAY-2006
Attention : BILL ROONEY Sampled By : CLIENTProject Name : Your Client Services Manager : BRIAN WOODWARD Phone : (02) 94490151
Lab Reg No. Sample Ref Sample DescriptionN06/008679/E SITE 4A MARINE SEDIMENT SEAWATER ELUTRIATE
DOUBLE BAY
Lab Reg No. N06/008679/ESample Reference SITE 4A
Units MethodSemi Volatile Organic Compounds Benzo(a)pyrene ug/L <1 NGCMS_1111 Surrogate Surrogate semivolatile Rec. % 138 Dates Date extracted 4-MAY-2006 Date analysed 4-MAY-2006
Danny Slee, Section ManagerOrganics - NSW (Accreditation No. 198)
5-MAY-2006
Lab Reg No. N06/008679/ESample Reference SITE 4A
Units MethodTrace Elements Arsenic ug/L <50 NT247_251 Lead ug/L <50 NT2_47 Nickel ug/L <50 NT2_47
Dr. Honway Louie, Section ManagerInorganics - NSW (Accreditation No. 198)
5-MAY-2006
1 Suakin Street, Pymble NSW 2073 Tel: +61 2 9449 0111 Fax: +61 2 9449 1653 www.measurement.gov.au_______________________________________________________________________________________
N a t i o n a l M e a s u r e m e n t I n s t i t u t e

REPORT OF ANALYSISPage: 2 of 2
Report No. RN54816330g sample was leached for 20 hours with 600 ml seawater and the leachate tested for the above analytes.
Sample/s analysed as received.ND = Not Detected.This Report supersedes reports: RN548063 RN548135
1 Suakin Street, Pymble NSW 2073 Tel: +61 2 9449 0111 Fax: +61 2 9449 1653 www.measurement.gov.au_______________________________________________________________________________________
N a t i o n a l M e a s u r e m e n t I n s t i t u t e

Appendix D Laboratory Certificates of Analysis for
Water Samples
J:\JOBS\43217511\TLB- DOUBLE BAY MARINA\DELIVERABLES\FINAL REPORT\FINAL REPORT R001.DOC\1-MAY-07

ANALYTICAL SERVICES DIVISIONABN 30 008 127 802Correspondence to: 99 Mitchell RdPO Box 331 CARDIFF NSW 2285HUNTER REGIONAL MAIL Telephone: (02) 4902 4800CENTRE NSW 2310 Facsimile: (02) 4902 4899
CERTIFICATE OF ANALYSIS Cover Page 1Contents :1. Cover Pages (3)2. Analysis Report Pages3. QA/QC Appendix4. Additional Reports - External
(if applicable)5. Chain of Custody (if applicable)
Report No. : 6E1175
Attention : Mr Bill Rooney
Client : WS Rooney & Associates Pty Ltd: 156 Barrenjoey Rd: NEWPORTNSW 2106
Samples : 2
Reference/Order : 0511-057
Project : DRY WEATHER SEA WATER
Received Samples : 11/04/06 Instructions : 11/04/06
Date Reported : 26/04/06
PLEASE SEE FOLLOWING PAGES FOR METHOD LISTING AND RESULTS
RESULTS:All samples were analysed as received. This report relates specifically to the samples as received. Results relateto the source material only to the extent that the samples as supplied are truly representative of the sample source.This report replaces any preliminary results issued. Note that for methods indicated with "#", NATA accreditationdoes not cover the performance of this service. Three significant figures (or 2 for <10PQL) are reported forstatistical purposes only. Where "Total" concentrations are reported for organic suites of compounds this is the summationof the individual compounds and the PQL is noted for reporting purposes only. This report has been authorized by theNATA signatories listed in the method descriptions section on the following page.
Anthony CraneOperations Manager

Report No. : 6E1175 Cover Page 2
Please note: Where samples are collected/submitted over several days, the date on which the lastsamples were analysed or extracted is reported.Unless Ferrous Iron is determined on site, the possibility of a ferrous-ferric ratio change mayoccur.
Method Description Extracted Analysed AuthorisedE0230 TPH C6-C9 by purge and trap 12/04/06 12/04/06 GTO 094E0221F TPH (C10-C36) 13/04/06 21/04/06 GTO 095E4970 Total Metals by ICP-MS 13/04/06 13/04/06 DLU 093E4950 Mercury 12/04/06 19/04/06 DLU 093E4870 Dissolved Metals by ICP-MS 13/04/06 13/04/06 DLU 093E4850 Mercury 12/04/06 19/04/06 DLU 093E2551 NOX 12/04/06 12/04/06 DBL 101E2770 TKN 12/04/06 13/04/06 DBL 101E2330 Ammonia as N 12/04/06 12/04/06 DBL 101E2600 pH 12/04/06 12/04/06 DBL 101E2430 Conductivity 12/04/06 12/04/06 DBL 101E2640 Phosphorus-Total 12/04/06 13/04/06 DBL 101E2670 Suspended Solids 12/04/06 12/04/06 DBL 101E2790 Turbidity 12/04/06 12/04/06 DBL 101
NATA Signatories(AGR) Alison Graham, (DBL) Dianne Blane, (DLU) Darrel Luck, (GTO) Greg Towers,(MAV) Merrin Avery, (NCO) Nathan Cooper, (WME) Melanie Wade, (LSC) Lachlan Schwarz

Job Number : 6E1175 Page 1 of 4Client : WS Rooney & Associates Pty Ltd plus Cover PageReference : 0511-057Project : DRY WEATHER SEA WATER
Lab No E259075 E259076
SITE_1 SITE_2
Analyte Sample Id 11.4.06 11.4.06
PQL
E0230 TPH in Water by P&T/GC-MS (ug/L)
C6-C9 Fraction 20 nd nd
E0221 TPH in Water (ug/L)
C10-C14 Fraction 20 nd nd
C15-C28 Fraction 100 nd nd
C29-C36 Fraction 100 nd nd
PQL = Practical Quantitation Limit Soils : mg/kg (ppm) dry weight unless otherwise specifiedLNR = Samples Listed not Received Waters : mg/L (ppm) unless otherwise specified in Method Headernd = <PQL Leachates : mg/L (ppm) in leachate unless otherwise specified in-- = Not Applicable Method Header
Refer to Amdel standard laboratory qualifier codes for comments.

Job Number : 6E1175 Page 2 of 4Client : WS Rooney & Associates Pty Ltd plus Cover PageReference : 0511-057Project : DRY WEATHER SEA WATER
Lab No E259075 E259076
SITE_1 SITE_2
Analyte Sample Id 11.4.06 11.4.06
PQL
E4970 Total Recoverable Metals in Waters
Arsenic 0.005 *<0.025 *<0.025
Cobalt 0.005 *<0.025 *<0.025
Copper 0.005 *<0.025 *<0.025
Nickel 0.005 *<0.025 *<0.025
Lead 0.002 *<0.010 *<0.010
Zinc 0.010 *<0.050 *<0.050
E4950 Total Recoverable Mercury in Water
Mercury 0.001 nd nd
PQL = Practical Quantitation Limit Soils : mg/kg (ppm) dry weight unless otherwise specifiedLNR = Samples Listed not Received Waters : mg/L (ppm) unless otherwise specified in Method Headernd = <PQL Leachates : mg/L (ppm) in leachate unless otherwise specified in-- = Not Applicable Method Header
Refer to Amdel standard laboratory qualifier codes for comments.

Job Number : 6E1175 Page 3 of 4Client : WS Rooney & Associates Pty Ltd plus Cover PageReference : 0511-057Project : DRY WEATHER SEA WATER
Lab No E259075 E259076
SITE_1 SITE_2
Analyte Sample Id 11.4.06 11.4.06
PQL
E4870 Dissolved Metals in Waters
Arsenic 0.001 *<0.005 *<0.005
Cobalt 0.001 *<0.005 *<0.005
Copper 0.001 0.006 0.007
Nickel 0.001 *<0.005 *<0.005
Lead 0.001 *<0.005 *<0.005
Zinc 0.002 0.017 0.019
E4850 Dissolved Mercury in Waters
Mercury 0.001 nd nd
PQL = Practical Quantitation Limit Soils : mg/kg (ppm) dry weight unless otherwise specifiedLNR = Samples Listed not Received Waters : mg/L (ppm) unless otherwise specified in Method Headernd = <PQL Leachates : mg/L (ppm) in leachate unless otherwise specified in-- = Not Applicable Method Header
Refer to Amdel standard laboratory qualifier codes for comments.

Job Number : 6E1175 Page 4 of 4Client : WS Rooney & Associates Pty Ltd plus Cover PageReference : 0511-057Project : DRY WEATHER SEA WATER
Lab No E259075 E259076
SITE_1 SITE_2
Analyte Sample Id 11.4.06 11.4.06
PQL
E25501 Nitrate as N in Water
NOx 0.02 0.03 0.05
E2770 Kjeldahl Nitrogen in Water
Kjeldahl Nitrogen 0.1 0.5 0.9
E2330 Ammonia as N in Water
Ammonia as N 0.01 0.02 nd
E2600 pH in Water
pH 0.1 7.8 7.9
E2430 Conductivity (uS/cm at 25.0 C)
Electrical Conductivity 5 38000 36000
E2640 Total Phosphorus in Water
Phosphorus 0.02 0.14 0.22
E2670 Suspended Solids in Water
Suspended Solids 1 3 7
E2790 Turbidity in Water (NTU)
Turbidity 0.1 1.2 1.6
PQL = Practical Quantitation Limit Soils : mg/kg (ppm) dry weight unless otherwise specifiedLNR = Samples Listed not Received Waters : mg/L (ppm) unless otherwise specified in Method Headernd = <PQL Leachates : mg/L (ppm) in leachate unless otherwise specified in-- = Not Applicable Method Header
Refer to Amdel standard laboratory qualifier codes for comments.

ANALYTICAL SERVICES DIVISIONABN 30 008 127 802Correspondence to: 99 Mitchell RdPO Box 331 CARDIFF NSW 2285HUNTER REGIONAL MAIL Telephone: (02) 4902 4800CENTRE NSW 2310 Facsimile: (02) 4902 4899
CERTIFICATE OF ANALYSIS Cover Page 1Contents :1. Cover Pages (3)2. Analysis Report Pages3. QA/QC Appendix4. Additional Reports - External
(if applicable)5. Chain of Custody (if applicable)
Report No. : 6E1499
Attention : Mr Bill Rooney
Client : WS Rooney & Associates Pty Ltd: 156 Barrenjoey Rd: NEWPORTNSW 2106
Samples : 2
Reference/Order : 0511-057
Project : WET WEATHER SEAWATER
Received Samples : 15/05/06 Instructions : 15/05/06
Date Reported : 23/05/06
PLEASE SEE FOLLOWING PAGES FOR METHOD LISTING AND RESULTS
RESULTS:All samples were analysed as received. This report relates specifically to the samples as received. Results relateto the source material only to the extent that the samples as supplied are truly representative of the sample source.This report replaces any preliminary results issued. Note that for methods indicated with "#", NATA accreditationdoes not cover the performance of this service. Three significant figures (or 2 for <10PQL) are reported forstatistical purposes only. Where "Total" concentrations are reported for organic suites of compounds this is the summationof the individual compounds and the PQL is noted for reporting purposes only. This report has been authorized by theNATA signatories listed in the method descriptions section on the following page.
Anthony CraneOperations Manager

Report No. : 6E1499 Cover Page 2
Please note: Where samples are collected/submitted over several days, the date on which the lastsamples were analysed or extracted is reported.Unless Ferrous Iron is determined on site, the possibility of a ferrous-ferric ratio change mayoccur.
Method Description Extracted Analysed AuthorisedE0230 TPH C6-C9 by purge and trap 16/05/06 16/05/06 GTO 094E0221F TPH (C10-C36) 16/05/06 17/05/06 GTO 095E4870 Dissolved Metals by ICP-MS 18/05/06 18/05/06 APO 093E4850 Mercury 17/05/06 17/05/06 DLU 093E4970 Total Metals by ICP-MS 18/05/06 18/05/06 APO 093E4950 Mercury 17/05/06 17/05/06 DLU 093E2551 NOX 19/05/06 19/05/06 DBL 101E2330 Ammonia as N 22/05/06 22/05/06 DBL 101E2600 pH 16/05/06 16/05/06 DBL 101E2430 Conductivity 16/05/06 16/05/06 DBL 101E2790 Turbidity 16/05/06 16/05/06 DBL 101E2670 Suspended Solids 16/05/06 16/05/06 DBL 101E8770H TKN Analysed by NATA Lab #3626 18/05/06 19/05/06 DBL 101E8640 Phosphorus-Total Analysed by NATA Lab 18/05/06 19/05/06 DBL 101
NATA Signatories(AGR) Alison Graham, (DBL) Dianne Blane, (DLU) Darrel Luck, (GTO) Greg Towers,(MAV) Merrin Avery, (NCO) Nathan Cooper, (WME) Melanie Wade, (LSC) Lachlan Schwarz(LSC) Laura Schofield, (APO) Annette Poulton

Job Number : 6E1499 Page 1 of 3Client : WS Rooney & Associates Pty Ltd plus Cover PageReference : 0511-057Project : WET WEATHER SEAWATER
Lab No E264638 E264639
SITE_1 SITE_2
Analyte Sample Id 15.5.06 15.5.06
PQL
E0230 TPH in Water by P&T/GC-MS (ug/L)
C6-C9 Fraction 20 D n.d. D n.d.
E0221 TPH in Water (ug/L)
C10-C14 Fraction 20 nd nd
C15-C28 Fraction 100 nd nd
C29-C36 Fraction 100 nd nd
PQL = Practical Quantitation Limit Soils : mg/kg (ppm) dry weight unless otherwise specifiedLNR = Samples Listed not Received Waters : mg/L (ppm) unless otherwise specified in Method Headernd = <PQL Leachates : mg/L (ppm) in leachate unless otherwise specified in-- = Not Applicable Method Header
Refer to Amdel standard laboratory qualifier codes for comments.

Job Number : 6E1499 Page 2 of 3Client : WS Rooney & Associates Pty Ltd plus Cover PageReference : 0511-057Project : WET WEATHER SEAWATER
Lab No E264638 E264639
SITE_1 SITE_2
Analyte Sample Id 15.5.06 15.5.06
PQL
E4870 Dissolved Metals in Waters
Arsenic 0.001 0.002 0.002
Cobalt 0.001 0.002 0.002
Copper 0.001 0.002 0.002
Nickel 0.001 0.001 0.001
Lead 0.001 nd nd
Zinc 0.002 0.022 0.017
E4850 Dissolved Mercury in Waters
Mercury 0.001 nd nd
E4970 Total Recoverable Metals in Waters
Arsenic 0.005 *<0.01 *<0.01
Cobalt 0.005 *<0.025 *<0.025
Copper 0.005 *<0.025 *<0.025
Nickel 0.005 *<0.025 *<0.025
Lead 0.002 *<0.01 *<0.01
Zinc 0.010 *<0.05 *<0.05
E4950 Total Recoverable Mercury in Water
Mercury 0.001 nd nd
PQL = Practical Quantitation Limit Soils : mg/kg (ppm) dry weight unless otherwise specifiedLNR = Samples Listed not Received Waters : mg/L (ppm) unless otherwise specified in Method Headernd = <PQL Leachates : mg/L (ppm) in leachate unless otherwise specified in-- = Not Applicable Method Header
Refer to Amdel standard laboratory qualifier codes for comments.

Job Number : 6E1499 Page 3 of 3Client : WS Rooney & Associates Pty Ltd plus Cover PageReference : 0511-057Project : WET WEATHER SEAWATER
Lab No E264638 E264639
SITE_1 SITE_2
Analyte Sample Id 15.5.06 15.5.06
PQL
E2551 NOX in Water
NOx 0.02 0.05 0.11
E2330 Ammonia as N in Water
Ammonia as N 0.01 0.18 0.10
E2600 pH in Water
pH 0.1 7.9 7.9
E2430 Conductivity (uS/cm at 25.0 C)
Electrical Conductivity 5 44000 41000
E2790 Turbidity in Water (NTU)
Turbidity 0.1 0.8 1.4
E2670 Suspended Solids in Water
Suspended Solids 1 5 nd
E8770H Kjeldahl N Analysed by NATA Lab #3626
Kjeldahl Nitrogen 0.2 <0.5 <0.5
E8640H Total P Analysed by NATA Lab #3626
Phosphorus 0.05 <0.05 <0.05
PQL = Practical Quantitation Limit Soils : mg/kg (ppm) dry weight unless otherwise specifiedLNR = Samples Listed not Received Waters : mg/L (ppm) unless otherwise specified in Method Headernd = <PQL Leachates : mg/L (ppm) in leachate unless otherwise specified in-- = Not Applicable Method Header
Refer to Amdel standard laboratory qualifier codes for comments.

Appendix E Laboratory Certificates of Analysis for
AVS/SEM Analysis of Sediment Samples
J:\JOBS\43217511\TLB- DOUBLE BAY MARINA\DELIVERABLES\FINAL REPORT\FINAL REPORT R001.DOC\1-MAY-07

CERTIFICATE OF ANALYSISCERTIFICATE OF ANALYSIS 55225522Client:Client:
National Measurement InstituteNational Measurement Institute
1 Suakin St1 Suakin St
PymblePymble
NSWNSW 20732073
Attention:Attention: Geoff ThurtellGeoff Thurtell
Sample log in details:Sample log in details:
Your Reference:Your Reference: N06/016927, 016931, 016934N06/016927, 016931, 016934
No. of samples:No. of samples: 3 Sediments3 Sediments
Date samples received:Date samples received: 30/05/0630/05/06
Date completed instructions received:Date completed instructions received: 30/05/0630/05/06
Analysis Details:Analysis Details:
Please refer to the following pages for results, methodology summary and quality control data.Please refer to the following pages for results, methodology summary and quality control data.
Samples were analysed as received from the client. Results relate specifically to the samples as received.Samples were analysed as received from the client. Results relate specifically to the samples as received.
Results are reported on a dry weight basis for solids and on an as received basis for other matrices.Results are reported on a dry weight basis for solids and on an as received basis for other matrices.
Please refer to the last page of this report for any comments relating to the results.Please refer to the last page of this report for any comments relating to the results.
Report Details:Report Details:
Date results requested by:Date results requested by: 6/06/066/06/06
Date of Preliminary Report:Date of Preliminary Report: Not issuedNot issued
Issue Date:Issue Date: 9/06/069/06/06
NATA accreditation number 2901. This document shall not be reproduced except in full.NATA accreditation number 2901. This document shall not be reproduced except in full.
This document is issued in accordance with NATA's accreditation requirements.This document is issued in accordance with NATA's accreditation requirements.
Accredited for compliance with ISO/IEC 17025.Accredited for compliance with ISO/IEC 17025.
Tests not covered by NATA are denoted with *.Tests not covered by NATA are denoted with *.
Results Approved By:Results Approved By:
Page 1 of 5Page 1 of 5Envirolab Reference:Envirolab Reference: 55225522
Revision No: RRevision No: R 0000

Client Reference:Client Reference: N06/016927, 016931, 016934N06/016927, 016931, 016934
AVS/SEM
Our Reference: UNITS 5522-1 5522-2 5522-3
Your Reference ------------- N06/016927/S N06/016931/S N06/016934/S
Type of sample ------------ Sediment Sediment Sediment
Acid Volatile Sulphide µmole/g dry
weight
87 34 53
Arsenic µmole/g dry
weight
<0.05 <0.05 <0.05
Cadmium µmole/g dry
weight
0.01 <0.01 0.01
Copper µmole/g dry
weight
0.20 0.79 0.33
Lead µmole/g dry
weight
2.9 2.0 2.5
Mercury µmole/g dry
weight
<0.0005 <0.0005 <0.0005
Nickel µmole/g dry
weight
0.56 0.49 0.09
Zinc µmole/g dry
weight
9.2 14 8.3
Total SEM µmole/g dry
weight
13 17 11
SEM/AVS ratio - 0.15 0.49 0.21
Page 2 of 5Page 2 of 5Envirolab Reference:Envirolab Reference: 55225522
Revision No: RRevision No: R 0000

Client Reference:Client Reference: N06/016927, 016931, 016934N06/016927, 016931, 016934
Method ID Methodology Summary
AVS-SEM Determination of Acid Volatile Sulfide (AVS) and Simultaneously Extractable Metals (SEM) in sediment -
determined colurimetrically and ICP-OES and cold vapour-AAS.
Page 3 of 5Page 3 of 5Envirolab Reference:Envirolab Reference: 55225522
Revision No: RRevision No: R 0000

Client Reference:Client Reference: N06/016927, 016931, 016934N06/016927, 016931, 016934
QUALITY CONTROL UNITS PQL METHOD Blank Duplicate Sm# Duplicate results Spike Sm# Spike %
Recovery
AVS/SEM Base ll Duplicate ll %RPD
Acid Volatile Sulphide µmole/g
dry
weight
0.15 AVS-SEM <0.15 [NT] [NT] LCS 107%
Arsenic µmole/g
dry
weight
0.05 AVS-SEM <0.05 [NT] [NT] LCS 101%
Cadmium µmole/g
dry
weight
0.01 AVS-SEM <0.01 [NT] [NT] LCS 102%
Copper µmole/g
dry
weight
0.02 AVS-SEM <0.02 [NT] [NT] LCS 108%
Lead µmole/g
dry
weight
0.005 AVS-SEM <0.005 [NT] [NT] LCS 102%
Mercury µmole/g
dry
weight
0.0005 AVS-SEM <0.000
5
[NT] [NT] LCS 106%
Nickel µmole/g
dry
weight
0.02 AVS-SEM <0.02 [NT] [NT] LCS 105%
Zinc µmole/g
dry
weight
0.02 AVS-SEM <0.02 [NT] [NT] LCS 99%
Total SEM µmole/g
dry
weight
0.13 AVS-SEM <0.13 [NT] [NT] [NR] [NR]
SEM/AVS ratio - 0 AVS-SEM 0.0 [NT] [NT] [NR] [NR]
Page 4 of 5Page 4 of 5Envirolab Reference:Envirolab Reference: 55225522
Revision No: RRevision No: R 0000

Client Reference:Client Reference: N06/016927, 016931, 016934N06/016927, 016931, 016934
Report Comments:Report Comments:
INS: Insufficient sample for this testINS: Insufficient sample for this test NT: Not testedNT: Not tested
NR: Not requestedNR: Not requested PQL: Practical Quanitation LimitPQL: Practical Quanitation Limit
<: Less than<: Less than >: Greater than>: Greater than
NA: Test not requiredNA: Test not required
Quality Control DefinitionsQuality Control Definitions
LCS: Laboratory Control SampleLCS: Laboratory Control Sample
RPD: Relative Percent DifferenceRPD: Relative Percent Difference
Blank: This is the component of the analytical signal which is not derived from the sample but from reagents,
glassware etc, can be determined by processing solvents and reagents in exactly the same manner as for samples. glassware etc, can be determined by processing solvents and reagents in exactly the same manner as for samples.
Duplicate: This is the complete duplicate analysis of a sample from the process batch. If possible, the sample
selected should be one where the analyte concentration is easily measurable. selected should be one where the analyte concentration is easily measurable.
Matrix Spike: A portion of the sample is spiked with a known concentration of target analyte. The purpose of the matrix
spike is to monitor the performance of the analytical method used and to determine whether matrix interferences exist. spike is to monitor the performance of the analytical method used and to determine whether matrix interferences exist.
LCS (Laboratory Control Sample): This comprises either a standard reference material or a control matrix (such as a blank
sand or water) fortified with analytes representative of the analyte class. It is simply a check sample. sand or water) fortified with analytes representative of the analyte class. It is simply a check sample.
Surrogate Spike: Surrogates are known additions to each sample, blank, matrix spike and LCS in a batch, of compounds
which are similar to the analyte of interest, however are not expected to be found in real samples.which are similar to the analyte of interest, however are not expected to be found in real samples.
Laboratory Acceptance Criteria:Laboratory Acceptance Criteria:
Duplicates: <5xPQL - any RPD is acceptableDuplicates: <5xPQL - any RPD is acceptable
>5xPQL - 0-50% RPD is acceptable.>5xPQL - 0-50% RPD is acceptable.
Envirolab Reference:Envirolab Reference: 55225522
Revision No: RRevision No: R 0000

Appendix F Laboratory Certificates of Analysis for Acid Sulphate
Soil Testing for Sediment Samples
J:\JOBS\43217511\TLB- DOUBLE BAY MARINA\DELIVERABLES\FINAL REPORT\FINAL REPORT R001.DOC\1-MAY-07


Appendix G 95% UCL Calculations
J:\JOBS\43217511\TLB- DOUBLE BAY MARINA\DELIVERABLES\FINAL REPORT\FINAL REPORT R001.DOC\1-MAY-07

Sample ID Benzo(a)pyrene Lead Sample ID Benzo(a)pyre
ne Lead
SITE 2A 10 510 SITE 4A 18 88SITE 2B 20 850 SITE 4B 0.5 4.1SITE 2C 36 530 4S 4.3 1302N 2.8 600 4SA 7.6 2002NA 6.5 710 4SB 0.5 112NB 1.8 250 4N 8.5 652NC 11 940 4NA 11 1402S 1.1 54 4NB 5 592SA 6.5 4802W 12 470

Data File Variable: Benzo(a)pyrene Raw Statistics Normal Distribution Test Number of Valid Samples 10 Shapiro-Wilk Test Statisitic 0.824242Number of Unique Samples 9 Shapiro-Wilk 5% Critical Value 0.842Minimum 1.1 Data not normal at 5% significance levelMaximum 36 Mean 10.77 95% UCL (Assuming Normal Distribution)Median 8.25 Student's-t UCL 16.87384Standard Deviation 10.52965 Variance 110.8734 Gamma Distribution Test Coefficient of Variation 0.977683 A-D Test Statistic 0.205657Skewness 1.732163 A-D 5% Critical Value 0.743934 K-S Test Statistic 0.136136 Gamma Statistics K-S 5% Critical Value 0.272488k hat 1.239843 Data follow gamma distribution k star (bias corrected) 0.934557 at 5% significance level Theta hat 8.686585 Theta star 11.52418 95% UCLs (Assuming Gamma Distribution) nu hat 24.79686 Approximate Gamma UCL 20.35267nu star 18.69113 Adjusted Gamma UCL 22.87848Approx.Chi Square Value (.05) 9.890764 Adjusted Level of Significance 0.0267 Lognormal Distribution Test Adjusted Chi Square Value 8.798816 Shapiro-Wilk Test Statisitic 0.965789 Shapiro-Wilk 5% Critical Value 0.842 Log-transformed Statistics Data are lognormal at 5% significance levelMinimum of log data 0.09531 Maximum of log data 3.583519 95% UCLs (Assuming Lognormal Distribution)Mean of log data 1.922096 95% H-UCL 39.8702Standard Deviation of log data 1.081153 95% Chebyshev (MVUE) UCL 29.03157Variance of log data 1.168893 97.5% Chebyshev (MVUE) UCL 36.70142 99% Chebyshev (MVUE) UCL 51.76736
95% Non-parametric UCLs CLT UCL 16.24698 Adj-CLT UCL (Adjusted for skewness) 18.19585 Mod-t UCL (Adjusted for skewness) 17.17782 Jackknife UCL 16.87384 Standard Bootstrap UCL 15.96485 Bootstrap-t UCL 21.86405
RECOMMENDATION Hall's Bootstrap UCL 45.36476 Data follow gamma distribution (0.05) Percentile Bootstrap UCL 16.39 BCA Bootstrap UCL 17.79 Use Approximate Gamma UCL 95% Chebyshev (Mean, Sd) UCL 25.28412
97.5% Chebyshev (Mean, Sd) UCL 31.56438 99% Chebyshev (Mean, Sd) UCL 43.90076
Appendix G - 95% UCL.xlsBenzo(a)pyrene Site2

Data File Variable: Lead Raw Statistics Normal Distribution Test Number of Valid Samples 10 Shapiro-Wilk Test Statisitic 0.965775Number of Unique Samples 10 Shapiro-Wilk 5% Critical Value 0.842Minimum 54 Data are normal at 5% significance levelMaximum 940 Mean 539.4 95% UCL (Assuming Normal Distribution)Median 520 Student's-t UCL 691.3498Standard Deviation 262.1264 Variance 68710.27 Gamma Distribution Test Coefficient of Variation 0.485959 A-D Test Statistic 0.656728Skewness -0.306407 A-D 5% Critical Value 0.733383 K-S Test Statistic 0.29585 Gamma Statistics K-S 5% Critical Value 0.268931k hat 2.646075 Data follow approximate gamma distibution k star (bias corrected) 1.918919 at 5% significance level Theta hat 203.8491 Theta star 281.0958 95% UCLs (Assuming Gamma Distribution) nu hat 52.92149 Approximate Gamma UCL 821.8588nu star 38.37838 Adjusted Gamma UCL 886.7291Approx.Chi Square Value (.05) 25.18838 Adjusted Level of Significance 0.0267 Lognormal Distribution Test Adjusted Chi Square Value 23.34568 Shapiro-Wilk Test Statisitic 0.761552 Shapiro-Wilk 5% Critical Value 0.842 Log-transformed Statistics Data not lognormal at 5% significance levelMinimum of log data 3.988984 Maximum of log data 6.84588 95% UCLs (Assuming Lognormal Distribution)Mean of log data 6.089756 95% H-UCL 1323.24Standard Deviation of log data 0.824859 95% Chebyshev (MVUE) UCL 1297.018Variance of log data 0.680392 97.5% Chebyshev (MVUE) UCL 1600.951 99% Chebyshev (MVUE) UCL 2197.967
95% Non-parametric UCLs CLT UCL 675.7446 Adj-CLT UCL (Adjusted for skewness) 667.1626 Mod-t UCL (Adjusted for skewness) 690.0111 Jackknife UCL 691.3498 Standard Bootstrap UCL 667.5933 Bootstrap-t UCL 683.0971
RECOMMENDATION Hall's Bootstrap UCL 696.4851 Data are normal (0.05) Percentile Bootstrap UCL 665 BCA Bootstrap UCL 658 Use Student's-t UCL 95% Chebyshev (Mean, Sd) UCL 900.7164
97.5% Chebyshev (Mean, Sd) UCL 1057.058 99% Chebyshev (Mean, Sd) UCL 1364.162
Appendix G - 95% UCL.xlsLead Site2

Data File Variable: Benzo(a)pyrene Raw Statistics Normal Distribution Test Number of Valid Samples 8 Shapiro-Wilk Test Statisitic 0.929563Number of Unique Samples 7 Shapiro-Wilk 5% Critical Value 0.818Minimum 0.5 Data are normal at 5% significance levelMaximum 18 Mean 6.925 95% UCL (Assuming Normal Distribution)Median 6.3 Student's-t UCL 10.80901Standard Deviation 5.79846 Variance 33.62214 Gamma Distribution Test Coefficient of Variation 0.837323 A-D Test Statistic 0.424533Skewness 0.854516 A-D 5% Critical Value 0.734699 K-S Test Statistic 0.203959 Gamma Statistics K-S 5% Critical Value 0.30117k hat 1.056557 Data follow gamma distribution k star (bias corrected) 0.743681 at 5% significance level Theta hat 6.55431 Theta star 9.311785 95% UCLs (Assuming Gamma Distribution) nu hat 16.90491 Approximate Gamma UCL 15.97047nu star 11.8989 Adjusted Gamma UCL 20.12437Approx.Chi Square Value (.05) 5.159515 Adjusted Level of Significance 0.01946 Lognormal Distribution Test Adjusted Chi Square Value 4.094532 Shapiro-Wilk Test Statisitic 0.834139 Shapiro-Wilk 5% Critical Value 0.818 Log-transformed Statistics Data are lognormal at 5% significance levelMinimum of log data -0.693147 Maximum of log data 2.890372 95% UCLs (Assuming Lognormal Distribution)Mean of log data 1.39228 95% H-UCL 101.2449Standard Deviation of log data 1.361125 95% Chebyshev (MVUE) UCL 26.6114Variance of log data 1.852661 97.5% Chebyshev (MVUE) UCL 34.44331 99% Chebyshev (MVUE) UCL 49.8276
95% Non-parametric UCLs CLT UCL 10.29706 Adj-CLT UCL (Adjusted for skewness) 10.95885 Mod-t UCL (Adjusted for skewness) 10.91224 Jackknife UCL 10.80901 Standard Bootstrap UCL 10.07339 Bootstrap-t UCL 12.04533
RECOMMENDATION Hall's Bootstrap UCL 13.15254 Data are normal (0.05) Percentile Bootstrap UCL 10.325 BCA Bootstrap UCL 10.725 Use Student's-t UCL 95% Chebyshev (Mean, Sd) UCL 15.86103
97.5% Chebyshev (Mean, Sd) UCL 19.72765 99% Chebyshev (Mean, Sd) UCL 27.32289
Appendix G - 95% UCL.xlsBenzo(a)pyrene Site4

Data File Variable: Lead Raw Statistics Normal Distribution Test Number of Valid Samples 8 Shapiro-Wilk Test Statisitic 0.955288Number of Unique Samples 8 Shapiro-Wilk 5% Critical Value 0.818Minimum 4.1 Data are normal at 5% significance levelMaximum 200 Mean 87.1375 95% UCL (Assuming Normal Distribution)Median 76.5 Student's-t UCL 131.9602Standard Deviation 66.916 Variance 4477.751 Gamma Distribution Test Coefficient of Variation 0.767936 A-D Test Statistic 0.390117Skewness 0.39226 A-D 5% Critical Value 0.733885 K-S Test Statistic 0.226584 Gamma Statistics K-S 5% Critical Value 0.300876k hat 1.114086 Data follow gamma distribution k star (bias corrected) 0.779637 at 5% significance level Theta hat 78.21436 Theta star 111.7668 95% UCLs (Assuming Gamma Distribution) nu hat 17.82537 Approximate Gamma UCL 196.2064nu star 12.47419 Adjusted Gamma UCL 245.4853Approx.Chi Square Value (.05) 5.539931 Adjusted Level of Significance 0.01946 Lognormal Distribution Test Adjusted Chi Square Value 4.427841 Shapiro-Wilk Test Statisitic 0.85417 Shapiro-Wilk 5% Critical Value 0.818 Log-transformed Statistics Data are lognormal at 5% significance levelMinimum of log data 1.410987 Maximum of log data 5.298317 95% UCLs (Assuming Lognormal Distribution)Mean of log data 3.955705 95% H-UCL 1276.039Standard Deviation of log data 1.354529 95% Chebyshev (MVUE) UCL 342.0347Variance of log data 1.834748 97.5% Chebyshev (MVUE) UCL 442.5504 99% Chebyshev (MVUE) UCL 639.9942
95% Non-parametric UCLs CLT UCL 126.0521 Adj-CLT UCL (Adjusted for skewness) 129.5579 Mod-t UCL (Adjusted for skewness) 132.507 Jackknife UCL 131.9602 Standard Bootstrap UCL 123.6145 Bootstrap-t UCL 140.3815
RECOMMENDATION Hall's Bootstrap UCL 130.9315 Data are normal (0.05) Percentile Bootstrap UCL 123.125 BCA Bootstrap UCL 128.3875 Use Student's-t UCL 95% Chebyshev (Mean, Sd) UCL 190.262
97.5% Chebyshev (Mean, Sd) UCL 234.884 99% Chebyshev (Mean, Sd) UCL 322.5354
Appendix G - 95% UCL.xlsLead Site4

UPGRADING DOUBLE BAY MARINA ENVIRONMENTAL IMPACT STATEMENT
14.12 BERTH DEMAND REPORT BY AUSTRALIAN MARINA MANAGEMENT PTY LTD
TAYLOR LAUDER BERSTEN PTY LTD SUBMISSION TO WOOLLAHRA COUNCIL 10TH DECEMBER, 2007 PROJECT NO: 05027

DOUBLE BAY MARINA
SYDNEY NEW SOUTH WALES – AUSTRALIA
BERTH DEMAND
BERTH SIZE DISTRIBUTION
BRIEF COMMENTARY & OVERVIEW
Australian Marina Management Prepared for: Pty Limited TLB Engineers Pty Limited marina management consultants March 2007

Double Bay Marina Berth Demand & Size Commentary
BERTH DEMAND AND SIZE DISTRIBUTION COMMENTARY
CONTENTS Page/s Introduction 3 Existing Demand Patterns, Trends & Statistics 4 - 6 Demand Growth Pattern for Ownership of Vessels/Marina Berthing 7 - 9 Other Demand Considerations 10 Comment on Proposed Berth Size Distribution 11
2

Double Bay Marina Berth Demand & Size Commentary Introduction: In addition to commercial swing moorings, Double Bay Marina currently has 40 marina berths which cater for the berthing of vessels ranging in size from 8 metres to 15 metres. All berths are fully occupied. A “waiting list” prepared by marina management shows an additional demand for marina berthing for 30 vessels as follows: Vessel Size Number 8 m 11 9 m 3 11 m 2 12 m 3 14 m 1 15 m 7 17 m 1 21 m 2 Total 30 Initial proposals were to increase the number of marina wet berths by 24 (from 40 to 64) and also to provide one temporary berth for vessels awaiting transfer to the slipway. The amended proposal is now to increase the marina wet berths by 11 (from 40 to 51) and to retain 14 swing moorings to give a total capacity to store 65 vessels. Australian Marina Management Pty Limited has been asked by TLB Engineers to provide brief commentary on the proposed extension of Double Bay Marina with particular emphasis on the general demand in NSW for berthing of larger vessels and the suggested berth size distribution for the proposed reconfigured marina berthing to cater for current and future demand.
Aerial View of Double Bay Marina
3

Double Bay Marina Berth Demand & Size Commentary Existing Demand Patterns, Trends & Statistics: In the 22 years since 1983, as shown by the following Table A, there has been a substantial growth in boat ownership in NSW. The total overall increase is 109,266 vessels representing an average growth of 5.28% per annum over the 22 year period. Table A
NSW VESSEL REGISTRATIONS COMPARISON 1983 – 2005
VESSEL NSW % SIZE NSW % SIZE
SIZES (M) 1983 DISTRB'N 2005 DISTRIB'N 0 - 3.99 25,636 27.27 62,747 30.874 - 5.99 63,760 67.84 111,405 54.816 - 7.99 3,321 3.53 16,047 7.898 - 9.99 663 0.71 6,013 2.96
10 - 11.99 365 0.39 4,099 2.0212 - 13.99 137 0.15 1,842 0.9114 - 15.99 62 0.07 683 0.3416 - 17.99 29 0.03 228 0.1118 - 19.99 14 0.01 112 0.0520m & > 5 0.00 82 0.04TOTAL 93,992 100.00 203,258 100.00
Source: NSW Maritime Boat Registration Data 30 June 1983 & 2005
Of particular note is the considerable growth in demand for ownership of larger vessels in the size range 8m and above in length which in turn, based on Industry experience, has substantially increased the demand for modern marina berths and facilities. From Table A above it is calculated that at 30th June 1983, in NSW, there were 1,275 registered vessels of a length of 8m and above representing only 1.36% of the total NSW vessel registrations. By comparison, twenty-two years later, at 30th June 2005, registered vessels 8m and above had grown to a total of 13,059 vessels representing 6.42% of total NSW vessel registrations. Numerically, in the twenty-two years since 1983, in NSW, there has been an increase in the ownership of boats 8m in length and above, of an astounding 11,784 vessels. This equates to an average increase of 536 vessels per annum over the 22 year period or an average increase, from a base of 1,275 vessels in 1983, of an incredible 42% per annum over the 22 year period. As discussed above, vessels 8m and above represented only 1.36% of total NSW registrations in 1983 but by 2005 they represented a substantial 6.42% of the total. This clearly evidences the increasing demand for ownership of larger vessels and consequently the increasing demand by boat owners for modern marina berths and facilities.
4

Double Bay Marina Berth Demand & Size Commentary Existing Demand Patterns, Trends & Statistics (Continued): In order to consider more current or recent trends in boat ownership demand the following Table B sets out a comparison of 2003 and 2005 NSW vessel registration data.
Table B NSW VESSEL REGISTRATIONS
COMPARISON 2003 – 2005
VESSEL NSW % SIZE NSW % SIZE SIZES (M) 2003 DISTRB'N 2005 DISTRIB'N
< 3.00 7,043 3.69 5,180 2.553 - 3.99 58,645 30.69 57,567 28.324 - 4.99 68,824 36.02 73,407 36.125 - 5.99 32,039 16.77 37,998 18.696 - 7.99 13,006 6.81 16,047 7.898 - 9.99 5,476 2.86 6,013 2.96
10 – 11.99 3,657 1.91 4,099 2.0212 – 13.99 1,530 0.80 1,842 0.9114 – 15.99 556 0.29 683 0.3416 – 17.99 177 0.09 228 0.1118 – 19.99 84 0.04 112 0.0520m & > 52 0.03 82 0.04TOTAL 191,089 100.00 203,258 100.00
So
urce: NSW Maritime Boat Registration Data 30 June 2003 & 2005
From Table B above it is calculated that vessels 8m and above in length have grown numerically from 11,532 vessels in 2003 to 13,059 vessels in 2005 being an increase of 1,572 vessels in the 2-year period or an average of 786 vessels per annum. As previously stated, in the 22 year period to June 2005, the average growth in ownership of vessels 8m and above in length was 536 vessels per annum. In the 2-year 2004/2005 the growth has increased to an average of 786 vessels per annum. This strongly evidences the growing demand for vessels of a size for which the owners will also demand modern marina berthing and on-water facilities and amenities. To further evidence the continuing trend towards ownership of larger recreational vessels, from Table B above, it is calculated that, in 2003, vessels 8m and above in length (11,532) represented 6.03% of total NSW registered vessels. By 2005 there were 13,059 such vessels representing an increased 6.42% of total NSW registered vessels. Of more remarkable note, from Tables A and B, are the trends towards ownership of vessels in the larger size range of 12m and above in length, and, in particular in the ownership of vessels above 20 metres in length. These trends, with their implications for modern marina berthing facilities and amenities are now discussed.
5

Double Bay Marina Berth Demand & Size Commentary Existing Demand Patterns, Trends & Statistics (Continued) : The following Table C sets out comparisons of vessel ownership and demand by vessel size. It shows a 20-year comparison from June 1983 to June 2003 and a more recent 2-year comparison from June 2003 to June 2005. The Table shows an “average per annum” growth in vessel numbers for each size category over the periods. For vessels of each size category the Table also shows the percentage of registered vessels per size to total registered vessels in NSW.
Table C
NSW VESSEL REGISTRATIONS
VESSEL DEMAND COMPARISONS - 12M AND ABOVE
VESSEL 1983 2003 2005 SIZES REG'D % TOTAL REG'D % TOTAL AV. P/A REG'D % TOTAL AV. P/A
METRES VESSELS REG'NS VESSELS REG'NS GROWTH VESSELS REG'NS GROWTH 12-13.99 137 0.146 1,530 0.800 69 1,842 0.906 15614-15.99 62 0.066 556 0.291 25 683 0.336 6316-17.99 29 0.031 177 0.093 7 228 0.112 2618-19.99 14 0.015 84 0.044 4 112 0.055 1420M & > 5 0.005 52 0.027 3 82 0.041 15TOTAL 247 0.263 2,399 1.255 108 2,947 1.450 274
TOTAL) NSW) 93,992 191,089 4,855 203,258 6,085
REG'NS)
From the above Table it is calculated that in the 20-year period from 1983 to 2003 there was a growth of 2,152 vessels of 12m and above in size. This equates to an average increase of 108 vessels per annum. In the 2-year period from 2003 to 2005 however there has been a growth of 548 vessels or an average growth of 274 vessels per annum. This growth in obvious demand for ownership of larger vessels is almost 3 times greater than the annual average growth for the period from 1983 to 2003. The increasing trend towards ownership of larger vessels is also evidenced by the fact that in 1983 vessels above 12m in length accounted for 0.263% of total NSW registered vessels. By 2005 this had grown to 1.45% of an increased total number of registered vessels. The demand for ownership of vessels 20m and above in length in NSW is also remarkable. In the 20-year period to 2003 there has been an average annual growth in vessels of this size of 3 per annum. This has grown to 15 per annum in the 2 years to 2005 and Industry reports are that the increasing demand for marina berths to cater for such sized vessels cannot currently be met.
6

Double Bay Marina Berth Demand & Size Commentary Demand Growth Pattern for Ownership of Vessels Requiring Marina Berthing: The following Table D sets out the demand growth patterns calculated for the ownership of vessels in NSW with a length of 12m and above. The demand patterns have been calculated to show the growth from two bases, namely:-
• the two-year period of 2003 to 2005; and • the twenty two-year period of 1983 to 2005.
From these two bases, the anticipated, or future, vessel ownership has then been calculated for the years 2010, 2020 and 2030 respectively The anticipated vessel ownership for years 2010, 2020 and 2030 using the 2003 year base is considered the “Higher Level” of predictions whilst the forecasts using the earlier 1983 base is considered the “Lower Level” of anticipated vessel ownership. Table D
NSW VESSEL REGISTRATIONS
GROWTH PATTERNS AND ANTICIPATED OWNERSHIP
“HIGHER LEVEL” - FROM 2003 BASE USING 2 YEAR GROWTH PATTERN TO 2005
Vessel Vessels Vessels 2 Year Per Annum Anticipated Vessel Ownership
Size 2003 2005 Growth Growth % 2010 2020 2030 12-13.99 1,530 1,842 312 10.20% 2,622 4,183 5,74414-15.99 556 683 127 11.42% 1,000 1,635 2,27016-17.99 177 228 51 14.40% 355 610 86518-19.99 84 112 28 16.66% 182 322 46220M & > 52 82 30 28.85% 157 307 457TOTAL 2,399 2,947 548 4,316 7,057 9,798
“LOWER LEVEL” - FROM 1983 BASE USING 22 YEAR GROWTH PATTERN TO 2005
Vessel Vessels Vessels 22 Year Per Annum Anticipated Vessel Ownership Size 1983 2005 Growth Growth % 2010 2020 2030
12-13.99 137 1,842 1,705 56.57% 2,229 3,005 3,78014-15.99 62 683 621 45.53% 824 1,106 1,38916-17.99 29 228 199 31.19% 273 364 45418-19.99 14 112 98 31.82% 135 179 22420M & > 5 82 77 70.00% 100 135 170TOTAL 247 2,947 2,700 3,561 4,789 6,017
7

Double Bay Marina Berth Demand & Size Commentary Demand Growth Pattern for Ownership of Vessels Requiring Marina Berthing (Continued): Clearly as Tables C and D show, since 2003, there has been a substantial growth in the ownership of vessels in NSW in the size categories of 12m and above in length. This verifies Industry reports of high demand for marina berths for larger vessels. It also verifies Industry’s view that marinas designed and built for the demand of the 1960s and 1970s urgently require to be modernised and berth sizes reconfigured to be able to cater for the increasing demand for marina berths for the larger vessels coming on to the market today and in the future. As stated, Table D sets out the anticipated ownership of vessels of a size likely to require a marina berth and calculated at both a “higher level” and “lower level” for 2010, 2020 and 2030. Due to a variety of factors however, it is considered that the “higher level” of demand will not be able to be sustained into the longer term future. The key reason for this will be the inability of Government and/or the private sector to supply sufficient modern marina berths, facilities and amenities to meet the anticipated vessel ownership demand. Thus the “higher level” of anticipated demand for ownership of larger vessels will be dampened by the lack of facilities. Economic factors may also have the propensity at times to dampen the demand for larger vessel ownership at the “higher level” but these factors are not considered in this study. The “lower level” of anticipated ownership predictions has been based on a long 22 year period. It has also been calculated from a relatively low 1983 base. This was a time when no new marinas were in construction and when the demand for ownership of large vessels was relatively low and mainly restricted to corporate ownership. This was also a period however in which demand studies by Government and professional consultants showed that, in NSW, there was likely to be considerable latent demand for boat ownership and marina berthing. The forecasts contained in these early studies have in the main been fulfilled with the resulting high demand for marina berths generally. New marinas, and extended marinas, built since the late 1980s are fully occupied. Within that demand emerged the increasing demand for ownership of larger vessels and consequently the need for marinas to provide relevant sized facilities. The substantial actual growth in ownership of larger vessels from 2003 to 2005 clearly indicates that the “lower levels” of anticipated ownership set out in Table D are very likely to be exceeded.
8

Double Bay Marina Berth Demand & Size Commentary Demand Growth Pattern for Ownership of Vessels Requiring Marina Berthing (Continued): Considering the foregoing comments, it is therefore reasonable to assume that the likely demand for ownership of larger vessels will fall into a “medium level”. For the purpose of calculating such a “medium level” of future demand it is therefore considered that this could reasonably be the average of the “higher level” and “lower level” figures set out in the previous Table D. Accepting this methodology, the anticipated “medium level” of ownership of vessels 12m and above is shown in the following Table E. The Table also shows comparisons with actual vessels at 2005 and the “lower” and “higher” levels shown in earlier Tables.
Table E
NSW RECREATIONAL VESSELS
ANTICIPATED OWNERSHIP OF VESSELS 12M AND ABOVE IN LENGTH
Vessel Actual Anticipated - Year 2010 Anticipated - Year 2020 Anticipated - Year 2030 Size 2005 Lower Medium Higher Lower Medium Higher Lower Medium Higher
12-13.99 1,842 2,229 2,425 2,622 3,005 3,594 4,183 3,780 4,762 5,74414-15.99 683 824 912 1,000 1,106 1,370 1,635 1,389 1,830 2,27016-17.99 228 273 314 355 364 487 610 454 660 86518-19.99 112 135 159 182 179 250 322 224 343 46220M & > 82 100 129 157 135 221 307 170 314 457TOTAL 2,947 3,561 3,939 4,316 4,789 5,922 7,057 6,017 7,909 9,798 In the above Table, no allowance has been made for population changes over the periods. The forecast growth in vessel ownership has been based on the 1983, 2003 and 2005 actual levels with growth in the 1983 – 2005 and the 2003 – 2005 periods calculated and the resulting factor applied to forward calculations for the years 2010, 2020 and 2030. If the “medium level” of anticipated growth in ownership of larger vessels eventuates, the anticipated increase in demand for boat ownership, and consequently marina berths, can be expected for the following numbers and sizes of vessels:- Vessel Size 2010 2020 2030 12-13.99m 583 1,169 1,168 14-15.99m 229 458 460 16-17.99m 86 173 173 18-19.99m 47 91 93 20m & > 47 92 93 Total New Boats/Berths 992 1,983 1,987
9

Double Bay Marina Berth Demand & Size Commentary Other Demand Considerations: NSW Maritime owns and operates a marina facility in Rozelle Bay in Sydney Harbour designed to cater for superyachts and larger vessels. NSW Maritime first encouraged superyacht owners to visit Sydney for the 2000 Sydney Olympic Games and since then has helped to attract more than 100 overseas superyachts to NSW. There is considerable growth in Australia in superyacht and large vessel construction. Currently Australian shipyards are building 13 superyachts with a reported value in excess of $213 million. NSW Premier Morris Iemma and Ports & Waterways Minister Joe Tripodi, in March 2006, announced that superyacht and luxury boat builder Azzura Marine would be expanding its operations to NSW. Recently, the NSW Superyacht Industry Association has been formed including NSW Maritime, Azzura Marine and another superyacht cluster group Super Yacht Base Australia, the latter reporting that in the last 12 months some 50 vessels over 24 metres in length have visited Australia. Many of these have been transported to Australia by Dockwise Yacht Transport with three scheduled trips to Australia each year.
Vessel Transporter Loading “Super Servant 3” Discharging in Brisbane Amongst the activities of the new Association is the promotion of Sydney as a destination for local and overseas superyachts and large recreational vessels. Industry advises that the strongest demand for berthing of overseas and interstate visiting vessels in Sydney is at marinas in Sydney Harbour including the NSW Maritime’s superyacht facility. Additional demand for larger vessel berthing in Sydney Harbour is also generated by new vessel manufacturers and dealers seeking appropriate and suitable on-water locations at which to present new vessels to intending purchasers. Sunseeker Motor Yachts and Riviera are two prominent vessel manufacturers continually seeking suitable berthing spaces in Sydney Harbour at which to display the larger vessels in their fleets.
10

Double Bay Marina Berth Demand & Size Commentary Comment on Proposed Berth Size Distribution: For the proposed upgrading works at Double Bay Marina it is noted from plans that it is intended to provide the 51 berths with the following berth size distribution:- Berth Size No of Berths 8m 7 10m 2 12m 11 14.5m 16 15.5m 15 Total 51 As it is proposed to upgrade the existing marina, consideration therefore needs to be given to the existing clientele of the marina and the availability and general affordability of berths for existing clients in the reconfigured marina. Whilst the above berth size distribution has been drawn up to cater for existing berth clients, wait-list demand, and to enable berths to be affordable, it is considered that an alternative berth size distribution could be considered to cater for larger vessels if deemed appropriate to meet the future long term demand discussed earlier in this study. This study clearly demonstrates the increasing demand by the NSW community for ownership of larger recreational vessels and, as a result, the increasing demand for adequately sized modern berthing facilities and amenities. When compared with Brisbane, Gold Coast and regional Queensland and Auckland and regional New Zealand, there is a considerable lack of adequate marina berthing for larger vessels in NSW in general and in Sydney Harbour in particular. The current facility of NSW Maritime at Rozelle Bay, without expansion, will not be able to satisfy the future demand for permanent berthing of larger vessels as well as the Industry forecast increased demand for berthing of visiting superyachts and larger vessels. Any proposals to provide for larger berth spaces within the intended plans to upgrade Double Bay Marina would be appropriate and would assist to some degree in meeting current and future community demand for berthing of larger vessels in Sydney.
11

UPGRADING DOUBLE BAY MARINA ENVIRONMENTAL IMPACT STATEMENT
14.13 COASTAL PROCESSES REPORTS BY GARY BLUMBERG & ASSOCIATES
TAYLOR LAUDER BERSTEN PTY LTD SUBMISSION TO WOOLLAHRA COUNCIL 10TH DECEMBER, 2007 PROJECT NO: 05027

Principal Gary Blumberg BSc(Eng)Civil MSc(Eng) MIEAust NPER3
© Copyright The concepts and information in this document are the property of Gary Blumberg & Associates Pty Ltd. Use of this document or passing onto others or copying, in part or in full, without the written permission of Gary Blumberg & Associates, is an infringement of copyright.
�������������������������� ��������������������
Consulting Engineers ACN 085 739 322
6A Market Street East P O Box 572 mobile 0416 037 336 Naremburn 2065 Cammeray 2062 E -mail [email protected] ph 02 9460 7663 fax 02 9460 7664
gpb:gpb/05-20/lr744
21 August, 2007 Taylor Lauder Bersten P O Box 110 CAMMERAY NSW 2062 Attention: Mr Howard Bersten Dear Howard DOUBLE BAY MARINA UPGRADE ADVICE ON DESIGN DREDGING CONFIGURATION AND ITS INFLUENCE ON BEACH AND SHORELINE STABILITY We refer to your E-mail dated 25/7/07 in which you requested Gary Blumberg & Associates (GBA) to consider the matter of design dredge batter slopes as queried by NSW Maritime in their E-mail to TLB of the same date. We also note that Maritime has raised a separate but related issue regarding the effect of the dredge configuration generally on beach/shoreline stability, thus we also address this matter. A copy of Maritime’s correspondence is attached in Appendix A for completeness. Our report is set out under the following main headings: • Overview of Existing Proposal • Query on Design Dredging Configuration by NSW Maritime • Stability of Design Dredge Batters • Beach / Shoreline Response to Design Dredge Arrangement • Conclusion All reference to Relative Level (RL) in this report is given to Zero on the Fort Denison Tide Gauge (ZFDTG). RL 0.0 is approximately Lowest Astronomical Tide in Sydney Harbour and 925 mm below Australian Height Datum (AHD). AHD is approximately Mean Sea Level. All reference to dredge batter slope is given as the ratio of vertical to horizontal (v:h). We refer also to previous related advice provided to TLB for the Double Bay Marina Upgrade project. GBA lr706 dated 23/3/07 sets out our appraisal of beach stability impacts

Gary Blumberg & Associates Double Bay Marina Reference: gpb:gpb/05-20/lr744 21 August 2007
Page 2 of 11
covering beach and nearshore morphology, coastal sediment transport and beach stability, contemporary movement of beach sediments and influences of marina upgrade on beach stability. GBA lr724 dated 29/3/07 addresses stormwater impacts, in particular the effect of sedimentation at the stormwater outlets and the effect of current patterns.
1 OVERVIEW OF EXISTING DREDGING PROPOSAL
TLB have developed a dredging proposal as part of the upgrade for Double Bay Marina. Dredging would be largely contained on the western side of the existing main marina walkway, involving the removal of approximately 1.5 m of bed material at the SE corner of the precinct, gradually reducing northwards. In the immediate vicinity of the innermost berthing arm, approximately 1.0 m of bed material is to be removed. Fifty metres further from the shore under the central berths, this is reduced to less than 0.3 m. A dredge batter slope of 1:7 is proposed throughout, bounding the dredge footprint to the SW, S and E. TLB have advised that the provisional dredge quantity is approximately 4,800 m3. The proposed Dredging Plan is shown in TLB Job No 05027 Dwg No DA 09, included in Figure 1.
2 QUERY ON DESIGN DREDGING CONFIGURATION BY NSW MARITIME
Refer Appendix A.
2.1 Stable Batters
NSW Maritime is concerned that “the proposed batter slopes of 1:7 may not be sustainable given the very soft, silty nature of the sediments, and especially because the existing natural seabed slopes at the southern end of the proposed dredge area are about 1:25”. According to Maritime, “the implication is that at low tide, local sea may rework the batter slopes to a flatter form, thereby causing the top of the batter to move towards the seawall. The outcome may then be a lowering of the beach level close to the site.”
2.2 Dredging Configuration and Influence on Beach Shoreline Response
Maritime also states that the dredging configuration (basin and batters) “is likely to turn waves a little more easterly on the western side and a little more westerly on the eastern side of the slipway. This would cause the beach to become a little narrower near the slipway.” In concluding, Maritime states that “the form of any changes (to beach levels) would also be affected by the change in marina layout and indeed, the actual spatial changes in wave heights and siltation rate.”
2.3 Summary
Maritime’s concerns may be summarised under the following headings, addressed separately in this report:

Gary Blumberg & Associates Double Bay Marina Reference: gpb:gpb/05-20/lr744 21 August 2007
Page 3 of 11
• Stability of design dredge batters • Beach / shoreline response to design dredge arrangement
3 STABILITY OF DESIGN DREDGE BATTERS
The stability of dredge batters would depend on the type of bed material and the exposure of the site to waves and currents.
3.1 Guidance from Local Literature
The NSW Canal Subdivisions Guidelines (PWD, 1992) provide typical ranges of stable underwater dredge batters for different types of material, reproduced below in Table 1.
Table 1 Typical Stable Underwater Batters for Different Types of Bed Material
Material Type Stable Underwater Batter
Stiff clay 1:1.5 Firm sand 1:2 to 1:4.5 Sandy clay 1:4 to 1:7 Coarse sand 1:3 to 1:6 Fine sand 1:5 to 1:10 Mud 1:8 to 1:50
Source PWD (1992) While wave and current exposure is not linked with the stable batter slopes for canal subdivisions, one could expect that they would be low and comparable to those encountered within a protected marina precinct. Thus the material type alone as listed in Table 1 should provide guidance for any marina, including Double Bay Marina.
3.2 Bed Material Type for Dredging at Double Bay Marina
Four bed sediment cores ranging in length between 400 and 900 mm were extracted from separate locations in the dredge area by WS Rooney & Associates in March 2006. Grain size analyses were performed on selected core segments by Australian Soil Testing (AST) Pty Ltd. The bed material ranged from a sandy clay (69% mud) at the surface in the NE corner of the dredge area, to a gravelly sand (7-11% mud) 340 – 900 mm below the surface in the W and S areas. The coring locations are shown in Figure 1. Sediment grain size grading curves are presented in Appendix B of URS (2007). A summary of the grain size results are presented below in Table 2. The sediment comprising the proposed dredge batters might best be described as a clayey sand along the eastern batter, grading to a gravelly sand along the southern and western batters.

Gary Blumberg & Associates Double Bay Marina Reference: gpb:gpb/05-20/lr744 21 August 2007
Page 4 of 11
Table 2 Summary of Grain Size Results for Bed Sediments, Double Bay Marina
Coring Location Samples
Sample Distance
below Bed (mm)
Sample Description
D50 (mm)
% Mud
SS1 1a 0-400 Sandy clay <0.063 69 SS2 2a 0-400 Clayey sand 0.26 21 2b 400-700 Clayey sand 0.17 39 SS3 3a 0-150 Sand 0.27 8 3b 350-900 Gravelly sand 0.30 11 SS4 4a 0-150 Sand 0.24 12 4b 400-800 Gravelly sand 0.33 7
Source AST (2006)
3.3 Assessment for Stable Batter Slopes
On the basis of PWD (1992) (Section 3.1) and the bed sediment materials determined from the cores (Section 3.2), it would seem reasonable to nominate stable batter slopes for the proposed dredging as ranging between say 1:8 to 1:10 along the eastern batter, steepening to between say 1:5 and 1:7 along the southern and western batters. The suitability of these batter slopes are further considered/refined in the light of dredge batters accepted elsewhere in NSW, and also having regard to historical hydrographic surveys in the vicinity of Double Bay Marina.
Dredge Batter Slopes adopted Elsewhere in NSW
GBA has information on past dredging projects at other NSW estuary sites. While most of these projects have occurred over clean sand beds, some have involved beds with a proportion of muds not dissimilar to that encountered at Double Bay. A brief overview of those projects which involve the latter is given below.
Shell Cove, Sydney Harbour
A small craft mooring facility was constructed along the waterfront at 33A and B Shell Cove Road, Shell Cove in 1992. The work included the dredging of approximately 730 m3 of in-situ material comprising a mixture of silty sand (375 m3) and underlying rock. The design dredge batter for the silty sand overburden was set at 1:4.

Gary Blumberg & Associates Double Bay Marina Reference: gpb:gpb/05-20/lr744 21 August 2007
Page 5 of 11
Parramatta River (upstream of Silverwater Bridge)
The Parramatta River upstream of Silverwater Bridge was dredged between 1992 and 1993 to facilitate the passage of Rivercat ferries up to Parramatta. Dredging involved the removal of approximately one metre of material over a 25 m wide channel. The design dredge level was RL-1.8 with batter slopes of 1:3. While rock excavation formed part of the dredging, we understand that a significant proportion involved the removal of unconsolidated bed materials, the details of which we are unaware.
Port of Newcastle
The Newcastle Port Corporation (NPC) accepts a maximum unprotected submerged dredge batter slope of 1:5 for its port dredging works, based on past experience (GHD, 2003). In their assessment of the mobility of dredge spoil for NPC in 1989, Patterson Britton & Partners (PBP) found that 30 - 70% of surface sediments in the Port of Newcastle comprise clays and fine silts. Based on 21 samples PBP collected in the Port, the median grain size of all material, including the sand fraction, was 0.001 to 0.05 mm (as reported in GHD, 2003).
Sylvania Waters Canal Estate, Lower Georges River
Maintenance dredging of the Sylvania Waters Canal Estate in the Lower Georges River was completed in the late 1990’s. Some 25,000 m3 of material was removed to a level of RL-2.1 with sloped underwater batters of 1:5. The material which was removed had an average mud content of 30%. We note from the above that adopted and approved design dredge batters in bed materials (including exposed dredge substrates) which are comparable to, and in some instances finer than, that which would comprise the dredge batters at Double Bay Marina, have slopes which are consistently steeper than 1:7. We are not aware of batter stability issues that may have ensued in respect of any of these projects.
Historical Hydrographic Surveys in vicinity of Double Bay Marina
NSW Maritime have pointed to the existing natural slopes in Double Bay as being considerably flatter than the proposed batter slopes of 1:7, suggesting that the dredge batters may rework to attain the natural flatter slopes, possibly impacting on beach and shoreline stability, and also adjoining seagrass beds. To investigate this matter, GBA has reviewed eight hydrographic surveys provided by TLB (1973 - 2007) which cover the SE corner at Double Bay Marina. Most of these surveys are localised to the corner, mainly tracking the buildup of sediments at the outlets of the two large stormwater drains (refer GBA lr724 dated 29/3/07). The survey dates are: • March 1973 • January 1975 • September 1985 • May 1989 • March 1992

Gary Blumberg & Associates Double Bay Marina Reference: gpb:gpb/05-20/lr744 21 August 2007
Page 6 of 11
• September 1994 • January 2006 • April 2007 Two cross-sections cutting through the southern and eastern batters of the proposed dredging have been developed (refer Figure 1). Cross-section A-A cuts the southern end of the eastern batter. It crosses a zone of overlap of historical bed surveys. It is located close to the shoreline between the marina slipway and the main corner stormwater outlet. This shoreline is identified by NSW Maritime as potentially sensitive, presumably in that it is protected by seawalls, the stability of which may be affected by sand levels at the toe of the walls. If these walls are founded directly on rock, this would not be an issue. The seawall foundation details are not known. Cross-section B-B cuts the southern batter at right angles to the main beach. It is of interest in that it passes through the area of dredging at its closest point to the beach.
Cross Section A-A
Cross-section A-A is approximately 40 m from the southern seawall shoreline. Bed levels at this cross-section range between RL+0.2 down to RL -1.9. The historical record of bed changes is only available on the eastern side of the marina walkway. Here we observe existing (2006) maximum bed slopes up to 1:7.7. It seems that a steeper maximum slopes existed in 1973 (1:5 max), 1985 (1:5 max) and 1989 (1:6 max), and flatter maximum slopes in 1975 (1:8 max), 1992 (1:10 max) and 1994 (1:17 max). We know that this area was dredged in about 1983 and the progressive subsequent slopes would reflect a post-dredge adjustment. Thus we do see a progressive flattening from 1985, through 1989, 1992 and 1994, but then a relatively large influx of material and a steepening at the next survey in 2006. We would expect the recent deposit to comprise predominantly sand from the stormwater feed. Given the above, it would be our opinion that the proposed 1:7 dredge slopes in this vicinity the SE corner are reasonable. Nevertheless, we are mindful of the 39% mud encountered at depth at Core SS2, increasing to 69% at the surface at Core SS1. On that basis alone, we would recommend that TLB consider flattening the eastern batter to 1:10.
Cross Section B-B
Cross-section B-B is located 24.5 m west of and parallel to the centreline of the existing marina walkway. The historical surveys do not extend to the western side of the walkway and its only the 2006 bed profile that is available. The existing maximum bed slope is 1:7.4 through the intertidal zone at the beach. This flattens to less than 1:50 at approximately RL 0 some 10 and 20 m from the Mean Water Line, then steepens again to about 1:15 and flattens further offshore. The material to be dredged at Section B-B, particularly that close to the inshore batter, is sand and gravelly sand. Mud percentages range between 8 and 11%.

Gary Blumberg & Associates Double Bay Marina Reference: gpb:gpb/05-20/lr744 21 August 2007
Page 7 of 11
Having regard to the typical stable underwater batters presented in Table 1 and dredge batter slopes adopted in comparable bed materials and exposure conditions, it would be our opinion that the proposed 1:7 batter slope is quite suitable.
Concluding Remarks
Dredging activity by its very nature must involve a steepening of the natural bed slope. Lowering of the bed cannot be achieved without steepened batters at the edge of the dredging. These steepened slopes will flatten over time. The flattening process will be either by a reshaping of the slope because it is intrinsically unstable as a consequence of its material composition and its exposure to waves and currents, or by deposition and reworking of finer material over the top of the slope. The natural bed slopes at the southern periphery of the proposed dredging vary between approximately 1:7 and 1:50. Steeper slopes have existed in the SE corner as a consequence of past dredging work, however, in the main, these have subsequently flattened over time. It is clear from the profile progression shown in Section A-A in Figure 1 that the flattening process has not resulted in a retreat of the profile crest (which would point to a slope instability), but rather the building up and out of the profile indicative of the deposition of finer material. GBA has previously estimated peak infilling rates in the nearshore SE corner of the marina at 70 mm/yr, reducing to a typical rate of 20 mm/yr over 95% of the dredge area. The infill material would be silts and muds (GBA lr 724, 29/3/07). Having regard to all the available information, it would be our opinion that the proposed 1:7 batter is appropriate for the southern and western edge of the dredging, but that TLB give consideration to flattening the eastern batter from 1:7 to 1:10.
4 BEACH / SHORELINE RESPONSE TO DESIGN DREDGE ARRANGEMENT
NSW Maritime have suggested that the dredging configuration (basin and batters) is likely to lead to wave refraction that would cause the beach to become a little narrower near the slipway. This may be a concern in relation to the stability of the private seawalls that join the slipway to the stormwater outlet at the SE corner. GBA has previously appraised the matter of beach impacts for TLB (refer GBA letter lr706 dated 23/3/07). Our conclusion was that the net influence of the dredging on beach stability would be small and acceptable. We further consider this matter here to address Maritime’s specific query in regard to beach stability in the vicinity of the slipway. Our deliberation is summarised in Figure 2 which presents a conceptual model of wave influence on shoreline sediment mobility. This model is described and discussed below. GBA has previously advised TLB on the ambient wave climate at the site (Howard Bersten pers comm 20/1/06). This was reported in the Outline of the Proposed Works (TLB 2006). The wave climate comprises wind waves from the NNE through NNW and boat waves incident from the main harbour channels and western Double Bay. Ocean swell penetration to the site is insignificant.

Gary Blumberg & Associates Double Bay Marina Reference: gpb:gpb/05-20/lr744 21 August 2007
Page 8 of 11
The upgraded marina with its larger number of berthed vessels and outer floating breakwater will increase wave protection to the marina zone and leeward beaches and shorelines. The slight “wave shadow” within the marina precinct may be contrasted to the waterway area immediately west of the marina which will continue to experience the same wave climate. This differential in wave climate could be expected to set up a slight current from W to E. This is due to what is called “radiation stress” modification. The W to E current would not be sufficient in itself to erode the bed, however it could influence the mobility of any suspended material thereby increasing the propensity for W to E longshore transport. This is the same process that leads to beach building in the lee of a detached offshore breakwater (CERC, 1984). At the same time, the dredging configuration will lead to a slight deviation of the predominant NNE through NNW wave fronts as they pass across the dredge zone and over the submerged inshore southern and western dredge batters. (This is eluded to in Maritime’s E-mail). It is likely that this effect would be limited to long wave activity from fast ferries and significant wind wave events. This deviation of the wave energy direction, which is a consequence of wave refraction, will modify the existing longshore sediment transport flux introducing a slight E to W bias. Thus we encounter a directional balancing of the changes to longshore sediment transport potential: the W to E influence is offset by the E to W influence. These effects will be localised to the beach area immediately inshore of the marina, extending say 50 to 75 m west of the marina jetty. Double Bay already enjoys good drying beach widths immediately west of the marina jetty, and it is our contention that these will continue and the proposal will not have a significant effect on beach shape. It is also our assessment that the concrete slipway is not bypassed by shoreline sediments. This slipway protrudes 14 m from the seawall acting as a groyne and compartmentalising the upper beach face sediments on its eastern side. Finally, we note that the inshore bed levels along the seawall between the slipway and the corner stormwater drain have been relatively stable over the past 30 years. The 1973, 1985, 1989, 2006 and 2007 surveys which extend to this shore margin show a beach/ bed level fluctuation of up to 300 to 400 mm near the slipway and a similar fluctuation near the stormwater outlet. Midway along this section of seawall, the bed level changes have been less than 250 mm. It is of interest to note that the c.1983 dredging (as recorded by the 1973 and 1985 surveys) did not lead to a reduction in bed level at this seawall. If anything, we observe a small bed level increase of between 200 and 300 mm.
5 CONCLUSION
GBA has considered the matters raised by NSW Maritime in their E-mail to TLB dated 25/7/07. Having regard to guidance from NSW literature, the available hydrographic survey record, and the textural information on the sediments to be dredged (and exposed at the dredge interface), it is GBA’s opinion that the proposed 1:7 dredge batter is appropriate for the

Gary Blumberg & Associates Double Bay Marina Reference: gpb:gpb/05-20/lr744 21 August 2007
Page 9 of 11
southern and western batters, but that a flattening of the batter at the eastern edge from 1:7 to 1:10 should be considered. While we agree with Maritime’s statement regarding the effect that changes in marina layout, and spatial changes in wave heights and siltation rate, upon a closer consideration of the influence of the marina upgrade and dredging on the wave climate inside the marina and its effect on shoreline sediment mobility, it remains our opinion that the beach and shoreline response to the proposed dredging configuration would be small and acceptable.
6 REFERENCES
Australian Soil Testing (2006) Double Bay Marina Particle Size Distribution Test Reports For WS Rooney and Associates, 6/4/06 CERC (1984) Shore Protection Manual US Army Corps of Engineers, Vicksberg USA GHD (2003) Proposed Extension of Shipping Channels, Port of Newcastle Environmental Impact Statement Prepared for Newcastle Port Corporation and NSW Waterways, November 2003 URS (2007) Upgrading Double Bay Marina, Castra Place, Double Bay Assessment of Sediment Contamination and Waste Classification For TLB Engineers, Report 43217511, 1/5/07 PWD (1992) Canal Subdivisions Conditions and Guidelines Report No 91021, July 1992 TLB (2006) Outline of Proposed Works Upgrading Double Bay Marina, Castra Place, Double Bay Project No 05027, Draft Issue 1, 28/3/06

Gary Blumberg & Associates Double Bay Marina Reference: gpb:gpb/05-20/lr744 21 August 2007
Page 10 of 11
We trust that the above meets your immediate requirements in this matter. Should you need any further information or clarification, please do not hesitate to contact the undesigned. Yours faithfully GARY BLUMBERG & ASSOCIATES
G P Blumberg Principal


Gary Blumberg & Associates Double Bay Marina Reference: gpb:gpb/05-20/lr744 21 August 2007
Page 11 of 11
APPENDIX A
E-MAIL FROM NSW MARITIME 25/7/07

Gary Blumberg
From: Howard Bersten [[email protected]]
Sent: Wednesday, 25 July 2007 3:15 PM
To: Frettingham, Ruth L.
Cc: Gary Blumberg
Subject: RE: Double bay Marina TLB ref: 05027
Page 1 of 2
17/08/2007
Ruth, We have asked Gary Blumberg and Associates to consider the batters specified. as you can see this email is forwarded to him. He will also consider the comments below. Howard
Excellence in structural, civil and maritime solutions
Howard Bersten Director
514 Miller Street (PO Box 110) Cammeray NSW 2062 t: 02 9409 3300 f: 02 9929 6667 m: 0412 618 220 This email and any attachments are intended for the named recipients only. It may contain confidential or privileged information. If you are not the intended recipient please notify
the sender and delete the email immediately. Whilst care is taken, including virus scanning software, TLB Engineers shall not be held liable for any incidental or consequential damages arising out of the use of this email and its attachments. The recipient is responsible for verifying the accuracy and completeness of any data contained in this email and its
attachments.
����������������� ��������������������������������������������
������������������ �����!!"�#�!"�$%����&�����'�������
��� ����(��)���)��%����
Dear Howard Further to our meeting of the 11 July 2007 could you please consider and comment on the following identified issue and address where necessary : Proposed dredging The drawings indicate that batter slopes are proposed to be at 1V:7H. Given the very soft, silty nature of those sediments, this slope may not be sustainable, especially because the existing ‘natural’ seabed slopes at the southern end of the proposed dredged area, Figure DA09, show slopes about 1V:25H. The implication is that at low tide, local sea may rework the batter slopes to a flatter form, thereby causing the top of the batter to move south towards the seawall. The outcome may then be a lowering of the beach level close to the site. . . Additionally, the slope of the dredged basin is likely to turn waves a little more easterly (coming from) on the western side and a little more westerly (coming from) on the eastern side of the slipway . . . This process would cause the beach to become a little narrower near the slipway. The form of any changes would be affected also by the change in marina layout and indeed, the actual spatial changes in wave heights . . . [and] siltation rate.

Seagrass issues The risk at the south-western seagrass patch, is that possibility that the dredged batters may slump and partially upset some seagrass. The distance between the top of batter and the seagrass patch is about 7.5m. Thus, if the batters were to slump from 1V:7H to about 1V:15H, there would be some damage to the seagrass. Thanks
������������� Senior Environmental Planner Property Planning Branch Maritime Property Division NSW Maritime Authority Locked Bag 5100 Camperdown NSW 1450 Phone 9364 2550 Fax 9364 2444
CONFIDENTIALITY NOTICE: This message transmission (including any accompanying documents) may contain information which is confidential and or privileged. As a result if you are not the intended recipient, any dissemination, copying or action taken in reliance on the contents of the message is strictly prohibited. If you have received this message in error you are requested to notify the sender and delete the message.
Views expressed in this message are those of the sender rather than NSW Maritime unless the content of the message indicates to the contrary.
Page 2 of 2
17/08/2007

Principal Gary Blumberg BSc(Eng)Civil MSc(Eng) MIEAust NPER3
© Copyright The concepts and information in this document are the property of Gary Blumberg & Associates Pty Ltd. Use of this document or passing onto others or copying, in part or in full, without the written permission of Gary Blumberg & Associates, is an infringement of copyright.
�������������������������� ��������������������
Consulting Engineers ACN 085 739 322
6A Market Street East P O Box 572 mobile 0416 037 336 Naremburn 2065 Cammeray 2062 E -mail [email protected] ph 02 9460 7663 fax 02 9460 7664
gpb:gpb/05-20/lr724
29 March, 2007 Taylor Lauder Bersten P O Box 110 CAMMERAY NSW 2062 Attention: Mr Howard Bersten Dear Howard DOUBLE BAY MARINA UPGRADE STORMWATER IMPACTS In their letter to the Department of Planning dated 22/11/06, NSW Maritime has requested that the environmental assessment includes information on the effect of the proposal on the existing stormwater drainage into Double Bay (Item 8). Two potential effects warrant consideration: • effect on sedimentation at stormwater outlets; • effect on current patterns. Two major stormwater channels discharge into the SE corner of Double Bay, immediately east of the marina precinct (Figure 1). These outlets would dominate the influence of stormwater behaviour on the marina, and consideration of any other smaller outlets is not required.
1 SEDIMENTATION
It is clear from existing historical hydrographic surveys that water depth has progressively reduced in the area between the two stormwater outlets and the existing marina. Surveys dated 3/73, 1/75, 9/85, 5/89, 3/92, 9/94 and 1/06 show (Figures 1 and 2): - progressive reductions in water depth over the full range of surveyed levels from RL 0 to
RL-2 and lower (metres to ZFDTG);
- between 1973 and 1975, sediment infill rates in the order of 150 to 200 mm/yr were encountered across the full waterway area east of the marina (Figure 2). We note that Sydney experienced above average rainfall between about 1971 through 1978 (Figure 3)

Gary Blumberg & Associates Double Bay Marina Reference: gpb:gpb/05-20/lr724 29 March 2007
Page 2 of 4
when stormwater sedimentation is also likely to have been above average;
- we understand that dredging took place in the general vicinity in 1983 – this is clearly evident from the survey history, in particular the 1975 and 1985 surveys which indicate a general bed lowering here in the order of 1.0 to 2.0 m;
- between 1985 and 1992/1994, progressive infilling continued, with infill rates highest at around 100 to 125 mm/yr close to the Sherbrooke Ave (corner) stormwater outlet, reducing with distance into the waterway (~80 mm/yr 100 m from the corner outlet). We note that between about 1984 and 1994 Sydney again experienced above average rainfall (Figure 2 and 3);
- we then observe a reduction in infilling rates from about 1992/94. This we attribute to three factors: (a) Rainfall reduces – in 1990’s Sydney experienced average to below average
rainfall. In the last 6 or 7 years, this rainfall has reduced even further (Figure 3).
(b) Sediment controls would have continued to improve in the stormwater catchment(s). We would expect that sediment controls in the last 10 years would have been significantly better that say in the early 1970’s when Double Bay is shown to have experienced particularly high sedimentation (Figure 2).
(c) All else being equal, infilling rates following a dredging campaign would be highest immediately after the dredging, and then reduce as the infilling re-establishes and water depth reduces. This is because the reduction in flow area (across the top of the accreting bed) would lead to higher localised velocities, so the propensity for deposition would reduce and erosion increase. The process is therefore one which is self-limiting – the infilling reduces and approaches an equilibrium under which the rate of deposition is balanced by the rate of scour.
- finally, since 1994, infill rates have reduced to ~ 10 to 20 mm/yr throughout the area between the outlets and the marina with the upper bound rates now encountered further out into the bay (Figure 2).
TLB has advised that dredging for the proposed marina would be largely contained on the western side of the main walkway, amounting to removal of approximately 1.5 m of bed material at the SE corner of the precinct, gradually reducing northwards. In the immediate vicinity of the innermost berthing arm, some 1.0 m of bed depth is to be removed. Fifty metres further from the shore under the central berths, this is reduced to less than 0.3 m. We understand from TLB that the provisional dredge quantity is approximately 4,800 m3. Based on our assessment of infilling over the last 30 years in the area immediately east of the existing marina (described above), it is our contention that infilling in the period immediately following the proposed dredging would, as a conservative prediction, tend to mimic the previous post-dredge behaviour observed from the mid-1980’s. We suggest “conservative” since the 1985 to 1992/94 record would overestimate a typical prediction for today (2007 onwards) in that Sydney’s rainfall was relatively high over this period and also catchment sediment controls are nowadays much improved.

Gary Blumberg & Associates Double Bay Marina Reference: gpb:gpb/05-20/lr724 29 March 2007
Page 3 of 4
Thus our estimate of infilling into the newly dredged marina would be as follows:
Maximum infilling in the nearshore SE corner of the marina 70 mm/yr
Typical infilling (covering over 95% of the dredge area) � 20 mm/yr
These infill rates may be used to develop indicative predictions for maintenance dredging requirements for the upgraded Double Bay marina.
2 CURRENT PATTERNS
The question arises as to whether the discharge jets from the major stormwater outlets could potentially disrupt berthing activities in the marina. To investigate this, GBA has applied submerged jet theory after Albertson to characterise dissipative current patterns with distance away from the outlet. For the extreme case of the corner outlet flowing full at a velocity of say 4 m/s (typical peak flow for a low-gradient open channel) with assumed flow area 10 m2 (modelled as a concentrated discharge just below the water surface), we estimate the following peak current speeds with distance away from the outlet:
Distance from the outlet Peak current
speed (m/s)
0 m 4.0 m/s
30 m 1.3 m/s
60 m 0.7 m/s
90 m 0.4 m/s
Along the alignment of the exit jet, the marina is over 100 m from the main corner stormwater outlet (Figure 1). It follows that peak currents induced by an extreme stormwater event should not exceed say 0.4 m/s at the main marina walkway, with lesser speeds encountered at the berths themselves. This assessment conservatively disregards the replacement of the existing suspended walkway with a floating walkway which would penetrate the water surface, further reducing transfer of currents into the facility. In relation to the loading of the exit jet on the marina structure, it would be important as part of the detailed design to make an assessment of design current loads and apply these to the floating marina arrangement. Stormwater induced currents are likely to be the dominant mechanism for transporting stormwater derived sediments into the marina precinct.

Gary Blumberg & Associates Double Bay Marina Reference: gpb:gpb/05-20/lr724 29 March 2007
Page 4 of 4
3 CONCLUSION
Two potential effects of the proposal on the existing stormwater drainage into Double Bay have been considered – sedimentation and current patterns. The two large stormwater outlets in the SE corner of the bay control the stormwater influence. The major outlets have led to considerable sedimentation east of the marina, probably extending into the facility. A comparison of the historical hydrosurveys spanning the recent 1983 dredging of this area permits an understanding of contemporary sedimentation behaviour, as well as likely future sedimentation behaviour following the dredging for the marina upgrade. It is estimated that typical infilling rates across the proposed dredge footprint of the upgraded facility would not exceed 20 mm/yr, although higher localised pockets of infilling are likely in the SE corner. The discharge jets from the major stormwater outlets will entrain ambient water and slow. A peak surface current speed estimated 0.4 m/s attributed to the outlets is predicted at the eastern edge of the upgraded marina precinct. Conventional berthing arrangements would be expected to withstand currents of this magnitude.
4 REFERENCES
Albertson ML (1948) Diffusion of Submerged Jets Proc ASCE Transactions, Paper No 2409 We trust that the above meets your immediate requirements in this matter. Should you need any further information or clarification, please do not hesitate to contact the undesigned. Yours faithfully GARY BLUMBERG & ASSOCIATES
G P Blumberg Principal


Principal Gary Blumberg BSc(Eng)Civil MSc(Eng) MIEAust NPER3
© Copyright The concepts and information in this document are the property of Gary Blumberg & Associates Pty Ltd. Use of this document or passing onto others or copying, in part or in full, without the written permission of Gary Blumberg & Associates, is an infringement of copyright.
�������������������������� ��������������������
Consulting Engineers ACN 085 739 322
6A Market Street East P O Box 572 mobile 0416 037 336 Naremburn 2065 Cammeray 2062 E -mail [email protected] ph 02 9460 7663 fax 02 9460 7664
gpb:gpb/05-20/lr706
23 March, 2007 Taylor Lauder Bersten P O Box 110 CAMMERAY NSW 2062 Attention: Mr Howard Bersten Dear Howard DOUBLE BAY MARINA UPGRADE APPRAISAL OF BEACH IMPACTS Further to our recent discussions, TLB has requested that GBA make an appraisal of the potential impacts of the proposed marina upgrade on the beaches in Double Bay. Our advice in this matter is set out below under the following main headings: • Beach and Nearshore Morphology of Double Bay • Coastal Sediment Transport and Beach Stability: Theoretical Aspects • Contemporary Movement of Beach Sediments in Double Bay • Influence of Marina Upgrade on Beach Stability In preparing this advice, Mr Gary Blumberg made an inspection of the shoreline in west Double Bay between 4.30 m and 5.00 pm on 11 December 2006. Weather during the inspection was fine, wind was moderate from the NE, and predicted tide was approx RL 0 m AHD, and falling. Selected photos taken during the inspection are attached.
1 BEACH AND NEARSHORE MORPHOLOGY OF DOUBLE BAY
Sydney Harbour is a “drowned river valley” formed within the last 10,000 years (Chapman et al, 1982). Dendritic valley patterns and rocky shorelines characterise such drowned valley systems. There is a relatively shallow tidal delta (5 to 10 m from Grotto Point to Middle Head and on to Camp Cove), a deep mud basin (up to 20 m in vicinity of Harbour Bridge), and an estuarine channel. Less extensive marine deposits often occur in nearshore and barrier beach environments, with tidal flat deposits exhibited in shallow tributary valleys. Double Bay exhibits a combination of these features.

Gary Blumberg & Associates Double Bay Marina Reference: gpb:gpb/05-20/lr706 23 March 2007
Page 2 of 8
Rose Bay, and to a lesser extent Double Bay, exhibit a relatively large accumulation of nearshore sediments. While this may be attributed to deposition from tributary creeks and major stormwater outlets, we would not expect these to be a major sources. Rather, we would expect the beach and nearshore shallows in these bays to largely comprise reworked marine sand. Along the NSW coast, shoreline sediments of marine origin are quite different to stormwater derived sediments. They are older (at least 10,000 years old) and usually well sorted due to winnowing by wave and tidal action. Medium to fine sand sized grains predominate and silica content is high. Iron staining and shell are also common. Stormwater derived sediments are significantly younger, more angulated, and often containing darker coloured grains of lithic minerals. The sandy fringing beaches in Double Bay would mostly comprise sediments of marine origin. Sydney Harbour exhibits a relatively wide and exposed entrance to the ocean. Ocean swell penetration usually influences morphology and sediment distribution for some distance from the entrance of drowned valleys (typically up to 5 km). We would expect Double Bay to be close to the upstream limit of influence of swell penetration during ocean storms.
2 COASTAL SEDIMENT TRANSPORT AND BEACH STABILITY: THEORETICAL ASPECTS
The contemporary stability of the sandy beaches in Double Bay maybe considered in terms of onshore-offshore sand movements, and longshore sand movements. Onshore-offshore transport relates to the capacity of larger than normal waves (storm waves) to erode a beach profile, relocating the sediments away from the shoreline and depositing these near the wave break zone. Following the storm, the bar sediments are then reworked onshore under normal wave action to re-establish the beach. The onshore re-establishment may take considerably longer in estuarine situations compared to the open coast. Longshore transport relates to the capacity of waves (aided by longshore currents) to move sediments along the shoreline. This will not occur when the incident wave crests are at right angles to the shoreline. The potential for longshore sand movement is commonly related to the longshore wave energy flux (PL). PL is sensitive to inshore wave height and wave obliquity to the shoreline. For example, if the height of oblique waves at the shoreline doubles, then the longshore transport potential will increase about 6 times. Equally, a 5 to 10 degree increase in obliquity will cause the longshore transport potential to approximately double (CERC, 1984). In the long term, beaches are stable; they are in “regime” with the forcing processes. A change in the incident wave climate may lead to a change in the transport behaviour at a beach, but the beach adjustment in turn serves to reduce the capacity of the modified waves to continue to influence the beach. So eventually the beach regains its equilibrium. The timeframe to attain regime will vary widely depending on the size of the system, sediment supply factors and so on.

Gary Blumberg & Associates Double Bay Marina Reference: gpb:gpb/05-20/lr706 23 March 2007
Page 3 of 8
3 CONTEMPORARY MOVEMENT OF BEACH SEDIMENTS IN DOUBLE BAY
Double Bay exhibits variable drying beach widths, ranging from 30 m in eastern Double Bay to zero along most of the Double Bay Seawall in western Double Bay. In the vicinity of Double Bay Marina, mid-tide drying beach widths up to 15 m are encountered immediately west of the marina office, progressively reducing westward to Beach Street some 150 m away (Photo 1). Drying beaches are largely absent between the marina and the rocky eastern shoreline of the bay (Photo 5). The large stormwater outlet in the far eastern corner would be an important localised source of sediment, with coarser material dropping out closer to the outlet and finer material jetted further away. We understand that that shallowing has occurred in the marina as a direct consequence of the sediment feed from local stormwater outlets. Wind waves, boat waves and occasional swell would be the primary causes of present-day sediment movement in Double Bay. Wind waves are likely to dominate. Boat waves are becoming more influential, particularly since the introduction of high speed ferries. GBA estimates that wash from high speed ferries delivers some 5 to 10 times the wave energy to the shoreline compared to typical power boats, with commensurate potential to influence shoreline sediment transport. Occasional swell waves are approximately 5 times more energetic than the waves generated by high speed ferries, but their low frequency of occurrence would cap their relative influence. West of the marina, GBA observes a slight fining in beach sediment grain size from west to east (beach slope flattens in this direction too), and a slight buildup of sand on the western side of the marina slipway ramp compared to the eastern side (3 m plan offset at waterline) (Photos 3 and 4). Both features point to a net transport direction along the beach from west to east. However, the magnitude of this transport is likely to be low for a number of reasons. Beach widths are relatively narrow so sediment availability is contained. Incident waves at the beach show variable obliquity – easterly bias during summer afternoons, and more from the west over the winter months and in the mornings. Wash from ferries would add to the westerly wave component. Variable gross movements infer a balancing of net movements. Furthermore, bypassing of sediment is not observed at the head of the marina’s slipway ramp, suggesting low transport rates in this location. Finally, it is clear that there is minimal sediment exchange between west Double Bay and east Double Bay. Since the rocky headland at Gladswood Gardens between east and west Double Bay is devoid of beach sediments, it follows that physically there is no sediment transport connection between the two of any significance.
4 INFLUENCE OF MARINA UPGRADE ON BEACH STABILITY
The marina upgrade proposal involves a slight expansion of the marina “footprint” to the NW, and conversion from fixed jetties to floating walkways and berths. Boat numbers in the marina will increase from 40 to 51, however the additional 11 vessels are balanced by the removal of 11 swing moorings in the immediate vicinity. Dredging is also proposed. Most of the change in marina layout is to occur at the outer end of the facility, between 75 and 175 m from the shoreline of west Double Bay.

Gary Blumberg & Associates Double Bay Marina Reference: gpb:gpb/05-20/lr706 23 March 2007
Page 4 of 8
The proposed modifications to the marina will not influence the supply of sediments to Double Bay. This relies on geomorphic and catchment erosion processes. The modifications will however, to at least some extent, influence the incident wave conditions at the shoreline. Since there is no sediment transport connection around the headland at Gladswood Gardens, the eastern part of Double Bay is therefore fully quarantined from any influence and can therefore be excluded from further consideration. Equally, the shoreline to the west of the ferry terminal is outside of any potential influence, due to its distant location from the marina and since the marina does not project so far into the waterway such as to interfere with waves directed into the western portion of the bay. It follows that possible influence on beach stability will be limited to the western part of Double Bay, east of the ferry terminal The upgraded facility could be expected to result in slightly less wave action penetrating to the shoreline. Thus erosion of the beach in storm events (onshore-offshore transport behaviour) may be reduced compared to that which occurs today. This is a positive outcome for beach stability. The inshore wave climate which forces the longshore sediment transport is a compilation of all wind waves, boat waves and swell. The existing “weighted” wave condition at the beach is expected to retain a slight westerly component, driving the west to east net transport. The upgraded facility may cause a reduction in the NE contribution to the overall wave climate, thereby accentuating the west to east influence. However, the dredging will serve to counteract this change in that there will be refraction of waves in the immediate lee of the breakwater, thereby promoting an east-to-west transport bias. The scale of these influences is not readily quantifiable, however, given the sedate nature of the existing transport regime and the predicted balancing of albeit minor impacts attributed to the upgrade, our expectation would be that the net influence on beach stability would be small and acceptable.
5 REFERENCES
CERC (1984) Shore Protection Manual US Army Corps of Engineers, Vicksberg Chapman DM, Geary M, Roy PS and Thom BG (1982) Coastal Evolution and Coastal Erosion in NSW Coastal Council of NSW

Gary Blumberg & Associates Double Bay Marina Reference: gpb:gpb/05-20/lr706 23 March 2007
Page 5 of 8
We trust that the above meets your immediate requirements in this matter. Should you need any further information or clarification, please do not hesitate to contact the undesigned. Yours faithfully GARY BLUMBERG & ASSOCIATES G P Blumberg Principal Attachments

Gary Blumberg & Associates Double Bay Marina Reference: gpb:gpb/05-20/lr706 23 March 2007
Page 6 of 8
SELECTED PHOTOS TAKEN DURING SITE INSPECTION ON 11 DECEMBER 2006-12-12 (APPROX MID TIDE)
Photo 1 – Beach east of Beach Road, west Double Bay
Photo 2 – Beach at west Double Bay

Gary Blumberg & Associates Double Bay Marina Reference: gpb:gpb/05-20/lr706 23 March 2007
Page 7 of 8
Photo 3 – Sand build up on west side of slipway ramp
Photo 4 – Sand deficiency on east side of slipway ramp

Gary Blumberg & Associates Double Bay Marina Reference: gpb:gpb/05-20/lr706 23 March 2007
Page 8 of 8
Photo 5 – Minor beach deposits opposite main stormwater
outlet, east corner of west Double Bay