
Environmental Impact of Sugar mill Effluent on the … · groundwater pollution. According to...
8
Research Journal of Recent Sciences _________________________________________________ ISSN 2277-2502 Vol. 3(ISC-2013), 385-392 (2014) Res. J. Recent. Sci. International Science Congress Association 385 Environmental Impact of Sugar mill Effluent on the Quality of Groundwater from Sangamner, Ahmednagar, Maharashtra, India K.K. Deshmukh Research Center in Chemistry, Sangamner Nagarpalika Arts, D.J. Malpani Commerce & B.N. Sarda Science College, Sangamner – 422605, Dist. Ahmednagar, MS, INDIA Available online at: www.isca.in, www.isca.me Received 30 th November 2013, revised 9 th February 2014, accepted 13 th March 2014 Abstract Among the factors polluting the soil and groundwater, sugar mills certainly have a larger share in form of their discharges of the large account of wastewater as effluent. Increasing use of chemical fertilizers and pesticides in raising the sugarcane production has also resulted in the degradation of soil and groundwater quality. Taking this view into amount, the present study aimed at conducting a detailed investigation of the impact of sugar mill effluent on the ground water quality in the vicinity of sugar mills in Sangamner. Fifteen groundwater samples were analysed for various parameters like pH, EC, TDS, Na + , K + , Ca 2+ , Mg 2+ , Cl - , HCO 3 , SO 4 2- , PO 4 3- , NO 3 - and total hardness during the period of operation of sugar mill. The results revealed that there was significant variation in some parameters. The high values of Ca, Na, chloride, sulphates, nitrates and hardness in the samples which are located downstream suggest that sugar mill effluent is the source of soil and groundwater pollution. According to permissible limit suggested by Indian standard – drinking water specification -1991. During this study, it was found that the samples in flowing to the downward direction land located in the close proximity of stream of effluent are not suitable for either drinking or irrigation purposes. The investigation suggests that water quality management, an important issue for the sustenance of human civilization must become a major priority. Keywords: Sugar mill effluent, groundwater quality, groundwater pollution, environmental impact, spatial variations, salinisation. Introduction Undoubtedly, water is the most essential requirement not only for life sustenance but for the economic and industrial development. At the same, it is a known reality that water is an important issue in the maintenance of our environmental balance with the rapid growth of population and acceleration in industrialization. In last few decades, the tremendous increase in the demand for freshwater has also been a matter of great concern. The release of treated and untreated industrial effluents in unplanned manner is one of the major causes of water pollution. The effluents released from sugar cane factory into land and into various surface water bodies not only affect the water quality and soil but also pollute the groundwater due to percolation of some water soluble pollutants 1 . Industrial and domestic waste water come into contact with natural water bodies. Such waste waters contain large amount of dissolved chemical constituents and many a times, microorganisms in them. In rural area small scale industries like dairy, poultry etc and large scale industries like sugar, distillery, paper etc. release the waste (solid and liquid) after partial treatments like lagooning or often without any treatment on the land surface or directly into the natural streams thereby admitting some hazardous chemicals. These waste material is also serving as a medium for growing bacteria, fungi or chemical minerals like Na + , K + , NO 3 - , PO 4 3- etc get in groundwater by percolation through the soil and thus contaminate groundwater. Disposal of industrial waste in the open space and abandoned dug wells have thus caused the pollution of groundwater in some parts of rural India. Industrial effluents often infiltrate upto the of pheratic zone of aquifer depending upon the porosity and the permeability of the medium of infiltration resulting in acceptable concentration of TDS, fluorides and iron resulting in severe contamination of the groundwater 2 . Sugar industry consumes substantial volume of water and chemicals in different processing units. All chemicals used wash away with the waste water discharged through industrial outlet. Thus effluents consist of all types of chemicals which contain toxic heavy metals. Effluents store pond is highly contaminated. Effluents moves along with heavy metals and reach in shallow water table by leaching processes and contamination may disperse in a wide range of the region. Contamination of soils of close areas occurs when the effluents or polluted water comes under contact of soil. The regular contact of polluted water with soil makes the sodic soils and alters the physico chemical characteristics, texture and profile of soil stratum 3 . India is widely known for its sugar industry; it has emerged as one of the largest sugar producing country in the world. In term of the economic development, sugar industry played a
Transcript of Environmental Impact of Sugar mill Effluent on the … · groundwater pollution. According to...
Research Journal of Recent Sciences _________________________________________________ ISSN 2277-2502
Vol. 3(ISC-2013), 385-392 (2014) Res. J. Recent. Sci.
International Science Congress Association 385
Environmental Impact of Sugar mill Effluent on the Quality of Groundwater
from Sangamner, Ahmednagar, Maharashtra, India K.K. Deshmukh
Research Center in Chemistry, Sangamner Nagarpalika Arts, D.J. Malpani Commerce & B.N. Sarda Science College, Sangamner – 422605, Dist.
Ahmednagar, MS, INDIA
Available online at: www.isca.in, www.isca.me Received 30th November 2013, revised 9th February 2014, accepted 13th March 2014
Abstract
Among the factors polluting the soil and groundwater, sugar mills certainly have a larger share in form of their discharges
of the large account of wastewater as effluent. Increasing use of chemical fertilizers and pesticides in raising the sugarcane
production has also resulted in the degradation of soil and groundwater quality. Taking this view into amount, the present
study aimed at conducting a detailed investigation of the impact of sugar mill effluent on the ground water quality in the
vicinity of sugar mills in Sangamner. Fifteen groundwater samples were analysed for various parameters like pH, EC, TDS,
Na+, K
+, Ca
2+, Mg
2+, Cl
-, HCO3, SO4
2-, PO4
3-, NO3
- and total hardness during the period of operation of sugar mill. The
results revealed that there was significant variation in some parameters. The high values of Ca, Na, chloride, sulphates,
nitrates and hardness in the samples which are located downstream suggest that sugar mill effluent is the source of soil and
groundwater pollution. According to permissible limit suggested by Indian standard – drinking water specification -1991.
During this study, it was found that the samples in flowing to the downward direction land located in the close proximity of
stream of effluent are not suitable for either drinking or irrigation purposes. The investigation suggests that water quality
management, an important issue for the sustenance of human civilization must become a major priority.
Keywords: Sugar mill effluent, groundwater quality, groundwater pollution, environmental impact, spatial variations,
salinisation.
Introduction
Undoubtedly, water is the most essential requirement not only
for life sustenance but for the economic and industrial
development. At the same, it is a known reality that water is an
important issue in the maintenance of our environmental
balance with the rapid growth of population and acceleration
in industrialization. In last few decades, the tremendous
increase in the demand for freshwater has also been a matter of
great concern. The release of treated and untreated industrial
effluents in unplanned manner is one of the major causes of
water pollution. The effluents released from sugar cane factory
into land and into various surface water bodies not only affect
the water quality and soil but also pollute the groundwater due
to percolation of some water soluble pollutants1.
Industrial and domestic waste water come into contact with
natural water bodies. Such waste waters contain large amount
of dissolved chemical constituents and many a times,
microorganisms in them. In rural area small scale industries
like dairy, poultry etc and large scale industries like sugar,
distillery, paper etc. release the waste (solid and liquid) after
partial treatments like lagooning or often without any
treatment on the land surface or directly into the natural
streams thereby admitting some hazardous chemicals. These
waste material is also serving as a medium for growing
bacteria, fungi or chemical minerals like Na+, K
+, NO3
-, PO4
3-
etc get in groundwater by percolation through the soil and thus
contaminate groundwater. Disposal of industrial waste in the
open space and abandoned dug wells have thus caused the
pollution of groundwater in some parts of rural India.
Industrial effluents often infiltrate upto the of pheratic zone of
aquifer depending upon the porosity and the permeability of
the medium of infiltration resulting in acceptable
concentration of TDS, fluorides and iron resulting in severe
contamination of the groundwater2.
Sugar industry consumes substantial volume of water and
chemicals in different processing units. All chemicals used
wash away with the waste water discharged through industrial
outlet. Thus effluents consist of all types of chemicals which
contain toxic heavy metals. Effluents store pond is highly
contaminated. Effluents moves along with heavy metals and
reach in shallow water table by leaching processes and
contamination may disperse in a wide range of the region.
Contamination of soils of close areas occurs when the
effluents or polluted water comes under contact of soil. The
regular contact of polluted water with soil makes the sodic
soils and alters the physico chemical characteristics, texture
and profile of soil stratum3.
India is widely known for its sugar industry; it has emerged as
one of the largest sugar producing country in the world. In
term of the economic development, sugar industry played a
Research Journal of Recent Sciences ______________________________________________________________ ISSN 2277-2502
Vol. 3(ISC-2013), 385-392 (2014) Res. J. Recent. Sci.
International Science Congress Association 386
vital role in the Indian subcontinent. The industry particularly
in Maharashtra holds a very important position in the economy
and politics of the state. These sugar industries have initiated
many economic activities by setting up dairies, distilleries,
paper mills and poultries etc. in their respective regions.
Besides, many of sugar industries run their own educational
institutions to impart education at different levels e.g. from
KG to PG and have started the technical institutions. Thus,
contributing to the social change rural areas within their
jurisdiction4.
Increase in sugar industrialization along with high rate of
urbanization and subsequent increase in population has led to
unprecented increase in the environmental degradation of the
resources. The damage to both aquatic and terrestrial
ecosystems caused by the enormous quantity of waste released
in the form of effluent produces is certainly alarming. These
pollutants not only alter the physico chemical characteristics
of the recipient aquatic bodies but also affect the aquatic flora
and fauna. Similarly, the rural and semi-urban population,
drinking water from streams or rivers and using it for
agricultural and domestic purposes has undergo serious health
hazards on account of the sugar mill effluents, being
discharged into the environment. Farmers have been using
these effluents unscientifically for irrigation and found that the
growth, yield and soil health is reduced. Contaminants such as
Cl-, SO4
2-, PO4
3-, Mg
+2 and NO3
- are discharged with the
effluent which creates a nuisance due to physical appearance,
odor and taste5. In recent past various studies have been made
on the impact of sugar mill effluent on groundwater quality6-13
.
Sangamner area is of particular importance because effluents
from municipal sewage, agricultural runoff, sugar cane factory
effluents and industrial waste are discharged into the Pravara
River bringing out considerable change in the groundwater
quality. However there exists negligible data and information
available about the effect of sugar mill effluent on the quality
of groundwater of this area. Considering these serious issues,
the present study was carried out to find out the possible
effects of such effluents on the quality of groundwater in the
proximity of a sugar factory.
Sangamner Sugar Factory: The place of study is Sangamner
sugar factory which is located at Ghulewadi, one of villages in
Sangamner Tehsil of the Ahmednagar district of Maharashtra.
It is included in the toposheet no 47/I/2 of the survey of India
and lies between 18° 36’ N to 19° 1
’ N latitude and 74° 1
’ W to
74° 56’ W longitude (Figure-1). Sangamner sugar factory is
located in the study area. It is a Co-operative Sugar factory
started in 1966-67 with the initial capacity of 800 tons of
sugarcane crushed per day (TCD). This initial capacity has
been expanded two to three times and presently it is 3500 TCD
(since 1989-90). The raw water requirement for the industry is
about 1500-1700 lit/ton/day. The water goes through the
internal processes, in the boiling house, mill house and filter
cloth washing and comes out as an effluent. This effluent with
very little partial treatment like lagooning goes through a zig -
zag natural stream flowing through the agricultural area in the
downstream part for a distance of about 5 km and finally
meets the river Pravara at Sangamner. Geographical locations
of lagoons are at higher elevation in the foothill zones where
thickness of colluvial deposits is more, colluvium overlies on
amygdaloidal/vesicular basalt that shows moderate degree of
weathering. This has possibly favoured induced infiltration of
effluent into the subsurface. In addition to this, while flowing
through the natural stream the effluent infiltrates through the
soils, leading to contamination and changes in chemical
composition of water from nearby dug wells. It should be
noted that water from this area was uncontaminated and was
also of potable quality prior to installation of the sugar factory.
Methodology
The streams carrying effluent from sugar mills flows through
the study area. The loss of some effluents envisaged due to
percolation through the soil zone. This waste water is
therefore, expected to reach the groundwater table. Hence it
was essential to have the sampling sites near the stream and
few meters away from the effluents stream. The groundwater
composition is likely to vary from place to place due to the
effect of mixing of effluent with natural groundwater. Hence
representative water samples were collected from the wells
close to the stream and progressively away from it. Thus
fifteen sampling stations in the study area were selected
(Figure-1) by adopting the above mentioned criteria. The wells
which are used for drinking, irrigation and contaminated by
sugar mill effluents were selected for sampling.
The wells located in platea top, hill slopes and valley floor
areas spread over either side of Pravara River were included.
By considering such an approach it should be possible to study
the impact of sugar mill effluent on the groundwater quality.
Considering the operational period of Sangamner sugar factory
the groundwater samples were collected at appropriate time.
The samples were collected in polyethylene bottles of one liter
capacity. The care was taken to collect samples after pumping
for some time. The pH, electrical conductivity (EC) and
temperature were measured in the field. The analysis was
carried out in the laboratory by using the procedures given by
APHA14
. Using titrimetric methods, the analysis of chloride
(Cl), total alkalinity as CaCO3, Calcium (Ca+2
) and total
hardness as CaCO3 (TH) was performed. While nitrate,
phosphate and sulphate were analyzed by spectrophotometric
methods (Hitachi-2000, UV-visible spectrophotometer), the
alkali elements like sodium and potassium were detected by
flame photometer (E1 850 A, Equiptronics). The data
obtained through the chemical analysis of groundwater is
presented in table 1.
Research Journal of Recent Sciences ______________________________________________________________ ISSN 2277-2502
Vol. 3(ISC-2013), 385-392 (2014) Res. J. Recent. Sci.
International Science Congress Association 387
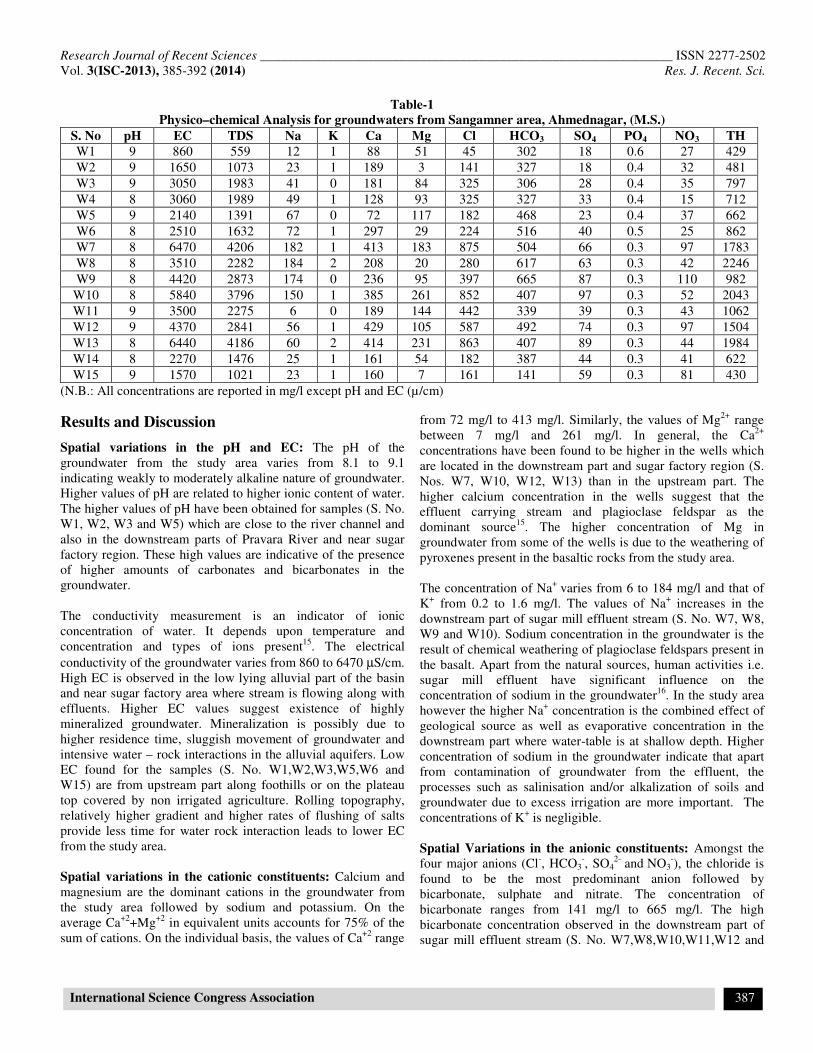
Table-1
Physico–chemical Analysis for groundwaters from Sangamner area, Ahmednagar, (M.S.)
S. No pH EC TDS Na K Ca Mg Cl HCO3 SO4 PO4 NO3 TH
W1 9 860 559 12 1 88 51 45 302 18 0.6 27 429
W2 9 1650 1073 23 1 189 3 141 327 18 0.4 32 481
W3 9 3050 1983 41 0 181 84 325 306 28 0.4 35 797
W4 8 3060 1989 49 1 128 93 325 327 33 0.4 15 712
W5 9 2140 1391 67 0 72 117 182 468 23 0.4 37 662
W6 8 2510 1632 72 1 297 29 224 516 40 0.5 25 862
W7 8 6470 4206 182 1 413 183 875 504 66 0.3 97 1783
W8 8 3510 2282 184 2 208 20 280 617 63 0.3 42 2246
W9 8 4420 2873 174 0 236 95 397 665 87 0.3 110 982
W10 8 5840 3796 150 1 385 261 852 407 97 0.3 52 2043
W11 9 3500 2275 6 0 189 144 442 339 39 0.3 43 1062
W12 9 4370 2841 56 1 429 105 587 492 74 0.3 97 1504
W13 8 6440 4186 60 2 414 231 863 407 89 0.3 44 1984
W14 8 2270 1476 25 1 161 54 182 387 44 0.3 41 622
W15 9 1570 1021 23 1 160 7 161 141 59 0.3 81 430
(N.B.: All concentrations are reported in mg/l except pH and EC (µ/cm)
Results and Discussion
Spatial variations in the pH and EC: The pH of the
groundwater from the study area varies from 8.1 to 9.1
indicating weakly to moderately alkaline nature of groundwater.
Higher values of pH are related to higher ionic content of water.
The higher values of pH have been obtained for samples (S. No.
W1, W2, W3 and W5) which are close to the river channel and
also in the downstream parts of Pravara River and near sugar
factory region. These high values are indicative of the presence
of higher amounts of carbonates and bicarbonates in the
groundwater.
The conductivity measurement is an indicator of ionic
concentration of water. It depends upon temperature and
concentration and types of ions present15
. The electrical
conductivity of the groundwater varies from 860 to 6470 µS/cm.
High EC is observed in the low lying alluvial part of the basin
and near sugar factory area where stream is flowing along with
effluents. Higher EC values suggest existence of highly
mineralized groundwater. Mineralization is possibly due to
higher residence time, sluggish movement of groundwater and
intensive water – rock interactions in the alluvial aquifers. Low
EC found for the samples (S. No. W1,W2,W3,W5,W6 and
W15) are from upstream part along foothills or on the plateau
top covered by non irrigated agriculture. Rolling topography,
relatively higher gradient and higher rates of flushing of salts
provide less time for water rock interaction leads to lower EC
from the study area.
Spatial variations in the cationic constituents: Calcium and
magnesium are the dominant cations in the groundwater from
the study area followed by sodium and potassium. On the
average Ca+2
+Mg+2
in equivalent units accounts for 75% of the
sum of cations. On the individual basis, the values of Ca+2
range
from 72 mg/l to 413 mg/l. Similarly, the values of Mg2+
range
between 7 mg/l and 261 mg/l. In general, the Ca2+
concentrations have been found to be higher in the wells which
are located in the downstream part and sugar factory region (S.
Nos. W7, W10, W12, W13) than in the upstream part. The
higher calcium concentration in the wells suggest that the
effluent carrying stream and plagioclase feldspar as the
dominant source15
. The higher concentration of Mg in
groundwater from some of the wells is due to the weathering of
pyroxenes present in the basaltic rocks from the study area.
The concentration of Na+
varies from 6 to 184 mg/l and that of
K+ from 0.2 to 1.6 mg/l. The values of Na
+ increases in the
downstream part of sugar mill effluent stream (S. No. W7, W8,
W9 and W10). Sodium concentration in the groundwater is the
result of chemical weathering of plagioclase feldspars present in
the basalt. Apart from the natural sources, human activities i.e.
sugar mill effluent have significant influence on the
concentration of sodium in the groundwater16
. In the study area
however the higher Na+ concentration is the combined effect of
geological source as well as evaporative concentration in the
downstream part where water-table is at shallow depth. Higher
concentration of sodium in the groundwater indicate that apart
from contamination of groundwater from the effluent, the
processes such as salinisation and/or alkalization of soils and
groundwater due to excess irrigation are more important. The
concentrations of K+ is negligible.
Spatial Variations in the anionic constituents: Amongst the
four major anions (Cl-, HCO3
-, SO4
2- and
NO3
-), the chloride is
found to be the most predominant anion followed by
bicarbonate, sulphate and nitrate. The concentration of
bicarbonate ranges from 141 mg/l to 665 mg/l. The high
bicarbonate concentration observed in the downstream part of
sugar mill effluent stream (S. No. W7,W8,W10,W11,W12 and

Research Journal of Recent Sciences ______________________________________________________________ ISSN 2277-2502
Vol. 3(ISC-2013), 385-392 (2014) Res. J. Recent. Sci.
International Science Congress Association 388
W13) is possibly due to flat topography, providing sufficient
length of time for the aquifer material to interact with the
groundwater17
. Both silicate mineral weathering of basalt and
dissolution of carbonate present in the alluvium and addition of
effluent from sugar factory seem to be the potential sources of
bicarbonates in the groundwater from the study area.
The chloride concentration in the groundwater ranges from 45
mg/l to 875 mg/l. The chloride concentrations are higher in the
downstream part of the sugar mill effluent (S.No.W7, W10,
W11, W12 and W13). There is no lithological source of chloride
in the area. Hence higher concentration of chloride in the area
close to sugar-mill and other industries indicate contribution of
chloride could be due to mixing of waste waters and severe
contamination of groundwater from the chloride rich effluent as
the source.
The sulphate concentration in the groundwater of the area varies
from 18 to 97 mg/l. The higher concentrations of sulphate is
observed in the downstream part which could be due to
excessive use of fertilisers or use of soil amendments (S. No.
W6, W7, W9, W10, W12 and W13). The lower values of
sulphate have been observed in the upstream part of the basin
(S. No. W1,W2,W3 and W15) indicating negligible contribution
from lithological sources.
The nitrate concentration varies between 15 to 110 mg/l. The
high level of nitrate are observed in the downstream part and
also around sugar factory area (S.No. W7,W9,W11 and W12).
Around sugar mill there is mixing of effluent with the
groundwater which is responsible for high orders of nitrate
values. However, there does not seem to be any discernible
pattern of distribution nitrate along the direction of groundwater
movement. Thus, nitrate pollution in the area is the combined
effect of agricultural activity, the mixing of sugar mill effluent
and the animal wastes.
Groundwater quality for drinking purposes: Groundwater is
the only source of drinking water for more than 80% of the
population in India. As a part of this dependency, most efforts
are directed in locating the groundwater reservoir ignoring the
quality aspect. The seriousness of the chemical contamination
remains often neglected as the toxic chemicals do not show
acute health effects unless they enter into the body in
appreciable amount. However, the adverse health effects may
result through the cumulative poison formed in the body. Thus,
the sugar factory continuing its operation without taking
environmental precaution may cause serious health problems.
Such health related problems are observed in the Sangamner
sugar factory region where the people used to drink
groundwater. In view of this, it was decided to study the impact
of sugar mill effluent on the groundwater resources in the area.
Table 2 shows the critical parameters exceeding the Indian
standard – drinking water specification – 1996, permissible limit
along with the permissible limit for these parameters18
.
It is observed that the pH of 5(33.33%) samples exceeds the
permissible limit prescribed by drinking water standard. It is
found from the Table 2 that the Ca of 7(46.67%) samples have
exceeded the permissible limit specified by drinking water
standard18
. Therefore, constant use of such well waters for
drinking purpose may lead to kidney stones or joints pains in
population. In case of magnesium it is observed that 6(40%)
samples have exceeded the maximum permissible limit (Table
2) prescribed by drinking water standard18
. It is observed from
Table 2 that the nitrate of 5(33.33%) samples from the study
area have exceeded the permissible limit of nitrate prescribed by
drinking water standard18
. However, nitrates do not directly
contribute to the problem. It is the bacteria present in the
digestive tract converts the nitrate into highly toxic nitrites and
this might lead into 'blue baby syndrome' (Methamoglobinema)
in infants. Thus, the groundwater resources contaminated with
high levels of nitrate prove be environmental hazards19-21
. It is
observed that wells from the irrigated agricultural surrounded by
sugar cane field, close to cattle waste disposal areas and near
sugar factory have been shown higher concentration of nitrate.
This is possible due to leaching of organic and inorganic
fertilizers from irrigated land and effluents from sugar mill.
Table-2
Critical parameters of drinking water exceeding the Permissible limit in the study area
Parameter
Indian Standard drinking
water – specification IS 10500
-1991 (Reaffirmed 2009)
No. and locations of the samples exceeding permissible limit
Desirable
Limit
Permissible
Limit %
pH 6.5 to 8.5 No relaxation W2,W3,W5,W11 and W15 = 5 (33.33%)
TDS, mg/L 500 2000 W7,W8,W9,W10,W11,W12,W and W13 = 7 (46.67%)
Ca, mg/L 75 200 W6,W7,W8,W9,W10,W12 and W13 = 7 (46.67%)
Mg, mg/L 30 100 W5W7W10W11W12 and W13 = 6 (40%)
Cl, mg/L 250 1000 Nil
SO4, mg/L 200 400 Nil
NO3, mg/L 45 No relaxation W7,W9,W10,W12 and W15 = 5 (33.33%)
TH, (as CaCO3) mg/L 300 600 W3,W4,W5,W6,W7,W8,W9,W10,W11,W12,W13 and W14 = 12 (80%)

Research Journal of Recent Sciences ______________________________________________________________ ISSN 2277-2502
Vol. 3(ISC-2013), 385-392 (2014) Res. J. Recent. Sci.
International Science Congress Association 389
Hardness of groundwater and groundwater quality for drinking purposes: The study shows that the hardness of
groundwater of 12(80%) samples have exceeded maximum
permissible limit (table 2) prescribed by drinking water
standard18
. Therefore, it is found in the study area that majority
of the samples in the sugar factory area and wells along the path
of sugar mill effluent is not suitable for drinking purposes.
On the basis of hardness, groundwater can be classified into
four categories15
. These are
i. Very hard : <300mg/l. ii. Extremely hard class I : 300-600
mg/l. iii. Extremely hard class II : 600-1200 mg/l. iv. Extremely
hard class III : >1200 mg/l.
In the study area, the groundwater has been categorized as per
above classification. It is observed that the groundwater can be
described as 3(20%) samples show extremely hard class I,
7(46.66%) shows extremely hard class II and 5 (33.33%) belong
to extremely hard class III. Therefore it is observed that sugar
mill effluent has the impact on groundwater quality in the study
area and it can be categorized as very hard to extremely hard
type.
Groundwater pollution due to sugar mill effluent: To
evaluate the sugar mill effluent as a source of groundwater
contamination, the wells from the study area are selected along
the cross section from Chandanapuri Ghat to Karhe Ghat (figure
1). Out of 15 wells, 3 wells (S. No. S1, S2 and S3) from
southern part penetrate predominantly through basaltic aquifers.
Similarly from northern part through 7 wells (Sr. No. W15,
W14, W13, W12, W11, W10 and W9) pierce though basaltic
aquifers. All these wells both from southern and northern part of
the valley section represent recharge areas of the basin. The
remaining wells (S. No. W8, W7, W6, W5 and W4) displaying
composite lithosection consisting of alluvium and basalt
represent discharge area. Some of the wells (S. No. W7 and W8)
located close to river bank show higher thickness of alluvial
aquifers. In contrast, the wells which are situated close to the
base of hills in Ghat section pierce through colluviums and
basaltic lithology (S. No. S1, S2, S3 and S15). The groundwater
flows from water divides on either sides (Chandanapuri Ghat
and Karhe Ghat) to the central part of the valley where Pravara
River is flowing. This is to say that groundwater flow is clearly
associated with physiographic setup of the area. Although the
main Pravara valley is in the E-W direction, the slopes on
northern part (Karhe Ghat) and southern part (Chandanapuri
Ghat) of the vally have been eroded by numerous small to
medium sized tributaries of the Pravara River. This has
developed local valleys and water divides thereby affecting the
regional flow pattern. As a result of this hydrogeomorphic and
hydrogeological set up, the groundwater is flowing from
southern part i.e. Chandanapuri Ghat towards the vally and
similarly from northern i.e. Karhe Ghat where sugar factory is
located to central part i.e. towards Pravara river (figure 2).
Mechanism of groundwater pollution in the area: As sugar
processing is a seasonal activity the samples for the
groundwater pollution were to be collected only during the
period of operation in the sugar factory. Artificial flow
generated by the release of effluent also ceases for a couple of
months when the factory closes in the rainy season. Subsequent
to the rainy season, the average depth to groundwater in winter
months is minimum i.e. 2.5 m. During this period, the stream
remains dry and factory operation recommences. The
operational period of sugar factory corresponds with the major
part of winter and early part of summer season in the area. The
average depth to groundwater during early summer month is 4
m. During the period of operation of the factory, waste water
percolates through porous and permeable soil and weathered
basalt to reach the aquifer. Then the aquifer creates waterlogged
conditions in the downstream reaches over confluence of
Pravara River, favoring induced infiltration of waste water. This
leads to salinisation of groundwater (figure 2). The primary
cause of contamination of the shallow aquifer apparently seems
to be the infiltration of effluents through the soil and weathered
basalt. It is the downward percolation through the zone of
aeration allows the pollutants to enter the shallow aquifer. This
percolation forms a recharge mound at the water table and
further lateral movement below it. The effluents, draining
downwards and reaches the water table and get mixed with the
groundwater and then becomes the part of a lateral flow.
On the basis of TDS, salinisation of groundwater is defined by
Mehta et al22
. The waters with TDS content ranging from 400 to
>3000 mg /l have been designated as saline water. Hem15
classified water into four categories based on the TDS values.
They are slightly saline (1000-3000 mg/l), moderately saline
(3000-10,000 mg/l), very saline (10000 to 35000 mg/l) and
brine (>35000 mg/l). By using the same criteria, the wells along
the cross section of Pravara basin were classified. It is observed
that in the recharge zone (S. No. W1) wells belong to fresh
water class (TDS<1000mg/l), the wells (S. No. W2, W3, W4,
W5, W6, W8, W9, W11, W12, W14 and W15) which are in the
intermediate part between recharge and discharge areas, belong
to slightly saline water class. The wells (S. No. W7, W10, and
W 13) are situated on the both sides of river representing
discharge zone are moderately saline in character. The wells
(W15, W14, W13 and W12) located in the recharge zone near
Karhe Ghat are expected to represent fresh water class.
However, interestingly, all of them show slightly saline and
moderately saline water characters (figure-2). This is possibly
due to contamination of the wells by mixing of sugar mill
effluent. These wells are located in the down gradient direction
of the effluent storage pond (lagoons) of sugar factory besides
being in close proximity to the effluent carrying stream. Due to
mixing of effluents into the wells, saline water characteristics
have been developed. As mentioned earlier the ground water is
slightly to moderately saline in character in the discharge zone.
This is possible because of alluvial lithology, flat topography
and intensive irrigation practices that have lead to the problem
of salinization. The observations further show that the area with
Research Journal of Recent Sciences ______________________________________________________________ ISSN 2277-2502
Vol. 3(ISC-2013), 385-392 (2014) Res. J. Recent. Sci.
International Science Congress Association 390
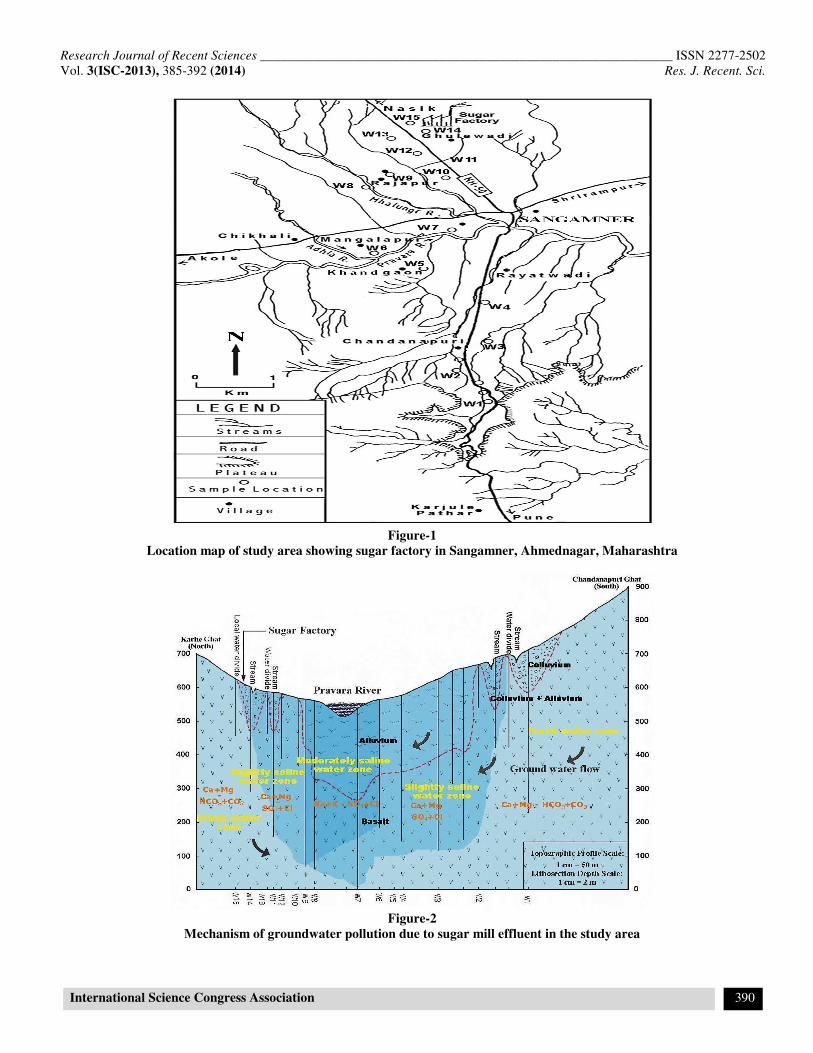
Figure-1
Location map of study area showing sugar factory in Sangamner, Ahmednagar, Maharashtra
Figure-2
Mechanism of groundwater pollution due to sugar mill effluent in the study area

Research Journal of Recent Sciences ______________________________________________________________ ISSN 2277-2502
Vol. 3(ISC-2013), 385-392 (2014) Res. J. Recent. Sci.
International Science Congress Association 391
TDS below 1000 mg/l lies in the recharge zone, which is
predominantly non-irrigated agricultural region and located on
the plateau and hilltop. Therefore, absence of saline waters or
presence of fresh water in this part is possible due to the faster
circulation of ground water attributable to physiography. On the
contrary, in the discharge zone, flat topography responsible for
sluggish groundwater flow conditions has lead to higher
residence time and greater rock-water interactions. In addition
to this, intensive irrigation and excess use of fertilizers have
lead to higher salinity in the area.
Conclusion
On the basis of chemical analysis of groundwater samples, it is
possible to study the effect sugar mill effluent as a source of
pollution of groundwater in the area. Sugar industries in India
are mainly located in the rural parts. The study reveals that the
sugar industries through their continued operation, without
taking the environmental precaution may cause serious health
problems to the rural population residing in the proximity.
Comparison of data with the water quality standard indicated
that the parameters like TDS, Ca, Mg, TH and nitrate have
exceeded the prescribed limit in the majority of the samples
particularly from the sugar mill effluent area. TDS of
groundwater indicate slightly saline to moderately saline
groundwater properties which suggests that the quality of
groundwater from sugar factory area is almost unsatisfactory for
drinking purpose. Majority of samples from sugar factory area
have exceeded the permissible limit of nitrate. It is clear that
the groundwater becomes polluted due to sugar industry effluent
from surrounding area. Hence it is not suitable for human
consumption without prior treatment. The following measures
have been recommended for the protection of groundwater. i.
Lining the store pond and water proofing at the base of lagoon.
ii. Treatment to effluent releasing from sugar factory is essential
to meet the required standards established by Indian standards
institutions. iii. Arranging public awareness programme and
there is a need for periodic testing of groundwater in the vicinity
of sugar factory. This information should be provided to farmers
for maintenance of soil and groundwater quality.
Acknowledgement
The author is thankful to University Grants Commission
(WRO), Pune for providing financial assistance under minor
research project. The author is also thankful to Post-Graduate
Research Centre in Chemistry, Sangamner College, Sangamner
for providing necessary research facilities.
References
1. Siddiqui W.A. and Waseem M., A comparative study of
sugar mill treated and untreated effluent – A case study,
Oriental Journal of Chemistry, 28(4), 1899-1904 (2012)
2. Pondhe G.M., Patil S.F. and Pawar N.J., Groundwater
pollution due to sugar mill effluent at Sonai, Maharashtra,
India, Environmental Geology, 34(2), 151-158 (1958)
3. Bharati P.K., Groundwater Pollution, Biotech Books, New
Delhi (2012)
4. Sabade B.R., Industrial developments of Maharashtra, 22nd
Annual Convention IWWA, 17-27 (1990)
5. Barugh, A.K., Sharama R.N. and Borab G.C., Impact of
sugar mill and distillery effluent on water quality of river
Galabil, Assam, Indian Journal of Environmental Health,
35, 288-293 (1993)
6. Kumar V. and Ghopra A.K., Influence of sugar mill
effluent of physico – chemical characteristics of soil at
Haridwar, Journal of Applied and Natural Science, 2(2),
269-279 (2010)
7. Dhangar S.D. and Lohar P.S., Effect of sugar factory
effluent on physico – chemical properties and cellulose
activity of soil – A case study, International
multidisciplinary Research journal, 3(1), 18-22 (2013)
8. Samuel S. and Muthukkaruppan S.M., Physico-chemical
analysis of sugar mill effluent, contaminated soil and its
effect on seed Germination of Paddy, International journal
of pharmaceutical and biological archives, 2(5), 146-1472
(2011)
9. Mahar M.T., Khuhawar M.Y., Baloch M.A. and Jahangir
T.M., Effect of spent wash of ethanol industry on
groundwater: A case study of Rahimyar Khan district,
Pakistan, J. of Environmental Science and Water
Resources,1(4), 85-94 (2012)
10. Kumar P., Environmental effect of industrial effluent of
groundwater, Oriental Journal of Chemistry, 29(3), 1243-
1249 (2013)
11. Kadam S.A., Dahiwalkar S.D., Gorantiwar S.D., and
Gadage S.B., Characteristic of Industrial Effluents and their
possible impact on Groundwater quality, Int. J. Research in
Chemistry and Environment, 2(1), 124-129 (2012).
12. Agale M.C., Patel N.G. and Patil A.G., Impact of sugar
industry effluents on the quality of groundwater from
Dahiwad Village, Dist Dhule (M.S.), Archives f Applied
Science Research, 5(2), 58-60 (2013)
13. Deshmukh K.K., The chemistry of groundwater in
Sangamner area with regard to their Suitability for drinking
purposes, Rasayan J. Chem, 4(4), 770–779 (2011)
14. APHA, AWWA and WPCF, Standard Methods for the
Examination of water and Waste Waters, America Public
Health Association 14th Edition, (1987)
15. Hem J.D., Study and Interpretation of chemical
characteristics of natural waters, U.S. Geological Survey
water Supply Paper No. 2254, (1991)
Research Journal of Recent Sciences ______________________________________________________________ ISSN 2277-2502
Vol. 3(ISC-2013), 385-392 (2014) Res. J. Recent. Sci.
International Science Congress Association 392
16. Pawar N.J., Geochemistry of carbonate precipitation from
the groundwaters in basaltic aquifers: an equilibrium
thermodynamic approach, J. Geo. Soc. India, 41, 119-131
(1993)
17. Nikumbh J.D. and Pawar N.J., Hydrogeochemistry of
groundwaters from Behedi Basin, Deccan Trap Hydrologic
Province, India: In Contributions to Environmental Geo-
science, edited by Pathan, A.M. and Thigale, S.S., Aravali
Books Institution (P) Ltd., New Delhi, 137-150 (2000)
18. Indian standard – Drinking water – specification IS 1050-
1991 (Reaffirmed 2009) (2009)
19. Hill A.R. Nitrate distribution in the groundwater of the
Alliston region of Ontario, Canada, Groundwater, 20(6),
696 (1982)
20. Pawar N.J. and Shaikh I.J., Nitrate pollution of groundwater
from shallow basaltic aquifers, Deccan Trap Hydrologic
Province, India, Env. Geol. 25, 197 (1995)
21. Datta P.S., Deb D.L. and Tyagi S.K., Assessment of
groundwater contamination from the fertilizers in Delhi
area based on 18
O, NO3 and K+ composition, Journal of
contaminant Hydrology, 27 (3-4), 249 (1997)
22. Mehta S, Fryar A and Banner J, Control on the regional –
Scale salinization of the Ogallala aquifer, Southern High
plains Texas, USA, Applied Geology, 15, 849 (2000)