Environmental impact assessment for DOORNHOEK FLUORSPAR ...
66
ENVIRONMENTAL IMPACT ASSESSMENT FOR DOORNHOEK FLUORSPAR MINE PROJECT SOCIO-ECONOMIC IMPACT STUDY FINAL REPORT OCTOBER 2016 P.O. Box 13554, HATFIELD 0028 Tel: (012) 342-8686 Fax: (012) 342 8688 E-mail: [email protected]
Transcript of Environmental impact assessment for DOORNHOEK FLUORSPAR ...
ENVIRONMENTAL IMPACT ASSESSMENT
FOR DOORNHOEK FLUORSPAR MINE
PROJECT
SOCIO-ECONOMIC IMPACT STUDY
FINAL REPORT
OCTOBER 2016
P.O. Box 13554, HATFIELD 0028
Tel: (012) 342-8686
Fax: (012) 342 8688
E-mail: [email protected]
DOORNHOEK FLUORSPAR PROJECT SOCIO-ECONOMIC IMPACT ASSESSMENT STUDY
Urban Econ Development Economists
2
Celebrate Development Diversity.
Version:
Draft version 1
September 2016
Project leader:
Elena Broughton
Cell: 082 463 2325
Email: [email protected]
Report writer:
Ndivhuwo Malemagoba
Cell: 073 565 2239
Email: [email protected]

DOORNHOEK FLUORSPAR PROJECT SOCIO-ECONOMIC IMPACT ASSESSMENT STUDY
Urban Econ Development Economists
3
SPECIALISTS DETAILS
Elena Broughton
Cell: 082 463 2325
E-mail: [email protected]
Position: Manager/Senior Economist
Qualifications: MSc Technology Management, BSC (Hon) Technology Management, BCom (Hon)
Economics
Experience: 11 years
Brief profile: Elena Broughton is a senior professional and the manager of the Innovation & Sustainable
Development Unit at Urban-Econ. She has extensive knowledge in various fields of
economic development that includes 11 years of experience in undertaking socio-
economic impact assessment studies for a variety of private clients spanning the mining,
manufacturing, energy, infrastructure, and retail sectors. She also acted as a peer
reviewer in a number of socio-economic impact assessment studies and completed a few
strategic socio-economic impact assessments. Her involvement in the field allowed her to
develop a sound understanding of the South African environmental legislation and
developmental policies and equipped her with a widespread knowledge of socio-economic
implications and benefits of various new developments.
Ndivhuwo Malemagoba
Cell: 073 565 2239
E-mail: [email protected]
Position: Junior Development Economist
Qualifications: MSc Development Planning, BSc (Hons) Urban and Regional Planning, BSc Urban and
Regional Planning
Experience: 2 years
Brief profile: Ndivhuwo Malemagoba is Junior Development Economist with a sturdy background in
development planning. Her endeavours include project management in built environment
solution provision. Her robust experience in qualitative and quantitative research has
equipped her with data collection, analysis and interpretation skills. This has lead to her
contribution to numerous development research studies in the academic and private
sector arena.

DOORNHOEK FLUORSPAR PROJECT SOCIO-ECONOMIC IMPACT ASSESSMENT STUDY
Urban Econ Development Economists
4
TABLE OF CONTENTS
SPECIALISTS DETAILS ..................................................................................................................... 3
TABLE OF CONTENTS ....................................................................................................................... 4
ACRONYMS AND ABBREVIATIONS ................................................................................................. 6
1 INTRODUCTION .......................................................................................................................... 7
1.1 Brief Description of the Project .............................................................................................. 7
1.2 Scope and Purpose of the Study ........................................................................................... 8
1.3 Methodology .......................................................................................................................... 9
1.4 Data gathering and consultation process ............................................................................. 10
1.5 Assumptions, Limitations and Gaps in Knowledge ............................................................... 12
2 POLICY REVIEW ....................................................................................................................... 13
3 BASELINE INFORMATION ........................................................................................................ 17
Study Area’s Composition and Locational Factors ............................................................... 17 3.1
Sense of Place, History and Cultural Aspects ...................................................................... 19 3.2
Demographic Profile ............................................................................................................ 20 3.3
Economy ............................................................................................................................. 21 3.4
Labour Force and Employment Structure ............................................................................ 23 3.5
Income................................................................................................................................. 25 3.6
Access to Services and State of Local Built Environment .................................................... 26 3.7
Settlement profile ................................................................................................................. 26 3.8
Access to Housing and Basic Services ................................................................................ 27 3.9
Transport Infrastructure ....................................................................................................... 29 3.10
Social and Recreational Infrastructure ................................................................................. 30 3.11
4 SITE-RELATED INFORMATION ................................................................................................ 32
5 IMPACT ANALYSIS ................................................................................................................... 38
Impact ensued during Construction Phase .......................................................................... 38 5.1
5.1.1 Temporary Stimulation of the Local and National Economy .......................................... 38
5.1.2 Temporary Creation of Employment in Local and National Economies ......................... 40
5.1.3 Increased Household Income and Improved Standard of living .................................... 41
5.1.4 Skills Development due to the creation of new Employment Opportunities ................... 42

DOORNHOEK FLUORSPAR PROJECT SOCIO-ECONOMIC IMPACT ASSESSMENT STUDY
Urban Econ Development Economists
5
5.1.5 Government Revenue Increase due to Capital Expenditure.......................................... 42
5.1.6 Change in Sense of Place ............................................................................................ 42
5.1.7 Loss of Agricultural Production due to Agricultural Land Sterilization and Other
Environmental Impacts ............................................................................................................... 43
5.1.8 Increase in Social Pathologies ...................................................................................... 44
5.1.9 Added Pressure on Basic Services and Social and Economic infrastructure ................ 45
Impacts Ensued during Operational Phase .......................................................................... 48 5.2
5.2.1 Sustainable Stimulation of the Local and National Economy......................................... 48
5.2.2 Creation of Employment in Local and National Economies ........................................... 50
5.2.3 Skills Development due to the Creation of New Employment Opportunities .................. 50
5.2.4 Increase in household income and standard of living .................................................... 51
5.2.5 Increase in Government Revenue ................................................................................ 52
5.2.6 Export Earnings ............................................................................................................ 52
5.2.7 Change in Sense of Place ............................................................................................ 53
5.2.8 Improved Quality of Life and Service Delivery .............................................................. 53
Impacts ensued during Decommissioning Phase ................................................................. 54 5.3
6 CONCLUSION ........................................................................................................................... 55
ANNEXURE A: IMPACT RATING CRITERIA AND METHODOLOGY ............................................... 62
REFERENCES .................................................................................................................................. 64

DOORNHOEK FLUORSPAR PROJECT SOCIO-ECONOMIC IMPACT ASSESSMENT STUDY
Urban Econ Development Economists
6
ACRONYMS AND ABBREVIATIONS
CAGR Compounded Average Growth Rate
DM District Municipality
DLM Ditsobotla Local Municipality
EIA Environmental Impact Assessment
ENRC Eurasian Natural Resources Corporation plc
IDP Integrated Development Plan
IPAP Industrial Policy Action Plan
KPA Key Performance Area
LED Local Economic Development
LM Local Municipality
NDP National Development Plan
NGPF New Growth Path Framework
NIP National Infrastructure Plan
PDP Provincial Development Plan
RNLM Ramotshere Moiloa Local Municipality
SA South Africa
SEDA Small Enterprise Development Agency
SIP Strategic Infrastructure Project
SMME Small Medium and Micro-Sized Enterprises
DOORNHOEK FLUORSPAR PROJECT SOCIO-ECONOMIC IMPACT ASSESSMENT STUDY
Urban Econ Development Economists
7
1 INTRODUCTION
This document is prepared by Urban-Econ Development Economists in request by Exigo Sustainability
(Pty) Ltd on behalf of SA Fluorite (Pty) Ltd and Southern Palace (Pty) Ltd (“The Project Proponent”), to
undertake a Socio-Economic Impact Study for the Doornhoek Fluorspar Project, near Zeerust. The
socio-economic impact study is conducted as part of the Environmental Impact Assessment (EIA)
process managed by Exigo Sustainability (Pty) Ltd.
1.1 Brief Description of the Project
The Project Proponent plans to develop a fluorspar operation at the Doornhoek Fluorspar Project near
Zeerust. There is a strong history of acid grade fluorspar production in the area, dating back to the
1960s. Having secured the exploration rights over a large area, including permits held by SA Fluorite
(Pty) Ltd and Southern Palace (Pty) Ltd, covering a total of nine farms surrounding Doornhoek 305JP,
the Project Proponent now wishes to progress from exploration to project development (exploration has
shown that economically viable concentrations of fluorspar underlie these properties). ENRC proposes
to mine 1.5 MT of ore per year over a minimum of 30 years, and likely much longer.
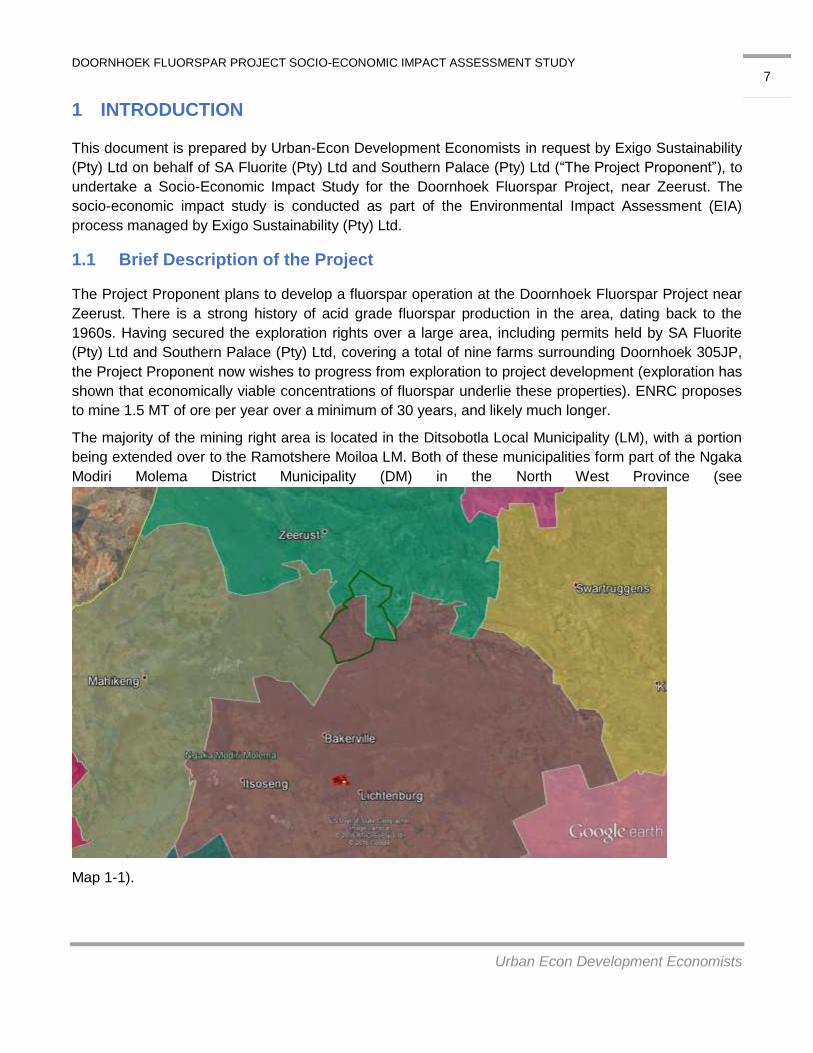
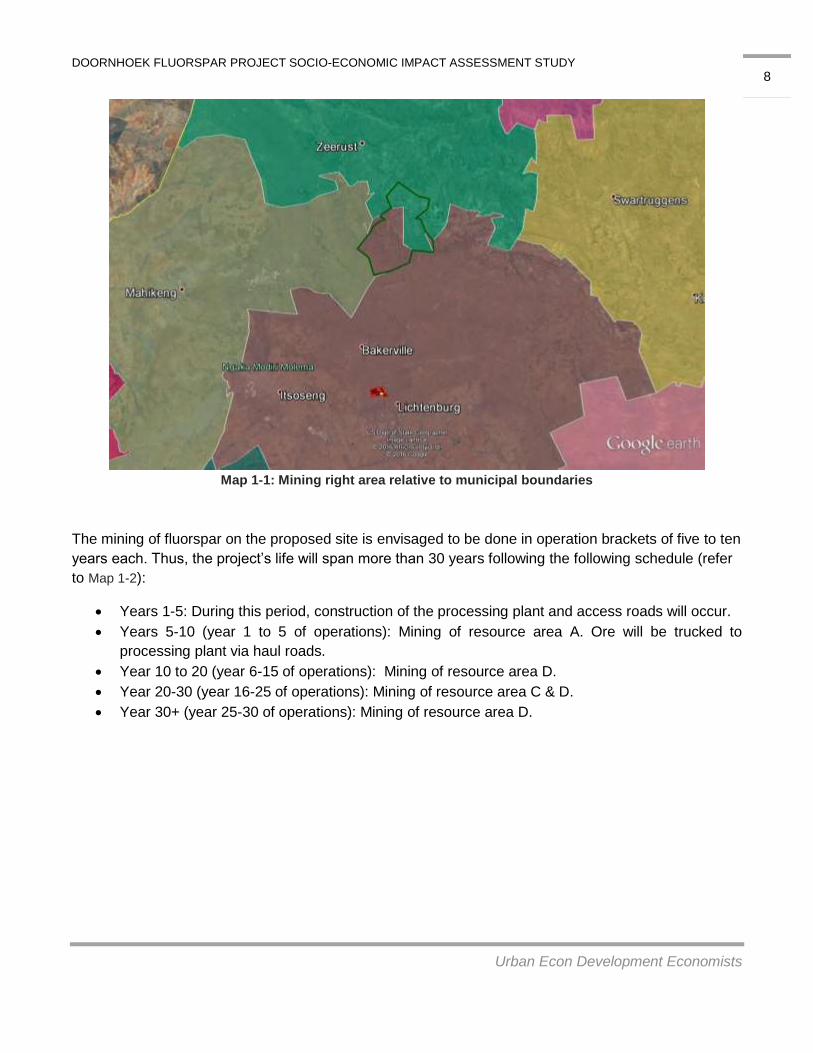
The majority of the mining right area is located in the Ditsobotla Local Municipality (LM), with a portion
being extended over to the Ramotshere Moiloa LM. Both of these municipalities form part of the Ngaka
Modiri Molema District Municipality (DM) in the North West Province (see
Map 1-1).
DOORNHOEK FLUORSPAR PROJECT SOCIO-ECONOMIC IMPACT ASSESSMENT STUDY
Urban Econ Development Economists
8
Map 1-1: Mining right area relative to municipal boundaries
The mining of fluorspar on the proposed site is envisaged to be done in operation brackets of five to ten
years each. Thus, the project’s life will span more than 30 years following the following schedule (refer
to Map 1-2):
Years 1-5: During this period, construction of the processing plant and access roads will occur.
Years 5-10 (year 1 to 5 of operations): Mining of resource area A. Ore will be trucked to
processing plant via haul roads.
Year 10 to 20 (year 6-15 of operations): Mining of resource area D.
Year 20-30 (year 16-25 of operations): Mining of resource area C & D.
Year 30+ (year 25-30 of operations): Mining of resource area D.
Ditsobotla LM

DOORNHOEK FLUORSPAR PROJECT SOCIO-ECONOMIC IMPACT ASSESSMENT STUDY
Urban Econ Development Economists
9
Map 1-2: Resource areas A, C and D
1.2 Scope and Purpose of the Study
The socio-economic impact assessment contains information that together with other specialists allows
assessment of the project from a sustainable development perspective and assists in identifying “the
most practicable environmental option” that provides the “most benefit and causes the least damage to
the environment as a whole, at a cost acceptable to society”, in the long-term and the short-term. In
light of the above, and in line with the Environmental Impact Assessment (EIA) Regulations of 2014, the
purpose of the socio-economic impact assessment is to assess the need and desirability of the project.
It specifically aims to ensure that the project, if approved, provides for justifiable social and economic
development outcomes. As such, it aims to:
1. Identify, predict and evaluate geographical, social, economic and cultural aspects of the
environment that may be affected by the project activities and associated infrastructure
2. Advise on the alternatives that best avoid negative impacts or allow to manage and minimise
them to acceptable levels, while optimising positive effects
The specific objectives of the study include:
Engage with the environmental practitioner, other specialists on the team, and the client to gain
necessary background on the project
A
c
D

DOORNHOEK FLUORSPAR PROJECT SOCIO-ECONOMIC IMPACT ASSESSMENT STUDY
Urban Econ Development Economists
10
Delineate the zone of influence in consultation with other specialists on the team
Determine the affected communities and economies located in the zone of influence and identify
sensitive receptors within the delineated study area; i.e. communities, land uses and economic
activities that could be directly or indirectly negatively affected by the proposed project or benefit
from it
Determine the data required to assess potential impacts and respond to the questions outlined
in the guidelines related to needs and desirability assessment
Review secondary data and assess data gaps
Conduct a site visit and collect primary social and economic data of the parties that may be
directly or indirectly be affected (positively or negatively) by the proposed project to address
data gaps
Create profiles for the communities and economies representing the study areas and the
environmentally affected zone
Assess the need and desirability of the project and its alternatives in line with the specified
guidelines
Identify, predict and evaluate the potential positive and negative impacts associated with the
project following the environmental specialist’s methodology
Advise on the most suitable alternative, inclusive of the “no-go” option
Develop a mitigation plan by proposing mitigation measures for negative effects and
enhancement measures for positive impacts
1.3 Methodology
The following methodology was followed in completing the study:
1. Orientation: The study started with gaining an understanding of the proposed project during
various stages of its lifecycle and potentially affected environment. Review of various data and
maps provided for the project, as well as discussions with the project team, informed the
delineation of the potential zone of influence associated with each component of the project.
The delineated zone of influence defined the spatial boundaries of the area to be included in the
assessment and assisted in identifying likely impacted and beneficiary communities and
economic activities, as well as other stakeholders of the project.
2. Policy alignment review: Relevant government policies and other strategic documents were
gathered and reviewed to determine the alignment of the proposed project with the strategic
plans of various government spheres and highlight any potential red flags, if such exist.
3. Baseline profiling: Following policy review, primary and secondary data were gathered to
create the socio-economic profile of the delineated zone of influence. The baseline profile
assisted in gaining an understanding of the communities and economic activities to be likely
DOORNHOEK FLUORSPAR PROJECT SOCIO-ECONOMIC IMPACT ASSESSMENT STUDY
Urban Econ Development Economists
11
affected or benefit from the proposed project. This included description of the study area’s
composition and locational factors, economic and labour profiles, way of life of communities
located within the zone of influence, their demographic trends and cultural references, their
health and wellbeing, and their living environment. Specific attention was paid to the socio-
economic composition of the area affected by the project’s footprint and its potential
environmental effects, i.e. visual, noise, air pollution, etc.
4. Impact analysis and evaluation: Derived from the review of the project and the feedback
received from various parties during data collection, a list of various negative and positive socio-
economic impacts that can ensue as a result of the proposed activity during various stages of its
life cycle was drawn up and analysed. All of the identified socio-economic impacts were
assessed and categorised in line with the rating provided by the environmental specialist (refer
to Annexure A).
5. Need and desirability assessment: Given the knowledge of the project and the profile of the
area and the proposed location of the project, the need and desirability of the project from a
locational perspective was investigated. It involved the assessment of the project’s alignment
with the interests and needs of the broader public and the suitability and necessity of the project
considering the chosen time and place.
6. Formulation of mitigation and enhancement measures: Following the analysis and ranking
of impacts, mitigation and enhancement measures, where applicable, were formulated whereby
recommendations to reduce or eliminate the potential negative effects on the affected parties
and enhance positive impacts were provided.
1.4 Data gathering and consultation process
The project made use of both secondary and primary data.
Secondary data gathering
Secondary data was sourced from the following databases and documents:
Previously completed studies such as:
Stats SA Census, 2016
Quantec Research Standardised Regional Data, 2016
Integrated Development Plans (IDP)
o The Revised Ditsobotla LM Integrated Development Plan (IDP) 2015/16 - 2017/18
(2013)
o The Reviewed Ramotshere Moiloa LM Integrated Development Plan (IDP) 2015/2016
Provincial Strategic Documents
o North West Provincial Development Plan (PDP) 2030 (2013)
DOORNHOEK FLUORSPAR PROJECT SOCIO-ECONOMIC IMPACT ASSESSMENT STUDY
Urban Econ Development Economists
12
Primary data gathering
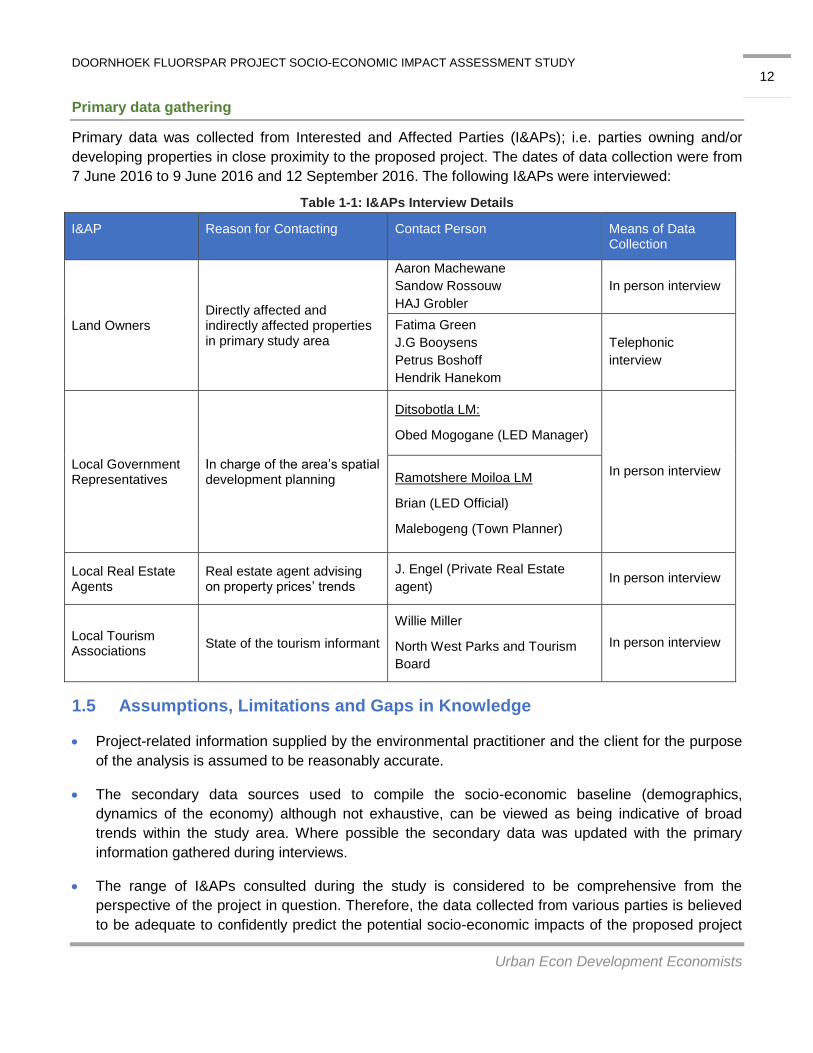
Primary data was collected from Interested and Affected Parties (I&APs); i.e. parties owning and/or
developing properties in close proximity to the proposed project. The dates of data collection were from
7 June 2016 to 9 June 2016 and 12 September 2016. The following I&APs were interviewed:
Table 1-1: I&APs Interview Details
I&AP Reason for Contacting Contact Person Means of Data Collection
Land Owners Directly affected and indirectly affected properties in primary study area
Aaron Machewane
Sandow Rossouw
HAJ Grobler
In person interview
Fatima Green
J.G Booysens
Petrus Boshoff
Hendrik Hanekom
Telephonic
interview
Local Government Representatives
In charge of the area’s spatial development planning
Ditsobotla LM:
Obed Mogogane (LED Manager)
In person interview Ramotshere Moiloa LM
Brian (LED Official)
Malebogeng (Town Planner)
Local Real Estate Agents
Real estate agent advising on property prices’ trends
J. Engel (Private Real Estate
agent) In person interview
Local Tourism Associations
State of the tourism informant
Willie Miller
North West Parks and Tourism
Board
In person interview
1.5 Assumptions, Limitations and Gaps in Knowledge
Project-related information supplied by the environmental practitioner and the client for the purpose
of the analysis is assumed to be reasonably accurate.
The secondary data sources used to compile the socio-economic baseline (demographics,
dynamics of the economy) although not exhaustive, can be viewed as being indicative of broad
trends within the study area. Where possible the secondary data was updated with the primary
information gathered during interviews.
The range of I&APs consulted during the study is considered to be comprehensive from the
perspective of the project in question. Therefore, the data collected from various parties is believed
to be adequate to confidently predict the potential socio-economic impacts of the proposed project
DOORNHOEK FLUORSPAR PROJECT SOCIO-ECONOMIC IMPACT ASSESSMENT STUDY
Urban Econ Development Economists
13
and objectively evaluate their significance. This is under assumption that the information shared by
I&APs during engagements with them was truthful and reflected the position of the families or
organisations they represented. Furthermore, it is assumed that the attitudes of the respondents
towards the project will remain reasonably stable over the short- to medium-term.
Possible impacts as well as stakeholder responses to the identified impacts cannot be predicted
with complete accuracy, even when circumstances are similar and these predictions are based on
research and years of experience, taking the specific set of circumstance into account.
DOORNHOEK FLUORSPAR PROJECT SOCIO-ECONOMIC IMPACT ASSESSMENT STUDY
Urban Econ Development Economists
14
2 POLICY REVIEW
A policy review plays an integral role in the early stages of a project. The review provides a high level
indication of whether a project is aligned with the goals and aspirations of the developmental policy
within a country and at local level. Furthermore, the analysis signposts any red-flag or developmental
concerns that could jeopardise the development of the project and assist in amending it, preventing
costly and unnecessary delays.
The following government strategic documents applicable to the delineated study areas were
examined:
National (South Africa):
o New Growth Path Framework (NGPF) (2010)
o National Development Plan (NDP) 2030 (2011 - 2030)
o Industrial Policy Action Plan (IPAP) 2015/2016-2017/2018
Regional:
o North West Provincial Development Plan (PDP) 2030 (2013)
Local:
o The Revised Ditsobotla LM Integrated Development Plan (IDP) 2015/16 - 2017/18
(2013)
o The Ditsobotla LM Local Economic Development (LED) Strategy (2016)
o The Reviewed Ramotshere Moiloa LM Integrated Development Plan (IDP) 2015/2016
National Policies and Strategic Plans Alignment
From an economic perspective, the proposed project aligns with key national policies and strategies
that identify mining as a crucial economic sector for job creation and economic growth, which are
developmental priorities for the country:
The New Growth Path Framework (NGPF) cites employment
creation as one of the primary tools to stimulate and grow the
national economy and lists six key sectors and activities that have
potential for job creation. These include the mining industry, with a
particular emphasis on mineral beneficiation and on increasing the
rate of minerals extraction.
The National Development Plan (NDP) 2030 is informed by the
New Growth Path and states that 11 million new employment
opportunities must be created to improve the livelihoods of South
Africans and grow the economy. It further states the key means for
achieving the desired growth, including stimulation of private
investment, involvement of labour intensive industries, and
DOORNHOEK FLUORSPAR PROJECT SOCIO-ECONOMIC IMPACT ASSESSMENT STUDY
Urban Econ Development Economists
15
adequate beneficiation of the country’s mineral resources.
The IPAP 2015/2016-2017/2018, in its sectoral focus area cluster,
specified “leveraging SA’s mineral endowments” as being one of
the key interventions for the country in the near future. In addition,
fluorspar is an integral component in numerous products such as
nuclear fuel, thin fill solar cells, lithium batteries, power
transmission, petroleum, refrigerants, pharmaceuticals, smart
chips, etc. Industries associated with the production of the above;
i.e. green energy, white goods and electro-technical, ICT goods, pharmaceuticals, are also the
priority industries for government interventions and for investment.
The Strategic Infrastructure Project (SIP) 4: Unlocking the
economic opportunities in North West Province is one of the
18 SIPs that government developed to fast track development and
growth throughout South Africa. SIP 4 is one of the five geographic
SIPs that were formulated. It aims to accelerate investments in
road, rail, bulk water, treatment and transmission infrastructure;
enable reliable supply and basic service delivery; facilitate the
development of mining, agricultural and tourism activities; and trigger beneficiation opportunities
in the Province. Therefore, the mining and processing of ore to generate acid grade fluorspar
falls directly under this SIP.
A Beneficiation Strategy for the Minerals Industry of South Africa (2011) identified five
mineral commodities that have been prioritised for the advancement through various stages of
value addition. These include energy commodities, iron and steel, pigment and titanium metal
production, autocatalytic converters and diesel particular filters on the basis of Platinum Group
Metals (PGMs), and jewellery fabrication. The strategy proposed a coordinated approach to
stimulate and increase beneficiation activities in the country that among others include the
finalisation of relevant legislative policies and implementation of strategic activities. The
development of fluorspar mineral resources is implied through the exploitation of energy
commodities that South Africa is endowed with, which include uranium and thorium and other
commodities such as fluorspar used in production of nuclear fuel.
Regional Policies Alignment
The North West Provincial Development Plan (PDP) 2030 identifies mining
as one of its two priority economic sectors with a comparative advantage,
together with agriculture. It is envisaged that mining will contribute an
additional 55 000 jobs by 2030, representing about 14% of the Province’s job
creation. For that to happen, the sector must maintain an annual growth rate of
2.5% until 2030.
The PDP acknowledges that downstream production (beneficiation) should be
promoted, but more economic potential exists in backward linkages (e.g.
equipment and chemicals manufacturing). The sector should be sensibly

DOORNHOEK FLUORSPAR PROJECT SOCIO-ECONOMIC IMPACT ASSESSMENT STUDY
Urban Econ Development Economists
16
supported by the Province through investment retention and promotion. However, the Plan also
stresses the necessity to use water efficiently in a province that experiences water scarcity, as well as
to protect the environment and water resources for future use once mining activities have ceased.
Furthermore, it aims to ensure that mining companies deliver more effectively on their socio-economic
development obligations, with a particular focus on local enterprise development and local procurement
of goods and services.
Local Policy Alignment
From a local policy perspective, the proposed project does not appear to contravene any strategy or
plan developed by the Ditsobotla or Ramotshere Moiloa LM’s. It seems to be in line with Key
Performance Area (KPA) 3 “Local Economic Development and Spatial Rationale”, which is one of the
five KPAs set out in the Revised Ditsobotla LM Integrated Development Plan (IDP) for 2015/16 -
2017/18. The main objectives under this KPA include:
Developing “a vibrant, growing economic environment conducive for investment attraction and
retention”; and
Creating “an enabling environment for job creation and businesses to thrive”.
The same applies to the Reviewed Ramotshere Moiloa LM Integrated Development Plan (IDP)
2015/2016, where the proposed project is in line with the Fourth Key Performance Area outlined in the
IDP. KPA 4 pertains to Local Economic Development and states the importance of transforming the
local economy to create decent work and sustainable livelihoods for all that live in the local municipality
(Ramotshere Moiloa LM, 2015/2016).
The Ditsobotla LM Local Economic Development (LED) Strategy of 2016 identifies mining as one of
the three most important sectors within the LM, as well as agriculture and tourism; and untapped
mineral resources/deposits as one of the key opportunities for the growth of this sector (Ditsobotla LM,
2016). The potential projects listed under this opportunity include:
An investigation to identify untapped resources
The promotion of mineral deposits to potential investors
Skills development and training
The facilitation of financial and funding support for small-scale mining activities
The establishment of one or more small mining operations within a cluster of small and larger
operations that could co-operate in the utilisation of concentrators
Possibly smelting and refining plant in the Lichtenburg area
The assessment of slate mining potential.
Where the project is planned to be developed, namely within ward 14, the following activities have been
identified by communities (Ditsobotla LM, 2016):
Flagship projects in the Welverdient Carlisonia area include diamond, manganese mining and
services
In the Bakerville area: Food services, diamond mining, crop farming(vegetable), artisans,
garden services, piggery, goat, and cattle farming, sewing, sport and recreation, recycling
Flagship projects in the Rietvlei area include: slate mine, road making and house construction
Flagship projects in the Grasfontein area include: diamond, manganese mining and farming
DOORNHOEK FLUORSPAR PROJECT SOCIO-ECONOMIC IMPACT ASSESSMENT STUDY
Urban Econ Development Economists
17
Flagship projects in the Bakerville area include diamond mining, recycling and farming
The planned projects in Ramotshere Moiloa LM,Ward 19 are (Ramotshere Moiloa LM, 2015/2016):
The intensification of Revenue Collection and strict implementation of the Credit Control Policy
at Groot Marico and Lehurutse Town
The establishment of new sites for cemeteries for Groot Marico and Zeerust
Bulk water Infrastructure and Internal Reticulation
Paving all roads which connects different villages
Paving of Internal Roads and maintaining existing ones
Electricity Connections and High Mast Lights
Construction of Community Facilities
Conclusion
The proposed project appears to be in line with the policies and strategies formulated at the national,
provincial and local levels. The development of mining activities, while protecting the environment and
water resources, is seen as an opportunity for the further development of the North West Province, the
Ditsobotla LM, and the Ramotshere Moiloa LM. However, agriculture and tourism are two other
important activities for economic growth in the study area. Therefore, care should be taken when
developing the project to ensure that it is not established to the detriment of the other key economic
sectors in the area.
No Spatial Development Frameworks for the North West, the Ngaka Modiri Molema DM, the
Ramotshere Moiloa LM or the Ditsobotla LM were available during the compilation of the report.
Therefore, it was not possible to determine whether the project is in line with the spatial visions of these
administrative units or whether it may contradict them. Having said this, no contradictions with the
spatial planning of the municipalities were identified during the interviews with the local authorities.
DOORNHOEK FLUORSPAR PROJECT SOCIO-ECONOMIC IMPACT ASSESSMENT STUDY
Urban Econ Development Economists
18
3 BASELINE INFORMATION
This chapter examines key socio-economic characteristics of the study area, as per delineation
provided in the previous chapter. This is essential as it provides both qualitative and quantitative data
related to the communities and economies under observation, creating a baseline against which the
impacts can be assessed.
The specific focus of the socio-economic profile is on the Ditsobotla LM, as well as the towns of
Lichtenburg and Zeerust in the Ramotshere Moiloa LM.
Study Area’s Composition and Locational Factors 3.1
The major towns situated in close proximity to the site include:
Zeerust (Ramotshere Moiloa LM): Originally a farm, the town was established in 1867. Mixed
farming and the mining of lead and chrome constitute the backbone of the town’s economy. Due
to its location on the N4 highway, en route to Botswana, tourism is a growing industry in the
town and the surrounding area. Attractions in the town and around include Kleinfontein
Memorial, Kaditshwene Village Ruins, the Zeerust Museum, Marula Kop (an Iron Age
settlement 50km north of Zeerust), and the Madikwe Game Reserve (90km north of Zeerust)
(SA Venues, 2016).
Lichtenburg (Ditsobotla LM): The town emerged in 1873, but it was the discovery of diamonds
that propelled its expansion in the late 1920s. It is predominantly a farming town with maize,
groundnut and sunflower seed farms surrounding the area (SA Venues, 2016).
The smaller settlements that are in close proximity to the site are:
Dinkana
Lehurutse
Ntsheweletsoko
Lenig River
Kruisrivier (closest to site)
These areas have a total population of 57500.
The following points of interest are situated within a 50km-radius from the proposed project sites:
The Molemane Nature Reserve (adjacent to the mining right area) includes a dam and an old
mill at its centre.
Mafikeng Game Reserve (about 40km west of the mining right area) is one of the major
breeding parks for white rhinos in South Africa. It is also located on a malaria-free zone.
The Lichtenburg Game Breeding Centre (about 50km south of the mining right area) is a
6 000-hectare reserve, which aims to further the breeding programmes of endangered species
already in place by the National Zoo, and to supplement the populations of local and
international zoos.
Wondergat (about 30km west of the mining right area) is a 70-metre cave diving spot.
Marico Oog (about 40km to the east) is an inland diving site.
The Groot-Marico mountains and river.

DOORNHOEK FLUORSPAR PROJECT SOCIO-ECONOMIC IMPACT ASSESSMENT STUDY
Urban Econ Development Economists
19
As indicated on Map 3-1, the area is relatively well-connected.
Map 3-1: Road networks in the study area
There are two national roads situated in close proximity to the project site (i.e. the N4 and the N18),
connecting it with the Gauteng Province to the east, Botswana to the north-west, and the Northern
Cape to the south-east. The other important roads present in the area, which link the Ditsobotla LM and
the Ramotshere Moiloa LM with surrounding municipalities, include:
Road 52 from Koster to Lichtenburg, and further westwards from Lichtenburg to Mafikeng
(R503). High traffic volumes are observed on this road.
Road 503 linking Lichtenburg with Coligny and ultimately Klerksdorp.
The R505 traversing the municipality and connecting Lichtenburg with Ottoshoop to the north
and Wesselsbron (situated in the Free State) to the south.
Road 49 connecting Zeerust with Botswana to the north, and with Mahikeng in a south-western
direction. It then becomes the N18, which goes to Kimberley.
Existing mining and quarrying activities, that are in line with the proposed project, can be observed in
the Ditsobotla LM and the Ramotshere Moiloa LM. There are various mining and quarrying activities
that particularly impact on both of the LMs. These consist of:
The limestone quarry of AfriSam around Dudfield
The quarrying activities of Lafarge between Bodibe and Springbokpan
The quarry areas of Lafarge near Lichtenburg
DOORNHOEK FLUORSPAR PROJECT SOCIO-ECONOMIC IMPACT ASSESSMENT STUDY
Urban Econ Development Economists
20
The mining of diamonds in the north-western parts of the Ditsobotla LM municipality (i.e.,
Bakerville, Grasfontein and Welverdiend), many of which have been abandoned without proper
rehabilitation
The state quarries in the northern part of the Ditsobotla LM
Witkop Fluorspar mine near Zeerust (not active)
Regarding agriculture activities, commercial farming is predominant in both LMs. These comprise of
commercial dry-land and irrigated agricultural activities in the southern part of the Ditsobotla LM and
more extensive farming in the areas situated north-east and north-west of Lichtenburg (Ditsobotla LM,
2015). Farming activities in the Ramotshere Moiloa LM are predominantly subsistent/small-scale
activities and are slowly moving away from crop irrigation to more exotic wildlife and game hunting
activities. This can be attributed to the severe shortage of water within the LM.
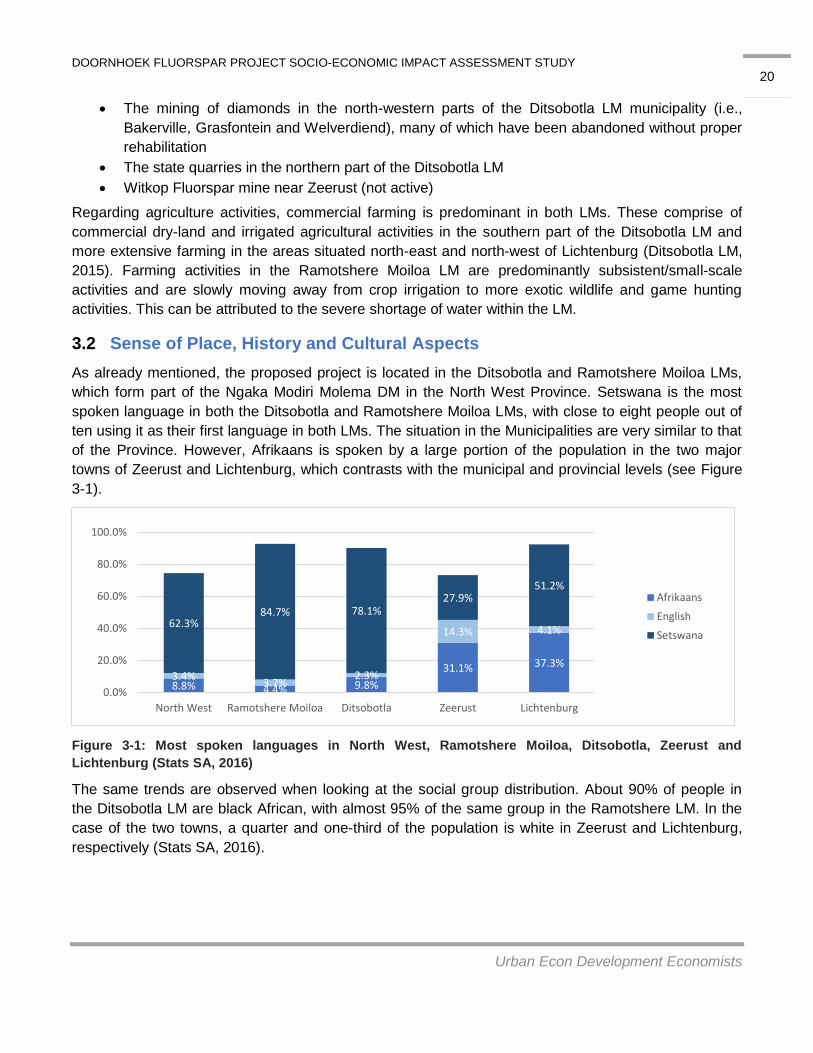
Sense of Place, History and Cultural Aspects 3.2
As already mentioned, the proposed project is located in the Ditsobotla and Ramotshere Moiloa LMs,
which form part of the Ngaka Modiri Molema DM in the North West Province. Setswana is the most
spoken language in both the Ditsobotla and Ramotshere Moiloa LMs, with close to eight people out of
ten using it as their first language in both LMs. The situation in the Municipalities are very similar to that
of the Province. However, Afrikaans is spoken by a large portion of the population in the two major
towns of Zeerust and Lichtenburg, which contrasts with the municipal and provincial levels (see Figure
3-1).
Figure 3-1: Most spoken languages in North West, Ramotshere Moiloa, Ditsobotla, Zeerust and
Lichtenburg (Stats SA, 2016)
The same trends are observed when looking at the social group distribution. About 90% of people in
the Ditsobotla LM are black African, with almost 95% of the same group in the Ramotshere LM. In the
case of the two towns, a quarter and one-third of the population is white in Zeerust and Lichtenburg,
respectively (Stats SA, 2016).
8.8% 4.4% 9.8%
31.1% 37.3% 3.4%
3.7% 2.3%
14.3% 4.1% 62.3%
84.7% 78.1% 27.9%
51.2%
0.0%
20.0%
40.0%
60.0%
80.0%
100.0%
North West Ramotshere Moiloa Ditsobotla Zeerust Lichtenburg
Afrikaans
English
Setswana

DOORNHOEK FLUORSPAR PROJECT SOCIO-ECONOMIC IMPACT ASSESSMENT STUDY
Urban Econ Development Economists
21
Demographic Profile 3.3
The population in the Ditsobotla LM reached 168 904 people across 44 501 households in 2011,
which represented a growth of 14.4% compared to the population of 147 616 in 2001. Over half of the
population in the municipality live in urban areas (52.3%); the rest include 24.1% of people who live in
tribal or traditional areas, and 23.5% of people who live on a farm (Stats SA, 2016).
The population of the Ramotshere Moiloa LM reached 150 714 people in 2011 across 40 740
households in the same year. This in turn, represents a 7.3% absolute growth from 2001, which is half
that of the Ditsobotla LM growth. Nearly 80% of the households in the LM are living in a brick or
concrete formal dwelling with its own stand. This is followed by nearly 9% of households living in
informal dwellings, and almost 4% of households living in traditional dwellings (Stats SA, 2016).
As can be seen in Table 3-1, the population density in the municipality is lower than the provincial and
district levels.
Table 3-1: Population Growth and Density Indicators
Location Area (km2) Population (2011) Population
density per km2 Population growth
(2001-2011)
North West 104 881,7 3 509 950 33,5 17,7%
Ngaka Modiri Molema 28 206,1 842 702 29,9 10,2%
Ramotshere Moiloa LM 7 193,9 150 714 21,0 7,3%
Ditsobotla LM 6 464,9 168 904 26,1 14,4%
Lichtenburg 108,9 26 337 241,9 118,5%
Zeerust 57,1 9 093 159,3 N/A
(Stats SA, 2016)
The Ditsobotla LM’s population is very young, with 66.2% of people being less than 35 years old. The
same can be said for the Ramotshere Moiloa LM, with just over 70% of the population being younger
than 35 years old. This is on par with national figures, i.e. 66.7% of South Africans are less than 35
years old.
The youth (aged 15-34) make up the majority of the people living in both Ditsobotla and Ramotshere
Moiloa with 33,7% and 32,1% of the population falling in said age group, respectively. This is followed
by the group between the ages of 35 and 64, which accounts for 28.4% of Ditsobotla LM and 27.6% of
Ramotshere Moiloa LM’s population.
Considering the working age group that is between the ages of 15 and 64, the study area has a slightly
bigger percentage of working age males than females in the Ditsobotla LM, while the opposite is true
for the Ramotshere Moiloa LM. The population in the area is characterised by a relatively high
dependency ratio, with 38.1% for Ditsobotla and 40.1% for the Ramotshere Moiloa LM, compared to
the national and provincial averages of 34.8% and 35.3%, respectively. This includes 32.6% and 32.8%
of the population within the ages of 0 to 14, and 5.5% and 7.5% of the population who is over 65 years
old for the Ditsobotla LM and the Ramotshere Moiloa LM, respectively (Stats SA, 2016).
The Ditsobotla LM had a reported 19 710 individuals who were HIV positive in 2015, which equates to
12.1% of the total LM’s population. The Ramotshere Moiloa LM in turn, noted 19 759 individuals living
DOORNHOEK FLUORSPAR PROJECT SOCIO-ECONOMIC IMPACT ASSESSMENT STUDY
Urban Econ Development Economists
22
with the virus, which equates to 11.9% of the LM’s population. These percentages are on par with
national and provincial levels of 11.3% and 12,7%, respectively.
Total AIDS-related deaths equated to 699 and 708 individuals for the respective LMs, or 0.4% of the
LM population for both LMs. This is higher than the national and provincial averages of 0.3% and 0.2%,
respectively. The AIDS-related deaths in the Ditsobotla LM equated to 36.4% of total deaths in the LM,
with the Ramotshere Moiloa LM following close behind with 30.8% of total LM’s deaths.
Considering the above information, it can be suggested that the health-related situation in Ditsobotla is
slightly worse than that in the Ramotshere Moiloa LM. This situation is worsened by the fact that there
are no clinics or centres targeting the treatment of HIV/AIDS in either of the municipalities. Based on
the information sourced from the interviews, one clinic existed in Ramotshere Moiloa LM, but had to
close down.
The crime situation also appears to be considerably worse in Ditsobotla than in Ramotshere Moiloa. In
2015, 4 662 cases of serious crimes were recorded in the Ditsobotla LM and almost half of that in the
Ramotshere Moiloa LM, although the population in these municipalities differed only slightly.
Assault with the intent to inflict grievous bodily harm was the most common reported crime in both LMs
with 764 cases for Ditsobotla LM and 347 cases for the Ramotshere Moiloa LM. This is followed by
theft, burglary and motor vehicle theft. The third most prevalent crime is burglary at residential
premises. The discussion with the local authorities also revealed that there is a mass theft of copper
cables in the area with over 150 cases per year. Consequently, a number of landlines do not operate.
This crime is prevalent beyond the local level and perpetrators operate at a national level.
Drugs and alcohol abuse also appear to be a notable social ill in the areas and a direct contributor to
crime in the area. This was particularly an acute problem in Ditsobotla, where about 7.3% of all
reported crime cases were linked to drugs. To address this problem, the District Municipality seeks to
develop youth centres to educate the youth in the district about the dangers of alcohol abuse.
Economy 3.4
In 2013, the Ditsobotla economy was valued at R8 014.3 million in current prices (Quantec, 2016). It
contributed 26.2% to the District’s economy and 4.07% to the economy of the North West Province,
which in turn, accounted for 6.5% of the national economy. The Ditsobotla economy relies heavily on
the tertiary sector, with 76.8% contribution towards the local GDP, followed by 15.1% and 8.1% by the
secondary and tertiary sectors, respectively. This contrasts with the provincial level, where the tertiary
sector represents 57.7% of the economy and the secondary sector accounts for a third of it. The
biggest contributors to the Ditsobotla LM’s economy (46.4%) are the sectors of “wholesale and retail
trade, catering and accommodation” and “finance, insurance, real estate and business services” (refer
Table 3-2). Two of the main economic drivers in the LM are agriculture and manufacturing hence
Clover and PPC are the largest secondary sector employers in the municipality. A large number of the
farming activities are crop/irrigation farming; however, some irrigation farmers have shifted in the type
of crop farming to sun and drought resistant crops such as sunflowers or wildlife farming activities.
In 2013, the Ramotshere Moiloa economy was valued at R3 698.3 million in current prices (Quantec,
2016). The LM contributed 5.1% and 1,4% to the DM and provincial economies, while adding 0,1% to
DOORNHOEK FLUORSPAR PROJECT SOCIO-ECONOMIC IMPACT ASSESSMENT STUDY
Urban Econ Development Economists
23
national GDP. The Ramotshere Moiloa LM economy relies heavily on the tertiary sector with 82.7% of
GDP generated by this sector. This is followed by the secondary and primary sector contributing 11.2%
and 6.1%, respectively. The biggest contributing sector in the LM were that of wholesale and retail
trade (32%), general government (20.3%), and finance and business services (14.7%). Two of the key
economic drivers in the LM are agriculture and more recently tourism, which can be attributed to the
larger number of game farms in the area. The main sectoral differences between the two identified LMs
is that of the General government sector which is significantly smaller in the Ditsobotla LM than in the
Ramotshere Moiloa LM.
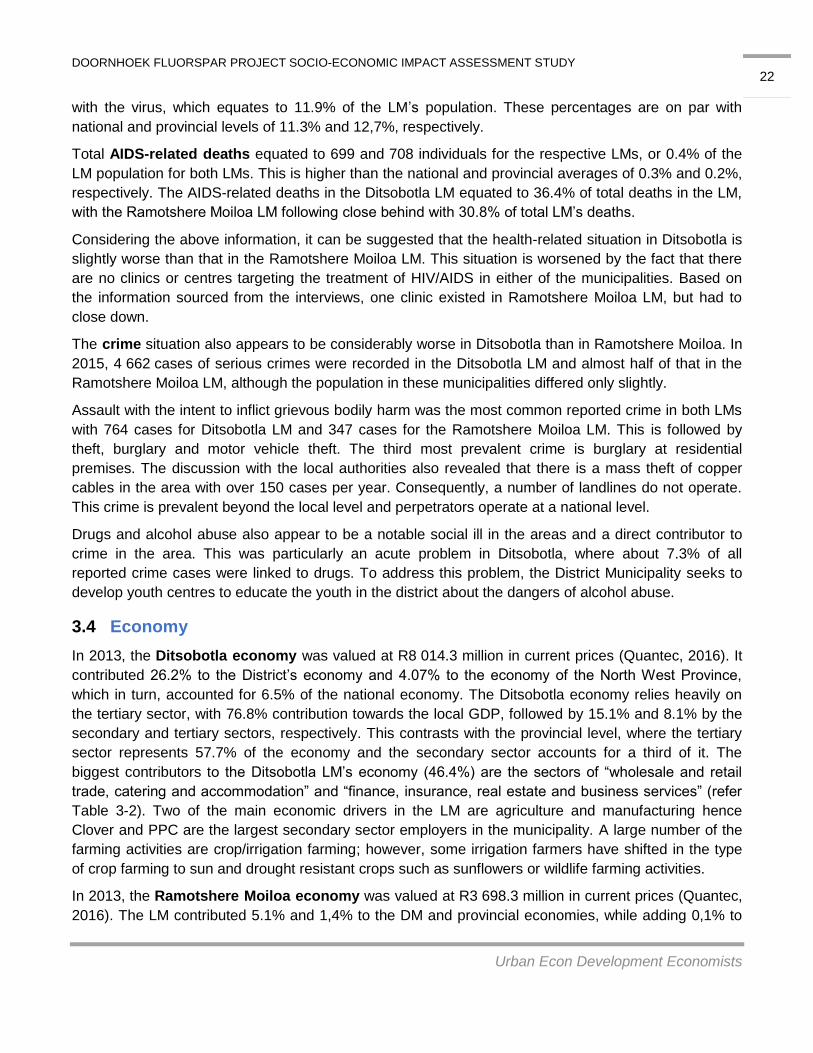
Table 3-2: Structure and composition of the Ramotshere Moiloa and Ditsobotla LM’s economies
Economic Sector
Ramotshere Moiloa LM (GDP in 2013 prices)
Ditsobotla LM (GDP in 2013 prices)
GDP (R'ml)
% of GDP
CAGR (2003 - 2013)
GDP (R'ml)
% of GDP CAGR (2003 - 2013)
Agriculture 69,5 1,8% 2,4% 556,5 6,9% 3,3%
Mining and quarrying 154,2 4,2% -7,0% 96,4 1,2% -8,5%
Manufacturing 152,9 4,1% -4,4% 764,2 9,5% 5,0%
Electricity, gas and water 185,4 5,0% 8,4% 159,7 2,0% 2,1%
Construction 77,2 2,1% 5,9% 284,1 3,5% 7,7%
Trade 1 183,5 32,0% 4,1% 1 906,5 23,8% 6,6%
Transport and communication 175,3 4,7% 6,7% 641,8 8,0% 1,0%
Finance and business services 542,2 14.7% -1,2% 1 814,6 22,6% 8,6%
Personal services 405,9 11,0% 5,7% 758,0 9,5% 3,7%
General government 751,7 20,3% 0,2% 1 032,5 12,9% 4,3%
TOTAL 3 698,3 100.0% -0,4% 8 014,3 100,0% 5,1% (Quantec, 2016)
Over a ten-year period between 2003 and 2013, the Ditsobotla LM’s economy grew at a Compounded
Average Growth Rate (CAGR) of 5.1% per year, which is significantly higher than th Province’s CAGR
of 2.2%. This growth can be attributed to the sustained growth in the manufacturing and finance and
business services sector, which grew at CAGR of 5% and 8.6%, respectively. At the same time, the
mining sector recorded an important recession, with a negative CAGR of 8.5% (refer to Table 3-2Error!
Reference source not found.). The mining sector also experienced a decline at the provincial level,
but to a much lesser extent (negative CAGR of 1.2%).
Over the same period, the Ramotshere Moiloa LM’s economy declined by a CAGR of -0.4%, which can
be attributed to the sharp declines in the mining, manufacturing and finance and business services
sectors. These sectors declined by 7,0%, 4,4% and 1,2%, respectively. The decline in the mining sector
is again far greater than that of the Province.
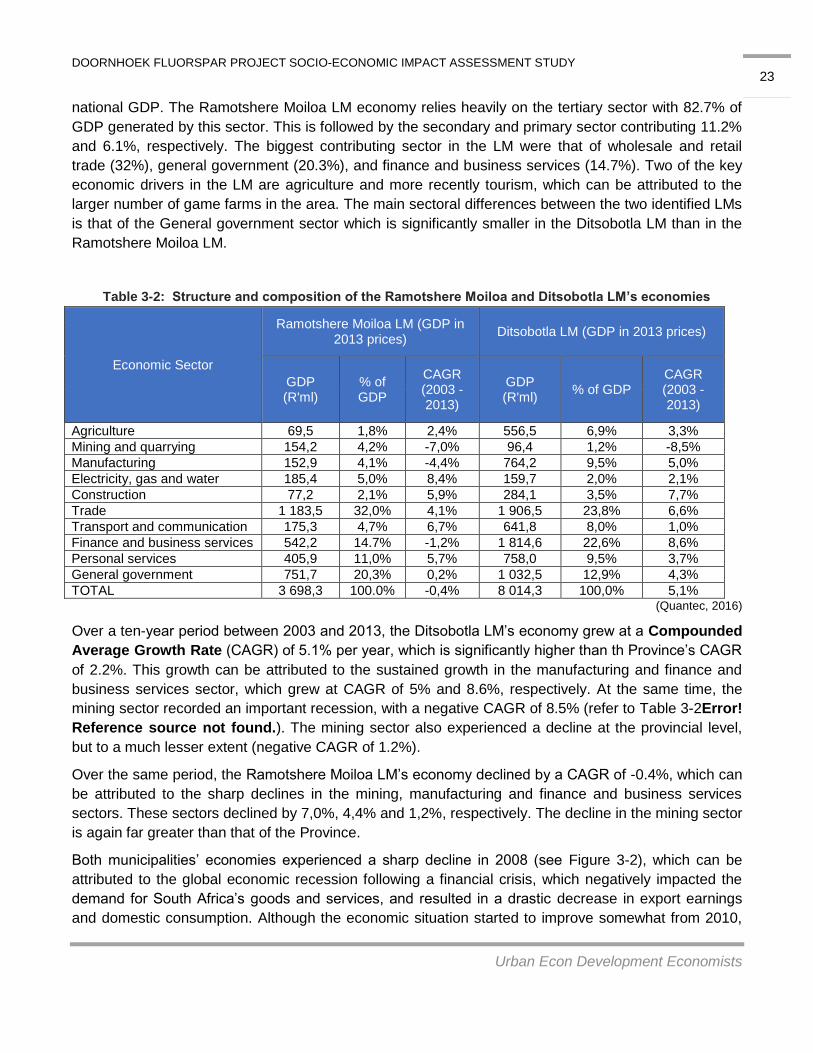
Both municipalities’ economies experienced a sharp decline in 2008 (see Figure 3-2), which can be
attributed to the global economic recession following a financial crisis, which negatively impacted the
demand for South Africa’s goods and services, and resulted in a drastic decrease in export earnings
and domestic consumption. Although the economic situation started to improve somewhat from 2010,
DOORNHOEK FLUORSPAR PROJECT SOCIO-ECONOMIC IMPACT ASSESSMENT STUDY
Urban Econ Development Economists
24
the prognosis for faster recovery was not realised, and it was clear that the recession had a far greater
impact than what was originally perceived. As a result, the national economy showed poor performance
after the 2009 recession and it is clear that despite a growth spike in 2012; Ditsobotla’s economy could
not recover in full after that time either. The Ramotshere Moiloa LM staged a growth recovery in early
2010, but began to slow down after 2012. The drought experienced earlier in the year is expected to
further negatively impact on the economies’ growth trajectories, for both local municipalities but more
so in the Ditsobotla LM.
Figure 3-2: Growth rates for South Africa, the North West Province, Ramotshere Moiloa LM and Ditsobotla
LM (Quantec, 2016)
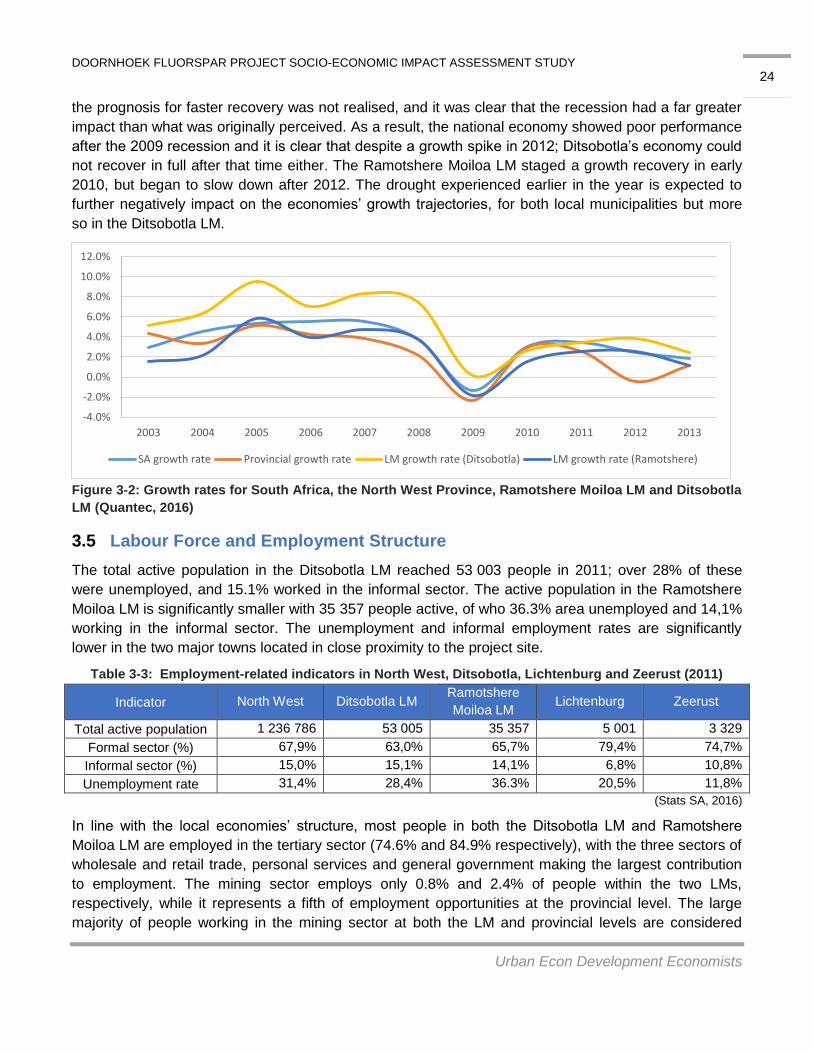
Labour Force and Employment Structure 3.5
The total active population in the Ditsobotla LM reached 53 003 people in 2011; over 28% of these
were unemployed, and 15.1% worked in the informal sector. The active population in the Ramotshere
Moiloa LM is significantly smaller with 35 357 people active, of who 36.3% area unemployed and 14,1%
working in the informal sector. The unemployment and informal employment rates are significantly
lower in the two major towns located in close proximity to the project site.
Table 3-3: Employment-related indicators in North West, Ditsobotla, Lichtenburg and Zeerust (2011)
Indicator North West Ditsobotla LM Ramotshere
Moiloa LM Lichtenburg Zeerust
Total active population 1 236 786 53 005 35 357 5 001 3 329
Formal sector (%) 67,9% 63,0% 65,7% 79,4% 74,7%
Informal sector (%) 15,0% 15,1% 14,1% 6,8% 10,8%
Unemployment rate 31,4% 28,4% 36.3% 20,5% 11,8%
(Stats SA, 2016)
In line with the local economies’ structure, most people in both the Ditsobotla LM and Ramotshere
Moiloa LM are employed in the tertiary sector (74.6% and 84.9% respectively), with the three sectors of
wholesale and retail trade, personal services and general government making the largest contribution
to employment. The mining sector employs only 0.8% and 2.4% of people within the two LMs,
respectively, while it represents a fifth of employment opportunities at the provincial level. The large
majority of people working in the mining sector at both the LM and provincial levels are considered
-4.0%
-2.0%
0.0%
2.0%
4.0%
6.0%
8.0%
10.0%
12.0%
2003 2004 2005 2006 2007 2008 2009 2010 2011 2012 2013
SA growth rate Provincial growth rate LM growth rate (Ditsobotla) LM growth rate (Ramotshere)
DOORNHOEK FLUORSPAR PROJECT SOCIO-ECONOMIC IMPACT ASSESSMENT STUDY
Urban Econ Development Economists
25
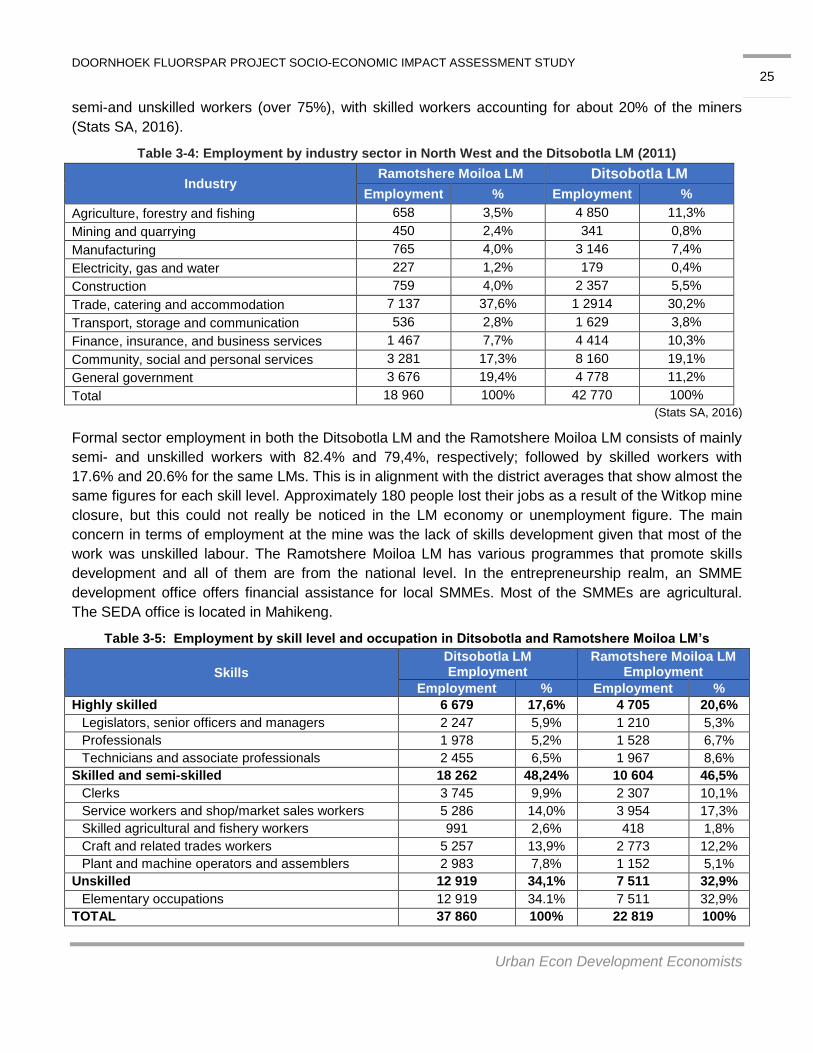
semi-and unskilled workers (over 75%), with skilled workers accounting for about 20% of the miners
(Stats SA, 2016).
Table 3-4: Employment by industry sector in North West and the Ditsobotla LM (2011)
Industry Ramotshere Moiloa LM Ditsobotla LM
Employment % Employment %
Agriculture, forestry and fishing 658 3,5% 4 850 11,3%
Mining and quarrying 450 2,4% 341 0,8%
Manufacturing 765 4,0% 3 146 7,4%
Electricity, gas and water 227 1,2% 179 0,4%
Construction 759 4,0% 2 357 5,5%
Trade, catering and accommodation 7 137 37,6% 1 2914 30,2%
Transport, storage and communication 536 2,8% 1 629 3,8%
Finance, insurance, and business services 1 467 7,7% 4 414 10,3%
Community, social and personal services 3 281 17,3% 8 160 19,1%
General government 3 676 19,4% 4 778 11,2%
Total 18 960 100% 42 770 100%
(Stats SA, 2016)
Formal sector employment in both the Ditsobotla LM and the Ramotshere Moiloa LM consists of mainly
semi- and unskilled workers with 82.4% and 79,4%, respectively; followed by skilled workers with
17.6% and 20.6% for the same LMs. This is in alignment with the district averages that show almost the
same figures for each skill level. Approximately 180 people lost their jobs as a result of the Witkop mine
closure, but this could not really be noticed in the LM economy or unemployment figure. The main
concern in terms of employment at the mine was the lack of skills development given that most of the
work was unskilled labour. The Ramotshere Moiloa LM has various programmes that promote skills
development and all of them are from the national level. In the entrepreneurship realm, an SMME
development office offers financial assistance for local SMMEs. Most of the SMMEs are agricultural.
The SEDA office is located in Mahikeng.
Table 3-5: Employment by skill level and occupation in Ditsobotla and Ramotshere Moiloa LM’s
Skills
Ditsobotla LM Employment
Ramotshere Moiloa LM Employment
Employment % Employment %
Highly skilled 6 679 17,6% 4 705 20,6%
Legislators, senior officers and managers 2 247 5,9% 1 210 5,3%
Professionals 1 978 5,2% 1 528 6,7%
Technicians and associate professionals 2 455 6,5% 1 967 8,6%
Skilled and semi-skilled 18 262 48,24% 10 604 46,5%
Clerks 3 745 9,9% 2 307 10,1%
Service workers and shop/market sales workers 5 286 14,0% 3 954 17,3%
Skilled agricultural and fishery workers 991 2,6% 418 1,8%
Craft and related trades workers 5 257 13,9% 2 773 12,2%
Plant and machine operators and assemblers 2 983 7,8% 1 152 5,1%
Unskilled 12 919 34,1% 7 511 32,9%
Elementary occupations 12 919 34.1% 7 511 32,9%
TOTAL 37 860 100% 22 819 100%
DOORNHOEK FLUORSPAR PROJECT SOCIO-ECONOMIC IMPACT ASSESSMENT STUDY
Urban Econ Development Economists
26
(Stats SA, 2016)
The above indicates that elementary occupations represent the biggest single group of skills observed
in both of the municipalities, which is in line with the formal employment and economic profile of the
area requiring labourers in the agriculture, mining and wholesale trade industries. Service workers and
shop sales workers, as well as craft and related trade workers represent the second and the third
largest group of formal occupation in both LMs. This again fits the profile of the local economy, where
the former is largely engaged in the trade and personal services sector, while the latter is involved in
the agricultural and mining industries. There is a shortage of employment opportunities that requires
highly skilled individuals in the LM. This results in the disregard for further studies or skills development
in the Ramotshere Moiloa LM. Management skills are in abundance in the LM but the economy cannot
absorb these skills.
Income 3.6
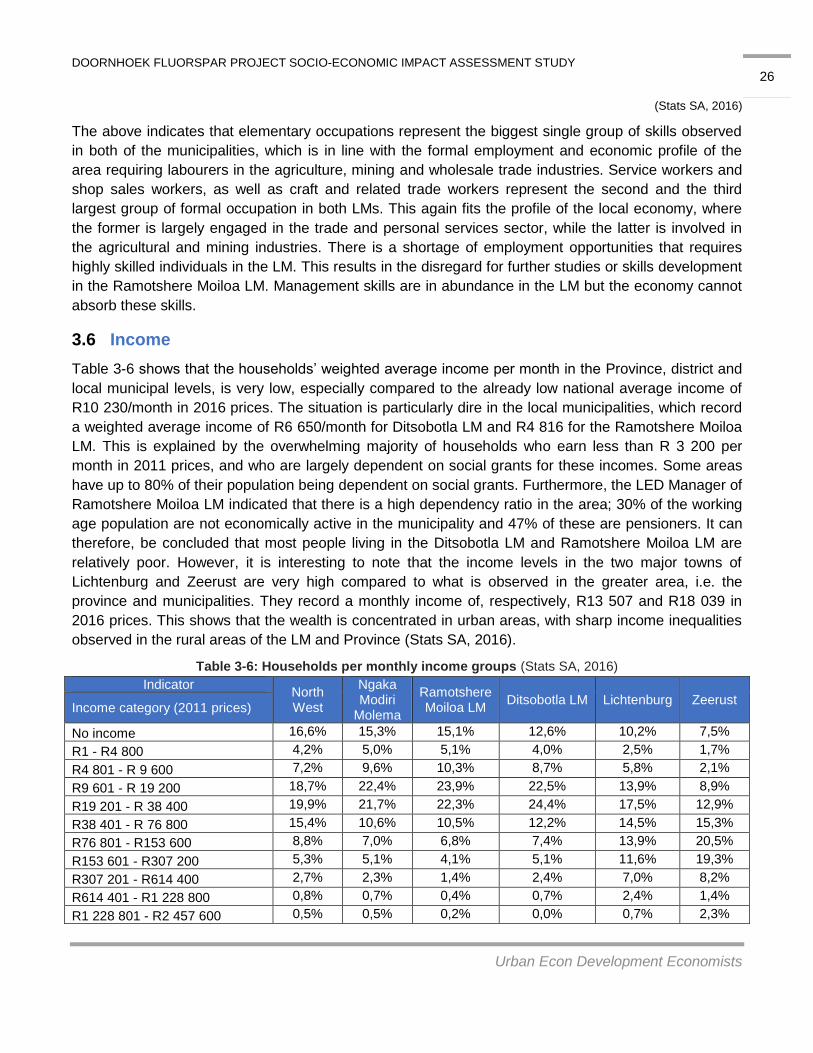
Table 3-6 shows that the households’ weighted average income per month in the Province, district and
local municipal levels, is very low, especially compared to the already low national average income of
R10 230/month in 2016 prices. The situation is particularly dire in the local municipalities, which record
a weighted average income of R6 650/month for Ditsobotla LM and R4 816 for the Ramotshere Moiloa
LM. This is explained by the overwhelming majority of households who earn less than R 3 200 per
month in 2011 prices, and who are largely dependent on social grants for these incomes. Some areas
have up to 80% of their population being dependent on social grants. Furthermore, the LED Manager of
Ramotshere Moiloa LM indicated that there is a high dependency ratio in the area; 30% of the working
age population are not economically active in the municipality and 47% of these are pensioners. It can
therefore, be concluded that most people living in the Ditsobotla LM and Ramotshere Moiloa LM are
relatively poor. However, it is interesting to note that the income levels in the two major towns of
Lichtenburg and Zeerust are very high compared to what is observed in the greater area, i.e. the
province and municipalities. They record a monthly income of, respectively, R13 507 and R18 039 in
2016 prices. This shows that the wealth is concentrated in urban areas, with sharp income inequalities
observed in the rural areas of the LM and Province (Stats SA, 2016).
Table 3-6: Households per monthly income groups (Stats SA, 2016)
Indicator North West
Ngaka Modiri
Molema
Ramotshere Moiloa LM
Ditsobotla LM Lichtenburg Zeerust Income category (2011 prices)
No income 16,6% 15,3% 15,1% 12,6% 10,2% 7,5%
R1 - R4 800 4,2% 5,0% 5,1% 4,0% 2,5% 1,7%
R4 801 - R 9 600 7,2% 9,6% 10,3% 8,7% 5,8% 2,1%
R9 601 - R 19 200 18,7% 22,4% 23,9% 22,5% 13,9% 8,9%
R19 201 - R 38 400 19,9% 21,7% 22,3% 24,4% 17,5% 12,9%
R38 401 - R 76 800 15,4% 10,6% 10,5% 12,2% 14,5% 15,3%
R76 801 - R153 600 8,8% 7,0% 6,8% 7,4% 13,9% 20,5%
R153 601 - R307 200 5,3% 5,1% 4,1% 5,1% 11,6% 19,3%
R307 201 - R614 400 2,7% 2,3% 1,4% 2,4% 7,0% 8,2%
R614 401 - R1 228 800 0,8% 0,7% 0,4% 0,7% 2,4% 1,4%
R1 228 801 - R2 457 600 0,5% 0,5% 0,2% 0,0% 0,7% 2,3%
DOORNHOEK FLUORSPAR PROJECT SOCIO-ECONOMIC IMPACT ASSESSMENT STUDY
Urban Econ Development Economists
27
Indicator North West
Ngaka Modiri
Molema
Ramotshere Moiloa LM
Ditsobotla LM Lichtenburg Zeerust Income category (2011 prices)
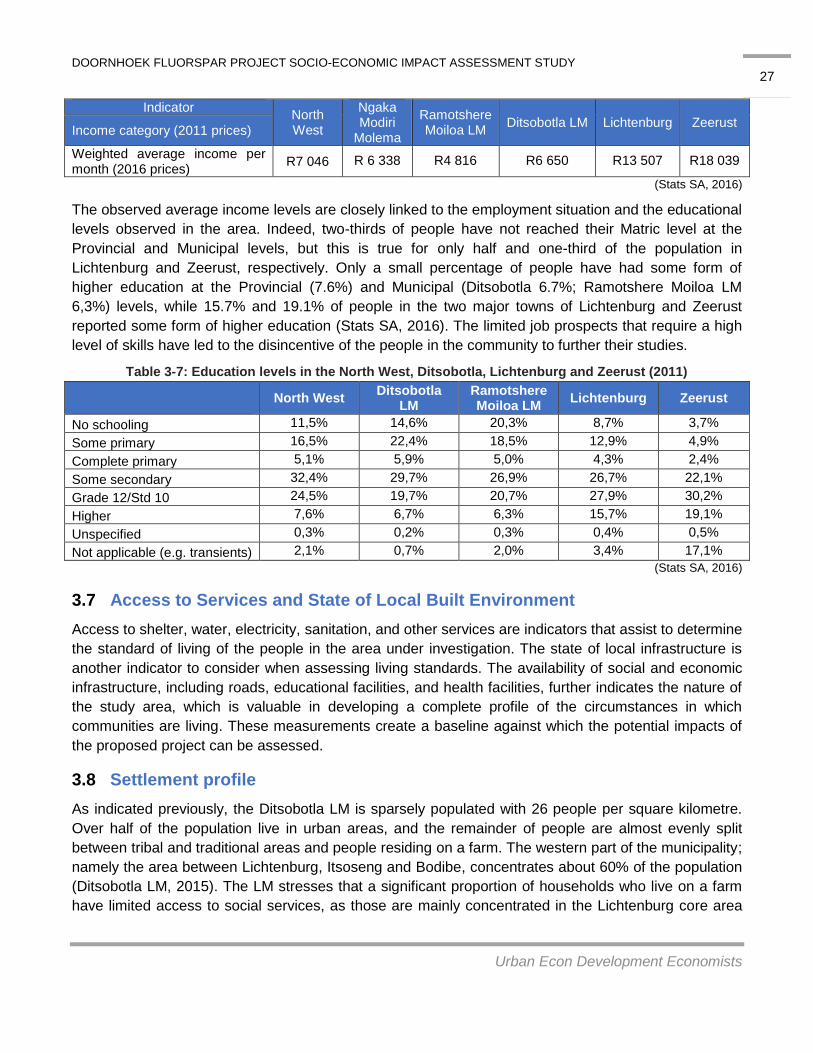
Weighted average income per month (2016 prices)
R7 046 R 6 338 R4 816 R6 650 R13 507 R18 039
(Stats SA, 2016)
The observed average income levels are closely linked to the employment situation and the educational
levels observed in the area. Indeed, two-thirds of people have not reached their Matric level at the
Provincial and Municipal levels, but this is true for only half and one-third of the population in
Lichtenburg and Zeerust, respectively. Only a small percentage of people have had some form of
higher education at the Provincial (7.6%) and Municipal (Ditsobotla 6.7%; Ramotshere Moiloa LM
6,3%) levels, while 15.7% and 19.1% of people in the two major towns of Lichtenburg and Zeerust
reported some form of higher education (Stats SA, 2016). The limited job prospects that require a high
level of skills have led to the disincentive of the people in the community to further their studies.
Table 3-7: Education levels in the North West, Ditsobotla, Lichtenburg and Zeerust (2011)
North West
Ditsobotla LM
Ramotshere Moiloa LM
Lichtenburg Zeerust
No schooling 11,5% 14,6% 20,3% 8,7% 3,7%
Some primary 16,5% 22,4% 18,5% 12,9% 4,9%
Complete primary 5,1% 5,9% 5,0% 4,3% 2,4%
Some secondary 32,4% 29,7% 26,9% 26,7% 22,1%
Grade 12/Std 10 24,5% 19,7% 20,7% 27,9% 30,2%
Higher 7,6% 6,7% 6,3% 15,7% 19,1%
Unspecified 0,3% 0,2% 0,3% 0,4% 0,5%
Not applicable (e.g. transients) 2,1% 0,7% 2,0% 3,4% 17,1%
(Stats SA, 2016)
Access to Services and State of Local Built Environment 3.7
Access to shelter, water, electricity, sanitation, and other services are indicators that assist to determine
the standard of living of the people in the area under investigation. The state of local infrastructure is
another indicator to consider when assessing living standards. The availability of social and economic
infrastructure, including roads, educational facilities, and health facilities, further indicates the nature of
the study area, which is valuable in developing a complete profile of the circumstances in which
communities are living. These measurements create a baseline against which the potential impacts of
the proposed project can be assessed.
Settlement profile 3.8
As indicated previously, the Ditsobotla LM is sparsely populated with 26 people per square kilometre.
Over half of the population live in urban areas, and the remainder of people are almost evenly split
between tribal and traditional areas and people residing on a farm. The western part of the municipality;
namely the area between Lichtenburg, Itsoseng and Bodibe, concentrates about 60% of the population
(Ditsobotla LM, 2015). The LM stresses that a significant proportion of households who live on a farm
have limited access to social services, as those are mainly concentrated in the Lichtenburg core area
DOORNHOEK FLUORSPAR PROJECT SOCIO-ECONOMIC IMPACT ASSESSMENT STUDY
Urban Econ Development Economists
28
and other settlement clusters. The Municipality plans to develop Service Delivery Centres in these
areas in order to improve access to social and economic services (Ditsobotla LM, 2015).
The Ramotshere Moiloa LM is equally sparsely populated with only 21 people per square kilometre.
Nearly 80% of the households in the LM are living in a brick or concrete formal dwelling with its own
stand. This is followed by nearly 9% of households living in informal dwellings, and almost 4% of
households living in traditional dwellings (Stats SA, 2016). The Ramotshere Moiloa LM is characterised
by only a few urban areas, which include Zeerust (main town) and various smaller formal settlements
such as Groot Marico, Lehurutshe, Welbedacht, Ikagaleng and Dinokana. Nearly 70% of the LM is rural
in nature, and include 40 villages spread across the entire LM (Ramotshere Moiloa LM, 2015/2016).
Access to Housing and Basic Services 3.9
Access to basic services in the study area reflects the inequalities within the district, and both the
Ditsobotla and Ramotshere Moiloa LMs, with basic services being more adequately accessed in urban
areas (Stats SA, 2016):
Housing: Only 6.8% of people in Zeerust live in informal housing, while this is the case for
17.8% of people in the Ditsobotla LM and 9% for the Ramotshere Moiloa LM (the town of
Lichtenburg is no exception with a low percentage of the population living in informal housing).
There is an abundance of RDP housing in the Ramotshere Moiloa LM, but due to the
unappealing outskirt location from town, many people do not want to live there. In the property
market, very few transactions have occurred in the past five years. This is a result of the
passing of property from one generation to the next; however, the current owners of the
properties do not live in the area but rent out the property. In general, the renting prices are
highly inflated as there is no competition and there is no desire to purchase property in the town
or the surrounding areas. Moreover, the rate of buying property is low given that Zeerust is
located close to the border, which makes the renting option and guesthouse more appealing.
Water: The two municipalities face serious challenges with respect to the provision of adequate
water supply to its residents and businesses. Less than two-thirds of the population have
adequate access to water in the Ditsobotla municipality, while only 57% of the Ramotshere
Moiloa LM’s households have the same service. Furthermore, those households who are
connected to bulk water supply often have water only during certain hours of the day. This is
especially the case in the Ramotshere Moiloa LM, where a water source is located some 25km
away from any major settlement. The two towns of Lichtenburg and Zeerust provide very good
access to water, with over 94% of people accessing water inside their dwelling or yard. the
problem with water scarcity is associated with both – the water supply, which was exacerbated
by the droughts experienced from 2008, and the inadequate provision of infrastructure.
Sanitation: The same challenging situation is observed regarding sanitation services, i.e. only
43% of people within the Ditsobotla municipality and 22.4% of people in the Ramotshere Moiloa
LM have access to proper sanitation (e.g. connected to sewerage system); while over 94% of
people in Lichtenburg and Zeerust have access to proper sanitation (Stats SA, 2016). The
sewage plants in the area need upgrades, but no provision for these have been known to be
made by the district.
DOORNHOEK FLUORSPAR PROJECT SOCIO-ECONOMIC IMPACT ASSESSMENT STUDY
Urban Econ Development Economists
29
Electricity: Access to electricity for lighting in the Ditsobotla LM is low compared to national and
provincial figures. Close to one-fourth of the population in the Ditsobotla LM use candles for
lighting, while 16,5% of the Ramotshere Moiloa LM population uses the same means to light
their homes. The situation is better in the town of Lichtenburg (12.2% of people use candle light)
and Zeerust with 96.3% of the population using electricity for lighting (Stats SA, 2016).
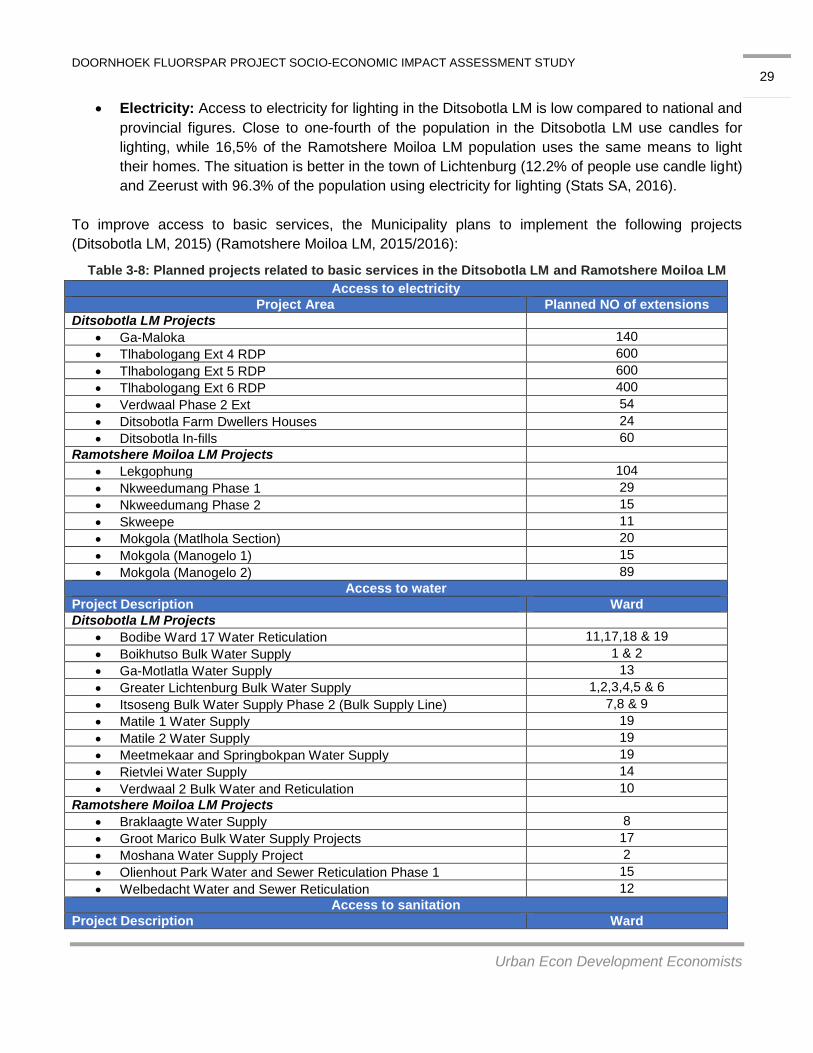
To improve access to basic services, the Municipality plans to implement the following projects
(Ditsobotla LM, 2015) (Ramotshere Moiloa LM, 2015/2016):
Table 3-8: Planned projects related to basic services in the Ditsobotla LM and Ramotshere Moiloa LM
Access to electricity
Project Area Planned NO of extensions
Ditsobotla LM Projects
Ga-Maloka 140
Tlhabologang Ext 4 RDP 600
Tlhabologang Ext 5 RDP 600
Tlhabologang Ext 6 RDP 400
Verdwaal Phase 2 Ext 54
Ditsobotla Farm Dwellers Houses 24
Ditsobotla In-fills 60
Ramotshere Moiloa LM Projects
Lekgophung 104
Nkweedumang Phase 1 29
Nkweedumang Phase 2 15
Skweepe 11
Mokgola (Matlhola Section) 20
Mokgola (Manogelo 1) 15
Mokgola (Manogelo 2) 89
Access to water
Project Description Ward
Ditsobotla LM Projects
Bodibe Ward 17 Water Reticulation 11,17,18 & 19
Boikhutso Bulk Water Supply 1 & 2
Ga-Motlatla Water Supply 13
Greater Lichtenburg Bulk Water Supply 1,2,3,4,5 & 6
Itsoseng Bulk Water Supply Phase 2 (Bulk Supply Line) 7,8 & 9
Matile 1 Water Supply 19
Matile 2 Water Supply 19
Meetmekaar and Springbokpan Water Supply 19
Rietvlei Water Supply 14
Verdwaal 2 Bulk Water and Reticulation 10
Ramotshere Moiloa LM Projects
Braklaagte Water Supply 8
Groot Marico Bulk Water Supply Projects 17
Moshana Water Supply Project 2
Olienhout Park Water and Sewer Reticulation Phase 1 15
Welbedacht Water and Sewer Reticulation 12
Access to sanitation
Project Description Ward

DOORNHOEK FLUORSPAR PROJECT SOCIO-ECONOMIC IMPACT ASSESSMENT STUDY
Urban Econ Development Economists
30
Ditsobotla LM Projects
Blydeville Outfall Sewer Projects 3 & 4
Ditsobotla Rural Sanitation
Itekeng & Biesiesvlei Bulk Sanitation 21
Itsoseng Waste Water Treatment Plant Upgrade 8 & 9
Lichtenburg Waste Water Treatment Plant 1,2,3,4,5
Tlhabologang Bulk Water Supply (Waste Water Treatment Works) 15, 16 & 21
Tlhabologang Bulk Sanitation (Monitoring & Evaluation) 15, 16 & 21
Tlhabologang Bulk Sanitation (Outfall Sewer) 15, 16 & 21
Ramotshere Moiloa LM Projects
Groot Marico Waste Water Treatment Plant 17
Groot Marico Outfall Sewer and Reticulation 17
Ramotshere Moiloa Rural Sanitatio All
Zeerust Waste Water Treatment Plant Phase 2 15
Access to housing
Project Description Total contractual target
Ditsobotla LM Projects
Itsoseng 619 (project linked subsidies) 619
Itsoseng Ext 3 (project linked subsidies) 200
Blydeville Ext 4 (Integrated Residential Development Programme)
Lichtenburg Ext 4 (CRU)/Social Housing Feasibility (Integrated Residential Development Programme)
200
Ditsobotla PHP (People’s Housing Process) 710
Boikhutso 245 (Informal Settlement Upgrading) 245
Sheila 250 (Informal Settlement Upgrading) 250
Tlhabologang 141 (Informal Settlement Upgrading) 141
Coligny (Informal Settlement Upgrading)
Tlhabologang (Informal Settlement Upgrading) 40
Verdwaal 401 (Rural Housing and Communal Land Rights) 401
Bodibe 248 (Rural Housing and Communal Land Rights) 248
Ditsobotla 2000 (Rural Housing and Communal Land Rights) 2 000
Ditsobotla Villages (Rural Housing and Communal Land Rights) 1 040
Boikhutso Extension 1 Senior Citizens (Priority Projects) 2 030
Itsoseng Phase 2 (Priority Projects) 500
Ramotshere Moiloa LM Projects
RDP Housing Project N/A
RDP Housing Project – Groot Marico N/A
(Ditsobotla LM, 2015) (Ramotshere Moiloa LM, 2015/2016)
Transport Infrastructure 3.10
The Ditsobotla LM is characterised by a fragmented urban structure, with the Lichtenbrug-Boikhusto
cluster as the core area of the municipality. The municipality aims to improve roads and transport by
integrating the surrounding settlements within the Lichtenburg core area. The projects presented in
Table 3-9 have been identified to be in the pipeline for the area.
The Ramotshere Moloa LM has focused on increasing the quality of all road infrastructure in the LM
and has made the tarring, paving and maintenance of roads a priority in all wards in the LM

DOORNHOEK FLUORSPAR PROJECT SOCIO-ECONOMIC IMPACT ASSESSMENT STUDY
Urban Econ Development Economists
31
(Ramotshere Moiloa LM, 2015/2016). Backlog figures were not available in the Ramotshere Moiloa LM
IDP.
Table 3-9: Proposed road and transport projects in Ditsobotla LM
Project name Funder
Construction of Lichtenburg Weighbridge NW Public Works and Roads
Rehabilitation of 40km Road D933 & D2095 between Lichtenburg & Gelukspan (Duffield & Sephaku)
NW Public Works and Roads
Rehabilitation of Road D408 between Itsoseng & Goedgevonden through Springbokpan
NW Public Works and Roads
Rehabilitation: Sections of Road P28/1 between Mahikeng and Lichtenburg
NW Public Works and Roads
Patchwork on Road P183/1 between Lichtenburg & Deelpan Phase 2 NW Public Works and Roads
Construction of Roads and Stormwater in Bodibe Ditsobotla LM
Construction of Roads and Stormwater in Bakerville Ditsobotla LM
Construction of Roads and Stormwater in Tlhabologang Ditsobotla LM
Construction of Access Roads in Itsosen Construction and Upgrade of Roads and Stormwater in Boikhutso
Ditsobotla LM
Construction of Access Roads in Itekeng Ditsobotla LM
Construction of Roads and Stormwater in Ga-Maloka Ditsobotla LM
Refurbishment of Internal Roads in Lichtenburg Ditsobotla LM
Construction of Roads and Stormwater in Springbokpan Ditsobotla LM
Construction of Roads and Stormwater in Blydeville Extensions
Ditsobotla LM
Internal Roads and Stormwater for ward 6 Ramothsere Moiloa LM
Mmasebudule Internal Roads Ramothsere Moiloa LM
Ntsweletsoku Internal Roads Ramothsere Moiloa LM
Borakalalo Bridge and Internal Roads Ramothsere Moiloa LM
Nyetse Internal Roads\Technical\Civil Engineering Ramothsere Moiloa LM
Bosugakobo Internal Road Ramothsere Moiloa LM
Sandvlagte Internal Road Ramothsere Moiloa LM
Madutle Matlhase Internal Road Ramothsere Moiloa LM
Ikageleng W16 Internal Roads Ramothsere Moiloa LM
Supingstadt Internal Road Ramothsere Moiloa LM
Motswedi Internal Road Ramothsere Moiloa LM
Dinokana W9 Internal Roads Phase 2 Ramothsere Moiloa LM
Swartkopfontein Internal Roads Phase 2 Ramothsere Moiloa LM
Lobatla Ward 20 Internal Roads Ramothsere Moiloa LM
Zeeust Internal Road Ramothsere Moiloa LM (Ditsobotla LM, 2015) (Ramotshere Moiloa LM, 2015/2016)
Social and Recreational Infrastructure 3.11
The local area comprises of the following social and recreational infrastructure (Ditsobotla LM, 2015):
Educational facilities:
o A total of 107 primary schools, including junior primary (30), primary (74) and senior
primary (3) in the Ditsobotla LM. These are concentrated in the central and south-
western segments of the LM. Primary schools in the Ramotshere Moiloa LM include
Henryville, Sefathlhane, Zeerust, Glen Alice and Moruti primary schools.
DOORNHOEK FLUORSPAR PROJECT SOCIO-ECONOMIC IMPACT ASSESSMENT STUDY
Urban Econ Development Economists
32
o A total of 23 secondary schools, including combined schools (2), intermediate schools
(6), secondary schools (14), and one senior secondary school in the Ditsobotla LM.
Secondary schools in the Ramotshere Moiloa LM include Ikageleng, Zeerust,
Ramotshere, Thuto-Ke-Mattla and Ngotwane high schools.
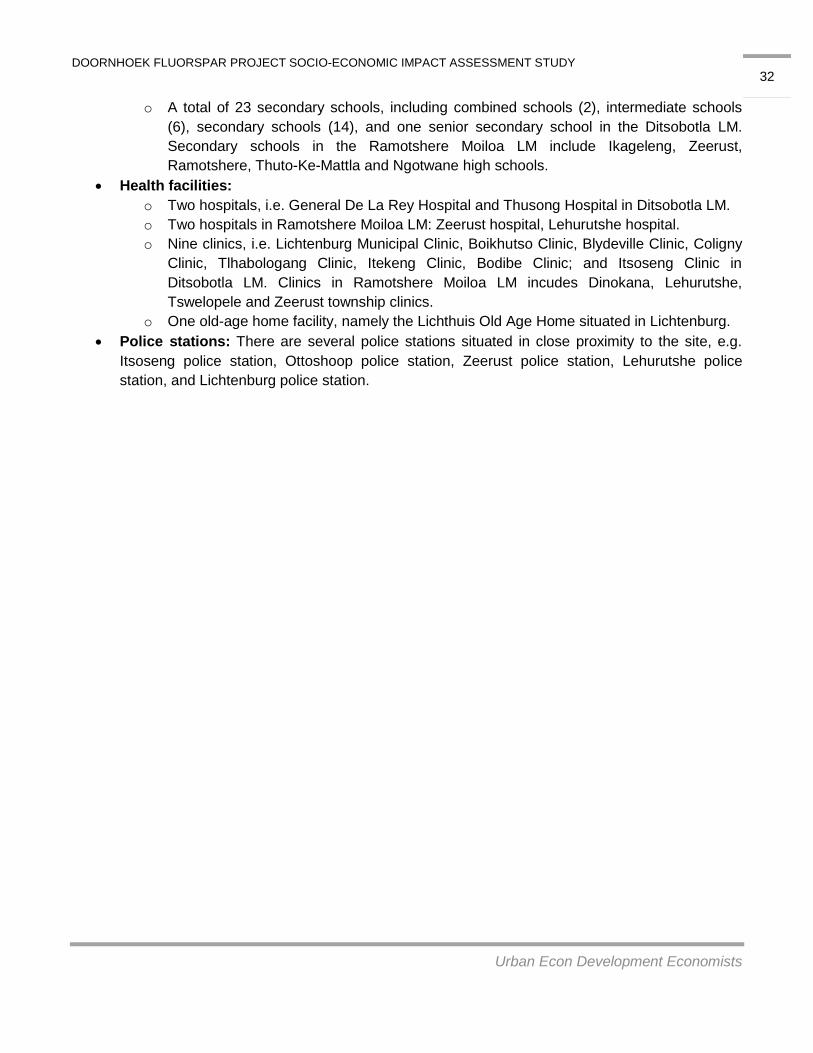
Health facilities:
o Two hospitals, i.e. General De La Rey Hospital and Thusong Hospital in Ditsobotla LM.
o Two hospitals in Ramotshere Moiloa LM: Zeerust hospital, Lehurutshe hospital.
o Nine clinics, i.e. Lichtenburg Municipal Clinic, Boikhutso Clinic, Blydeville Clinic, Coligny
Clinic, Tlhabologang Clinic, Itekeng Clinic, Bodibe Clinic; and Itsoseng Clinic in
Ditsobotla LM. Clinics in Ramotshere Moiloa LM incudes Dinokana, Lehurutshe,
Tswelopele and Zeerust township clinics.
o One old-age home facility, namely the Lichthuis Old Age Home situated in Lichtenburg.
Police stations: There are several police stations situated in close proximity to the site, e.g.
Itsoseng police station, Ottoshoop police station, Zeerust police station, Lehurutshe police
station, and Lichtenburg police station.
DOORNHOEK FLUORSPAR PROJECT SOCIO-ECONOMIC IMPACT ASSESSMENT STUDY
Urban Econ Development Economists
33
4 SITE-RELATED INFORMATION
Based on the review of the Google imagery, as well as site visit responses, it can be suggested that the
area where the proposed project is to be located is of rural nature with limited presence of man-made
structures, infrastructure, and economic activities. This section investigates secondary and primary data
sources in order to identify the portion of land uses affected by the proposed project.
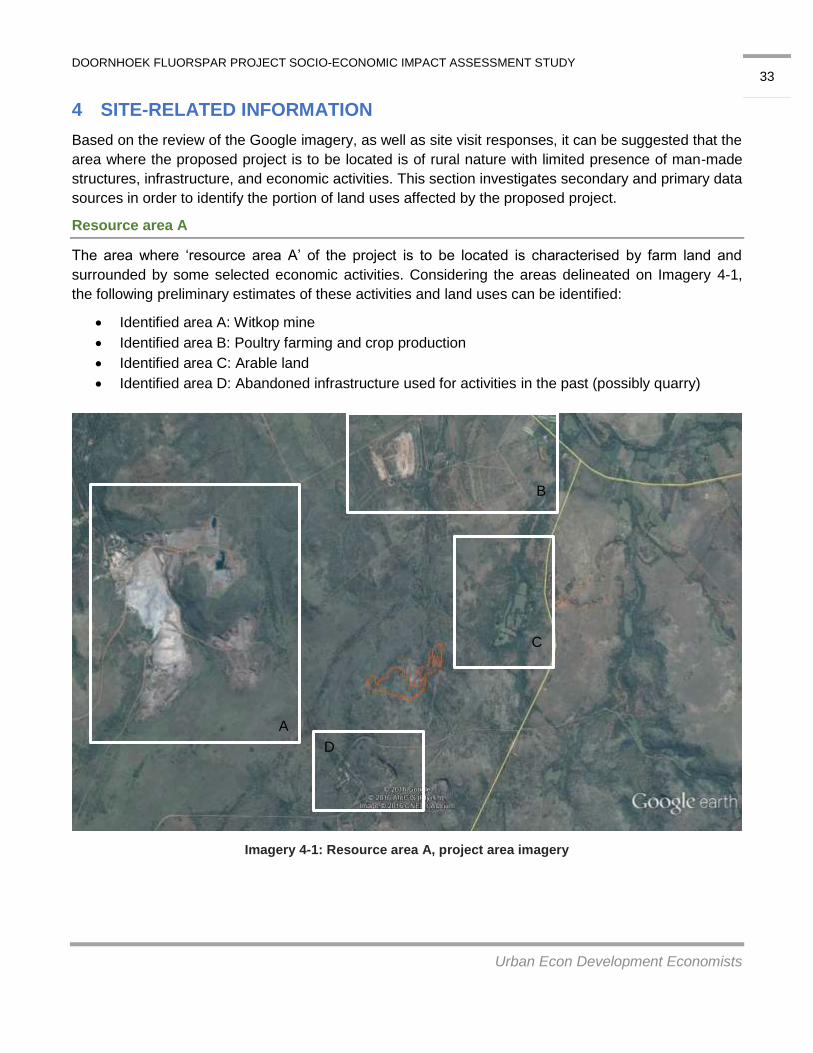
Resource area A
The area where ‘resource area A’ of the project is to be located is characterised by farm land and
surrounded by some selected economic activities. Considering the areas delineated on Imagery 4-1,
the following preliminary estimates of these activities and land uses can be identified:
Identified area A: Witkop mine
Identified area B: Poultry farming and crop production
Identified area C: Arable land
Identified area D: Abandoned infrastructure used for activities in the past (possibly quarry)
Imagery 4-1: Resource area A, project area imagery
A
B
C
D

DOORNHOEK FLUORSPAR PROJECT SOCIO-ECONOMIC IMPACT ASSESSMENT STUDY
Urban Econ Development Economists
34
Imagery 4-2: Resource area A project area imagery per selected area
Resource Area C and D
Areas surrounding resource area C and D of the project are also classified as rural and consist of
farming activities. Crop production and poultry farming appear to be concentrated to the north and
north-east from the project site. The rest of the area is used for livestock grazing.
Imagery 4-3: Resource areas C and D
Land Use Information
The following map illustrates the farm portions that are expected to be directly and indirectly affected by
the proposed project. A farm portion is considered to be directly affected if any of the mine’s footprint is
D D C B

DOORNHOEK FLUORSPAR PROJECT SOCIO-ECONOMIC IMPACT ASSESSMENT STUDY
Urban Econ Development Economists
35
located on that farm portion. An indirectly affected farm portion is the one that is adjacent to the directly
affected farm portion.
Imagery 4-4: Directly and Adjacent Land Uses
Listed in the tables below are the land uses for the various directly and indirectly affected land portions.
Two land owners own the majority of properties that are envisaged to be affected by the proposed
project, which account for 16 farm portions. The Project Proponent also owns some of the directly and
indirectly affected farm portions.
Table 4-1: Land use data and concerns raised for directly affected farm portions
Farm Portion (s) and size
Current Land Use
Project component to impact the property and
duration of impact
Number of Residents
and Employees
Concerns raised
Portion 1 (r/e) of the farm Knoflookfontein 310 JP.
Unconfirmed agricultural activities
Mining infrastructure Construction Years 1-5 (5-years) Operations Years 5-30
2 residents 5 employees
Water resource impact
Air pollution
Crime
Traffic
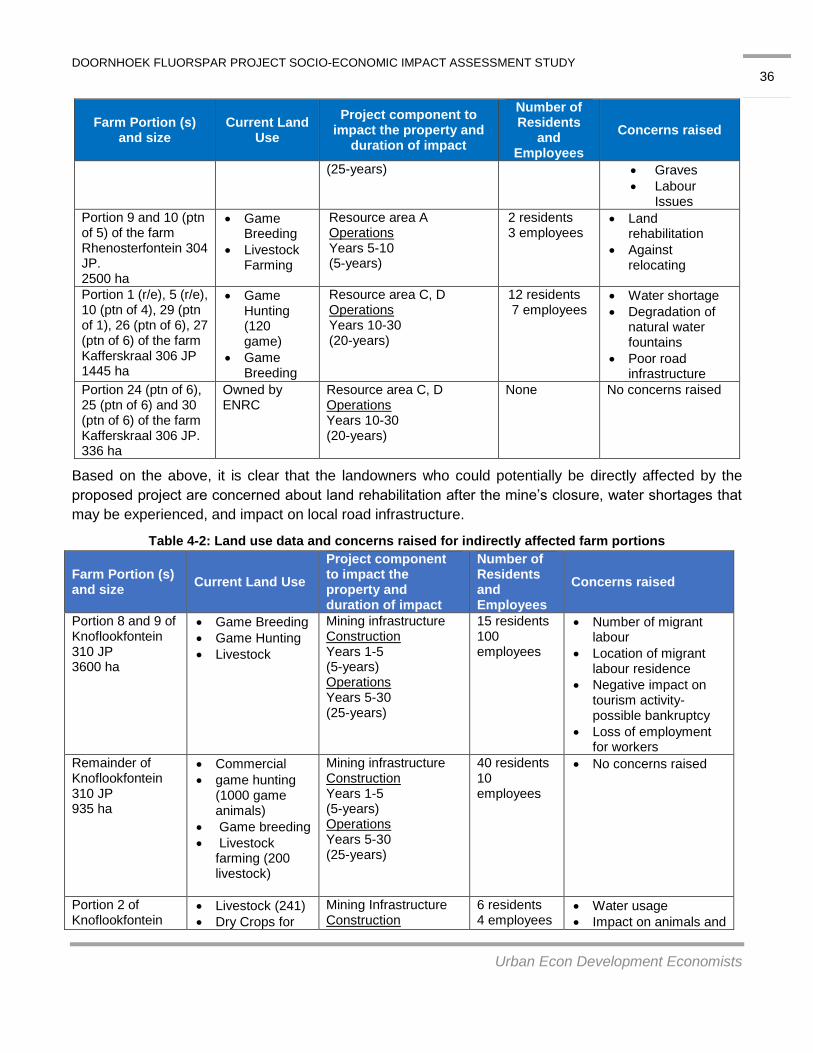
DOORNHOEK FLUORSPAR PROJECT SOCIO-ECONOMIC IMPACT ASSESSMENT STUDY
Urban Econ Development Economists
36
Farm Portion (s) and size
Current Land Use
Project component to impact the property and
duration of impact
Number of Residents
and Employees
Concerns raised
(25-years) Graves
Labour Issues
Portion 9 and 10 (ptn of 5) of the farm Rhenosterfontein 304 JP. 2500 ha
Game Breeding
Livestock Farming
Resource area A Operations Years 5-10 (5-years)
2 residents 3 employees
Land rehabilitation
Against relocating
Portion 1 (r/e), 5 (r/e), 10 (ptn of 4), 29 (ptn of 1), 26 (ptn of 6), 27 (ptn of 6) of the farm Kafferskraal 306 JP 1445 ha
Game Hunting (120 game)
Game Breeding
Resource area C, D Operations Years 10-30 (20-years)
12 residents 7 employees
Water shortage
Degradation of natural water fountains
Poor road infrastructure
Portion 24 (ptn of 6), 25 (ptn of 6) and 30 (ptn of 6) of the farm Kafferskraal 306 JP. 336 ha
Owned by ENRC
Resource area C, D Operations Years 10-30 (20-years)
None No concerns raised
Based on the above, it is clear that the landowners who could potentially be directly affected by the
proposed project are concerned about land rehabilitation after the mine’s closure, water shortages that
may be experienced, and impact on local road infrastructure.
Table 4-2: Land use data and concerns raised for indirectly affected farm portions
Farm Portion (s) and size
Current Land Use
Project component to impact the property and duration of impact
Number of Residents and Employees
Concerns raised
Portion 8 and 9 of Knoflookfontein 310 JP 3600 ha
Game Breeding
Game Hunting
Livestock
Mining infrastructure Construction Years 1-5 (5-years) Operations Years 5-30 (25-years)
15 residents 100 employees
Number of migrant labour
Location of migrant labour residence
Negative impact on tourism activity-possible bankruptcy
Loss of employment for workers
Remainder of Knoflookfontein 310 JP 935 ha
Commercial
game hunting (1000 game animals)
Game breeding
Livestock farming (200 livestock)
Mining infrastructure Construction Years 1-5 (5-years) Operations Years 5-30 (25-years)
40 residents 10 employees
No concerns raised
Portion 2 of Knoflookfontein
Livestock (241)
Dry Crops for
Mining Infrastructure Construction
6 residents 4 employees
Water usage
Impact on animals and

DOORNHOEK FLUORSPAR PROJECT SOCIO-ECONOMIC IMPACT ASSESSMENT STUDY
Urban Econ Development Economists
37
Farm Portion (s) and size
Current Land Use
Project component to impact the property and duration of impact
Number of Residents and Employees
Concerns raised
310 JP 468 ha
livestock Years 1-5 (5-years) Operations Years 5-30 (25-years)
natural environment
Air quality- dust
Impact on grazing land
Portion 3 and 4 of the farm Knoflookfontein 310 JP.
No Data Available Mining infrastructure Construction Years 1-5 (5-years) Operations Years 5-30 (25-years)
6 residents 5 employees
Water use and
pollution
Portion 5 (r/e) of Knoflookfontein 310 JP 150 ha
Commercial Livestock farming
Mining infrastructure Construction Years 1-5 (5-years) Operations Years 5-30 (25-years)
0 residents 4 employees
No concerns raised
Portion 2 (r/e), 5 (r/e), 25 (ptn of 5) and 17 (ptn of 4) of the farm Rhenosterfontein 304 JP 2500 ha
Commercial game hunting (350 game)
Game Breeding
Livestock Farming (50)
Resource area A Operations Years 5-10 (5-years)
9 residents 3 employees
Rehabilitation of land
Against relocating
Portion 15 (ptn of 2) of the farm Rhenosterfontein 304 JP.
No Data Available Resource area A Operations Years 5-10 (5-years)
No Data Available
No Data Available
Portion 6 (ptn of 1) of the farm Rhenosterfontein 304 JP.
No Data Available Resource area A Operations Years 5-10 (5-years)
No Data Available
No Data Available
Portion 4,6 of the farm Kafferskraal 306 JP. 10 ha
Owned by ENRC Resource area C, D Operations Years 20-30 (10-years)
- No concerns raised
Portion 14, 12, 28 (ptn of 6) of the farm Kafferskraal and remainder of farm Kafferskraal 306 JP
Data not Available Resource area C, D Operations Years 20-30 (10-years)
No Data Available
No Data Available
Portion 31 of farm Paardplaats 296 JP
Data not Available Resource area C, D Operations Years 20-30
No Data Available
Water restrictions
Dust effects on chicken farming

DOORNHOEK FLUORSPAR PROJECT SOCIO-ECONOMIC IMPACT ASSESSMENT STUDY
Urban Econ Development Economists
38
Farm Portion (s) and size
Current Land Use
Project component to impact the property and duration of impact
Number of Residents and Employees
Concerns raised
(10-years) labour
Remainder of farm Saamgevoeg 220 JP
Data not Available Resource area C, D Operations Years 20-30
No Data Available
Water restrictions
Dust effects on chicken farming
labour
Portion 2 of farm Witrand 325 JP
Data not Available Mining infrastructure Construction Years 1-5 (5-years) Operations Years 5-30 (25-years)
No Data Available
No Data Available
Portion 2 of farm Strydfontein 326 JP
Data not Available Resource area A Operations Years 5-10 (5-years)
No Data Available
No Data Available
Considering information gathered during the interviews, the concerns of the land owners that are in
direct proximity to the farm portion where various mine’s components are to be located revolve around
the effects of migrant labour on local crime and social welfare, potential loss of agricultural land,
negative impact on water availability, and potential effect on local economic activity such as tourism
derived from game farming and associated employment.
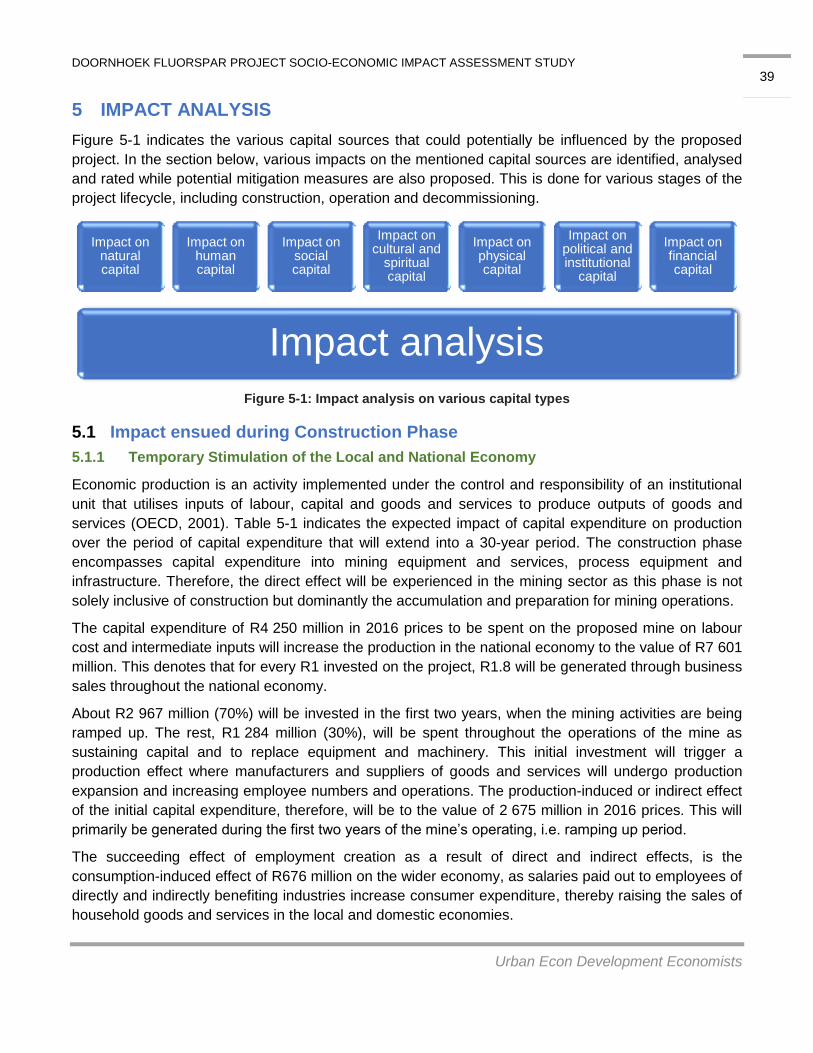
DOORNHOEK FLUORSPAR PROJECT SOCIO-ECONOMIC IMPACT ASSESSMENT STUDY
Urban Econ Development Economists
39
5 IMPACT ANALYSIS
Figure 5-1 indicates the various capital sources that could potentially be influenced by the proposed
project. In the section below, various impacts on the mentioned capital sources are identified, analysed
and rated while potential mitigation measures are also proposed. This is done for various stages of the
project lifecycle, including construction, operation and decommissioning.
Figure 5-1: Impact analysis on various capital types
Impact ensued during Construction Phase 5.1
5.1.1 Temporary Stimulation of the Local and National Economy
Economic production is an activity implemented under the control and responsibility of an institutional
unit that utilises inputs of labour, capital and goods and services to produce outputs of goods and
services (OECD, 2001). Table 5-1 indicates the expected impact of capital expenditure on production
over the period of capital expenditure that will extend into a 30-year period. The construction phase
encompasses capital expenditure into mining equipment and services, process equipment and
infrastructure. Therefore, the direct effect will be experienced in the mining sector as this phase is not
solely inclusive of construction but dominantly the accumulation and preparation for mining operations.
The capital expenditure of R4 250 million in 2016 prices to be spent on the proposed mine on labour
cost and intermediate inputs will increase the production in the national economy to the value of R7 601
million. This denotes that for every R1 invested on the project, R1.8 will be generated through business
sales throughout the national economy.
About R2 967 million (70%) will be invested in the first two years, when the mining activities are being
ramped up. The rest, R1 284 million (30%), will be spent throughout the operations of the mine as
sustaining capital and to replace equipment and machinery. This initial investment will trigger a
production effect where manufacturers and suppliers of goods and services will undergo production
expansion and increasing employee numbers and operations. The production-induced or indirect effect
of the initial capital expenditure, therefore, will be to the value of 2 675 million in 2016 prices. This will
primarily be generated during the first two years of the mine’s operating, i.e. ramping up period.
The succeeding effect of employment creation as a result of direct and indirect effects, is the
consumption-induced effect of R676 million on the wider economy, as salaries paid out to employees of
directly and indirectly benefiting industries increase consumer expenditure, thereby raising the sales of
household goods and services in the local and domestic economies.
Impact analysis
Impact on natural capital
Impact on human capital
Impact on social capital
Impact on cultural and
spiritual capital
Impact on physical capital
Impact on political and institutional
capital
Impact on financial capital

DOORNHOEK FLUORSPAR PROJECT SOCIO-ECONOMIC IMPACT ASSESSMENT STUDY
Urban Econ Development Economists
40
Construction employees will procure goods and services on a daily basis from the area during the
construction period. For instance, a demand for local transport services, trade and personal services
will be created. The manufacturing, financial and business services and transport and communication
sectors will be benefit the most from the construction activities. The total increase in new business
sales for industries operating within the manufacturing sector is anticipated to be valued at R889 million
in 2016 prices. An additional result is new employment through direct and indirect effects which will in
turn increase income levels of the respective households. Evidently, various spill over effects spread
throughout the economy further contribute to heightened production levels.
Table 5-1: Total impact on SA’s production during construction (R’million)
Sector Direct Indirect Induced TOTAL % distribution
Agriculture - R9.6 R32.9 R42.5 0.6%
Mining R4 250.3 R614.9 R2.4 R4 867.5 64.0%
Manufacturing - R817.7 R71.0 R888.7 11.7%
Electricity & water - R139.8 R9.9 R149.7 2.0%
Construction - R136.0 R1.6 R137.6 1.8%
Trade & accommodation - R107.8 R91.1 R198.9 2.6%
Transport & communication - R307.4 R135.7 R443.1 5.8%
Financial & business services - R407.9 R154.3 R562.2 7.4%
Community services - R134.6 R176.7 R311.3 4.1%
Total R 4 250.3 R 2 675.7 R 675.6 R 7 601.6 100.0%
Urban-Econ modelling based on data supplied by the client
Gross Domestic Product (GDP) entails the monetary value of all goods and services produced within a
nation’s geographic borders over a specified period of time (Parkin, 2007). The primary method of
expanding GDP levels is through investment into infrastructure and enterprises that generate goods
and services. The investment into the creation of new and improved goods and services creates
heightened levels of GDP within the economy.
The domestic expenditure on the establishment of the proposed mine will result in an increase of GDP
to the tune of R1 514 million, the majority of which will be generated in the first two years of the mine’s
operations. Aside from the mining sector, the largest Value Added to be created as a result of indirect
effects of the initial capital expenditure is expected to be in the financial and business services sector
which is set to increase by approximately R222 million (2016 prices) followed by that of manufacturing,
which is forecast to increase by R174 million (2016 prices). Sectors forecast to benefit the most from
the indirect impact include community services and financial and the business service sectors. Some of
these positive effects will be localised in the local economies stimulating further development in the
Ditsobotla LM economy valued at R8 014.3 million and Ramotshere Moiloa LM economy valued at
R3 698.3 million in current prices (Quantec, 2016).
Table 5-2: Total impact on SA’s GDP as a result of Capital Expenditure (R’million, 30-years)
Sector Direct Indirect Induced TOTAL % distribution
Agriculture - R4.4 R15.3 R19.7 1.3%
Mining R204.2 R300.9 R1.2 R506.3 33.5%
Manufacturing - R174.0 R14.4 R188.5 12.5%

DOORNHOEK FLUORSPAR PROJECT SOCIO-ECONOMIC IMPACT ASSESSMENT STUDY
Urban Econ Development Economists
41
Sector Direct Indirect Induced TOTAL % distribution
Electricity & water - R51.8 R4.6 R56.4 3.7%
Construction - R34.6 R0.4 R35.0 2.3%
Trade & accommodation - R49.3 R40.9 R90.2 6.0%
Transport & communication - R113.0 R49.9 R162.9 10.8%
Financial & business services - R221.8 R84.2 R306.0 20.2%
Community services - R62.2 R86.2 R148.4 9.8%
Total R204.2 R1 012.2 R297.0 R1 513.5 100.0%
Urban-Econ modelling based on data supplied by the client
5.1.2 Temporary Creation of Employment in Local and National Economies
Info Box: Full Time Equivalent (FTE) man-year or FTE jobs
Employment impacts are calculated in terms of the Full Time Equivalent (FTE) employment positions, which is
the same as a FTE job or one man-year of work. This does not directly translate into the headcount of people
employed or into new job opportunities. Generally, one FTE man-year is equal to one person working for 40
hours per week for about 50 weeks per year; however, it could vary depending on the industry.
A FTE man-year means that if one person worked only 20 hours per week for 50 weeks in a year, its FTE
equivalent would be 0.5; if two people worked for 20 hours per week for 50 weeks in a year, the combined work
load would be estimated as one FTE man-year or one FTE job. In the short-term, an increase in FTE
employment positions could be absorbed by the existing workforce, either by working overtime or if these labour
resources are underutilised in the industry.
The unemployment figures of the economically active population of the Ditsobotla LM and the
Ramotshere Moiloa LM are 14 840 and 12 728, respectively. Unemployment is evidently a key
challenge, thus one of the officials from the Ngaka Modiri District Municipality argued that employment
opportunities ought to be prioritised for local residents, particularly those with limited skills. Forty to sixty
percent of employment during the construction phase is envisaged to be recruited locally. Therefore,
between 88 and 133 jobs during the first two-year period will be occupied by locals; thus allowing the
local municipality to decrease their unemployment figures by between 0.3% and 0.6%.
Overall, 4 397 FTE person-years will be created as a result of Capital Expenditure during the 30-year
period. The majority of these FTE jobs will be created during the first two years of the mine’s
operations, i.e. ramping up period. Most of these FTE jobs will be created as a result of indirect effects,
i.e. among the businesses that would supply goods and services for the development of the mine and
among their own suppliers. The employment is not permanent, nevertheless, the benefits derived from
the temporary employment will be improved livelihood due to income, and skills for greater marketability
for future employment. Aside from mining, the sectors to benefit the most in terms of employment
creation are manufacturing and financial and business services with 1 247 and 555, respectively.
Table 5-3: Total impact on employment as a result of Capital Expenditure (FTE person-years, 30 years)
Sector Direct Indirect Induced TOTAL % distribution
Agriculture - 69 238 307 7.0%
Mining 445 211 1 656 14.9%
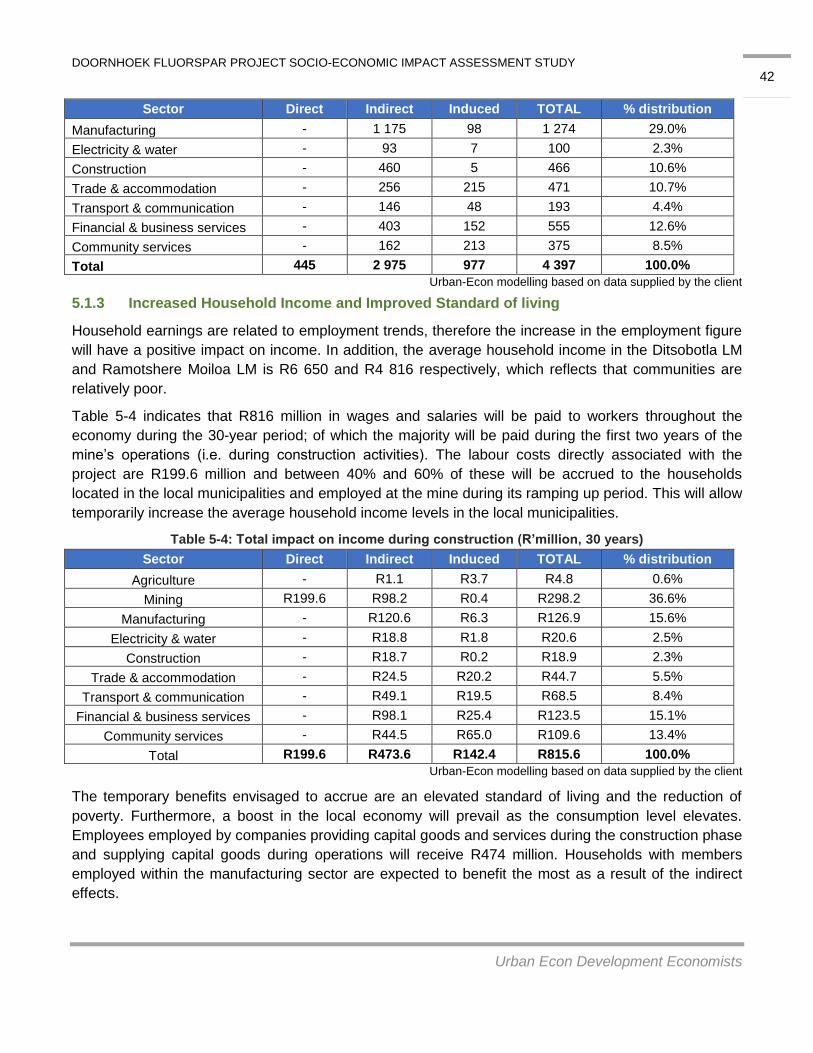
DOORNHOEK FLUORSPAR PROJECT SOCIO-ECONOMIC IMPACT ASSESSMENT STUDY
Urban Econ Development Economists
42
Sector Direct Indirect Induced TOTAL % distribution
Manufacturing - 1 175 98 1 274 29.0%
Electricity & water - 93 7 100 2.3%
Construction - 460 5 466 10.6%
Trade & accommodation - 256 215 471 10.7%
Transport & communication - 146 48 193 4.4%
Financial & business services - 403 152 555 12.6%
Community services - 162 213 375 8.5%
Total 445 2 975 977 4 397 100.0%
Urban-Econ modelling based on data supplied by the client
5.1.3 Increased Household Income and Improved Standard of living
Household earnings are related to employment trends, therefore the increase in the employment figure
will have a positive impact on income. In addition, the average household income in the Ditsobotla LM
and Ramotshere Moiloa LM is R6 650 and R4 816 respectively, which reflects that communities are
relatively poor.
Table 5-4 indicates that R816 million in wages and salaries will be paid to workers throughout the
economy during the 30-year period; of which the majority will be paid during the first two years of the
mine’s operations (i.e. during construction activities). The labour costs directly associated with the
project are R199.6 million and between 40% and 60% of these will be accrued to the households
located in the local municipalities and employed at the mine during its ramping up period. This will allow
temporarily increase the average household income levels in the local municipalities.
Table 5-4: Total impact on income during construction (R’million, 30 years)
Sector Direct Indirect Induced TOTAL % distribution
Agriculture - R1.1 R3.7 R4.8 0.6%
Mining R199.6 R98.2 R0.4 R298.2 36.6%
Manufacturing - R120.6 R6.3 R126.9 15.6%
Electricity & water - R18.8 R1.8 R20.6 2.5%
Construction - R18.7 R0.2 R18.9 2.3%
Trade & accommodation - R24.5 R20.2 R44.7 5.5%
Transport & communication - R49.1 R19.5 R68.5 8.4%
Financial & business services - R98.1 R25.4 R123.5 15.1%
Community services - R44.5 R65.0 R109.6 13.4%
Total R199.6 R473.6 R142.4 R815.6 100.0%
Urban-Econ modelling based on data supplied by the client
The temporary benefits envisaged to accrue are an elevated standard of living and the reduction of
poverty. Furthermore, a boost in the local economy will prevail as the consumption level elevates.
Employees employed by companies providing capital goods and services during the construction phase
and supplying capital goods during operations will receive R474 million. Households with members
employed within the manufacturing sector are expected to benefit the most as a result of the indirect
effects.

DOORNHOEK FLUORSPAR PROJECT SOCIO-ECONOMIC IMPACT ASSESSMENT STUDY
Urban Econ Development Economists
43
Through the consumption-induced effects, households throughout the country will experience an
increase in earning to the tune of R143 million in 2016 prices. Most of this, again, will be earned during
the first two years of the mine’s operations, i.e. construction and ramping up activities.
5.1.4 Skills Development due to the creation of new Employment Opportunities
The construction phase of the project is comprised of the establishment of mining and supporting
infrastructure. The skill sets required during the construction phase are not solely construction skills but
also include skills required in mining activities. The Doornhoek Fluorspar Project estimates a minimum
of 40%-60% of total labour to be derived locally. However, semi- and unskilled labour dominate the
Ditsobotla LM and Ramotshere Moiloa LM’s formal sector with 82.4% and 79.4%, respectively. In
addition, the number of construction workers in the municipalities is relatively low (4% and 5.5%) due to
the dominantly rural nature of the area and limited construction taking place; however, the local area
has the existing Witkop Fluorspar Mine that has been put in care and maintenance, which has likely
assisted in developing local skills that would now be required at the Doornhoek Mine even during its
construction activities and ramping up period.
From the above it can be suggested that the area is likely to be able to provide unskilled and low-skilled
labourers for the mine’s construction activities, as well as some of the more experienced mine workers
that are required during the ramping up period. Some training exercises might still be required to
ensure skills and knowledge transfer. Resultantly, between 88 and 132 individuals from the area will be
able to acquire and/or expand skills and improve their marketability on the job market once the
construction is completed. Those with specialist skills will gain further experience and improve their
skills level. The sustainable impact of skills development will thus improve the skills profile of the two
local municipalities.
5.1.5 Government Revenue Increase due to Capital Expenditure
The construction phase will be spread over five years but the activities resulting in major capital
expenditure will be concentrated within a two-year period. After these, expenditure on capital will
continue until the end of the operational period of the plant, i.e. over 30 years. As a result of capital
expenditure on the project, companies will be generating a revenue and employ people. From this,
companies are obliged to pay the government income taxes and payroll taxes. Additionally, increased
spending power will translate into more purchases, which would increase the Value Added Tax base for
government. The various tax received by government improves government’s ability to deliver services
and an increase in national fiscus will prevail.
5.1.6 Change in Sense of Place
According to Relph (2001), a place is a territory of meanings. Therefore, a sense of place is the
distinctiveness of place embedded with the cultural transformations and traditions associated with the
historic use and habitation of the area (Young & Martin, 2016). Place attachment is the symbolic
relationship formed by people attributing culturally shared emotional meanings to a particular piece of
land. It is thus an affective bond between people and place. This personal orientation toward place
assists in understanding a place, which informs environmental meaning. It is a subjective matter and is
dependent on the perceptions of the user and viewer of an area.
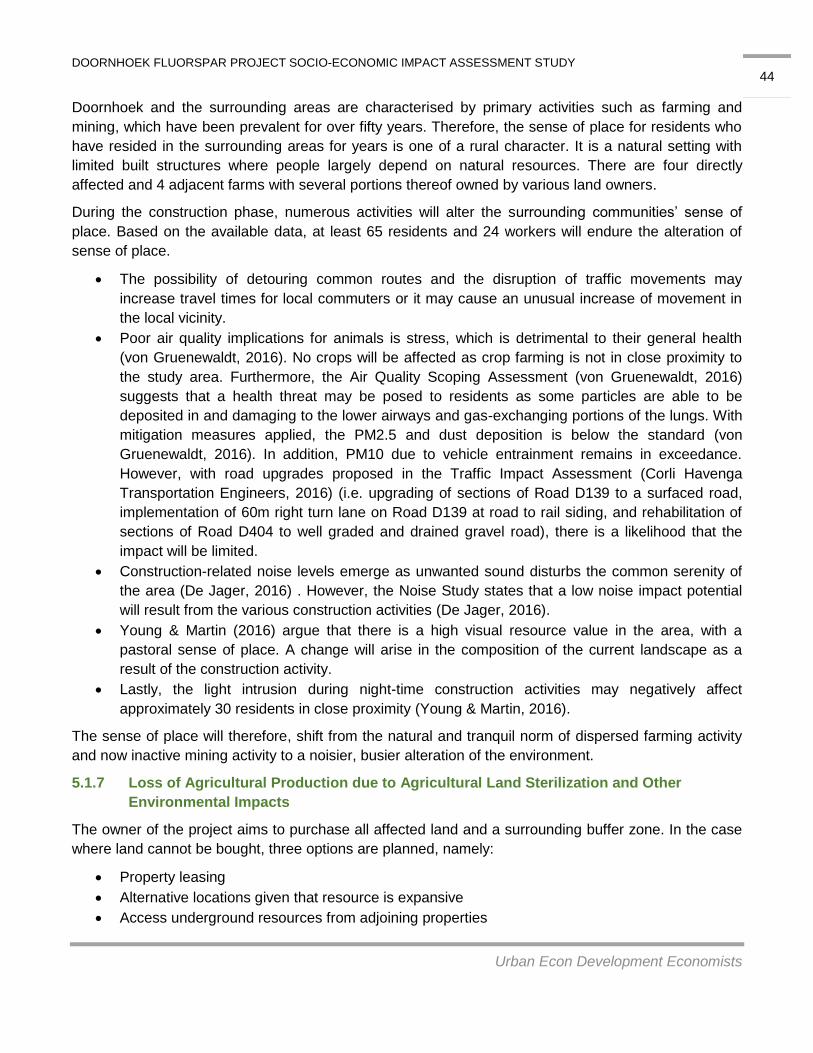
DOORNHOEK FLUORSPAR PROJECT SOCIO-ECONOMIC IMPACT ASSESSMENT STUDY
Urban Econ Development Economists
44
Doornhoek and the surrounding areas are characterised by primary activities such as farming and
mining, which have been prevalent for over fifty years. Therefore, the sense of place for residents who
have resided in the surrounding areas for years is one of a rural character. It is a natural setting with
limited built structures where people largely depend on natural resources. There are four directly
affected and 4 adjacent farms with several portions thereof owned by various land owners.
During the construction phase, numerous activities will alter the surrounding communities’ sense of
place. Based on the available data, at least 65 residents and 24 workers will endure the alteration of
sense of place.
The possibility of detouring common routes and the disruption of traffic movements may
increase travel times for local commuters or it may cause an unusual increase of movement in
the local vicinity.
Poor air quality implications for animals is stress, which is detrimental to their general health
(von Gruenewaldt, 2016). No crops will be affected as crop farming is not in close proximity to
the study area. Furthermore, the Air Quality Scoping Assessment (von Gruenewaldt, 2016)
suggests that a health threat may be posed to residents as some particles are able to be
deposited in and damaging to the lower airways and gas-exchanging portions of the lungs. With
mitigation measures applied, the PM2.5 and dust deposition is below the standard (von
Gruenewaldt, 2016). In addition, PM10 due to vehicle entrainment remains in exceedance.
However, with road upgrades proposed in the Traffic Impact Assessment (Corli Havenga
Transportation Engineers, 2016) (i.e. upgrading of sections of Road D139 to a surfaced road,
implementation of 60m right turn lane on Road D139 at road to rail siding, and rehabilitation of
sections of Road D404 to well graded and drained gravel road), there is a likelihood that the
impact will be limited.
Construction-related noise levels emerge as unwanted sound disturbs the common serenity of
the area (De Jager, 2016) . However, the Noise Study states that a low noise impact potential
will result from the various construction activities (De Jager, 2016).
Young & Martin (2016) argue that there is a high visual resource value in the area, with a
pastoral sense of place. A change will arise in the composition of the current landscape as a
result of the construction activity.
Lastly, the light intrusion during night-time construction activities may negatively affect
approximately 30 residents in close proximity (Young & Martin, 2016).
The sense of place will therefore, shift from the natural and tranquil norm of dispersed farming activity
and now inactive mining activity to a noisier, busier alteration of the environment.
5.1.7 Loss of Agricultural Production due to Agricultural Land Sterilization and Other
Environmental Impacts
The owner of the project aims to purchase all affected land and a surrounding buffer zone. In the case
where land cannot be bought, three options are planned, namely:
Property leasing
Alternative locations given that resource is expansive
Access underground resources from adjoining properties

DOORNHOEK FLUORSPAR PROJECT SOCIO-ECONOMIC IMPACT ASSESSMENT STUDY
Urban Econ Development Economists
45
With reference to Imagery 4-4, the land that will be affected by the mine’s footprint and its associated
infrastructure is owned currently by various parties and used for both commercial and non-commercial
activities. Some of the potentially affected land will be impacted only for five years, other farm potions
will be impacted for the entire duration of the project starting from the construction phase and until the
closure of the mine after 30-years of operations (should the mining right not be extended). The farm
portions to the north are used for commercial exotic game hunting and breeding. The interviews with
the potentially affected parties determine that there are multiple game and livestock units raised on the
farms, which generate approximately R20 million per annum.
An estimated 4 500 ha of land comprise the farms that could potentially be directly affected by the
mine. The mining area is planned to be 177 ha of which 1 ha will certainly be sterilised and consist of
mining infrastructure. Therefore, more than 4 000 ha may still be possible to continue to be used by
existing agricultural activities, if land is not purchased from landowners. Moreover, there is a possibility
that agricultural activity will continue in cases where the mine purchases land and rents out unused
portions. Both livestock and game breeding activities could theoretically continue outside the buffer
zones of the mine. The landowner, may though be required to adapt their agricultural practices, which
could include downscaling their commercial activity and reducing the number of livestock units that are
raised on the land.
In the case of the land that is currently used for game hunting and that comprises Portion 1 (r/e), 5 (r/e),
10 (ptn of 4), 29 (ptn of 1), 2+ (ptn of 6), 27 (ptn of 6) of the Farm Kafferskraal 306 JP, the situation may
be different, though. The way these farm portions are located relative to the mine’s planned mining
areas and infrastructure, it is likely that the owner of these farm portions will no longer be able to
continue with game hunting and will have to close and/or move his businesses somewhere else. This
could result in the loss of substantial revenue to the owner, reduced agricultural production in the
region, and the loss of seven jobs.
In addition to the above, the mine will have a negative effect on the surrounding farms as a result of
various environmental impacts. Some of the farms located in the direct proximity to the farm portions
where various project elements will be located are also used for commercial game hunting and are
therefore sensitive to the change in the sense of place. It is not possible to determine with certainty
whether the local game farms will lose their tourist customers, but the possibility does exist and its
likelihood will depend on the extent to which construction activities and following it operations will
impact the surrounding farms. Based on the studies conducted by the visual and noise specialists, the
visual and noise effects on the adjacent farms used for commercial game hunting and breeding are
expected to be notable; therefore, the risk of losing tourists and subsequently employment (around 100
people) is possible. However, it should be noted that not all owners of these commercial activities have
raised concerns related to the loss of tourists and the possibility of business closure, which means that
some of the local businesses are not envisioning any loses. Various mitigation measures have been
proposed by the respective specialists in order to reduce the expected impacts relating to the stated
impacts.
5.1.8 Increase in Social Pathologies
The Doornhoek Fluorspar Project construction phase does not solely require construction labourers but
also general supportive activities and highly specialised skills that are required by mining and

DOORNHOEK FLUORSPAR PROJECT SOCIO-ECONOMIC IMPACT ASSESSMENT STUDY
Urban Econ Development Economists
46
processing plant activities. However, an alarmingly high composition of 82.4% and 79.4% of the
Ditsobotla LM and Ramotshere Moiloa LM, respectively, are semi- and unskilled workers. Although the
project is expected to capitalise on the fact that the nearby Witkop Mine has been put on maintenance
and that some of the skilled workers have remained in the area; a shortage of middle to highly skilled
workers locally is still expected, which means that migrant workers are likely to be moving into the
region. Migrant workers are planned to be located in Zeerust. The project will create pull factors and as
a result, job seekers will migrate into the area with prospects of attaining employment.
The consequences of a male-dominated influx are the exacerbation of social ills. Social pathologies
that exist in the local mentalities include alcohol abuse, which stems from the high level of
unemployment. It is expected that drug and alcohol abuse will worsen, thus deteriorating the social
fabric. Associated behaviour is drunkenness, violence, disorder and noise that may emanate from the
drinking establishments. In addition, prostitution may be on a rise and will cause a rise in communicable
diseases, Sexually Transmitted Infections (STI’s) and HIV/AIDS.
Available employment opportunities during the construction phase are estimated at around 222, of
which 40%-60% will be filled by locals. Therefore, opportunities for job seekers that may be migrating
into the area will be limited. Without adequate and sustainable income, individuals are susceptible to
behaviour leading to crime and alcoholism. Moreover, some of the local landowners have already
expressed a personal safety concern as well as the possibility of livestock theft due to the influx of
people into the area and presence of relatively large number of constructions workers on the affected
properties. A positive alternative to income creation for unsuccessful job seekers may be business
establishments as an increase in people in an area will require a greater supply of products and
services. Additionally, job seekers who may not have acquired employment during the construction
phase might continue to reside in the area due to the prospect of opportunities during the operational
phase.
The unemployment rate in the North West Province is 31.4% and there is a high dependency ratio. In
such contexts, projects such as the Doornhoek Fluorspar are sought after. A conflict between locals
and migrants may consequently ensue as locals perceive migrants as receivers of the jobs they need
and desire. It may be worsened if the migrants are foreign nationals, as xenophobic attacks may arise.
In essence, economic deprivation, prosperity and change influence social pathology. The greater the
influx, the greater the social pathologies will be. In terms of mitigation, the in-migration of people to the
area is not controllable.
5.1.9 Added Pressure on Basic Services and Social and Economic infrastructure
The Ditsobotla LM and Ramotshere Moiloa LM are comprised of both urban and rural areas. Notable
disparities in service provision are evident between urban areas such as Zeerust and Lichtenburg,
which have satisfactory service provision; whereas the rural areas such as Dinkana and Kruisrivier
have a relatively poor level of service provision.
Between 89 to 134 migrant workers are planned to migrate to the area for the period of construction
activities and will be accommodated in Zeerust. The local expenditure by the migrant workers will
enable the municipality to maintain and support the increase in service usage that will be generated as
a result of their movement into the area. On the contrary, migrant job seekers, due to limited or no

DOORNHOEK FLUORSPAR PROJECT SOCIO-ECONOMIC IMPACT ASSESSMENT STUDY
Urban Econ Development Economists
47
finances may either rent from existing accommodation or develop informal settlements. The informal
settlement proliferation may be propagated by the highly inflated rent of the area. This presence and
growth of migrant job seekers in the rural areas will place pressure on the already insufficient and
inadequate basic services.
Water provision is the most concerning basic service due to:
The 25km distance of the water source to the closest settlement;
The 33% of the population who do not have adequate access to water;
Drought; and the
Ill-managed water source and infrastructure.
Water scarcity has, in a previous mining project near Groot Marico, resulted in social unrest. The local
community opposed the development and operation of the mine due to the limited water supply, which
would have worsened if the project was implemented. Furthermore, the Marico Oog tourism facility has
a natural spring of water and thus has water of a high quality and one of the cleanest in the country.
The facility’s owner is concerned about the disturbance the mining activities will have on the natural
resource located at the Marico Oog. The Groundwater Impact Assessment Study (Exigo, 2016),
though, estimated that the zone of influence for mine dewatering and other potential effects on water
will not extend to the Marico Oog, thus it will not be impacted. Furthermore, the report stated that any
potential impacts associated with water dewatering or depletion of water in boreholes is very low or
negligible once the mitigation measures are implemented (Exigo, 2016).
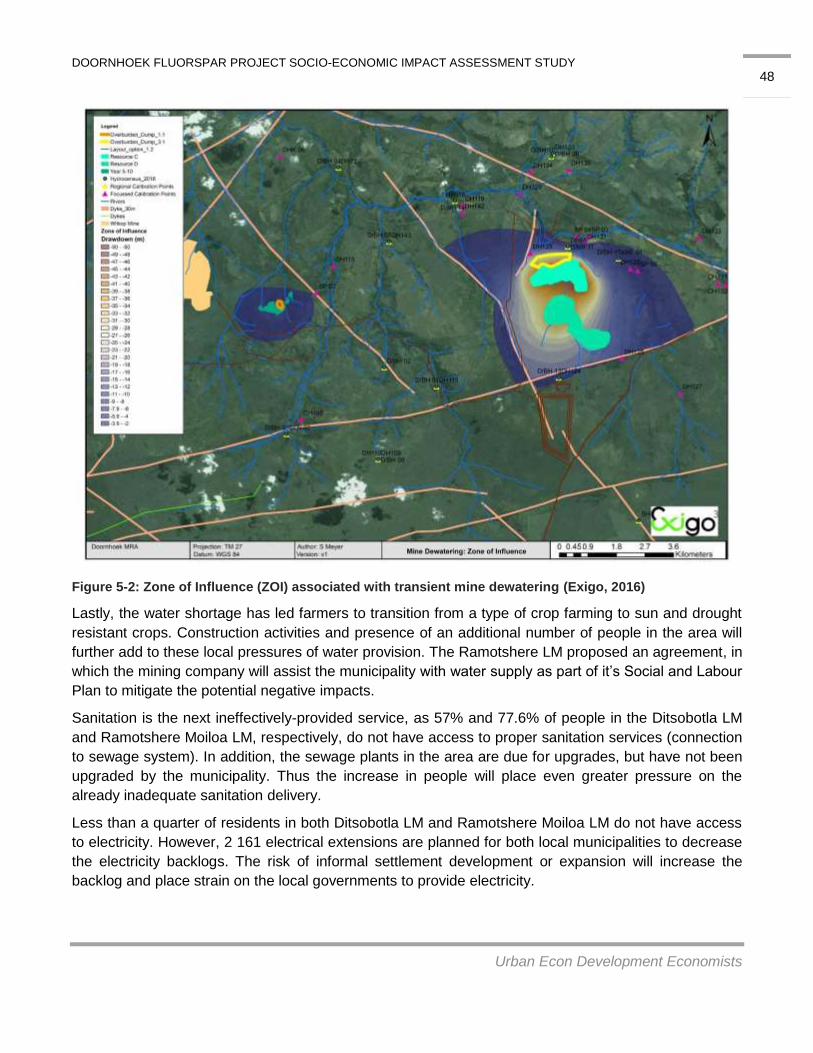
DOORNHOEK FLUORSPAR PROJECT SOCIO-ECONOMIC IMPACT ASSESSMENT STUDY
Urban Econ Development Economists
48
Figure 5-2: Zone of Influence (ZOI) associated with transient mine dewatering (Exigo, 2016)
Lastly, the water shortage has led farmers to transition from a type of crop farming to sun and drought
resistant crops. Construction activities and presence of an additional number of people in the area will
further add to these local pressures of water provision. The Ramotshere LM proposed an agreement, in
which the mining company will assist the municipality with water supply as part of it’s Social and Labour
Plan to mitigate the potential negative impacts.
Sanitation is the next ineffectively-provided service, as 57% and 77.6% of people in the Ditsobotla LM
and Ramotshere Moiloa LM, respectively, do not have access to proper sanitation services (connection
to sewage system). In addition, the sewage plants in the area are due for upgrades, but have not been
upgraded by the municipality. Thus the increase in people will place even greater pressure on the
already inadequate sanitation delivery.
Less than a quarter of residents in both Ditsobotla LM and Ramotshere Moiloa LM do not have access
to electricity. However, 2 161 electrical extensions are planned for both local municipalities to decrease
the electricity backlogs. The risk of informal settlement development or expansion will increase the
backlog and place strain on the local governments to provide electricity.
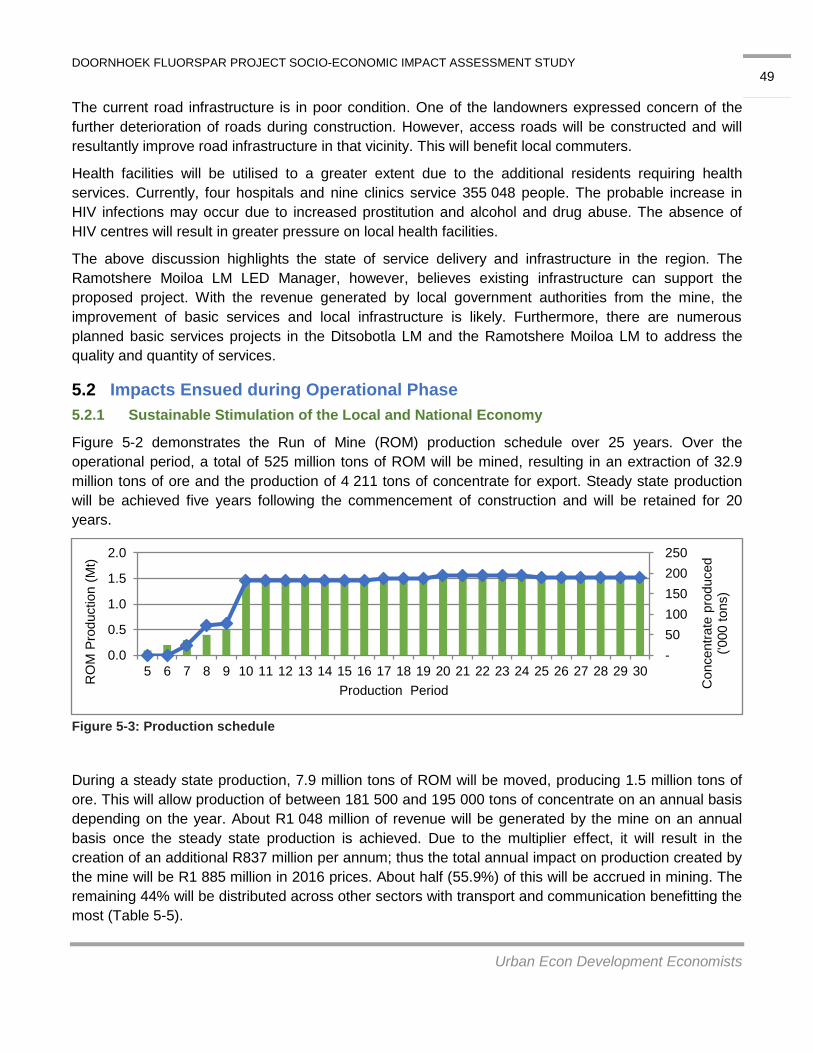
DOORNHOEK FLUORSPAR PROJECT SOCIO-ECONOMIC IMPACT ASSESSMENT STUDY
Urban Econ Development Economists
49
The current road infrastructure is in poor condition. One of the landowners expressed concern of the
further deterioration of roads during construction. However, access roads will be constructed and will
resultantly improve road infrastructure in that vicinity. This will benefit local commuters.
Health facilities will be utilised to a greater extent due to the additional residents requiring health
services. Currently, four hospitals and nine clinics service 355 048 people. The probable increase in
HIV infections may occur due to increased prostitution and alcohol and drug abuse. The absence of
HIV centres will result in greater pressure on local health facilities.
The above discussion highlights the state of service delivery and infrastructure in the region. The
Ramotshere Moiloa LM LED Manager, however, believes existing infrastructure can support the
proposed project. With the revenue generated by local government authorities from the mine, the
improvement of basic services and local infrastructure is likely. Furthermore, there are numerous
planned basic services projects in the Ditsobotla LM and the Ramotshere Moiloa LM to address the
quality and quantity of services.
Impacts Ensued during Operational Phase 5.2
5.2.1 Sustainable Stimulation of the Local and National Economy
Figure 5-2 demonstrates the Run of Mine (ROM) production schedule over 25 years. Over the
operational period, a total of 525 million tons of ROM will be mined, resulting in an extraction of 32.9
million tons of ore and the production of 4 211 tons of concentrate for export. Steady state production
will be achieved five years following the commencement of construction and will be retained for 20
years.
Figure 5-3: Production schedule
During a steady state production, 7.9 million tons of ROM will be moved, producing 1.5 million tons of
ore. This will allow production of between 181 500 and 195 000 tons of concentrate on an annual basis
depending on the year. About R1 048 million of revenue will be generated by the mine on an annual
basis once the steady state production is achieved. Due to the multiplier effect, it will result in the
creation of an additional R837 million per annum; thus the total annual impact on production created by
the mine will be R1 885 million in 2016 prices. About half (55.9%) of this will be accrued in mining. The
remaining 44% will be distributed across other sectors with transport and communication benefitting the
most (Table 5-5).
-
50
100
150
200
250
0.0
0.5
1.0
1.5
2.0
5 6 7 8 9 10 11 12 13 14 15 16 17 18 19 20 21 22 23 24 25 26 27 28 29 30
Concentr
ate
pro
duced
('0
00 t
ons)
RO
M P
roduction (
Mt)
Production Period
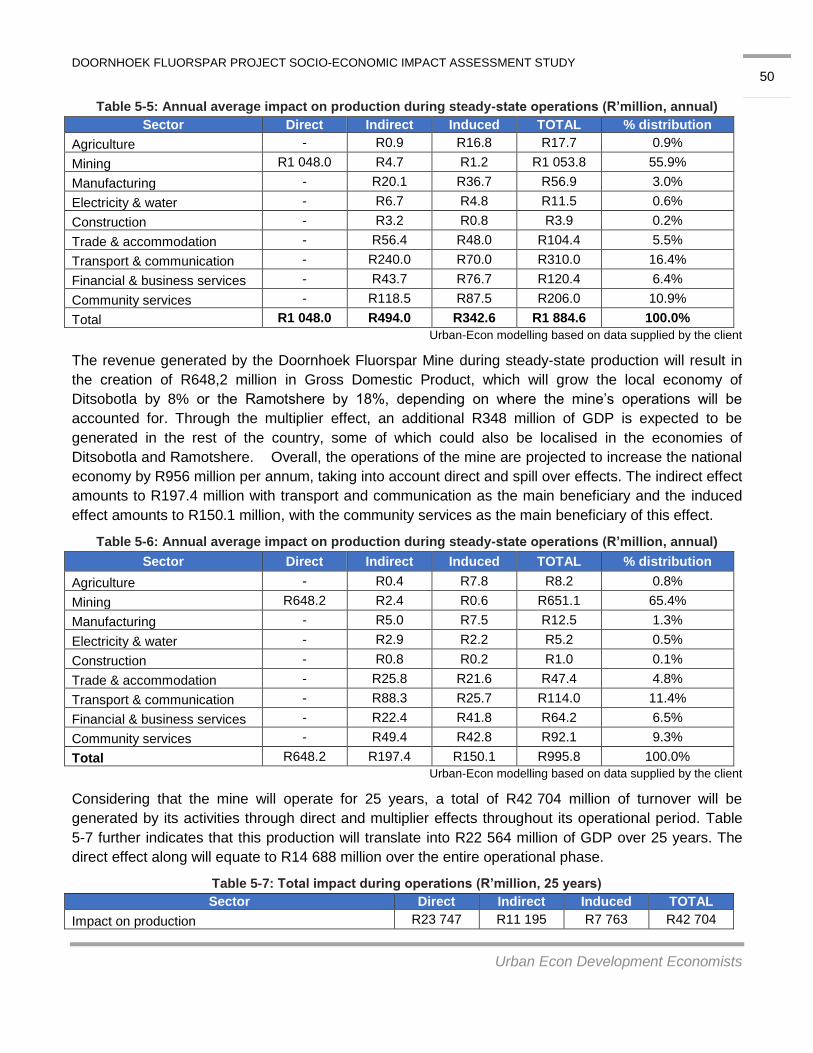
DOORNHOEK FLUORSPAR PROJECT SOCIO-ECONOMIC IMPACT ASSESSMENT STUDY
Urban Econ Development Economists
50
Table 5-5: Annual average impact on production during steady-state operations (R’million, annual)
Sector Direct Indirect Induced TOTAL % distribution
Agriculture - R0.9 R16.8 R17.7 0.9%
Mining R1 048.0 R4.7 R1.2 R1 053.8 55.9%
Manufacturing - R20.1 R36.7 R56.9 3.0%
Electricity & water - R6.7 R4.8 R11.5 0.6%
Construction - R3.2 R0.8 R3.9 0.2%
Trade & accommodation - R56.4 R48.0 R104.4 5.5%
Transport & communication - R240.0 R70.0 R310.0 16.4%
Financial & business services - R43.7 R76.7 R120.4 6.4%
Community services - R118.5 R87.5 R206.0 10.9%
Total R1 048.0 R494.0 R342.6 R1 884.6 100.0%
Urban-Econ modelling based on data supplied by the client
The revenue generated by the Doornhoek Fluorspar Mine during steady-state production will result in
the creation of R648,2 million in Gross Domestic Product, which will grow the local economy of
Ditsobotla by 8% or the Ramotshere by 18%, depending on where the mine’s operations will be
accounted for. Through the multiplier effect, an additional R348 million of GDP is expected to be
generated in the rest of the country, some of which could also be localised in the economies of
Ditsobotla and Ramotshere. Overall, the operations of the mine are projected to increase the national
economy by R956 million per annum, taking into account direct and spill over effects. The indirect effect
amounts to R197.4 million with transport and communication as the main beneficiary and the induced
effect amounts to R150.1 million, with the community services as the main beneficiary of this effect.
Table 5-6: Annual average impact on production during steady-state operations (R’million, annual)
Sector Direct Indirect Induced TOTAL % distribution
Agriculture - R0.4 R7.8 R8.2 0.8%
Mining R648.2 R2.4 R0.6 R651.1 65.4%
Manufacturing - R5.0 R7.5 R12.5 1.3%
Electricity & water - R2.9 R2.2 R5.2 0.5%
Construction - R0.8 R0.2 R1.0 0.1%
Trade & accommodation - R25.8 R21.6 R47.4 4.8%
Transport & communication - R88.3 R25.7 R114.0 11.4%
Financial & business services - R22.4 R41.8 R64.2 6.5%
Community services - R49.4 R42.8 R92.1 9.3%
Total R648.2 R197.4 R150.1 R995.8 100.0%
Urban-Econ modelling based on data supplied by the client
Considering that the mine will operate for 25 years, a total of R42 704 million of turnover will be
generated by its activities through direct and multiplier effects throughout its operational period. Table
5-7 further indicates that this production will translate into R22 564 million of GDP over 25 years. The
direct effect along will equate to R14 688 million over the entire operational phase.
Table 5-7: Total impact during operations (R’million, 25 years)
Sector Direct Indirect Induced TOTAL
Impact on production R23 747 R11 195 R7 763 R42 704
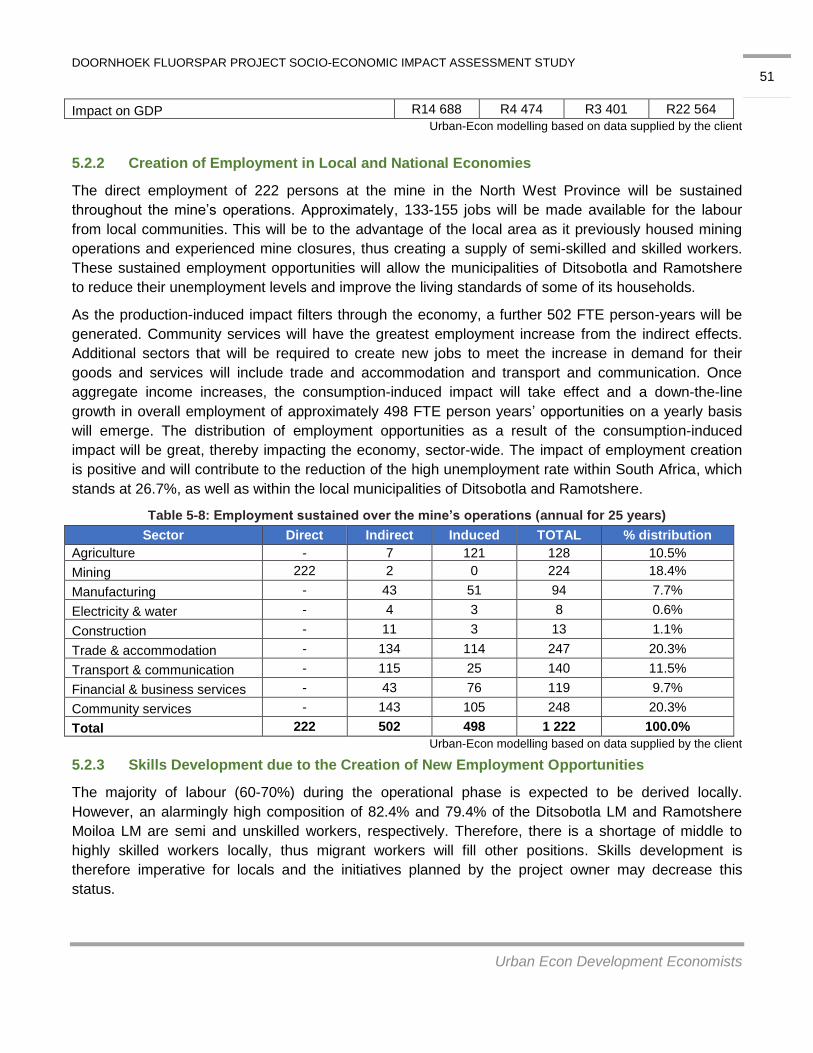
DOORNHOEK FLUORSPAR PROJECT SOCIO-ECONOMIC IMPACT ASSESSMENT STUDY
Urban Econ Development Economists
51
Impact on GDP R14 688 R4 474 R3 401 R22 564
Urban-Econ modelling based on data supplied by the client
5.2.2 Creation of Employment in Local and National Economies
The direct employment of 222 persons at the mine in the North West Province will be sustained
throughout the mine’s operations. Approximately, 133-155 jobs will be made available for the labour
from local communities. This will be to the advantage of the local area as it previously housed mining
operations and experienced mine closures, thus creating a supply of semi-skilled and skilled workers.
These sustained employment opportunities will allow the municipalities of Ditsobotla and Ramotshere
to reduce their unemployment levels and improve the living standards of some of its households.
As the production-induced impact filters through the economy, a further 502 FTE person-years will be
generated. Community services will have the greatest employment increase from the indirect effects.
Additional sectors that will be required to create new jobs to meet the increase in demand for their
goods and services will include trade and accommodation and transport and communication. Once
aggregate income increases, the consumption-induced impact will take effect and a down-the-line
growth in overall employment of approximately 498 FTE person years’ opportunities on a yearly basis
will emerge. The distribution of employment opportunities as a result of the consumption-induced
impact will be great, thereby impacting the economy, sector-wide. The impact of employment creation
is positive and will contribute to the reduction of the high unemployment rate within South Africa, which
stands at 26.7%, as well as within the local municipalities of Ditsobotla and Ramotshere.
Table 5-8: Employment sustained over the mine’s operations (annual for 25 years)
Sector Direct Indirect Induced TOTAL % distribution
Agriculture - 7 121 128 10.5%
Mining 222 2 0 224 18.4%
Manufacturing - 43 51 94 7.7%
Electricity & water - 4 3 8 0.6%
Construction - 11 3 13 1.1%
Trade & accommodation - 134 114 247 20.3%
Transport & communication - 115 25 140 11.5%
Financial & business services - 43 76 119 9.7%
Community services - 143 105 248 20.3%
Total 222 502 498 1 222 100.0%
Urban-Econ modelling based on data supplied by the client
5.2.3 Skills Development due to the Creation of New Employment Opportunities
The majority of labour (60-70%) during the operational phase is expected to be derived locally.
However, an alarmingly high composition of 82.4% and 79.4% of the Ditsobotla LM and Ramotshere
Moiloa LM are semi and unskilled workers, respectively. Therefore, there is a shortage of middle to
highly skilled workers locally, thus migrant workers will fill other positions. Skills development is
therefore imperative for locals and the initiatives planned by the project owner may decrease this
status.

DOORNHOEK FLUORSPAR PROJECT SOCIO-ECONOMIC IMPACT ASSESSMENT STUDY
Urban Econ Development Economists
52
SA Fluorite has developed a Skills Development Plan (SDP). The initiatives of the plan can be divided
into direct and secondary benefits. The direct benefit entails that there will be a result from operational
activities, whereas secondary benefits are benefits unrelated to the operational activities. The SDP
contains the following programmes (Metago, 2016):
Direct Benefit
Portable Skills Program: Employed labourers will be trained and thus attain or strengthen
specific skills required during the operations phase. The benefits of this will be the decrease in
the number of unskilled and semi-skilled labour in the municipalities. The investment in human
capital equips employees with skills that improve their employability after the project.
Mentorship: Mentorship will be offered to guide labourers during construction. This supportive
relationship may enhance individual performance as a knowledgeable person is available and
assists in the workers’ growth path.
Learnerships and Internships: Only 6.7% and 6.3% of people in Ditsobotla LM and Ramotshere
Moiloa LM have acquired higher education qualification(s). The very limited number of students
who are currently studying towards a relevant qualification, will have the opportunity to work
while studying in the Learnerships, and those who have acquired their qualifications will attain
work experience in the internships.
Indirect Benefit
Adult Basic Education and Training: The ABET enables adults to attain relevant and necessary
literacy education and training of actual routine jobs. The basic skills attained will have a
permanent impact and improve the likelihood of future general work for the employees.
Bursary Program: The common reluctance and discouragement to further studies due to dire
opportunities dampens future prospects for the area. Financial constraints are an additional
reason why people cannot further their studies; thus the bursary program financially aids
students who then have the opportunity to gain marketable knowledge and skills (Metago,
2016).
The operational phase will occur over a duration of three phases cumulatively amounting to 25 years.
The successful implementation of the SDP will have long-term benefits to the employees and local
residents and will complement existing local skills development initiatives.
5.2.4 Increase in household income and standard of living
During steady state production at the Doornhoek Fluorspar mine, annual household income is expected
to increase by R289 million throughout the country. Direct beneficiaries are estimated to earn R120,4
million on average annually. Production-induced impacts will generate an additional annual increase in
household income to the value of R96,1 million. The majority of it will be earned by households with
members employed within the transport and communication sector. Through the spending of household
income created as a result of direct and indirect effects of the mining operations, an additional R72.3
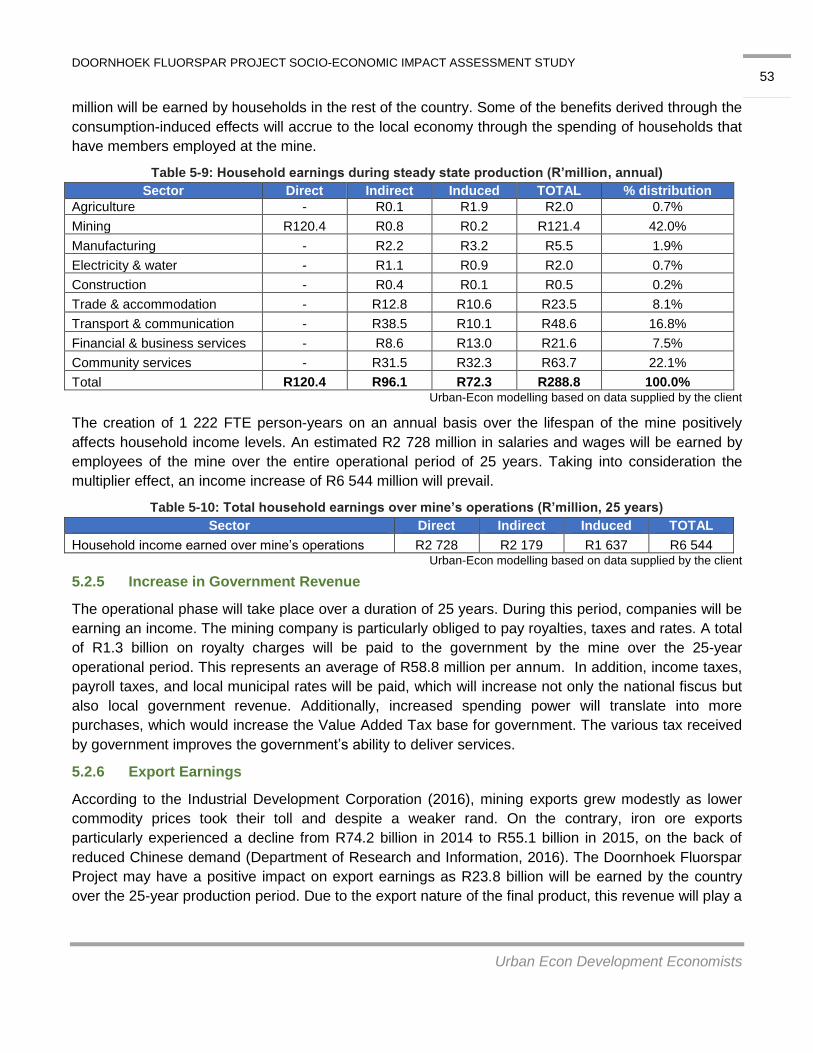
DOORNHOEK FLUORSPAR PROJECT SOCIO-ECONOMIC IMPACT ASSESSMENT STUDY
Urban Econ Development Economists
53
million will be earned by households in the rest of the country. Some of the benefits derived through the
consumption-induced effects will accrue to the local economy through the spending of households that
have members employed at the mine.
Table 5-9: Household earnings during steady state production (R’million, annual)
Sector Direct Indirect Induced TOTAL % distribution
Agriculture - R0.1 R1.9 R2.0 0.7%
Mining R120.4 R0.8 R0.2 R121.4 42.0%
Manufacturing - R2.2 R3.2 R5.5 1.9%
Electricity & water - R1.1 R0.9 R2.0 0.7%
Construction - R0.4 R0.1 R0.5 0.2%
Trade & accommodation - R12.8 R10.6 R23.5 8.1%
Transport & communication - R38.5 R10.1 R48.6 16.8%
Financial & business services - R8.6 R13.0 R21.6 7.5%
Community services - R31.5 R32.3 R63.7 22.1%
Total R120.4 R96.1 R72.3 R288.8 100.0% Urban-Econ modelling based on data supplied by the client
The creation of 1 222 FTE person-years on an annual basis over the lifespan of the mine positively
affects household income levels. An estimated R2 728 million in salaries and wages will be earned by
employees of the mine over the entire operational period of 25 years. Taking into consideration the
multiplier effect, an income increase of R6 544 million will prevail.
Table 5-10: Total household earnings over mine’s operations (R’million, 25 years)
Sector Direct Indirect Induced TOTAL
Household income earned over mine’s operations R2 728 R2 179 R1 637 R6 544 Urban-Econ modelling based on data supplied by the client
5.2.5 Increase in Government Revenue
The operational phase will take place over a duration of 25 years. During this period, companies will be
earning an income. The mining company is particularly obliged to pay royalties, taxes and rates. A total
of R1.3 billion on royalty charges will be paid to the government by the mine over the 25-year
operational period. This represents an average of R58.8 million per annum. In addition, income taxes,
payroll taxes, and local municipal rates will be paid, which will increase not only the national fiscus but
also local government revenue. Additionally, increased spending power will translate into more
purchases, which would increase the Value Added Tax base for government. The various tax received
by government improves the government’s ability to deliver services.
5.2.6 Export Earnings
According to the Industrial Development Corporation (2016), mining exports grew modestly as lower
commodity prices took their toll and despite a weaker rand. On the contrary, iron ore exports
particularly experienced a decline from R74.2 billion in 2014 to R55.1 billion in 2015, on the back of
reduced Chinese demand (Department of Research and Information, 2016). The Doornhoek Fluorspar
Project may have a positive impact on export earnings as R23.8 billion will be earned by the country
over the 25-year production period. Due to the export nature of the final product, this revenue will play a
DOORNHOEK FLUORSPAR PROJECT SOCIO-ECONOMIC IMPACT ASSESSMENT STUDY
Urban Econ Development Economists
54
long term role within the current account. Thus, a positive effect on the balance of payment in the
country will additionally occur.
5.2.7 Change in Sense of Place
The sense of place is the distinct value that is allocated to a specific place through the cognitive
experience of the user or viewer (Young & Martin, 2016). The sense of place in terms of air quality,
noise and visual elements is expected to change as a result of the mining infrastructure construction.
These changes were noted in the construction phase impact analysis. The purpose of this section is to
analyse the further alteration of the experience of place during the operational phase.
Firstly, gaseous and particulate emissions and fugitive dust will potentially be emitted but to a
reduced extent from the mining operations (von Gruenewaldt, 2016). This insinuates that a
possible health threat may be posed to residents as some particles are able to be deposited in
and damaging to the lower airways and gas-exchanging portions of the lungs (von Gruenewaldt,
2016). With mitigation measures applied, the PM2.5 and dust deposition is below the standard.
In addition, PM10 due to vehicle entrainment remains in exceedance. However, with road
upgrades, there is a likelihood that the impact will be limited.
In terms of noise impacts, De Jager (2016) indicated that the average acceptable sound levels are 36
dBa and 61 dBa for a rural area and an industrial area, respectively. An increase in these sound levels
will occur. The most significant noise contributor identified is road traffic volumes and speeds. However,
worst case scenario projections indicate that operational phase noise levels will comply with the Noise
Control Regulations. In addition, in years 5-10 a large mountain region bisecting the study area will
serve as a buffer of noise from open cast activities to receptors (De Jager, 2016).
The visual impact will improve from the construction phase to the operational phase. Young and Martin
(2016) have noted that the visual change will mostly be visible from areas located to the north, south
and south-east of the mine. The Marico Oog tourism facility, which is 10km from the mine, will not be
affected due to the fact that over 10km the vision diminishes due to the reduced effect of distance.
From the above, it is clear that the overall sense of place will change but it will not drastically affect the
24 people residing and/or working in the immediate zone of influence of the project.
5.2.8 Improved Quality of Life and Service Delivery
The operations phase is set to take 25 years. This duration insinuates a permanent residence for
certain staff such as managerial, administrative and highly skilled staff. Other specialised staff will
reside in the area for shorter periods. Permanent staff will have the option of relocating to preferable
areas, while the rest of the staff will reside in Zeerust. The financial contribution made by the migrant
workers and a percentage of the revenue generated by the mine will enable the municipality to
maintain, improve and support the increase in service provision.
Furthermore, there are numerous planned basic services projects in the Ditsobotla LM and Ramotshere
Moila LM to address the quality and quantity of services. The mine specifically plans to assist in
addressing the local water-related shortages by allocating over R2 million during the first five years of
its operations towards the Water Project as part of its Local Economic Development contribution.
DOORNHOEK FLUORSPAR PROJECT SOCIO-ECONOMIC IMPACT ASSESSMENT STUDY
Urban Econ Development Economists
55
Further assistance with respect to infrastructure local enterprises development will be provided during
the rest of the mine’s operations.
Impacts ensued during Decommissioning Phase 5.3
The Doornhoek Fluorspar Mine is planned to span for 30 years, including construction and operations.
Thereafter, the termination of the project will occur. The decommissioning process will cost a total of
R75 billion in 2016 prices. This expenditure on closure activities will generate positive impacts on
production, GDP, employment and household income, albeit relatively small and for a temporary
period. Resultantly, the local economy will be stimulated for the duration of the decommissioning
phase. Decommissioning expenditure such as the disassembly of buildings and machinery and
rehabilitation of land will increase the demand for construction services and services offered by other
industries.
The decommissioning process will inform the land restoration process. Infrastructure such as roads and
service-related facilities (building), water and storm water systems may be utilised for future activities.
Socio-economic impacts projected to emerge during the closure phase are expected to be similar to
those that take place during the construction phase. For instance, noise levels will be similar to that
observed during the construction phase (De Jager, 2016). Impacts will occur for a shorter duration and
will be associated with less expenditure than that observed during the construction period.
It can be assumed that the existence of the project in the community will create a significant stimulus,
leading to industry development in the area and the availabilities of opportunities even after
decommissioning of the mine. Nonetheless, most impacts will cease to exist, during and succeeding
the project.
DOORNHOEK FLUORSPAR PROJECT SOCIO-ECONOMIC IMPACT ASSESSMENT STUDY
Urban Econ Development Economists
56
6 CONCLUSION The planned fluorspar mining operations are proposed to be located south of Zeerust but in both the
Ditsobotla and Ramotshere Moiloa LMs, which form part of the North-West Province. The national,
provincial and local levels acknowledge in their policies and strategies the need to develop the mining
sector and promote private investment to stimulate growth in the area. Considering the impact of mining
activities on the environment, they also underline the necessity to protect the ecosystem and use water
resources in an efficient and sustainable way. Furthermore, mining should contribute to the socio-
economic development of the communities in the area, especially through local enterprise development
and local procurement. The planned mining operations are in line with the national, provincial and local
priorities and do not appear to conflict with other activities in the area.
The planned mining activities should further promote the development of an area with a small economy,
a high unemployment rate (i.e. 28.4% and 36,3% of unemployed people in the Ditsobotla LM and
Ramotshere Moiloa LM respectively), and large disparities between urban and rural areas. The towns
of Zeerust and Lichtenburg are well developed, and Zeerust is particularly well developed when
focusing on indicators such as income levels and access to basic services. It was indicated that labour
for the proposed project is planned to be sourced from the local community as far as possible, and be
accommodated in the town of Zeerust.
The assessment of the current socio-economic situation in the local municipalities, the profile of the
zone of influence, and the project itself revealed that the proposed mining activity will create numerous
positive impacts and will likely stimulate the local economy. The stimulation of the national economy will
occur as a result of the increase in production. This has numerous benefits, such as employment
creation, a rise in consumption levels, new business sales and a contribution to GDP.
Overall, R1 513.5 million of GDP during construction and R22 564 million of GDP during the operational
phase will be created in the South African economy because of the proposed mine’s operations. A total
of 4 397 FTE person-years will be created during construction in the entire national economy and an
additional 1 222 FTE jobs will be supported on an annual basis for the entire mine’s operations of 25
years examined in this study. The mine will create at least 222 sustainable employment opportunities
on site that will be filled largely by people coming from the local communities and will increase
government revenue base. The salaries paid out to local employees will result in an increase in the
average household income. Given that both municipalities are relatively poor, an elevated household
income will improve their standard of living and reduce poverty. In addition, as income increases, the
consumption levels increase will consequently boost the local economy. However, due to the nature of
the area where the proposed mine is to be established, some negative socio-economic impacts can
also be created as a result of the mine’s development.
Firstly, the mine could have a negative effect on the local supply of water, which is currently a
major service delivery challenge for the local government.
It would also impact on the sense of place and transform the rural agricultural areas into an
industrial area.
DOORNHOEK FLUORSPAR PROJECT SOCIO-ECONOMIC IMPACT ASSESSMENT STUDY
Urban Econ Development Economists
57
The people who work and reside on the farms where some of the project infrastructure will be
located, as well as people residing and working on the adjacent farms are likely to be the
recipients of this change in the sense of place.
Linked to the change in the sense of place is the possibility of negative effect on the local
tourism activities represented by game hunting operations. Moreover, some of the farm portions
where the majority of the mine’s footprint will be located are currently used for game hunting
activities and are unlikely to be able to proceed if the mine is built.
Some of the above-mentioned negative effects could be mitigated or could be reduced. Table 6- 1
provides the rating of impacts, while Table 6-2 includes mitigation measures.

Table 6-1: Assessment of potential socio-economic impacts
No Activity Impact Without or With
Mitigation
Nature (Negative
or Positive Impact)
Probability Duration Scale Magnitude/
Severity Significance Mitigation Effect
Ma
gn
itu
de
Sco
re
Ma
gn
itu
de
Sco
re
Ma
gn
itu
de
Sco
re
Ma
gn
itu
de
Sco
re
Sco
re
Ma
gn
itu
de
Construction Phase
1
Capital investment into the establishment of the mine
Stimulation of production and GDP due to investment WOM Positive Definite 5
Short term 1 Regional 3 Medium 6 50 Moderate
N/A WM Positive Definite 5
Short term 1 Regional 3 Medium 6 50 Moderate
2
Capital investment into the establishment of the mine
Stimulation of employment due to investment
WOM Positive Definite 5 Short term 1 Regional 3 Medium 6 50 Moderate
N/A WM Positive Definite 5
Short term 1 Regional 3 Medium 6 50 Moderate
3
Creation of employment Improved standard of living due to creation of employment
WOM Positive Definite 5 Short term 1 Regional 3 Medium 6 50 Moderate
N/A WM Positive Definite 5
Short term 1 Regional 3 Medium 6 50 Moderate
4
Creation of employment Skills development WOM Positive Probable 2
Short term 1 Regional 3 Medium 6 20 Negligible
N/A WM Positive
Highly Probable 4
Short term 1 Regional 3 Medium 6 40 Low
5
Capital investment into the establishment of the mine
Government revenue increase
WOM Positive Definite 5 Short term 1 Regional 3 Medium 6 50 Moderate
N/A WM Positive Definite 5
Short term 1 Regional 3 Medium 6 50 Moderate
6
Sterilisation of land due to construction and mine establishment activities
Loss of agricultural production due to land sterilisation and other environmental impacts
WOM Negative Definite 5 Long term 4 Site 2 High 8 70 High May cause
irreplaceable loss of resources WM Negative
Highly Probable 4
Long term 4 Site 2 Medium 6 48 Moderate
7
Construction activities on site
Change in the sense of place among the directly and indirectly affected communities
WOM Negative Definite 5 Short term 1 Site 2 Medium 6 45 Moderate Can be avoided,
managed or mitigated WM Negative Definite 5
Short term 1 Site 2 Low 2 25 Low

DOORNHOEK FLUORSPAR PROJECT SOCIO-ECONOMIC IMPACT ASSESSMENT STUDY
Urban Econ Development Economists
59
8
Influx of job seekers Added pressure on basic service delivery and economic infrastructure
WOM Negative Highly Probable 4
Medium term 3 Regional 3 Medium 6 48 Moderate Can be avoided,
managed or mitigated WM Negative Probable 2
Medium term 3 Regional 3 Low 2 16 Negligible
9
Capital investment into the establishment of the mine and recruitment of construction workers
Increase in social pathologies (Crime, xenophobia, prostitution, etc.) due to influx of people into the area
WOM Negative Probable 2 Medium term 3 Regional 3 Medium 6 24 Low Can be avoided,
managed or mitigated WM Negative Probable 2
Medium term 3 Regional 3 Low 2 16 Negligible
Operational Phase
10
Mining operations Stimulation of production and GDP due to operations
WOM Positive Definite 5 Long term 4 Regional 3 Medium 6 65 High
N/A WM Positive Definite 5
Long term 4 Regional 3 Medium 6 65 High
11
Mining operations Stimulation of employment creation due to operations
WOM Positive Definite 5 Long term 4 Regional 3 Medium 6 65 High
N/A WM Positive Definite 5
Long term 4 Regional 3 Medium 6 65 High
12
Mining operations Skills development WOM Positive Definite 5
Long term 4 Regional 3 Medium 6 65 High
N/A WM Positive Definite 5
Long term 4 Regional 3 Medium 6 65 High
13
Creation of employment at the mine
Improved standard of living due to creation of employment
WOM Positive Definite 5 Long term 4 Regional 3 Medium 6 65 High
N/A WM Positive Definite 5
Long term 4 Regional 3 Medium 6 65 High
14
Mining operations Increase in government revenue and its ability to deliver services
WOM Positive Definite 5 Long term 4 Regional 3 Medium 6 65 High
N/A WM Positive Definite 5
Long term 4 Regional 3 Medium 6 65 High
15
Extraction and processing of minerals
Export earnings WOM Positive Probable 2
Long term 4 Regional 3 Low 2 18 Negligible
N/A WM Positive Probable 2
Long term 4 Regional 3 Low 2 18 Negligible
16
Presence of the mine and resultant environmental impacts (noise, visual, air quality)
Change in sense of place WOM Negative Definite 5 Long term 4 Regional 3 Medium 6 65 High Can be avoided,
managed or mitigated WM Negative Definite 5
Long term 4 Regional 3 Low 2 45 Moderate
17
Investment into the local communities through SLP
Improved quality of life and service delivery
WOM Positive Highly Probable 4
Long term 4 Regional 3 Low 2 36 Low
N/A WM Positive Definite 5
Long term 4 Regional 3 Low 2 45 Moderate
Closure

DOORNHOEK FLUORSPAR PROJECT SOCIO-ECONOMIC IMPACT ASSESSMENT STUDY
Urban Econ Development Economists
60
18
Expenditure on decommissioning and closure
Stimulation of production and GDP and employment
WOM Positive Definite 5 Short term 1 Regional 3 Low 2 30 Low
N/A WM Positive Definite 5
Short term 1 Regional 3 Low 2 30 Low
Table 6-2: Preliminary mitigation measures for the identified potential socio-economic impacts
No Activity Impact Mitigation Measures Mitigation Effect
Construction Phase
1 Capital investment into the establishment of the mine
Stimulation of production and GDP due to investment
The project developer should engage with local authorities and business organisations to investigate the possibility of procurement of construction materials, goods, and services from local suppliers where feasible
N/A
2 Capital investment into the establishment of the mine
Stimulation of employment due to investment
Employ labour-intensive methods in construction where feasible
N/A Where possible, local labour and sub-contracting to local companies should be considered for employment to increase the positive impact on the local economy
3 Creation of employment
Improved standard of living due to creation of employment
Employ labour-intensive methods in construction where feasible
N/A Where possible, local labour and sub-contracting to local companies should be considered for employment to increase the positive impact on the local economy
4 Creation of employment Skills development
Facilitate knowledge and skills transfer between workers during the construction phases
N/A Set up apprenticeship programmes to build on existing skills or for the advancement of development of new skills for construction workers, especially those coming from the local communities
5 Capital investment into the establishment of the mine
Government revenue increase
None required N/A
6 Sterilisation of land due to construction and mine establishment activities
Loss of agricultural production due to land sterilisation and other environmental impacts
Engage with the directly and indirectly affected farmers to investigate the opportunities to minimise the loss of productive agricultural land
May cause irreplaceable loss of resources
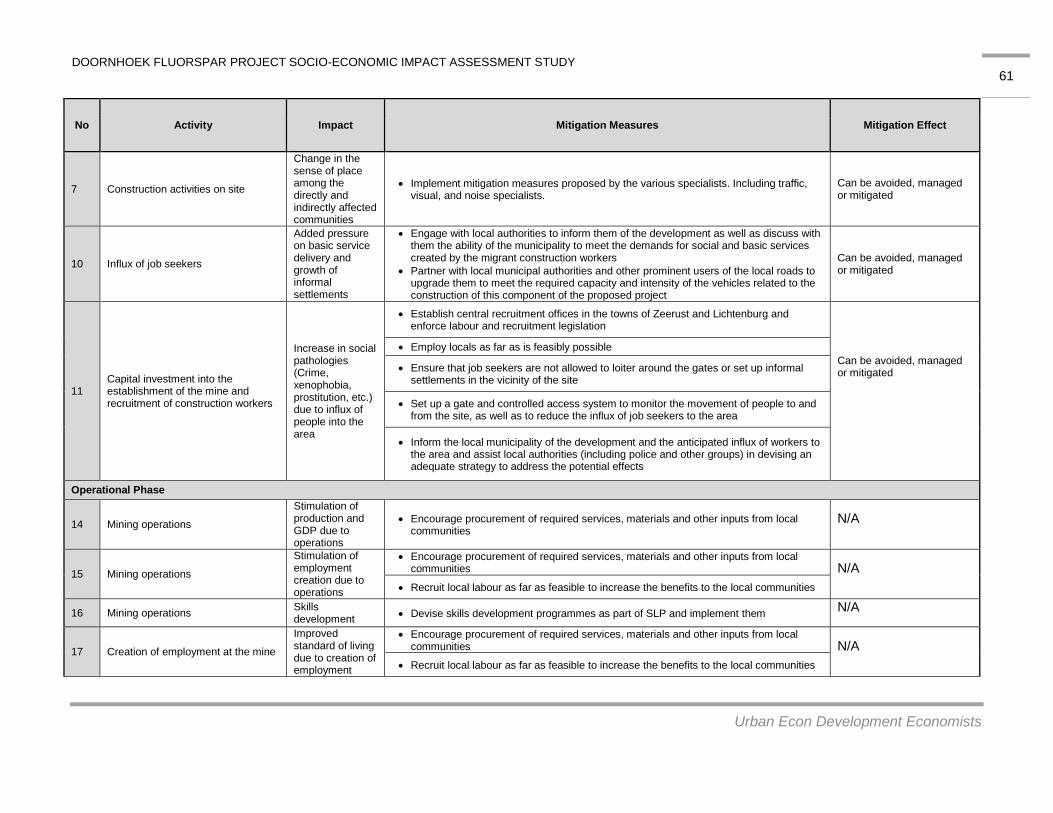
DOORNHOEK FLUORSPAR PROJECT SOCIO-ECONOMIC IMPACT ASSESSMENT STUDY
Urban Econ Development Economists
61
No Activity Impact Mitigation Measures Mitigation Effect
7 Construction activities on site
Change in the sense of place among the directly and indirectly affected communities
Implement mitigation measures proposed by the various specialists. Including traffic, visual, and noise specialists.
Can be avoided, managed or mitigated
10 Influx of job seekers
Added pressure on basic service delivery and growth of informal settlements
Engage with local authorities to inform them of the development as well as discuss with them the ability of the municipality to meet the demands for social and basic services created by the migrant construction workers
Partner with local municipal authorities and other prominent users of the local roads to upgrade them to meet the required capacity and intensity of the vehicles related to the construction of this component of the proposed project
Can be avoided, managed or mitigated
11 Capital investment into the establishment of the mine and recruitment of construction workers
Increase in social pathologies (Crime, xenophobia, prostitution, etc.) due to influx of people into the area
Establish central recruitment offices in the towns of Zeerust and Lichtenburg and enforce labour and recruitment legislation
Can be avoided, managed or mitigated
Employ locals as far as is feasibly possible
Ensure that job seekers are not allowed to loiter around the gates or set up informal settlements in the vicinity of the site
Set up a gate and controlled access system to monitor the movement of people to and from the site, as well as to reduce the influx of job seekers to the area
Inform the local municipality of the development and the anticipated influx of workers to the area and assist local authorities (including police and other groups) in devising an adequate strategy to address the potential effects
Operational Phase
14 Mining operations
Stimulation of production and GDP due to operations
Encourage procurement of required services, materials and other inputs from local communities
N/A
15 Mining operations
Stimulation of employment creation due to operations
Encourage procurement of required services, materials and other inputs from local communities N/A
Recruit local labour as far as feasible to increase the benefits to the local communities
16 Mining operations Skills development
Devise skills development programmes as part of SLP and implement them N/A
17 Creation of employment at the mine
Improved standard of living due to creation of employment
Encourage procurement of required services, materials and other inputs from local communities N/A
Recruit local labour as far as feasible to increase the benefits to the local communities
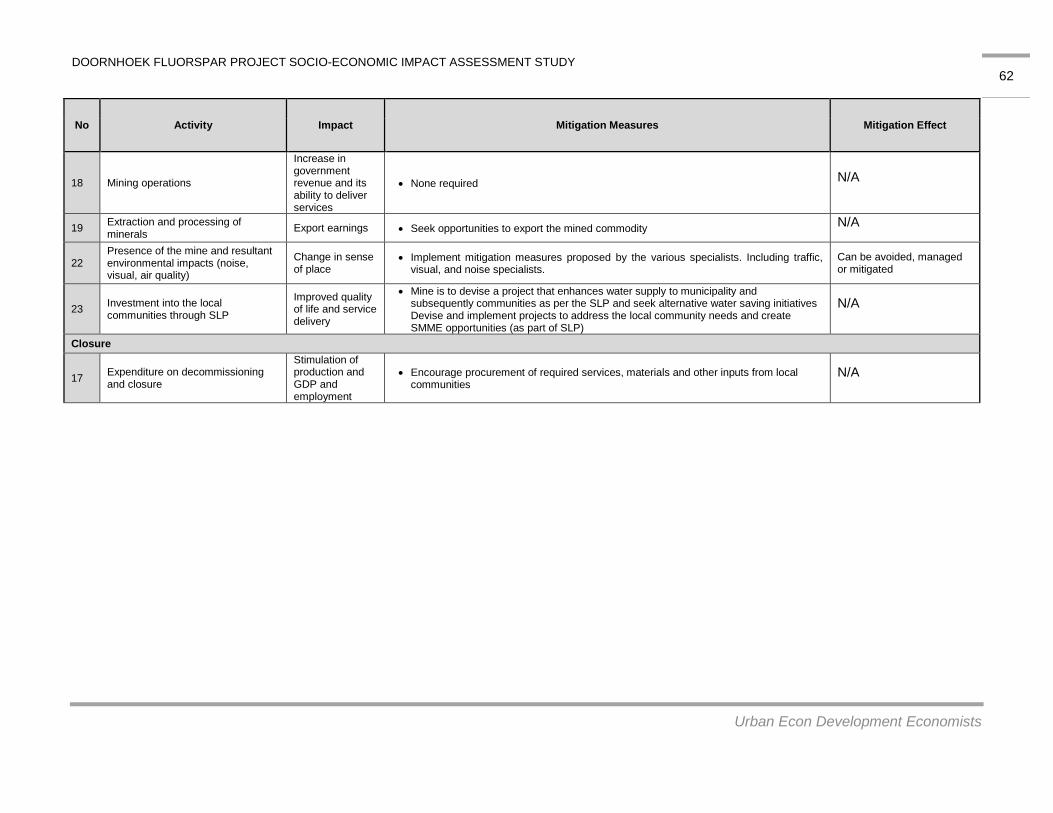
DOORNHOEK FLUORSPAR PROJECT SOCIO-ECONOMIC IMPACT ASSESSMENT STUDY
Urban Econ Development Economists
62
No Activity Impact Mitigation Measures Mitigation Effect
18 Mining operations
Increase in government revenue and its ability to deliver services
None required N/A
19 Extraction and processing of minerals
Export earnings Seek opportunities to export the mined commodity N/A
22 Presence of the mine and resultant environmental impacts (noise, visual, air quality)
Change in sense of place
Implement mitigation measures proposed by the various specialists. Including traffic, visual, and noise specialists.
Can be avoided, managed or mitigated
23 Investment into the local communities through SLP
Improved quality of life and service delivery
Mine is to devise a project that enhances water supply to municipality and subsequently communities as per the SLP and seek alternative water saving initiatives Devise and implement projects to address the local community needs and create SMME opportunities (as part of SLP)
N/A
Closure
17 Expenditure on decommissioning and closure
Stimulation of production and GDP and employment
Encourage procurement of required services, materials and other inputs from local communities
N/A
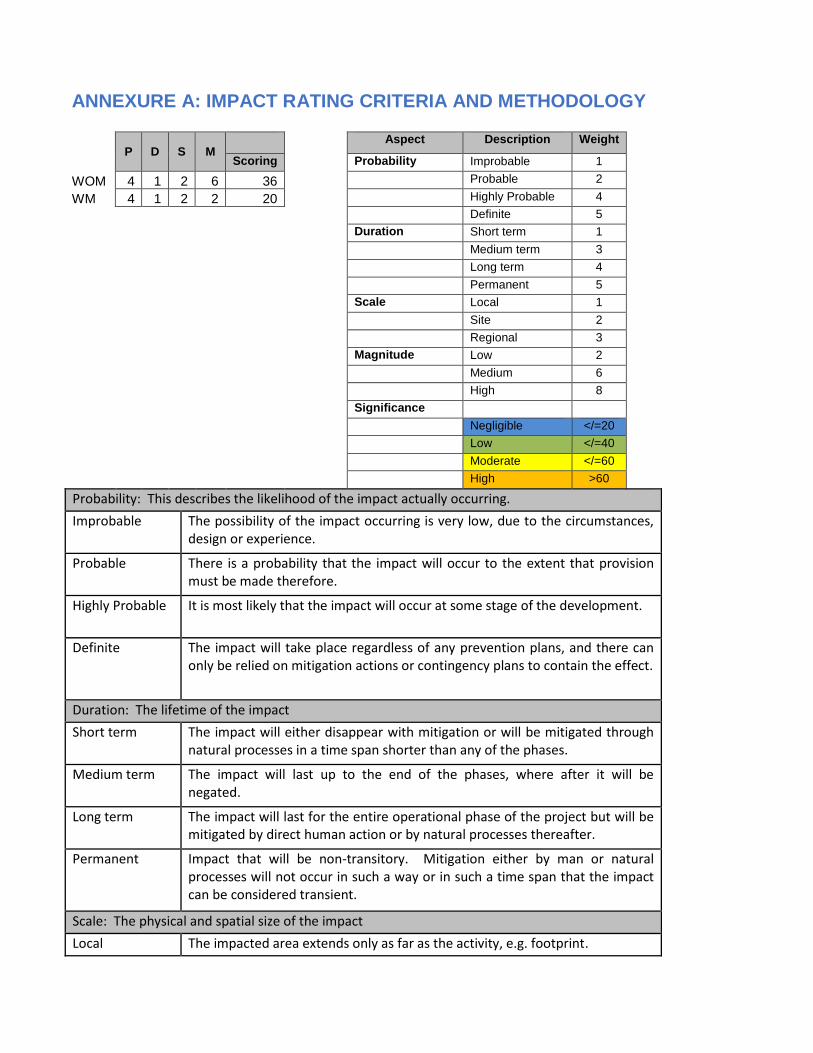
ANNEXURE A: IMPACT RATING CRITERIA AND METHODOLOGY
P D S M Aspect Description Weight
Scoring Probability Improbable 1
WOM 4 1 2 6 36 Probable 2
WM 4 1 2 2 20 Highly Probable 4
Definite 5
Duration Short term 1
Medium term 3
Long term 4
Permanent 5
Scale Local 1
Site 2
Regional 3
Magnitude Low 2
Medium 6
High 8
Significance
Negligible </=20
Low </=40
Moderate </=60
High >60
Probability: This describes the likelihood of the impact actually occurring.
Improbable The possibility of the impact occurring is very low, due to the circumstances, design or experience.
Probable There is a probability that the impact will occur to the extent that provision must be made therefore.
Highly Probable It is most likely that the impact will occur at some stage of the development.
Definite The impact will take place regardless of any prevention plans, and there can only be relied on mitigation actions or contingency plans to contain the effect.
Duration: The lifetime of the impact
Short term The impact will either disappear with mitigation or will be mitigated through natural processes in a time span shorter than any of the phases.
Medium term The impact will last up to the end of the phases, where after it will be negated.
Long term The impact will last for the entire operational phase of the project but will be mitigated by direct human action or by natural processes thereafter.
Permanent Impact that will be non-transitory. Mitigation either by man or natural processes will not occur in such a way or in such a time span that the impact can be considered transient.
Scale: The physical and spatial size of the impact
Local The impacted area extends only as far as the activity, e.g. footprint.

DOORNHOEK FLUORSPAR PROJECT SOCIO-ECONOMIC IMPACT ASSESSMENT STUDY
Urban Econ Development Economists
64
Site The impact could affect the whole, or a measurable portion of the above mentioned properties.
Regional The impact could affect the area including the neighbouring residential areas.
Magnitude/ Severity: Does the impact destroy the environment, or alter its function.
Low The impact alters the affected environment in such a way that natural processes are not affected.
Medium The affected environment is altered, but functions and processes continue in a modified way.
High Function or process of the affected environment is disturbed to the extent where it temporarily or permanently ceases.
Significance: This is an indication of the importance of the impact in terms of both physical extent and time scale, and therefore indicates the level of mitigation required.
Negligible The impact is non-existent or unsubstantial and is of no or little importance to any stakeholder and can be ignored.
Low The impact is limited in extent, has low to medium intensity; whatever its probability of occurrence is, the impact will not have a material effect on the decision and is likely to require management intervention with increased costs.
Moderate The impact is of importance to one or more stakeholders, and its intensity will be medium or high; therefore, the impact may materially affect the decision, and management intervention will be required.
High The impact could render development options controversial or the project unacceptable if it cannot be reduced to acceptable levels; and/or the cost of management intervention will be a significant factor in mitigation.
Mitigation Effect: Degree to which the impact can be managed following mitigation
Can be reversed Can be avoided, managed or mitigated in such a way that natural processes are not affected and returned to natural state.
Can be avoided, managed or mitigated
Can be avoided, managed or mitigated to the degree that functions and processes continue in a modified way).
May cause irreplaceable loss of resources
Irreversible impact (may cause irreplaceable loss of resources). Function or process of the affected environment is disturbed to the extent where it temporarily or permanently ceases.
N/A Not applicable.

DOORNHOEK FLUORSPAR PROJECT SOCIO-ECONOMIC IMPACT ASSESSMENT STUDY
Urban Econ Development Economists
65
REFERENCES
Corli Havenga Transportation Engineers. (2016). Traffic Impact Assessment: Doornhoek Fluorspar
Mine .
De Jager, M. (2016). Doornhoek Fluorspar Project, near Zeerust, North West Province. Pretoria:
Enviro-Acoustic Research cc.
Ditsobotla LM. (2015). REVISED INTEGRATED DEVELOPMENT PLAN 2015/16 - 2017/18.
Ditsobotla LM. (2016). Local Economic Development Strategy Document .
Exigo. (2016). Doornhoek Fluorspar: Hrydrological Specialist Investigation. Ground Water Impact
Assessment .
OECD. (2001). Economic Production, National Accounts.
Parkin, M. (2007). Economic (8th Edition). Prentice Hall.
Quantec. (2016). Standardised Regional Data .
Ramotshere Moiloa LM. (2015/2016). The reviewed Ramotshere Moiloa LM Integrated Development
Plan (IDP) 2015/2016. Ramotshere Moiloa LM.
SA Venues. (2016). Lichtenburg, Central region. Retrieved from http://www.sa-
venues.com/attractionsnwp/lichtenburg.php
SA Venues. (2016). Zeerust, central region. Retrieved from http://www.sa-
venues.com/attractionsnwp/zeerust.php
Stats SA. (2016). Census 2011.
von Gruenewaldt, R. (2016). Air Quality Scoping Land Assessment for the proposed Fluorspar at
Doornhoek in the North West Province. Johannesburg: Airshed Planning Professionals.
Young, G., & Martin, Y. (2016). Proposed Doornhoek Fluospar Project Zeerust, North West Province.
Johannesburg: Newtown Landscape Architects.
Delta Minerals Limited, 2012. Doornhoek Fluorspar Project, Pre-scoping Study, Process Summary and
Conceptual Process Flowsheet.
DOORNHOEK FLUORSPAR PROJECT SOCIO-ECONOMIC IMPACT ASSESSMENT STUDY
Urban Econ Development Economists
66