Environmental Impact Assessment (EIA) Study on...
75
Interim Progress Report Environmental Impact Assessment (EIA) Study on Pollution Due to Oil Spill and Other Hazardous Substances for Maharashtra Pollution Control Board (MPCB) Submitted By National Environmental Engineering Research Institute (NEERI)
Transcript of Environmental Impact Assessment (EIA) Study on...

Interim Progress Report
Environmental Impact Assessment (EIA) Study on Pollution Due to Oil Spill and Other Hazardous Substances
for
Maharashtra Pollution Control Board (MPCB)
Submitted By
National Environmental Engineering Research Institute (NEERI)

[This report is an interim progress report and many areas of data collection and
interpretation are still underway]
CONTENTS
Pages1.0 Background 12.0 Objectives 23.0 Methodology 43.1 Shoreline Sediment Monitoring and Assessment 43.1.1 Monitoring Methods for Shoreline Oil 53.1.2 Assessment of Oiled Shorelines: Surface Oil 63.1.3 Assessment of Oiled Shorelines: Sub-Surface Oil 63.1.4 Sediment Sampling Methods 63.1.5 Monitoring Damage to Invertebrate Beach Fauna 83.1.6 Monitoring Damage to Coastal Flora 83.1.7 General Methods for Assessment and Monitoring 93.2 Assessment and Sampling of Seabed Sediments 103.2.1 Monitoring and Methodology 113.3 Assessment and Monitoring of Mangroves 113.4 Socio-Economic Impacts 123.5 Status of the Study 133.6 Elephanta Island 153.7 Butcher Island 283.8 Uran 323.9 Mandva 383.10 Revas 413.11 Alibaug 413.12 Vashi - Thane Creek 433.13 Trombay, Mahul and Sewari Area 473.14 Daramtar and Bhal Creek 493.15 Nhava-Sheva 503.16 Navy Nagar and Near by Area 513.17 Fixed Transect Analysis of Oil Spill Impact on Elephanta Island 593.18 Work in Progress 72References

1
1.0 Background
The Mumbai oil spill occurred after the Panamian ships MSC Chitra (IMO: 7814838)
and MV Khalijia 3 (IMO: 8128690) collided off the coast of India near Mumbai on Saturday,
7 August 2010 at around 9:50 a.m. local time. MSC Chitra, which was outbound from South
Mumbai's Nava Sheva port, collided with the inbound MV Khalijia-3. The geographical
position of the collision is 18°51’51.8" N and 072°49´12.0" E. The impact of collision was so
severe that MSC Chitra tilted to about 80 degrees soon after the collision, spilling an estimated
400 tonnes of oil in initial few hours. The ship was loaded with an estimated 2,600 tonnes of oil
at the time of the accident. During the accident, there was a spillage of about 879 tonnes of oil
which traveled long distances to the various coast line of the Mumbai Metropolitan region
(MMR) and near by areas.
MSC Chitra was also carrying 31 containers of the pesticide like pyrethrins and the
organophosphates. The crude oil moved to different coastline of the Mumbai, Thane and
Raigad district due to the tidal movement. The shoreline of most of these areas here shown
signs of oil from the very next day of the collision. The coastal sediment affected along the
shoreline can be classified as bedrock, sand, boulders etc. The mangrove stretch along shore
can be also seen affected. The degree of impact of the oil spill varies with locations.
The fallen containers were swept away in different coastal parts. Some of these are still in the
offshore region, and can be seen at low tide. Materials of damaged containers have moved in
The Ships: Kalijia 3 and MSC Chitra

2
different directions. Much of these have been retrieved, however large chunks are still lying
around in multiple directions and locations.
The present report focuses on the oil spill impact on the mangrove with respect to the percent
cover, affected species, affect on the fruiting and flowering etc. Along with the impact on the
mangrove study, study of the oil spill impact on the sediment with respect to type of sediment,
area cover, age etc. has also been undertaken. The study also addresses the impact of the spill
on the associated marine biota and the animals, using multiple tools. Socioeconomic impacts
are also a part of the study for assessment of direct and indirect impacts on livelihood.
2.0 Objectives The study components of NEERI include multifaced objectives. Given below are the overall
components and their finer attributes.
1. Impact mapping of the region to assess the level of damages, which will include:
a. Area of water with high concentrations of oil and other hazardous material
b. Levels of contamination and its spatial and temporal mapping.
i. Locations and its effective region.
ii. Concentration gradient at multiple locations.
2. Contaminants profile for whole region
a. Types of contaminants and their levels shall be plotted for iso-contours
b. Prediction of their movement
c. Fate analysis of the contamination based on weather, place and clean ups, if any
3. Contamination regions of all types shall be identified through the data given by NIO and
any other agencies such as BARC, other Govt agencies, Godrej Foundations, NGOs,
villagers etc
a. NEERI will carry out some ground truthing of all data obtained using its own team
b. It shall also use Remote Sensing Satellite data with ground truth data
c. It will need to use the Coastal Zone Management map (available with GOM) and map
these values on the same.
4. Response assessment and evaluation of cleanup
a. Physical survey and assessment of secondary information and primary data over a
period (Short term and long term)

3
b. Chemical and biological quality assessment based on secondary and primary
information [limited primary data] (short and long term)
c. As there are many agencies carrying out assessment at varying time interval and extent
of work, it is important to integrate and use the same for interpretation by collating the
same with MPCB.
d. Clean up of efficiencies of various efforts and documentation
5. Response assessment and evaluation of cleanup
a. Damage assessment
b. Water quality related
c. Aquatic Bio-diversity: fish, planktons etc
d. Terrestrial system: mangrove and other plants/shrubs
e. Sediment system: physical and biological
f. Fisheries and other resources (other source of data and information to be obtained
through MPCB/GOM efforts to get necessary secondary information)
6. Response assessment and evaluation of cleanup
a. Assessment of total directly affected population within the impacted area
i. Affected population due to oil spill impacting their daily earning
ii. Affected population due to soil spill impacting tourism and related activities
iii. Aesthetic damages
iv. These damages will be computed using direct techniques and other techniques for
assessment of intangibles
b. Losses and other damages over a period of active phase of the oil spill and other
material spillage
c. Secondary level assessment of population with types affected due to long term effect
of the spill
7. Recommendation and Deliverables
a. The whole mapping of the region shall be divided into various aspects of damages and
costs of the restoration
b. The damage costs shall include direct costs (where direct clean up is possible by
human efforts) and indirect damage (where natural attenuation is the only way)
c. The report shall include:

4
i. Total areas of affected and their extent of damage [ short term and long term]
ii. Damage types: water, sediment, rocks, beaches, mudflats, mangroves, other
vegetation, aquatic and terrestrial ecosystem
iii. Damages with regard to human population: directly affected population
(fishermen, small businesses, tourists, etc) and indirectly affected ( loss of
tourists traffic, aesthetic damages etc)
iv. Direct costs of oil spill and indirect costs including intangibles in short term
v. Long term costs can be attempted, however the same will depend upon the
availability of data
8. Recommendation and Deliverables
9. Support and Data Needs
a. MPCB/GOM shall assist in getting all the necessary data and information from other
agencies such as NIO, CMFRI, CZMA, DGCA, and any other agencies
b. Data from NIO shall be the starting point for the coastal water, sediment and mangrove
damage assessment
c. Necessary permissions to visit and perform survey in all the affected regions
3.0 Methodology
The methodologies used for different attributes of environment affected by the oil spill have
been summarized herewith. An attempt has been made to fully appreciate the methods, however
after visiting the actual site conditions; suitable modifications in the methodologies have been
made. 3.1 Shoreline Sediment Monitoring and Assessment
This component includes three major categories.
⇒ Collection and arrangement of shoreline maps for background information
⇒ Determination and marking of the affected areas to fix the survey area
⇒ Determination of substrate type
5
The Coastline substrate can be divided into following types • Bedrock or Rock: Porous/non-porous, Broken/not broken
• Boulder: Porous/non-porous, Broken/not broken
• Cobble: Porous (e.g. coral, pumice)/non-porous.
• Pebble: Or “shingle” if flattened.
• Granules/ Gravel: Rounded/flat. • Compacted/loose.
• Sand: Fine to coarse
• Mud/Silt/ Clay: Consolidated/loose. Dry (e.g. mud cliffs).
• Earth/ Soil: applicable to cliffs and seawalls.
• Ice: In the Antarctic territories.
• Shellgrit: Wet/dry. Usually with sand.
• Coral: Rubble/Boulder/Cobble.
• Concrete: Rubble.
• Wood: Debris/logs; pilings. Debris can overlay other substrates.
• Metal: Pilings, sheeting. Usually artificial structures.
Shoreline Form – Gradient Width Height etc. can be interlinked with the level of energy used
or destroyed depending upon the locations specifically gradient and substrate. Figure delineates
the energy from that is common in coastal regions.
Substrate, Gradient, Form, Shoreline Energy: Energy
Low High
Substrate Mud Sand Grits Pebble Cobble Boulder Bedrock Forms Swamps Flats Beach Reefs Cliffs Gradient/ Slope Gentle slope Steep slope Vertical 3.1.1 Monitoring Methods for Shoreline Oil
Ground Surveys Ground surveys are usually required for identification and marking of oil impact area. In
particularly to measure or estimate the thickness of oily bands, and describe the character of the
oil. Ground surveys are also required to determine whether subsurface oil is present, usually
from percolation of oil into interstitial spaces, or by burial by mobile sediments. Subsurface oil

6
adds significantly to the cleanup efforts required and may also have significant implications for
waste management.
3.1.2 Assessment of Oiled Shorelines: Surface Oil
Methodology
• Divide shoreline into Sectors and Segments for the easy detail study.
• The documentation should be made for Length, Width, Energy, Substrate, Form etc.
• For each Segment, draw a sketch map showing the approximate location of the oil.
• Record the length, width and the percent cover (visually)
• Oil thickness can be assessed by dividing into Pooled oil, Cover, Coat, Stain. Film
3.1.3 Assessment of Oiled Shorelines: Sub-Surface Oil
• Divide shoreline into Sectors and Segments for the easy detail study.
• The documentation should be made for Length, Width, Energy, Substrate, Form etc.
• Dig trenches or pits to detect subsurface oil. Narrow trenches are more suitable for
sandy substrates. Pits are more suitable for cobbles or small boulder substrates. The
depth required will depend on substrate type and, for sand – pebbles, on sediment
mobility (wave energy).
• For each pit, or location along a transect trench, following details are recorded
• Minimum depth of oil, distance from the beach surface to the top of the buried layer.
• Substrate type at various depths or in the oily bands as required.
• Description of the oil in the oily layer in terms of Fluid Oil, Viscous Oil,
Mousse/Emulsified and Tar.
3.1.4 Sediment Sampling Methods
The oil reaches to the shoreline area by the natural tidal movement and gets deposited on the
shoreline sediment. The impact of the oil spill on the shoreline depends on the shoreline energy,
which depend on the type of substrate, from of the substrate and the gradient. The substrate
types along the studied impact area mainly include bedrock, boulders, pebbles and the sandy
type. Where as forms can be given as beach, swaps and flats. Most of the impacted sites have
natural seaward gentle slope.

7
The impact and its persistence also depend on the texture of the sediment type as the rough
surfaces; creviced surfaces hold more oil than that of smooth and fine textured surfaces. In this
particular study, degree of impact on the shore line area varies greatly in the various areas.
Oil is only rarely incorporated into seabed sediments as a result of the weathering of surface
slicks. However, oil can be incorporated into marine sediments as a result of the natural
redistribution of oiled pebbles, sands, and silts due to wave or following remobilization by
shoreline cleanup activities, particularly washing methods. If this accumulates to a significant
extent then alternative cleanup strategies may be required. Monitoring of both natural and
cleanup induced sand redistribution may be necessary to better determine the net environmental
benefits of natural cleaning or intervention.
This monitoring method is usually suitable for shallow waters. Grab Samplers or Drop Corers
are used. The sediment sampling methods are dependent on the basis of oil layer thickness and
the type of the sediment affected.
Push Core Sampling A
This method of sampling involves pushing a clean plastic tube down into the substrate and
extracting a column, or “core” of sediment. It is suitable for most sediment conditions, but
particularly when:
• Oil is present on the surface as a thin layer (coat, stain, film).
• Oil penetrated to a fairly shallow depth (e.g. < 10 cm).
• Accurate measures of the amount of oil at various depths are not needed
Methodology
1. Push plastic tube into sediment. Generally the depth of sampling should not be more
than two thirds of the length of the tube.
2. Seal the top of the tube and extract.
3. If the sediment is wet or loose, or does not stick to the inside of the tube when
extracted, it may be necessary to dig down beside the tube and block the bottom opening
before removing the tube from the sediment.
4. Alternately sealing the top of the tube with a bung can facilitate extraction of the core.
5. The core of sediment should be transferred immediately to a clean glass container.

8
Push Core Sampling B
This method is essentially the same as Method 1, but is used when it is necessary to
differentiate between surface oil and subsurface oil. This may be needed if attempting to
determine, for example:
• The amount of oil that could be removed by tidal action (i.e. surface oil) in low energy
shores and oil likely to persist (i.e. subsurface oil).
• The rate of degradation of the oil. In this case the presence of relatively large amounts
of surface oil could mask any observation of changes in subsurface oil (or visa versa).
Methodology
1. Scrape surface oil from a given area prior to pushing in the sampling tube.
2. Transfer this “surface sample” to a clean storage jar and record the area cleaned (square
centimeters) and approximate depth of sediment removed (if possible).
3. Rest is same as method ‘Push Core Sampling A’.
3.1.5 Monitoring Damage to Invertebrate Beach Fauna Species or communities should be observed or collected from both affected (oiled) and
unaffected (unoiled) control areas. A number of affected and unaffected areas should be
monitored. Determine species to be monitored or sampled.
Methodology
The parameters like number and position of the organism in transact or quadrat, oil cover
impact, shell damage, mortality etc. should be part of the study. The photo documentation can
use for this type of study. The mortality assessment must be considered seasonal and natural
die-off and the control (unaffected area) mortality.
3.1.6 Monitoring Damage to Coastal Flora
Damage to coastal flora can occur as a result of oiling or response activities. Damage due to
oiling plus response activities may need to be compared to the effects of oil alone to determine
whether cleanup is having a net benefit or adverse effect. However, short-term effects should be
evaluated against possible longer-term benefits. The persistence of the oil and likelihood of
longer-term effects need to be evaluated.

9
Methodology
1. Determine monitoring locations for all affected and unaffected areas for monitored. A
number of affected and unaffected areas should be monitored
2. Determine species to be monitored or sampled.
3. The parameter like number and distribution of plants, oil cover, mortality and other
possible effect like leaf curling, chlorosis etc. can be considered.
4. The monitoring and assessment study can be carried out with transect or quadrat method
or by aerial and ground survey. 3.1.7 General Methods for Assessment and Monitoring
The basic aim of a sampling design is to ensure field samples are representative of the area,
habitat or community being investigated, and are collected efficiently and cost effectively.
There are three basic approaches relevant to selecting sample locations:
Authoritative or Selective Sampling
This sampling is deliberately biased to specific areas, e.g. visibly oil-free and oil-impacted sites.
It is ideal for Type I monitoring as it allows a smaller number of samples to be collected from
the areas of most interest. However, it has a relatively high potential for error if variability is
unknown.
Random Sampling
This is a more scientifically valid method but usually requires a large number of sample
locations.
Systematic Sampling
This sampling area uses a grid or consistent pattern across the defined area. This approach is
most suitable when looking for non-obvious contaminated locations, for most known areas of
the present case, this method has been added..
Use of Quadrats and Transects
If the parameter being measured is based on area (e.g. animals per m2), small sampling
perimeters or “quadrats” can be used. Quadrat size will depend on what is being sampled and
the numbers to be counted. With large quadrats numbers can become unwieldy, if they are too
small, sampling variability problems may arise. Generally, for shoreline work, an area of 0.2-

10
0.3 m2 is sufficient (e.g. a 0.25m2 area would be a 50cm x 50cm square quadrat or a circular
qaudrat with a diameter of about 56.4cm) for mangroves and large area, assessment quadrate
size is much larger.
Transects are surveyed lines, usually passing from high to low tide, along which samples are
taken. Like quadrats, transects can be positioned selectively, randomly or at regular intervals.
Sampling points or quadrats can be distributed along transect continuously, selectively,
randomly, or at regular intervals. In the last case this would effectively be the same as a grid
pattern.
Photo-documentation
Photographic documentation can range from video or photo-surveys of coastlines or slicks at
sea to detailed photographs of quadrats, transects, or individual impacted plant and wildlife.
Photo documentation has the advantages that skilled interpretation of data can be done later,
remotely and be consistently interpreted. This overcomes problems of shortage of skilled staff
and the need to calibrate estimates by different field staff. More accurate calculations of
percentage cover and numbers may also be possible.
3.2 Assessment and Sampling of Seabed Sediments
Oil can become incorporated into offshore sediments through natural processes or due to
shoreline cleanup methods. If this accumulates to a significant extent then alternative cleanup
strategies may be required. This monitoring method is usually only required in shallow waters.
Grab Samplers or Drop Corers can be used. The former are suitable for the wider set of
sediments and sea conditions. Sample handling is also easier. Sample volume should be
consistent between sites and surveys to allow cross comparison.
Prerequisites
• Sampling vessels should be suited for expected weather, water depth and sea states.
• It should be equipped with communication tools, GPS and life preservation equipment
with adequate deck place
• Sampling kits: sampling jars, sealing tape, gloves
• Sampling equipment (grab or corer): if biological samples are to be taken samples should
be at least 10 cm depth and have a minimum surface area of at least 125 square
centimeters.

11
3.2.1 Monitoring and Methodology
The sample number and the location can be determined by considering the following points:
• Amount of spillage • Possible contamination area • Current dynamics
Various grabs that can be used for the sampling:
3.3 Assessment and Monitoring of Mangroves
Level 1- Transect based survey recording mangrove locations, species zones, mangrove
condition and identifying pressures. This is quick to do, and is a suitable exercise for
capacity building with community groups.
Level 2- Vegetation plots in each zone recording community structure, height and diameter of
trees, density of seedlings. Level 2 takes about a day per transect, and is better
carried out by project staff, though can be done with community groups assisting.
Level 3- Sedimentation monitoring and litter productivity. These techniques take longer to
carry out but can give good information on mangrove health and sedimentation
trends.
Degree of Impact
In the centre of each mangrove zone, assess the degree of impact and type for each zone.
• Assess the degree of impact in an area with a 15 m radius around you.
• Impact is assessed on a scale from 0 to 5 where 0 is no impact and 5 is severely impacted as
given in Table 1.
• It is done by looking up at the forest canopy and records the average height of trees, and
assess how many are at that level.
An index of “impact pressure” is recorded within the area with a 15 m radius, or a rectangular
section. The impact may be direct, indirect, or both. Records are made in accordance with any
activities which are prevalent in the respective area.

12
Table 1: Recording method for short term impact of oil spill on mangrove ecosystems.
Impact %Cover Canopy
Example
No Impact 0-10 No oil effects. No interference of oil on roots, leaves, & seeds, etc.
Slight Impact 11-30 Leaves are fairly black (influenced) due to Oil. Pneumatophores are also coated frequently. Some of them regenerate rapidly. It is not likely to produce any type of damage to the mangrove plant.
Moderate Impact
31-50 Leaves & roots become considerably black due to the oil coating. Leaves, trunk, branches, roots are coated with the oil layer. Oil layer becomes thick. Affected part could not recover over period of time.
Slightly High Impact
51-75 Tree parts are evenly black. Leaves, branches, roots, seeds, fruits also affected. Major portion of the mangrove appears to be destructed. It has affect to the productivity of plant.
High Impact 76-95 Only a few trees remain without being affected. Massive parts of mangroves have got affected. Extensive area could not survive. It will definitely affect productivity of mangrove.
Severe Impact
96-100 All mangrove trees have become black. There is no evidence of any greenery. Oil reached at the each and every part of the trees. Chance of survival is very less. Roots also affected.
3.4 Socio-economic Impacts
Methodology
Survey Design : This comprises a survey design dealing with the exact location and the area
affected due to the oil spill spread. Congregation of information regarding specific services or
products by important first hand information from the inhabitants and local stakeholders was
the key to further interpretation. The overall area of oil spill impact is given in Figure 1.
Primary Information:
A walk-through survey of all areas and the entire study region is carried out. Primary
information was gauged by the means of a detailed questionnaire to the local businessmen,
governing body of the villages and other stakeholders. This detailed questionnaire comprised
of enquiries regarding the reduction in customers or tourists as well as its impact on the daily

13
income. Critical questions which were posed when assessing the socioeconomic impact also
considered the duration the impact, effects on local economy, support system of fishing and
tourism. The other enquiries included the effect on their daily routine, vicinity, employment,
population and aesthetics of the area of impact.
Secondary Information:
Secondary information obtained through the reviews of the experts relevant in the particular
subject area, research journals, literature, latest released communications, newspapers and other
publications in addition to the above.
3.5 Status of the Study
The oil spill impact region comprises of coastlines of Mumbai, Thane and Alibag district.
Coastlines of islands such as Elephanta and Bucher have also been included. Figure 1 presents
the overall region, which has been impacted and mapped during the study.
Figure 1 : Overall Area of Oil Spill Impact

14
Sediment Study: The spill impact study on the sediment can be divided into Physical,
Chemical and biological impacts. Physical impact can be studied by the visual observation and
photo documentation by dividing area into sectors and segments. The detail study of the
physical impact can be done by using transect or quadrant method. The parameters like area
cover, character of the oil, visual impact on the marine animals etc. can be included in the
physical study.
Chemical study of the oil spill can be done by sediment sampling in the impacted area. The
chemical impact includes concentration of the oil in the sediment, variation in the substrate
type, characterization of the oil etc.
Biological impact of oil spill includes impact of oil on the small marine animals like crabs, mud
creepers, bivalve etc. The biological study can be precomplished by visual observation, photo
documentation by using different study techniques like transect or quadrant method. The
biological impacts also comprise the effect of the oil on the mangroves, which is discussed in
detail in separate section. The biological impact assessment needs more understanding in
respective area like biodiversity, seasonal variation etc.
The shoreline of the Mumbai, Alibag and Thane district shows variation with respect to
sediment type, form and gradient as it result in the difference in the shoreline energy.
Mangrove Study : The oil spill took place during the seeding season of Mangroves. The oil
slick has been sighted ashore majorly in the mangroves of Elephanta Island, Vashi creek and
some fringes of Mahul- Shewri. Signs of natural recovery were also observed with regeneration
of new twigs. In most of the sites, canopy of mangroves is intact and mortality is not apparent.
Mangroves are highly susceptible to oil exposure; oiling may kill them within a few weeks to
several months. Lighter oils are more acutely toxic to mangroves than are heavier oils.
Increased weathering generally lowers oil toxicity. Oil-impacted mangroves may suffer
yellowed leaves, defoliation, and tree death. More subtle responses include branching of
pneumatophores, germination failure, decreased canopy cover, increased rate of mutation, and
increased sensitivity to other stresses. Response techniques that reduce oil contact with
mangroves, such as chemical dispersants, reduce the resultant toxicity as well. Natural recovery
is the most reliable strategy for mangroves. Tradeoffs include potential increased toxicity to
adjacent communities, and increased penetration of dispersed oil to mangrove sediments.

15
The amount of oil reaching the mangroves and the length of time spilled oil remains near the
mangroves are key variables in determining the severity of effect. Mangrove-associated
invertebrates and plants recover more quickly from oiling than do the mangroves themselves,
because of the longer time for mangroves to reach maturity. Physical mechanisms are the primary
means by which oil has adversely affected mangroves. Comparing spill impacts at several mangrove
sites indicated that variable effects are related to geomorphology and hydrologic kinetics of the
mangrove ecosystem that, in turn, controls whether oil persists in the mangrove habitat. Oiled
mangrove forests that are sheltered from wave and current exposure are likely to be more
severely affected than well-exposed, “outer fringe” mangrove areas. Full extent of damage to
mangroves is not apparent for many months or years after an incident as noted from many case
studies. The oil spill impact status in different studied areas is given in following sections.
3.6 Elephanta Island
3.6.1 Sediment
The island is located at 18°57´45.59”N, 72°55´59.49”E and include three villages namely Shet
Bandar, Mora Bandar and Raj Bandar having population of about 2000- 2500 (Table 2). Oil
spill impact can be seen on the island near all three villages. The area at Raj Bandar is severally
affected as compare to shoreline at other two villages. The sediment monitoring of the
Elephanta Island reveals various shoreline types like sand, Bedrock, boulders, pebbles with
slight seaward slope. The sediment is severely affected in the south, east and west direction of
the island as compare to it northern site is lesser affected. Various agencies are engaged in the
cleaning of different areas. Oil Spill response team (UK) is cleaning the Shet Bandar Jetty and
surrounded area with hot water jet (80-90°C). The cleaning operations of the Oil spill response
at various sites adding oil to the lower sediment. The private company “Seaworthy Shipping
Services” also carrying out manual cleaning of the affected area nearby Raj Bandar jetty. The
whole area of the Elephanta has been divided into 21 transects for the assessment of the area for
oil spill.

16
Table 2: Location for Sediment at Elephanta Island
Transect Geographical position Type of sediment % area affected 1 18° 57´30.2" N, 72° 55´35.0" E Bed rock, sand 70 2 18° 57´32.5" N, 72° 55´33.4" E Pebbles, Bed rock 60 3 18° 57´34.0" N, 72° 55´31.0" E Boulders, pebbles 55 4 18° 57´32.7" N, 72° 55´31.9" E Boulders, Bed rock 50 5 18° 57´33.6" N, 72° 55´31.1" E Sand, Bed rock 70 6 18° 57´36.4" N, 72° 55´31.3" E Sand, Pebbles 60 7 18° 57´43.7" N, 72° 55´32.0" E Sand, Boulders 65 8 18° 57´59.6" N, 72° 55´44.9" E Sand, Bed rock 60 9 18° 57´59.2" N, 72° 55´46.8" E Sand, Bed rock 60 10 18° 58´00.6" N, 72° 55´43.2" E Sand 50 11 18° 58´01.4" N, 72° 55´51.0" E Sand 0 12 18° 58´01.8" N, 72° 55´51.8" E Sand 0 13 18° 58´01.7" N, 72° 55´52.5" E Sand 0 14 18° 58´00.6" N, 72° 55´43.2" E Sand 20 15 18° 58´02.5" N, 72° 55´54.3" E Sand, Bed rock 95 16 18° 57´19.7" N, 72° 55´47.6" E Sand, Bed rock 100 17 18° 57´17.6" N, 72° 55´49.5" E Sand, Bed rock 85 18 18° 57´15.7" N, 72° 55´52.8" E Bed rock 80 19 18° 57´13.6" N, 72° 56´00.5" E Sand, Pebbles 90 20 18° 57´08.6" N, 72° 56´03.7" E Pebbles, Sand, Boulders 90 21 18° 57´16.2" N, 72° 55´56.1" E Sand, Boulders 80 22 18° 57´32.8" N, 72° 56´13.4" E Sandy pebbles 10 23 18° 57´49.0" N, 72° 56´24.2" E Sandy 00
Oil floating on the surface and on boulders at the main jetty at Shet bandar (16th day)
Affected sediment at sandy area along with the oil deposited compound wall (16th day)

17
Boulders of the jetty affected with the crude oil (16th day)
Cleaning operation by oil spill response team UK:
on going cleaning and jetty divided into 10 m transect (40th day)
Sediment affected with thin oil sheen and tar balls at boulders (40th day)
Cleaning at jetty and compound wall cleaned by oil spill response team (43rd day)

18
NEERI study: plotting of transect, sediment showing thin sheen of oil with melted tar balls (transect 1) 43rd day
Oil affected pebbles and boulders (transect 2) 43rd day

19
Transect 3 and 4 showing non affected bedrock and oil deposited boulders (43rd day)
Sediment sampling methods: core sampling and loose sediment sampling
Transect 5 and 6 affected bed rock and thin sheen of oil on the sandy shoreline (43rd day)

20
Transect 7 affected boulders (43rd day)
Transect 8 cleaning operation from oil spill response causes oil on the sediment and loose sampling method (44th day)
Transect 9 unaffected bedrock with affected pebbles and Transect 10 with affected and non affected sandy sediment (44th day)

21
Transect 11 to 14 no visual oil impact seen, transact 14 shows thin sheen oil because of the cleaning activity (44th day)
Transect 15: Severely affected by the oil spill, oil deposited on the boulders, pebbles and thick melted, flowing oil can be seen at this site near raj bandar (48th day)
Transect 16 severely affected along with mangroves and grass (48th day)

22
Transect 19 and 20 sand and pebbles affected with oil and cleaning activity by private company “seaworthy shipping services” (48th day)
Transect 17 and 18 thin sheen on the sand and affected bedrock (48th day)
Transect 21 Oil deposited pebbles, floating container and affected boulder with some tea packets (48th day)

23
3.6.2 Mangroves
Amongst all the sites, Elephanta Island mangroves are the most severely affected due to the oil
slick. The tides are not strong enough to wash away all the oil. Ecologically sensitive mangrove
fringes across the circumference of the island have been affected by oil. In some areas as shown
in the pictures regeneration of new leaves has started. The sparse mangrove cover at Mora
bandargoan, the north-east of the island is not affected by oil. The beach is also covered with
packets of tablets, biscuits, tea bags and other material from the containers. The location of
mangroves in different transect is given in Table 3.
Table 3 : Location Mangroves at Elephanta Island
Date Site Transect No Latitude Longitude % affected
1 18° 57'30.02 "N 72°55'35.00"E 842 18° 57'30.02 "N 72°55'35.00"E 623 18° 57'34.00 "N 72°55'31.00"E 444 18°57'40.86 "N 72°55'29.53"E 335 18°57'55.88 "N 72°55'30.72"E 376 18°57'53.05 "N 72°55'35.33"E 60
20/09/2010 Elephanta
7 18°57'56.45 "N 72°55'38.32"E 638 18°57'59.06 "N 72°55'44.09"E 709 18°58'10.49 "N 72°55'48.35"E 95
21/09/2010 Elephanta
10 18°58'10.02 "N 72°55'46.54"E 011 18° 58'19.00 "N 72°56'03.00"E 025/09/2010 Elephanta 12 18° 57'37.00 "N 72°56'14.00"E 82
Transect 22 and Transect 23: unaffected site at

24
Plates of Mangroves at Elephanta Island
Transect 1: Oil effects on mangroves at shetbandar on the 42nd day
Transect 2: Oil damaged debris seen reaching the roots of the inner frontiers of mangroves

25
Transects 3 and 4 A solitary mangrove species already existing in less density affected due to oil
Transect 6 and 7 Pneumatophores affected completely along with Aveccinia mangroves which are present in less density
Transect 8 a) Oil stressed pneumatophores around the base of a huge trunk of mangrove tree entangled with oil licked debris

26
Transect 8 b) Oil stressed pneumatophores around the base of a huge trunk of mangrove tree entangled with oil licked debris
Transect 9 Impact on various mangrove species due to oil as well as the accident debris coming in the way of circulation of sea water and contributing to further mechanical damages of oiling at the northern periphery of the elephant island

27
Transect 9 Pneumatophores of mangroves covered by thick oil layer. lenticels in the exposed portions of mangrove roots are highly susceptible to clogging by crude oil. These pictures highlight the pressures on the mangrove roots in the western periphery of the island at shetbandar.
Transect 12 Normal regeneration observed in oil affected mangroves at elephanta on t
28
3.7 Butcher Island
3.7.1 Sediment: The Butcher island is located west of the Elephanta island, with geographic
position 18°57´35.60”N, 72°54´11.93”E. The island is under control of Mumbai Port Trust and
has multiple storage tanks of BPCL. The island has four jetties for the BPCL and other
activities. This island is much smaller island as compared to Elephanta island, the location of
sediment at different Transects is given in Table 4.
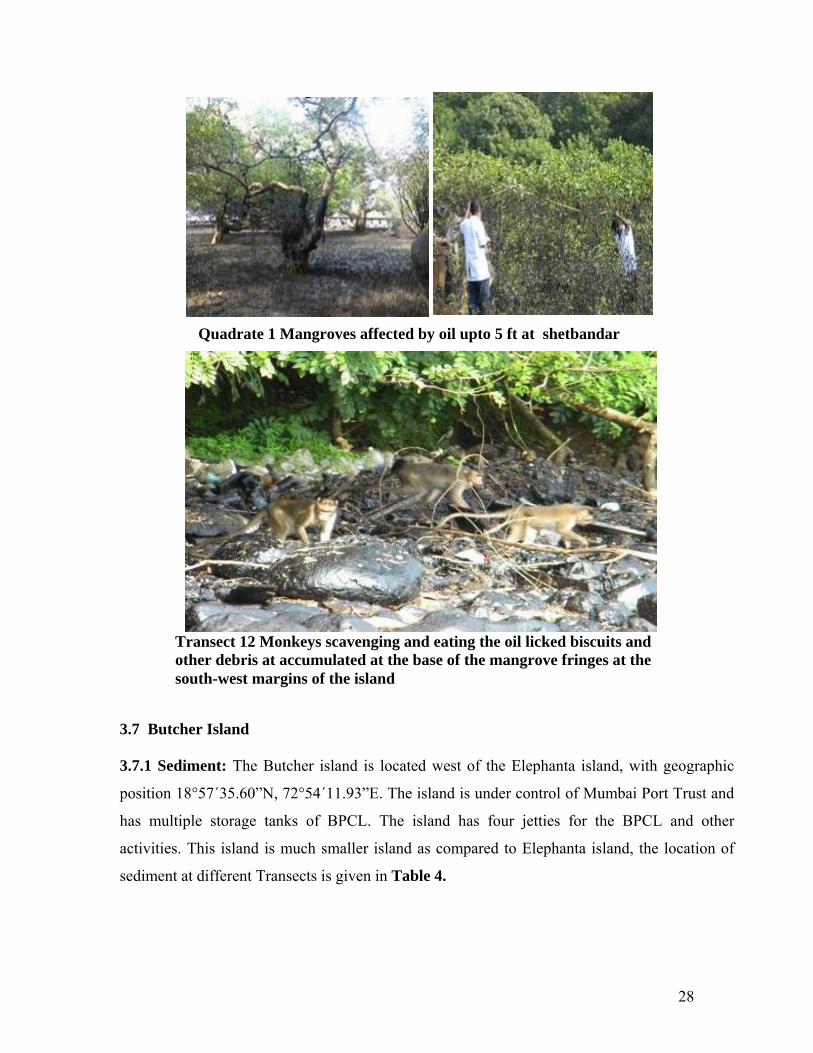
Transect 12 Monkeys scavenging and eating the oil licked biscuits and other debris at accumulated at the base of the mangrove fringes at the south-west margins of the island
Quadrate 1 Mangroves affected by oil upto 5 ft at shetbandar

29
Table 4 : Location for Butcher Island Sediment
Transect Geographical Position Type of Sediment Percent Area Affected
1 18°57´39.0” N, 72°54´13.0” E Bed rock 70 2 18°57´23.0” N, 72°54´20.1” E Bed rock 65 3 18°57´23.7” N, 72°54´17.6” E Bed rock, Sand, Pebbles 20 4 18°57´41.0” N, 72°54´13.0” E Bedrock, Sand 20
Plates of Sediment at Butcher Island
Transect 1 and 2 bedrock partially affected with the oil (48th day)
Transect 3 Melted tar balls on the bedrock and unaffected boulders inside the mangrove belt (48th day)
Transect 4: Bedrock showing algal growth along with melted tar ball (48th day)

30
3.7.2 Mangroves
Surviving fringe of mangroves at the oiled sites of Butcher Island had fewer and shorter prop
roots. The slick has now settled due to the low tide and high tide interventions. Some of the
dolphins were reported to be blackened by the officials of MBPT. The mangroves has present
all around the island. There was some transects shows density of mangroves. Some of the
locations which were studied is given in Table 5.
Table : Location Table for Butcher Island Mangroves
Date Site Transect no Latitude Longitude
% area impacted
13 18° 57'39.00"N 72°54'13.00"E 7614 18° 57'23.00"N 72°54'20.10"E 4415 18° 57'23.07"N 72°54'17.60"E 28
25/09/2010 Butcher
16 18°57'48.59 "N 72°54'30.13"E 19 Photos of Butcher Island Mangroves
Transect 1 Right side of the main jetty of Butcher Island
(Mumbai Port Trust) with oil affecting the mangrove roots in soft sediments

31
Transect 2 Container floating into the margins of mangroves that fronted the open sea at the left side of the main jetty of the butcher island
Transect 3 Inner side of dense cover of mangroves with the height of mangrove trees above 20 ft is affected. Few melted tar balls were spotted

32
3.8 Uran
The geographic position of this village is 18°52´42.45” N, 72°56´26.83”E. Uran has two jetties
one is for public use (Mora jetty) and other is under control of navy. It is primarily a fishing
village, which has developed into a special economy zone. It has ample industries, namely
JNPT, P&O, GTI and other shipping companies. The monitoring and assessment covers area
around Uran beach and area around Mora jetty. The overall assessment and monitoring inferred
that the area is moderately affected due to oil.
3.8.1 Sediment: The sediment near Uran beach has been affected with lesser density of tarballs
(Table 6). The sediment type of the area around Mora jetty is flat sandy and rocky (bed rock).
This area is covered with mangrove of different species. The dried and melted tar balls were
seen in this area. The sandy and rocky area near navy jetty is affected quite considerably along
with the mangrove vegetation
Table 6 : Percent Sediment Affected Area at Uran Transect Geographical Position Type of Sediment % Area Affected
1 18°52'5.70"N, 72°55'17.40"E Sand, Pebbles 5 2 18°52'14.03"N, 2°55'11.06"E Sand, Pebbles, Bed rock 5 3 18°52'19.34"N, 72°55'6.47"E Bed rock, Sand, Pebbles 5 4 18°52'57.79"N, 72°54'41.09"E Bedrock, Pebbles, Sand 5
Plates of Mangroves Area at Uran
Container carried to the Uran beach, along with the material and tea packets spread all over the coast. (3rd day)

33
The area near Mora jetty, Uran bedrock is not much affected except the melted tar balls (50th day)

34
Unaffected area near old navy jetty, sandy and bedrock sediment (51st day)

35
Unaffected sediment, broken container, rag pickers collecting the plastic and other materials (51st day)
36
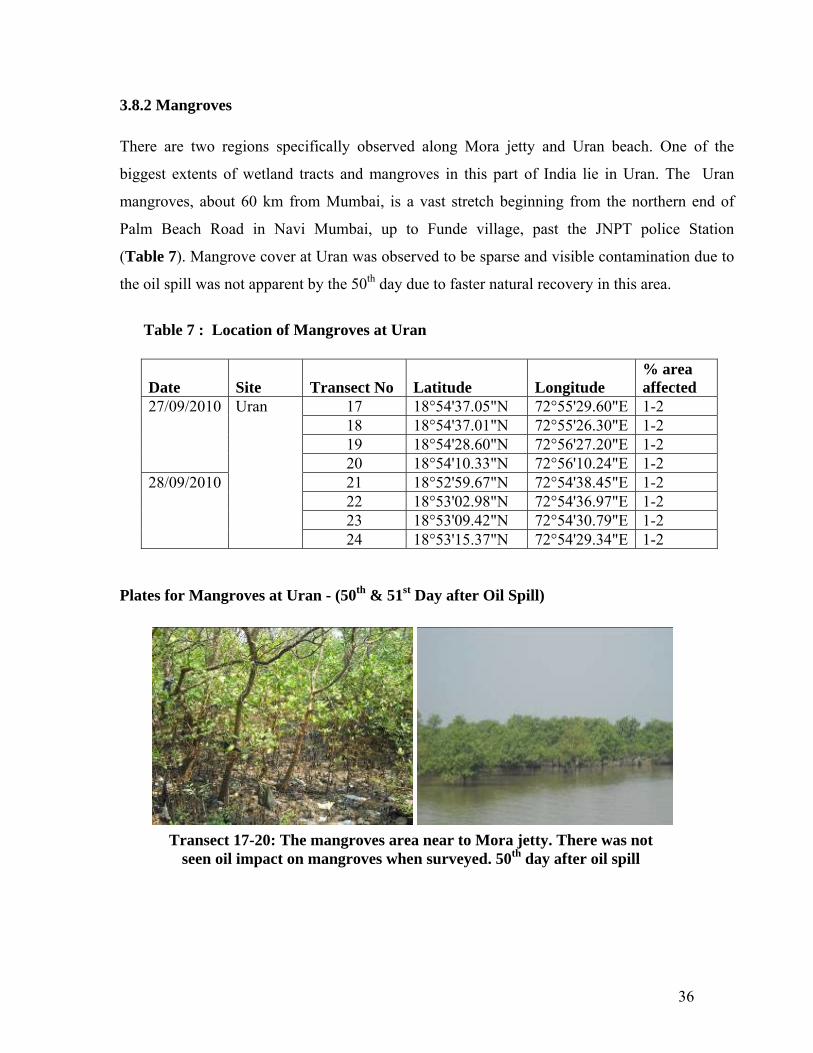
3.8.2 Mangroves
There are two regions specifically observed along Mora jetty and Uran beach. One of the
biggest extents of wetland tracts and mangroves in this part of India lie in Uran. The Uran
mangroves, about 60 km from Mumbai, is a vast stretch beginning from the northern end of
Palm Beach Road in Navi Mumbai, up to Funde village, past the JNPT police Station
(Table 7). Mangrove cover at Uran was observed to be sparse and visible contamination due to
the oil spill was not apparent by the 50th day due to faster natural recovery in this area.
Table 7 : Location of Mangroves at Uran
Plates for Mangroves at Uran - (50th & 51st Day after Oil Spill)
Date Site Transect No Latitude Longitude % area affected
17 18°54'37.05"N 72°55'29.60"E 1-2 18 18°54'37.01"N 72°55'26.30"E 1-2 19 18°54'28.60"N 72°56'27.20"E 1-2
27/09/2010
20 18°54'10.33"N 72°56'10.24"E 1-2 21 18°52'59.67"N 72°54'38.45"E 1-2 22 18°53'02.98"N 72°54'36.97"E 1-2 23 18°53'09.42"N 72°54'30.79"E 1-2
28/09/2010
Uran
24 18°53'15.37"N 72°54'29.34"E 1-2
Transect 17-20: The mangroves area near to Mora jetty. There was not seen oil impact on mangroves when surveyed. 50th day after oil spill
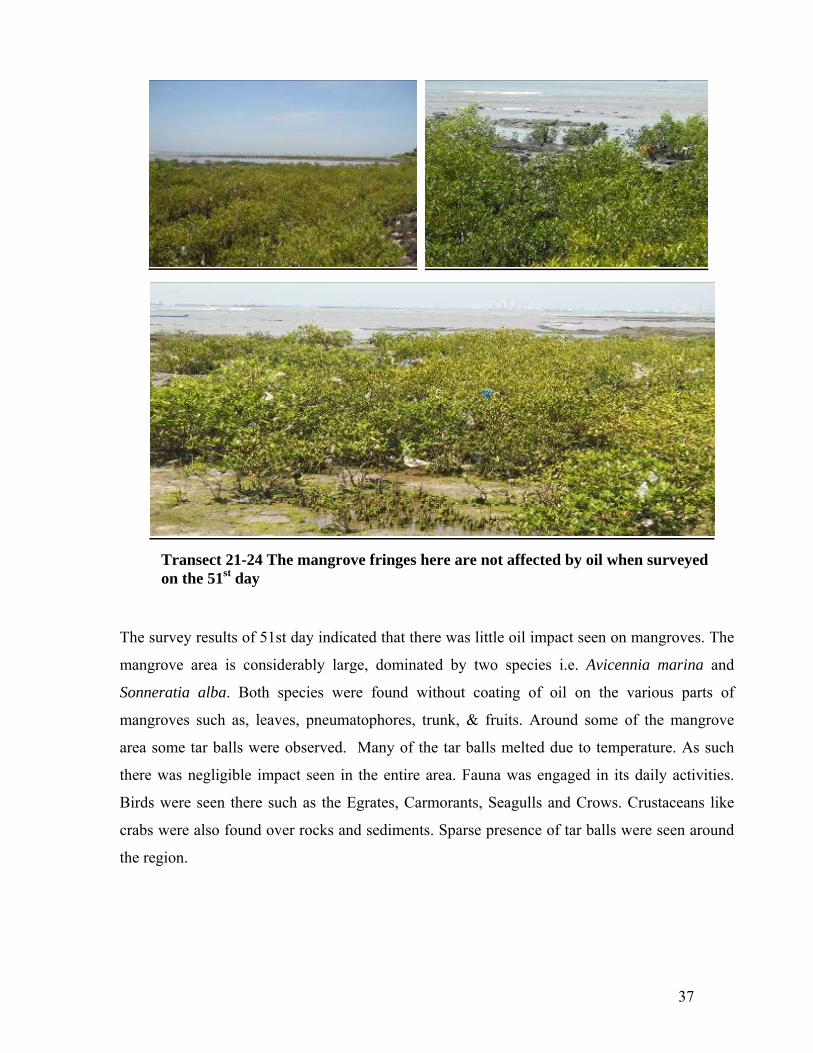
37
The survey results of 51st day indicated that there was little oil impact seen on mangroves. The
mangrove area is considerably large, dominated by two species i.e. Avicennia marina and
Sonneratia alba. Both species were found without coating of oil on the various parts of
mangroves such as, leaves, pneumatophores, trunk, & fruits. Around some of the mangrove
area some tar balls were observed. Many of the tar balls melted due to temperature. As such
there was negligible impact seen in the entire area. Fauna was engaged in its daily activities.
Birds were seen there such as the Egrates, Carmorants, Seagulls and Crows. Crustaceans like
crabs were also found over rocks and sediments. Sparse presence of tar balls were seen around
the region.
Transect 21-24 The mangrove fringes here are not affected by oil when surveyed on the 51st day

38
JNPT: The port is run by the Jawaharlal Nehru Port Trust, an organization entrusted with
the operations of the large shipping port in Navi Mumbai, India and controlled by
the Government of India. The geographic position of the port is 18°56´56.00”N,
72°56´57.32”E. The grab samples have been collected from the area nearby JNPT jetty.
Floating containers have been observed near the jetty area.
3.9 Mandva
It is a sandy and rocky beach having geographical 18°47´57.61”N, 72°55´56.42”E. It contains
approximately 8-10 km coastline. There is a jetty, which is used for locals for transportation
purposes. Around the jetty some stalls and shops are present. The area has a sandy beach with
some rocky areas near the coasts.
Boulders near the grounded container at jnpt are unaffected; however, earlier oil layers were found. Most of there were got cleaned by natural action. (63rd day)

39
3.9.1 Sediment
The sediment of the beach did not show significant traces of the oil except melted tar balls. Bed
rock also had negligible oil cover on it. However, locals have reported that there was some oil
layer in the beginning of the oil spill, which significantly receded by the 50th day. At the time
of assessment, very few tar balls seen on the beach area.
Plates of Sediment at Mandwa Shoreline
Sandy beach of the mandva and melted tar ball, unaffected bedrocks and sandy sediments (50th day)

40
3.9.2 Mangroves
The locations were studied for oil impact upon the mangroves in the Mandwa region as given in
Table 8. Oil impact on mangroves was insignificant. There are beaches on the side of the jetty,
so maximum area has been covered by sand. Mangroves are in lesser density and have not been
affected significantly.
Table 8 : Location of Mangroves Area at Mandwa
Date Site Transect No Latitude Longitude
% area affected
25 18° 48'18.53"N 72°52'57.74"E 1-2 26 18° 48'11.17"N 72°53'00.30"E 1-2 27 18° 48'10.70"N 72°53'05.00"E 1-2 28 18° 48'10.40"N 72°53'09.70"E 1-2 29 18° 48'09.90"N 72°53'13.30"E 1-2 30 18° 48'06.10"N 72°53'17.10"E 1-2 31 18° 48'01.70"N 72°53'16.10"E 1-2
28/09/10 Mandva
32 18° 48'15.00"N 72°53'57.30"E 1-2
Plates of Mangroves at Mandwa After 50th Day Oil Spill
Amongst the 8 transects assessed at Mandva shoreline the moderate cover of mangroves was not significantly affected. tar balls were spotted.50th day after Oil S ill

41
3.10 Revas
3.10.1 Sediment : The sandy shoreline is with abundance of mangrove vegetation. The area of
study is near the jetty area, with the geographical position is 18°49´15.21”N, 72°56´47.58”E.
The muddy and sandy sediment in this area did not show significant sign of oil on surface.
Table 9: Location of Mangroves and Sediment Identification at Revas
Date Site Transect No Latitude Longitude
% area affected
33 18° 49'16.80"N 72°56'47.60"E 1 28/09/10 Revas 34 18° 47'25.60"N 72°54'38.30"E 1
3.10.2 Mangroves
Large swathes of mangrove stand along both sides of the Revas jetty and also in the creek- lets.
The oil slick has not significantly affected the mangrove or mud flats.
3.11 Alibaug
Alibaug is located about 15 nautical miles south of Mumbai, at 18°38′29”N 72°52′20”E. The
Alibag shore line is mainly sandy in nature. There were few traces of oil on the sediment except
back side of the Colaba Fort (Alibaug Fort). The percent affected and mangrove identification
area is given in Table 11 and 12.
Table 11 : Sediment Percent Affected Area at Alibaug
Transect Geographical position Type of sediment % Area Affected 1 18° 37'55.00"N 2°57'49.90"E Bed rock, Sandy 20
Continuous stretches of mangroves are unaffected with intact mudflats and sandy muddy sediment at revas jetty

42
Table 12 : Location for Mangrove Identification at Alibaug
Date Site Transect No Latitude Longitude
% area affected
28/09/2010 Alibag 35 18°37'59.45"N 72°51'48.09"E 2-3
Unaffected Alibag Beach (3rd Day)
Unaffected Sandy Sediment of the Alibag Beach (50th day)
Affected Sandy and Rocky Sediment: Back Side of the Alibag fort (50th day)

43
3.12 Vashi - Thane Creek
3.12.1 Sediment : Both sides of Thane creek have been assessed for the oil spill impact of the
area of Bhandup, Kanjur, Vikroli and Airoli area. The muddy sediment in this area is showing
very low visual signs of the oil by the 51st day. The creek-lets have abundance of birds like
Cranes and Egrets. However, the sediments had shown oil traces during 5th -51st day .
Plates of Sediment Identification at Vashi - Thane Creek
The mangrove cover at Alibag is not significantly affected by the oil. almost intact epiphytic algae as well as other epibiota are seen.
Thane creek: Bhandup creek, Kanjurmarg –moderately muddy sediment (51st day) Densely populated habitant species harboring in the rookeries and mudflats
Thane creek: near Airoli bridge- moderately affected muddy sediment st

44
Thane Creek (Vashi area): The area comprises Vashi chowpatty (sector 8), the mangrove seen
this particular area is 50-60 percent affected with oil and showing sign of regeneration by the
51st day of the study. The sandy and muddy sediment in this area has no sign of oil
Palm Beach Road, Sarsole Village
3.12.2 Mangroves
The fragile ecosystem of Vashi mangroves has been ravaged by the oil slick to a considerable
extent along the eastern banks of the creek and Palm Beach road banks (Table 13). Vashi-
Thane creek cover a stretch of dense canopy of mangroves strands with a dominance of
Aveccinia marina species in the fore-front of eastern banks. Blackening of the mangroves has
reduced by 51st day, as compared to the observations made in the first week immediately after
the accident took place. Normal flocking of habitant bird species was apparent in the mangrove
Moderately affected sandy sediment and affected mangroves near Vashi sector 8 (51st day)
Moderately affected bedrock and sandy sediment near Palm beach road (52nd day)

45
rookeries. Mangroves towards the Navi Mumbai area are comparatively more affected than
those in the direction of Thane creek. Regeneration of affected mangroves was not significant.
Table 13 : Location Identification for Mangroves at Vashi-Thane Creek
Date Site Transect no Latitude Longitude % area affected
36 19°02'21.95"N 72°57'25.60"E 2037 19°07'80.60"N 72°58'04.40"E 2038 19°08'58.60"N 72°58'34.20"E 1939 19°10'00.00"N 72°58'51.00"E 2040 19°07'06.04"N 72°59'05.00"E 2041 19°06'00.00"N 72°58'51.00"E 3042 19°05'05.39"N 72°59'02.00"E 3043 19°05'10.87"N 72°59'10.33"E 3044 19°04'58.00"N 72°59'80.00"E 3045 19°03'48.00"N 72°58'45.00"E 3046 19°03'45.10"N 72°59'11.40"E 20
29/09/2010 Vashi
47 19°03'45.00"N 72°58'48.30"E 3048 19°00'56.80"N 73°00'00.70"E 3049 19°01'07.70"N 73°00'07.80"E 2550 19°07'16.50"N 73°00'07.90"E 2551 19°01'16.92"N 73°09’87.00"E 2552 19°01'50.90"N 73°00'02.60"E 2553 19°02'20.70"N 72°59'54.30"E 25
30/09/2010 Palm beach
54 19°02'49.30"N 72°59'56.00"E 20
Plates of Mangroves at Vashi-Thane Creek Mangroves After 51st, 52nd Day of Oil Spill
Thane Creek : Bhandup Creek, Kanjur – Unaffected Mangroves Area (51st day)

46
Thane Creek Near Airoli Bridge- Unaffected Mangroves (51st day)
Affected mangroves near Vashi sector 8 (51st day)

47
Palm Beach Road, Sarsole village
3.13 Trombay, Mahul and Sewari Area:
It is a hook area of the Thane creek comprising of regions of Trombay, Mahul and Sewari. The
seabed sediment samples were collected from this region by grab sampler
Affected mangroves along area of the Palm Beach road. Near the Sarsole village there was a creek-let which shows the blackish water. There was so many boats which also polluted the region (52nd day)
Grab sampling for seabed sediment (56th day)

48
3.13.1 Mangroves: About 15 acres mangroves area between Shewri and Trombay are the part
of the study given in Table 14.
Table 14: Location for mangroves at Trombay-Shewri
Date Site Transect No Latitude Longitude % area affected
55 19°02'51.00"N 72°57'44.00"E 10 56 19°01'13.00"N 72°56'52.00"E 15
Trombay
57 19°00'44.00"N 72°56'11.00"E 10 58 18°59'37.00"N 72°53'80.00"E 20 59 19°09’05.00"N 72°53'30.10"E 20 60 19°00'27.00"N 72°53'00.00"E 20 61 19°08’57.00"N 72°51'45.03"E 10
04/10/2010
Shevari
62 18°59'48.31"N 72°51'39.31"E 15
Plate of mangroves at Trombay-Shewri After 56th day Oil Spill
A monotype culture of mangroves affected stands along the banks of Mahul – Shewri with birds harboring in the rookeries
Along the Mahul - Shewri area some oil coated seen on mangroves

49
3.14 Daramtar and Bhal Creek
This creek is situated in south of Uran shoreline and mainly divided into Dharmtar and Bhal
creek (Table 16).
Table 16: Location of mangroves at Dharamtar creek
Date Site Transect no
Latitude Longitude % area affected
D1 18°48'33.52"N 72°57'11.89"E 2 D2 18°48'70.01"N 72°58'30.51"E 2 D3 18°47'00.08"N 72°59'22.92"E 2 D4 18°46'40.52"N 72°59'43.67"E 2 D5 18°44'40.58"N 72°59'60.22"E 2 D6 18°43'50.86"N 73°00'15.29"E 2 D7 18°48'22.29"N 72°59'41.98"E 2 D8 18°48'00.41"N 73°03’50.81"E 2 D9 18°49'36.33"N 72°58'50.74"E 2
05/10/2010 Dharamtar
D10 18°51'80.65"N 72°58'41.79"E 2
Plates of mangroves at Dharamtar after 57th Day of Oil Spill
Floating container at Bhal creek (57th day)
A container barging into the large mudflats of the Dharamtar creek in the upper intertidal region. This region does not show significant oil spill impact by 57th day.

50
3.15 Nhava-Sheva
Nhava Sheva is the 6th largest port and largest container port in India. The geographical
position of Nhava is at 18°57′28.5″N and 72°59′11.45″E and Sheva is at 18°56′05.34″N and
72°57′39.98″E (Table 17). Grab samples were collected from the shoreline for oil analysis.
There was no visual oil impacted sediment at this site.
Table 17 : Location for Mangroves Identification at Nhava-Sheva
Date Site Transect No Latitude Longitude % area affected
63 18°58'20.06"N 72°59'90.85"E 1-2 64 18°57'47.30"N 72°58'50.20"E 1-2 65 18°57'46.50"N 72°58'26.80"E 1-2
Sheva
66 18°57'52.00"N 72°58'20.50"E 1-2
09/10/2010
Nava 67 18°58'01.20"N 72°58'04.60"E 1-2 Plates of sediment at Nhava-Sheva After 61st days of Oil Spill
Sediment is showing insignificant oil impact (61st day)

51
3.16 Navy Nagar and Near by Area
The study area includes shoreline of INS Kunjali with geographical position 18°53′42.39″N and
72°48′35.07″E (Table 18). The shoreline of the INS Kunjali is mainly covered with bedrock,
boulders and pebbles with few area covered with sandy sediment. Different levels of Oil
cleaning operation have been carried out at the site.
Oil covered with mud and marine algae (71st day)
Moderately sandy and pebbled shoreline and thin sheen on the sand (71st day)
Affected mangrove trunks along with the sandy sediment and oiled boulders (71st day)

52
3.16.1 Mangroves Table 18: Location for mangroves identification near Navy Nagar area
Date Site Transect No
Latitude Longitude % Area affected
68 18° 53'29.34"N 72°48'27.86"E 8869 18° 53'27.18"N 72°48'29.96"E 6870 18° 53'30.57"N 72°48'32.15"E 7071 18° 53'30.78"N 72°48'39.32"E 75
19/10/2010 Navy Nagar
72 18° 53'38.12"N 72°48'43.86"E 88 Plates of mangroves area near Navy Nagar
Effects of oil have reached the mangrove surfaces due to intertidal to shallow sub tidal levels at Navy Nagar.
53
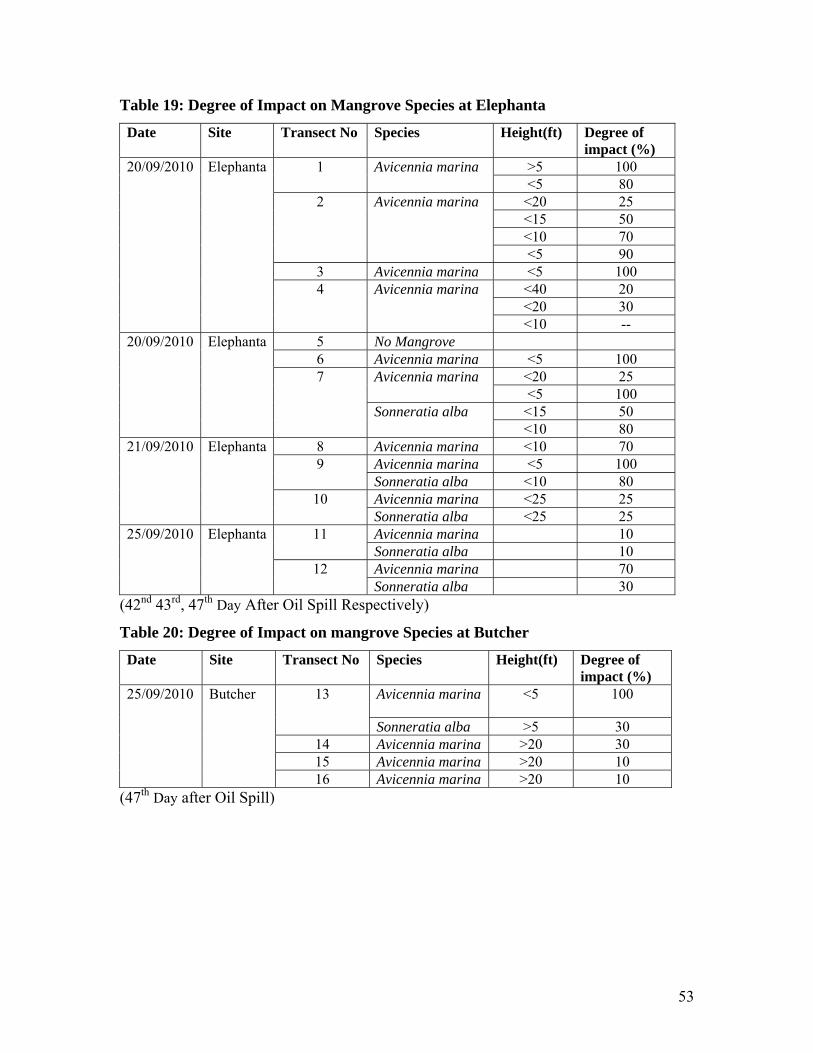
Table 19: Degree of Impact on Mangrove Species at Elephanta
Date Site Transect No Species Height(ft) Degree of impact (%)
>5 100 1 Avicennia marina <5 80
<20 25 <15 50 <10 70
2 Avicennia marina
<5 90 3 Avicennia marina <5 100
<40 20 <20 30
20/09/2010 Elephanta
4 Avicennia marina
<10 -- 5 No Mangrove 6 Avicennia marina <5 100
<20 25 Avicennia marina <5 100
<15 50
20/09/2010 Elephanta
7
Sonneratia alba <10 80
8 Avicennia marina <10 70 Avicennia marina <5 100 9 Sonneratia alba <10 80 Avicennia marina <25 25
21/09/2010 Elephanta
10 Sonneratia alba <25 25 Avicennia marina 10 11 Sonneratia alba 10 Avicennia marina 70
25/09/2010 Elephanta
12 Sonneratia alba 30
(42nd 43rd, 47th Day After Oil Spill Respectively)
Table 20: Degree of Impact on mangrove Species at Butcher
Date Site Transect No Species Height(ft) Degree of impact (%)
Avicennia marina <5 100 13
Sonneratia alba >5 30 14 Avicennia marina >20 30 15 Avicennia marina >20 10
25/09/2010 Butcher
16 Avicennia marina >20 10 (47th Day after Oil Spill)

54
Table 21: Degree of Impact on mangrove Species at Uran and JNPT
Date Site Transect No Species Height(ft) Degree of impact (%)
Avicennia marina >20 0 17
Sonneratia alba >20 0 Avicennia marina >20 0
Uran
18 Sonneratia alba >20 0
JNPT 19 Sonneratia alba 0
27/09/2010
Uran 20 Avicennia marina >20 0 (49th Day after Oil Spill)
Table 22: Degree of Impact on mangrove Species at Mandva
Date Site Transect No Species Height(ft) Degree of impact (%)
Avicennia marina <5 0 21
Sonneratia alba >5 0 22 Sonneratia alba >5 0
Avicennia marina >5 0 23 Sonneratia alba <5 0
24 Avicennia marina <5 0 25 Avicennia marina <5 0
Avicennia marina <5 0 26 Sonneratia alba >10 0
27 Avicennia marina >15 0
27/09/2010 Mandva
28 No Mangroves (49th Day after Oil Spill)
Table 23: Degree of Impact on mangrove Species at Uran Beach
Date Site Transect No Species Height(ft) Degree of impact (%)
Avicennia marina <5 0 29
Sonretia alba <5 0 Avicennia marina <5 0 30 Sonretia alba <5 0 Avicennia marina <5 0 31 Sonretia alba <5 0 Avicennia marina <5 0
28/09/2010 Uran beach
32 Sonretia alba <5 0
(50th Day after Oil Spill)

55
Table 24 : Degree of Impact on mangrove Species at Revas
Date Site Transect No Species Height(ft) Degree of impact (%)
Avicennia marina 0 33 Sonneratia alba 0 Avicennia marina <5 0
28/09/2010 Revas
34 Avicennia marina >5 0
(50th Days after Oil Spill)
Table 25 : Degree of Impact on mangrove Species at Alibag
Date Site Transect No Species Height(ft) Degree of impact (%)
28/09/2010 Alibag 35 Avicennia marina >5 0 (50th Day after Oil Spill)
Table 26 : Degree of Impact on mangrove Species at Vashi
Date Site Transect No Species Height(ft) Degree of impact (%)
36 Avicennia marina <25 0 37 Avicennia marina <25 0 38 Avicennia marina <25 0 39 No Mangroves
Avicennia marina >25 0 40 Sonneratia alba >20 0 Avicennia marina >20 10 41 Sonneratia alba >20 10 Avicennia marina >10 40 42 Avicennia marina <10 60 Avicennia marina >10 30 43 Sonneratia alba >10 30 Avicennia marina >10 30 44 Sonneratia alba >10 30
45 Avicennia marina <10 80 46 Avicennia marina >10 40
29/09/2010 Vashi
47 Avicennia marina <10 80 (51th Day after Oil Spill)

56
Table 27: Degree of Impact on mangrove Species at Palm Beach
Date Site Transect No Species Height(ft) Degree of impact (%)
Avicennia marina >10 20 48 Avicennia marina <10 30
49 Avicennia marina Avicennia marina >15 20 50 Sonneratia alba >10 30 Avicennia marina >15 40 51 Sonneratia alba >10 20 Avicennia marina >20 20 52 Sonneratia alba >10 30 Avicennia marina >15 30 53 Sonneratia alba >25 20 Avicennia marina >25 40
01/10/2010 Palm beach
54 Sonneratia alba >20 50
(53rd Day after Oil Spill)
Table 28: Degree of Impact on mangrove Species at Trombay
Date Site Transect No Species Height(ft) Degree of impact (%)
55 Avicennia marina >15 30 56 Avicennia marina >5 70
Avicennia marina >5 60
04/10/2010 Trombay
57 Sonneratia alba >5 40
(56th Day after Oil Spill)
Table 29: Degree of Impact on mangrove Species at Shewri
Date Site Transect No Species Height(ft) Degree of impact (%)
58 Avicennia marina >5 20 <5 50 59 Avicennia marina
>10 30 Avicennia marina >5 40
>10 30 60
Avicennia marina >10 30 >10 30 61 Avicennia marina >10 30 >10 10
04/10/2010 Shevari
62 Avicennia marina >10 10
(56th Day after Oil Spill)

57
Table 30 : Degree of Impact on mangrove Species at Sheva
Date Site Transect No Species Height(ft) Degree of impact (%)
Avicennia marina 63 Sonneratia alba
64 No Mangroves Avicennia marina 0 65 Sonneratia alba 0 Avicennia marina 0
Sheva
66 Sonneratia alba 0 Avicennia marina 0
9/10/2010
Nava 67 Sonneratia alba 0
(61ST Day After Oil Spill)
Table 31 : Degree of Impact on mangrove Species at Navy Nagar
Date Site Transect No Species Height(ft) Degree of impact (%)
Avicennia marina <5 100 Avicennia marina >5 60
68
Sonneratia alba >10 20 Avicennia marina >5 50 69 Avicennia marina >10 30 Avicennia marina >5 100 Avicennia marina >10 60
70
Sonneratia alba >10 70 Avicennia marina >5 90 Avicennia marina >10 40
71
Sonneratia alba >10 30 Avicennia marina <5 100 Avicennia marina >5 60 Avicennia marina >10 40
19/10/2010 Navy Nagar
72
Sonneratia alba >10 30 (71Th Day After Oil Spill)

58
Details of quadrate locations and assessment of the quadrate for identification of impact area is
given in Table 32 and Table 33.
Table 32 : Details of Quadrat Locations
Quadrate No Location Latitude Longitude Length (meter)
Width (meter)
QD 1 Elephanta 18° 57'59.60"N 72°55'47.30"E 5 5 QD2 Elephanta 18° 57'58.90"N 72°55'48.50"E 5 5
Table 33 : Assessment of the Quadrates
Quadrate No Species Height (ft) Degree of Impact (%) No of Sp.
QD 1 Avicennia marina <5 100 70
Sonneratia alba >5 80 4
QD2 Avicennia marina <5 100 48
Sonneratia alba >5 80 7 During the survey at different transect the percent impact of oil spill and the number of species
affected of A. marina and S. alba have been estimated. The total number of affected species in
different region is given in Table 34.
Table 34 : Trees affected of A. marina and S. alba at Different Locations
Location Total No. of A. marina Plants
Total No. of Affected A. marina Plants Trees
% of Affected A. marina sps
Elephanta 337613 66655 20 Butcher 75159 21928 29 Vashi 1930360 427126 22 Trombay 643668 99206 15 Navy Nagar 17021 12202 72
Location Total No. of S. alba Plants
Total No. of Affected S. alba Plants Trees
% of Affected S. alba sps
Elephanta 9723 2296 24 Butcher 34163 10838 32 Vashi 965365 213604 22 Trombay 20107 3099 15 Navy Nagar 349 235 67
59
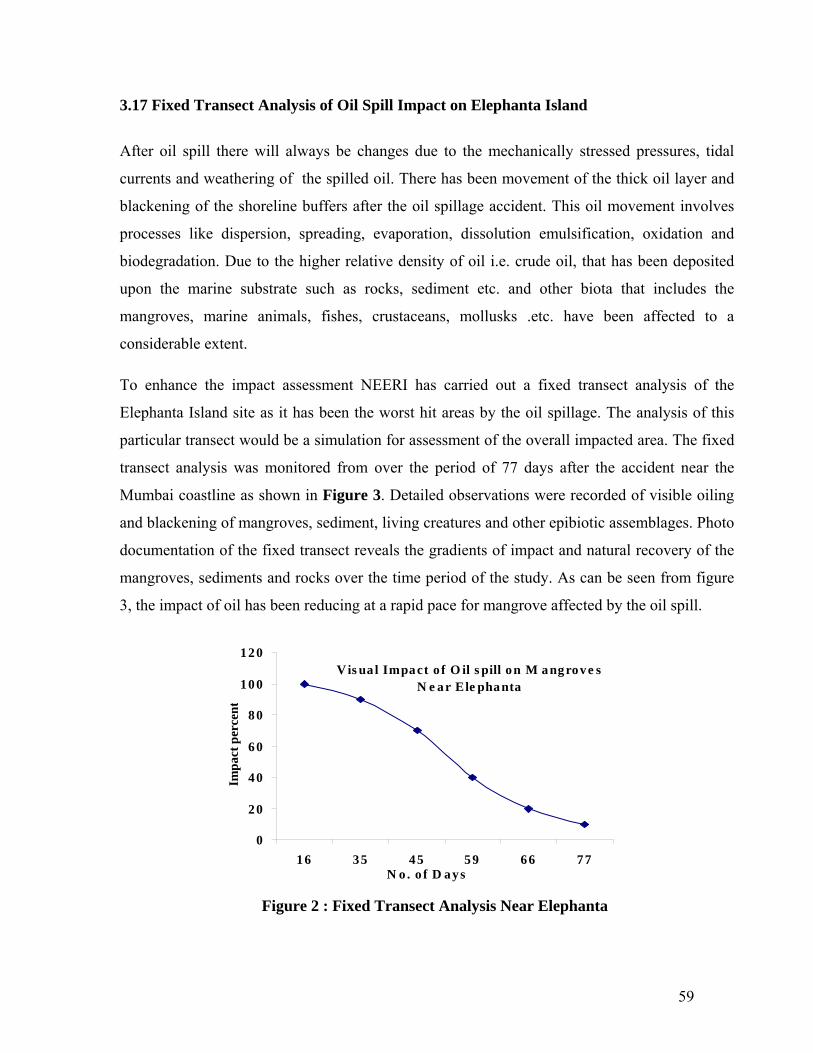
3.17 Fixed Transect Analysis of Oil Spill Impact on Elephanta Island
After oil spill there will always be changes due to the mechanically stressed pressures, tidal
currents and weathering of the spilled oil. There has been movement of the thick oil layer and
blackening of the shoreline buffers after the oil spillage accident. This oil movement involves
processes like dispersion, spreading, evaporation, dissolution emulsification, oxidation and
biodegradation. Due to the higher relative density of oil i.e. crude oil, that has been deposited
upon the marine substrate such as rocks, sediment etc. and other biota that includes the
mangroves, marine animals, fishes, crustaceans, mollusks .etc. have been affected to a
considerable extent.
To enhance the impact assessment NEERI has carried out a fixed transect analysis of the
Elephanta Island site as it has been the worst hit areas by the oil spillage. The analysis of this
particular transect would be a simulation for assessment of the overall impacted area. The fixed
transect analysis was monitored from over the period of 77 days after the accident near the
Mumbai coastline as shown in Figure 3. Detailed observations were recorded of visible oiling
and blackening of mangroves, sediment, living creatures and other epibiotic assemblages. Photo
documentation of the fixed transect reveals the gradients of impact and natural recovery of the
mangroves, sediments and rocks over the time period of the study. As can be seen from figure
3, the impact of oil has been reducing at a rapid pace for mangrove affected by the oil spill.
V is ua l Impact o f O il s pill on M angrove s N e ar Ele phanta
0
20
40
60
80
100
120
16 35 45 59 66 77N o. o f D ays
Impa
ct p
erce
nt
Figure 2 : Fixed Transect Analysis Near Elephanta

60
The above photograph illustrates the oil impact on the mangroves within 15 days after the accident took place. Blackening of almost the entire mangrove transect can be conspicuously seen. Marine flora and fauna in the transect area as well as its vicinity are worst impacted due to the oil spillage.
The transect plotted for the fixed transect analysis was on the western periphery of the island. (Latitude 18° 57'59.06"N and Longitude 72°55'44.09"E).
(16th day after oil spill)- 23-08-10

61
Documented during the high tide to compare the changes or physical stresses caused due to the tidal levels and hydrological patterns.
(35th day after oil spill) -13-09-2010

62
Sheen of oil covering the sediment is seen in some patches of the transect at Shetbandargaon even on the 35th day.
The blackening reducing by the 35th day due to natural recovery.
63
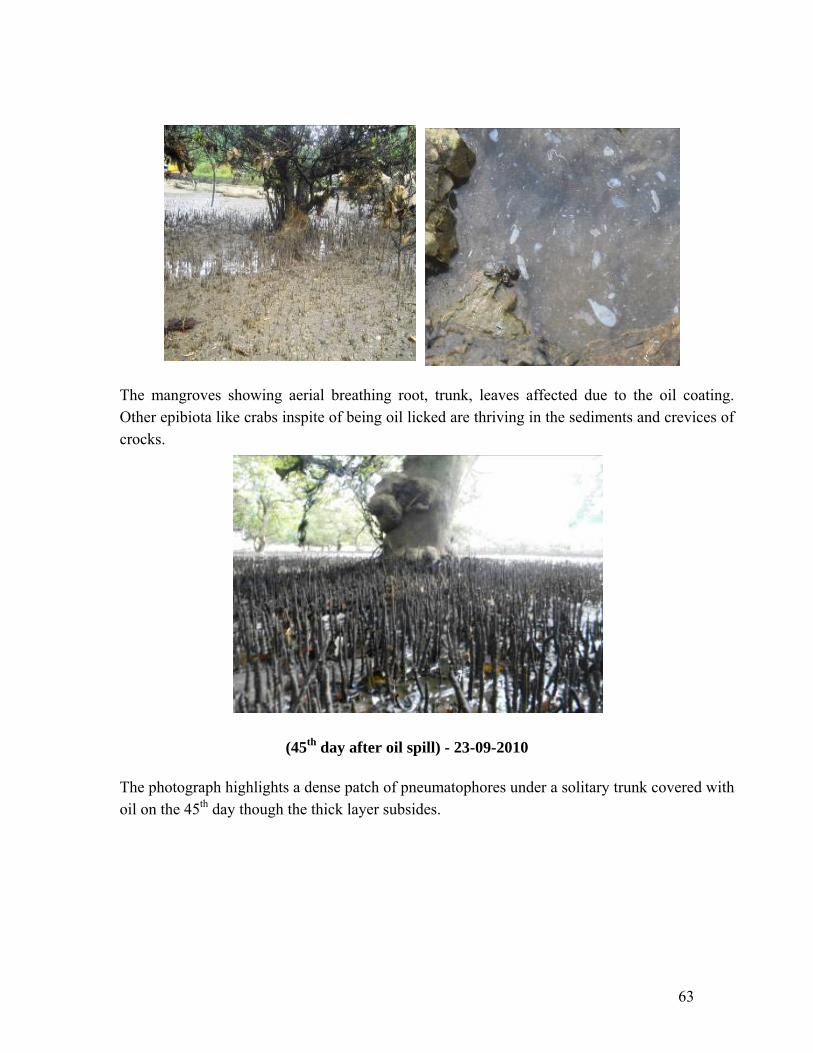
The mangroves showing aerial breathing root, trunk, leaves affected due to the oil coating. Other epibiota like crabs inspite of being oil licked are thriving in the sediments and crevices of crocks.
(45th day after oil spill) - 23-09-2010 The photograph highlights a dense patch of pneumatophores under a solitary trunk covered with oil on the 45th day though the thick layer subsides.

64
Lighter gradients of oil seen in the stretch of mangrove as compared to the 35th day.
The sheen of oil in the sediment and bed rock recovering slowly.
(59th day after oil spill) - 7-10-2010 On the 59th day observations distinctly reveal the natural recovery taking place by the reduction in blackening of oil impacted mangroves. Though the oil layer covering on the pneumatophores persists their growth is not highly shunted, new growth is seen to be extending as depicted in this densely networked pneumatophores.

65
Other epibiotic assemblages like crustaceans, mollusks living with normal movements in the transect area and its vicinity.
(66th day after oil spill) - 14-10-10
The blackening of thick oil layer on the bed rock observed to have reduced on the 66th day. Also oil stressed crabs surviving in these bed rocks were spotted.

66
Algae observed to be growing after 66th day on the affected transect area indicating the direction towards recovery after undergoing direct and indirect stresses of oil spill
Mortality of mangroves below 2 ft tampered due to oil layers Degradation of micro and macro habitats in sediments has taken place but existence of burrows of fiddler crabs is apparent.

67
Over a period of 66 days, the above photographs show further recovery of the mangrove spread. The oil affected mangroves and mud flats getting slowly vegetated with the respective species.

68
(77th day after oil spill) -25-10-2010 The transect along the western periphery of the island clearly highlights the recovery in process of the stretch of mangrove fringes after 77 days. Mortality of stunted Aveccinia marina in a small patch of the transect is spotted.

69
Stray cattle feeding on the recovered assemblages in the soft sediments were spotted onsite Distinct epibiotic assemblage and sessile invertebrates on open coast and bed rock are observed after oil stress of 77 days.

70
Oil in sediments and mudflats has affected percolation and surface run offs, silt loads and stream flows but attachment and activities of epibiota is observed to be taking place due to the recovery process. Reduction in surface area for attachment of epibiota is observed but foliose algae have been observed in small patches.

71
After a period of 77 days, regeneration of various mangrove species is conspicuously observed over the oil coated branches. The earlier period shows a thick oil layer on the mangrove leaves which hindered the light reaching the surfaces for essential plant physiological process like photosynthesis and metabolism. The fresh mangrove leaves shall help in recovering from the changes and disturbances in the amount of light reaching the mangrove surfaces. Also post spill, the oil covered significantly less space on the prop roots.
72
3.18 Work in Progress
The assessment work presented in this report is limited to first interim assessment based
on data and information. During the study, many samples have been collected which are
being analyzed. Socio-economic and other data sets are also being analyzed for
interpretation after complete documentation. The work under progress is given here under
which shall be submitted in subsequent reports.
1. Impact mapping of the region
a. Remote Sensing Satellite data is being analyzed with the ground truth data.
b. Data representation the map with details of area.
c. Long term impact assessment
d. Chemical quality assessment is under progress.
e. As there are many agencies carrying out assessment at varying time interval and extent
of work, it is important to integrate and use the same for interpretation by collating the
same with MPCB.
f. After all the data of other agencies including that of NIO is obtained, these will be
overlaid for further analysis.
2. Damage assessment
a. Water quality related
b. Fisheries and other resources (other source of data and information to be obtained
through MPCB/GOM efforts to get necessary secondary information)
3. Recommendation and Deliverables
a. The whole mapping of the region shall be divided into various aspects of damages and
costs of the restoration. This work shall be submitted in subsequent reports.
b. The damage costs shall include direct costs (where direct clean up is possible by
human efforts) and indirect damage (where natural attenuation is the only way)
i. Direct costs of oil spill and indirect costs including intangibles in short term
ii. Long term costs can be attempted, however the same will depend upon the
availability of data
73
References:
• Lewis R.R., 1983. Impact of Oil Spills on Mangrove Forests, Mangrove Systems, Inc., Tampa, Florida, USA.
• Kathiresan K., Methods of Studying Mangroves. Centre of Advanced Study in
Marine Biology, Annamalai University.
• Quantitative Analysis by the Point-Centered Quarter Method Kevin Mitchell, Department of Mathematics and Computer Science Hobart and William Smith Colleges, Geneva, NY 14456 25 June 2007
• AMSA. 2003. Oil Spill Monitoring Handbook. Prepared by Wardrop Consulting
and the Cawthron Institute for the Australian Maritime Safety Authority (AMSA) and the Marine Safety Authority of New Zealand (MSA). Published by AMSA, Canberra.
• Oil Spills in Mangroves: Planning & Response Considerations, Lanning &
Response Considerations July 2010 Rebecca Hoff, U.S. Department of Commerce, National Oceanic and Atmospheric Administration, National Ocean Service, Office of Response and Restoration