Environmental gradients and the evolution of successional habitat ...
15
Environmental gradients and the evolution of successional habitat specialization: a test case with 14 Neotropical forest sites Susan G. Letcher 1 *, Jesse R. Lasky 2,3 , Robin L. Chazdon 4 , Natalia Norden 5,6 , S. Joseph Wright 7 , Jorge A. Meave 8 , Eduardo A. P erez-Garc ıa 8 , Rodrigo Mu~ noz 8 , Eunice Romero- P erez 8 , Ana Andrade 9 , Jos e Luis Andrade 10 , Patricia Balvanera 11 , Justin M. Becknell 12 , Tony V. Bentos 9 , Radika Bhaskar 13 , Frans Bongers 14 , Vanessa Boukili 4 , Pedro H. S. Brancalion 15 , Ricardo G. C esar 15 , Deborah A. Clark 16 , David B. Clark 16 , Dylan Craven 17 , Alexander DeFrancesco 4 , Juan M. Dupuy 10 , Bryan Finegan 18 , Eugenio Gonz alez- Jim enez 19 , Jefferson S. Hall 7 , Kyle E. Harms 20 , Jos e Luis Hern andez-Stefanoni 10 , Peter Hietz 21 , Deborah Kennard 22 , Timothy J. Killeen 23 , Susan G. Laurance 24 , Edwin E. Lebrija- Trejos 7,8 , Madelon Lohbeck 11,14 , Miguel Mart ınez-Ramos 11 , Paulo E. S. Massoca 9 , Rita C. G. Mesquita 9 , Francisco Mora 11 , Robert Muscarella 3,25 , Horacio Paz 10 , Fernando Pineda- Garc ıa 26 , Jennifer S. Powers 27 , Ruperto Quesada-Monge 28 , Ricardo R. Rodrigues 29 , Manette E. Sandor 4 , Luc ıa Sanaphre-Villanueva 10 , Elisabeth Sch€ uller 30 , Nathan G. Swenson 31 , Alejandra Tauro 11 , Mar ıa Uriarte 3 , Michiel van Breugel 7,32 , Orlando Vargas- Ram ırez 33 , Ricardo A. G. Viani 34 , Amanda L. Wendt 4 and G. Bruce Williamson 9,20 1 Department of Environmental Studies, Purchase College (SUNY), 735 Anderson Hill Road, Purchase, New York 10577, USA; 2 Earth Institute, Columbia University, 405 Low Library, MC 4335, 535 West 116th Street, New York, NY 10027, USA; 3 Department of Ecology, Evolution and Environmental Biology, Columbia University, 1200 Amsterdam Ave., Manhattan, NY 10027, USA; 4 Department of Ecology and Evolutionary Biology, University of Connecticut, 75 N. Eagleville Road, Storrs, CT 06269-3043, USA; 5 Fundaci on Cedrela, Diagonal 40A # 18A - 09, Bogot a, Colombia; 6 Programa de Biolog ıa, Facultad de Ciencias Naturales y Matem aticas, Universidad del Rosario, Cra 24 # 63C-69, Bogot a, Colombia; 7 Smithsonian Tropical Research Institute, Apartado 0843-03092, Balboa, Republic of Panama; 8 Departamento de Ecolog ıa y Recursos Naturales, Facultad de Ciencias, Universidad Nacional Aut onoma de M exico, Ciudad Universitaria, Circuito Exterior s/n, M exico 04510 D.F., Mexico; 9 Coordenac ß ~ ao de Din^ amica Ambiental, Instituto Nacional de Pesquisas da Amaz^ onia, Av. Andr e Ara ujo 1756, Petr opolis, Manaus, Amazonas 69067-375, Brazil; 10 Unidad de Recursos Naturales, Centro de Investigaci on Cient ıfica de Yucat an, Calle 43 No. 130, Col. Chuburn a de Hidalgo, C.P. 97200 M erida, Yucat an, M exico; 11 Instituto de Investigaciones en Ecosistemas y Sustentabilidad, Universidad Nacional Aut onoma de M exico Unidad Morelia, Antigua Carretera a P atzcuaro 8701 58190, Morelia, Michoac an, M exico; 12 Department of Biology, University of Alabama, Box 870344, Tuscaloosa, AL 35487, USA; 13 Environmental Change Initiative, Brown University, Box 1951, Providence, RI 02912, USA; 14 Forest Ecology and Forest Management, Wageningen University, 6708 PB Wageningen, The Netherlands; 15 Departamento de Ci ^ encias Florestais, Escola Superior de Agricultura Luiz de Queiroz, University of S~ ao Paulo, Av. P adua Dias, 11, Piracicaba S~ ao Paulo 13418-900, Brazil; 16 Department of Biology, University of Missouri – St. Louis, 1 University Blvd, St. Louis, MO 63121, USA; 17 Synthesis Centre for Biodiversity Sciences, German Centre for Biodiversity Research, Deutscher Platz 5e, 04103, Leipzig, Germany; 18 Production and Conservation in Forests Programme, Centro Agron omico Tropical para Investigaci on y Ense~ nanza, 7170 Cartago, Turrialba 30501, Costa Rica; 19 Soltis Center for Research and Education in Costa Rica, Texas A&M University, San Isidro de Pe~ nas Blancas, Apto. 80-4417, Fortuna, San Carlos, Costa Rica; 20 Department of Biological Sciences, Louisiana State University, 202 Life Science Bldg., Baton Rouge, LA 70803, USA; 21 Institute of Botany, University of Natural Resources and Life Sciences, Gregor-Mendel- Straße 33, 1180 Vienna, Austria; 22 Department of Physical and Environmental Sciences, Colorado Mesa University, 1100 North Ave, Grand Junction, CO 81501, USA; 23 Museo de Historia Natural Noel Kempff Mercado, Av. Irala No. 565, Santa Cruz, Bolivia; 24 School of Marine and Tropical Biology, James Cook University, 1 James Cook Dr, Townsville, Qld 4811, Australia; 25 Ecoinformatics and Biodiversity, Department of Bioscience, Aarhus University, 8000 C Aarhus, Denmark; 26 Escuela Nacional de Estudios Superiores, Unidad Morelia, Universidad Nacional Aut onoma de M exico, Antigua Carretera a P atzcuaro 8701, 58190, Morelia, Michoac an, Mexico; 27 Department of Ecology, Evolution, *Correspondence author: E-mail: [email protected] © 2015 The Authors. Journal of Ecology © 2015 British Ecological Society Journal of Ecology 2015, 103, 1276–1290 doi: 10.1111/1365-2745.12435
Transcript of Environmental gradients and the evolution of successional habitat ...
Environmental gradients and the evolution ofsuccessional habitat specialization: a test case with 14Neotropical forest sites
Susan G. Letcher1*, Jesse R. Lasky2,3, Robin L. Chazdon4, Natalia Norden5,6, S. JosephWright7, Jorge A. Meave8, Eduardo A. P�erez-Garc�ıa8, Rodrigo Mu~noz8, Eunice Romero-P�erez8, Ana Andrade9, Jos�e Luis Andrade10, Patricia Balvanera11, Justin M. Becknell12,Tony V. Bentos9, Radika Bhaskar13, Frans Bongers14, Vanessa Boukili4, Pedro H. S.Brancalion15, Ricardo G. C�esar15, Deborah A. Clark16, David B. Clark16, Dylan Craven17,Alexander DeFrancesco4, Juan M. Dupuy10, Bryan Finegan18, Eugenio Gonz�alez-Jim�enez19, Jefferson S. Hall7, Kyle E. Harms20, Jos�e Luis Hern�andez-Stefanoni10, PeterHietz21, Deborah Kennard22, Timothy J. Killeen23, Susan G. Laurance24, Edwin E. Lebrija-Trejos7,8, Madelon Lohbeck11,14, Miguel Mart�ınez-Ramos11, Paulo E. S. Massoca9, Rita C. G.Mesquita9, Francisco Mora11, Robert Muscarella3,25, Horacio Paz10, Fernando Pineda-Garc�ıa26, Jennifer S. Powers27, Ruperto Quesada-Monge28, Ricardo R. Rodrigues29,Manette E. Sandor4, Luc�ıa Sanaphre-Villanueva10, Elisabeth Sch€uller30, Nathan G.Swenson31, Alejandra Tauro11, Mar�ıa Uriarte3, Michiel van Breugel7,32, Orlando Vargas-Ram�ırez33, Ricardo A. G. Viani34, Amanda L. Wendt4 and G. Bruce Williamson9,20
1Department of Environmental Studies, Purchase College (SUNY), 735 Anderson Hill Road, Purchase, New York10577, USA; 2Earth Institute, Columbia University, 405 Low Library, MC 4335, 535 West 116th Street, New York, NY10027, USA; 3Department of Ecology, Evolution and Environmental Biology, Columbia University, 1200 AmsterdamAve., Manhattan, NY 10027, USA; 4Department of Ecology and Evolutionary Biology, University of Connecticut, 75 N.Eagleville Road, Storrs, CT 06269-3043, USA; 5Fundaci�on Cedrela, Diagonal 40A # 18A - 09, Bogot�a, Colombia;6Programa de Biolog�ıa, Facultad de Ciencias Naturales y Matem�aticas, Universidad del Rosario, Cra 24 # 63C-69,Bogot�a, Colombia; 7Smithsonian Tropical Research Institute, Apartado 0843-03092, Balboa, Republic of Panama;8Departamento de Ecolog�ıa y Recursos Naturales, Facultad de Ciencias, Universidad Nacional Aut�onoma de M�exico,Ciudad Universitaria, Circuito Exterior s/n, M�exico 04510 D.F., Mexico; 9Coordenac�~ao de Dinamica Ambiental, InstitutoNacional de Pesquisas da Amazonia, Av. Andr�e Ara�ujo 1756, Petr�opolis, Manaus, Amazonas 69067-375, Brazil;10Unidad de Recursos Naturales, Centro de Investigaci�on Cient�ıfica de Yucat�an, Calle 43 No. 130, Col. Chuburn�a deHidalgo, C.P. 97200 M�erida, Yucat�an, M�exico; 11Instituto de Investigaciones en Ecosistemas y Sustentabilidad,Universidad Nacional Aut�onoma de M�exico Unidad Morelia, Antigua Carretera a P�atzcuaro 8701 58190, Morelia,Michoac�an, M�exico; 12Department of Biology, University of Alabama, Box 870344, Tuscaloosa, AL 35487, USA;13Environmental Change Initiative, Brown University, Box 1951, Providence, RI 02912, USA; 14Forest Ecology andForest Management, Wageningen University, 6708 PB Wageningen, The Netherlands; 15Departamento de CienciasFlorestais, Escola Superior de Agricultura Luiz de Queiroz, University of S~ao Paulo, Av. P�adua Dias, 11, PiracicabaS~ao Paulo 13418-900, Brazil; 16Department of Biology, University of Missouri – St. Louis, 1 University Blvd, St. Louis,MO 63121, USA; 17Synthesis Centre for Biodiversity Sciences, German Centre for Biodiversity Research, DeutscherPlatz 5e, 04103, Leipzig, Germany; 18Production and Conservation in Forests Programme, Centro Agron�omicoTropical para Investigaci�on y Ense~nanza, 7170 Cartago, Turrialba 30501, Costa Rica; 19Soltis Center for Researchand Education in Costa Rica, Texas A&M University, San Isidro de Pe~nas Blancas, Apto. 80-4417, Fortuna, SanCarlos, Costa Rica; 20Department of Biological Sciences, Louisiana State University, 202 Life Science Bldg., BatonRouge, LA 70803, USA; 21Institute of Botany, University of Natural Resources and Life Sciences, Gregor-Mendel-Straße 33, 1180 Vienna, Austria; 22Department of Physical and Environmental Sciences, Colorado Mesa University,1100 North Ave, Grand Junction, CO 81501, USA; 23Museo de Historia Natural Noel Kempff Mercado, Av. Irala No.565, Santa Cruz, Bolivia; 24School of Marine and Tropical Biology, James Cook University, 1 James Cook Dr,Townsville, Qld 4811, Australia; 25Ecoinformatics and Biodiversity, Department of Bioscience, Aarhus University, 8000C Aarhus, Denmark; 26Escuela Nacional de Estudios Superiores, Unidad Morelia, Universidad Nacional Aut�onoma deM�exico, Antigua Carretera a P�atzcuaro 8701, 58190, Morelia, Michoac�an, Mexico; 27Department of Ecology, Evolution,
*Correspondence author: E-mail: [email protected]
© 2015 The Authors. Journal of Ecology © 2015 British Ecological Society
Journal of Ecology 2015, 103, 1276–1290 doi: 10.1111/1365-2745.12435
and Behavior and Department of Plant Biology, University of Minnesota, 100 Ecology Building, 1987 Upper BufordCircle, Saint Paul, MN 55108, USA; 28Escuela de Ingenier�ıa Forestal, Instituto Tecnol�ogico de Costa Rica, Apto. 159-7050, Cartago, Costa Rica; 29Department of Biological Sciences, ESALQ, University of S~ao Paulo, P�adua DiasAvenue, 11, Piracicaba, S~ao Paulo 13418-900, Brazil; 30Division of Viticulture and Pomology, University of NaturalResources and Life Sciences, Gregor-Mendel-Straße 33, 1180, Vienna, Austria; 31Department of Plant Biology,Michigan State University, 612 Wilson Road, East Lansing, MI 48824, USA; 32Yale-NUS College, National Universityof Singapore, 6 College Ave. E, 138614 Singapore, Singapore; 33Organization for Tropical Studies, La SelvaBiological Station, Apto. 676-2050, San Pedro de Montes de Oca, Costa Rica; and 34Departamento de Biotecnologiae Produc�~ao Vegetal e Animal, Universidade Federal de S~ao Carlos, Rod. Anhanguera, Km 174, CEP 13600-970,Araras, S~ao Paulo, Brazil
Summary
1. Successional gradients are ubiquitous in nature, yet few studies have systematically examined theevolutionary origins of taxa that specialize at different successional stages. Here we quantify succes-sional habitat specialization in Neotropical forest trees and evaluate its evolutionary lability along aprecipitation gradient. Theoretically, successional habitat specialization should be more evolution-arily conserved in wet forests than in dry forests due to more extreme microenvironmental differenti-ation between early and late-successional stages in wet forest.2. We applied a robust multinomial classification model to samples of primary and secondary foresttrees from 14 Neotropical lowland forest sites spanning a precipitation gradient from 788 to4000 mm annual rainfall, identifying species that are old-growth specialists and secondary forestspecialists in each site. We constructed phylogenies for the classified taxa at each site and for theentire set of classified taxa and tested whether successional habitat specialization is phylogeneticallyconserved. We further investigated differences in the functional traits of species specializing in sec-ondary vs. old-growth forest along the precipitation gradient, expecting different trait associationswith secondary forest specialists in wet vs. dry forests since water availability is more limiting indry forests and light availability more limiting in wet forests.3. Successional habitat specialization is non-randomly distributed in the angiosperm phylogeny, witha tendency towards phylogenetic conservatism overall and a trend towards stronger conservatism inwet forests than in dry forests. However, the specialists come from all the major branches of theangiosperm phylogeny, and very few functional traits showed any consistent relationships with suc-cessional habitat specialization in either wet or dry forests.4. Synthesis. The niche conservatism evident in the habitat specialization of Neotropical trees sug-gests a role for radiation into different successional habitats in the evolution of species-rich genera,though the diversity of functional traits that lead to success in different successional habitats compli-cates analyses at the community scale. Examining the distribution of particular lineages with respectto successional gradients may provide more insight into the role of successional habitat specializa-tion in the evolution of species-rich taxa.
Key-words: determinants of plant community diversity and structure, functional traits, life-historyevolution, phylogeny, pioneer species, precipitation gradient, tropical dry forest, tropical wet forest
Introduction
Environmental gradients provide opportunities for understand-ing the evolution of habitat specialization (Grime 1977; Grubb1977). Many of the gradients observed in ecosystems are asso-ciated with the process of succession, as communities reassem-ble after disturbances (Pickett 1976; Sousa 1984). Successionalhabitat specialization – the radiation of lineages to take advan-tage of particular points on this successional gradient – is
potentially a strong driver of plant evolution (van Steenis 1958;G�omez-Pompa 1971; Pickett 1976). Grubb (1977) reiteratedthe importance of the regeneration niche in community assem-bly, and many studies have explored the potential of distur-bance for maintaining diversity (Sousa 1984; Ricklefs 1987;Tilman & Pacala 1993), yet relatively few studies have exam-ined successional gradients as an evolutionary force.Neotropical forests are a fascinating laboratory for studying
plant evolution due to their floristic diversity and environmen-
© 2015 The Authors. Journal of Ecology © 2015 British Ecological Society, Journal of Ecology, 103, 1276–1290
Successional gradients shape plant evolution 1277
tal heterogeneity (Gentry 1988). The specialization of tropicaltrees into successional habitats has long been recognized.Pioneer tree species – the species that establish and dominateearly in succession – form an important component of the trop-ical forest flora, particularly in wet forests (van Steenis 1958;G�omez-Pompa 1971; Whitmore 1989). G�omez-Pompa (1971)proposed that the evolution of many tropical plant taxa couldonly be understood through the lens of secondary forest succes-sion. He postulated that species richness and taxonomic diver-sification in the tropics could be explained, at least partially, bystrong selection for growth and survival in early successionalhabitats following large-scale disturbances. Pioneer speciesevolved to take advantage of natural disturbances such as fires,floods, landslides, cyclones and volcanic eruptions, and theyhave proliferated in recent millennia with the expansion ofanthropogenic disturbances (Whitmore 1989; Chazdon 2003,2014). Yet the exact definition of pioneer species has remainedsomewhat ambiguous (Swaine & Whitmore 1988; Gitay &Noble 1997), and relatively few studies have examined theevolutionary origins of the taxa that dominate early succes-sional forests vs. the taxa that are more abundant in undis-turbed forest (Gentry 1988; Dalling, Hubbell & Silvera 1998).The massive expansion of available molecular data in
recent decades (Wikstr€om, Savolainen & Chase 2001; Ma-gall�on & Castillo 2009; Stevens 2014) gives us unprecedentedpower to examine the distribution of traits on the angiospermphylogeny and test hypotheses about their evolutionary ori-gins. Like extinction risk (Fritz & Purvis 2010), successionalhabitat specialization is a complex emergent characteristic ofa species, stemming from the interaction of many traits andthe environment. Here, we develop a new conceptual modelof how the strength of environmental gradients during succes-sion affects the evolution of successional habitat specializa-tion. We test the model by evaluating the phylogeneticconservatism of habitat specialization in tropical forest treesacross a precipitation gradient.Successional processes involve changes in resource avail-
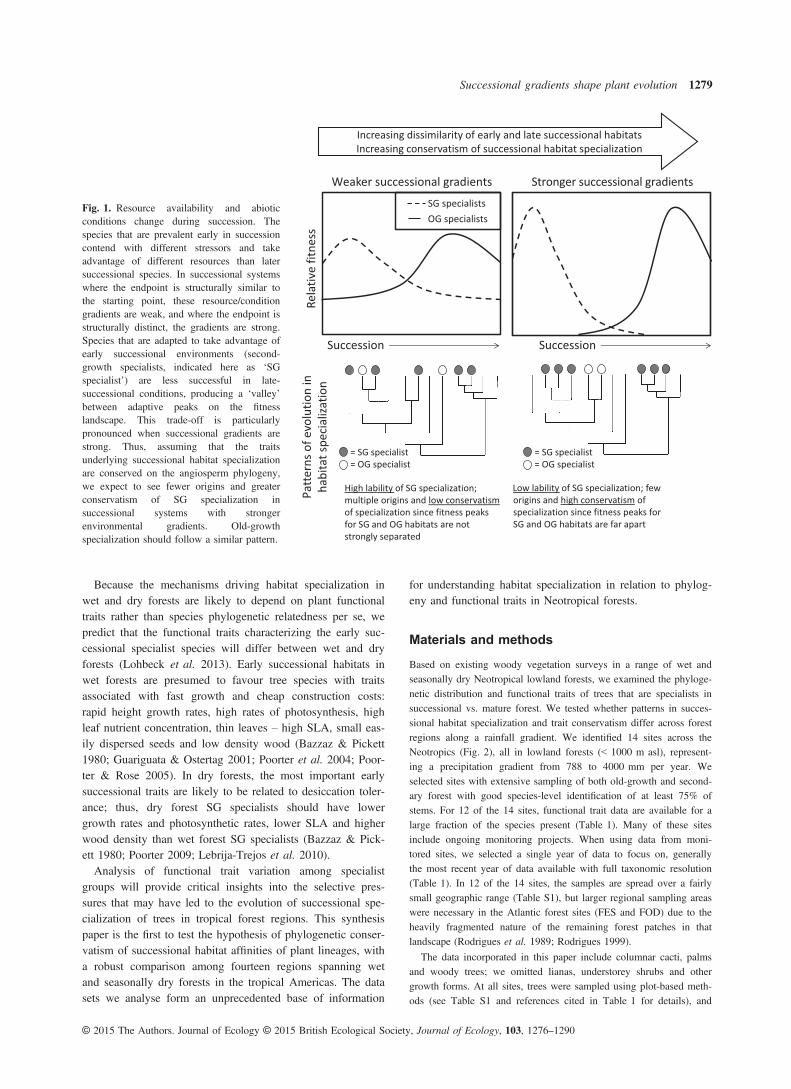
ability and abiotic conditions (Fig. 1). The magnitude of thesechanges depends on the intensity of the disturbance thatbegins the succession (Sousa 1984) and also on the similaritybetween the starting point and the endpoint in succession(Pickett 1976). In ecosystems where the early successionaland late-successional stages are structurally similar (e.g. grass-lands, shrublands and open forests), these resource/conditiongradients are less strong than in ecosystems where succes-sional stages differ greatly in structure (e.g. tropical wet for-ests). Changes in conditions and resource availability duringsuccession mediate the success of individuals that arrive at asite. When successional gradients are weak, the valleybetween adaptive peaks on the fitness landscape is shallow:being a specialist at one end of the successional gradientinvolves little reduction in fitness at the other end of the gra-dient (Fig. 1). When successional gradients are strong,though, being a specialist at one end of the gradient has aconsiderable fitness cost at the other end of the gradient.Thus, we expect to see fewer independent origins of succes-sional habitat specialization where gradients are strong.
Instead, we expect to see conservatism of habitat specializa-tion; specialist lineages consist of close relatives that radiatedwithin that habitat rather than crossing the fitness barrierbetween habitats (Fig. 1).Neotropical forest succession involves numerous environ-
mental gradients. As succession proceeds, light availabilitydecreases, temperatures (and diel temperature fluctuations)decrease, and relative humidity increases (Bazzaz & Pickett1980; Swaine & Whitmore 1988; Finegan 1996; Guariguata& Ostertag 2001; Ruiz, Fandi~no & Chazdon 2005). Theseenvironmental gradients are present in every forest duringsuccession, but the relative strength of the gradients dependson the similarity in abiotic conditions between early succes-sional and late-successional habitats, which in turn is a func-tion of habitat structure. Precipitation is a major driver ofstructural differences among Neotropical forests. Tropical dryforests have lower stature and greater canopy openness thanwet forests (Ewel 1977; Holbrook, Whitbeck & Mooney1995). In dry forests, light conditions differ less stronglybetween early successional and late-successional habitats(Holbrook, Whitbeck & Mooney 1995; Lebrija-Trejos et al.2011). In mature wet forests, generally 1–2% of the incidentsunlight reaches the forest floor except in canopy gaps (Chaz-don & Fetcher 1984). In dry forests, 5–10% of the incidentsunlight reaches the forest floor in the wet season, with highervalues during the dry season when many species are leafless(Coomes & Grubb 2000; Poorter 2009). Canopy closure indry forests during succession is slower than in wet forests(Ewel 1977; Ruiz, Fandi~no & Chazdon 2005; Letcher &Chazdon 2009; Lebrija-Trejos et al. 2010), potentially leavinga longer window of time for pioneer species to colonize indry forests. The microclimatic stressors that plant seedlingsface are markedly different between open areas and forest un-derstorey in wet forests and less distinct in dry forests (Ewel1977). The precipitation gradient in Neotropical forests there-fore produces a gradient in the environmental dissimilarity ofearly successional and late-successional habitats.The ability to thrive in particular successional habitats is a
composite trait resulting from many physiological, anatomicaland phenological adaptations (Poorter & Markesteijn 2008;Lebrija-Trejos et al. 2010), many of which are likely to be phy-logenetically conserved (Prinzing 2001; Losos 2008). Based onour model of the evolution of successional habitat specializa-tion (Fig. 1), we expect to observe different patterns of succes-sional habitat specialization in wet and dry forests due to thedepth of the ‘valley’ between adaptive peaks in the fitness land-scape (Fig. 1). Specifically, we predict that there will be lowerlevels of successional habitat specialization in dry forest floras,with specialists in each group (SG and OG) originating frommany lineages and not necessarily being closely related. In wetforests, by contrast, where the adaptive peaks are separated by adeeper ‘valley’, we predict that there will be fewer origins ofthe specialist strategies, but that the lineages that do evolve intospecialists will undergo adaptive radiations. Thus, we predictthat the successional habitat specialists in wet forest will be clo-sely related and that habitat specialization is more likely to be aphylogenetically conserved trait in wetter forests.
© 2015 The Authors. Journal of Ecology © 2015 British Ecological Society, Journal of Ecology, 103, 1276–1290
1278 S. G. Letcher et al.
Because the mechanisms driving habitat specialization inwet and dry forests are likely to depend on plant functionaltraits rather than species phylogenetic relatedness per se, wepredict that the functional traits characterizing the early suc-cessional specialist species will differ between wet and dryforests (Lohbeck et al. 2013). Early successional habitats inwet forests are presumed to favour tree species with traitsassociated with fast growth and cheap construction costs:rapid height growth rates, high rates of photosynthesis, highleaf nutrient concentration, thin leaves – high SLA, small eas-ily dispersed seeds and low density wood (Bazzaz & Pickett1980; Guariguata & Ostertag 2001; Poorter et al. 2004; Poor-ter & Rose 2005). In dry forests, the most important earlysuccessional traits are likely to be related to desiccation toler-ance; thus, dry forest SG specialists should have lowergrowth rates and photosynthetic rates, lower SLA and higherwood density than wet forest SG specialists (Bazzaz & Pick-ett 1980; Poorter 2009; Lebrija-Trejos et al. 2010).Analysis of functional trait variation among specialist
groups will provide critical insights into the selective pres-sures that may have led to the evolution of successional spe-cialization of trees in tropical forest regions. This synthesispaper is the first to test the hypothesis of phylogenetic conser-vatism of successional habitat affinities of plant lineages, witha robust comparison among fourteen regions spanning wetand seasonally dry forests in the tropical Americas. The datasets we analyse form an unprecedented base of information
for understanding habitat specialization in relation to phylog-eny and functional traits in Neotropical forests.
Materials and methods
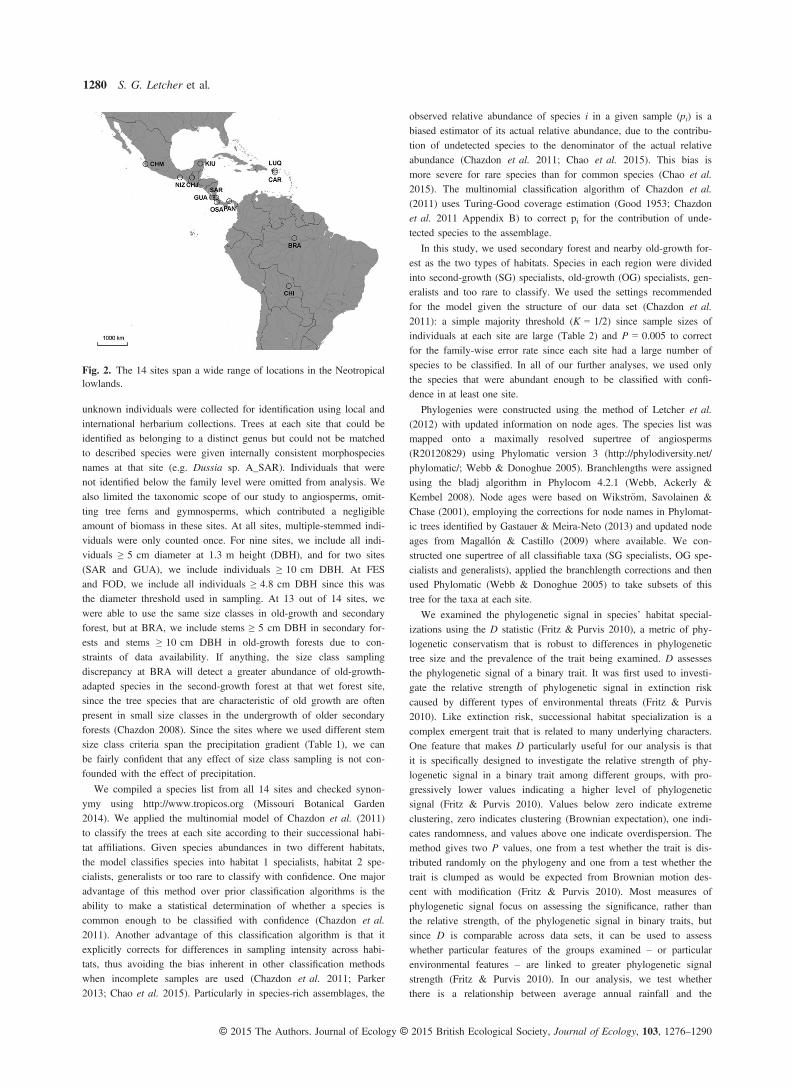
Based on existing woody vegetation surveys in a range of wet andseasonally dry Neotropical lowland forests, we examined the phyloge-netic distribution and functional traits of trees that are specialists insuccessional vs. mature forest. We tested whether patterns in succes-sional habitat specialization and trait conservatism differ across forestregions along a rainfall gradient. We identified 14 sites across theNeotropics (Fig. 2), all in lowland forests (< 1000 m asl), represent-ing a precipitation gradient from 788 to 4000 mm per year. Weselected sites with extensive sampling of both old-growth and second-ary forest with good species-level identification of at least 75% ofstems. For 12 of the 14 sites, functional trait data are available for alarge fraction of the species present (Table 1). Many of these sitesinclude ongoing monitoring projects. When using data from moni-tored sites, we selected a single year of data to focus on, generallythe most recent year of data available with full taxonomic resolution(Table 1). In 12 of the 14 sites, the samples are spread over a fairlysmall geographic range (Table S1), but larger regional sampling areaswere necessary in the Atlantic forest sites (FES and FOD) due to theheavily fragmented nature of the remaining forest patches in thatlandscape (Rodrigues et al. 1989; Rodrigues 1999).
The data incorporated in this paper include columnar cacti, palmsand woody trees; we omitted lianas, understorey shrubs and othergrowth forms. At all sites, trees were sampled using plot-based meth-ods (see Table S1 and references cited in Table 1 for details), and
Rela
tive
fitne
ss
Succession
SG specialistsOG specialists
Succession
Weaker successional gradients Stronger successional gradients
Patt
erns
of e
volu
tion
inha
bita
t spe
cial
izatio
n
High lability of SG specialization; multiple origins and low conservatism of specialization since fitness peaks for SG and OG habitats are not strongly separated
Low lability of SG specialization; few origins and high conservatism of specialization since fitness peaks for SG and OG habitats are far apart
Increasing dissimilarity of early and late successional habitatsIncreasing conservatism of successional habitat specialization
= SG specialist= OG specialist
= SG specialist= OG specialist
Fig. 1. Resource availability and abioticconditions change during succession. Thespecies that are prevalent early in successioncontend with different stressors and takeadvantage of different resources than latersuccessional species. In successional systemswhere the endpoint is structurally similar tothe starting point, these resource/conditiongradients are weak, and where the endpoint isstructurally distinct, the gradients are strong.Species that are adapted to take advantage ofearly successional environments (second-growth specialists, indicated here as ‘SGspecialist’) are less successful in late-successional conditions, producing a ‘valley’between adaptive peaks on the fitnesslandscape. This trade-off is particularlypronounced when successional gradients arestrong. Thus, assuming that the traitsunderlying successional habitat specializationare conserved on the angiosperm phylogeny,we expect to see fewer origins and greaterconservatism of SG specialization insuccessional systems with strongerenvironmental gradients. Old-growthspecialization should follow a similar pattern.
© 2015 The Authors. Journal of Ecology © 2015 British Ecological Society, Journal of Ecology, 103, 1276–1290
Successional gradients shape plant evolution 1279
unknown individuals were collected for identification using local andinternational herbarium collections. Trees at each site that could beidentified as belonging to a distinct genus but could not be matchedto described species were given internally consistent morphospeciesnames at that site (e.g. Dussia sp. A_SAR). Individuals that werenot identified below the family level were omitted from analysis. Wealso limited the taxonomic scope of our study to angiosperms, omit-ting tree ferns and gymnosperms, which contributed a negligibleamount of biomass in these sites. At all sites, multiple-stemmed indi-viduals were only counted once. For nine sites, we include all indi-viduals ≥ 5 cm diameter at 1.3 m height (DBH), and for two sites(SAR and GUA), we include individuals ≥ 10 cm DBH. At FESand FOD, we include all individuals ≥ 4.8 cm DBH since this wasthe diameter threshold used in sampling. At 13 out of 14 sites, wewere able to use the same size classes in old-growth and secondaryforest, but at BRA, we include stems ≥ 5 cm DBH in secondary for-ests and stems ≥ 10 cm DBH in old-growth forests due to con-straints of data availability. If anything, the size class samplingdiscrepancy at BRA will detect a greater abundance of old-growth-adapted species in the second-growth forest at that wet forest site,since the tree species that are characteristic of old growth are oftenpresent in small size classes in the undergrowth of older secondaryforests (Chazdon 2008). Since the sites where we used different stemsize class criteria span the precipitation gradient (Table 1), we canbe fairly confident that any effect of size class sampling is not con-founded with the effect of precipitation.
We compiled a species list from all 14 sites and checked synon-ymy using http://www.tropicos.org (Missouri Botanical Garden2014). We applied the multinomial model of Chazdon et al. (2011)to classify the trees at each site according to their successional habi-tat affiliations. Given species abundances in two different habitats,the model classifies species into habitat 1 specialists, habitat 2 spe-cialists, generalists or too rare to classify with confidence. One majoradvantage of this method over prior classification algorithms is theability to make a statistical determination of whether a species iscommon enough to be classified with confidence (Chazdon et al.2011). Another advantage of this classification algorithm is that itexplicitly corrects for differences in sampling intensity across habi-tats, thus avoiding the bias inherent in other classification methodswhen incomplete samples are used (Chazdon et al. 2011; Parker2013; Chao et al. 2015). Particularly in species-rich assemblages, the
observed relative abundance of species i in a given sample (pi) is abiased estimator of its actual relative abundance, due to the contribu-tion of undetected species to the denominator of the actual relativeabundance (Chazdon et al. 2011; Chao et al. 2015). This bias ismore severe for rare species than for common species (Chao et al.2015). The multinomial classification algorithm of Chazdon et al.(2011) uses Turing-Good coverage estimation (Good 1953; Chazdonet al. 2011 Appendix B) to correct pi for the contribution of unde-tected species to the assemblage.
In this study, we used secondary forest and nearby old-growth for-est as the two types of habitats. Species in each region were dividedinto second-growth (SG) specialists, old-growth (OG) specialists, gen-eralists and too rare to classify. We used the settings recommendedfor the model given the structure of our data set (Chazdon et al.2011): a simple majority threshold (K = 1/2) since sample sizes ofindividuals at each site are large (Table 2) and P = 0.005 to correctfor the family-wise error rate since each site had a large number ofspecies to be classified. In all of our further analyses, we used onlythe species that were abundant enough to be classified with confi-dence in at least one site.
Phylogenies were constructed using the method of Letcher et al.(2012) with updated information on node ages. The species list wasmapped onto a maximally resolved supertree of angiosperms(R20120829) using Phylomatic version 3 (http://phylodiversity.net/phylomatic/; Webb & Donoghue 2005). Branchlengths were assignedusing the bladj algorithm in Phylocom 4.2.1 (Webb, Ackerly &Kembel 2008). Node ages were based on Wikstr€om, Savolainen &Chase (2001), employing the corrections for node names in Phylomat-ic trees identified by Gastauer & Meira-Neto (2013) and updated nodeages from Magall�on & Castillo (2009) where available. We con-structed one supertree of all classifiable taxa (SG specialists, OG spe-cialists and generalists), applied the branchlength corrections and thenused Phylomatic (Webb & Donoghue 2005) to take subsets of thistree for the taxa at each site.
We examined the phylogenetic signal in species’ habitat special-izations using the D statistic (Fritz & Purvis 2010), a metric of phy-logenetic conservatism that is robust to differences in phylogenetictree size and the prevalence of the trait being examined. D assessesthe phylogenetic signal of a binary trait. It was first used to investi-gate the relative strength of phylogenetic signal in extinction riskcaused by different types of environmental threats (Fritz & Purvis2010). Like extinction risk, successional habitat specialization is acomplex emergent trait that is related to many underlying characters.One feature that makes D particularly useful for our analysis is thatit is specifically designed to investigate the relative strength of phy-logenetic signal in a binary trait among different groups, with pro-gressively lower values indicating a higher level of phylogeneticsignal (Fritz & Purvis 2010). Values below zero indicate extremeclustering, zero indicates clustering (Brownian expectation), one indi-cates randomness, and values above one indicate overdispersion. Themethod gives two P values, one from a test whether the trait is dis-tributed randomly on the phylogeny and one from a test whether thetrait is clumped as would be expected from Brownian motion des-cent with modification (Fritz & Purvis 2010). Most measures ofphylogenetic signal focus on assessing the significance, rather thanthe relative strength, of the phylogenetic signal in binary traits, butsince D is comparable across data sets, it can be used to assesswhether particular features of the groups examined – or particularenvironmental features – are linked to greater phylogenetic signalstrength (Fritz & Purvis 2010). In our analysis, we test whetherthere is a relationship between average annual rainfall and the
Fig. 2. The 14 sites span a wide range of locations in the Neotropicallowlands.
© 2015 The Authors. Journal of Ecology © 2015 British Ecological Society, Journal of Ecology, 103, 1276–1290
1280 S. G. Letcher et al.
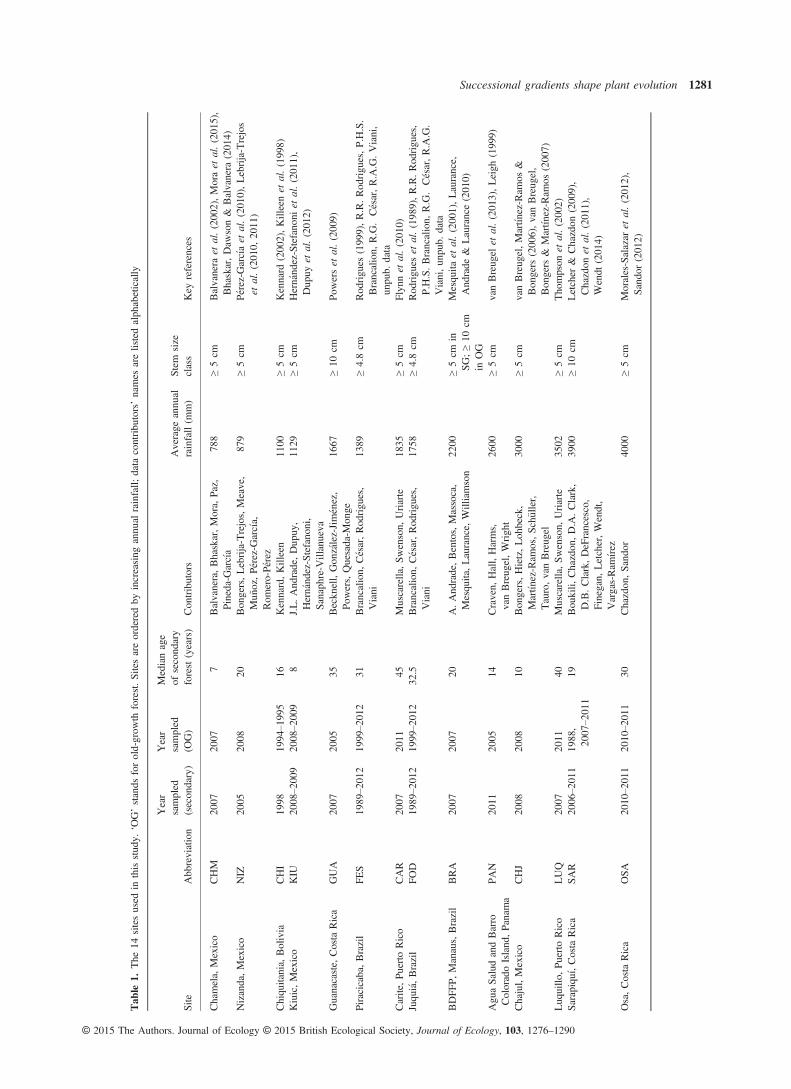
Tab
le1.
The
14sitesused
inthisstud
y.‘O
G’stands
forold-grow
thforest.Sitesareorderedby
increasing
annual
rainfall;
data
contributors’names
arelistedalphabetically
Site
Abb
reviation
Year
sampled
(secondary)
Year
sampled
(OG)
Medianage
ofsecondary
forest(years)
Contributors
Average
annual
rainfall(m
m)
Stem
size
class
Key
references
Chamela,
Mexico
CHM
2007
2007
7Balvanera,Bhaskar,Mora,
Paz,
Pineda-G
arc� ıa
788
≥5cm
Balvanera
etal.(200
2),Moraet
al.(201
5),
Bhaskar,Daw
son&
Balvanera
(201
4)Nizanda,Mexico
NIZ
2005
2008
20Bongers,Lebrija-Trejos,Meave,
Mu~ n
oz,P� erez-Garc� ıa,
Rom
ero-P� erez
879
≥5cm
P� erez-Garc� ıaet
al.(2010),Lebrija-Trejos
etal.(2010,
2011
)
Chiqu
itania,
Bolivia
CHI
1998
1994–199
516
Kennard,Killeen
1100
≥5cm
Kennard
(200
2),Killeenet
al.(1998)
Kiuic,Mexico
KIU
2008–200
920
08–200
98
J.L.And
rade,Dup
uy,
Hern� andez-Stefanoni,
Sanaphre-V
illanueva
1129
≥5cm
Hern� andez-Stefano
niet
al.(201
1),
Dup
uyet
al.(2012)
Guanacaste,
Costa
Rica
GUA
2007
2005
35Beckn
ell,Gon
z� alez-Jim� enez,
Powers,Quesada-M
onge
1667
≥10
cmPo
werset
al.(2009)
Piracicaba,Brazil
FES
1989–201
219
99–201
231
Brancalion,
C� esar,Rodrigues,
Viani
1389
≥4.8cm
Rod
rigues
(199
9),R.R.Rod
rigues,P.H.S.
Brancalion,
R.G.C� esar,R.A.G.Viani,
unpub.
data
Carite,Pu
erto
Rico
CAR
2007
2011
45Muscarella,Sw
enson,
Uriarte
1835
≥5cm
Flyn
net
al.(201
0)Juqui� a,Brazil
FOD
1989–201
219
99–201
232
.5Brancalion,
C� esar,Rodrigues,
Viani
1758
≥4.8cm
Rod
rigues
etal.(1989),R.R.Rodrigues,
P.H.S.Brancalion,
R.G.César,R.A.G.
Viani,un
pub.
data
BDFF
P,Manaus,Brazil
BRA
2007
2007
20A.And
rade,Bentos,Massoca,
Mesquita,Laurance,
Williamson
2200
≥5cm
inSG
;≥10
cmin
OG
Mesqu
itaet
al.(2001),Laurance,
And
rade
&Laurance(201
0)
Agu
aSaludandBarro
ColoradoIsland
,Panama
PAN
2011
2005
14Craven,
Hall,Harms,
vanBreug
el,Wrigh
t26
00≥5cm
vanBreug
elet
al.(2013),Leigh
(1999)
Chajul,Mexico
CHJ
2008
2008
10Bongers,Hietz,Loh
beck,
Mart� ın
ez-Ram
os,Sch€ uller,
Tauro,vanBreugel
3000
≥5cm
vanBreug
el,Mart� ın
ez-Ram
os&
Bon
gers
(200
6),vanBreug
el,
Bon
gers
&Mart� ın
ez-Ram
os(2007)
Luquillo
,Pu
erto
Rico
LUQ
2007
2011
40Muscarella,Sw
enson,
Uriarte
3502
≥5cm
Tho
mpson
etal.(200
2)Sarapiqu� ı,Costa
Rica
SAR
2006–201
119
88,
2007–201
119
Boukili,
Chazdon
,D.A.Clark,
D.B.Clark,DeFrancesco,
Finegan,
Letcher,Wendt,
Vargas-Ram
� ırez
3900
≥10
cmLetcher
&Chazdon
(200
9),
Chazdon
etal.(201
1),
Wendt
(2014)
Osa,Costa
Rica
OSA
2010–201
120
10– 201
130
Chazdon
,Sand
or40
00≥5cm
Morales-Salazar
etal.(201
2),
Sand
or(201
2)
© 2015 The Authors. Journal of Ecology © 2015 British Ecological Society, Journal of Ecology, 103, 1276–1290
Successional gradients shape plant evolution 1281
strength of phylogenetic signal in successional habitat specialization.Based on the predictions in Fig. 1, we would expect to see lowervalues of D (i.e. greater phylogenetic signal strength) in sites withhigher rainfall.
In order to examine the relative strength of the phylogenetic signalin our data, we analysed D for the whole data set using the tree of allclassifiable taxa, and for each site using the site-specific phylogeny.Because D is only applicable to binary traits, we conducted two dif-ferent tests in each case: one for SG specialists vs. [OG special-ists + generalists] and one for OG specialists vs. [SGspecialists + generalists]. We used the phylo.d function in the pack-age caper (Orme et al. 2013) to calculate D, using R 2.13.1 (RDevelopment Core Team 2013).
We examined a wide range of functional traits related to seeds,leaves, wood density and plant stature (Table 3). Not every trait wasavailable for every species; for instance, we did not measure wood orleaf traits for cacti. The number of taxa included for each trait at eachsite is given in Table 3. For two sites (SAR and OSA), seed lengthwas reported as categorical values (seed length: < 1, 1–6, 6–15,15–30, 30–50, 50–100 and > 100 mm). Tree height at OSA was acategorical variable (canopy or subcanopy). All other traits werereported as continuous variables: seed dry mass (mg), seed length(mm), specific leaf area (SLA; cm2 g�1), leaf dry matter content(LDMC; mg g�1), wood specific gravity (WSG; unitless) or wooddensity (g cm�1), and maximum height (m). Leaf and seed traits werecollected according to standard protocols (Cornelissen et al. 2003b).Wood density was reported at NIZ, CHM, FES and FOD, whileWSG was reported at KIU, GUA, CAR, PAN, LUQ and SAR.Because of differences in measurement protocols including core diam-eter and length, drying temperature, and whether corrections weremade for radial variation, WD and WSG measurements are notdirectly comparable among sites (Williamson & Wiemann 2010).
To examine the associations of particular functional traits with suc-cessional habitat specialization, we used functions developed by Pur-vis & Rambaut (1995) that calculate phylogenetically independentcontrasts for a set of variables and then test for evolutionary relation-ships in the contrasts using linear models. We used the functionscrunch (for continuous data) and brunch (for categorical data) incaper (Orme et al. 2013) to model the relationship between habitatspecialization, coded as a binary variable and each of the functional
traits measured. Again, we did two sets of tests for each site–traitcombination, one using SG specialists vs. [OG specialists + general-ists] and one using OG specialists vs. [SG specialists + generalists].
Results
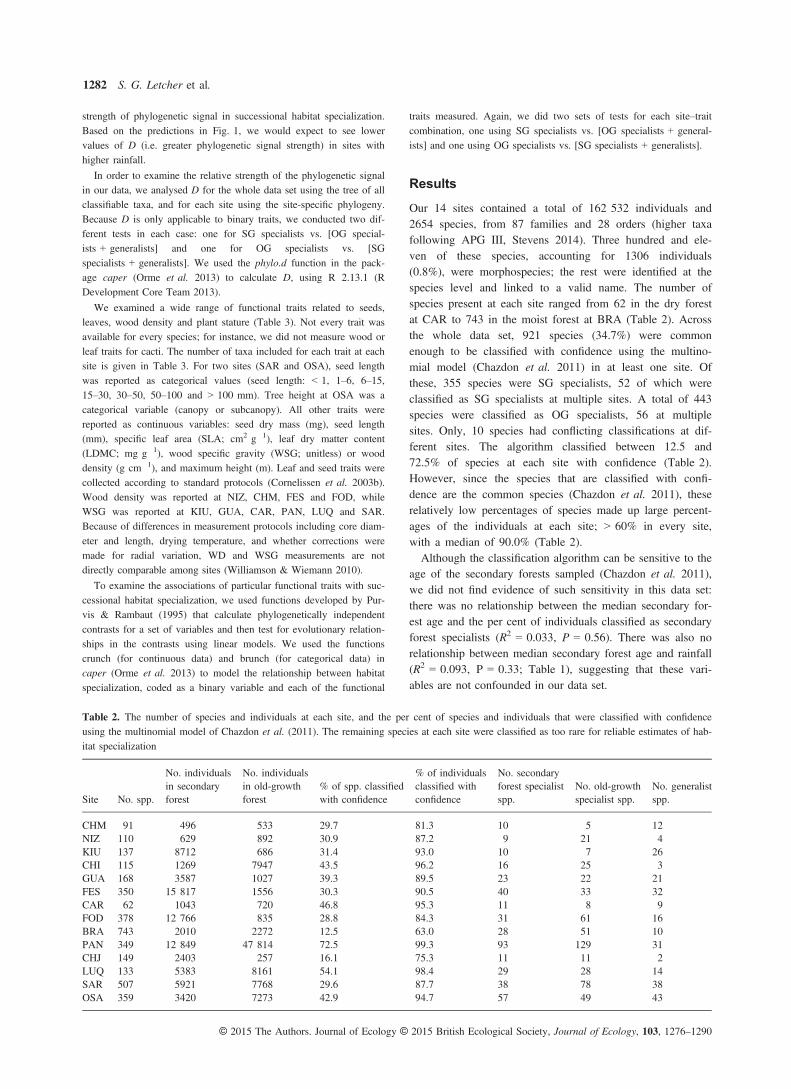
Our 14 sites contained a total of 162 532 individuals and2654 species, from 87 families and 28 orders (higher taxafollowing APG III, Stevens 2014). Three hundred and ele-ven of these species, accounting for 1306 individuals(0.8%), were morphospecies; the rest were identified at thespecies level and linked to a valid name. The number ofspecies present at each site ranged from 62 in the dry forestat CAR to 743 in the moist forest at BRA (Table 2). Acrossthe whole data set, 921 species (34.7%) were commonenough to be classified with confidence using the multino-mial model (Chazdon et al. 2011) in at least one site. Ofthese, 355 species were SG specialists, 52 of which wereclassified as SG specialists at multiple sites. A total of 443species were classified as OG specialists, 56 at multiplesites. Only, 10 species had conflicting classifications at dif-ferent sites. The algorithm classified between 12.5 and72.5% of species at each site with confidence (Table 2).However, since the species that are classified with confi-dence are the common species (Chazdon et al. 2011), theserelatively low percentages of species made up large percent-ages of the individuals at each site; > 60% in every site,with a median of 90.0% (Table 2).Although the classification algorithm can be sensitive to the
age of the secondary forests sampled (Chazdon et al. 2011),we did not find evidence of such sensitivity in this data set:there was no relationship between the median secondary for-est age and the per cent of individuals classified as secondaryforest specialists (R2 = 0.033, P = 0.56). There was also norelationship between median secondary forest age and rainfall(R2 = 0.093, P = 0.33; Table 1), suggesting that these vari-ables are not confounded in our data set.
Table 2. The number of species and individuals at each site, and the per cent of species and individuals that were classified with confidenceusing the multinomial model of Chazdon et al. (2011). The remaining species at each site were classified as too rare for reliable estimates of hab-itat specialization
Site No. spp.
No. individualsin secondaryforest
No. individualsin old-growthforest
% of spp. classifiedwith confidence
% of individualsclassified withconfidence
No. secondaryforest specialistspp.
No. old-growthspecialist spp.
No. generalistspp.
CHM 91 496 533 29.7 81.3 10 5 12NIZ 110 629 892 30.9 87.2 9 21 4KIU 137 8712 686 31.4 93.0 10 7 26CHI 115 1269 7947 43.5 96.2 16 25 3GUA 168 3587 1027 39.3 89.5 23 22 21FES 350 15 817 1556 30.3 90.5 40 33 32CAR 62 1043 720 46.8 95.3 11 8 9FOD 378 12 766 835 28.8 84.3 31 61 16BRA 743 2010 2272 12.5 63.0 28 51 10PAN 349 12 849 47 814 72.5 99.3 93 129 31CHJ 149 2403 257 16.1 75.3 11 11 2LUQ 133 5383 8161 54.1 98.4 29 28 14SAR 507 5921 7768 29.6 87.7 38 78 38OSA 359 3420 7273 42.9 94.7 57 49 43
© 2015 The Authors. Journal of Ecology © 2015 British Ecological Society, Journal of Ecology, 103, 1276–1290
1282 S. G. Letcher et al.
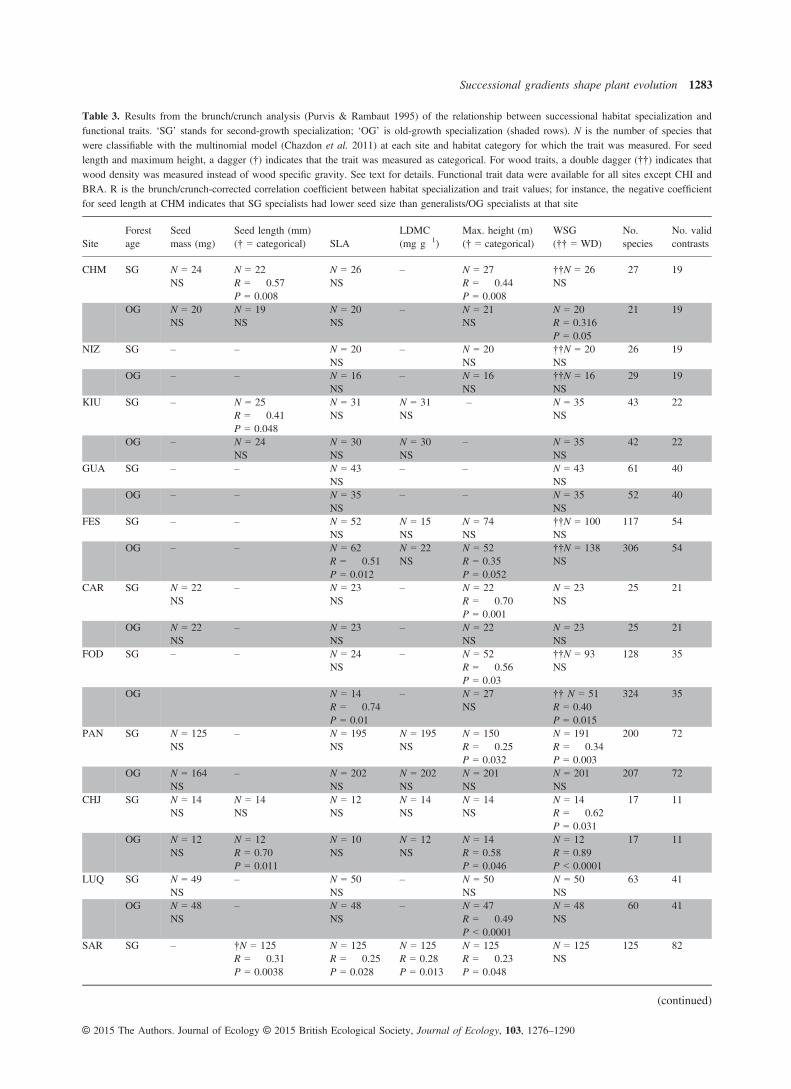
Table 3. Results from the brunch/crunch analysis (Purvis & Rambaut 1995) of the relationship between successional habitat specialization andfunctional traits. ‘SG’ stands for second-growth specialization; ‘OG’ is old-growth specialization (shaded rows). N is the number of species thatwere classifiable with the multinomial model (Chazdon et al. 2011) at each site and habitat category for which the trait was measured. For seedlength and maximum height, a dagger (†) indicates that the trait was measured as categorical. For wood traits, a double dagger (††) indicates thatwood density was measured instead of wood specific gravity. See text for details. Functional trait data were available for all sites except CHI andBRA. R is the brunch/crunch-corrected correlation coefficient between habitat specialization and trait values; for instance, the negative coefficientfor seed length at CHM indicates that SG specialists had lower seed size than generalists/OG specialists at that site
SiteForestage
Seedmass (mg)
Seed length (mm)(† = categorical) SLA
LDMC(mg g�1)
Max. height (m)(† = categorical)
WSG(†† = WD)
No.species
No. validcontrasts
CHM SG N = 24NS
N = 22R = � 0.57P = 0.008
N = 26NS
– N = 27R = � 0.44P = 0.008
††N = 26NS
27 19
OG N = 20NS
N = 19NS
N = 20NS
– N = 21NS
N = 20R = 0.316P = 0.05
21 19
NIZ SG – – N = 20NS
– N = 20NS
††N = 20NS
26 19
OG – – N = 16NS
– N = 16NS
††N = 16NS
29 19
KIU SG – N = 25R = � 0.41P = 0.048
N = 31NS
N = 31NS
– N = 35NS
43 22
OG – N = 24NS
N = 30NS
N = 30NS
– N = 35NS
42 22
GUA SG – – N = 43NS
– – N = 43NS
61 40
OG – – N = 35NS
– – N = 35NS
52 40
FES SG – – N = 52NS
N = 15NS
N = 74NS
††N = 100NS
117 54
OG – – N = 62R = � 0.51P = 0.012
N = 22NS
N = 52R = 0.35P = 0.052
††N = 138NS
306 54
CAR SG N = 22NS
– N = 23NS
– N = 22R = � 0.70P = 0.001
N = 23NS
25 21
OG N = 22NS
– N = 23NS
– N = 22NS
N = 23NS
25 21
FOD SG – – N = 24NS
– N = 52R = � 0.56P = 0.03
††N = 93NS
128 35
OG N = 14R = � 0.74P = 0.01
– N = 27NS
†† N = 51R = 0.40P = 0.015
324 35
PAN SG N = 125NS
– N = 195NS
N = 195NS
N = 150R = � 0.25P = 0.032
N = 191R = � 0.34P = 0.003
200 72
OG N = 164NS
– N = 202NS
N = 202NS
N = 201NS
N = 201NS
207 72
CHJ SG N = 14NS
N = 14NS
N = 12NS
N = 14NS
N = 14NS
N = 14R = � 0.62P = 0.031
17 11
OG N = 12NS
N = 12R = 0.70P = 0.011
N = 10NS
N = 12NS
N = 14R = 0.58P = 0.046
N = 12R = 0.89P < 0.0001
17 11
LUQ SG N = 49NS
– N = 50NS
– N = 50NS
N = 50NS
63 41
OG N = 48NS
– N = 48NS
– N = 47R = � 0.49P < 0.0001
N = 48NS
60 41
SAR SG – †N = 125R = � 0.31P = 0.0038
N = 125R = � 0.25P = 0.028
N = 125R = 0.28P = 0.013
N = 125R = � 0.23P = 0.048
N = 125NS
125 82
(continued)
© 2015 The Authors. Journal of Ecology © 2015 British Ecological Society, Journal of Ecology, 103, 1276–1290
Successional gradients shape plant evolution 1283
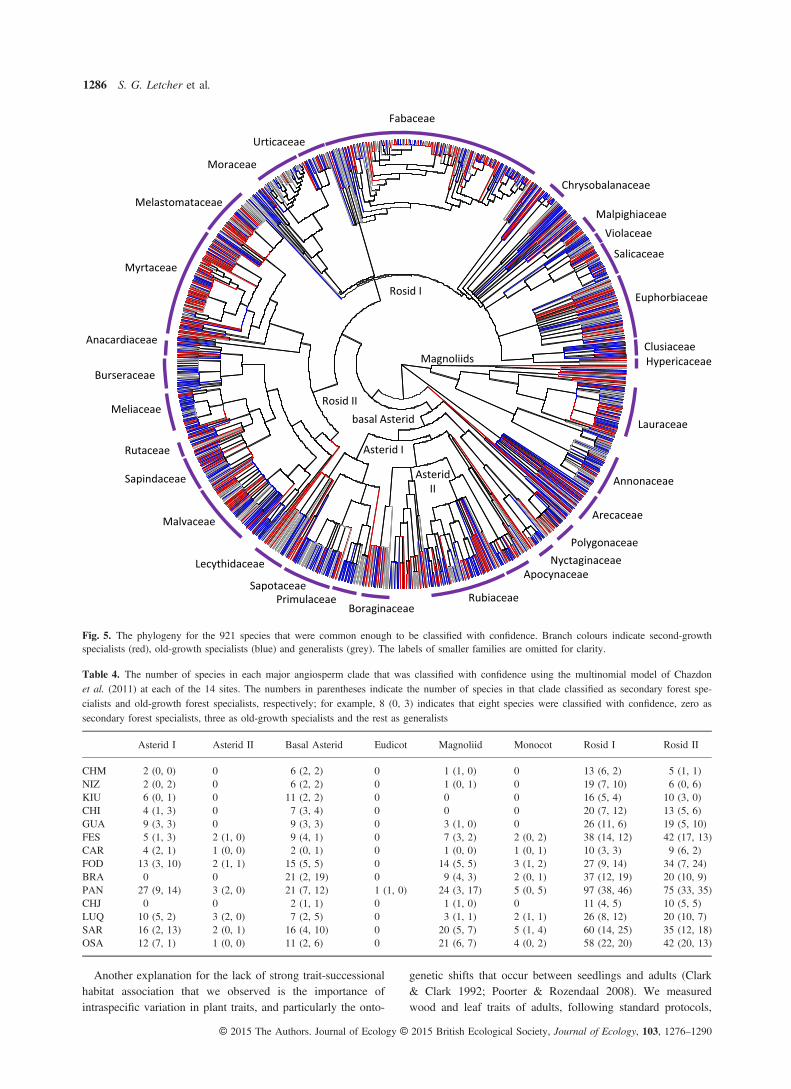
Successional habitat specialization in our data set wassignificantly non-random, with D values lower than 1,suggesting a tendency towards phylogenetic clustering (SGspecialization: D = 0.7641, Prandom < 0.0001, PBrownian <0.0001; OG specialization: D = 0.7159, Prandom < 0.0001,PBrownian < 0.0001). For SG specialization, values of D forindividual sites fell between 0.158 (clustering) and 1.11 (slightoverdispersion). There was a trend towards lower D values (i.e.stronger phylogenetic signal) in the wetter forest sites (Fig. 3a),although the correlation between D values and precipitationwas weak and not significant (R2 = 0.212, P = 0.09). For OGspecialization, values ranged from �0.35 to 1.48. There wasalso a tendency towards lower D values in wetter forest sites(Fig. 3b) except for the dry forest at NIZ, which had the lowestvalue of all. The relationship here was not significant(R2 = 0.065, P = 0.37). There were also suggestive trends inthe proportion of stems that were specialists along the precipita-tion gradient: wetter sites had a higher proportion of individualsclassified as specialists (Fig. 4), although again the correlationswere weak and not significant (R2 = 0.243, P = 0.105 for SGspecialists, R2 = 0.095, P = 0.282 for OG specialists).Considering the relationship between functional traits and
secondary habitat specialization, relatively few traits showed astrong relationship with habitat specialization when phyloge-netically independent contrasts were taken into account(Table 3). Seed length (measured in five sites) showed signifi-cant relationships with SG specialization in three sites andOG specialization in one site. The slope of all the significantrelationships was negative in SG and positive in OG, indicat-ing that seed length tends to be shorter in SG specialists andlonger in OG specialists (Table 3). However, seed mass (mea-sured in five sites) showed no significant relationship withhabitat specialization in any site (Table 3). Leaf traits (SLAand LDMC) also showed relatively few significant relation-ships with habitat specialization. SLA (measured in 11 sites)was negatively related to OG specialization at two sites andpositively related to SG specialization in one site; LDMC(measured in five sites) was positively related to SG special-ization in only one site. Maximum height (measured in 10sites) had a significant negative relationship to SG specializa-tion in three sites and a significant positive relationship withOG specialization in two sites, indicating that maximumheight is lower in SG specialists, but there was also a signifi-cant negative relationship between OG specialization and
maximum height in one site (LUQ). Wood specific gravity/wood density (measured in 11 sites; see Table 3) had a signif-icant negative relationship with SG specialization in four sitesand a significant positive relationship with OG specializationin two sites, indicating denser wood in OG trees.Examining the distribution of secondary forest specialist
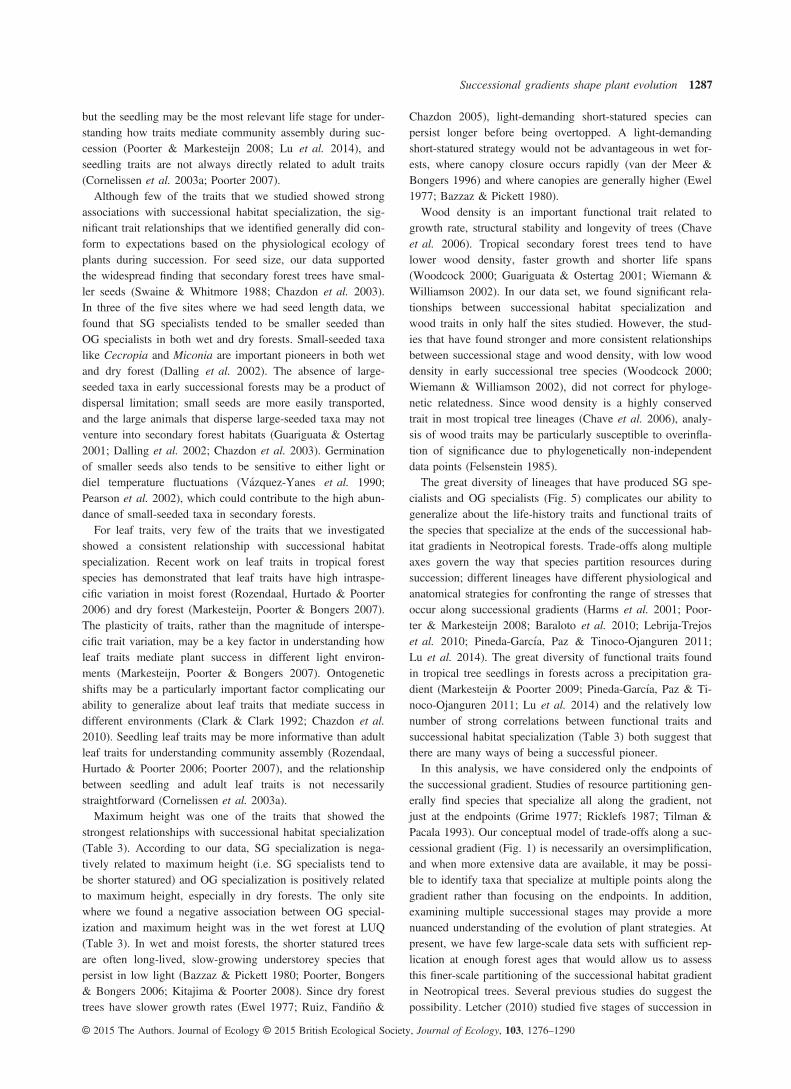
taxa across the angiosperm phylogeny (Fig. 5), clustering ofsuccessional habitat specialization is evident in some lineages.Certain families have a large representation of SG specialists,for example Melastomataceae and Myrtaceae (Fig. 5). Otherfamilies have a greater proportion of OG specialists, forexample Sapotaceae and Primulaceae (Fig. 5). In some cases,closely related groups of taxa differed in the prevalence ofSG vs. OG specialists; see, for instance, Salicaceae and Viola-ceae; Clusiaceae and Hypericaceae; Moraceae and Urticaceae;Burseraceae and Anacardiaceae (Fig. 5).Despite overall conservatism of successional habitat spe-
cialization, there have been multiple origins of SG and OGspecialists in a wide range of lineages. Successional habitatspecialization occurs in every major clade of angiosperms(Table 4). The Rosid I and II clades contain a large numberof SG specialists, but the flora of this region as a whole isRosid-dominated (Gentry 1988; Chave et al. 2006; Fig. 5;Table 4). Many clades contain both generalist and specialisttaxa without clear patterns of clustering; for instance, Faba-ceae, Rubiaceae and the Magnoliids (Fig. 5).
Discussion
This is the first study, to our knowledge, to demonstrate thatsuccessional habitat specialization tends to be conservedamong angiosperms, with significantly non-random patternsof successional habitat specialization evident in a broad sam-ple of the angiosperm phylogeny from a diverse range ofNeotropical forest sites. In a previous study of Neotropicaltrees, Norden et al. (2012) found that the SG specialists andOG specialists at SAR are both significantly clustered on theangiosperm phylogeny; here, we extended the scope of thestudy and confirmed that there is phylogenetic clustering ofsuccessional habitat specialists in numerous sites across abroad geographic area.Our data also reveal a weak association between the degree
of clustering in the secondary forest specialist habit and theamount of rainfall at a site (Fig. 3a). Although the trend is
Table 3. (continued)
SiteForestage
Seedmass (mg)
Seed length (mm)(† = categorical) SLA
LDMC(mg g�1)
Max. height (m)(† = categorical)
WSG(†† = WD)
No.species
No. validcontrasts
OG – N = 133NS
N = 146NS
N = 133NS
N = 146NS
N = 146R = 0.32P = 0.005
146 84
OSA SG – †N = 129NS
– – †N = 130NS
– 141 84
OG – †N = 107NS
– – †N = 109NS
– 118 84
© 2015 The Authors. Journal of Ecology © 2015 British Ecological Society, Journal of Ecology, 103, 1276–1290
1284 S. G. Letcher et al.
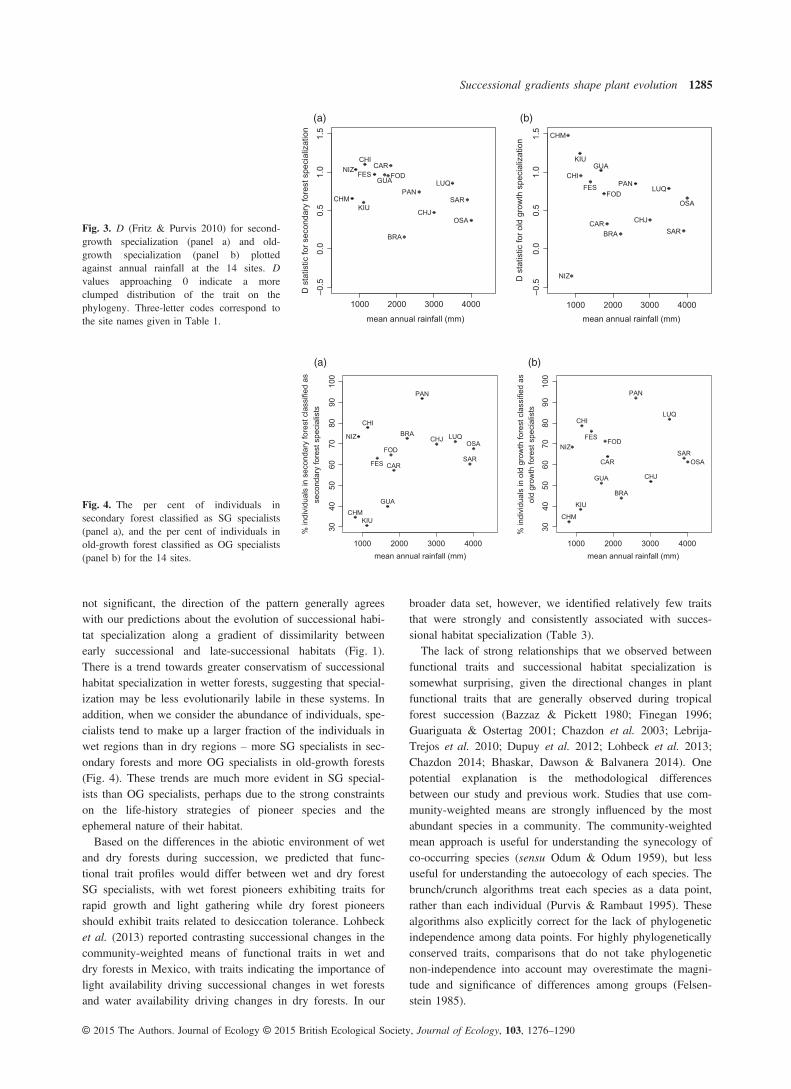
not significant, the direction of the pattern generally agreeswith our predictions about the evolution of successional habi-tat specialization along a gradient of dissimilarity betweenearly successional and late-successional habitats (Fig. 1).There is a trend towards greater conservatism of successionalhabitat specialization in wetter forests, suggesting that special-ization may be less evolutionarily labile in these systems. Inaddition, when we consider the abundance of individuals, spe-cialists tend to make up a larger fraction of the individuals inwet regions than in dry regions – more SG specialists in sec-ondary forests and more OG specialists in old-growth forests(Fig. 4). These trends are much more evident in SG special-ists than OG specialists, perhaps due to the strong constraintson the life-history strategies of pioneer species and theephemeral nature of their habitat.Based on the differences in the abiotic environment of wet
and dry forests during succession, we predicted that func-tional trait profiles would differ between wet and dry forestSG specialists, with wet forest pioneers exhibiting traits forrapid growth and light gathering while dry forest pioneersshould exhibit traits related to desiccation tolerance. Lohbecket al. (2013) reported contrasting successional changes in thecommunity-weighted means of functional traits in wet anddry forests in Mexico, with traits indicating the importance oflight availability driving successional changes in wet forestsand water availability driving changes in dry forests. In our
broader data set, however, we identified relatively few traitsthat were strongly and consistently associated with succes-sional habitat specialization (Table 3).The lack of strong relationships that we observed between
functional traits and successional habitat specialization issomewhat surprising, given the directional changes in plantfunctional traits that are generally observed during tropicalforest succession (Bazzaz & Pickett 1980; Finegan 1996;Guariguata & Ostertag 2001; Chazdon et al. 2003; Lebrija-Trejos et al. 2010; Dupuy et al. 2012; Lohbeck et al. 2013;Chazdon 2014; Bhaskar, Dawson & Balvanera 2014). Onepotential explanation is the methodological differencesbetween our study and previous work. Studies that use com-munity-weighted means are strongly influenced by the mostabundant species in a community. The community-weightedmean approach is useful for understanding the synecology ofco-occurring species (sensu Odum & Odum 1959), but lessuseful for understanding the autoecology of each species. Thebrunch/crunch algorithms treat each species as a data point,rather than each individual (Purvis & Rambaut 1995). Thesealgorithms also explicitly correct for the lack of phylogeneticindependence among data points. For highly phylogeneticallyconserved traits, comparisons that do not take phylogeneticnon-independence into account may overestimate the magni-tude and significance of differences among groups (Felsen-stein 1985).
1000 2000 3000 4000
–0.5
0.0
0.5
1.0
1.5
mean annual rainfall (mm)
D s
tatis
tic fo
r sec
onda
ry fo
rest
spe
cial
izat
ion
OSA
SAR
LUQ
CHJ
PAN
BRA
CAR
GUA
KIU
CHINIZ
CHM
FES FOD
1000 2000 3000 4000
–0.5
0.0
0.5
1.0
1.5
mean annual rainfall (mm)
D s
tatis
tic fo
r old
gro
wth
spe
cial
izat
ion
OSA
SAR
LUQ
CHJ
PAN
BRACAR
GUAKIU
CHI
NIZ
CHM
FESFOD
(a) (b)
Fig. 3. D (Fritz & Purvis 2010) for second-growth specialization (panel a) and old-growth specialization (panel b) plottedagainst annual rainfall at the 14 sites. Dvalues approaching 0 indicate a moreclumped distribution of the trait on thephylogeny. Three-letter codes correspond tothe site names given in Table 1.
1000 2000 3000 4000
3040
5060
7080
9010
0
mean annual rainfall (mm)
OSA
SAR
LUQCHJ
PAN
BRA
CAR
GUA
KIU
CHI
NIZ
CHM
FES
FOD
% in
divi
dual
s in
sec
onda
ry fo
rest
cla
ssifi
ed a
sse
cond
ary
fore
st s
peci
alis
ts
1000 2000 3000 400030
4050
6070
8090
100
mean annual rainfall (mm)
OSASAR
LUQ
CHJ
PAN
BRA
CAR
GUA
KIU
CHI
NIZ
CHM
FESFOD
% in
divi
dual
s in
old
gro
wth
fore
st c
lass
ified
as
old
grow
th fo
rest
spe
cial
ists
(a) (b)
Fig. 4. The per cent of individuals insecondary forest classified as SG specialists(panel a), and the per cent of individuals inold-growth forest classified as OG specialists(panel b) for the 14 sites.
© 2015 The Authors. Journal of Ecology © 2015 British Ecological Society, Journal of Ecology, 103, 1276–1290
Successional gradients shape plant evolution 1285
Another explanation for the lack of strong trait-successionalhabitat association that we observed is the importance ofintraspecific variation in plant traits, and particularly the onto-
genetic shifts that occur between seedlings and adults (Clark& Clark 1992; Poorter & Rozendaal 2008). We measuredwood and leaf traits of adults, following standard protocols,
Fabaceae
Rosid I
Rosid II
Magnoliids
Melastomataceae
Euphorbiaceae
basal Asterid
Asterid I
AsteridII
Urticaceae
Salicaceae
Moraceae
Violaceae
Anacardiaceae
Burseraceae
Sapindaceae
Meliaceae
Malvaceae
RubiaceaeBoraginaceae
Sapotaceae
Lecythidaceae
Arecaceae
Primulaceae
Apocynaceae
HypericaceaeClusiaceae
Annonaceae
Lauraceae
Myrtaceae
Chrysobalanaceae
Malpighiaceae
PolygonaceaeNyctaginaceae
Rutaceae
Fig. 5. The phylogeny for the 921 species that were common enough to be classified with confidence. Branch colours indicate second-growthspecialists (red), old-growth specialists (blue) and generalists (grey). The labels of smaller families are omitted for clarity.
Table 4. The number of species in each major angiosperm clade that was classified with confidence using the multinomial model of Chazdonet al. (2011) at each of the 14 sites. The numbers in parentheses indicate the number of species in that clade classified as secondary forest spe-cialists and old-growth forest specialists, respectively; for example, 8 (0, 3) indicates that eight species were classified with confidence, zero assecondary forest specialists, three as old-growth specialists and the rest as generalists
Asterid I Asterid II Basal Asterid Eudicot Magnoliid Monocot Rosid I Rosid II
CHM 2 (0, 0) 0 6 (2, 2) 0 1 (1, 0) 0 13 (6, 2) 5 (1, 1)NIZ 2 (0, 2) 0 6 (2, 2) 0 1 (0, 1) 0 19 (7, 10) 6 (0, 6)KIU 6 (0, 1) 0 11 (2, 2) 0 0 0 16 (5, 4) 10 (3, 0)CHI 4 (1, 3) 0 7 (3, 4) 0 0 0 20 (7, 12) 13 (5, 6)GUA 9 (3, 3) 0 9 (3, 3) 0 3 (1, 0) 0 26 (11, 6) 19 (5, 10)FES 5 (1, 3) 2 (1, 0) 9 (4, 1) 0 7 (3, 2) 2 (0, 2) 38 (14, 12) 42 (17, 13)CAR 4 (2, 1) 1 (0, 0) 2 (0, 1) 0 1 (0, 0) 1 (0, 1) 10 (3, 3) 9 (6, 2)FOD 13 (3, 10) 2 (1, 1) 15 (5, 5) 0 14 (5, 5) 3 (1, 2) 27 (9, 14) 34 (7, 24)BRA 0 0 21 (2, 19) 0 9 (4, 3) 2 (0, 1) 37 (12, 19) 20 (10, 9)PAN 27 (9, 14) 3 (2, 0) 21 (7, 12) 1 (1, 0) 24 (3, 17) 5 (0, 5) 97 (38, 46) 75 (33, 35)CHJ 0 0 2 (1, 1) 0 1 (1, 0) 0 11 (4, 5) 10 (5, 5)LUQ 10 (5, 2) 3 (2, 0) 7 (2, 5) 0 3 (1, 1) 2 (1, 1) 26 (8, 12) 20 (10, 7)SAR 16 (2, 13) 2 (0, 1) 16 (4, 10) 0 20 (5, 7) 5 (1, 4) 60 (14, 25) 35 (12, 18)OSA 12 (7, 1) 1 (0, 0) 11 (2, 6) 0 21 (6, 7) 4 (0, 2) 58 (22, 20) 42 (20, 13)
© 2015 The Authors. Journal of Ecology © 2015 British Ecological Society, Journal of Ecology, 103, 1276–1290
1286 S. G. Letcher et al.
but the seedling may be the most relevant life stage for under-standing how traits mediate community assembly during suc-cession (Poorter & Markesteijn 2008; Lu et al. 2014), andseedling traits are not always directly related to adult traits(Cornelissen et al. 2003a; Poorter 2007).Although few of the traits that we studied showed strong
associations with successional habitat specialization, the sig-nificant trait relationships that we identified generally did con-form to expectations based on the physiological ecology ofplants during succession. For seed size, our data supportedthe widespread finding that secondary forest trees have smal-ler seeds (Swaine & Whitmore 1988; Chazdon et al. 2003).In three of the five sites where we had seed length data, wefound that SG specialists tended to be smaller seeded thanOG specialists in both wet and dry forests. Small-seeded taxalike Cecropia and Miconia are important pioneers in both wetand dry forest (Dalling et al. 2002). The absence of large-seeded taxa in early successional forests may be a product ofdispersal limitation; small seeds are more easily transported,and the large animals that disperse large-seeded taxa may notventure into secondary forest habitats (Guariguata & Ostertag2001; Dalling et al. 2002; Chazdon et al. 2003). Germinationof smaller seeds also tends to be sensitive to either light ordiel temperature fluctuations (V�azquez-Yanes et al. 1990;Pearson et al. 2002), which could contribute to the high abun-dance of small-seeded taxa in secondary forests.For leaf traits, very few of the traits that we investigated
showed a consistent relationship with successional habitatspecialization. Recent work on leaf traits in tropical forestspecies has demonstrated that leaf traits have high intraspe-cific variation in moist forest (Rozendaal, Hurtado & Poorter2006) and dry forest (Markesteijn, Poorter & Bongers 2007).The plasticity of traits, rather than the magnitude of interspe-cific trait variation, may be a key factor in understanding howleaf traits mediate plant success in different light environ-ments (Markesteijn, Poorter & Bongers 2007). Ontogeneticshifts may be a particularly important factor complicating ourability to generalize about leaf traits that mediate success indifferent environments (Clark & Clark 1992; Chazdon et al.2010). Seedling leaf traits may be more informative than adultleaf traits for understanding community assembly (Rozendaal,Hurtado & Poorter 2006; Poorter 2007), and the relationshipbetween seedling and adult leaf traits is not necessarilystraightforward (Cornelissen et al. 2003a).Maximum height was one of the traits that showed the
strongest relationships with successional habitat specialization(Table 3). According to our data, SG specialization is nega-tively related to maximum height (i.e. SG specialists tend tobe shorter statured) and OG specialization is positively relatedto maximum height, especially in dry forests. The only sitewhere we found a negative association between OG special-ization and maximum height was in the wet forest at LUQ(Table 3). In wet and moist forests, the shorter statured treesare often long-lived, slow-growing understorey species thatpersist in low light (Bazzaz & Pickett 1980; Poorter, Bongers& Bongers 2006; Kitajima & Poorter 2008). Since dry foresttrees have slower growth rates (Ewel 1977; Ruiz, Fandi~no &
Chazdon 2005), light-demanding short-statured species canpersist longer before being overtopped. A light-demandingshort-statured strategy would not be advantageous in wet for-ests, where canopy closure occurs rapidly (van der Meer &Bongers 1996) and where canopies are generally higher (Ewel1977; Bazzaz & Pickett 1980).Wood density is an important functional trait related to
growth rate, structural stability and longevity of trees (Chaveet al. 2006). Tropical secondary forest trees tend to havelower wood density, faster growth and shorter life spans(Woodcock 2000; Guariguata & Ostertag 2001; Wiemann &Williamson 2002). In our data set, we found significant rela-tionships between successional habitat specialization andwood traits in only half the sites studied. However, the stud-ies that have found stronger and more consistent relationshipsbetween successional stage and wood density, with low wooddensity in early successional tree species (Woodcock 2000;Wiemann & Williamson 2002), did not correct for phyloge-netic relatedness. Since wood density is a highly conservedtrait in most tropical tree lineages (Chave et al. 2006), analy-sis of wood traits may be particularly susceptible to overinfla-tion of significance due to phylogenetically non-independentdata points (Felsenstein 1985).The great diversity of lineages that have produced SG spe-
cialists and OG specialists (Fig. 5) complicates our ability togeneralize about the life-history traits and functional traits ofthe species that specialize at the ends of the successional hab-itat gradients in Neotropical forests. Trade-offs along multipleaxes govern the way that species partition resources duringsuccession; different lineages have different physiological andanatomical strategies for confronting the range of stresses thatoccur along successional gradients (Harms et al. 2001; Poor-ter & Markesteijn 2008; Baraloto et al. 2010; Lebrija-Trejoset al. 2010; Pineda-Garc�ıa, Paz & Tinoco-Ojanguren 2011;Lu et al. 2014). The great diversity of functional traits foundin tropical tree seedlings in forests across a precipitation gra-dient (Markesteijn & Poorter 2009; Pineda-Garc�ıa, Paz & Ti-noco-Ojanguren 2011; Lu et al. 2014) and the relatively lownumber of strong correlations between functional traits andsuccessional habitat specialization (Table 3) both suggest thatthere are many ways of being a successful pioneer.In this analysis, we have considered only the endpoints of
the successional gradient. Studies of resource partitioning gen-erally find species that specialize all along the gradient, notjust at the endpoints (Grime 1977; Ricklefs 1987; Tilman &Pacala 1993). Our conceptual model of trade-offs along a suc-cessional gradient (Fig. 1) is necessarily an oversimplification,and when more extensive data are available, it may be possi-ble to identify taxa that specialize at multiple points along thegradient rather than focusing on the endpoints. In addition,examining multiple successional stages may provide a morenuanced understanding of the evolution of plant strategies. Atpresent, we have few large-scale data sets with sufficient rep-lication at enough forest ages that would allow us to assessthis finer-scale partitioning of the successional habitat gradientin Neotropical trees. Several previous studies do suggest thepossibility. Letcher (2010) studied five stages of succession in
© 2015 The Authors. Journal of Ecology © 2015 British Ecological Society, Journal of Ecology, 103, 1276–1290
Successional gradients shape plant evolution 1287
Costa Rican wet forests and identified clades of angiospermsthat were more abundant than the null model expectation inevery stage of succession. Extending this work to three wetforest sites (Brazil (BRA), Mexico (CHJ), and an expandedset of sites in Costa Rica (SAR)), Letcher et al. (2012) foundsignificantly under- and overrepresented clades for each stageof succession examined.The scale at which phylogenetic conservatism is measured
can have a strong impact on the detection of conservatism;traits can be overdispersed within clades yet conserved acrossthe phylogeny as a whole or vice versa (Cooper, Jetz & Freckl-eton 2010; Fritz & Purvis 2010). Focusing on particular lin-eages, instead of the angiosperm phylogeny as a whole, mayprovide more insight into the evolution of successional habitatspecialization (Richardson et al. 2004). A tantalizing finding ofLetcher (2010) was that some genera contained species thatwere overrepresented in several distinct age categories; forinstance, one Miconia species (Melastomataceae) was signifi-cantly associated with old-growth forest, and two others weresignificantly associated with young forest. One Protium species(Burseraceae) was significantly associated with old-growth for-est, while another was indicative of older secondary forest.This pattern suggests that taxa can radiate into specialists atparticular stages in the successional gradient, as first envisionedby G�omez-Pompa (1971) for genera such as Piper and Acaly-pha over four decades ago. The new availability of phyloge-netic data provides opportunities to study these patterns.Incorporating phylogenetic relatedness into the study of
succession has revealed new insights about communityassembly (Letcher 2010; Letcher et al. 2012; Norden et al.2012). Incorporating the study of succession into biogeogra-phy and evolutionary biology could provide new insights aswell. When exploring the biogeography and evolution of spe-cies-rich taxa, it may be illuminating to include an investiga-tion of successional habitat specialization as well as climateand dispersal history (Chanderbali, van der Werff & Renner2001; Richardson et al. 2004).In sum, our results show that successional habitat special-
ization is a conserved trait for Neotropical trees; though, thereare many different pioneer lineages and a concomitant diver-sity of functional traits associated with successional habitatspecialization. Our data further suggest that successional habi-tat specialization may be more evolutionarily labile in dry for-ests than in wet forests, potentially due to the lowerdissimilarity of early successional and late-successional habi-tats in dry forests. Future studies will test the strength andgenerality of this pattern and reveal the extent to which radia-tion into successional niches has shaped plant evolution.
Acknowledgements
We thank three anonymous referees whose suggestions improved the manuscript.The authors gratefully acknowledge the financial and logistical support of the fol-lowing agencies and grants: at CHJ, NWO-WOTRO grant W85-326 to MvB andFB, and SEMARNAT-CONACyT 2002-C01-0597 and SEP-CONACyT CB-2005-01-51043 to MMR; at NIZ, SEP-CONACyT (CB-2009-01-128136) andDGAPA-UNAM (IN 216007-3) grants to JAM; at SAR, NSF DEB-0424767,DEB-0639114 and DEB-1110722 to RLC, Andrew W. Mellon Foundation to
DAC and DBC, NSF predoctoral fellowships to VB and S.G.L. and an OTS grad-uate fellowship to S.G.L.; at BRA, NSF DEB-0614044 to S.G.L., Conselho Nac-ional de Desenvolvimento Cientifico e Tecnologico (CNPq) to RCGM, and NSFDEB-1147434 and DEB-0639114 to GBW; at CAR and LUQ, Institute of LatinAmerican Studies, a Cross-Cutting Initiatives Earth Institute (Columbia Univer-sity), and NSF and NASA grants to the University of Puerto Rico; at CHI, BOL-FOR grants to DK and TJK and DEB9201 1026, National Geographic Society5570-95, and Tinker Foundation grants to TJK; at GUA, support from the Insti-tute on the Environment (University of Minnesota), NASA (NS000107), NSFDEB-1053237 and McKnight Land Grant Professorship (University of Minne-sota) to JSP, support from the Vicerrector�ıa de Investigaci�on-Universidad deCosta Rica and Organization for Tropical Studies to E.G.-J. and R.Q.-M.; at KIU,FOMIX-Yucat�an grant YUC-2008-C06-108863 to J.L.H.S. and CONACYTscholarship 46701 to L.S.V.; at OSA, the Blue Moon Fund; at PAN, datafrom Barro Colorado Island were supported by NSF DEB-0640386, DEB-0425651, DEB-0346488, DEB-0129874, DEB-00753102, DEB-9909347,DEB-9615226, DEB-9615226, DEB-9405933, DEB-9221033, DEB-9100058,DEB-8906869, DEB-8605042, DEB-8206992 and DEB-7922197 to S.P. Hub-bell, the Center for Tropical Forest Science, the Smithsonian Tropical ResearchInstitute, the John D. and Catherine T. MacArthur Foundation, the Mellon Foun-dation, the Small World Institute Fund and numerous private individuals; fundingfor the Agua Salud Project (secondary forest) came from the HSBC climate part-nership, STRI, the Panama Canal Authority, the Frank Levinson Family Founda-tion and the Motta Family Foundation; at CHM, PAPIIT-UNAM IN208012 to H.Paz, SEP-CONACYT 2012-179045 to A. Martinez-Yrizar, and SEP-CONACYT2009-129740 and PAPIIT-UNAM IN229007-3 to P.B. We also gratefullyacknowledge our field assistants, technicians, taxonomists and parataxonomists,and the landowners who provided access to their forests. This is publication #671in the Technical Series of the Biological Dynamics of Forest Fragments Project,BDFFP-INPA-SI.
Data accessibility
Except where otherwise noted, the phylogenetic tree used in this study and dataon plot locations, species abundances and functional traits are archived atdoi:10.5061/dryad.d87v7.
Species abundance data for:GUA: DOI:10.1016/j.foreco.2008.10.036,CAR and LUQ: http://luq.lternet.edu/research/luquillo-forest-dynamics-plot-lfdp,PAN: old-growth data at http://ctfs.arnarb.harvard.edu/webatlas/datasets/bci/;secondary forest data at http://ctfs.arnarb.harvard.edu/Public/plotdataaccess/.KIU: DOI 10.1111/j.1744-7429.2011.00783.x and DOI 10.1007/s10980-010-9561-3.
Functional trait data for:GUA: doi: 10.1111/j.1365-2435.2010.01701.x,PAN: doi: 10.1890/09-2335.1, doi: 10.1007/s00442-015-3339-x.CAR/LUQ: uploaded to TRY on 5/26/15 as ‘CTFS Luquillo ForestDynamics Plot – Swenson’; it will be available in the next data baseupdate.
References
Balvanera, P., Lott, E., Segura, G., Siebe, C. & Islas, A. (2002) Patterns of b-diversity in a Mexican tropical dry forest. Journal of Vegetation Science, 13,145–158.
Baraloto, C., Paine, C.E.T., Poorter, L., Beauchene, J., Bonal, D., Domen-ach, A.-M., H�erault, B., Pati~no Roggy, J.-C. & Chave, J. (2010) Decou-pled leaf and stem economics in rain forest trees. Ecology Letters, 13,1338–1347.
Bazzaz, F.A. & Pickett, S.T.A. (1980) Physiological ecology of tropical succes-sion: a comparative review. Annual Review of Ecology and Systematics, 11,287–310.
Bhaskar, R., Dawson, T.E. & Balvanera, P. (2014) Community assembly andfunctional diversity along succession post-management. Functional Ecology,28, 1256–1265.
van Breugel, M., Bongers, F. & Mart�ınez-Ramos, M. (2007) Community-levelspecies dynamics during early secondary forest succession: a test of the Ini-tial Floristic Composition hypothesis. Biotropica, 39, 610–619.
van Breugel, M., Mart�ınez-Ramos, M. & Bongers, F. (2006) Communitydynamics during early secondary succession in Mexican tropical rainforest.Journal of Tropical Ecology, 22, 663–674.
© 2015 The Authors. Journal of Ecology © 2015 British Ecological Society, Journal of Ecology, 103, 1276–1290
1288 S. G. Letcher et al.
van Breugel, M., Hall, J.S., Craven, D.J., Bailon, M., Hernandez, A., Abbene,M. & van Breugel, P. (2013) Succession of secondary forests and their lim-ited role for the conservation of floristic diversity in a human-modified tropi-cal landscape. PLoS One, 8, e82433.
Chanderbali, A.S., van der Werff, H. & Renner, S.S. (2001) Phylogeny and his-torical biogeography of Lauraceae: evidence from the chloroplast and nucleargenomes. Annals of the Missouri Botanical Garden, 88, 104–134.
Chao, A., Hsieh, T.C., Chazdon, R.L., Colwell, R.K. & Gotelli, N.J. (2015)Unveiling the species-rank abundance distribution by generalizing Good-Tur-ing sample coverage theory. Ecology, 96, 1189–1201.
Chave, J., Muller-Landau, H.C., Baker, T.R., Easdale, T.A., ter Steege, H. &Webb, C.O. (2006) Regional and phylogenetic variation of wood densityacross 2456 Neotropical tree species. Ecological Applications, 16, 2356–2367.
Chazdon, R.L. (2003) Tropical forest recovery: legacies of human impact anddisturbance. Perspectives in Plant Ecology, Evolution and Systematics, 6,51–71.
Chazdon, R.L. (2008) Chance and determinism in tropical forest succession.Tropical Forest Community Ecology (eds W.P. Carson & S.A. Schnitzer),pp. 384–408. Blackwell, Malden.
Chazdon, R.L. (2014) Second Growth: The Promise of Tropical Forest Regen-eration in an Age of Deforestation. University of Chicago Press, Chicago,IL.
Chazdon, R.L. & Fetcher, N. (1984) Photosynthetic light environments in alowland tropical rain forest in Costa Rica. Journal of Ecology, 72, 553–564.
Chazdon, R.L., Careaga, S., Webb, C.O. & Vargas, O. (2003) Community andphylogenetic structure of reproductive traits of woody species in wet tropicalforests. Ecological Monographs, 73, 331–348.
Chazdon, R.L., Finegan, B., Capers, R.S., Salgado-Negret, B., Casanoves, F.,Boukili, V. & Norden, N. (2010) Composition and dynamics of functionalgroups of trees during tropical forest succession in northeastern Costa Rica.Biotropica, 42, 31–40.
Chazdon, R.L., Chao, A., Colwell, R.K., Lin, S.-Y., Norden, N., Letcher,S.G., Clark, D.B., Finegan, B. & Arroyo, J.P. (2011) A novel statisticalmethod for classifying habitat generalists and specialists. Ecology, 96,1332–1343.
Clark, D.A. & Clark, D.B. (1992) Life history diversity of canopy and emer-gent trees in a neotropical rain forest. Ecological Monographs, 62, 315–344.
Coomes, D.A. & Grubb, P.J. (2000) Impacts of root competition in forests andwoodlands: a theoretical framework and review of experiments. EcologicalMonographs, 70, 171–207.
Cooper, N., Jetz, W. & Freckleton, R.P. (2010) Phylogenetic comparativeapproaches for studying niche conservatism. Journal of Evolutionary Biol-ogy, 23, 2529–2539.
Cornelissen, J.H.C., Cerabolini, B., Castro-D�ıez, P., Villar-Salvador, P., Mont-serrat-Mart�ı, G., Puyravaud, J.P., Maestro, M., Werger, M.J.A. & Aerts, R.(2003a) Functional traits of woody plants: correspondence of species rank-ings between field adults and laboratory-grown seedlings? Journal of Vegeta-tion Science, 14, 311–322.
Cornelissen, J.H.C., Lavorel, S., Garnier, E., D�ıaz, S., Buchmann, N., Gurvich,D.E., Reich, P.B., ter Steege, H., Morgan, H.D., van der Heijden, M.G.A.,Pausas, J.G. & Poorter, H. (2003b) A handbook of protocols for standardisedand easy measurement of plant functional traits worldwide. Australian Jour-nal of Botany, 51, 335–380.
Dalling, J.W., Hubbell, S.P. & Silvera, K. (1998) Seed dispersal, seedlingestablishment and gap partitioning among tropical pioneer trees. Journal ofEcology, 86, 674–689.
Dalling, J.W., Muller-Landau, H.C., Wright, S.J. & Hubbell, S.P. (2002) Roleof dispersal in the recruitment limitation of neotropical pioneer species. Jour-nal of Ecology, 90, 714–727.
Dupuy, J.M., Hern�andez-Stefanoni, J.L., Hern�andez-Ju�arez, R.A., Tetetla-Ran-gel, E., L�opez-Mart�ınez, J.O., Leyequi�en-Abarca, E., Tun-Dzul, F. & MayPat, F. (2012) Patterns and correlates of tropical dry forest structure and com-position in a highly replicated chronosequence in Yucatan, Mexico. Biotro-pica, 44, 151–162.
Ewel, J.J. (1977) Differences between wet and dry successional tropical ecosys-tems. Geo-Eco-Trop, 1, 103–117.
Felsenstein, J. (1985) Phylogenies and the comparative method. American Nat-uralist, 125, 1–15.
Finegan, B. (1996) Pattern and process in Neotropical secondary rain forests:the first 100 years of succession. Trends in Ecology and Evolution, 11, 119–124.
Flynn, D.F., Uriarte, M., Crk, T., Pascarella, J.B., Zimmerman, J.K., Aide,T.M. & Caraballo Ortiz, M.A. (2010) Hurricane disturbance alters secondaryforest recovery in Puerto Rico. Biotropica, 42, 149–157.
Fritz, S.A. & Purvis, A. (2010) Selectivity in mammalian extinction risk andthreat types: a new measure of phylogenetic signal strength in binary traits.Conservation Biology, 24, 1042–1051.
Gastauer, M. & Meira-Neto, J.A.A. (2013) Avoiding inaccuracies in tree cali-bration and phylogenetic community analysis using Phylocom 4.2. Ecologi-cal Informatics, 15, 85–90.
Gentry, A.H. (1988) Changes in plant community diversity and floristic compo-sition on environmental and geographic gradients. Annals of the MissouriBotanical Garden, 75, 1–34.
Gitay, H. & Noble, I.R. (1997) What are functional types and why should weseek them? Plant Functional Types: Their Relevance to Ecosystem Propertiesand Global Change (eds T.M. Smith, H.H. Shugart & F.I. Woodward), pp.1–19. Cambridge University Press, Cambridge.
G�omez-Pompa, A. (1971) Posible papel de la vegetaci�on secundaria en la evo-luci�on de la flora tropical. Biotropica, 3, 125–135.
Good, I.J. (1953) The population frequencies of species and the estimation ofpopulation parameters. Biometrika, 40, 237–264.
Grime, J.P. (1977) Evidence for the existence of three primary strategies inplants and its relevance to ecological and evolutionary theory. American Nat-uralist, 111, 1169–1194.
Grubb, P.J. (1977) The maintenance of species richness in plant communities:the importance of the regeneration niche. Biological Review, 52, 107–145.
Guariguata, M.R. & Ostertag, R. (2001) Neotropical secondary forest succes-sion: changes in structural and functional characteristics. Forest Ecology andManagement, 148, 185–206.
Harms, K.E., Condit, R., Hubbell, S.P. & Foster, R.B. (2001) Habitat associa-tions of trees and shrubs in a 50-ha neotropical forest plot. Journal of Ecol-ogy, 89, 947–959.
Hern�andez-Stefanoni, J.L., Dupuy, J.M., Tun-Dzul, F. & May-Pat, F. (2011)Influence of landscape structure and stand age on species density and bio-mass of a tropical dry forest across spatial scales. Landscape Ecology, 26,355–370.
Holbrook, M.N., Whitbeck, J.L. & Mooney, H.A. (1995) Drought responses ofNeotropical dry forest trees. Seasonally Dry Tropical Forests (eds S.H. Bull-ock, H.A. Mooney & E. Medina), pp. 243–276. Cambridge University Press,Cambridge.
Kennard, D.K. (2002) Secondary forest succession in a tropical dry forest: pat-terns of development across a 50-year chronosequence in lowland Bolivia.Journal of Tropical Ecology, 18, 53–66.
Killeen, T.J., Jardim, A., Mamani, F. & Rojas, N. (1998) Diversity, com-position and structure of a tropical semideciduous forest in the Chiquita-nia region of Santa Cruz, Bolivia. Journal of Tropical Ecology, 14,803–827.
Kitajima, K. & Poorter, L. (2008) Functional basis for resource niche partition-ing by tropical trees. Tropical Forest Community Ecology (eds W.P. Carson& S.A. Schnitzer), pp. 160–181. Wiley-Blackwell, Hoboken, NJ.
Laurance, S.G.W., Andrade, A. & Laurance, W.F. (2010) Unanticipatedeffects of stand dynamism on Amazonian tree diversity. Biotropica, 42,429–434.
Lebrija-Trejos, E., P�erez-Garc�ıa, E.A., Meave, J.A., Bongers, F. & Poorter, L.(2010) Functional traits and environmental filtering drive community assem-bly in a species-rich tropical system. Ecology, 91, 386–398.
Lebrija-Trejos, E., P�erez-Garc�ıa, E.A., Meave, J.A., Poorter, L. & Bongers, F.(2011) Environmental changes during secondary succession in a tropical dryforest in Mexico. Journal of Tropical Ecology, 27, 477–489.
Leigh, E.G. (1999) Tropical Forest Ecology: A View from Barro ColoradoIsland. Oxford University Press, Oxford, UK.
Letcher, S.G. (2010) Phylogenetic structure of angiosperm communities duringtropical forest succession. Proceedings of the Royal Society B: BiologicalSciences, 277, 97–104.
Letcher, S.G. & Chazdon, R.L. (2009) Rapid recovery of biomass, species rich-ness, and species composition in a forest chronosequence in northeasternCosta Rica. Biotropica, 41, 608–617.
Letcher, S.G., Chazdon, R.L., Andrade, A.C.S., Bongers, F., van Breugel, M.,Finegan, B., Laurance, S.G., Mesquita, R.C.G., Mart�ınez-Ramos, M. & Wil-liamson, G.B. (2012) Phylogenetic community structure during succession:evidence from three Neotropical forest sites. Perspectives in Plant Ecology,Evolution and Systematics, 14, 79–87.
Lohbeck, M., Poorter, L., Lebrija-Trejos, E., Mart�ınez-Ramos, M., Meave, J.A.,Paz, H., P�erez-Garc�ıa, E.A., Romero-P�erez, I.E., Tauro, A. & Bongers, F.(2013) Successional changes in functional composition contrast for dry andwet tropical forest. Ecology, 94, 1211–1216.
Losos, J.B. (2008) Phylogenetic niche conservatism, phylogenetic signal andthe relationship between phylogenetic relatedness and ecological similarityamong species. Ecology Letters, 11, 995–1007.
© 2015 The Authors. Journal of Ecology © 2015 British Ecological Society, Journal of Ecology, 103, 1276–1290
Successional gradients shape plant evolution 1289

Lu, X., Zang, R., Ding, Y., Letcher, S.G., Long, W. & Huang, Y. (2014) Vari-ations and trade-offs in functional traits of tree seedlings during secondarysuccession in a tropical lowland rain forest. Biotropica, 46, 404–414.
Magall�on, S. & Castillo, A. (2009) Angiosperm diversification rates throughtime. American Journal of Botany, 96, 349–365.
Markesteijn, L. & Poorter, L. (2009) Seedling root morphology and biomassallocation of 62 tropical tree species in relation to drought-and shade-toler-ance. Journal of Ecology, 97, 311–325.
Markesteijn, L., Poorter, L. & Bongers, F. (2007) Light-dependent leaf traitvariation in 43 tropical dry forest tree species. American Journal of Botany,94, 515–525.
van der Meer, P.J. & Bongers, F. (1996) Formation and closure of canopy gapsin the rain forest at Nouragues, French Guiana. Vegetatio, 126, 167–179.
Mesquita, R.C.G., Ickes, K., Ganade, G. & Williamson, G.B. (2001) Alterna-tive successional pathways in the Amazon. Journal of Ecology, 89, 528–537.
Missouri Botanical Garden. (2014) Tropicos. Available at http://www.tropi-cos.org. Accessed October 1, 2013 – January 15, 2014.
Mora, F., Mart�ınez-Ramos, M., Ibarra-Manriquez, G., P�erez-Jimenez, A., Trill-eras, J. & Balvanera, P. (2015) Testing chronosequences through dynamicapproaches: time and site effects on tropical dry forest succession. Biotropica,47, 38–48.
Morales-Salazar, M., V�ılchez-Alvarado, B., Chazdon, R.L., Ortega-Guti�errez,M., Ortiz-Malavassi, E. & Guevara-Bonilla, M. (2012) Diversidad y estruc-tura horizontal en los bosques tropicales del Corredor Biol�ogico de Osa,Costa Rica. Revista Forestal Mesoamericana Kur�u, 9, 19–28.
Norden, N., Letcher, S.G., Boukili, V., Swenson, N.G. & Chazdon, R.L.(2012) Demographic drivers of successional changes in phylogenetic struc-ture across life-history stages in plant communities. Ecology, 93, S70–S82.
Odum, E.P. & Odum, H.T. (1959) Fundamentals of Ecology. WB SaundersCompany, Philadelphia, USA.
Orme, D., Freckleton, R., Thomas, G., Petzoldt, T., Fritz, S., Isaac, N. &Pearse, W. (2013) caper: Comparative Analyses of Phylogenetics and Evolu-tion in R, version 0.5.2. http://cran.r-project.org/web/packages/caper.
Parker, C. (2013) On measuring the performance of binary classifiers. Knowl-edge and Information Systems, 35, 131–152.
Pearson, T.R.H., Burslem, D.F.R., Mullins, C.E. & Dalling, J.W. (2002) Germi-nation ecology of neotropical pioneers: interacting effects of environmentalconditions and seed size. Ecology, 83, 2798–2807.
P�erez-Garc�ıa, E.A., Meave, J.A., Villase~nor, J.L., Gallardo-Cruz, J.A. & Lebri-ja-Trejos, E.E. (2010) Vegetation heterogeneity and life-strategy diversity inthe flora of the heterogeneous landscape of Nizanda, Oaxaca, Mexico. FoliaGeobotanica, 45, 143–161.
Pickett, S.T.A. (1976) Succession: an evolutionary interpretation. AmericanNaturalist, 110, 107–119.
Pineda-Garc�ıa, F., Paz, H. & Tinoco-Ojanguren, C. (2011) Morphological andphysiological differentiation of seedlings between dry and wet habitats in atropical dry forest. Plant, Cell & Environment, 34, 1536–1547.
Poorter, L. (2007) Are species adapted to their regeneration niche, adult niche,or both? American Naturalist, 169, 433–442.
Poorter, L. (2009) Leaf traits show different relationships with shade tolerancein moist versus dry tropical forests. New Phytologist, 181, 890–900.
Poorter, L., Bongers, L. & Bongers, F. (2006) Architecture of 54 moist-forest treespecies: traits, trade-offs, and functional groups. Ecology, 87, 1289–1301.
Poorter, L. & Markesteijn, M. (2008) Seedling traits determine drought toler-ance of tropical tree species. Biotropica, 40, 321–331.
Poorter, L. & Rose, S.A. (2005) Light-dependent changes in the relationshipbetween seed mass and seedling traits: a meta-analysis for rain forest treespecies. Oecologia, 142, 378–387.
Poorter, L. & Rozendaal, D.M. (2008) Leaf size and leaf display of thirty-eighttropical tree species. Oecologia, 158, 35–46.
Poorter, L., van de Plassche, M., Willems, S. & Boot, R.G.A. (2004) Leaf traitsand herbivory rates of tropical tree species differing in successional status.Plant Biology, 6, 746–754.
Powers, J.S., Becknell, J.M., Irving, J. & P�erez-Aviles, D. (2009) Diversity andstructure of regenerating tropical dry forests in Costa Rica: geographic patternsand environmental drivers. Forest Ecology and Management, 258, 959–970.
Prinzing, A. (2001) The niche of higher plants: evidence for phylogenetic con-servatism. Proceedings of the Royal Society of London. Series B: BiologicalSciences, 268, 2383–2389.
Purvis, A. & Rambaut, A. (1995) Comparative analysis by independent con-trasts (CAIC): an apple macintosh application for analysing comparative data.Computer Applications in the Biosciences, 11, 247–251.
R Development Core Team. (2013) R: A Language and Environment for Statis-tical Computing. R Foundation for Statistical Computing, Vienna, Austria.Available at http://www.R-project.org/.
Richardson, J.E., Chatrou, L.W., Mols, J.B., Erkens, R.H.J. & Pirie, M.D.(2004) Historical biogeography of two cosmopolitan families of floweringplants: Annonaceae and Rhamnaceae. Proceedings of the Royal Society B:Biological Sciences, 359, 1495–1508.
Ricklefs, R.E. (1987) Community diversity: relative roles of local and regionalprocesses. Science, 235, 168–171.
Rodrigues, R.R. (1999) A vegetac�~ao de Piracicaba e munic�ıpios do entorno. Cir-cular T�ecnica IPEF (Instituto de Pesquisas e Estudos Florestais), 189, 1–17.
Rodrigues, R.R., Morellato, L.P.C., Joly, C.A. & Leit~ao Filho, H.F. (1989)Estudo flor�ıstico e fitossociol�ogico em um gradiente altitudinal de matames�ofila semidec�ıdua na Serra do Japi, Jundia�ı, SP. Revista Brasileira deBotanica, 12, 71–84.
Rozendaal, D.M.A., Hurtado, V.H. & Poorter, L. (2006) Plasticity in leaf traitsof 38 tropical tree species in response to light: relationships with lightdemand and adult stature. Functional Ecology, 20, 207–216.
Ruiz, J., Fandi~no, M.C. & Chazdon, R.L. (2005) Vegetation structure, composi-tion, and species richness across a 56-year chronosequence of dry tropicalforest on Providencia Island, Colombia. Biotropica, 37, 520–530.
Sandor, M.E. (2012) Forest regeneration on the Osa Peninsula, Costa Rica.MS Thesis, University of Connecticut, Storrs, CT.
Sousa, W.P. (1984) The role of disturbance in natural communities. AnnualReview of Ecology and Systematics, 15, 353–391.
van Steenis, C.G.G.J. (1958) Rejuvenation as a factor for judging the status of vege-tation types: the biological nomad theory. Study of Tropical Vegetation: Proceed-ings of the Kandy Symposium. (ed. anon.), pp. 212–215. UNESCO, Paris.
Stevens, P.F. (2014) Angiosperm Phylogeny Website. Version 12, July 2012[and more or less continuously updated since]. Available at http://www.mo-bot.org/MOBOT/research/APweb/. Accessed October 15, 2013 – March 20,2014.
Swaine, M.D. & Whitmore, T.C. (1988) On the definition of ecological speciesgroups in tropical rain forests. Vegetatio, 75, 81–86.
Thompson, J., Brokaw, N., Zimmerman, J.K., Waide, R.B., Everham, E.M. III,Lodge, D.J., Taylor, C.M., Garc�ıa-Montiel, D. & Fluet, M. (2002) Land usehistory, environment, and tree composition in a tropical forest. EcologicalApplications, 12, 1344–1363.
Tilman, D. & Pacala, S. (1993) The maintenance of species richness in plantcommunities. Species Diversity in Ecological Communities (eds R.E. Ricklefs& D. Schluter), pp. 13–25. University of Chicago Press, Chicago, IL.
V�azquez-Yanes, C., Orozco-Segovia, A., Rincon, E., S�anchez-Coronado, M.E.,Huante, P., Toledo, J.R. & Barradas, V.L. (1990) Light beneath the litter ina tropical forest: effect on seed germination. Ecology, 71, 1952–1958.
Webb, C.O., Ackerly, D.D. & Kembel, S.W. (2008) Phylocom: software forthe analysis of phylogenetic community structure and trait evolution. Bioin-formatics, 24, 2098–2100.
Webb, C.O. & Donoghue, M.J. (2005) Phylomatic: tree assembly for appliedphylogenetics. Molecular Ecology Notes, 5, 181–183.
Wendt, A.L. (2014). Seed dispersal, seed size and seed predation in tropicalregrowth forests. PhD Dissertation, 195 pp. University of Connecticut,Storrs, CT.
Whitmore, T.C. (1989) Canopy gaps and the two major groups of forest trees.Ecology, 70, 536–538.
Wiemann, M.C. & Williamson, G.B. (2002) Geographic variation in wood spe-cific gravity: effects of latitude, temperature, and precipitation. Wood andFiber Science, 34, 96–107.
Wikstr€om, N., Savolainen, V. & Chase, M.W. (2001) Evolution of the angio-sperms: calibrating the family tree. Proceedings of the Royal Society B: Bio-logical Sciences, 268, 2211–2220.
Williamson, G.B. & Wiemann, M.C. (2010) Measuring wood specific grav-ity. . . correctly. American Journal of Botany, 97, 519–524.
Woodcock, D.W. (2000) Wood specific gravity of trees and forest types in thesouthern Peruvian Amazon. Acta Amazonica, 30, 589–599.
Received 17 October 2014; accepted 2 June 2015Handling Editor: Shurong Zhou
Supporting Information
Additional Supporting Information may be found in the online ver-sion of this article:
Table S1. Detailed information on the study sites, including plotdimensions and ages. For specific methodological details, see the ref-erences cited in Table 1 for each site.
© 2015 The Authors. Journal of Ecology © 2015 British Ecological Society, Journal of Ecology, 103, 1276–1290
1290 S. G. Letcher et al.