Environmental Dosimetry - HPS Chaptershpschapters.org/src/2014/1 Jannik-Environmental Dosimetry...1)...
70
Environmental Dosimetry Environmental Dosimetry Methods and New Developments Tim Jannik Principal Technical Advisor Savannah River Chapter of Health Physics Society Seminar May 16, 2014
Transcript of Environmental Dosimetry - HPS Chaptershpschapters.org/src/2014/1 Jannik-Environmental Dosimetry...1)...
Environmental Dosimetry
Environmental Dosimetry Methods and New Developments
Tim Jannik
Principal Technical Advisor
Savannah River Chapter of Health Physics Society Seminar
May 16, 2014

Outline
• Introduction to Environmental Dosimetry
• Environmental Dosimetry Methods
• Representative Person
– Reference Person
• USEPA’s CAP88 PC Version 4.0
2
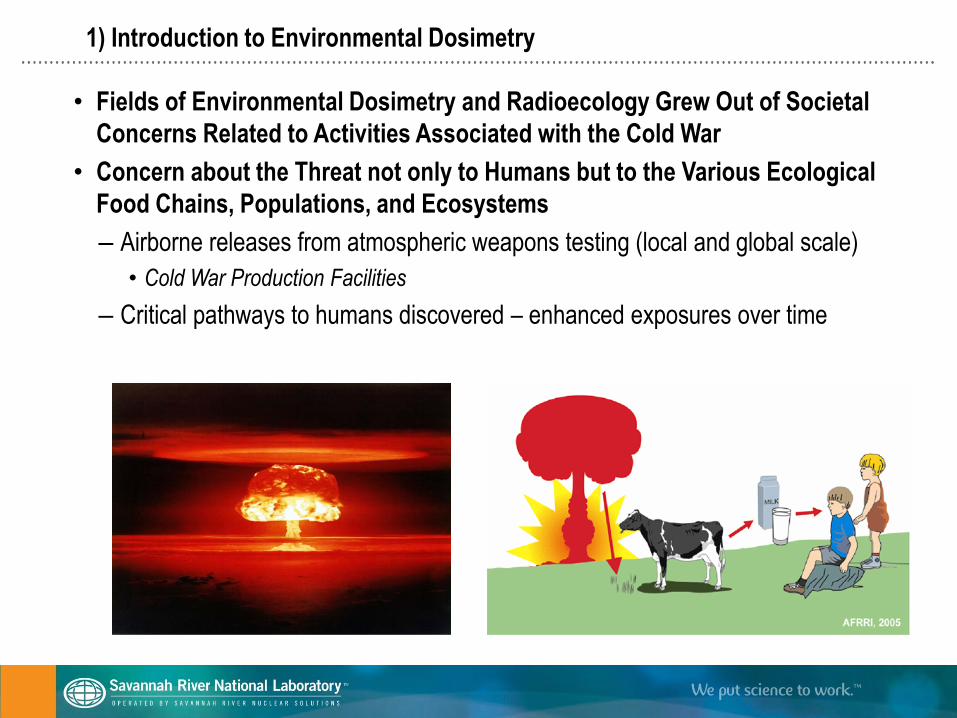
1) Introduction to Environmental Dosimetry
• Fields of Environmental Dosimetry and Radioecology Grew Out of Societal
Concerns Related to Activities Associated with the Cold War
• Concern about the Threat not only to Humans but to the Various Ecological
Food Chains, Populations, and Ecosystems
– Airborne releases from atmospheric weapons testing (local and global scale)
• Cold War Production Facilities
– Critical pathways to humans discovered – enhanced exposures over time
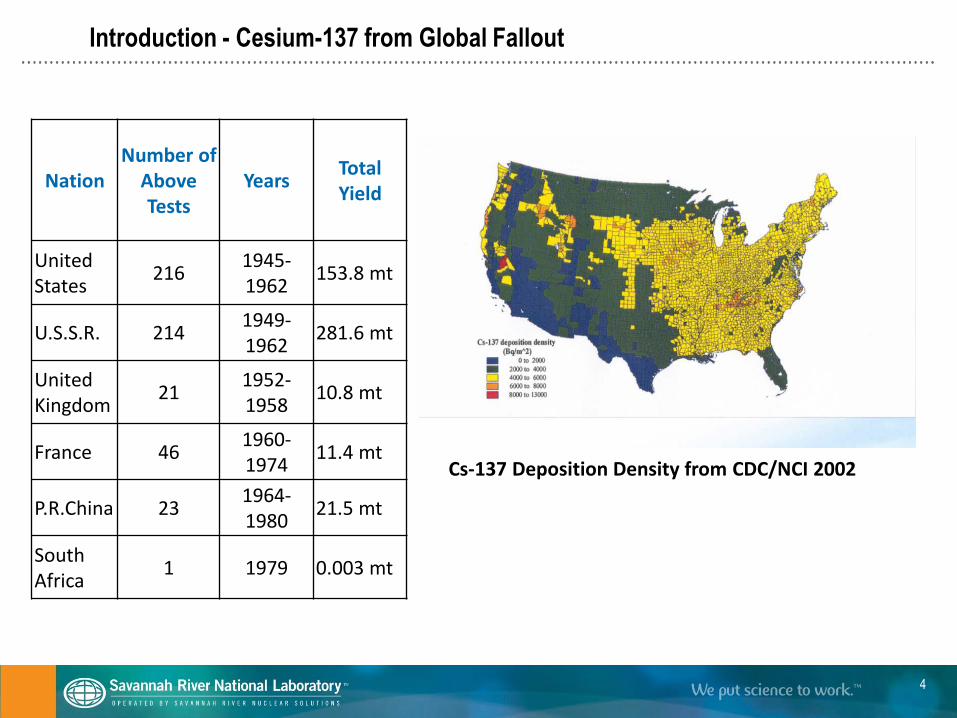
Introduction - Cesium-137 from Global Fallout
4
Cs-137 Deposition Density from CDC/NCI 2002
Nation Number of
Above Tests
Years Total Yield
United States
216 1945-1962
153.8 mt
U.S.S.R. 214 1949-1962
281.6 mt
United Kingdom
21 1952-1958
10.8 mt
France 46 1960-1974
11.4 mt
P.R.China 23 1964-1980
21.5 mt
South Africa
1 1979 0.003 mt
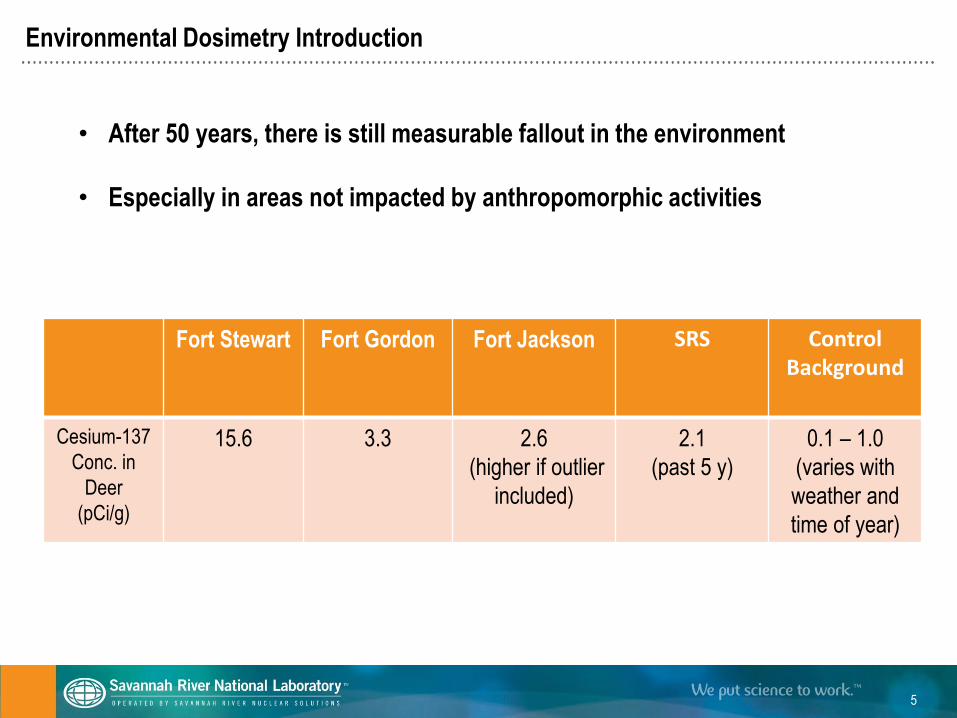
Environmental Dosimetry Introduction
5
Fort Stewart
Fort Gordon
Fort Jackson
SRS Control Background
Cesium-137
Conc. in
Deer
(pCi/g)
15.6 3.3 2.6
(higher if outlier
included)
2.1
(past 5 y)
0.1 – 1.0
(varies with
weather and
time of year)
• After 50 years, there is still measurable fallout in the environment
• Especially in areas not impacted by anthropomorphic activities
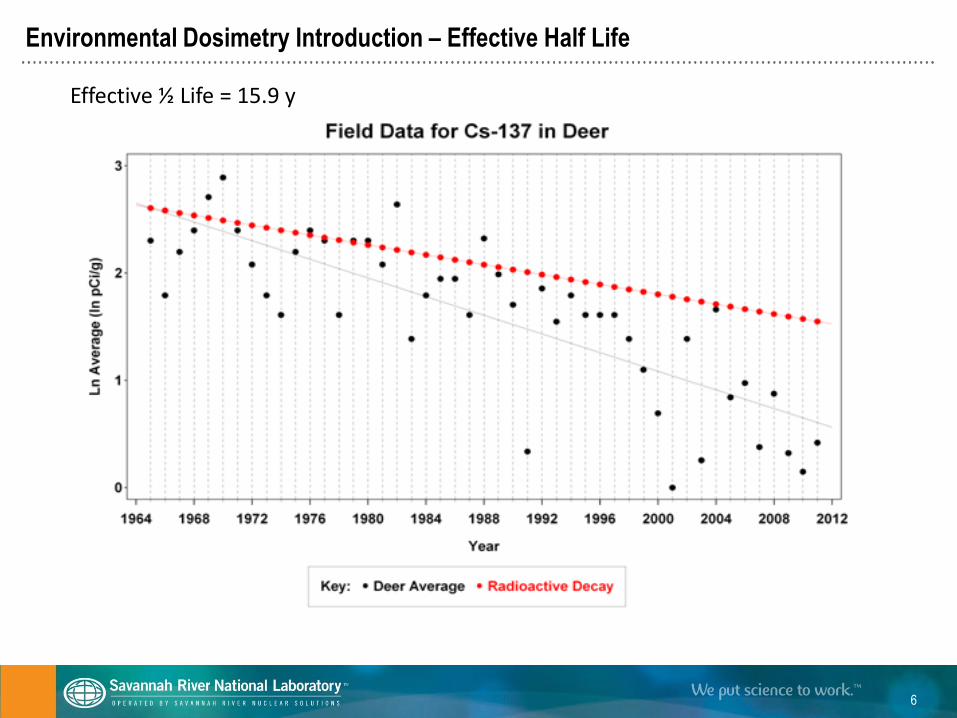
Environmental Dosimetry Introduction – Effective Half Life
6
Effective ½ Life = 15.9 y
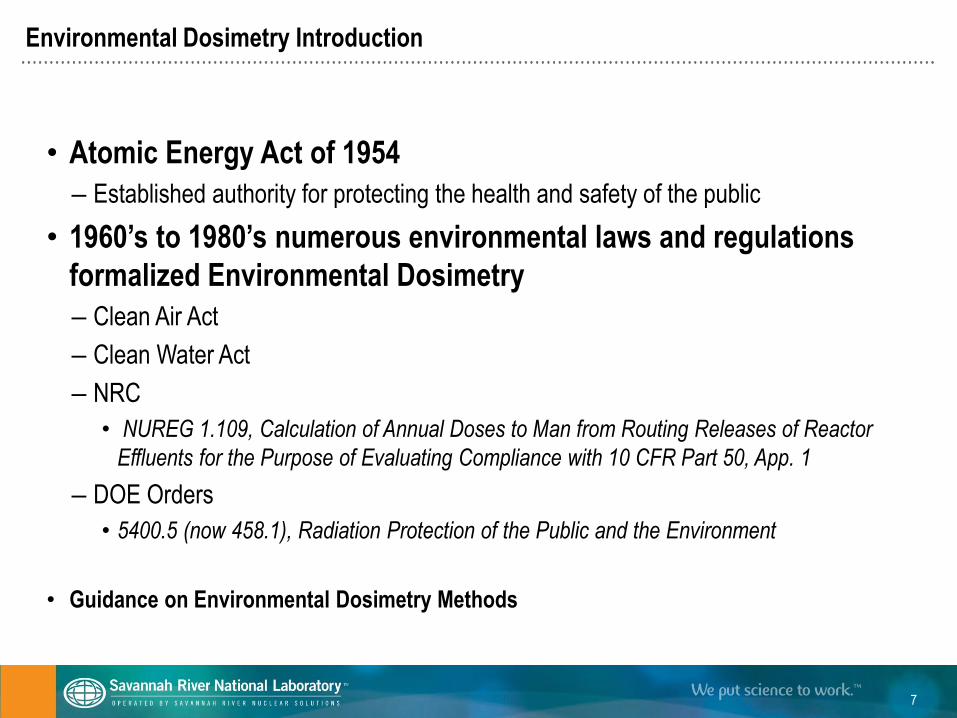
Environmental Dosimetry Introduction
• Atomic Energy Act of 1954
– Established authority for protecting the health and safety of the public
• 1960’s to 1980’s numerous environmental laws and regulations
formalized Environmental Dosimetry
– Clean Air Act
– Clean Water Act
– NRC
• NUREG 1.109, Calculation of Annual Doses to Man from Routing Releases of Reactor
Effluents for the Purpose of Evaluating Compliance with 10 CFR Part 50, App. 1
– DOE Orders
• 5400.5 (now 458.1), Radiation Protection of the Public and the Environment
• Guidance on Environmental Dosimetry Methods
7
2) Environmental Dosimetry Methods
• Definition of Environmental Dosimetry is from Dr. John Till
• “Radiological Risk Assessment and Environmental Analysis”
– Bible for Environmental Dosimetry
8
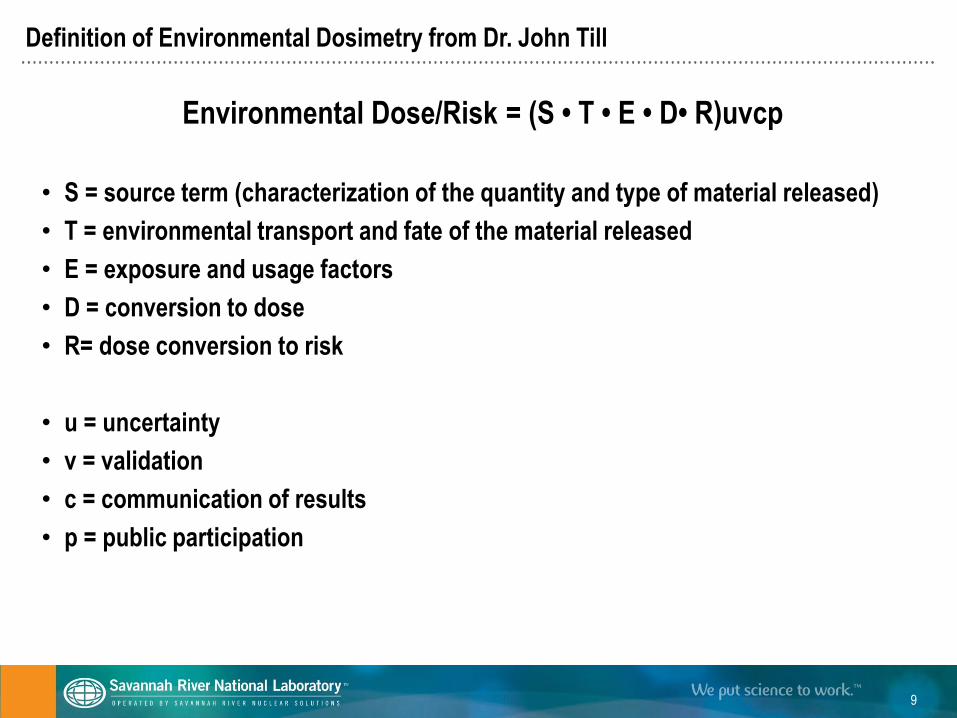
Definition of Environmental Dosimetry from Dr. John Till
Environmental Dose/Risk = (S • T • E • D• R)uvcp
• S = source term (characterization of the quantity and type of material released)
• T = environmental transport and fate of the material released
• E = exposure and usage factors
• D = conversion to dose
• R= dose conversion to risk
• u = uncertainty
• v = validation
• c = communication of results
• p = public participation
9
Source Term
Dose/Risk = (S • T • E • D• R)uvcp
• First key element is the source term (S) it defines the characteristics and quantity of material that is released to the environment
– Measured or calculated at the point of discharge
• Airborne pathways
• Liquid pathways
• Requires the most resources relative to other steps – Sampling
– Flow measurements
– Radiochemistry
– Radioanalyses
– Compilation
– Quality control and assurance
• Should follow a Data Life Cycle Process
– Optimize the quantity and quality of the data – Data Quality Objectives
– The only good data are used data
– The only used data are good data
10
Source Term Guidance
• “Design of Effective Radiological Effluent Monitoring and Environmental
Surveillance Programs”
– NCRP Report No. 169 (2011)
• "Environmental Radiological Effluent Monitoring and Environmental Surveillance“
– DOE/EH-0173T (1991)
– DOE Technical Standards Program (TSP) Handbook (Draft in DOE RevCom 2014)
• “Sampling and Monitoring Releases of Airborne Radioactive Substances from the
Stacks and Ducts of Nuclear Facilities,”
– ANSI N13.1 (2011)
• "Offsite Dose Calculation Manual Guidance: Standard Radiological Effluent
Controls for Pressurized Water Reactors“
– NUREG-1301 (1991)
• "Offsite Dose Calculation Manual Guidance: Standard Radiological Effluent
Controls for Boiling Water Reactors“
– NUREG-1302 (1991)
11
Source Term Determination – Liquid Effluents
• Batch Release Sampling
– Ideal Sampling
• Known volumes and concentrations
• Timed Integrated Sampling
– Samples collected on a specific schedule
– Composited over a specific sampling period
– Separate Flow Measurements
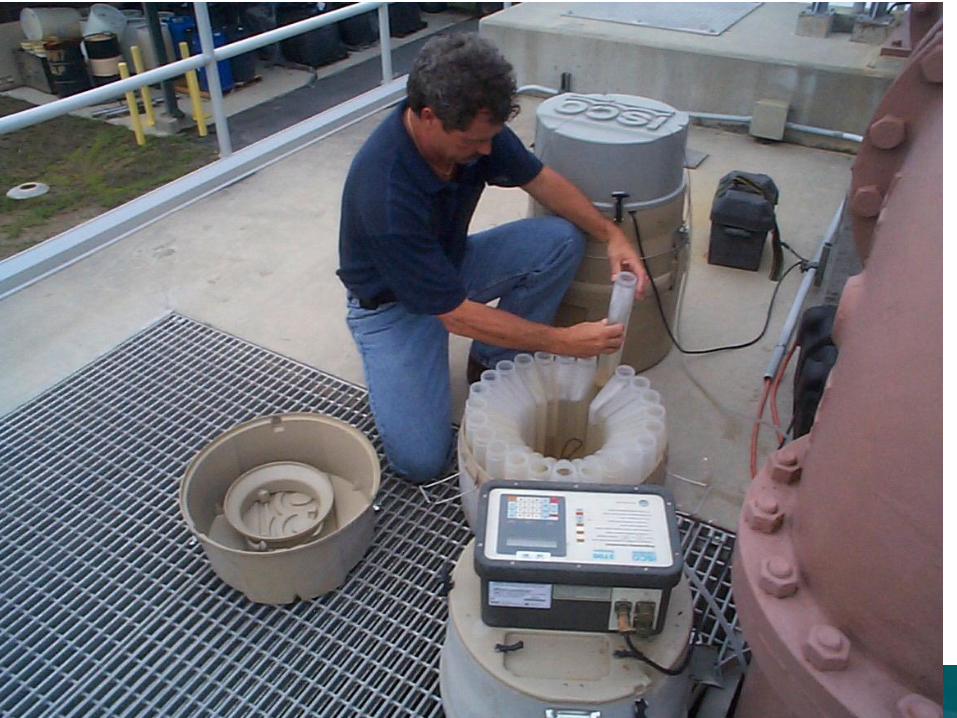
• Flow Proportional Sampling
– Requires continuous flow measurement and timed sampling
– Sample taken is programmed to be proportional to the effluent flow volume
12
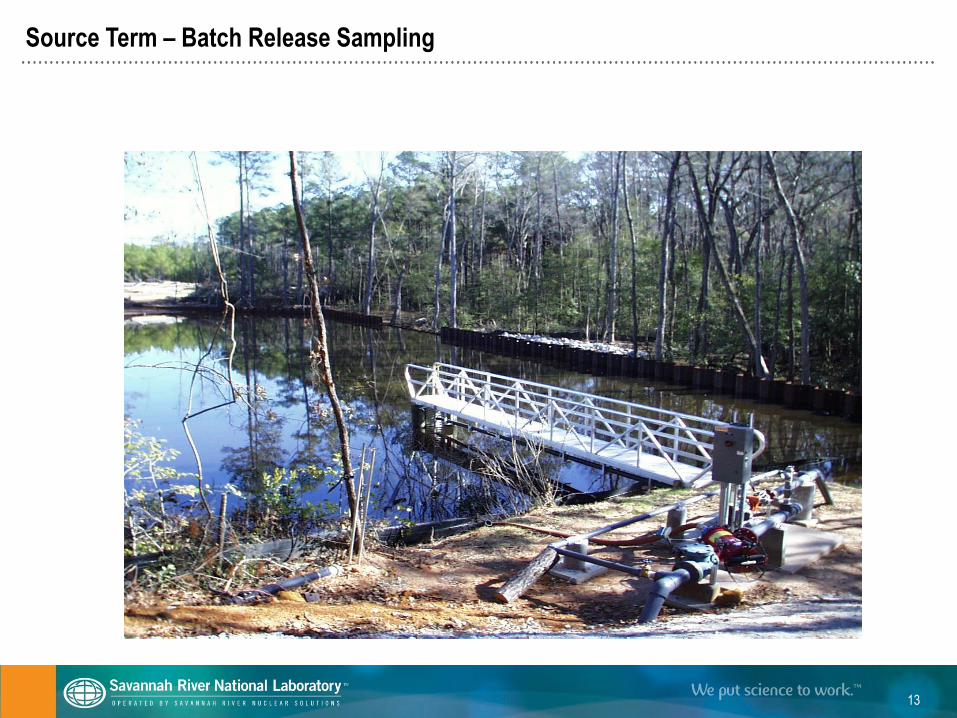
Source Term – Batch Release Sampling
13
Time Integrated Sampling
14
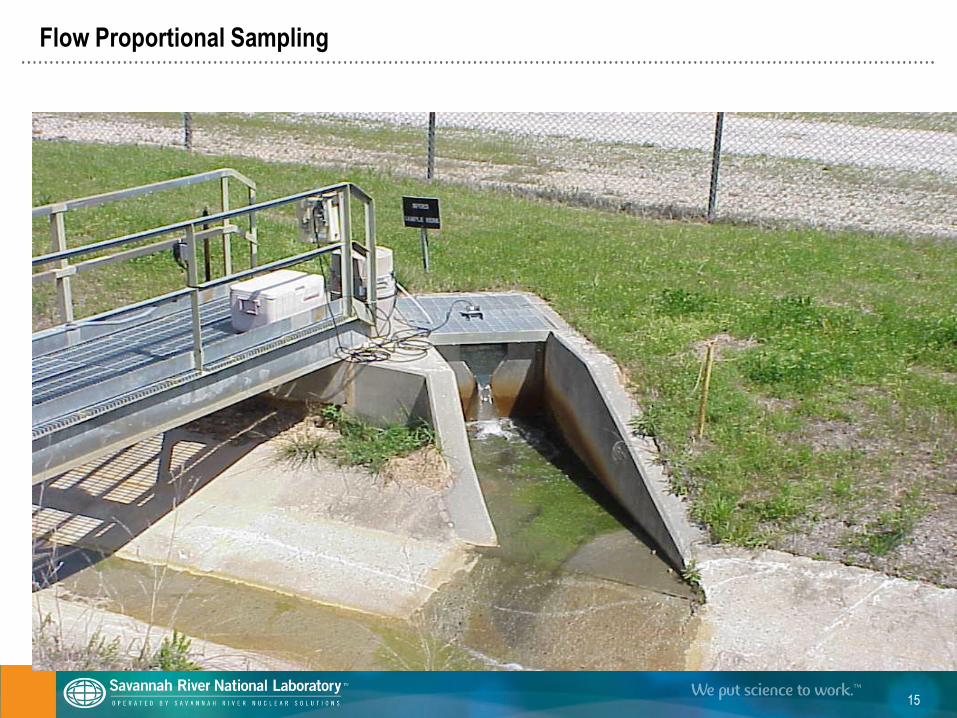
Flow Proportional Sampling
15
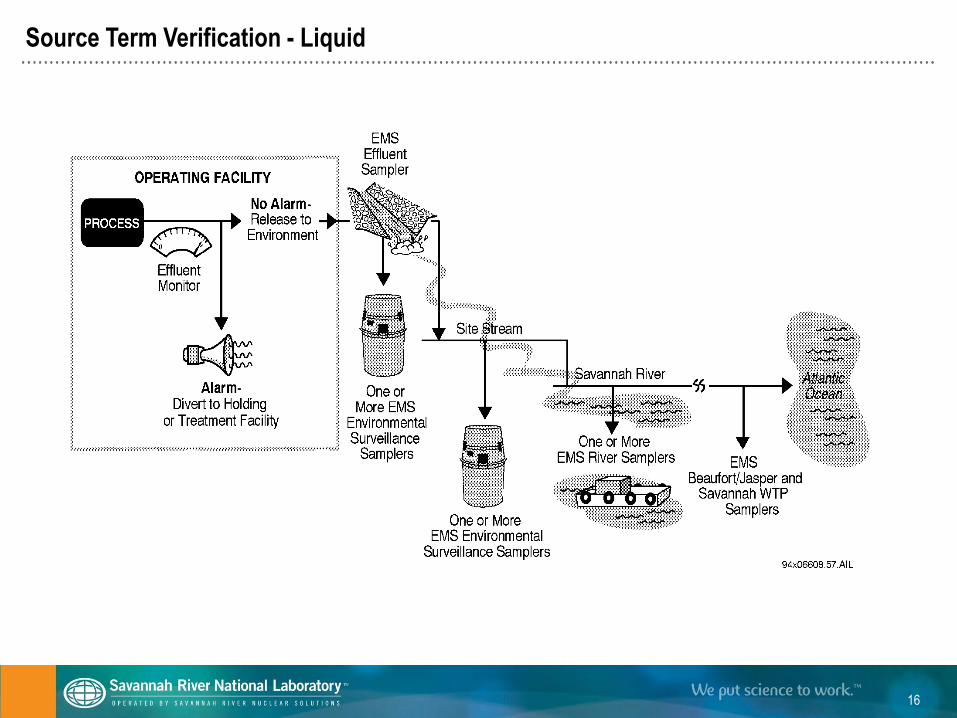
Source Term Verification - Liquid
16
Source Term Determination – Airborne Effluents
• National Emissions Standards for Hazardous Air Pollutants
• NESHAPS Subpart H (EPA 1991)
– Requires Evaluation
• Potential Airborne Emissions
– Potential Effective Dose (PED)
• Normal Operations
– Including System Upsets
– No Control Devices or Filtration Operating
• Results of PED Evaluations
– Used to Determine Potential Impact Categories (PIC)
• PIC Levels used to Determine Monitoring Requirements
17
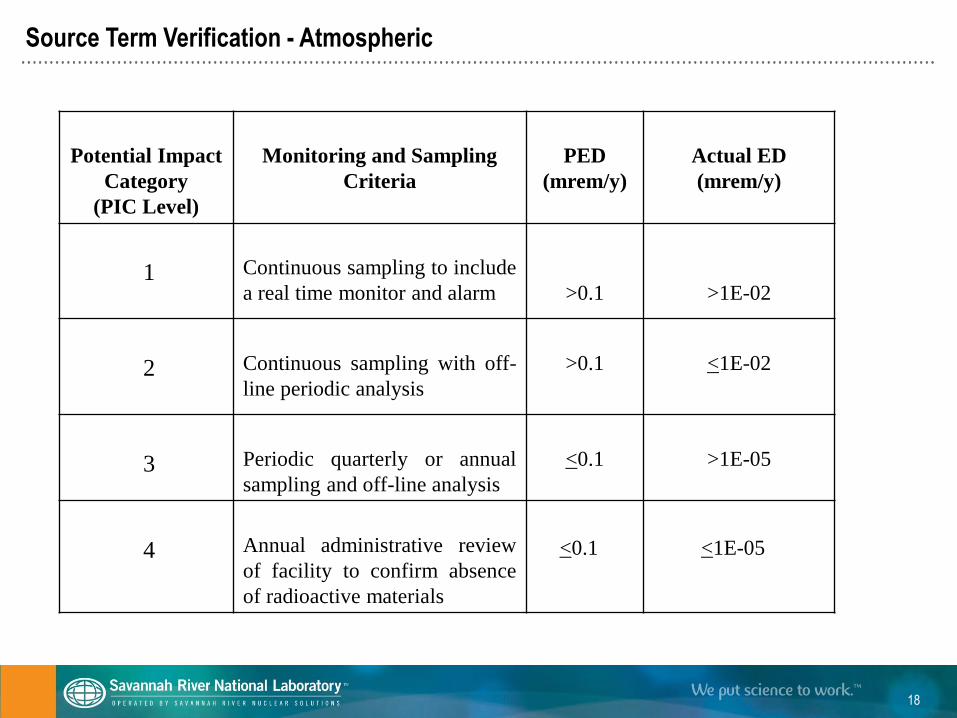
Source Term Verification - Atmospheric
18
Potential Impact
Category
(PIC Level)
Monitoring and Sampling
Criteria
PED
(mrem/y)
Actual ED
(mrem/y)
1
Continuous sampling to include
a real time monitor and alarm
>0.1
>1E-02
2
Continuous sampling with off-
line periodic analysis
>0.1
<1E-02
3
Periodic quarterly or annual
sampling and off-line analysis
<0.1
>1E-05
4
Annual administrative review
of facility to confirm absence
of radioactive materials
<0.1
<1E-05
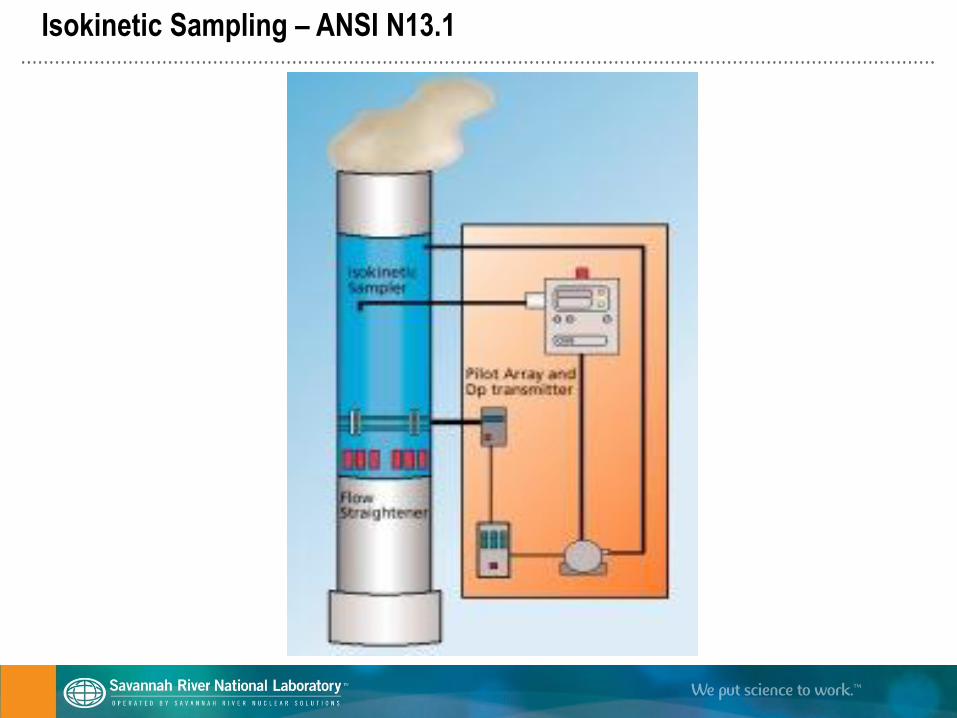
Isokinetic Sampling – ANSI N13.1
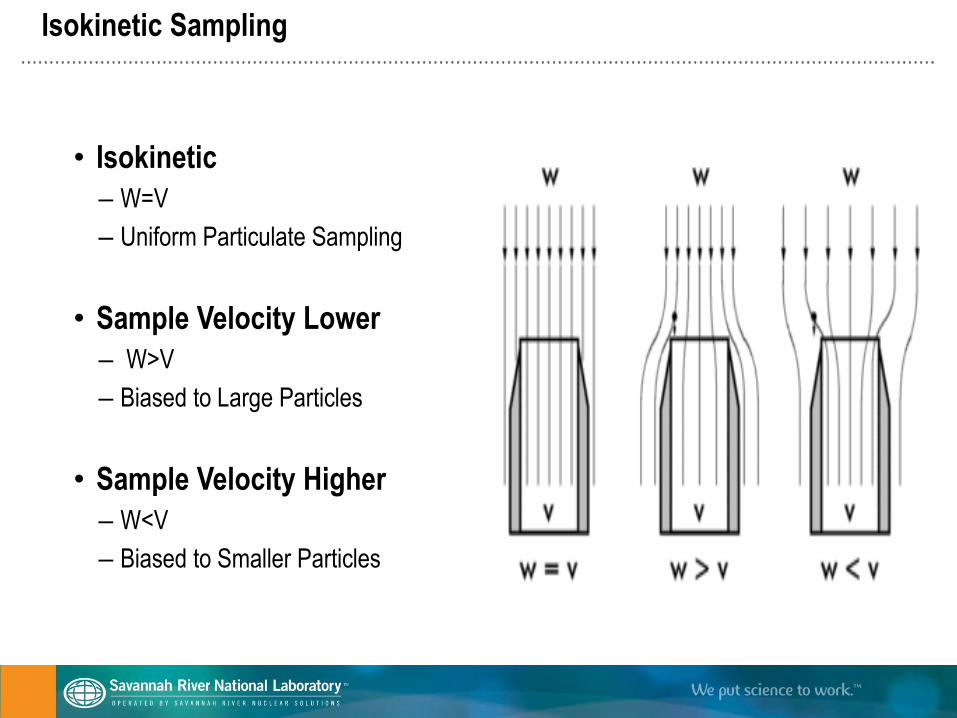
Isokinetic Sampling
• Isokinetic
– W=V
– Uniform Particulate Sampling
• Sample Velocity Lower
– W>V
– Biased to Large Particles
• Sample Velocity Higher
– W<V
– Biased to Smaller Particles
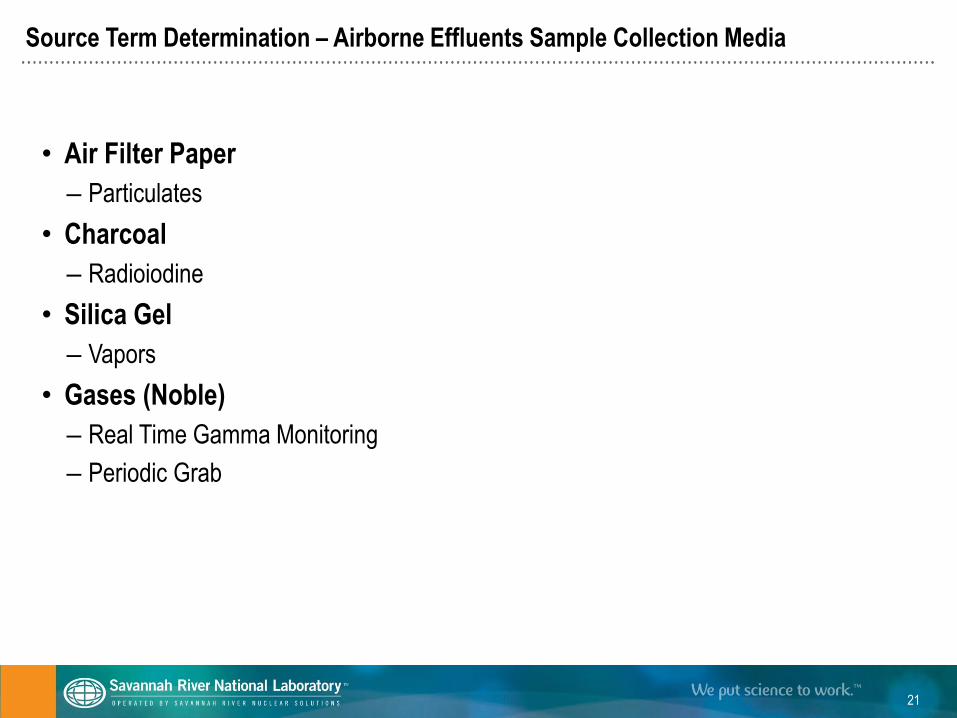
Source Term Determination – Airborne Effluents Sample Collection Media
• Air Filter Paper
– Particulates
• Charcoal
– Radioiodine
• Silica Gel
– Vapors
• Gases (Noble)
– Real Time Gamma Monitoring
– Periodic Grab
21
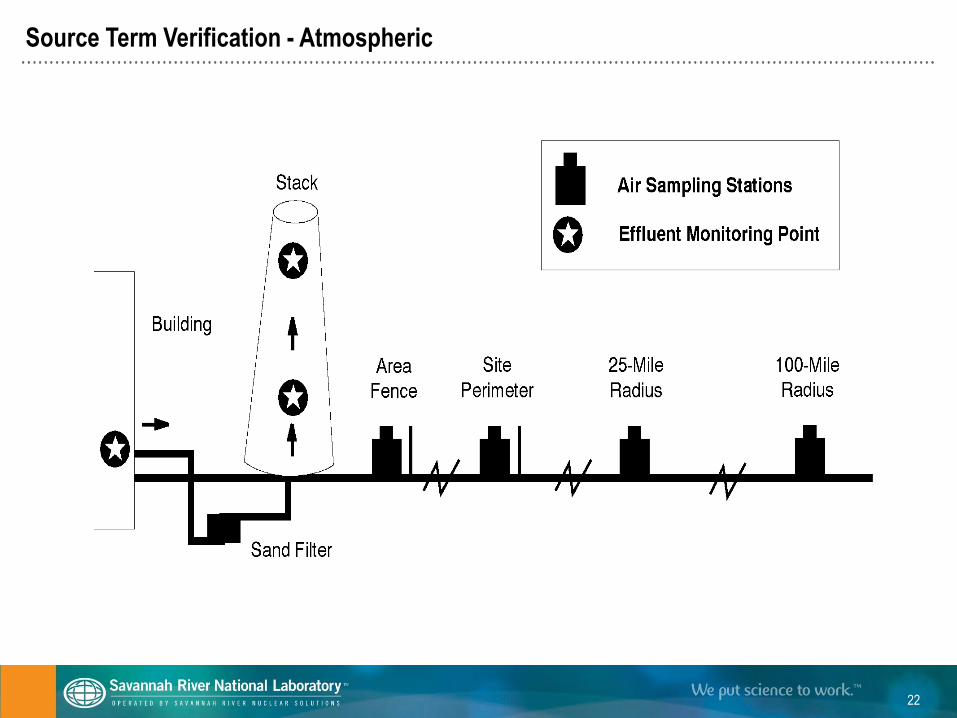
Source Term Verification - Atmospheric
22
Transport
Dose/Risk = (S • T • E • D• R)uvcp
• Transport (T) of contaminants as they move through the environment
– Estimates the concentration of contaminants in the environment at the point of
exposure or compliance
23
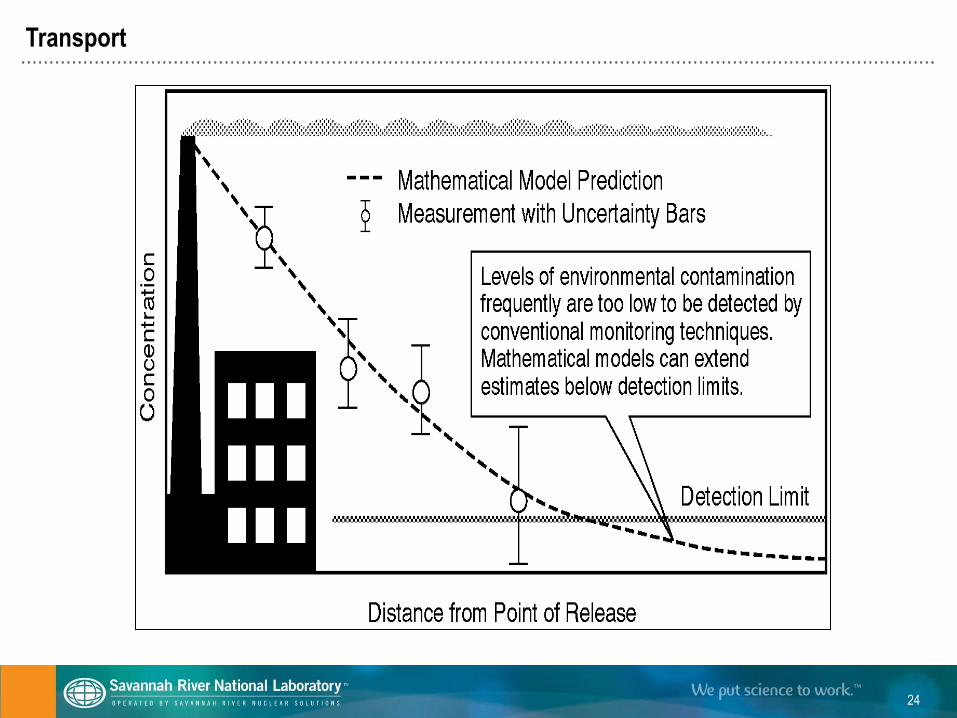
Transport
24
Transport
• Environmental Transport Models
• Simulate Complex Transport Phenomena
– Physical
– Chemical
– Biological
– Progressive Dilution or Bioaccumulation
25
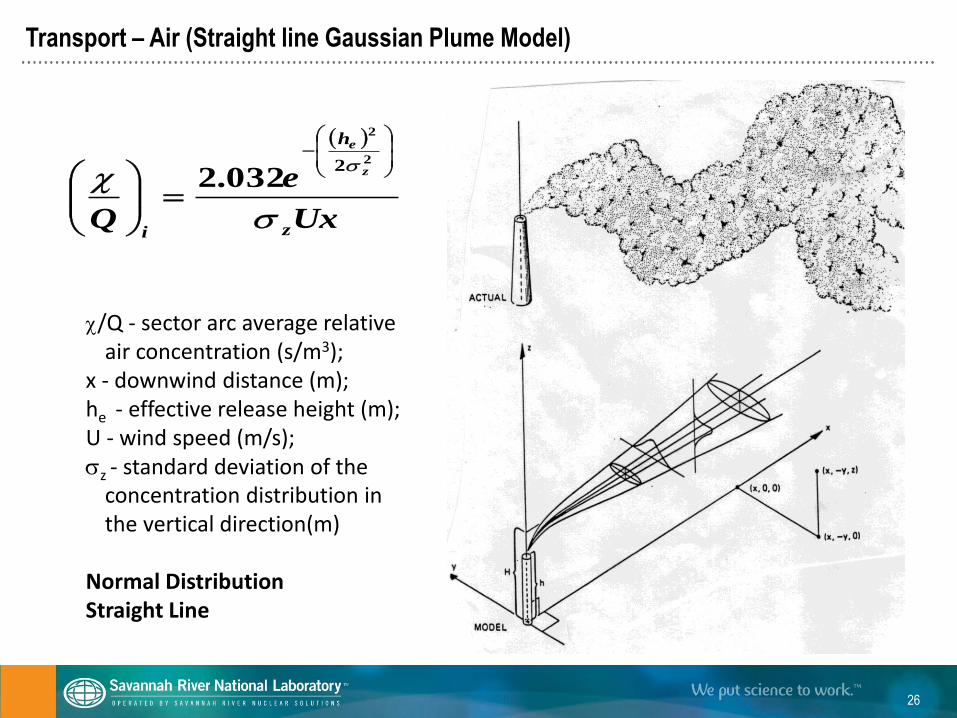
Transport – Air (Straight line Gaussian Plume Model)
26
Ux
e
Q z
h
i
z
e
2
2
2032.2
/Q - sector arc average relative air concentration (s/m3);
x - downwind distance (m); he - effective release height (m); U - wind speed (m/s); z - standard deviation of the
concentration distribution in the vertical direction(m)
Normal Distribution Straight Line
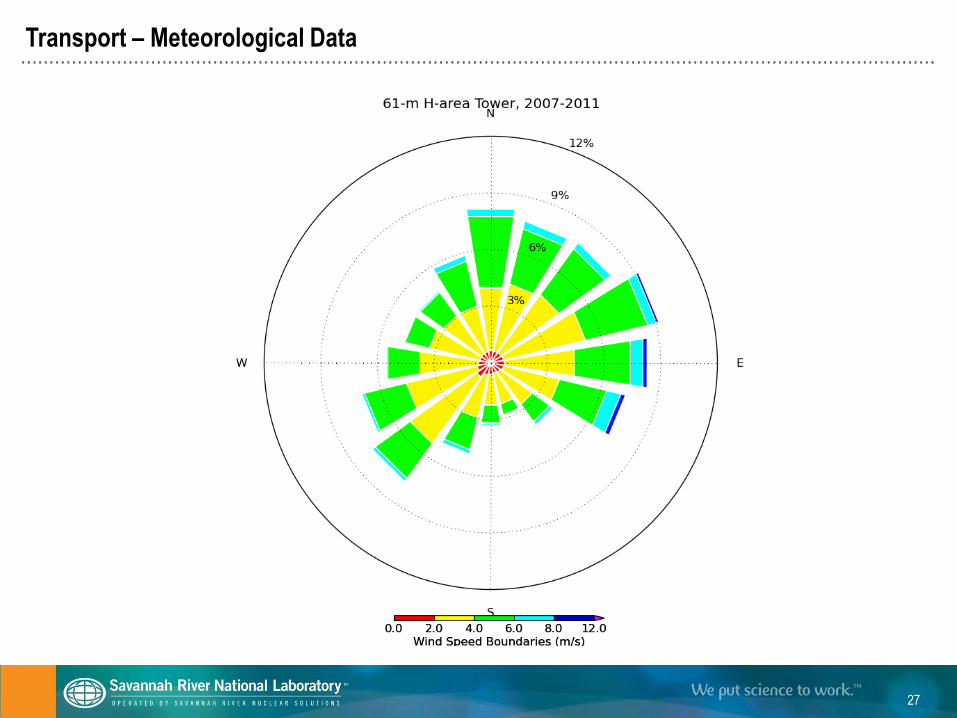
Transport – Meteorological Data
27
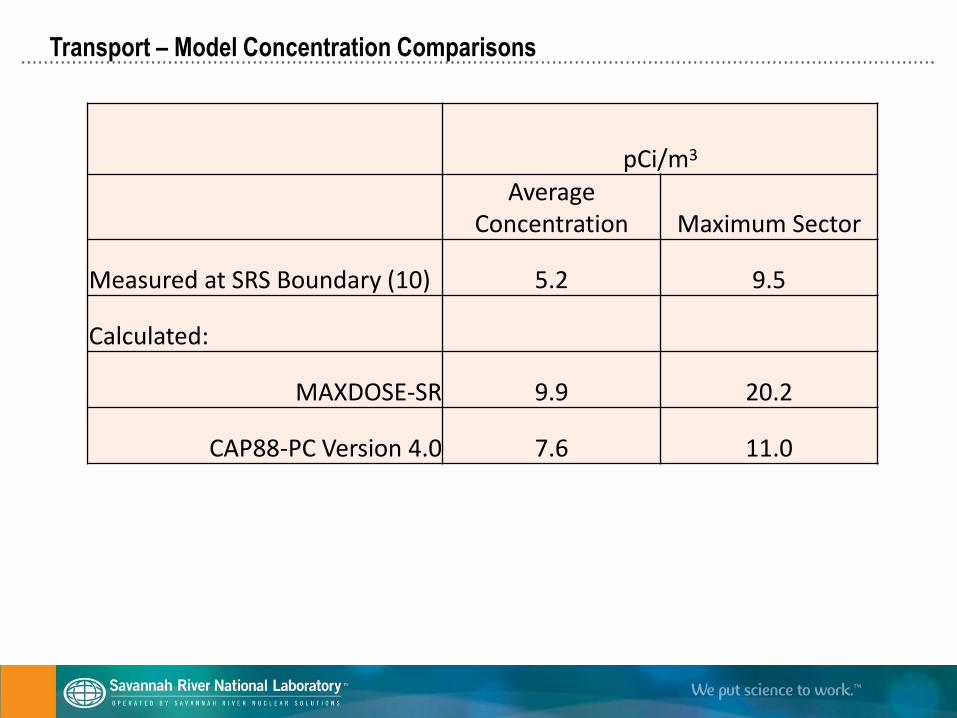
Transport – Model Concentration Comparisons
pCi/m3
Average Concentration Maximum Sector
Measured at SRS Boundary (10) 5.2 9.5
Calculated:
MAXDOSE-SR 9.9 20.2
CAP88-PC Version 4.0 7.6 11.0
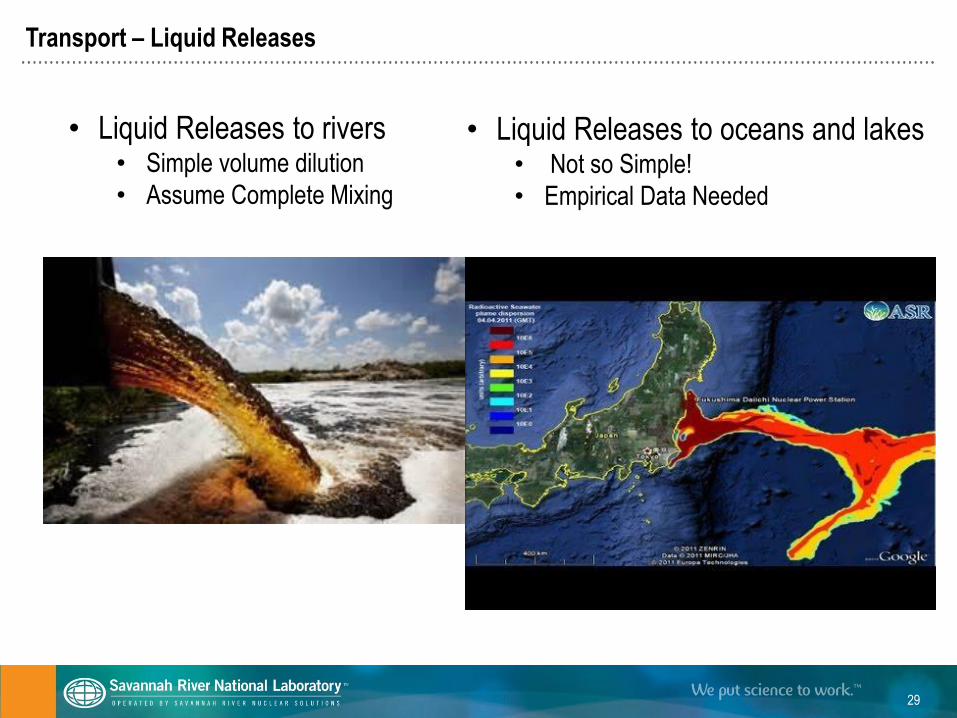
Transport – Liquid Releases
29
• Liquid Releases to rivers • Simple volume dilution
• Assume Complete Mixing
• Liquid Releases to oceans and lakes • Not so Simple!
• Empirical Data Needed
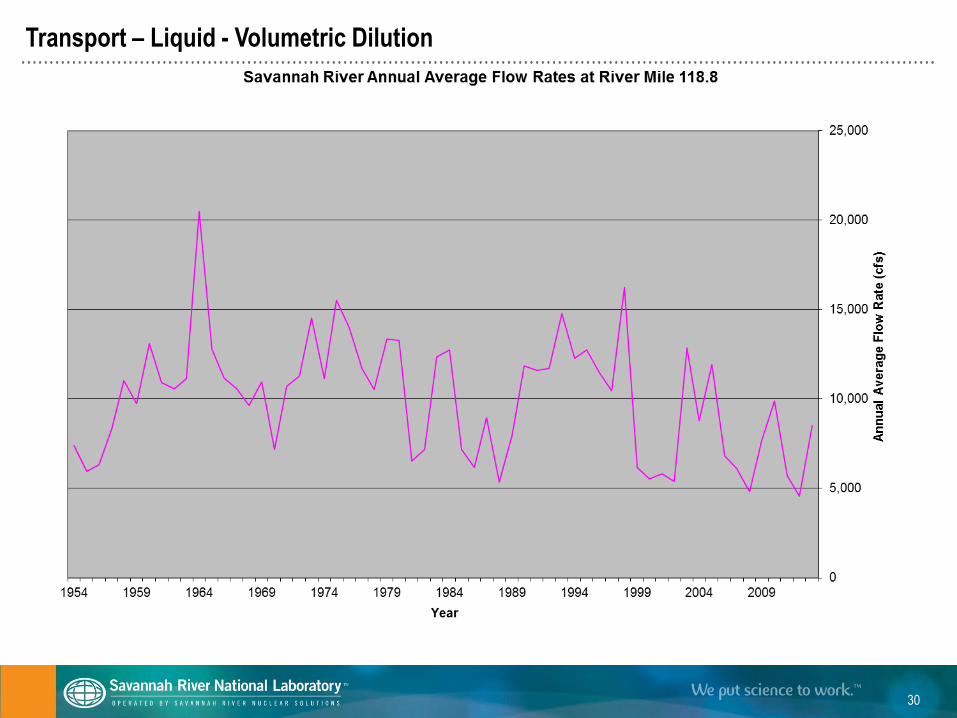
Transport – Liquid - Volumetric Dilution
30
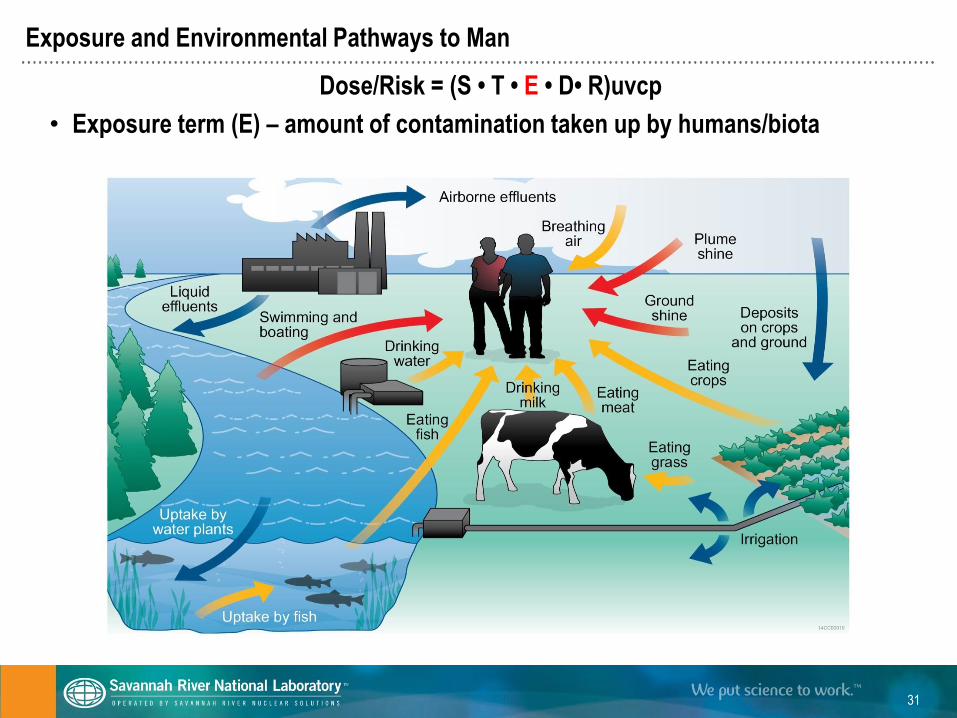
Exposure and Environmental Pathways to Man
Dose/Risk = (S • T • E • D• R)uvcp
• Exposure term (E) – amount of contamination taken up by humans/biota
31
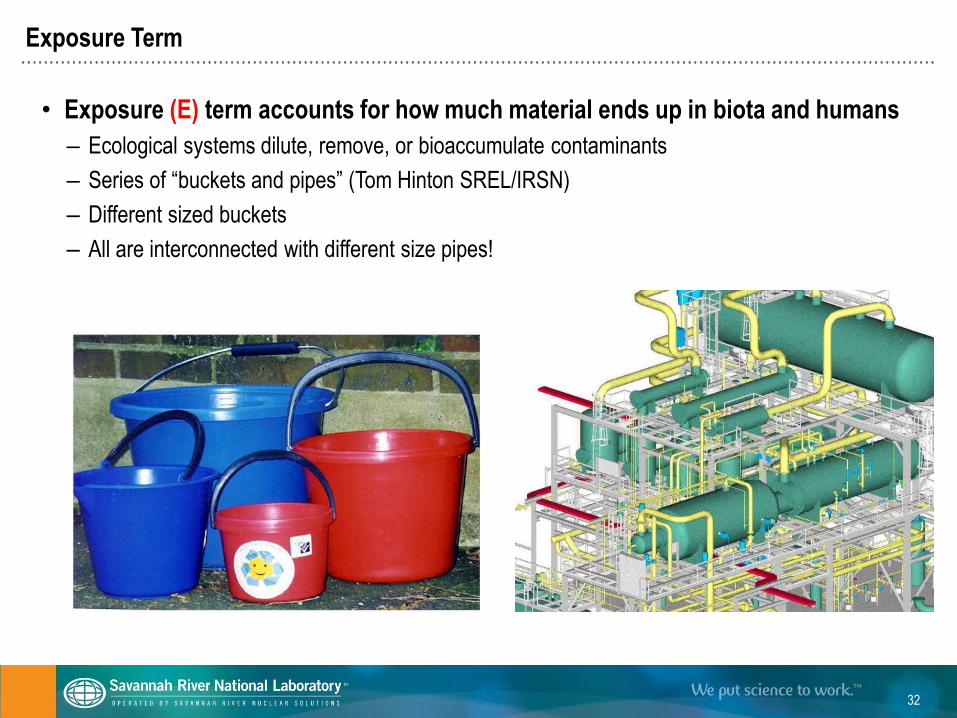
Exposure Term
• Exposure (E) term accounts for how much material ends up in biota and humans
– Ecological systems dilute, remove, or bioaccumulate contaminants
– Series of “buckets and pipes” (Tom Hinton SREL/IRSN)
– Different sized buckets
– All are interconnected with different size pipes!
32
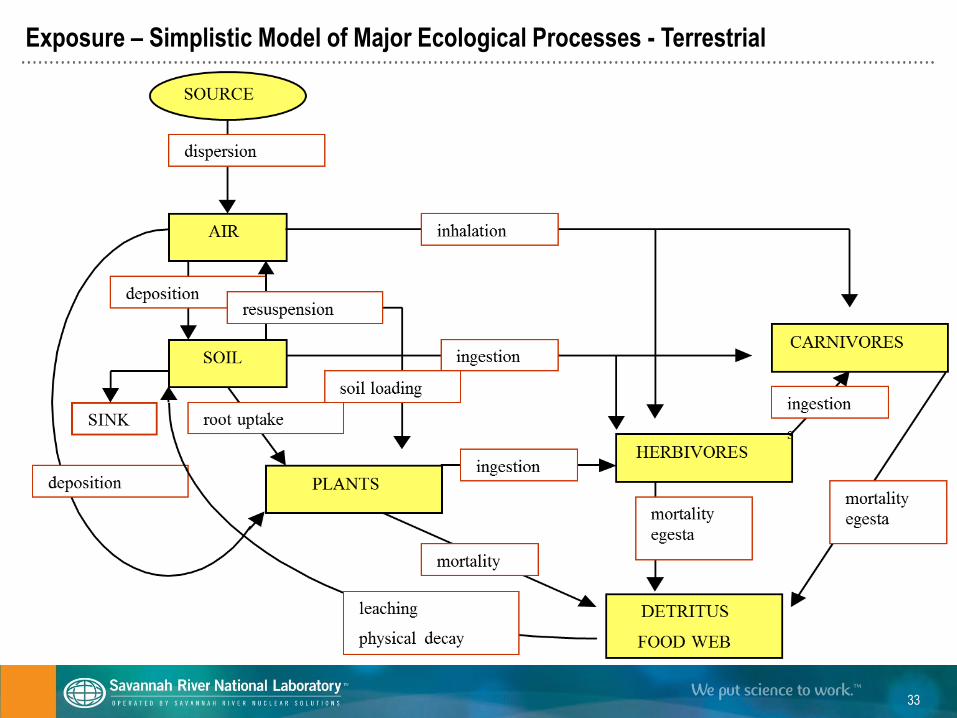
Exposure – Simplistic Model of Major Ecological Processes - Terrestrial
33
Dose Coefficients and Dose Terminology
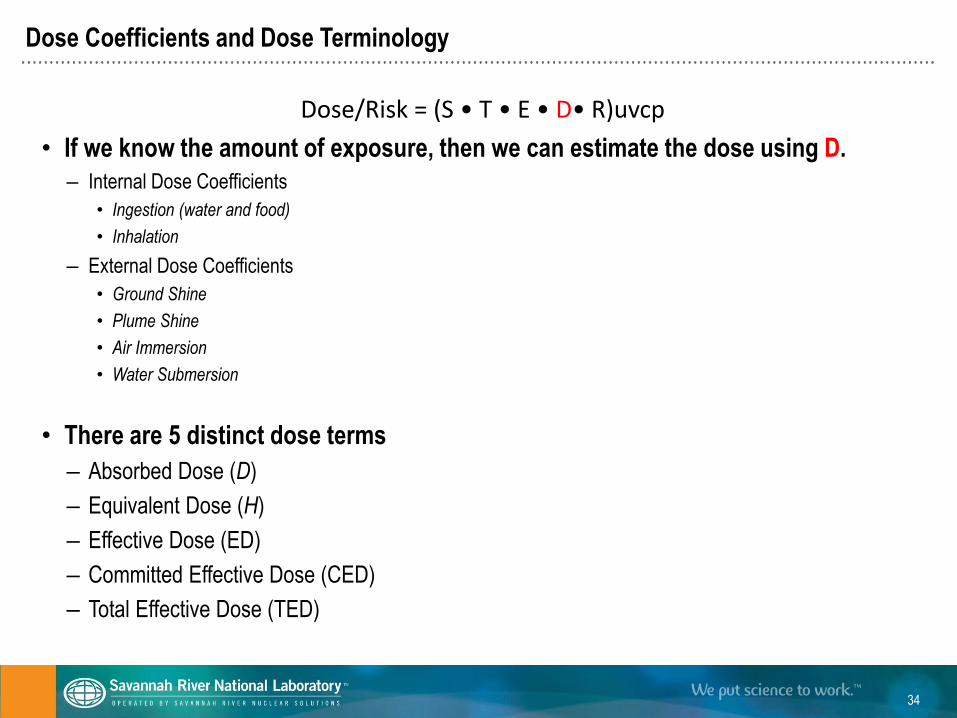
Dose/Risk = (S • T • E • D• R)uvcp
• If we know the amount of exposure, then we can estimate the dose using D.
– Internal Dose Coefficients
• Ingestion (water and food)
• Inhalation
– External Dose Coefficients
• Ground Shine
• Plume Shine
• Air Immersion
• Water Submersion
• There are 5 distinct dose terms
– Absorbed Dose (D)
– Equivalent Dose (H)
– Effective Dose (ED)
– Committed Effective Dose (CED)
– Total Effective Dose (TED)
34
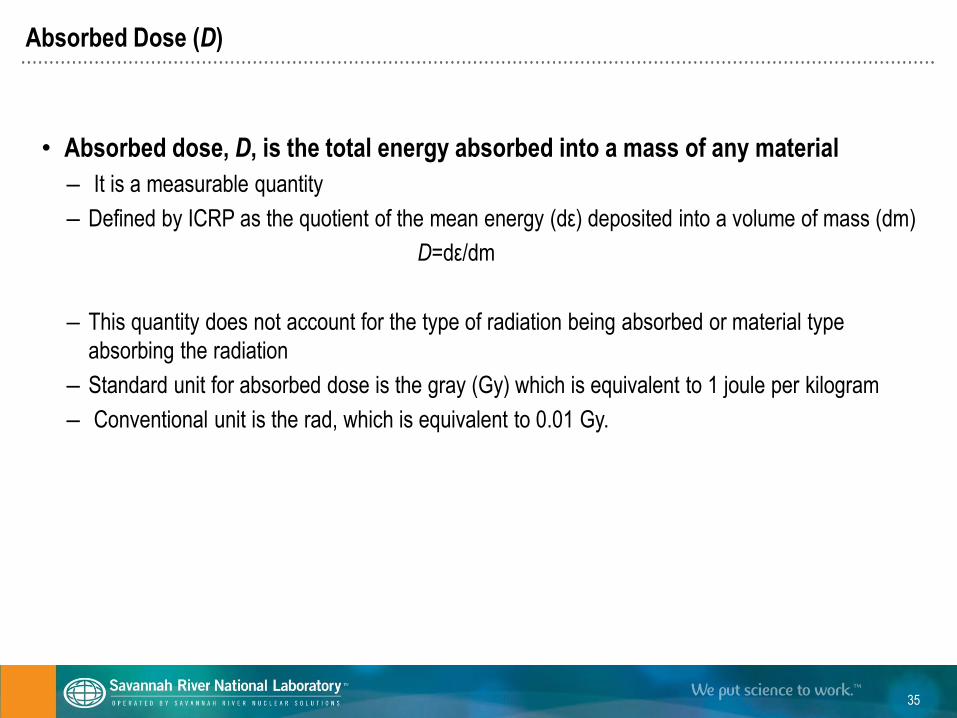
Absorbed Dose (D)
• Absorbed dose, D, is the total energy absorbed into a mass of any material
– It is a measurable quantity
– Defined by ICRP as the quotient of the mean energy (dε) deposited into a volume of mass (dm)
D=dε/dm
– This quantity does not account for the type of radiation being absorbed or material type
absorbing the radiation
– Standard unit for absorbed dose is the gray (Gy) which is equivalent to 1 joule per kilogram
– Conventional unit is the rad, which is equivalent to 0.01 Gy.
35
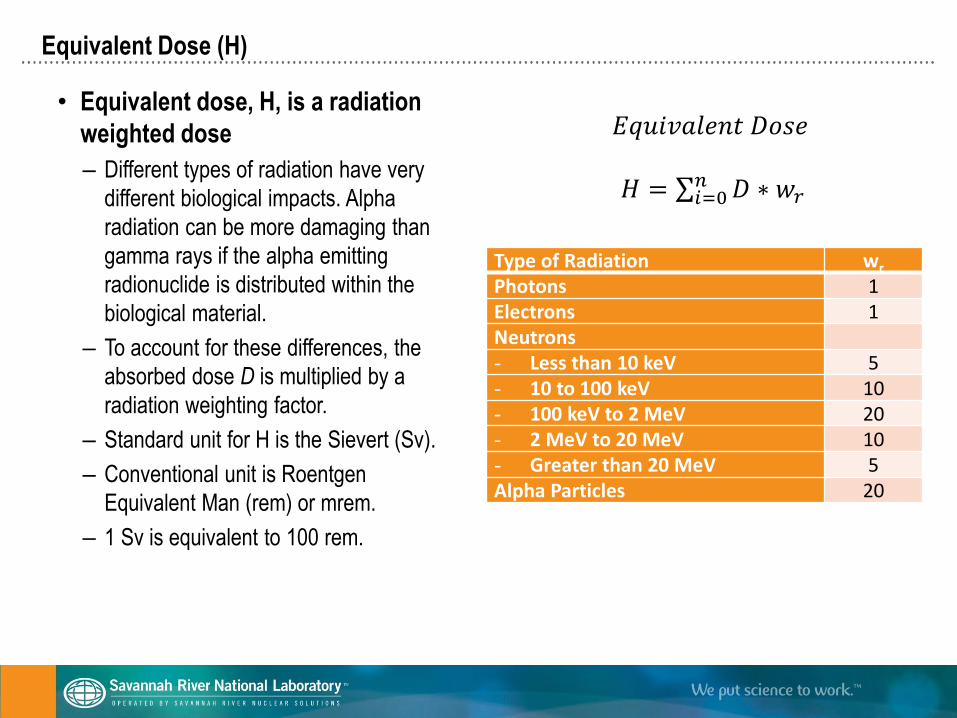
Equivalent Dose (H)
• Equivalent dose, H, is a radiation
weighted dose
– Different types of radiation have very
different biological impacts. Alpha
radiation can be more damaging than
gamma rays if the alpha emitting
radionuclide is distributed within the
biological material.
– To account for these differences, the
absorbed dose D is multiplied by a
radiation weighting factor.
– Standard unit for H is the Sievert (Sv).
– Conventional unit is Roentgen
Equivalent Man (rem) or mrem.
– 1 Sv is equivalent to 100 rem.
Type of Radiation wr
Photons 1
Electrons 1
Neutrons - Less than 10 keV 5
- 10 to 100 keV 10
- 100 keV to 2 MeV 20
- 2 MeV to 20 MeV 10
- Greater than 20 MeV 5
Alpha Particles 20
𝐸𝑞𝑢𝑖𝑣𝑎𝑙𝑒𝑛𝑡 𝐷𝑜𝑠𝑒
𝐻 = 𝐷 ∗ 𝑤𝑟𝑛𝑖=0
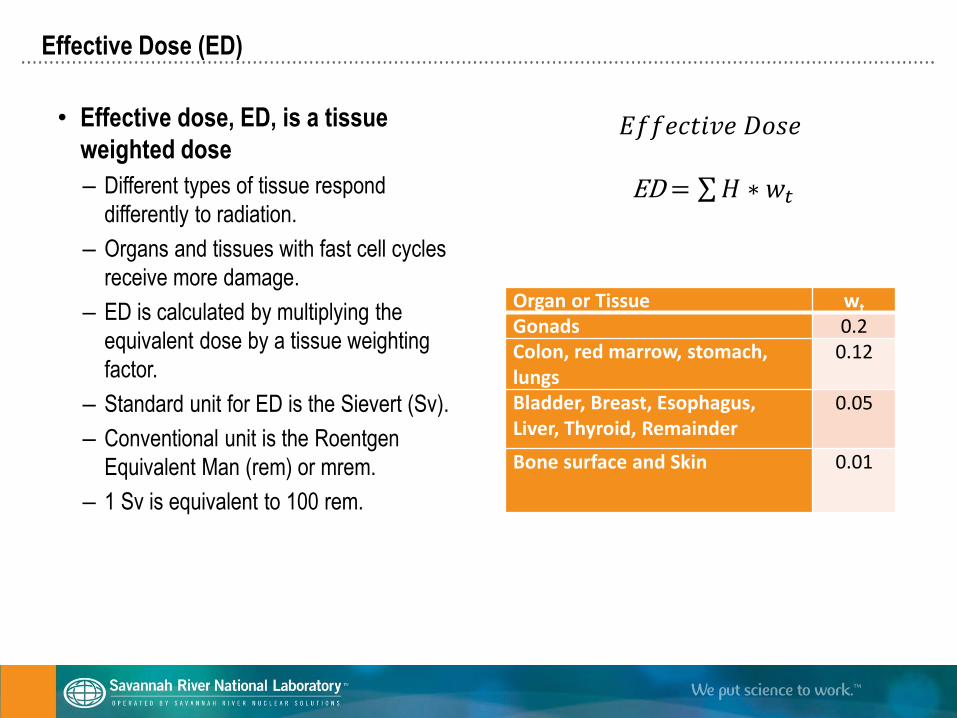
Effective Dose (ED)
• Effective dose, ED, is a tissue
weighted dose
– Different types of tissue respond
differently to radiation.
– Organs and tissues with fast cell cycles
receive more damage.
– ED is calculated by multiplying the
equivalent dose by a tissue weighting
factor.
– Standard unit for ED is the Sievert (Sv).
– Conventional unit is the Roentgen
Equivalent Man (rem) or mrem.
– 1 Sv is equivalent to 100 rem.
𝐸𝑓𝑓𝑒𝑐𝑡𝑖𝑣𝑒 𝐷𝑜𝑠𝑒
ED = 𝐻 ∗ 𝑤𝑡
Organ or Tissue wt
Gonads 0.2
Colon, red marrow, stomach, lungs
0.12
Bladder, Breast, Esophagus, Liver, Thyroid, Remainder
0.05
Bone surface and Skin 0.01
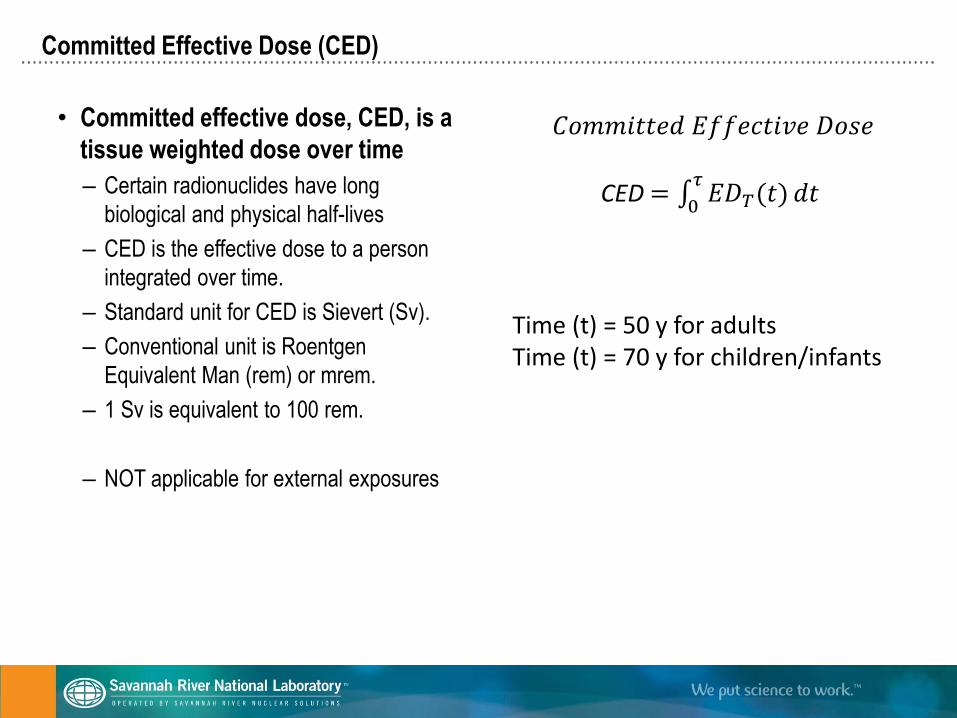
Committed Effective Dose (CED)
• Committed effective dose, CED, is a
tissue weighted dose over time
– Certain radionuclides have long
biological and physical half-lives
– CED is the effective dose to a person
integrated over time.
– Standard unit for CED is Sievert (Sv).
– Conventional unit is Roentgen
Equivalent Man (rem) or mrem.
– 1 Sv is equivalent to 100 rem.
– NOT applicable for external exposures
𝐶𝑜𝑚𝑚𝑖𝑡𝑡𝑒𝑑 𝐸𝑓𝑓𝑒𝑐𝑡𝑖𝑣𝑒 𝐷𝑜𝑠𝑒
CED = 𝐸𝐷𝑇(𝑡)𝜏
0𝑑𝑡
Time (t) = 50 y for adults Time (t) = 70 y for children/infants
Total Effective Dose (TED)
• Total effective dose, TED, is the sum of the effective dose from external exposures
and the CED from internal exposures
• TED is used to demonstrate compliance with required dose limits.
• Standard unit for TED is the Sievert (Sv)
• Conventional unit is the rem or mrem
– 1 Sv is equivalent to 100 rem.
39
Human Health Risk Conversion
Dose/Risk = (S • T • E • D• R)uvcp
• Dose is converted to risk (R) using coefficients developed over many years
– Atomic bomb survivor studies
– Medical radiation studies
– Occupational studies
• Nuclear Industry
• Mayak workers
• Chernobyl cleanup workers
• Airline
• Medical/Dental
– Environmental Radiation studies
• High background
• Fallout
40
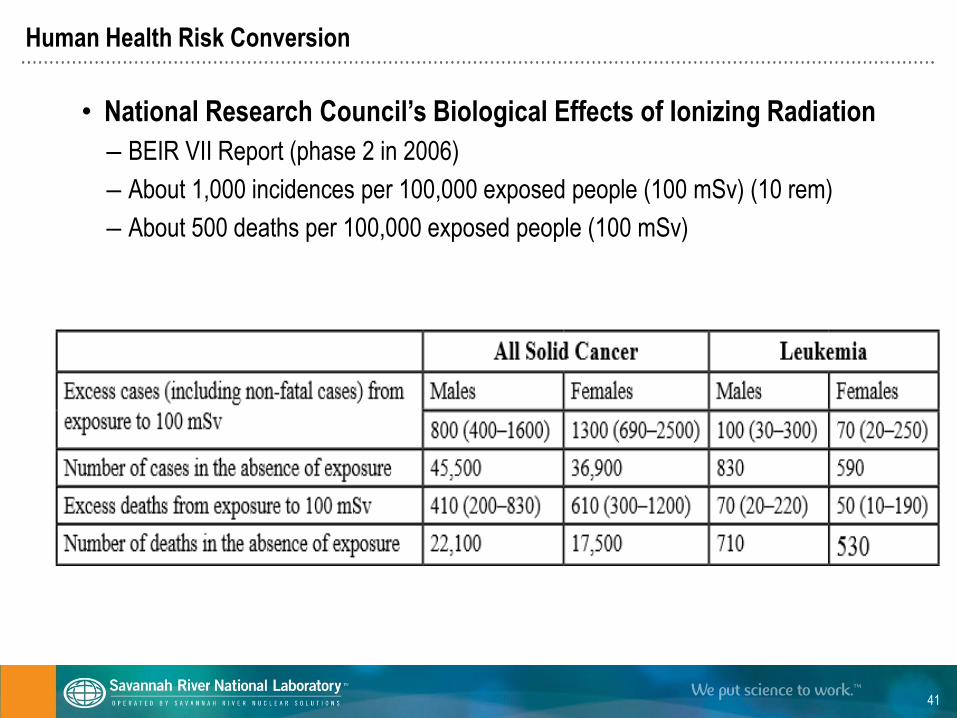
Human Health Risk Conversion
• National Research Council’s Biological Effects of Ionizing Radiation
– BEIR VII Report (phase 2 in 2006)
– About 1,000 incidences per 100,000 exposed people (100 mSv) (10 rem)
– About 500 deaths per 100,000 exposed people (100 mSv)
41
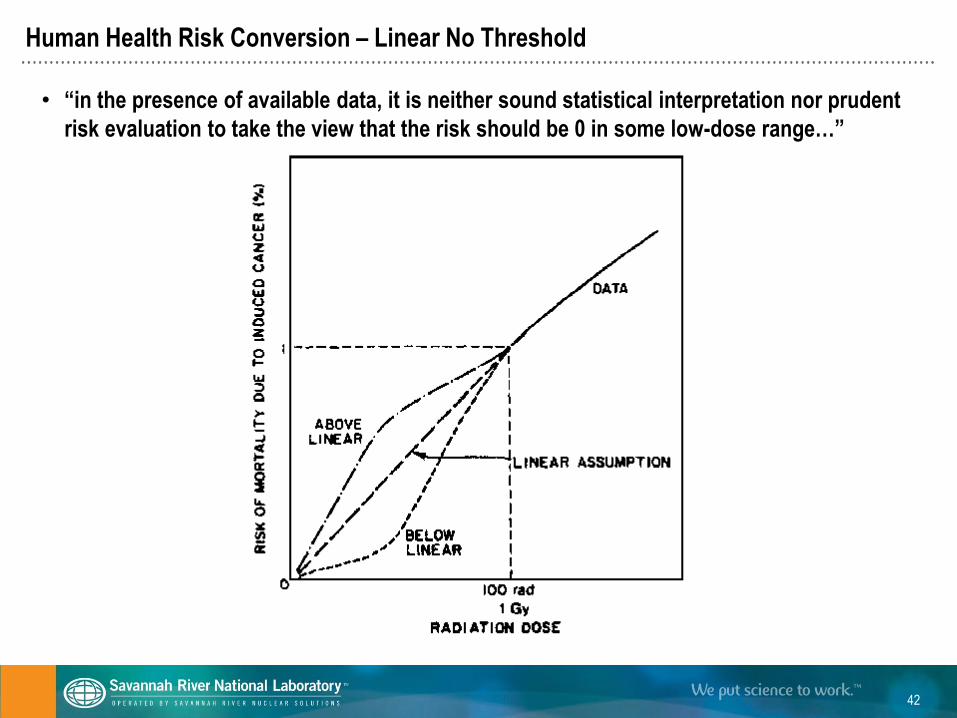
Human Health Risk Conversion – Linear No Threshold
• “in the presence of available data, it is neither sound statistical interpretation nor prudent
risk evaluation to take the view that the risk should be 0 in some low-dose range…”
42
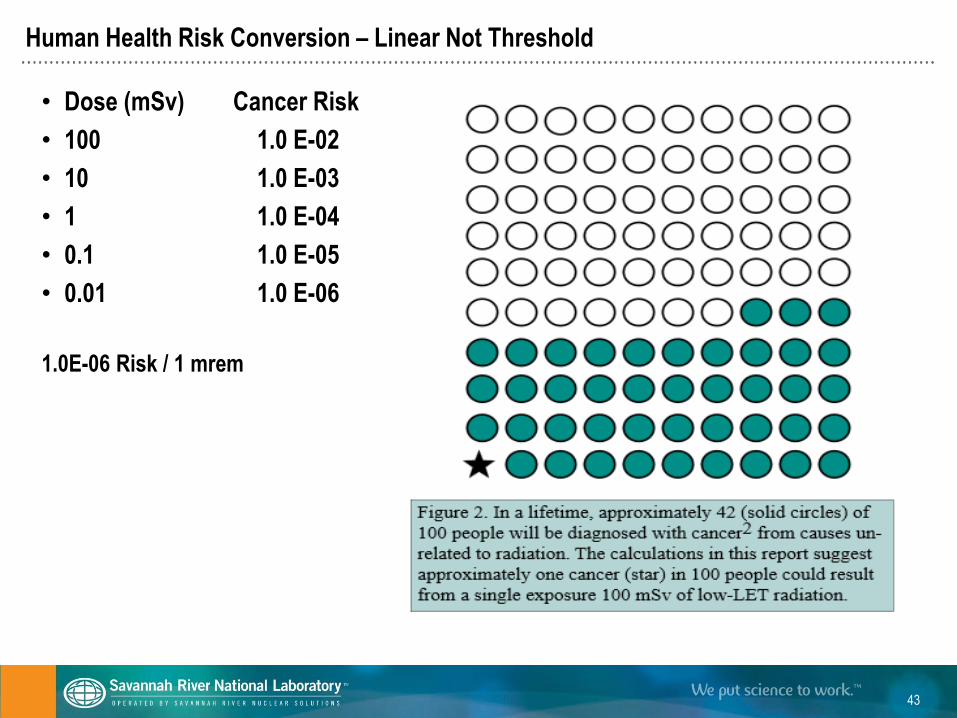
Human Health Risk Conversion – Linear Not Threshold
• Dose (mSv) Cancer Risk
• 100 1.0 E-02
• 10 1.0 E-03
• 1 1.0 E-04
• 0.1 1.0 E-05
• 0.01 1.0 E-06
1.0E-06 Risk / 1 mrem
43
Other Mitigating Factors
Dose/Risk = (S • T • E • D• R)uvcp
• Uncertainty (u) is related to all of the basic elements in the risk assessment
equation. Uncertainty calculations have changed this science in the last two
decades more than anything.
– Most regulations and laws require deterministic calculations
• 100 mrem/y public dose limit
• Validation (v) includes taking environmental measurement data and using these
data to help confirm the model calculations.
– SRS is able to do this with tritium oxide measurements
• Finally, communication (c) of what we do and participation (p) of stakeholders are
important in helping people understand the meaning of risk estimates from
exposure to radiation in the environment.
44
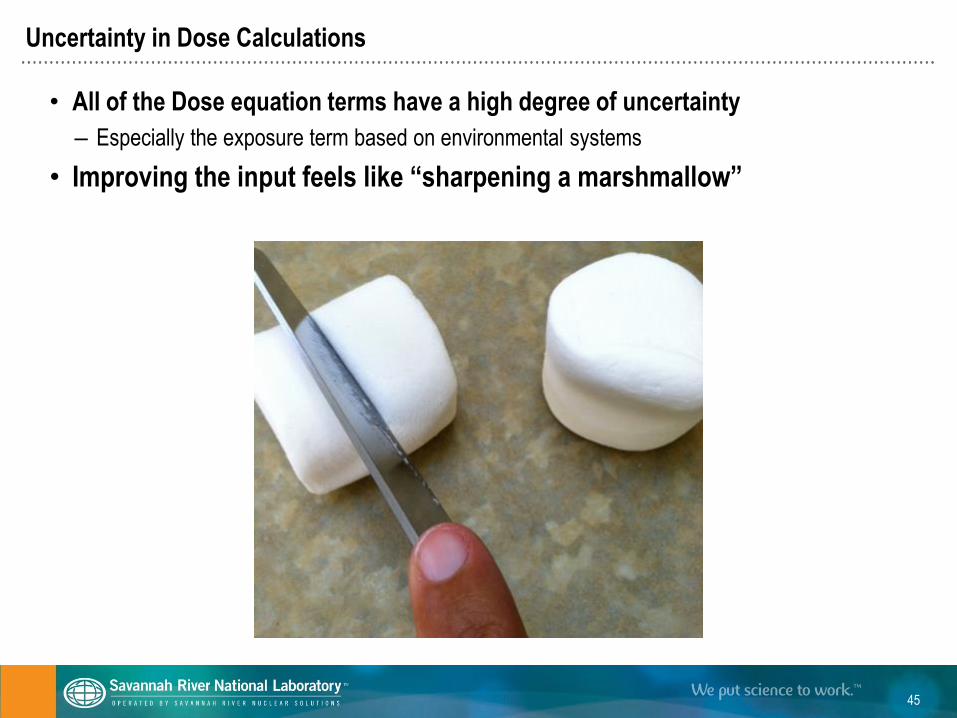
Uncertainty in Dose Calculations
• All of the Dose equation terms have a high degree of uncertainty
– Especially the exposure term based on environmental systems
• Improving the input feels like “sharpening a marshmallow”
45
3) SRS-Specific Reference Person - Outline
• The Reference Person History and Definition
• Dose Coefficients
• Intake Rates
• Dose Comparisons
• Conclusion and Discussion
Daniel Stone – Graduate Student at Oregon State University
2012 Summer Intern
Basis of his Masters Thesis
Published in most recent HPS Operational Radiation Safety
Department of Energy Order 458.1
• Establishes an Annual Public Dose Limit of 100 mrem (1 mSv) and states that:
• “Compliance may be demonstrated by calculating dose to the representative
person or to the maximally exposed individual (MEI).”
• SRS historically used the MEI
• Adult Male Usage Factors
• Adult Male/Female Dose Coefficients
• This project was to develop a SRS Reference Person Usage Factors
• To be used for calculating a dose to the representative person
Reference Person History
• Standard Man – 1960
– ICRP 2
– Average biological and dosimetric parameters
– Consistent and reproducible dose calculations to workers
• Reference Man – 1974
– Updated, ICRP 23
– Improved biokinetic models and dosimetric models
– Adult worker
– Data widely used
Representative Person History
• Reference “persons” – 2002
⁻ Updated in ICRP 89
⁻ Created male and female reference persons
⁻ Six age groups, each group with specific reference values
⁻ Provides the data for determining Reference Individual or Person
• Representative Person – 2005
– ICRP 101
– Introduction of the representative person
– ICRP 103 (2007)
– formally recommended use of the representative person
– DOE Order 458.1 (2011)
– allows use of representative person
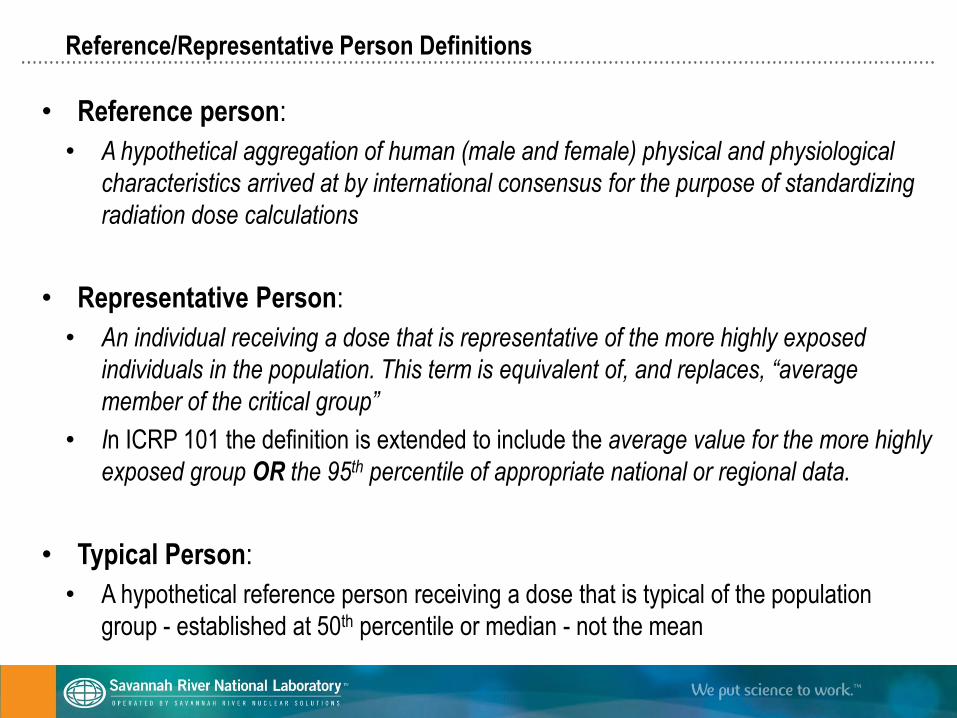
Reference/Representative Person Definitions
• Reference person:
• A hypothetical aggregation of human (male and female) physical and physiological
characteristics arrived at by international consensus for the purpose of standardizing
radiation dose calculations
• Representative Person:
• An individual receiving a dose that is representative of the more highly exposed
individuals in the population. This term is equivalent of, and replaces, “average
member of the critical group”
• In ICRP 101 the definition is extended to include the average value for the more highly
exposed group OR the 95th percentile of appropriate national or regional data.
• Typical Person:
• A hypothetical reference person receiving a dose that is typical of the population
group - established at 50th percentile or median - not the mean
Reference Person Dose Coefficients
• DOE-STD-1196-2011, Dr. Keith Eckerman at ORNL
• Internal Reference Person Dose Coefficients
– First time age-weighted reference person used in US DOE regulations
– Updated dose coefficients
– Based on ICRP 107 Nuclear Data for dose coefficients and ICRP 89 reference
values
• Age-Specific Dose coefficients updated from ICRP 72
– For Compliance - DOE-HQ recommended use of Water Ingestion dose coefficients
for all ingestion pathways
– Nearly all dose coefficients went up because of the incorporation of children
• External Dose Coefficients used from EPA’s DC_PAC3 toolbox
– Based on ICRP 107 Nuclear Data
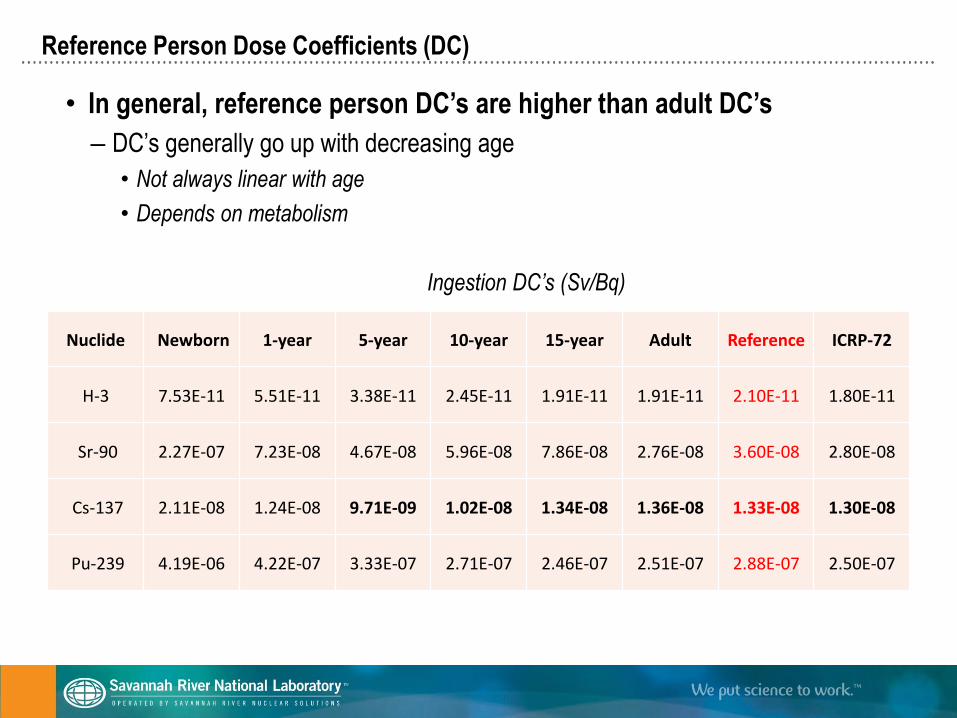
Reference Person Dose Coefficients (DC)
• In general, reference person DC’s are higher than adult DC’s
– DC’s generally go up with decreasing age
• Not always linear with age
• Depends on metabolism
Ingestion DC’s (Sv/Bq)
Nuclide Newborn 1-year 5-year 10-year 15-year Adult Reference ICRP-72
H-3 7.53E-11 5.51E-11 3.38E-11 2.45E-11 1.91E-11 1.91E-11 2.10E-11 1.80E-11
Sr-90 2.27E-07 7.23E-08 4.67E-08 5.96E-08 7.86E-08 2.76E-08 3.60E-08 2.80E-08
Cs-137 2.11E-08 1.24E-08 9.71E-09 1.02E-08 1.34E-08 1.36E-08 1.33E-08 1.30E-08
Pu-239 4.19E-06 4.22E-07 3.33E-07 2.71E-07 2.46E-07 2.51E-07 2.88E-07 2.50E-07
Development of SRS Reference Person Usage Parameters
• Several important parameters needed
– Population fractions by age and sex
• 2010 US Census for SC and GA
– Intake/Usage Rates for individuals by age and sex
• 2011 EPA Exposure Factors Handbook
• ICRP 89 for Reference Person Physical Characteristics
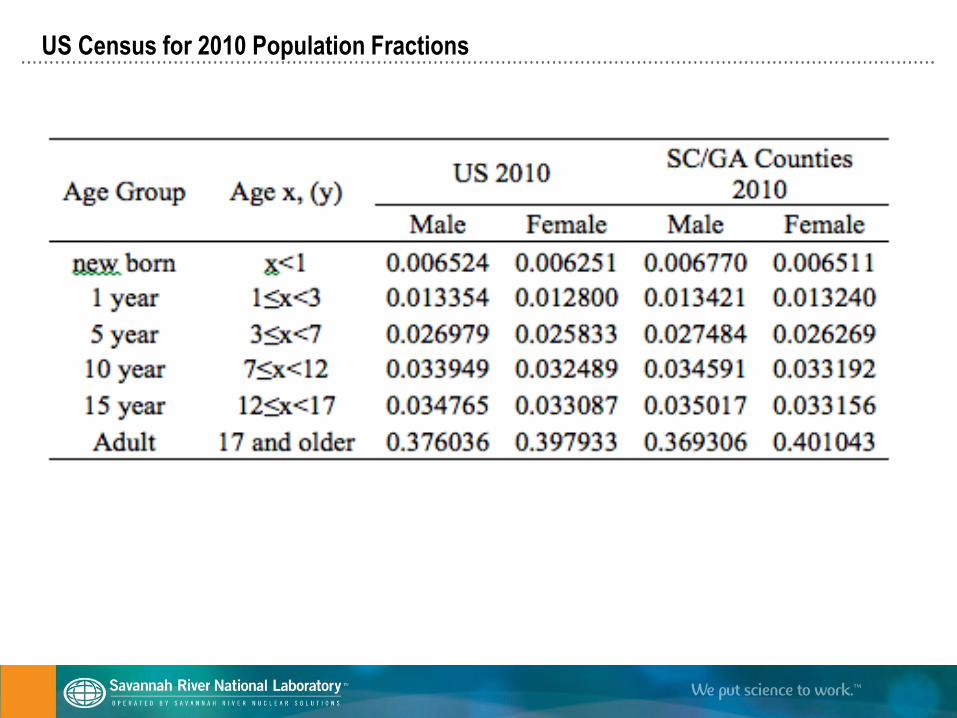
US Census for 2010 Population Fractions
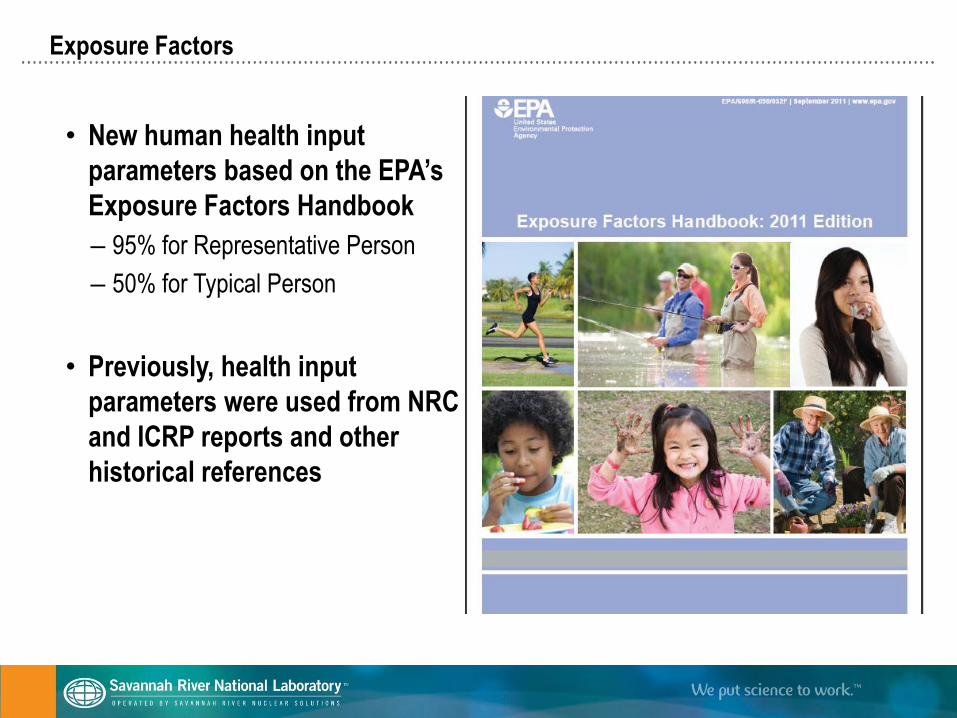
Exposure Factors
• New human health input
parameters based on the EPA’s
Exposure Factors Handbook
– 95% for Representative Person
– 50% for Typical Person
• Previously, health input
parameters were used from NRC
and ICRP reports and other
historical references
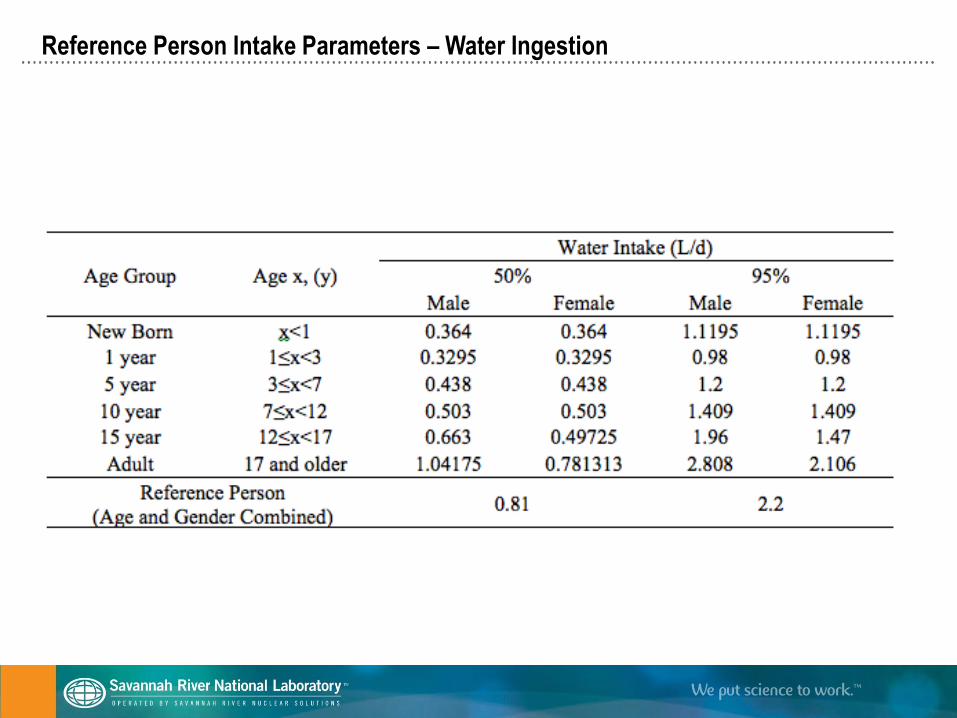
Reference Person Intake Parameters – Water Ingestion
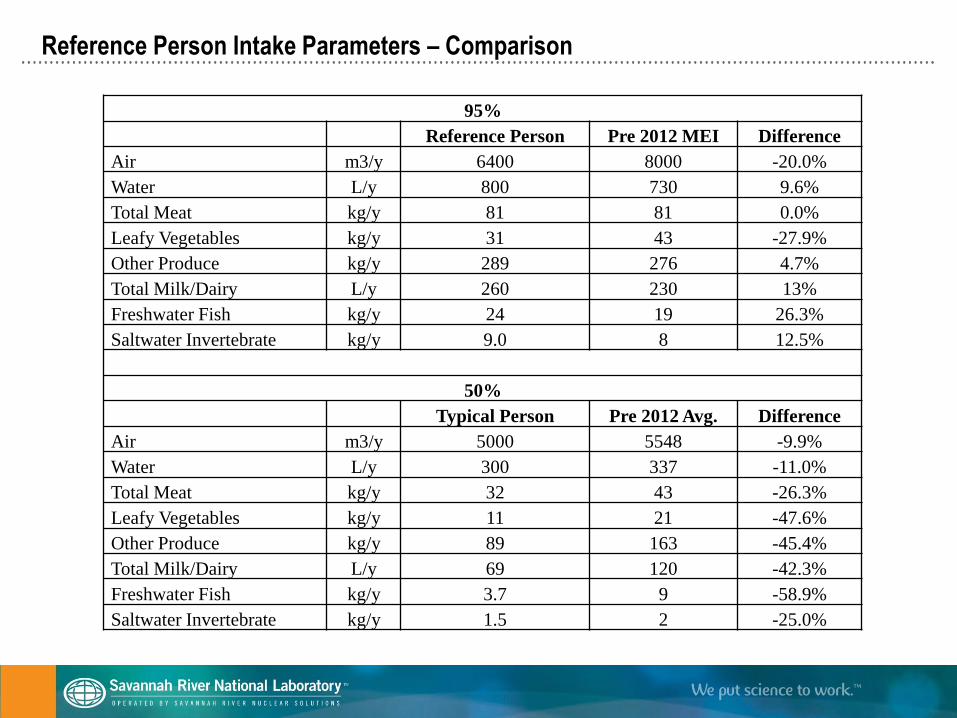
Reference Person Intake Parameters – Comparison
95%
Reference Person Pre 2012 MEI Difference
Air m3/y 6400 8000 -20.0%
Water L/y 800 730 9.6%
Total Meat kg/y 81 81 0.0%
Leafy Vegetables kg/y 31 43 -27.9%
Other Produce kg/y 289 276 4.7%
Total Milk/Dairy L/y 260 230 13%
Freshwater Fish kg/y 24 19 26.3%
Saltwater Invertebrate kg/y 9.0 8 12.5%
50%
Typical Person Pre 2012 Avg. Difference
Air m3/y 5000 5548 -9.9%
Water L/y 300 337 -11.0%
Total Meat kg/y 32 43 -26.3%
Leafy Vegetables kg/y 11 21 -47.6%
Other Produce kg/y 89 163 -45.4%
Total Milk/Dairy L/y 69 120 -42.3%
Freshwater Fish kg/y 3.7 9 -58.9%
Saltwater Invertebrate kg/y 1.5 2 -25.0%
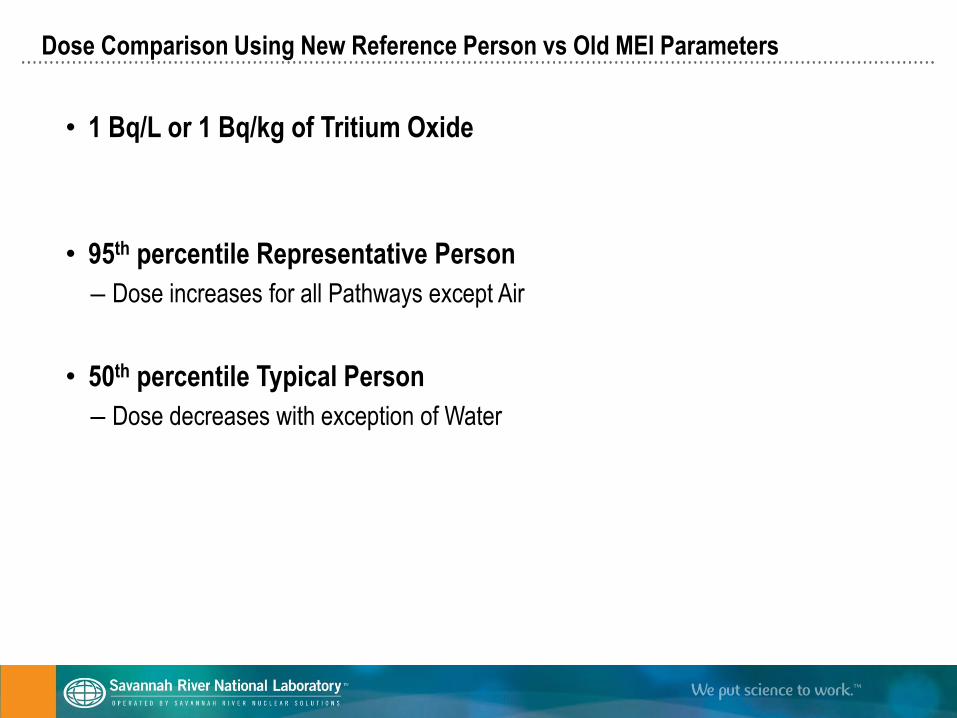
Dose Comparison Using New Reference Person vs Old MEI Parameters
• 1 Bq/L or 1 Bq/kg of Tritium Oxide
• 95th percentile Representative Person
– Dose increases for all Pathways except Air
• 50th percentile Typical Person
– Dose decreases with exception of Water
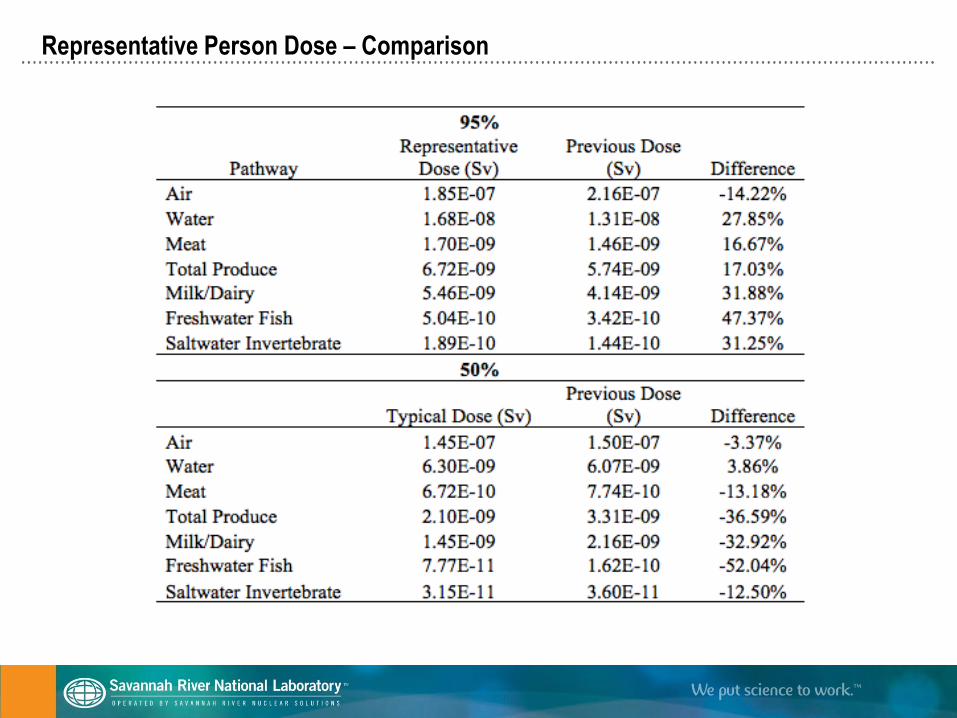
Representative Person Dose – Comparison
Reference Person Parameters - Conclusions
• SRS-specific intake parameters developed for use
• Internal DC’s established based on DOE recommendation
– Reference Person
• External DC’s only updated to new nuclear data in ICRP 107
– No age specific external DC’s
–
• Reference Person Parameters now being used for demonstrating
compliance with DOE O 458.1
– 1mSv/year limit to the Representative Person
4) CAP88 PC Version 4.0 - Outline
• CAP88 Background
• Comparison of Version 4.0 and 3.0
• Conclusions
• Georgia Regents University Nuclear Track Program 2013 interns
– Chris Sailors
– Levi Johnson
– Tammy Gussio
– John O’Meara
– Professor Joe Newton
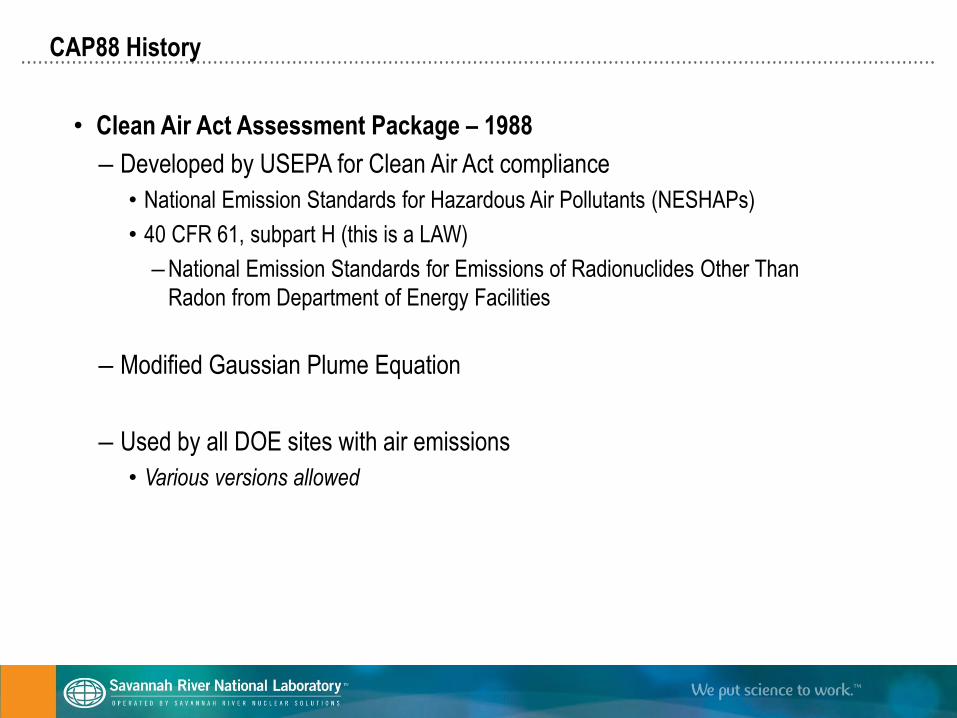
CAP88 History
• Clean Air Act Assessment Package – 1988
– Developed by USEPA for Clean Air Act compliance
• National Emission Standards for Hazardous Air Pollutants (NESHAPs)
• 40 CFR 61, subpart H (this is a LAW)
–National Emission Standards for Emissions of Radionuclides Other Than
Radon from Department of Energy Facilities
– Modified Gaussian Plume Equation
– Used by all DOE sites with air emissions
• Various versions allowed
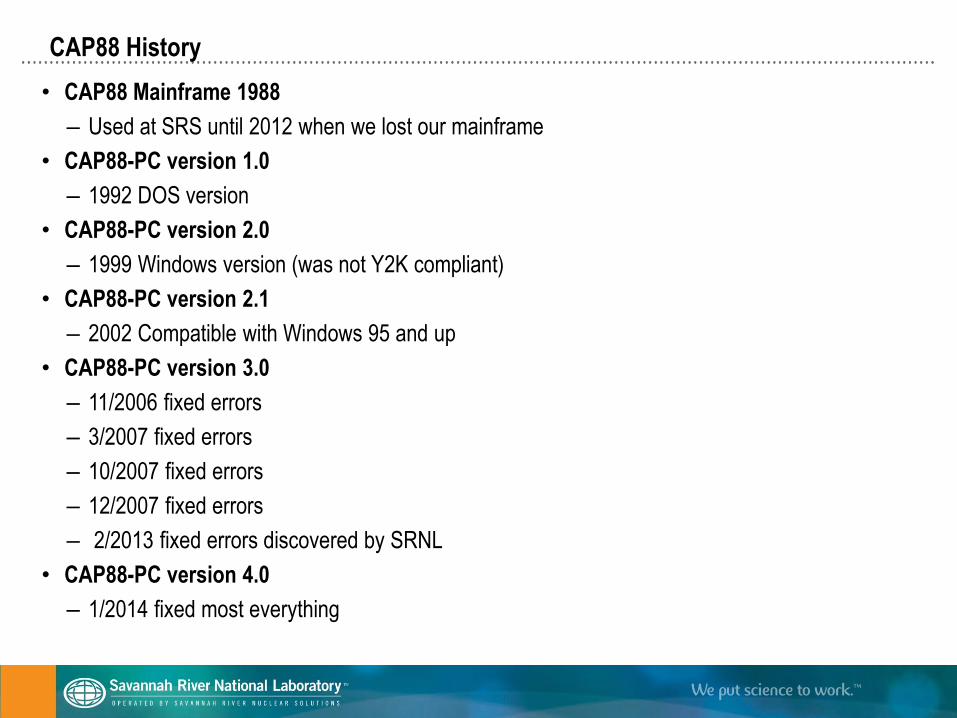
CAP88 History
• CAP88 Mainframe 1988
– Used at SRS until 2012 when we lost our mainframe
• CAP88-PC version 1.0
– 1992 DOS version
• CAP88-PC version 2.0
– 1999 Windows version (was not Y2K compliant)
• CAP88-PC version 2.1
– 2002 Compatible with Windows 95 and up
• CAP88-PC version 3.0
– 11/2006 fixed errors
– 3/2007 fixed errors
– 10/2007 fixed errors
– 12/2007 fixed errors
– 2/2013 fixed errors discovered by SRNL
• CAP88-PC version 4.0
– 1/2014 fixed most everything
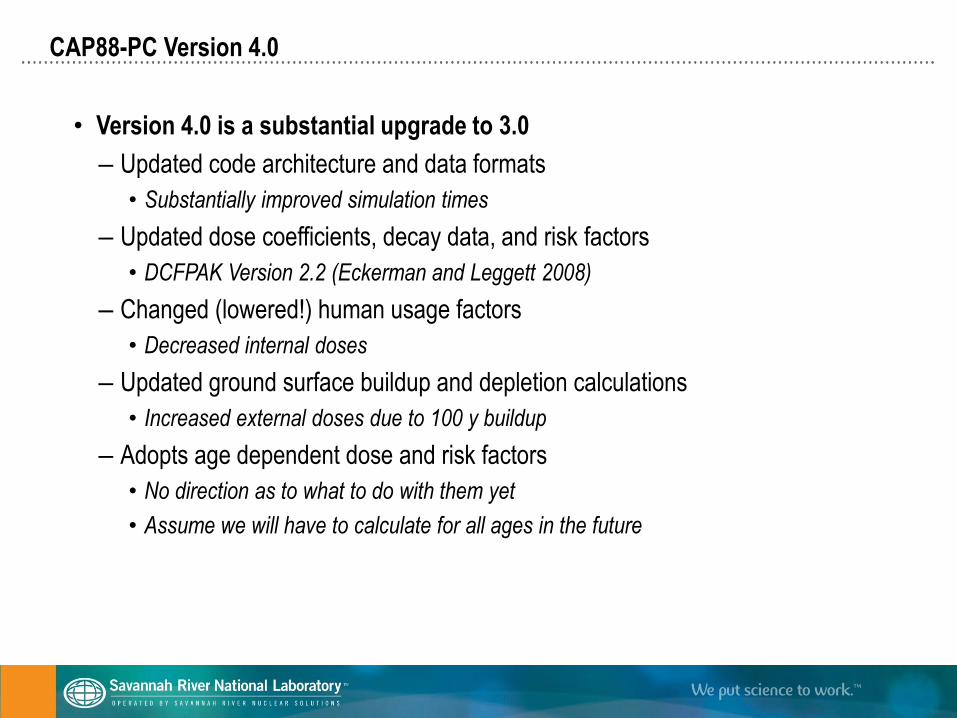
CAP88-PC Version 4.0
• Version 4.0 is a substantial upgrade to 3.0
– Updated code architecture and data formats
• Substantially improved simulation times
– Updated dose coefficients, decay data, and risk factors
• DCFPAK Version 2.2 (Eckerman and Leggett 2008)
– Changed (lowered!) human usage factors
• Decreased internal doses
– Updated ground surface buildup and depletion calculations
• Increased external doses due to 100 y buildup
– Adopts age dependent dose and risk factors
• No direction as to what to do with them yet
• Assume we will have to calculate for all ages in the future
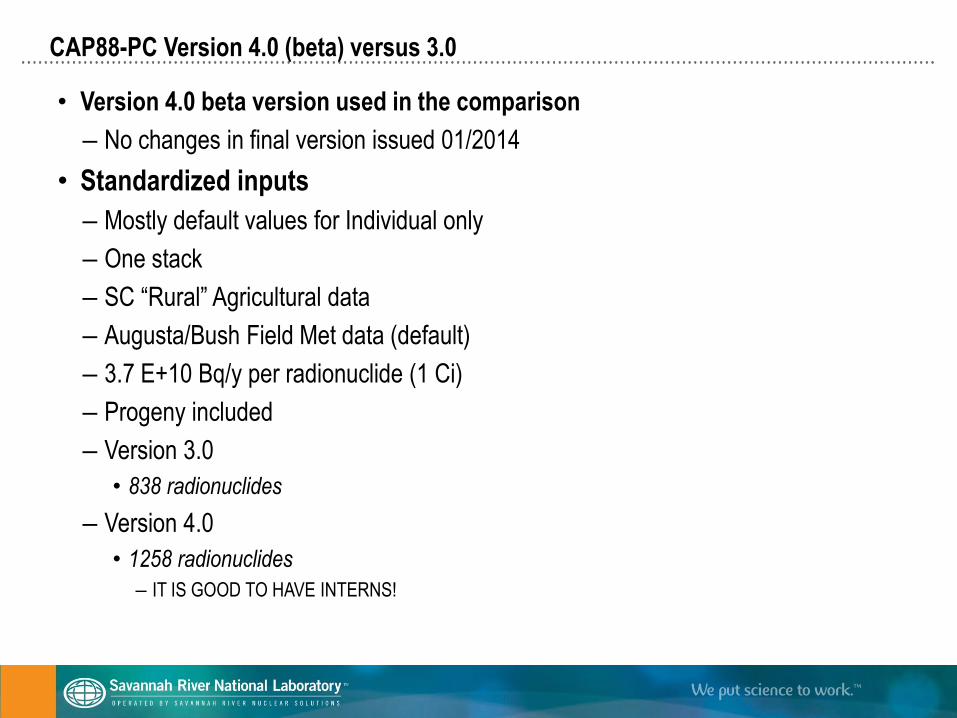
CAP88-PC Version 4.0 (beta) versus 3.0
• Version 4.0 beta version used in the comparison
– No changes in final version issued 01/2014
• Standardized inputs
– Mostly default values for Individual only
– One stack
– SC “Rural” Agricultural data
– Augusta/Bush Field Met data (default)
– 3.7 E+10 Bq/y per radionuclide (1 Ci)
– Progeny included
– Version 3.0
• 838 radionuclides
– Version 4.0
• 1258 radionuclides
– IT IS GOOD TO HAVE INTERNS!
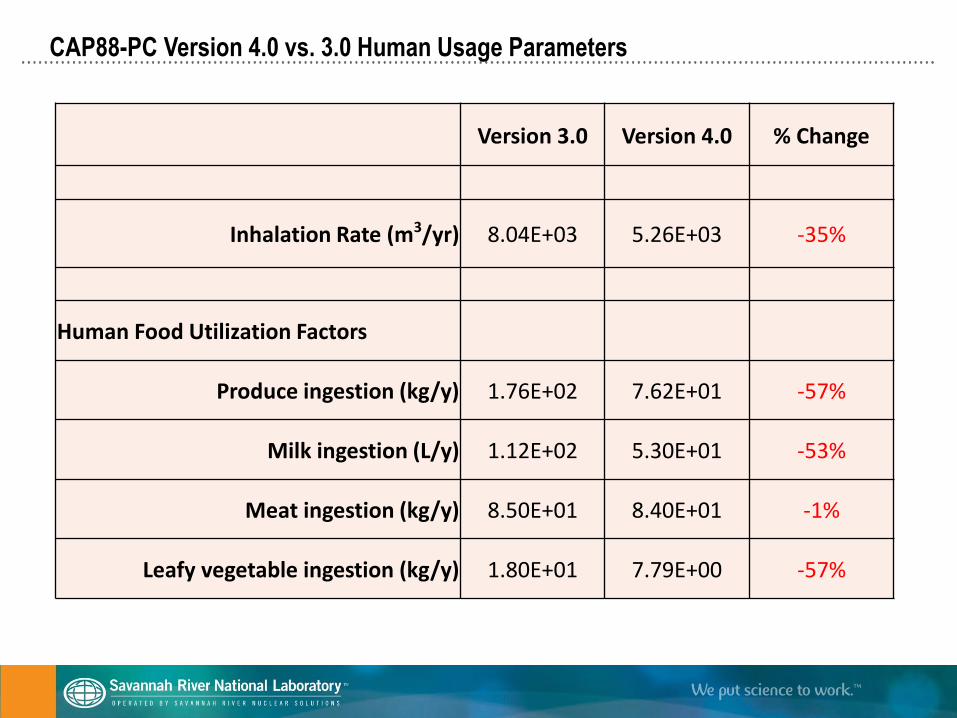
CAP88-PC Version 4.0 vs. 3.0 Human Usage Parameters
Version 3.0 Version 4.0 % Change
Inhalation Rate (m3/yr) 8.04E+03 5.26E+03 -35%
Human Food Utilization Factors
Produce ingestion (kg/y) 1.76E+02 7.62E+01 -57%
Milk ingestion (L/y) 1.12E+02 5.30E+01 -53%
Meat ingestion (kg/y) 8.50E+01 8.40E+01 -1%
Leafy vegetable ingestion (kg/y) 1.80E+01 7.79E+00 -57%
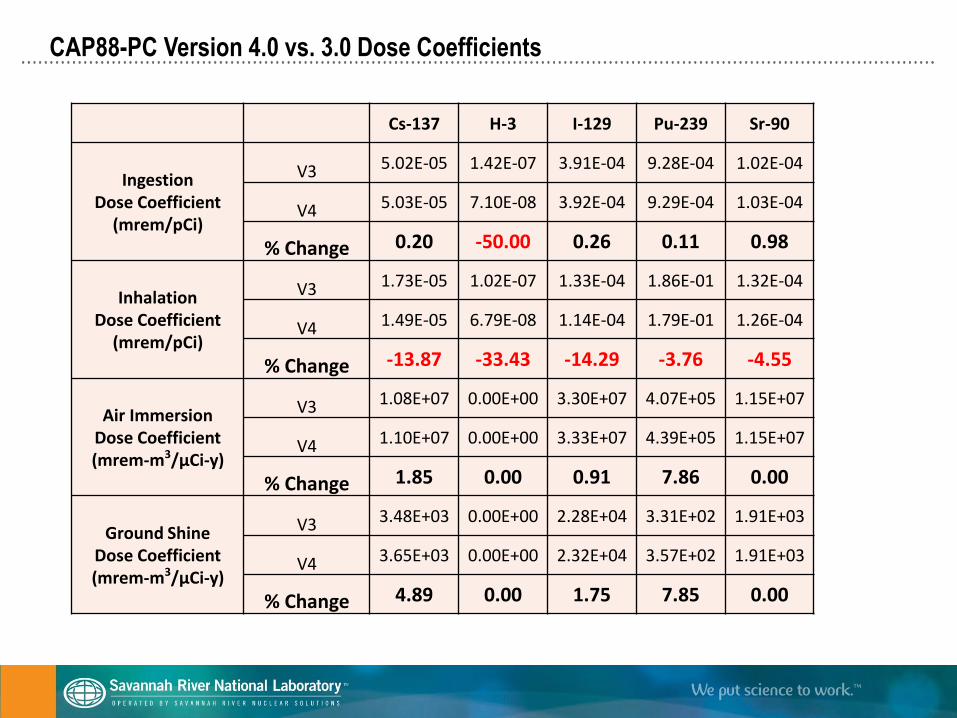
CAP88-PC Version 4.0 vs. 3.0 Dose Coefficients
Cs-137 H-3 I-129 Pu-239 Sr-90
Ingestion Dose Coefficient
(mrem/pCi)
V3 5.02E-05 1.42E-07 3.91E-04 9.28E-04 1.02E-04
V4 5.03E-05 7.10E-08 3.92E-04 9.29E-04 1.03E-04
% Change 0.20 -50.00 0.26 0.11 0.98
Inhalation Dose Coefficient
(mrem/pCi)
V3 1.73E-05 1.02E-07 1.33E-04 1.86E-01 1.32E-04
V4 1.49E-05 6.79E-08 1.14E-04 1.79E-01 1.26E-04
% Change -13.87 -33.43 -14.29 -3.76 -4.55
Air Immersion Dose Coefficient (mrem-m3/µCi-y)
V3 1.08E+07 0.00E+00 3.30E+07 4.07E+05 1.15E+07
V4 1.10E+07 0.00E+00 3.33E+07 4.39E+05 1.15E+07
% Change 1.85 0.00 0.91 7.86 0.00
Ground Shine Dose Coefficient (mrem-m3/µCi-y)
V3 3.48E+03 0.00E+00 2.28E+04 3.31E+02 1.91E+03
V4 3.65E+03 0.00E+00 2.32E+04 3.57E+02 1.91E+03
% Change 4.89 0.00 1.75 7.85 0.00
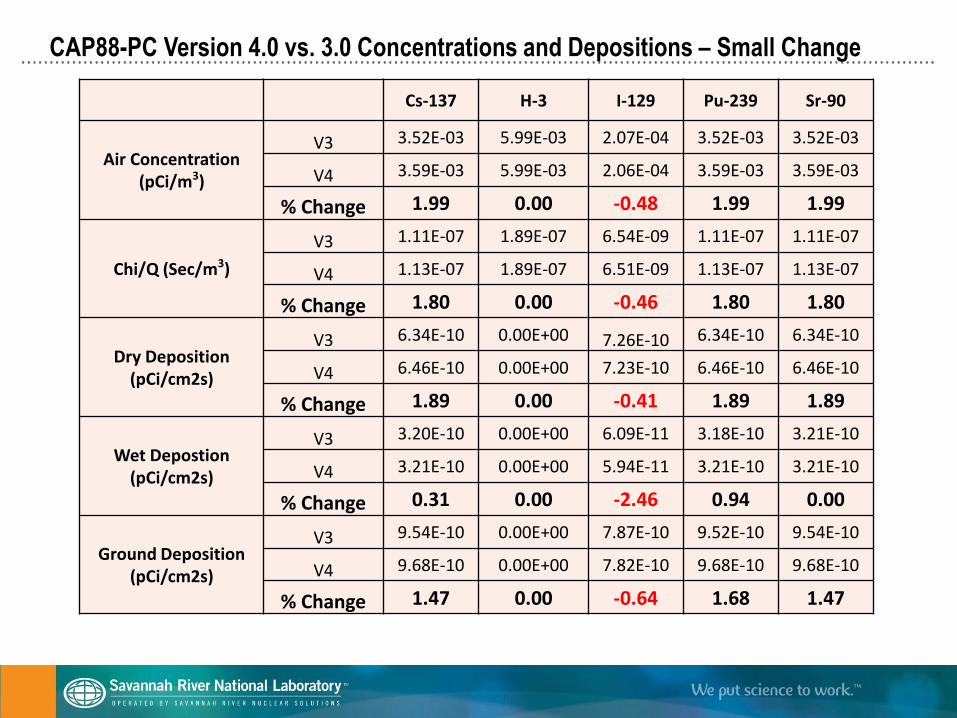
CAP88-PC Version 4.0 vs. 3.0 Concentrations and Depositions – Small Change
Cs-137 H-3 I-129 Pu-239 Sr-90
Air Concentration (pCi/m3)
V3 3.52E-03 5.99E-03 2.07E-04 3.52E-03 3.52E-03
V4 3.59E-03 5.99E-03 2.06E-04 3.59E-03 3.59E-03
% Change 1.99 0.00 -0.48 1.99 1.99
Chi/Q (Sec/m3)
V3 1.11E-07 1.89E-07 6.54E-09 1.11E-07 1.11E-07
V4 1.13E-07 1.89E-07 6.51E-09 1.13E-07 1.13E-07
% Change 1.80 0.00 -0.46 1.80 1.80
Dry Deposition (pCi/cm2s)
V3 6.34E-10 0.00E+00 7.26E-10 6.34E-10 6.34E-10
V4 6.46E-10 0.00E+00 7.23E-10 6.46E-10 6.46E-10
% Change 1.89 0.00 -0.41 1.89 1.89
Wet Depostion (pCi/cm2s)
V3 3.20E-10 0.00E+00 6.09E-11 3.18E-10 3.21E-10
V4 3.21E-10 0.00E+00 5.94E-11 3.21E-10 3.21E-10
% Change 0.31 0.00 -2.46 0.94 0.00
Ground Deposition (pCi/cm2s)
V3 9.54E-10 0.00E+00 7.87E-10 9.52E-10 9.54E-10
V4 9.68E-10 0.00E+00 7.82E-10 9.68E-10 9.68E-10
% Change 1.47 0.00 -0.64 1.68 1.47
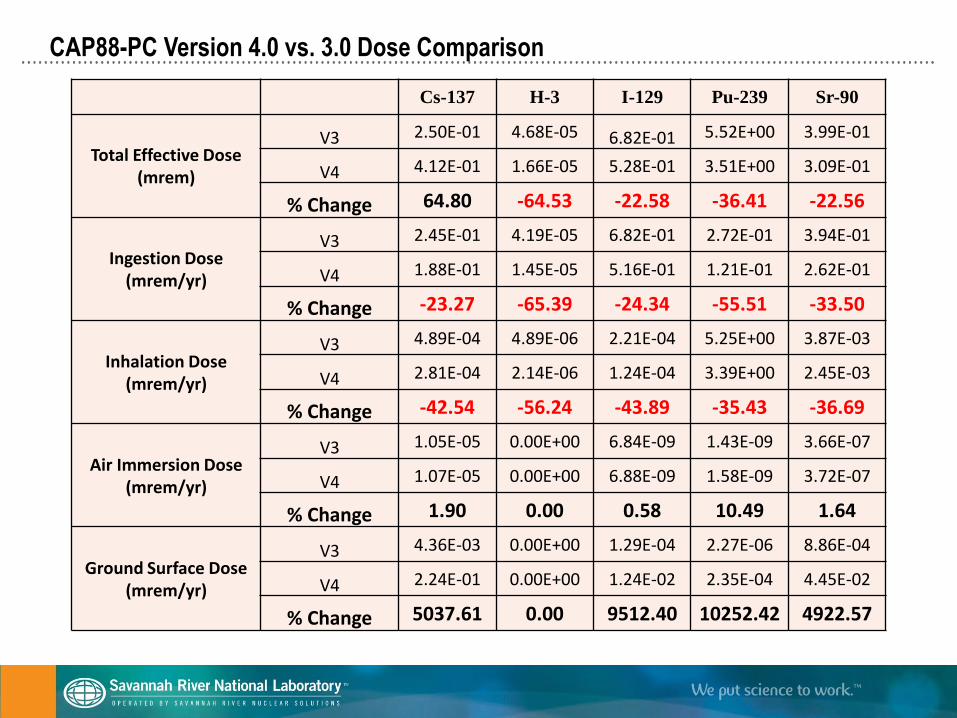
CAP88-PC Version 4.0 vs. 3.0 Dose Comparison
Cs-137 H-3 I-129 Pu-239 Sr-90
Total Effective Dose (mrem)
V3 2.50E-01 4.68E-05 6.82E-01 5.52E+00 3.99E-01
V4 4.12E-01 1.66E-05 5.28E-01 3.51E+00 3.09E-01
% Change 64.80 -64.53 -22.58 -36.41 -22.56
Ingestion Dose (mrem/yr)
V3 2.45E-01 4.19E-05 6.82E-01 2.72E-01 3.94E-01
V4 1.88E-01 1.45E-05 5.16E-01 1.21E-01 2.62E-01
% Change -23.27 -65.39 -24.34 -55.51 -33.50
Inhalation Dose (mrem/yr)
V3 4.89E-04 4.89E-06 2.21E-04 5.25E+00 3.87E-03
V4 2.81E-04 2.14E-06 1.24E-04 3.39E+00 2.45E-03
% Change -42.54 -56.24 -43.89 -35.43 -36.69
Air Immersion Dose (mrem/yr)
V3 1.05E-05 0.00E+00 6.84E-09 1.43E-09 3.66E-07
V4 1.07E-05 0.00E+00 6.88E-09 1.58E-09 3.72E-07
% Change 1.90 0.00 0.58 10.49 1.64
Ground Surface Dose (mrem/yr)
V3 4.36E-03 0.00E+00 1.29E-04 2.27E-06 8.86E-04
V4 2.24E-01 0.00E+00 1.24E-02 2.35E-04 4.45E-02
% Change 5037.61 0.00 9512.40 10252.42 4922.57
CAP88-PC Version 4.0 Conclusion
• CAP88-PC Version 4.0 will be used at SRS for the 2013 Annual Report
– Much better than Version 3.0!
• In general, the alpha and beta (internal doses) go down
– Consumption rates went down
• In general, gamma doses go up
– 100 y buildup
– No depletion from the environment
• Overall SRS NESHAP doses will go down
– Dominated by tritium oxide