ENVIRONMENTAL CAPABILITIES AND CORPORATE STRATEGY
44
1 ENVIRONMENTAL CAPABILITIES AND CORPORATE STRATEGY: EXPLORING ACQUISITIONS AMONG US MANUFACTURING FIRMS Luca Berchicci Rotterdam School of Management (RSM) Erasmus University Rotterdam [email protected] Glen Dowell Johnson Graduate School of Management Cornell University Ithaca, NY 14850 [email protected] Andrew A. King Tuck School of Business at Dartmouth College Hanover NH 03755 [email protected]
Transcript of ENVIRONMENTAL CAPABILITIES AND CORPORATE STRATEGY
1
ENVIRONMENTAL CAPABILITIES AND CORPORATE STRATEGY: EXPLORING ACQUISITIONS AMONG US MANUFACTURING FIRMS
Luca Berchicci Rotterdam School of Management (RSM)
Erasmus University Rotterdam [email protected]
Glen Dowell
Johnson Graduate School of Management Cornell University Ithaca, NY 14850
Andrew A. King Tuck School of Business at Dartmouth College
Hanover NH 03755 [email protected]
2
ENVIRONMENTAL CAPABILITIES AND CORPORATE STRATEGY: EXPLORING ACQUISITIONS AMONG US MANUFACTURING FIRMS
Abstract
In this article, we investigate whether environmental capabilities influence firms’ corporate
strategies, a topic that has received little attention to date. We hypothesize that firms are more
likely to acquire facilities when ownership facilitates the transfer of capabilities either to or
from the facility. Using a panel from the US government’s Toxics Release Inventory
program, we find firms with superior environmental capabilities are significantly more likely
to acquire physically proximate facilities with inferior environmental capabilities and vice
versa. Our results extend theories of both corporate and environmental strategy.
3
Introduction
In recent years, management scholars have become more interested in the sources and
consequences of environmental capabilities. As evidence of this trend, the Academy of
Management recently selected the theme ‘green management matters’ for its annual
conference. Scholars have investigated several ways green management might matter. Some
have explored how managers choose among various strategic options that could improve
environmental and financial performance (Dowell, Hart, & Yeung, 2000; King & Lenox,
2002; Russo & Fouts, 1997). Others have investigated when managers elect to have their
firms participate in various forms of self-regulation in order to improve green management
practices (Berchicci & King, 2007). However, little environmental work has addressed a
central issue of corporate strategy: does the presence or absence of environmental capabilities
influence corporate strategy (Diestre & Rajagopolan, 2010)? In this article, we take an early
step toward answering this question by investigating ownership changes in US manufacturing
firms.
At first blush, it might seem unlikely that environmental capabilities would influence
changes in ownership, but, in fact, both deductive logic and anecdotal evidence suggest it
may be so. Deductive logic suggests the potential to acquire and transfer capabilities could
motivate ownership changes. Wide differences in environmental performance capabilities
remain among US companies, in part because there has been relatively little time for these
capabilities to develop and diffuse. In the last 20 years, as environmental regulations have
become more stringent, some firms have been unable to reach acceptable environmental
performance goals, while others have found they can profitably go beyond regulatory
requirements. The resulting heterogeneous distribution of abilities could allow gains from

4
trade created by the transfer of capabilities to or from an acquiring firm. Anecdotal evidence
suggests some firms conduct careful due diligence of target facilities’ environmental
performance before approving acquisitions. General Electric, for example, has a special unit
of auditors who visit production facilities to evaluate their environmental management
systems.1
In this paper, we investigate the degree to which environmental capabilities influence
corporate strategy by examining ownership changes among US manufacturers. Our analysis
provides an important test of the degree to which capabilities matter in acquisitions. We make
three important contributions to the study of acquisition choices.
First, we bring attention to a new type of capability, specifically, environmental
capability, as a determinant of acquisition choice. Second, we consider the importance of
relative (rather than absolute) capabilities. Prior studies have examined how a facility’s
performance affects its likelihood of being acquired (Banaszak-Holl et al., 2002) but have not
considered the facility’s capabilities relative to the acquiring firm. Our third contribution is to
bring new attention to how firms choose among a set of similar alternatives (e.g., facilities in
the same industry or geography, or using the same technology). This ‘which one’ decision
has received less attention than it deserves, in part because the datum needed to analyze the
decision is difficult to acquire. Lacking broad panels of data from sources such as the US
Census of Manufactures, scholars usually cannot obtain temporal data on facility corporate
affiliation, characteristics, or operational performance. Nor can scholars usually observe the
set of facilities that might have represented reasonable alternatives for acquisition. Our use of
facility-level US environmental regulatory data and our combination of these data with other
facility-level information helps us to overcome this problem.
1 Personal communication with Stephen Ramsey, GE’s former vice president for corporate environmental programs. November 11.

5
For the literature on business and the natural environment, we open a new research
agenda for the field. To date, research has overlooked the question of how environmental
capabilities might influence strategic decisions such as acquisitions. Yet, acquisitions can
provide a tantalizing window on how a firm’s ‘green’ capabilities influence its strategic
decisions and how firms use, acquire, or transfer environmental capabilities. If environmental
performance influences such strategic choices as ownership changes, it would suggest firm
performance is driven by heterogeneous environmental capabilities rather than differing
managerial preferences with respect to pollution. It also would show the degree to which
green management matters—that is, capabilities for environmental management influence the
boundary of the firm itself, which is a fundamental strategic decision.
We examine firms’ acquisitions of production facilities over a 15-year period using a
unique data set that combines data from the Environmental Protection Agency’s Toxics
Release Inventory program with the National Establishment Time-Series (NETS) Database.
We test whether firms seek to acquire facilities with capabilities different from their own.
Controlling for a number of measures of similarity, we find firms tend to acquire targets with
differing levels of capabilities only if those facilities are geographically proximate to the
firm.
To explore how environmental capabilities might affect acquisitions, we begin by
reviewing some of the relevant theories of corporate ownership and ownership change. We
form two sets of hypotheses predicting how firm and facility characteristics influence
changes in ownership. We then describe our data and methods, test the hypotheses, and
discuss the results of these tests.

6
Theoretical Framework
Acquisitions and Value Creation
The literature on corporate strategy suggests firms are likely to own facilities when
ownership conveys value (Bowman & Singh, 1993). For example, a particular corporate
owner may undertake an acquisition because it is better positioned to extend economies of
scale or better use capabilities held by a target (Ravenscraft & Scherer, 1987). Creating value
through acquisitions is a delicate undertaking, as not only must the new parent be able to
extract value from the target, but the particular parent-target combination must be able to
create value through cost reduction or output improvement. If an ownership change does not
create value, competitive bidding should dissipate the value of an acquisition (Barney, 1988;
Capron & Pistre, 2002). Indeed, if changes in ownership are governed by informed and
rational managers seeking to maximize the value of their firms, such changes should occur
only when they create value.
Real-world empirical evidence of the effect of acquisitions provides mixed evidence
of value creation ( Fowler & Schmidt, 1988; Moeller, Schlingemann, & Stulz, 2005;
Ravenscraft & Scherer, 1987). Errors in perception or judgment may cause managers to
acquire facilities that do not add value to the firm. These explanations supplement rational
motivations for acquisitions in the sense that they help explain why many acquisitions may
not provide value, but they do not refute the idea that the pursuit of value drives acquisitions.
Here we draw on theories that postulate firms acquire facilities to improve their
competitive positions, and we test whether the predictions of these theories match observed
acquisition patterns. We follow recent work in strategy that has characterized acquisitions as
opportunities for firms to leverage their current capabilities or to acquire such capabilities
from targets (Anand & Delios, 2002; Arikan & McGahan, 2010; Capron, Dussauge, &
7
Mitchell, 1998; Karim & Mitchell, 2000; Vermeulen & Barkema, 2001; Zollo & Singh,
2004). We build hypotheses that outline how relative acquirer- and target-performance levels
affect acquisition choice and how distance moderates that relationship.
Relative Capabilities
In recent years, corporate strategy literature has focused on the importance of transfer
of capabilities in motivating acquisitions. A capability is a routine or set of routines that
determines what an organization is able to accomplish, and that often depends on tacit
knowledge (Hannan & Freeman, 1989; Karim & Mitchell, 2000; Winter, 2003). Acquisitions
are utilized to transfer capabilities for at least two reasons. First, routines, which capabilities
are based on, are not easily replicated (Nelson & Winter, 1982). Thus, any attempt to gain
proficiency at a given capability by simply observing firms with such capability is fraught
with difficulty (Rivkin, 2000). Second, capabilities often are difficult to trade discretely, as
they involve tacit knowledge and are embedded in the organization in which they reside
(Karim & Mitchell, 2000; Williams, 2007). Firms with inferior capabilities may seek to
acquire entities that possess useful knowledge, while those that have superior capabilities
may look for targets that can best benefit from the transfer of the acquirer’s capabilities
(Ahuja & Katila, 2001; Rosenkopf & Almeida, 2003). Banaszak-Holl et al. (2002) label these
two options ‘cream-skimming’ and ‘turnaround’ strategies respectively.
Firms acquiring facilities in order to improve them (i.e., the turnaround strategy) are
motivated by the belief that they can transfer superior routines and capabilities to a target and
thereby improve its performance. In order for a turnaround strategy to be economically
viable, the acquiring firm must perceive that by extending its resources to the target, it will
create sufficient value to offset the purchase price (Capron et al., 1998). Since potential
targets that lack valuable capabilities should have relatively low expectations of future cash

8
flows (and thus lower valuations), the acquisition process resembles a matching process
whereby firms may realize mutual gains by transferring capabilities from the firm that
possesses them to a unit that needs them (Faria, 2008). Ford’s acquisition of both Land Rover
and Jaguar, for example, was motivated partly by the belief that Ford had the capabilities to
produce high-quality cars that those firms were lacking and that by extending those
capabilities to Land Rover and Jaguar, Ford could increase the sales of the two lines
significantly (Kerwin, 2000).
In order to more fully understand how environmental performance plays a role in
acquisitions, we held informal interviews with managers and performed an archival search
for discussion of these issues. A more thorough discussion of our findings is available in
Appendix A, which is published as an online accompaniment to this paper. At minimum,
firms assess a potential target’s environmental records as part of the due diligence process in
order to minimize the possibility of acquiring a target that has significant potential for
environmental liabilities. Discussions with managers who have been involved with numerous
acquisitions indicate that environmental issues are commonly considered in the pre-
acquisition phase. Environmental issues are not the primary driver of acquisition choices, as
firms generally choose targets that fit their strategic needs (e.g., allow them to gain access to
a product or service market). However, environmental due diligence can either alter the terms
of a deal or cause the firm to cancel a planned acquisition altogether.
Increasingly, firms are assessing environmental performance to determine if a facility
is undervalued and whether its performance can be improved through post-acquisition
capability transfer. In 2000, for example, Kerr-McGee acquired a facility in Savannah, GA,
that had been cited for environmental and safety concerns. In making the acquisition, Kerr-
McGee explicitly cited its ability to fix the facility and bring it into line with the performance
of its other facilities (Wood, 2000).
9
The Carlyle Group (a private equity firm), together with the Environmental Defense
Fund, recently formalized this process by developing a tool that explicitly takes
environmental opportunities into account in the due diligence process. The tool ‘focuses on
five environmental areas where Carlyle can identify changes that would improve operational
and financial performance of prospective portfolio companies’ (Kreutzer, 2010: 1). In this
way, The Carlyle Group uses the environmental capabilities identified in companies already
in its portfolio to assess how to make improvements in targets that it is considering.
A number of studies previously have argued that environmental capabilities are
connected to both financial performance and other valuable capabilities. Hart (1995), for
example, develops the “Natural Resource Based View of the Firm” and argues that pollution
prevention is related to continuous improvement. Klassen and Whybark (1999) argue that
waste prevention relies on tacit knowledge and is connected to operational improvement.
Furthermore, a number of authors have argued that environmental capabilities lead to
superior financial performance (Klassen & McLaughlin, 1996; Margolis & Walsh, 2001;
Russo & Fouts, 1997). Research also indicates not all firms are equally positioned to enjoy
financial benefits from pursuing improved environmental performance. Christmann (2000),
for example, finds evidence that environmental capabilities are more likely to be associated
with higher profit levels in the presence of complementary resources.
For firms that have invested in environmental capabilities, then, acquisitions present
an opportunity to attempt a ‘turnaround’ acquisition. Since the ability to improve
environmental performance is often built upon knowledge that is more readily transferred
within the firm than across firm boundaries (Hart, 1995), firms that have strong
environmental performance can bring new units within their boundaries and improve upon
those units’ environmental capabilities. This implies that targets with relatively weak

10
environmental capabilities are attractive targets for firms with strong environmental
capabilities.
Hypothesis 1a: An acquiring firm with strong environmental capabilities is likely
to acquire a facility with weak environmental capabilities.
The above hypothesis assumes that capabilities move from the acquiring firm to the
target. In contrast, cream-skimming acquisitions occur when an acquiring firm takes over a
high-performing target with the intention of learning from the target or gaining benefits from
the target’s reputation (Banaszak-Holl et al., 2002). In a cream-skimming scenario, the
acquiring firm identifies a target with superior capabilities along a dimension the acquirer
values. The acquisition has the potential to create value for the acquiring firm if the
capabilities are difficult to build internally or acquire in a market transaction (Capron et al.,
1998). Analysts have argued, for example, that this was the reason General Motors entered
into a joint venture agreement with Toyota for the management of the NUMMI plan in
Freemont, CA. Managers at GM hoped to be able to transfer the capabilities in lean
production learned at the NUMMI plant to the rest of the company (Womack, Jones, & Roos,
1991).
Most of the studies that have examined facility-level acquisitions (Banaszak-Holl et
al., 2002; Lichtenberg et al., 1987; Siegel & Simons, 2010) have emphasized the role of the
target’s absolute performance.2 In fact, the logic of value creation suggests that potential
gains will be related to the relative level of capabilities between the target and the acquirer.
There is evidence in a related setting that relative capabilities might matter more than
absolute ones. Anand and Delios (2002) demonstrate the relative technological intensity 2 This emphasis on absolute capabilities may help explain the stronger evidence in favor of turnaround rather than cream-skimming acquisitions in prior studies (see Balsvik and Haller [2010] for a discussion of this tendency). If, on average, stronger firms make acquisitions, then, on average, weaker targets may be preferred targets, but the average could mask the matching process we describe.
11
between the host country and the firm’s home country might matter more than the absolute
intensity in determining mode of international entry. Strong firms may gain from acquiring
facilities with even higher capabilities, and lagging firms may gain from acquiring average
ones.
For environmental capabilities, cream skimming occurs when a firm lagging in
environmental performance acquires a better-performing target from which it can transfer
capabilities. While the firm potentially could build the capabilities itself, the path to do so and
the time required are uncertain; buying the capabilities may appear to be a better option.
Thus, weak firms interested in becoming better are likely to buy targets with superior
capabilities.
Hypothesis 1b: An acquiring firm with weak environmental capabilities is likely to
acquire a facility with strong environmental capabilities.
Geographic Proximity and the Transfer of Capabilities
The above hypotheses are based on the idea that firms often make acquisitions in order to
transfer capabilities either to or from the target. We now consider the circumstances under
which such transfers will be more or less likely, and we focus on the role geographic distance
plays in moderating the turnaround and cream-skimming acquisition strategies. Several
authors have documented the importance of physical proximity in influencing the transfer of
capabilities. Adler (1990) argues that learning flows within a corporation from a ‘primary’
location to operations that need such information. Evidence suggests such information flow is
strongly influenced by physical distance, as greater distance reduces the transfer of valuable
technical information (Allen, 1977). In the high-tech sector, Galbraith finds geographic
distance hampers the transference of complex productivity capabilities from the source unit
to the recipient unit (Galbraith, 1990). Corporate reports also support the importance of

12
business. When General Motors exited the NUMMI joint venture, Tesla bought the facility
from Toyota, claiming one of the advantages it would have in managing the facility was that
the proximity to its other facilities would allow a ‘tight feedback loop between engineering,
manufacturing, and other divisions within the company’ (Wood, 2010).
One might think modern information technology has reduced to the point of
insignificance the effect of physical proximity on the transfer of capabilities. Evidence
suggests, however, that when information exchange entails unfamiliar knowledge and
divergent routines, physical proximity continues to matter. In the hotel industry, for example,
Ingram and Baum (1997) find that greater knowledge transfer occurs between different firms
located in close proximity. In general, when exchange partners lack shared experience,
information referents can be ambiguous, and high-bandwidth (e.g., face-to-face)
communication often is required for effective information transfer (Daft & Lengel, 1986). In
contrast, for well-codified or understood issues, lower-bandwidth media usually are
sufficient. Acquiring firms and their targets usually will share relatively few experiences, and
this makes high-bandwidth communication especially beneficial. Proximity can also facilitate
social contacts with key individuals, and these can be critical to the acquisition of new
knowledge (Fleming & Marx, 2006). As a result of these findings, several companies have
created structures that attempt to increase information flow by locating groups with diverging
capabilities under one roof (e.g., Steelcase’s corporate office building described by Becker
and Steele [1995]).
We argue that proximity plays a significant role in the firm’s assessment of its
likelihood of transferring environmental capabilities, for two reasons. First, environmental
capabilities that go beyond simple pollution control procedures are built upon knowledge that
is tacit and not easily observed or replicated (Hart, 1995; King & Lenox, 2002). Such
capabilities are not easily transferred at a distance. Second, environmental performance often

13
is the result of a complex interplay between the facility’s capabilities and its institutional
environment (Delmas & Toffel, 2004). Thus, the capabilities a facility has developed in
environmental performance are context dependent, and transferring those capabilities to a
different context becomes an uncertain process (Williams, 2007). As distance to a potential
target increases, its institutional environment is more likely to differ from that of the
acquiring firm. Such a difference may reduce the firm’s confidence that environmental
capabilities can be transferred to or from the target.
Managers familiar with environmental issues in acquisitions indicate that distance
plays a role in the degree to which environmental capabilities can be transferred.3 For
example, in turnaround situations, acquiring firms often transfer their own people to the
target to make the target more aware of environmental issues and to develop capabilities that
will allow the target to improve its environmental performance. When a target is proximate,
people easily can be moved back and forth, and the transfer of know-how is relatively easy.
When a target is farther away, such transfers are more expensive and difficult, making it
more daunting to bring a distant target’s environmental capabilities up to the desired level.
In summary, both theory and anecdotal evidence suggest proximity should be
important in moderating capability transfer in both the turnaround and cream-skimming
cases. If, as we have hypothesized, firms choose targets based on the gains that can be
obtained by capability transfer, they are likely to acquire plants that have differing
capabilities and are geographically and operationally proximate to the existing firms’
operations.
Hypothesis 2a: The greater the geographic proximity to existing operations, the
3 Personal Communication with Ed Gomes, VICOR’s EH&S manager and former Wang’s EH&S manager. August 31, 2010.
14
higher the probability an acquiring firm with strong environmental capabilities
will acquire a facility with weak environmental capabilities.
Hypothesis 2b: The greater the geographic proximity to existing operations, the
higher the probability an acquiring firm with weak environmental capabilities
will acquire a facility with strong environmental capabilities.
Data and Methods
Data Sources
Our sample is drawn from the US EPA’s Toxics Release Inventory (TRI) and the National
Establishment Time-Series (NETS) Database. The NETS Database collects establishment-
level data from Dun & Bradstreet on most business activities in the United States. The TRI
data include all facilities with 10 or more employees and that process or manufacture any
listed chemical over the threshold amount established by the EPA. The TRI data have been
used extensively in measuring environmental performance (Freudenberg, 2005; King &
Lenox, 2002; King & Lenox, 2000; Klassen & Whybark, 1999; Konar & Cohen, 1997). The
NETS sales data indicate the TRI data cover about 50 percent of US manufacturing ($1.1
trillion) and a higher percentage of manufacturing sectors that use toxic chemicals. Along
with chemical production, use, and disposal data, the TRI data include facility characteristics,
such as current firm owner, production changes, industry, and location. Though the TRI data
have been collected since 1987, our panel begins in 1991 because that is the first year the
data provide suitable information about chemical waste generation. Our panel ends in 2005.

15
Sample
The goal of our research is to better understand which facilities, among a set of reasonable
alternatives, are likely to be chosen by a given firm making an acquisition. To do this, we
first create ownership data for US manufacturing facilities, combining ownership data from
NETS and the Toxics Release Inventory. We conclude that ownership changed when data
from both sources agree that the ultimate parent of a facility had changed in a given year.
Since we are interested in modeling the ‘which one’ decision—that is, the choice of
which facility to acquire among a set of alternatives—we need to construct a choice set for
each observed acquisition. We form these sets of alternatives by including the facilities that
are in the same four-digit standard industrial classification (SIC) as the facility that ultimately
was chosen.4 We call these sets of alternatives ‘acquisition pools’ because they represent the
pool of similar facilities from which the acquirer firm can choose its target. For example, if
acquirer firm Alpha chooses target facility Beta from the petroleum refinery industry, SIC
2911, in 1995, the acquisition pool we use in our analysis includes all facilities in 1994 in
SIC 2911 for which we have data.
Our final sample includes 2,485 acquisitions over the 1991–2005 observation period,
and we have a total of 229,186 plant-year observations. On average, the potential acquisition
pool consists of 118 facilities. Because some acquisitions include multiple facilities, there are
a total of 1,936 acquisition pools.
The Dependent Variable
Since we focus on the factors that influence whether a particular facility is chosen, we use as
our dependent variable a dichotomous variable, chosen target, which takes a value of 1 if that
facility was acquired in a given year and 0 otherwise. Across our analyzed sample, 73.4 4 In building these pools, we exclude all facilities already owned by the acquiring firm.

16
percent of the time (i.e., SIC code, year, firm-acquirer combinations) a single facility was
acquired and 14.5 percent of the time two facilities were acquired. This pattern is consistent
with the pattern of acquisitions noted elsewhere (Aldrich, 1999).
Main Independent Variables
Environmental capabilities
At the facility level, we measure environmental capabilities based on a facility’s relative
waste generation. We choose relative waste generation as our measure of capabilities for two
reasons: because the ability to reduce waste production, rather than simply treat it after it is
generated, is a critical determinant of both environmental treatment costs and pollution levels
(King & Lenox, 2002), and because pollution prevention is commonly considered an
example of tacit knowledge–based environmental capability (Hart, 1995). We sum the waste
generation of the toxic chemicals and weigh each chemical by its toxicity to create a single
waste generation total for each facility in each year.
Since larger facilities obviously will have greater levels of waste generation, we need
to create a standardized measure of a facility’s environmental performance. We follow King
and Lenox (2002) and regress the natural log of a facility’s weighted waste generation on a
quadratic specification of its size (number of employees) and its industry. We run separate
regressions in each year so that the regression produces an expected level of waste for a
facility of a given size in a given industry in a year.
ln Wit = α jt + β1 jt (ln sit ) + β2 jt (ln sit )2 +εit (1)
In the above, Wit is the waste generation from facility i in year t, αjt is a constant for
four-digit SIC sector j in year t, β1jt and β2jt are coefficients relating to the linear and quadratic
specifications of the number of employees respectively, and εit is the error term of the

17
regression. We use the regression in (1) above to generate predicted values of waste
generated for each facility in a given year. We then use the standardized residuals from that
prediction to generate our measure of relative waste generation for a facility in a given year.
Thus, we measure a facility’s environmental capabilities as the deviance from the waste
generation we would expect it to create given its size and industry. In the analysis that
follows, we use the value of the facility’s relative waste generation in the year before itis
acquired.
To create a firm-level measure of environmental capabilities, we take the average of
the relative waste generation of the facilities owned by the acquiring firm. Some firms, of
course, contain facilities from a variety of industries. Since we rate a facility’s performance
relative to other facilities within its industry, we have taken industry context out of the
performance measure. This allows us to add facilities from different industries together to
arrive at a firm score.
Although we compute a continuous measure of firm relative waste generation, the
specification of our models (described below) requires that we dichotomize firms into those
with higher and lower levels of capabilities. We divide firms by the level of firm relative
waste generation, designating firms as ‘clean’ if they generate less than the median amount of
waste and ‘dirty’ otherwise. In the following analysis, we model the effect of facility
characteristics on the probability of acquisition by clean firms and dirty firms separately to
assess how a firm’s environmental capabilities interact with those of potential targets.
While the King and Lenox (KL [2002]) measure allows us to compare across facilities
and time and weight emissions by toxicity, it has some weaknesses. First, it weights the
chemicals in terms of a portion of their environmental influence; other weighting schemes
may allow for more complete measures of toxicity. For example, the KL measure considers

18
primarily acute toxicity (e.g., from a single exposure) while persistent toxicity (e.g.,
bioaccumulation) may be more important to human welfare (Toffel & Marshall, 2004). One
such measure is the Risk-Screening Environmental Indicators (RSEI) model developed by the
EPA. We use RSEI weighting to test our results and find them to be consistent; however, the
RSEI scores cover only 69 percent of the chemicals for which we have data, which
substantially reduces the coverage of the measure. Second, the KL measure is an ad hoc
equation based on the Cobb-Douglass production function. A full Cobb-Douglass function
would be superior, but capital input data for these companies are not available.
Geographic proximity
Hypotheses 2a and 2b argue that geographic distance interacts with facility environmental
capabilities. Furthermore, previous research has demonstrated that geographic distance is a
significant factor in acquisition choice (Baum, Li, & Usher, 2000). Therefore, in addition to
the moderating effects we predict in H2a and H2b, we expect a direct effect of distance, with
firms more likely to choose proximate facilities. In order to measure distance, we use the
location (in latitude and longitude) of each facility as reported on their TRI forms. We then
calculate the geodesic distance in kilometers between each facility currently owned by a firm
and each potential target. We use the average distance so that our distance measure captures
the average distance between each given potential target and the plants owned by the acquirer
firm. We find robustness tests using the minimum distance instead of the average do not
change the results.
Control Variables
Our goal is to investigate the extent to which environmental capabilities influence acquisition
choice. To do so, we must be able to control for other factors that could affect the degree to
which capabilities influence acquisition. Based on prior research, we focus on three specific

19
constructs: operational similarity, target efficiency, and similarity in the environmental
context.
Operational similarity
We control for operational similarity for two reasons. First, as we describe above, there is an
inherent tension in acquiring facilities to transfer capabilities because operational similarity
enhances capability transfer but is potentially correlated with the target having similar
capabilities as the acquirer. Second, one of the main reasons to acquire a new facility is to
benefit from scale economies. Since scale benefits require similarity in operations, firms
seeking such benefits are more likely to choose facilities with operations that resemble their
own. There are a number of dimensions on which similarity could be measured, including
similarities of inputs, processes, and outputs (St. John & Harrison, 1999). Our empirical
method, which we describe in detail below, allows us to partly control for output similarity,
and our remaining measures capture three distinct dimensions of similarity. We describe each
of these variables below.
Chemical use overlap. The TRI data give a detailed picture of the chemicals that
facilities use as inputs/catalysts or create as products/byproducts of their production. These
data, then, give us an opportunity to examine similarity in inputs and processes between the
firm and potential targets. We measure chemical use overlap (CO) by calculating the angle
between the two vectors representing each facility’s chemical use. This method is used
extensively to measure interorganizational overlaps (Dowell, 2006; Sohn, 2001) and also is
commonly applied in physics and information science studies (Jones & Furnas, 1987). To
create a variable with a range of (0:1), we take the arcsine of the angle between the two
vectors. When two vectors are orthogonal (no chemical overlap), the measure will be equal to

20
0. When two vectors have the same direction (complete overlap), independent of their
magnitude (or scalar dimension), the arcsine will equal Pi/2. Formally, this equation is:
chemical use overlap (CO) = arcsine (|Aj dot Bi| /||Aj||*||Bi||)/(Pi/2) (2)
In (2) above, Aj and Bi are the chemicals used by a firm’s facility j and a potential
target i respectively. Although our measure follows a classic method, we performed a set of
robustness checks using alternative formulas. We used the maximum overlap (the overlap
between the target and the most similar facility in the firm) and a measure that accounted for
the dimensionality of the two vectors. The sign and significance of our results did not change.
Size discrepancy: Our second measure of operational similarity is the degree to which
a potential target facility is similar in size to the firm’s existing facilities. Larger facilities
usually require more complex and formal structures (Haveman, 1993). Facilities experienced
in managing small facilities might lack the capability to effectively manage large ones (and
vice versa). Thus, we expect firms will tend to buy facilities similar in size to those with
which they are familiar. We measure the converse of size similarity with the variable size
discrepancy; this captures the difference between the average size of all the acquirer firm’s
plants and the size of a given potential target. The size calculation is based on the number of
employees at a site in a given year. The value of a plant’s size discrepancy is close to 0 when
there is proximity in terms of size. The value increases as the absolute difference increases
between the average size of the firm’s plants and the size of the target. Again, we conduct a
robustness test to ensure our use of average (rather than maximum or minimum overlap) does
not provide misleading results.
SIC overlap. Our third variable of operational similarity controls for similarity in
outputs. Our empirical approach provides a primary control for relatedness, as all facilities
from which a firm ultimately chooses a target are in a single industry sector. However, it is

21
still possible that among these facilities, some are more closely related than others to the
firm’s current operations, as the four-digit SIC level of aggregation still contains significant
diversity. Thus, we control whether the firm already operates in other markets in which the
facility operates. We do this by making use of the secondary industry affiliation (again, at the
four-digit SIC level) that facilities report. We create a variable, SIC overlap, which is a
cosine measure of overlap similar to that used in the chemical overlap variable described
above. Higher SIC overlap suggests a greater similarity at the product level.
Target efficiency
Labor productivity. In addition to operational similarity, we control for the efficiency of the
facility’s operation by measuring its labor productivity. We do so for two reasons. First,
research has demonstrated that efficiency is a major determinant of acquisition (Siegel &
Simons, 2010). Second, prior research suggests environmental efficiency is related to overall
firm efficiency (Hart, 1995; King & Lenox, 2000). If we find environmental performance
affects acquisition choice, it is important to ensure the result is not driven by overall plant
efficiency. Though we lack full productivity data, we have both employee and sales data for
our facilities from the NETS data; thus, we follow prior research that has used
sales/employee data as a measure of efficiency (Huselid, Jackson, & Schuler, 1997; Norburn
& Birley, 1988). We normalize the productivity of each facility by its primary industry. Our
measure, labor productivity, therefore controls in the best way available for the relative
efficiency of potential targets.
Similarity in the environmental context
Our final three control variables account for differences in the institutional context
between the focal firm and potential targets. All else equal, firms are likely to prefer facilities
governed by similar regulations and in business contexts with regulatory requirements similar
22
to those with which they are familiar (Williams, 2007). To help prevent these differences
from creating spurious findings, especially with regard to the distance effects, we include
three measures of local context: regulatory overlap, same state location, and relative
regulatory stringency.
Regulatory overlap. To capture regulatory overlap, we compute a vector of the
regulation covering each facility based on the permits listed for that facility by the US EPA
(e.g., permit compliance system, Clean Water Act, etc.). We then compute the inner product
of these vectors (the degree to which they overlap) between each potential target and each
facility already owned by the acquiring firm. The variable we compute, regulatory overlap,
represents the average inner product of these computed vectors. Higher values mean there is a
greater overlap between the regulatory regimes in which a potential target facility operates
and that to which the firm is accustomed. Our results are unchanged when we use the
maximum overlap score instead of the mean.
Same state location. Since firms might be prone to purchasing targets within their
own states due to both familiarity and regulatory similarity between the facility and the firm,
we control for state location in addition to geographic distance. The variable same state
location is equal to 1 if one of any acquirer firm’s plants is in the same US state as a given
potential target; it is equal to 0 otherwise. This variable also helps ensure that any effects we
find for the distance measure are not simply capturing a firm’s preference to acquire facilities
within a given state with which the firm is familiar.
Relative regulatory stringency. Finally, since state regulation may change over time
and this might influence trends in environmental capabilities within states, we compute the
average score of environmental capabilities of the facilities in each state in each year. This
creates a measure of relative regulatory stringency, allowing us to control for whether firms
23
prefer to acquire facilities in relatively stringent or relatively lax jurisdictions.
The Model
We observe a firm making an acquisition in a particular industry and year. We assume that
when this acquisition occurred, the firm considered other facilities in the same industry as
well but chose not to acquire them.5 We model the probability that a particular facility
changes owners as a function of a set of firm and facility characteristics (discussed in the
previous section). Since the firm is ‘fixed’ across the available options, we model each
acquisition as a conditional choice: given the attributes of the firm, what facility attributes are
more likely to be associated with acquisition? For this structure, a conditional logistic
regression is particularly appropriate. Conditional logistic regressions model choice behavior
when a firm or individual must choose among a discrete set of alternatives (Greve, 2000;
Kalnins & Chung, 2004).
Our analysis, then, models the firm’s choice of a facility as a function of the facility’s
environmental capabilities, the distance from the firm to the facility, and the interaction
between these variables, as well as the controls discussed above. We consider the probability
that firm i chooses facility k. Facility k, meanwhile, is in acquisition pool g, which contains j
alternatives:
Prik (yi = k | Xi) = exp(Xik' β)
exp(Xij' β)
j =1
J
∑ for k =1 to J
where vector contains values of the independent variables for outcome k for firm i.
One advantage of our approach is that it controls for one dimension of relatedness
5 We recognize that ownership change is actually the result of a negotiation between the buyer and seller. We use the language of ‘choice’ for convenience and to emphasize that we are evaluating determinants of which facility, out of a set of alternatives, moves to the new firm.
(3)
24
between the firm and the targets from which it chooses. That is, since each facility in the pool
is in the same primary SIC, the degree of product market relatedness is the same between the
firm and each facility in the pool, and our secondary SIC overlap variable described above
further controls for this dimension. This gives us confidence that our results are not affected
by differences in this dimension of relatedness between the firm and the targets available.
The conditional logistic regression does not allow characteristics to vary among those
for which the choice is conditioned (in our case, the attributes of the acquiring firm). This
means the firm’s characteristics are controlled for, since the analysis has a fixed effect at the
firm level. To analyze the choice made by firms with different levels of environmental
capabilities, we separate the sample according to firms’ environmental performance and run
separate analyses on two groups: ‘clean’ and ‘dirty’ firms. Thus, our variables capture the
effect of a potential target’s characteristics (e.g., the target’s environmental performance) or
the unique match between the firm and the potential target (e.g., the size discrepancy). A
potential limitation of the conditional logistic model is the assumption of the homogeneous
error variances that lead to the property of the independent irrelevant alternatives (IIA).6 In
our case, the IIA property is likely to hold given the high average number of alternatives and
the relative heterogeneity of alternatives within the groups.
Results
Table 1 displays the sample’s descriptive statistics. The average distance between an
acquiring firm’s existing plants and a given potential target is around 1,350 km (843 miles),
and 25 percent of the potential targets share the same state with at least one of the acquiring
6 The IIA property states that if A is preferred to B out of the alternative set {A, B}, then the introduction of additional alternative C must not make B preferable to A.
25
firm’s plants. The correlations between variables are modest. Not surprisingly, the strongest
relationships are among distance, state overlap, and regulatory characteristics (regulatory
stringency).
*** Please insert Table 1 about here ***
Table 2 shows the results of the conditional logistic analysis. Models with an odd
number relate to cases where the acquiring firm had above-average environmental
capabilities. Models with an even number relate to cases where the acquiring firm had below-
average environmental capabilities.
*** Please insert Table 2 about here ***
Models 1 and 2 are the baseline models that include only the control variables. The
results show that firms are significantly more likely to acquire facilities that are
geographically and operationally similar to the firms’ existing facilities. All four measures of
similarity (geographic proximity, chemical use overlap, size discrepancy, and SIC overlap)
are significant in the expected direction. Interestingly, we do not find significant evidence
that labor productivity influences acquisition target choice.
The results also demonstrate that firms prefer to acquire facilities operating in
contexts similar to those to which the firms are accustomed. We find firms are more likely to
acquire facilities as the overlap between the regulatory regimes increases. Likewise, the
probability of acquisition increases if facilities are located in the same state in which at least
one of the existing firm’s facilities currently operates. Finally, it seems that relative
regulatory stringency has an effect on ownership choice only for firms with poor
environmental performance, and that such firms tend to acquire facilities in areas with lax
regulatory enforcement.

26
Models 3 through 6 investigate the effect of environmental capabilities on ownership
change. These results indicate that relative differences in environmental capabilities influence
choice when the acquiring firm already owns a proximate facility, but that such capabilities
have little or no influence when the facility is farther away. In Hypothesis 1a, we argue that a
firm with strong environmental capabilities is likely to acquire a facility that lacks such
capabilities (i.e., the turnaround strategy), and in Hypothesis 1b, we argue that firms lacking
such capabilities are likely to acquire facilities that are strong environmental performers (i.e.,
the cream-skimming strategy). In Model 3, we find that, on average, a facility’s
environmental performance does not affect the likelihood of its acquisition by a clean firm,
and thus, Hypothesis 1a is not supported. In Model 4, we find that dirty firms’ choices are
affected by a facility’s environmental performance, but not in the direction predicted by
Hypothesis 1b. Overall, it appears that dirty firms prefer to acquire relatively dirty facilities.
We return to these results in the discussion section of the paper.
Hypotheses 2a and 2b suggest geographic distance influences the likelihood firms will
attempt either turnaround or cream-skimming acquisitions. We test these hypotheses using
the interactions shown in Models 5 and 6. We use mean-centered variables to simplify the
interpretation of interaction coefficients and to decrease multicollinearity (Aiken, West, &
Reno, 1991). The results provide significant support for both hypotheses. In Model 5, we find
proximity increases the probability that firms with stronger environmental capabilities will
acquire targets with weak environmental capabilities. Stated another way, as geographic
distance increases between a firm and a potential target, the probability a clean firm will
acquire a dirty facility decreases. In Model 6, we find that a similar dynamic holds for weak
firms’ acquisition of facilities with strong environmental capabilities. As the distance
between the firm and the facility increases, an environmentally weak firm becomes less likely
to acquire an environmentally strong facility.

27
In order to better interpret our results and test their robustness, we perform three
additional pieces of analysis. First, we graph our results to aid interpretation of the effects of
our conditional logistic estimations. It is difficult to interpret coefficients in logistic
regressions, especially with interaction effects (Hoetker, 2007).7 Thus, we follow Zelner
(2010) and use a Monte Carlo simulation technique to evaluate the effect of important
variables and explore them graphically. 8 To do this, we draw estimates from distributions
corresponding to the mean, variance, and covariance of each coefficient and independent
variable in Models 5 and 6. By repeated sampling, we can estimate the mean effect of
distance on the acquisition of two prototypical facilities—one clean and one dirty.
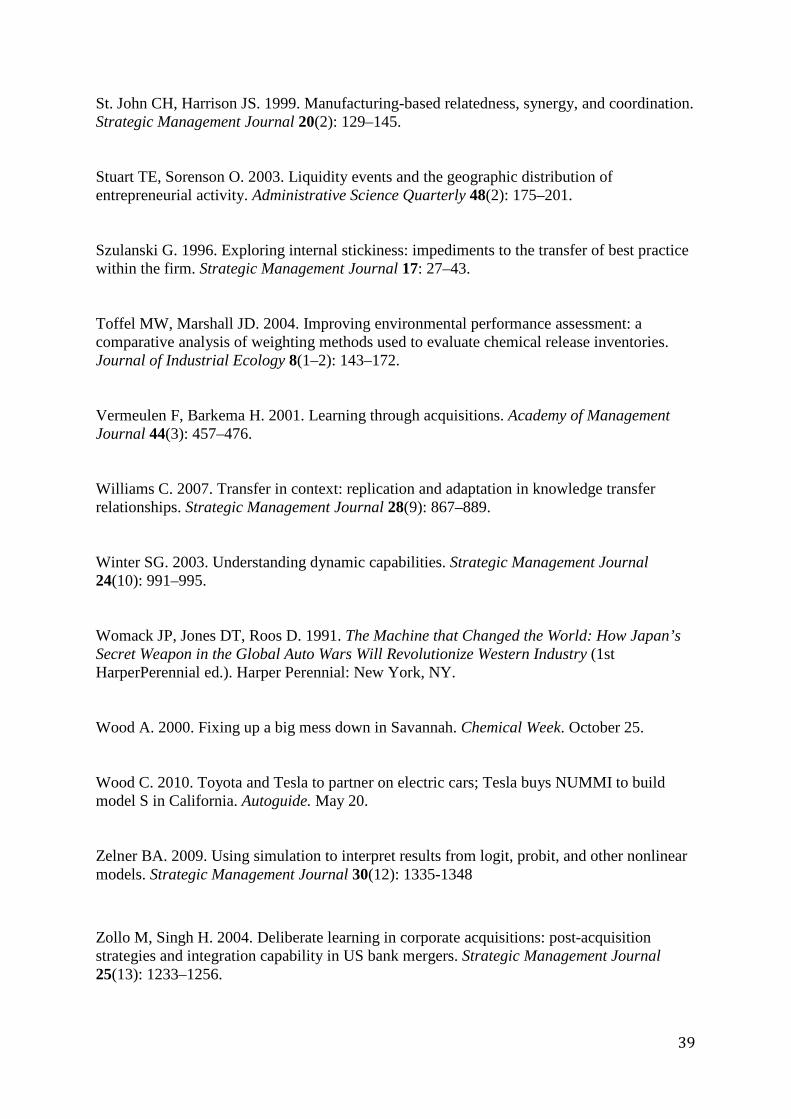
Figure 1 shows that clean firms are more likely to choose dirty plants when they are
proximate to the existing firms’ plants. This probability decreases as the distance increases.
Figure 2 illustrates that dirty firms are more likely to choose clean plants when they are
proximate. At the greater distance, firms are indifferent to differences in capabilities. Our
graphical results are consistent with our expectation that managers perceive it to be difficult
to transfer capabilities from a distance.
Figure 1 also allows us to explore the economic importance of our result. In Figure 1,
the distance between the two lines shows the relative probabilities of a clean firm choosing a
clean facility (continuous line) or dirty facility (dashed line) at a given distance. Consider two
facilities extremely close to a typical acquiring firm, one of which is an average ‘clean’
facility and the other an average ‘dirty’ one. The probability the clean facility will be
acquired is 0.024, while the probability that the dirty facility will be acquired is 0.08. Thus,
when choosing among very proximate facilities, clean firms are three times more likely to
7 In logistic regressions, the effect of the interaction is a function of the coefficient for the interaction, the coefficients for each interacted variable, and the values of all the variables. 8 In order to make the distance measures in the graph easier to interpret, we first repeated the analysis in Table 2 using raw (i.e., not mean centered) variables.
28
choose a dirty facility than a clean one. Figure 2 demonstrates a similar effect for dirty firms.
Very proximate clean facilities are more than twice as likely to be acquired as very proximate
dirty ones. Of course, in both graphs the preference for proximate facilities is revealed as
well. The probability of acquisition for both types of facilities falls with distance.
Figures 1 and 2 also help explain why we do not find support for Hypotheses 1a and
1b. Recall that the mean distance between a firm and a potential target facility is around
1,350 km (or 7.2 in a logarithmic scale, as shown in Figures 1and 2). The figures show that
with distance at its mean value, the preference for a clean or dirty target for a clean firm
(Figure 1) or for a dirty firm (Figure 2) is hard to differentiate. In Table 2, Model 4, we do
find that dirty firms are, on average, more likely to acquire dirty facilities at the mean
distance, but Figure 2 demonstrates that at that distance, the overall probability of acquisition
is quite small and, thus, the difference between clean and dirty is economically minute.
*** Please insert Figures 1 and 2 about here ***
In our second piece of additional analysis, we re-analyze the data, limiting our
analysis to those industries for which emissions are likely to be especially relevant. We use
Cho and Patten’s (2007) list of environmentally sensitive industries: metal mining (SIC 10),
paper and allied products (SIC 26), chemicals and allied products (SIC 28), petroleum
refining and allied products (SIC 29), primary metal industries (SIC 33), and electric, gas,
and sanitary services (SIC 49).9 Chatterij and Toffel (2010) recently demonstrated that firms
in these industries are more responsive to environmental third-party ratings than are firms
outside these industries. We would expect firms in these sensitive industries are especially
likely to take environmental capabilities into account in their acquisition choices.
9 Cho and Patten’s list includes oil and gas extraction (SIC 13) as well; however, our sample does not include any facility acquired within this specific industry sector.
29
Table 2, Models 7 and 8 show the results of our analysis of the acquisitions made by
firms in environmentally sensitive industries by replicating Models 5 and 6. The results are
very similar to those obtained with the broader sample. The results of the interaction of
environmental capabilities with distance show distance again strongly moderates this
tendency, and the same pattern found in the broader sample holds: firms only acquire
facilities with different levels of capabilities if the facilities are proximate. While we cannot
formally compare coefficients across the models, we note that for clean firms, the coefficient
on the interaction between environmental performance and distance is higher in
environmentally sensitive industries (-0.185 v. -0.135 across all industries).
Finally, we perform a simple test of the underlying mechanism we think influences
acquisition choice: the ability of firms to transfer improving capabilities among proximate
facilities. To do this, we perform an analysis of percent changes in waste generated by
facilities post-acquisition. In Table 3, we report the average change (per year) in every
chemical at the acquired facilities in the three years following their acquisition. We separate
that into cases where the facility was bought by a firm dirtier or cleaner than its previous
owner, and further separate this by proximity.
*** Please insert Table 3 about here ***
The results indicate that in the three years following acquisition, facilities acquired by clean
firms tend to reduce their waste by a greater amount (-1.64 percent/year) than do those
acquired by dirty firms (-0.82 percent/year), and that this effect is stronger for more
proximate facilities (-4.51 percent/year). This distance effect is not seen in the case of a
dirtier acquirer. Proximate facilities bought by dirtier firms improve less than those that are
somewhat distant, and about the same as those very far away. These results are consistent
with our claim that clean firms are able to transfer capabilities to proximate new acquisitions.
30
The lack of a clear distance result is also consistent with our theory that in the ‘cream–
skimming’ case, firms are transferring capabilities in the reverse direction (from the new
acquisition to the firm).
We recognize the current analysis assumes any facility in a set is a potential target for
a firm, including those acquired by other firms that year. We therefore perform a more
conservative analysis where the facilities acquired by other firms in a given year are excluded
from the pool of potential alternatives. The sign and significance of our results do not change.
Discussion and Conclusion
In this paper, we consider whether environmental capabilities affect corporate strategy.
Specifically, we hypothesize and find that acquisition choices of manufacturing firms are
affected by both their own and their targets’ degree of environmental capabilities. We also
extend the broader literature on corporate strategy by evaluating the conditional acquisition
decisions of firms. In doing so, we advance a previously neglected part of the literature on
acquisition choice, something we call the ‘which one’ decision. Both the ‘turnaround’ and
‘cream–skimming’ cases show the effect of capabilities is contingent on two important
factors. First, the relative difference between acquiring firm and target, not the absolute level
of the target’s capabilities, predicts acquisition. This supports the view of acquisitions as a
market-facilitated matching process between entities who can gain from exchange (Faria,
2008). Second, we show that the propensity for a change in ownership is still strongly
influenced by geographic proximity. We infer that managers recognize the importance of
proximate transfer, and we show preliminary evidence that this recognition is justified.
With regard to the literature on organizations and the natural environment, we provide
evidence that environmental capabilities do, in fact, affect corporate strategy, an important
topic that previously has been neglected (Diestre & Rajagopolan, 2010). Our research

31
suggests a different dynamic than has been considered by the environmental management
literature. Where most previous studies have assumed differences in strategy lead to different
outcomes (including abilities), our research shows a firm’s stock of abilities can influence its
strategy.
Our research also demonstrates one way environmental capabilities may diffuse
among firms. Given the growing importance of environmental capabilities, such diffusion is
vital to achieving social goals of economic growth and environmental protection. Our
research presents evidence that the pursuit of private gain may facilitate the transfer of
needed abilities.
Most importantly, our results open up corporate strategy as a new area of research on
green management. Future research could further explore how environmental capabilities
influence other aspects of corporate ownership. For example, do environmental capabilities
affect joint venture partners or new product line introductions? Our research also reveals the
importance of research on post-acquisition changes in capabilities. Our results suggest those
firms with strong capabilities are, in fact, able to infuse their newly acquired units with those
capabilities. When and how such transfer occurs could be an important question for future
research.
For the broader management literature on corporate strategy, we bring renewed
attention to the determinants of the conditional acquisition choice, the aforementioned ‘which
one’ decision. Prior research in acquisitions has found that, in general, acquiring firms tend to
undertake turnaround acquisitions, as lower-performing targets are more likely to be acquired
(Lichtenberg et al., 1987; Banaszak-Holl et al., 2002). Our results suggest that while low-
performing facilities often are acquisition targets, it is important to consider the relative
capabilities of the acquirer and the target, as well as factors that affect the ease of transferring
capabilities between the new owner and the target.

32
Finally, our work provides evidence of the role physical distance plays in corporate
strategy. Capabilities on which firms compete often are rooted in tacit knowledge (Kogut &
Zander, 1992), and distance remains an important determinant of a firm’s ability to manage
capabilities. In theory, knowledge can be transferred in a relatively costless manner across
distances. But to the degree that transferring capabilities requires dissemination of tacit
knowledge, firms may need to develop a strong cooperative relationship between the parent
and the newly acquired unit, as cooperation enhances trust, which, in turn, may enhance tacit
knowledge transfer (Bresman, Birkinshaw, & Nobel, 1999; Szulanski, 1996). Moreover,
cooperation and trust are enhanced by both physical proximity and similarity (Stuart &
Sorenson, 2003).
Our findings provide implications for managers as well. We highlight the increasingly
important role of environmental capabilities in managerial decisions and demonstrate that the
propensity to transfer environmental capabilities influences the acquisition decision process.
Given the tacit nature of environmental capabilities, managers involved in M&A activities
need to trade off the ease of knowledge transfer to or from a target with similar capabilities
and the difficult, yet potentially more valuable, transfer that involves a target with dissimilar
capabilities. To relieve this tension, managers in our sample tended to choose dissimilar yet
proximate targets. Proximity facilitates the transfer of complex know-how between an
acquiring firm and its new target while reducing monitoring and coordinating costs.
Our work has important limitations. The TRI data have a number of strengths, but
they include only those facilities that manufacture or use sufficient quantities of the pertinent
chemicals, so we are not able to include acquisitions of non-TRI-reporting facilities. For our
hypotheses regarding the role of environmental capabilities in acquisitions, however,
including other facilities would only introduce additional alternatives, and these should not
affect the preferences. Second, our use of conditional logistic analysis causes us to force

33
firms to choose from among facilities that are in the same industry as the facility they
ultimately acquired. We are unsure whether broadening the pool to include greater diversity
among targets would change our results, but our modeling strategy allowed for a tractable set
of alternatives from which firms could choose and broader choice sets would not do so.
There are three important benefits to our approach that offset the limitations noted
above. First, the TRI data contain both publicly traded and privately held firms, so our
analysis of acquisition choices does include private firms, which, by definition, are excluded
from the majority of acquisition studies that focus on stock price reactions. Since most
acquisitions involve private firms as either sellers or buyers, excluding such firms is
problematic (Aldrich, 1999). Second, since the data are collected at the facility level, we are
able to assess the degree to which establishment-level attributes affect the likelihood a
particular establishment will occur; again, such acquisitions are commonplace and it is
important to ensure they are included. Finally, the data allow us to consider how operation-
level factors, such as the actual chemicals used and/or produced at a facility, affect the
probability a firm will acquire a given facility.
In summary, our research provides important new evidence on the way differing
environmental capabilities influence ownership changes. This evidence suggests
environmental performance affects corporate strategy and that it does so in a different way
for clean firms than for dirty firms. It appears green management matters not only within the
firm but in deciding how to extend the very boundaries of the firm itself.

34
References
Adler PS. 1990. Shared learning. Management Science 36(8): 938–957. Ahuja G, Katila R. 2001. Technological acquisitions and the innovation performance of acquiring firms: a longitudinal study. Strategic Management Journal 22(3): 197–220. Aiken LS, West SG, Reno RR. 1991. Multiple Regression: Testing and Interpreting Interactions. Sage: Newbury Park, CA. Aldrich H. 1999. Organizations Evolving. Sage: London, UK. Allen TJ. 1977. Managing the Flow of Technology: Technology Transfer and the Dissemination of Technological Information within the R&D Organization. MIT Press: Cambridge, MA. Anand J, Delios A. 2002. Absolute and relative resources as determinants of international acquisitions. Strategic Management Journal 23(2): 119–134. Arikan AM, McGahan AM. 2010. The development of capabilities in new firms. Strategic Management Journal 31(1): 1–18. Balsvik R, Haller SA. Picking “Lemons” or Picking “Cherries”? Domestic and Foreign Acquisitions in Norwegian Manufacturing. Scandinavian Journal of Economics 112(2): 361-387. Banaszak-Holl J, Berta WB, Bowman DM, Baum JAC, Mitchell W. 2002. The rise of human service chains: antecedents to acquisitions and their effects on the quality of care in US nursing homes. Managerial and Decision Economics 23: 261–282. Barney JB. 1988. Returns to bidding firms in mergers and acquisitions: reconsidering the relatedness hypothesis. Strategic Management Journal 9: 71–78. Baum JAC, Li SX, Usher JM. 2000. Making the next move: how experiential and vicarious learning shape the locations of chains’ acquisitions. Administrative Science Quarterly 45(4): 766–801.
35
Becker FD, Steele F. 1995. Workplace by Design: Mapping the High-Performance Workscape. Jossey-Bass: San Francisco, CA. Berchicci L, King A. 2007. Postcards from the edge: a review of the business and environment literature. Academy of Management Annals 1(1): 513–547. Bowman EH, Singh H. 1993. Corporate restructuring: reconfiguring the firm. Strategic Management Journal 14: 5–14. Bresman H, Birkinshaw J, Nobel R. 1999. Knowledge transfer in international acquisitions. Journal of International Business Studies 30(3): 439–462. Capron L, Dussauge P, Mitchell W. 1998. Resource redeployment following horizontal acquisitions in Europe and North America, 1988–1992. Strategic Management Journal 19(7): 631–661. Capron L, Pistre N. 2002. When do acquirers earn abnormal returns? Strategic Management Journal 23(9): 781–794. Chatterji AK, Toffel MW. 2010. How firms respond to being rated. Strategic Management Journal 31(9): 917–945. Cho CH, Patten DM. 2007. The role of environmental disclosures as tools of legitimacy: a research note. Accounting, Organizations and Society 32(7–8): 639–647. Christmann P. 2000. Effects of "best practices" of environmental management on cost advantage: The role of complementary assets. Academy of Management Journal 43(4): 663-680. Daft RL, Lengel RH. 1986. Organizational information requirements, media richness and structural design. Management Science 32(5): 554–571. Delmas M, Toffel MW. 2004. Stakeholders and environmental management practices: an institutional framework. Business Strategy and the Environment 13(4): 209–222. Diestre L, Rajagopolan N. 2011. An environmental perspective on diversification: the effects of chemical relatedness and regulatory sanctions. Academy of Management Journal 54(1): 97–115.
36
Dowell, G. 2006. Product line strategies of new entrants in established industries: evidence from the U.S. bicycle industry. Strategic Management Journal 27: 959–979. Dowell G, Hart S, Yeung B. 2000. Do corporate global environmental standards create or destroy market value? Management Science 46(8): 1059–1074. Faria AL. 2008. Mergers and the market for organization capital. Journal of Economic Theory 138(1): 71–100. Fleming L, Marx M. 2006. Managing creativity in small worlds. California Management Review 48(4): 6–27. Fowler KL, Schmidt DR. 1988. Tender offers, acquisitions, and subsequent performance in manufacturing firms. Academy of Management Journal 31(4): 962–974. Freudenberg WR. 2005. Privileged access, privileged accounts: toward a socially structured theory of resources and discourses. Social Forces 84: 89–114. Galbraith CS. 1990. Transferring core manufacturing technologies in high-technology firms. California Management Review 32(4): 56–70. Greve HR. 2000. Market niche entry decisions: competition, learning, and strategy in Tokyo banking, 1894–1936. Academy of Management Journal 43(5): 816–836. Hannan MT, Freeman J. 1989. Organizational Ecology. Harvard University Press: Cambridge, MA. Hart SL. 1995. A natural-resource-based view of the firm. Academy of Management Review 20(4): 986–1014. Haveman HA. 1993. Organizational size and change: diversification in the savings and loan industry after deregulation. Administrative Science Quarterly 38(1): 20–50. Hoetker G. 2007. The use of logit and probit models in strategic management research: critical issues. Strategic Management Journal 28(4): 331–343.

37
Huselid MA, Jackson SE, Schuler RS. 1997. Technical and strategic human resource management effectiveness as determinants of firm performance. Academy of Management Journal 40(1): 171–188. Ingram P, Baum JAC. 1997. Opportunity and constraint: organizations’ learning from the operating and competitive experience of industries. Strategic Management Journal 18: 75–98. Jones WP, Furnas GW. 1987. Pictures of relevance: a geometric analysis of similarity measures. Journal of the American Society for Information Science 38(6): 420–442. Kalnins A, Chung W. 2004. Resource-seeking agglomeration: a study of market entry in the lodging industry. Strategic Management Journal 25(7): 689–699. Karim S, Mitchell W. 2000. Path-dependent and path-breaking change: reconfiguring business resources following acquisitions in the US medical sector, 1978–1995. Strategic Management Journal 21(10–11): 1061–1081. Kerwin KA. 2000. At Ford, the more brands the merrier. Business Week 58 April 3. King AA, Lenox MJ. 2000. Industry self-regulation without sanctions: the chemical industry’s responsible care program. Academy of Management Journal 43(4): 698–716. King A, Lenox M. 2002. Exploring the locus of profitable pollution reduction. Management Science 48(2): 289–299. Klassen RD, McLaughlin CP. 1996. The impact of environmental management on firm performance. Management Science 42(8): 1199–1214. Klassen RD, Whybark DC. 1999. The impact of environmental technologies on manufacturing performance. Academy of Management Journal 42(6): 599–615. Kogut B, Zander U. 1992. Knowledge of the firm, combinative capabilities, and the replication of technology. Organization Science 3(3): 383–397. Konar S, Cohen M. 1997. Information as regulation: the effect of community right to know laws on toxic emissions. Journal of Environmental Economics and Management 32: 109–124.

38
Kreutzer L. 2010. Carlyle Group teams up with EDF. The Wall Street Journal March 18. Lichtenberg FR, Siegel D, Jorgenson D, Mansfield E. 1987. Productivity and changes in ownership of manufacturing plants. Brookings Papers on Economic Activity 3: 643–683. Margolis JD, Walsh JP. 2001. People and Profits? The Search for a Link Between a Company’s Social and Financial Performance. Lawrence Erlbaum Associates: Mahwah, NJ. Moeller SB, Schlingemann FP, Stulz RM. 2005. Wealth destruction on a massive scale? a study of acquiring-firm returns in the recent merger wave. Journal of Finance 60(2): 757–782. Nelson RR, Winter SG. 1982. An Evolutionary Theory of Economic Change. Belknap Press of Harvard University Press: Cambridge, MA. Norburn D, Birley S. 1988. The top management team and corporate performance. Strategic Management Journal 9(3): 225–237. Ravenscraft D, Scherer FM. 1987. Mergers, Sell-Offs and Economic Efficiency. Brookings Institution Press: Washington, DC. Rivkin JW. 2000. Imitation of complex strategies. Management Science 46(6): 824–844. Rosenkopf L, Almeida P. 2003. Overcoming local search through alliances and mobility. Management Science 49(6): 751–766. Russo MV, Fouts PA. 1997. A resource-based perspective on corporate environmental performance and profitability. Academy of Management Journal 40(3): 539–559. Siegel DS, Simons KL. 2010. Assessing the effects of mergers and acquisitions on firm performance, plant productivity, and workers: new evidence from matched employer-employee data. Strategic Management Journal 31(8): 903–916. Sohn MW. 2001. Distance and cosine measures of niche overlap. Social Networks 23(2): 141–165.
39
St. John CH, Harrison JS. 1999. Manufacturing-based relatedness, synergy, and coordination. Strategic Management Journal 20(2): 129–145. Stuart TE, Sorenson O. 2003. Liquidity events and the geographic distribution of entrepreneurial activity. Administrative Science Quarterly 48(2): 175–201. Szulanski G. 1996. Exploring internal stickiness: impediments to the transfer of best practice within the firm. Strategic Management Journal 17: 27–43. Toffel MW, Marshall JD. 2004. Improving environmental performance assessment: a comparative analysis of weighting methods used to evaluate chemical release inventories. Journal of Industrial Ecology 8(1–2): 143–172. Vermeulen F, Barkema H. 2001. Learning through acquisitions. Academy of Management Journal 44(3): 457–476. Williams C. 2007. Transfer in context: replication and adaptation in knowledge transfer relationships. Strategic Management Journal 28(9): 867–889. Winter SG. 2003. Understanding dynamic capabilities. Strategic Management Journal 24(10): 991–995. Womack JP, Jones DT, Roos D. 1991. The Machine that Changed the World: How Japan’s Secret Weapon in the Global Auto Wars Will Revolutionize Western Industry (1st HarperPerennial ed.). Harper Perennial: New York, NY. Wood A. 2000. Fixing up a big mess down in Savannah. Chemical Week. October 25. Wood C. 2010. Toyota and Tesla to partner on electric cars; Tesla buys NUMMI to build model S in California. Autoguide. May 20. Zelner BA. 2009. Using simulation to interpret results from logit, probit, and other nonlinear models. Strategic Management Journal 30(12): 1335-1348
Zollo M, Singh H. 2004. Deliberate learning in corporate acquisitions: post-acquisition strategies and integration capability in US bank mergers. Strategic Management Journal 25(13): 1233–1256.

40
Table 1. Descriptive Statistics Variable Mean Std. Dev. Min Max 1 2 3 4 5 6 7 8 9
1 Waste generation 0.00 1.00 -4.36 8.53 1
2 Average distance 7.19 0.71 0 9.21 -0.03 1
3 Chemical use overlap 0.36 0.32 0 1 0.03 0.03 1
4 Plant’s size discrepancy 1.38 1.10 0 8.06 -0.01 0.02 -0.07 1
5 SIC overlap 0.36 0.35 0 1 0.00 -0.09 0.10 -0.08 1
6 Labor productivity 0.00 0.56 -19.45 7.57 0.02 0.00 0.00 -0.01 0.00 1
7 Regulatory overlap 1.00 0.29 0 1.5 0.07 -0.10 -0.02 -0.07 0.06 0.01 1
8 Same state location 0.25 0.43 0 1 0.00 -0.20 0.21 0.00 -0.08 0.00 0.01 1
9 Relative regulatory stringency 0.37 0.35 0 4.05 0.01 0.19 -0.05 0.01 0.03 0.01 -0.01 -0.18 1

41
Table 2. Conditional Choice Models.
Full Sample Environmentally Sensitive Industries
Only
Model 1 Model 2 Model 3 Model 4 Model 5 Model 6 Model 7 Model 8
Clean firm Dirty firm Clean firm Dirty firm Clean firm Dirty firm Clean firm Dirty firm
Waste generation (H1a/H1b) 0.052
(0.033) 0.084*** (0.029)
0.037 (0.033)
0.099*** (0.029)
0.072 (0.062)
0.195*** (0.049)
Waste generation X average distance (H2a/H2b)
-0.135*** (0.043)
0.119*** (0.037)
-0.185** (0.082)
0.122** (0.060)
Controls
Average distance -0.150*** (0.043)
-0.229*** (0.038)
-0.152*** (0.043)
-0.223*** (0.038)
-0.186*** (0.045)
-0.271*** (0.041)
-0.185** (0.082)
-0.227*** (0.065)
Chemical use overlap
1.514*** (0.134)
1.769*** (0.127)
1.537*** (0.135)
1.759*** (0.127)
1.563*** (0.136)
1.794*** (0.128)
2.148*** (0.280)
2.282*** (0.252)
Plant’s size discrepancy
-0.285*** (0.041)
-0.195*** (0.035)
-0.284*** (0.041)
-0.195*** (0.035)
-0.288*** (0.041)
-0.199*** (0.035)
-0.196*** (0.071)
-0.218*** (0.058)
SIC overlap 2.459*** (0.428)
1.638*** (0.371)
2.448*** (0.427)
1.591*** (0.371)
2.454*** (0.426)
1.622*** (0.371)
2.690*** (0.644)
1.185** (0.539)
Labor productivity -0.039 (0.058)
0.091 (0.058)
Regulatory overlap 0.354*** (0.133)
0.354*** (0.120)
0.347*** (0.134)
0.329*** (0.121)
0.363*** (0.134)
0.335*** (0.121)
0.740*** (0.256)
0.092 (0.200)
Same state location 0.231*** (0.087)
0.418*** (0.074)
0.233*** (0.087)
0.417*** (0.074)
0.222** (0.087)
0.408*** (0.074)
0.108 (0.160)
0.358*** (0.123)
Relative regulatory stringency
-0.088 (0.117)
0.205** (0.095)
-0.090 (0.117)
0.197** (0.095)
-0.091 (0.117)
0.202** (0.095)
-0.104 (0.180)
-0.052 (0.144)
Observations 98419 130766 98419 130766 98419 130766 31918 54223 Chi2 308.7 437.5 311.2 446.0 321.2 456.4 123.0 183.4 Standard errors in parentheses *** p<0.01, ** p<0.05, * p<0.1

42
Table 3: Average Waste Reduction in Three Years Following Acquisition
Close Typical Far
Median distance (Dist.<-1SD) (-1SD<Dist<+1SD) (Dist >+1SD)
Cleaner
acquirer -1.64* -4.51 -1.25 -0.64
Dirtier
acquirer
-0.82
-0.12
-1.75
0.00
* The reported values are ln(Wi,t+1/ Wi,t) for W lbs of each chemical i in year t (which is approximately the percentage change in waste for the relevant range of changes in the data). For each facility, we average this value for each i chemical in year t. Thus, the values in the table approximate the average percentage change of all of the chemicals in a facility in a focal year.
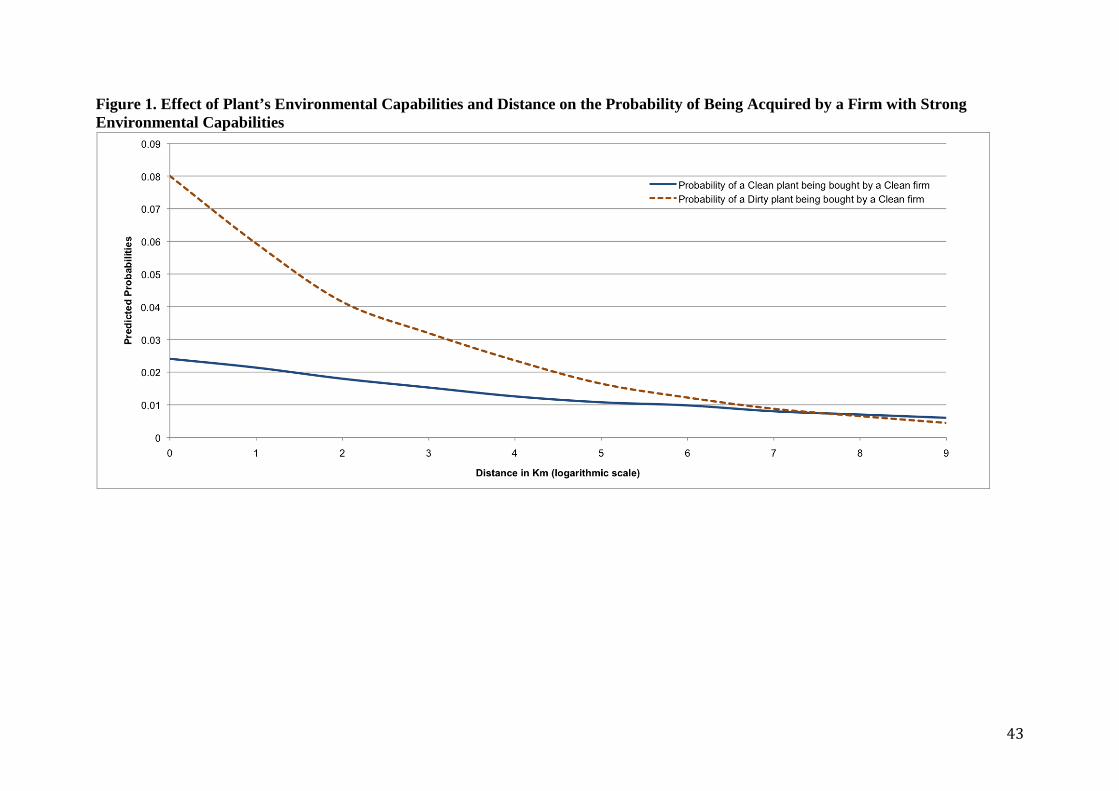
43
Figure 1. Effect of Plant’s Environmental Capabilities and Distance on the Probability of Being Acquired by a Firm with Strong Environmental Capabilities

44
Figure 2. Effect of Plant’s Environmental Capabilities and Distance on the Probability of Being Acquired by a Firm with Weak Environmental Capabilities