Environmental Assessment of Ogoniland Site Specific Fact ... · Environmental Assessment of...
12
Environmental Assessment of Ogoniland Site Specific Fact Sheets GIOR- K.DERE This fact sheet is part of a series prepared as part of the Environmental Assessment of Ogoniland by the United Nations Environment Programme (UNEP). It provides the observations and results from one of the individual sites studied in detail, plus the specific risk reduction measures for follow-up action. This fact sheet should be read in conjunction with the main assessment report available at: www.unep.org/nigeria. July 2011
Transcript of Environmental Assessment of Ogoniland Site Specific Fact ... · Environmental Assessment of...

Environmental Assessment of OgonilandSite Specific Fact Sheets
GIOR- K.DERE
This fact sheet is part of a series prepared as part of the Environmental Assessment of Ogoniland by the United Nations Environment Programme (UNEP). It provides the
observations and results from one of the individual sites studied in detail, plus the specific risk reduction measures for follow-up action.
This fact sheet should be read in conjunction with the main assessment report available at: www.unep.org/nigeria.
July 2011

July 2011 2 / 12
UNEP Environmental Assessment of Ogoniland
Site fact sheetSee Guide to content and terminology on last page.
I - Site Description
Site Name GIOR- K.DERE
Site Number qc_019-020
LGA GOKANA
Main community DEBON BODO MOGHO
Surrounding communities BIARA
BODO
BODO DEBON
DEBON BODO
DEBON BODO MOGHO
DEBON MOGHO BODO
Investigated area (ha) 22.69
Category SPDC Pipeline ROW
Eastings (WGS 84, Zone 32N) 309025
Northings (WGS 84, Zone 32N) 513006
Recommendations for risk reduction
- Communities should be informed in community meetings about health and safety precautions.
- A community based security and surveillance system should be put in place so that there is voluntary compliance with the restrictions which are needed to protect public health.
- The impacted area should be demarcated and appropriate signage put in place to indicate that the site is impacted.
- Highly contaminated core areas should be fenced and guarded until emergency cleanup measures have been carried out.
- Floating oil on the surface, if any, should be collected and treated off site.
- Owners of hydrocarbon-contaminated community wells should be informed and alternative drinking water supply provided to them.
- The site should be remodelled to prevent run off from the contaminated area into the downstream swamps.
- Runoff from the area should be monitored and if necessary collected and treated while the cleanup plan is developed and implemented.
- Additional soil sampling along with trial pits should be done at the contaminated site to delineate the site to be excavated for clean up.
- A detailed plan should be prepared for clean up of the contaminated soil and risk reduction at site.
- A system of ground water monitoring wells should be installed to act as early warning for communities which are not yet impacted by ground water contamination.
- A detailed plan should be prepared for clean up of the contaminated water and risk reduction in the community.
- While undertaking the clean up, management of excavation water should be handled properly to ensure that no pollutants are emitted into the environment without control.
July 2011 3 / 12
II - Oilfield Infrastructure Type
Wells No
Flowstations No
Manifolds No
Flaresites No
Oil pipeline in operation 24" BOMU TO BONNY TRUNKLINE
28" BOMU TO BONNY TRUNKLINE
NNPC crude line No
NNPC product line No
III - Spill History
Spills reported by SPDC Incident Number Incident Date
2007_00214 20070618
356474
Spill reported by community Yes
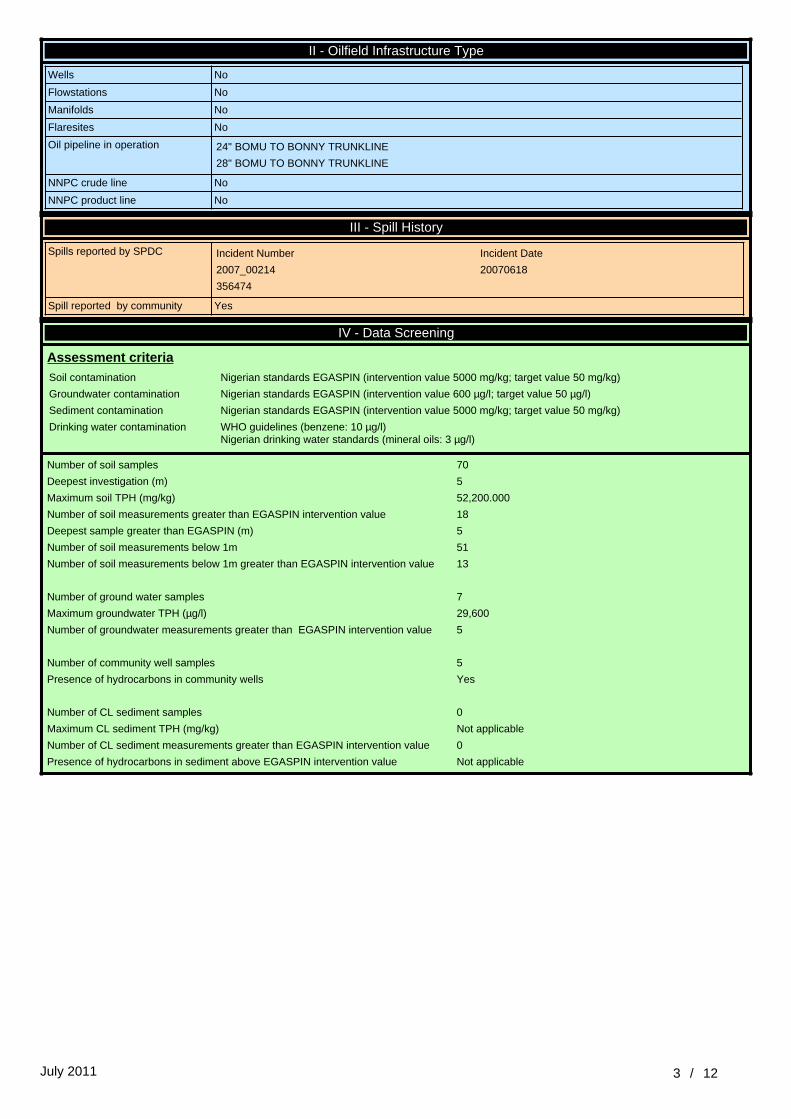
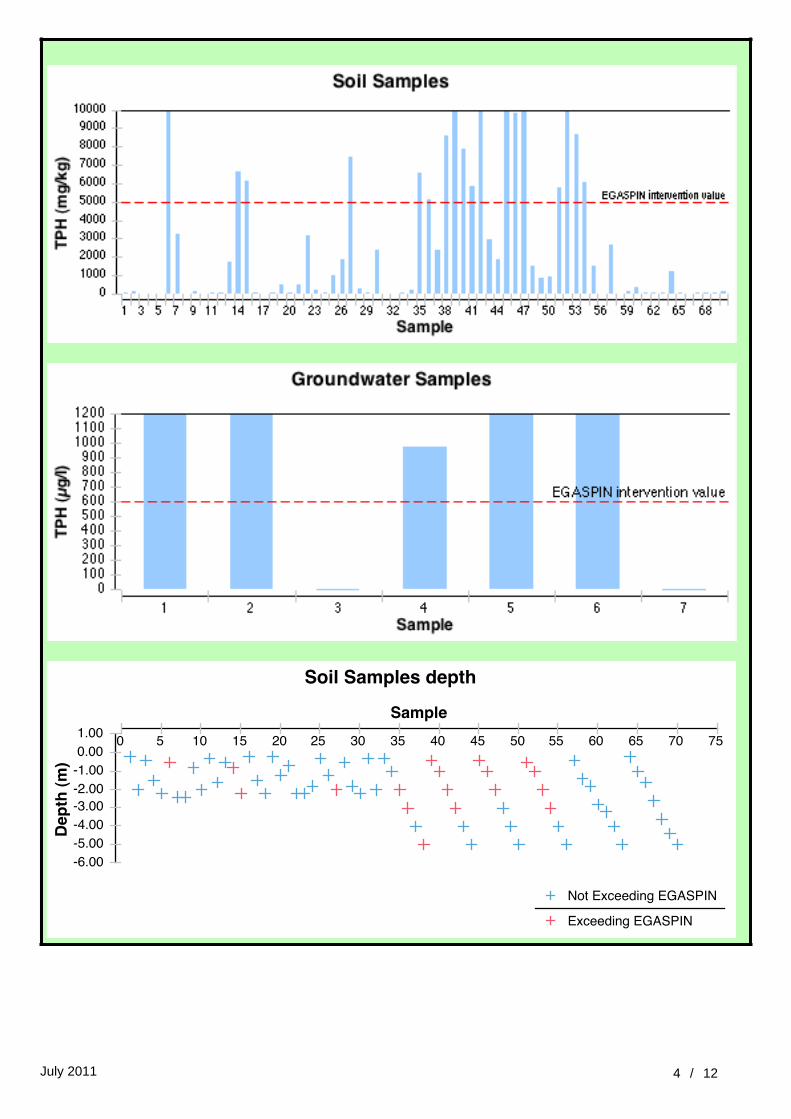
IV - Data Screening
Assessment criteriaSoil contamination Nigerian standards EGASPIN (intervention value 5000 mg/kg; target value 50 mg/kg)
Groundwater contamination Nigerian standards EGASPIN (intervention value 600 µg/l; target value 50 µg/l)
Sediment contamination Nigerian standards EGASPIN (intervention value 5000 mg/kg; target value 50 mg/kg)
Drinking water contamination WHO guidelines (benzene: 10 µg/l)Nigerian drinking water standards (mineral oils: 3 µg/l)
Number of soil samples 70
Deepest investigation (m) 5
Maximum soil TPH (mg/kg) 52,200.000
Number of soil measurements greater than EGASPIN intervention value 18
Deepest sample greater than EGASPIN (m) 5
Number of soil measurements below 1m 51
Number of soil measurements below 1m greater than EGASPIN intervention value 13
Number of ground water samples 7
Maximum groundwater TPH (µg/l) 29,600
Number of groundwater measurements greater than EGASPIN intervention value 5
Number of community well samples 5
Presence of hydrocarbons in community wells Yes
Number of CL sediment samples 0
Maximum CL sediment TPH (mg/kg) Not applicable
Number of CL sediment measurements greater than EGASPIN intervention value 0
Presence of hydrocarbons in sediment above EGASPIN intervention value Not applicable
July 2011 4 / 12

July 2011 5 / 12
V - Maps
Satellite image of the site

July 2011 6 / 12
Sampling location map

July 2011 7 / 12
Landcover 2007

July 2011 8 / 12
Soil Contamination Map
The values shown next to soil sample points represent the average TPH value for all samples taken from the borehole at that location.

July 2011 9 / 12
VI - Photos
Aerial photograph
Ground photograph

July 2011 10 / 12
VII - Sample List
Soil sample list
Sample Identifier Total petroleum hydrocarbon (mg/kg) Depth (m) Easting Northing
2077139 6,650.000 0.80 308982 512985
2077412 1,760.000 0.50 308982 512985
2077417 13.200 2.00 308947 512895
2077434 53.500 2.20 309006 512915
2077443 6,140.000 2.20 308982 512985
2077452 514.000 0.20 309111 512854
2077470 48.000 1.20 309111 512854
2077496 14,900.000 0.50 308973 513103
2077512 2,410.000 2.20 309020 512974
2077536 106.000 0.20 309006 512915
2077552 7,420.000 2.00 308969 513020
2077573 1,900.000 1.20 308969 513020
2077593 30.700 0.30 308947 512895
2077600 3,260.000 2.40 308973 513103
2077604 139.000 2.00 308970 513077
2077629 149.000 0.80 308971 513134
2077653 1,020.000 0.30 308969 513020
2077672 305.000 0.50 309020 512974
2077696 193.000 2.20 309050 512838
2077708 532.000 0.70 308947 512948
2077720 9.480 0.40 308988 513170
2077730 105.000 0.20 308970 513077
2077742 21.500 2.40 309005 513103
2077793 62.100 1.80 309003 512835
2077814 7.080 1.50 308988 513170
2077859 59.400 0.30 308939 513177
2077913 18.400 2.20 308988 513170
2077929 56.400 1.80 309020 512974
2077946 3,210.000 2.20 308947 512948
2078075 not analyzed for TPH 1.50 309006 512915
2078252 6.070 2.00 308971 513134
2078303 60.800 1.60 308939 513177
2351038 77.000 0.30 309084 512968
2351059 209.000 1.00 309084 512968
2351094 8,570.000 5.00 309084 512968
2352930 5,120.000 3.00 309084 512968
2352964 6,560.000 2.00 309084 512968
2353537 2,370.000 4.00 309084 512968
2555433 52,200.000 0.40 308992 512885
2555434 7,860.000 1.00 308992 512885

July 2011 11 / 12
Sample Identifier Total petroleum hydrocarbon (mg/kg) Depth (m) Easting Northing
2555437 5,850.000 2.00 308992 512885
2555438 9,880.000 3.00 308992 512885
2555439 2,990.000 4.00 308992 512885
2555441 1,890.000 5.00 308992 512885
2555442 5,770.000 0.50 308960 513006
2555443 11,500.000 1.00 308960 513006
2555445 8,650.000 2.00 308960 513006
2555447 6,070.000 3.00 308960 513006
2555448 1,520.000 4.00 308960 513006
2555449 not analyzed for TPH 5.00 308960 513006
2555451 12,800.000 0.40 308976 512959
2555452 9,820.000 1.00 308976 512959
2555453 18,100.000 2.00 308976 512959
2555454 1,550.000 3.00 308976 512959
2555457 895.000 4.00 308976 512959
2555459 958.000 5.00 308976 512959
2555460 1,250.000 0.20 309020 512880
2555461 54.700 1.00 309020 512880
2555462 26.100 1.60 309020 512880
2555464 39.100 2.60 309020 512880
2555465 80.700 3.60 309020 512880
2555466 66.600 4.40 309020 512880
2555467 161.000 5.00 309020 512880
2556219 2,660.000 0.40 309064 512855
2556220 not analyzed for TPH 1.40 309064 512855
2556221 133.000 1.80 309064 512855
2556222 351.000 2.80 309064 512855
2556223 41.900 3.20 309064 512855
2556224 41.900 4.00 309064 512855
2556226 47.500 5.00 309064 512855
Groundwater sample list
Sample Identifier Total petroleum hydrocarbon (µg/l) Easting Northing
2555480 7,400 308992 512885
2555481 29,600 308976 512959
2555482 BDL 309020 512880
2724346 5,870 308974 513129
2724350 971 309006 512895
2724351 BDL 308983 513165
2724355 23,700 309003 512904
Community well sample list
Sample Identifier Total petroleum hydrocarbon (µg/l) Easting Northing
2555486 BDL 308817 512589
2555488 BDL 308826 512643
2724347 BDL 308803 512720
2724348 BDL 308841 512621
2724356 4,240.000 308887 513109

July 2011 12 / 12
Guide To Content
Guide to content
The Site Fact Sheets present more detailed data from UNEP’s environmental assessment of Ogoniland on a site-by-site basis. Note that all data is based on the analysis of samples taken during the fieldwork period. The period of most intensive fieldwork ran from April to December 2010. The final sampling visit was completed in January 2011.
Here is a guide to the terms and abbreviations used. Please refer to the Environmental Assessment of Ogoniland report for details of EGASPIN target and intervention values.
Terminology
Site number Reference number allocated by UNEP to identify a study site
Area (ha) Estimated surface area (in hectares) of a given study site
Well Oil well, also referred to as a production well
Fugro well New well installed by Fugro at UNEP’s request to enable scientific sampling and monitoring
Community well Wells belonging to communities which are used to collect water for drinking and sanitation needs
Contamination contour Maps that display the geographical distribution of oil contamination concentrations in an analyzed receptor
Flare site Indicates whether the burning of unwanted gas through a pipe (or flare) takes place at a given site
Flow station Separation facilities (also called gathering centres) which separate natural gas and water from crude oil extracted from production wells
Incident number Numbers as supplied from the SPDC oil spills database
Manifold An arrangement of piping or valves designed to control, distribute and often monitor fluid flow
Abbreviations
BDL Below Detection Limit
CL Contaminated Land
EGASPIN Environmental Guidelines and Standards for Petroleum Industries in Nigeria
GW groundwater
LGA Local Government Area
mbgs metre/s below ground surface
NNPC Nigerian National Petroleum Corporation
SPDC Shell Petroleum Development Company of Nigeria
TPH total petroleum hydrocarbons
UNEP United Nations Environment Programme
Explanatory Note
1. The recommendations given are for initial risk reduction. Final clean up would need significant additional site specific engineering as well as consultation work.
2. Spill reported by SPDC has the date format YYYYMMDD3. Assessment is done based on a screening of the measured value against a Nigerian or international standard4. In the soil sample maps, the highest value has been cut-off to 2 times the intervention value. This was done to visually express the excedences
above intervention values. Actual values are given in the sample tables.5. The values of soil contamination listed in the Soil Contamination Maps are average values of all samples taken at that sampling location