Environmental assessment of nanomaterial use in … · 2 Environmental assessment of nanomaterial...
100
Environmental assessment of nanomaterial use in Denmark Environmental project No. 1788, 2015
Transcript of Environmental assessment of nanomaterial use in … · 2 Environmental assessment of nanomaterial...
Environmental assessment of nanomaterial use in Denmark Environmental project No. 1788, 2015

2 Environmental assessment of nanomaterial use in Denmark
Title:
Environmental assessment of nanomaterial
use in Denmark
Authors:
Jesper Kjølholt1
Fadri Gottschalk2
Anna Brinch1
Hans-Christian Holten Lützhøft3
Nanna B. Hartmann3
Bernd Nowack2
Anders Baun3
1 COWI A/S 2 Swiss Nano Modelling Consortium (SNMC) 3 DTU Miljø
Published by:
The Danish Environmental Protection Agency
Strandgade 29
1401 Copenhagen K
Denmark
www.mst.dk/english
Year:
2015
ISBN no.
978-87-93352-71-1
Disclaimer:
When the occasion arises, the Danish Environmental Protection Agency will publish reports and papers concerning
research and development projects within the environmental sector, financed by study grants provided by the Danish
Environmental Protection Agency. It should be noted that such publications do not necessarily reflect the position or
opinion of the Danish Environmental Protection Agency.
However, publication does indicate that, in the opinion of the Danish Environmental Protection Agency, the content
represents an important contribution to the debate surrounding Danish environmental policy.
Sources must be acknowledged.

Environmental assessment of nanomaterial use in Denmark 3
Contents
Preface ...................................................................................................................... 5
Executive Summary ................................................................................................... 7
Sammenfatning ........................................................................................................ 11
1. Introduction ..................................................................................................... 15
2. Approach and methodology ............................................................................... 17 2.1 Environmental exposure to ENMs ....................................................................................... 17 2.2 Environmental effects of ENMs ........................................................................................... 18 2.3 Environmental risk assessment of ENMs ............................................................................ 19
3. Environmental risk assessment of selected ENMs ............................................. 21 3.1 Introduction .......................................................................................................................... 21 3.2 Risk assessment of photostable nano-titanium dioxide..................................................... 22
Sources and releases ............................................................................................. 22 3.2.1
Important environmental fate processes ............................................................. 23 3.2.2
Environmental exposure....................................................................................... 24 3.2.3
Environmental effects ........................................................................................... 25 3.2.4
Environmental risk assessment............................................................................ 26 3.2.5
Summary for photostable TiO2 ............................................................................ 28 3.2.6
3.3 Risk assessment of photocatalytic nano-titanium dioxide ................................................ 28 Sources and releases ............................................................................................. 29 3.3.1
Important environmental fate processes ............................................................. 30 3.3.2
Environmental exposure........................................................................................ 31 3.3.3
Environmental effects ........................................................................................... 32 3.3.4
Environmental risk assessment............................................................................ 33 3.3.5
Summary for photocatalytic TiO2 ......................................................................... 34 3.3.6
3.4 Risk assessment of nano-zinc oxide (nano-ZnO) ............................................................... 34 Sources and releases ............................................................................................. 34 3.4.1
Important environmental fate processes ............................................................. 36 3.4.2
Environmental exposure....................................................................................... 36 3.4.3
Environmental effects ............................................................................................37 3.4.4
Environmental risk assessment............................................................................ 38 3.4.5
Summary for nano-ZnO ........................................................................................ 39 3.4.6
3.5 Risk assessment of nano-silver (nano-Ag) ......................................................................... 39 Sources and releases ............................................................................................. 39 3.5.1
Important environmental fate processes .............................................................. 41 3.5.2
Environmental exposure........................................................................................ 41 3.5.3
Environmental effects ........................................................................................... 43 3.5.4
Environmental risk assessment............................................................................ 44 3.5.5
Summary for nano-Ag........................................................................................... 45 3.5.6
3.6 Risk assessment of carbon nanotubes (CNT) ..................................................................... 45 Sources and releases ............................................................................................. 45 3.6.1
Important environmental fate processes ............................................................. 47 3.6.2
Environmental exposure....................................................................................... 47 3.6.3
Environmental effects ........................................................................................... 48 3.6.4
Environmental risk assessment............................................................................ 49 3.6.5
Summary for CNT ................................................................................................. 50 3.6.6

4 Environmental assessment of nanomaterial use in Denmark
3.7 Risk assessment of nano-copper carbonate (nano-CuCO3) ............................................... 50 Sources and releases ............................................................................................. 50 3.7.1
Important environmental fate processes ............................................................. 52 3.7.2
Environmental exposure....................................................................................... 52 3.7.3
Environmental effects ........................................................................................... 54 3.7.4
Environmental risk assessment............................................................................ 54 3.7.5
Summary for nano-copper carbonate/oxide.........................................................55 3.7.6
3.8 Risk assessment of nano-zero valent iron (nZVI) .............................................................. 56 Sources and releases ............................................................................................. 56 3.8.1
Important environmental fate processes .............................................................. 57 3.8.2
Environmental exposure........................................................................................ 57 3.8.3
Environmental effects ............................................................................................ 57 3.8.4
Environmental risk assessment............................................................................ 58 3.8.5
Summary for nZVI ................................................................................................ 59 3.8.6
3.9 Risk assessment of nano-cerium dioxide (nano-CeO2) ...................................................... 59 Sources and releases ............................................................................................. 59 3.9.1
Important environmental fate processes .............................................................. 61 3.9.2
Environmental exposure........................................................................................ 61 3.9.3
Environmental effects ........................................................................................... 62 3.9.4
Environmental risk assessment............................................................................ 63 3.9.5
Summary for nano-CeO2....................................................................................... 64 3.9.6
3.10 Risk assessment of quantum dots (QD) .............................................................................. 64 Sources and releases ............................................................................................. 64 3.10.1
Important environmental fate processes ............................................................. 65 3.10.2
Environmental exposure....................................................................................... 65 3.10.3
Environmental effects ........................................................................................... 67 3.10.4
Environmental risk assessment............................................................................ 67 3.10.5
Summary for QD ................................................................................................... 67 3.10.6
3.11 Risk assessment of carbon black (CB) ................................................................................ 68 Sources and releases ............................................................................................. 68 3.11.1
Important environmental fate processes ............................................................. 70 3.11.2
Environmental exposure....................................................................................... 70 3.11.3
Environmental effects ............................................................................................ 71 3.11.4
Environmental risk assessment............................................................................ 72 3.11.5
Summary for CB .................................................................................................... 72 3.11.6
3.12 RA summary..........................................................................................................................73
4. Nanomaterials in the environment – discussion of main findings ..................... 76 4.1 Sources and releases of ENMs............................................................................................. 76 4.2 Environmental exposure ..................................................................................................... 78 4.3 Environmental effects .......................................................................................................... 80 4.4 Risk assessment of the ENMs .............................................................................................. 81 4.5 Broader considerations regarding environmental risks ..................................................... 83
5. Uncertainties and data gaps .............................................................................. 86 5.1 Environmental fate and exposure modelling...................................................................... 86 5.2 Ecotoxicity and determination of level of protection ......................................................... 88 5.3 Other environmental hazards related to ENMs ................................................................. 89
Conclusions and perspectives .................................................................................. 90
References .............................................................................................................. 94
Appendix 1: List of Abbreviations and Acronyms .............................................. 96

Environmental assessment of nanomaterial use in Denmark 5
Preface
This report is the final report under the project “Nanomaterials – Occurrence and effects in the
Danish Environment” (“NanoDEN”). The NanoDEN project was commissioned by the Danish EPA
in December 2012 and is hereby completed. The project is one among a number of projects funded
by the Danish EPA aiming to increase the knowledge and understanding regarding occurrence of
engineered nanomaterials in Denmark and the possible risks posed by these to humans and the
environment.
The NanoDEN project is part of the initiative of the Danish government and the Red-Green Alliance
(a.k.a. Enhedslisten) called “Bedre styr på nanomaterialer” (Better control of nanomaterials) for
2012-2015 that focuses on the use of nanomaterials in products on the Danish market and their
consequences for consumers and the environment.
The NanoDEN project has been carried out by a project team with participation of COWI A/S (lead
partner) (overall project leader: Jesper Kjølholt), the Technical University of Denmark (DTU
Environment) (project leader: Anders Baun) and the Swiss Nano Modelling Consortium (SNMC)
(project leader: Fadri Gottschalk).
COWI is the lead partner for this report, which has been prepared by Jesper Kjølholt and Anna
Brinch (COWI A/S), Fadri Gottschalk and Bernd Nowack (SNMC), and Hans-Christian Holten
Lützhøft, Nanna B. Hartmann and Anders Baun (DTU Environment).
A Steering Committee with the following participants was established for the NanoDEN project:
- Flemming Ingerslev, Danish EPA (Chairman and project responsible)
- Katrine Bom, Danish EPA
- Jørgen Larsen, Danish EPA
- Jesper Kjølholt, COWI A/S (project manager)
- Anders Baun, DTU Environment
- Fadri Gottschalk/Bernd Nowack, SNMC.

6 Environmental assessment of nanomaterial use in Denmark

Environmental assessment of nanomaterial use in Denmark 7
Executive Summary
Background and Objective
This is the concluding report of the project "Nanomaterials – occurrence and effects in the Danish
environment" (abbreviated NanoDEN), which is one among of a number of projects commissioned
by the Danish Environmental Protection Agency as part of the Danish Government's initiative
"Better Control of Nanomaterials" (“Bedre styr på nanomaterialer”). These projects have aimed to
investigate and generate new knowledge on the presence of nanomaterials on the Danish market
and assess the possible associated risks to consumers and the environment.
The overall objective of NanoDEN has been to discuss and assess whether engineered
nanomaterials (ENMs)1 released to and occurring in the Danish environment give reason for
environmental concern. This is also the overarching question in the current report, which,
additionally, has the more specific objective of performing a concrete environmental risk
assessment of ten engineered nanomaterials selected in the project to represent ENMs of relevance
to Denmark. The assessment is based on the results of the preceding sub-projects of NanoDEN that
have addressed the following themes related to ENMs: environmental fate and behaviour,
modelling of environmental exposure, and effects in the (aquatic) environment.2
- Titanium Dioxide (TiO2), photostable
- Titanium Dioxide (TiO2), photocatalytic
- Zinc Oxide (ZnO)
- Silver (Ag)
- Carbon Nanotubes (CNTs)
- Copper carbonate/Copper oxide (CuCO3 / CuO)
- Nano Zero Valent Iron (nZVI)
- Cerium Dioxide (CeO2)
- Quantum Dots (QDs)
- Carbon Black (CB)
Main findings and conclusions
The main question "do engineered nanomaterials (ENMs) released to and occurring in the Danish
environment give reason for environmental concern" is addressed through a number of more
specific sub-questions. The reason for this is that ENMs, just like traditional chemicals, are used in
many different applications and have a wide range of individual properties. It is therefore
impossible to give one single answer that can embrace this variety.
Do some individual ENMs, or groups of ENMs, constitute a risk of environmental effects now
or within a not too distant future?
With the current scientific knowledge, and current use patterns and volumes, none of the ENMs
selected for this study appear to constitute a general environmental risk or to be of significant
environmental concern (i.e. they do not at the same time show high toxicity to aquatic organisms
and occur at significant levels in the environment). ENMs of potential concern are those that are
either highly toxic (e.g. Ag, CuO, CNT) or have a high environmental exposure combined with more
1 In the context of NanoDEN, nanomaterials are defined as materials consisting of particles with one or more external dimensions
between 1 and 100 nm. 2 For full references to these reports, please consult the list of references. See: Hartmann et al. (2014), Gottschalk et al. (2015a
and 2015b), and Lützhøft et al. (2015).

8 Environmental assessment of nanomaterial use in Denmark
moderate toxicity (e.g. titanium dioxide and carbon black). To both of these groups applies that
their use volumes shall increase significantly compared to today's levels before the potential risk
will materialise. Concerning the remaining the selected ENMs it is assessed to be unlikely that any
of them should constitute a general environmental risk (ZnO, nZVI, CeO2 and QD). The possible
risk that local effects could occur in special cases has not been evaluated in this study and due to
scarcity of data it has not been possible to determine risk quotients for soil- and sediment-dwelling
organisms or to assess bioaccumulation risks.
Are ENMs, as a group, covered sufficiently by the ENMs studied in this project?
The ENMs selected for this project represent: i) partly materials that are currently used in some of
the highest tonnages among nanomaterials, ii) partly materials that together represent a wide range
of applications in relevant consumer products and industrial/professional processes, iii) partly
materials of different physico-chemical character (metals, other inorganics, carbon-based ENMs),
and iv) materials with a significant span regarding toxicity and behaviour in the environment.
Hence, we believe that the selection made is representative considering the purpose of the
NanoDEN project, and the delimitations made in the project are not considered to compromise the
possibility of discussing ENMs from an overall risk perspective in this report.
Are certain functionalities or types of uses of ENMs more critical than others from an
environmental perspective?
The critical functionalities and types of uses are in principle all those leading to direct releases to
and exposure of one or more environmental compartments, i.e. without passing through e.g. sewage
treatment plants, incineration plants or other waste treatment processes. Examples of such critical
uses are outdoor paints and other coatings for building facades or other constructions, sun lotions,
impregnation of wood for outdoor constructions (on land or in water), anti-fouling paints for ships,
fuel additives, fillers for tyres, and artificial lawns (rubber filler made from used tyres). Some of
these uses lead to aquatic exposure due to discharges of untreated runoff from roofs and paved
surfaces (e.g. CeO2 and CB) while others affect directly the soil environment (such as use of CuO for
wood impregnation) or even the marine environment (ENMs in antifouling paints). It should be
mentioned that the assessments are made only for the "pristine" form of the ENMs, i.e. the
materials without coatings or other types of surface functionalization as typically used in
commercial applications.
Is the Danish situation with regard to ENMs comparable to the general situation in the EU?
In Denmark, there seems to be virtually no production of basic nanomaterials and manufacturing of
nano-containing materials and products appears to be quite limited. Therefore, industrial point
sources are probably of less importance in Denmark than in other countries in the EU with more
extensive industrial production. The actual use of nano-products by consumers is overall assumed
to be more or less in line with other European countries. The degree of re-cycling of waste
incineration residuals (slags etc.) for outdoor constructions such as base-materials for roads is high
in Denmark compared to many other EU countries. Such "open" types of re-cycling imply a
potential risk of higher environmental exposure for some ENMs, in particular of (subsurface) soil
and groundwater.
Is there, based on the above considerations, reasons for general concern with regard to
nanomaterials in the Danish environment?
Based on the data review and the assessments of exposure and effects of ENMs in the aquatic
environment performed in this project, no causes for significant environmental concerns regarding
nanomaterials in the Danish environment have been identified at the current level and character of
use of these materials. However, a few ENMs should be kept under observation (or some

Environmental assessment of nanomaterial use in Denmark 9
assumptions regarding their use be clarified), either because they already today are released in
significant quantities to the environment (TiO2, CB) or because their environmental properties (in
particular ecotoxicity) place them in a group of materials of potential concern (Ag, Cu, CNT). The
remaining ENMs are either used only for very specific applications in small quantities or in
applications that result in only very low releases to the environment.
Environmental risk assessment of selected ENMs
To provide a foundation for the overall environmental considerations presented above, a concrete
environmental risk assessment of the selected ENMs was performed in line with the principles used
in risk assessment of chemical substances in general. However, due to limitations in the available
data on ecotoxicological effects, the assessment is limited to the freshwater compartment.
The results of the assessments are summarised in the table below in the form of risk quotients
(= PEC/PNEC3) for effluents from sewage treatment plants (STPs) and fresh surface waters
(regional scenario, after full distribution). The model calculations of the level of environmental
exposure (PEC) were carried out on basis of probability distributions and, therefore, the table
presents risk quotients both for the most probable exposure concentration modelled and the highest
concentration within the 95 percent confidentiality interval of the total distribution range.
ENM Environmental compartment
Risk Quotient (PEC/PNEC)
Most probable value
Max value
(95% conf. int.)
TiO2 (photostable) STP effluent 0.7 5.1
Surface water, fresh 0.0002 0.006
TiO2 (photocatalytic) STP effluent 0.09 0.79
Surface water, fresh 1.5 E-05 3.9 E-04
ZnO STP effluent ≈0 -#
Surface water, fresh 1.8E-04 0.0052
Ag STP effluent 0.042 4.88
Surface water, fresh 0.001 0.004
CNT STP effluent 3.57E-04 4.17E-03
Surface water, fresh 1.19E-06 1.79E-05
CuO STP effluent 3.8 12.1
Surface water, fresh 0.0059 0.018
nZVI STP effluent -## -##
Surface water, fresh -## -##
CeO2 STP effluent 1.79E-03 1.15E-02
Surface water, fresh 7.69E-07 1.92E-05
QD STP effluent -## -##
Surface water, fresh -## -##
CB STP effluent -* -*
Surface water, fresh -** -**
-: estimation of PEC/PNEC not possible
3 PEC = Predicted Environmental Concentration; PNEC = Predicted No-Effect Concentration.
If PEC/PNEC is <1 the risk of biological effects is considered acceptably low.

10 Environmental assessment of nanomaterial use in Denmark
* possibly >1; **possibly <<1
# possibly <1; ## possibly <<1
It appears from the table that if the risk assessment is based on the most probable value for the
predicted environmental concentration (PEC), only 1-2 nanomaterials (copper oxide and possibly
carbon black) are estimated to show risk quotients higher than unity in STP effluents, i.e. there is a
potential risk of biological effects close to the points of discharge into the aquatic environment for
these two ENMs. If the highest effluent concentration in the 95 percent confidence interval is used,
the risk quotient for silver and titanium dioxide also exceed unity but the highest calculated risk
quotient (for copper oxide) is still only about 12. A risk reduction of this magnitude will normally be
possible to obtain for STP effluents discharging into rivers or coastal marine waters as the value of
unity does not have to be met in the effluent itself but only at the border of a mixing zone
established around the discharge point. None of the average concentrations calculated for
freshwater after full distribution will lead to risk quotients anywhere near the value of unity.
Please note that for nano-copper, the assessment is based on the assumption that all copper-based
preservation of wood is done with nano-copper, which is not the situation today (but potentially
possible in the future). For carbon black (CB) it is conservatively assumed that that CB-products
consist exclusively of nano particles, and this is not necessarily the case in reality.
Data gaps and uncertainties
Due to the fact that "nano" is a very new scientific area, the above assessments and conclusions have
been reached on basis of limited existing knowledge e.g. with regard to analytical and test
methodologies, as well as availability of specific data on the individual nanomaterials. From a
regulatory perspective and in relation to society's possibilities of managing and, if necessary,
introducing environmental regulation of engineered nanomaterials, the following data and
procedures are considered to be the most important to obtain/generate:
Data that can define the actual environmental exposure to ENMs more precisely than now, e.g.:
- more specific (Danish) data on the sources and releases from industrial facilities, as well as
resulting from the use of nano-products by consumers;
- data clarifying to what extent and for how long ENMs released to the environment exist as
nanoparticles in the environment before they either dissolve or are no longer on nano form due
to aggregation/agglomeration;
- Better data on retainment of ENMs in STPs and waste incineration plants.
Data that can verify the PECs predicted by modelling i.e. analytically measured data (which
requires better analytical methods for ENMs to be developed);
Data that can lead to more precise and reliable PNECs than today, i.e. more data (especially
chronic) on individual ENMs as well as testing methods that are more suitable to ENMs than
the current.
Ecotoxicity data for organisms from other compartments than freshwater (e.g. soil, marine,
and sediment-living organisms) since interpolation between environmental compartments is
presently not feasible.
Data that can validate that the use of current methods for deriving PNEC will lead to
protective concentrations with regards to environmental effects of ENMs
Environmental assessment of nanomaterial use in Denmark 11
Sammenfatning
Baggrund og formål
Dette er den afsluttende rapport i projektet "Nanomaterialer – forekomst og effekter i det danske
miljø" (forkortet NanoDEN), som er et af en række projekter iværksat af Miljøstyrelsen som en del
af udmøntningen af regeringens finanslovsaftale, kaldet "Bedre styr på nanomaterialer". Disse
projekter har haft som hovedformålet at undersøge og generere viden om industrielt fremstillede
nanomaterialer på det danske marked.
Hovedformålet med NanoDEN har været at undersøge og belyse om tilførslen til og forekomsten af
industrielle nanomaterialer (ENM) i det danske miljø giver anledning til miljømæssig bekymring4.
Dette er også det bagvedliggende hovedspørgsmål i nærværende rapport, der desuden har haft som
mere specifikt delformål at foretage en konkret miljømæssig risikovurdering af nedennævnte
nanomaterialer, der blev udvalgt i projektet til at repræsentere ENM af relevans for Danmark.
Vurderingen er baseret på resultaterne af de forudgående delprojekter under nanoDEN, der har
omhandlet hhv. miljømæssig opførsel og skæbne, modellering af miljøeksponering samt effekter i
(vand)miljøet5.
- Titandioxid, TiO2 (hhv. fotostabilt og foto-katalytisk)
- Zinkoxid, ZnO
- Sølv, Ag
- Kulstofnanorør, CNT (carbon nano-tubes)
- Kobbercarbonat, CuCO3 / kobberoxid, CuO
- Nanojern i oxidationstrin nul, nZVI (nano zero-valent iron)
- Ceriumdioxid, CeO2
- Kvantepunkter, QD (quantum dots)
- Carbon black, CB
Projektets hovedresultater/-konklusioner
Hovedspørgsmålet "giver forekomsten af industrielle nanomaterialer i det danske miljø anledning
til miljømæssig bekymring" er forsøgt besvaret ud fra en række mere konkrete delspørgsmål idet
ENM, lige som traditionelle kemikalier, har så mange forskellige anvendelser og egenskaber, at der
ikke kan gives ét, samlet svar, der kan dække dem alle.
Er der bestemte ENM, eller grupper af ENM, der i dag eller inden for en overskuelig
fremtid udgør en miljømæssig risiko?
Blandt de udvalgte ENM vurderes der ikke at være nogen materialer på nanoform, der ud fra den
eksisterende viden og med de nuværende anvendelser og omfang af forbrug kan siges at udgøre en
miljømæssig risiko i Danmark (dvs. de har ikke både høj giftighed for vandlevende organismer og
stor forekomst i miljøet). Potentielt kritiske ENM skal findes blandt dem, der enten har en høj
giftighed (sølv, kobberoxid, CNT) eller som med en mindre giftighed giver anledning til betydelig
eksponering af miljøet (titandioxid og CB). For begge grupper gælder, at anvendelsen af dem skal
stige betydeligt i forhold til dagens niveau for at risikoen bliver reel. For de resterende blandt de
udvalgte ENM vurderes det som usandsynligt, at de skulle udgøre en generel risiko (ZnO, nZVI,
4 Nanomaterialer er i forbindelse med NanoDEN defineret som materialer fremstillet af partikler med en eller flere eksterne
dimensioner på mellem 1 og 100 nm. 5 For fulde referencer til disse rapporter, se rapportens referenceliste under Hartmann et al. (2014), Gottschalk et al. (2015a og
2015b) og Lützhøft et al. (2015).

12 Environmental assessment of nanomaterial use in Denmark
CeO2 og QD). Det har ligget uden for projektet at vurdere risikoen for, at der i særlige tilfælde kan
forekomme lokale påvirkninger, og på grund af mangel på relevante data har der ikke kunnet
beregnes risikokvotienter for jord- og sedimentlevende organismer eller konkluderes på risikoen for
bioakkumulering.
Er ENM, som samlet gruppe, dækket tilstrækkeligt med de udvalgte ENM?
De ENM, der er udvalgt til dette projekt, repræsenterer dels nanomaterialer, der er blandt dem der
anvendes i de højeste tonnager, dels materialer med et bredt spektrum af forventede anvendelser i
relevante forbrugerprodukter, industrielle processer og miljøteknisk remediering, og endelig har de
en række forskellige fysisk-kemiske og miljømæssige karakteristika. Derfor anses de udvalgte ENM
for at være repræsentative ift. det overordnede formål med NanoDEN-projektet og de fravalg, der er
foretaget, vurderes ikke at være kritiske ift. at kunne diskutere de overordnede perspektiver.
Er der funktionaliteter eller typer af anvendelser af ENM, der er særligt kritiske ud fra et
miljømæssigt perspektiv?
De kritiske funktionaliteter og anvendelser er i princippet dem, der medfører direkte udslip til og
eksponering af en eller flere dele af miljøet, dvs. uden først at passere gennem renseanlæg eller
forbrændingsanlæg eller andre former for emissionsbegrænsende tekniske foranstaltninger.
Eksempler på sådanne kritiske anvendelser er udendørs malinger eller andre udendørs
facadebelægninger, imprægnering af træ til udendørs anvendelser, bundmalinger til skibe, additiver
til bilmotorer og bildæk, kunstgræsbaner etc. Nogle af disse anvendelser medfører eksponering af
ferskvandmiljøer som følge af udledninger af ubehandlet afstrømning fra tage og veje (f.eks. CeO2
og CB), mens andre fører til eksponering af jordmiljøet (CuO) eller havmiljøet (skibsmalinger). Det
skal også nævnes, at vurderingerne er foretaget på baggrund af den kemiske sammensætning af de
udvalgte ENM. Vurderinger af betydningen af overfladefunktionalisering og coatings af
kommercielt anvendte partikler er således ikke inkluderet.
Er situationen i Danmark mht. ENM sammenlignelig med situationen i andre
europæiske lande?
I Danmark er der ingen eller kun ganske ubetydelig basal produktion af ENM og formodentlig også
meget begrænset fremstilling af materialer eller produkter indeholdende nanomaterialer. Derfor er
industrielle punktkilder antagelig af mindre betydning end i et antal andre lande med højere grad af
industriel produktion. I øvrigt vurderes anvendelsen af ENMs hos forbrugerne at være omtrent på
linje med den i andre europæiske lande. I Danmark er der en ret høj grad af genanvendelse af
slagger mv. fra affaldsforbrænding, der potentielt kan medføre en forøget miljøeksponering,
primært af dybere jordlag og grundvand.
Er der, på baggrund af ovenstående, grund til overordnet miljømæssig bekymring pga.
nanomaterialer i Danmark?
På det foreliggende vidensgrundlag, baseret på vurderinger af virkninger af ENM i ferskvand, er der
i nærværende projekt ikke identificeret årsager til væsentlig miljømæssig bekymring relateret til
industrielle nanomaterialer i det danske miljø. Nogle få specifikke ENM bør dog holdes under
observation (eller forholdene omkring dem afklares nærmere). Dette enten fordi de allerede i dag er
beregnet at have ganske høje udslip til miljøet (TiO2, CB) eller fordi de har miljøegenskaber
(giftighed), der placerer dem i en gruppe af potentielt problematiske materialer (Ag, Cu, CNT). De
fleste øvrige ENM anvendes enten til meget specielle formål i små mængder og/eller til formål, der
ikke eller kun i meget ringe grad giver anledning til udslip til miljøet.

Environmental assessment of nanomaterial use in Denmark 13
Miljømæssig risikovurdering af udvalgte ENM
Der er, som baggrund for de foranstående overordnede miljømæssige betragtninger foretaget en
konkret miljømæssig risikovurdering af de udvalgte ENM efter de samme principper som ved
miljømæssig risikovurdering af kemikalier. På grund af datamæssige begrænsninger mht. biologiske
effekter er vurderingen dog begrænset til (fersk)vandsmiljøet.
Resultatet af de foretagne vurderinger er sammenfattet i nedenstående tabel udtrykt ved
risikokvotienter (PEC/PNEC6) for hhv. udløb fra renseanlæg og ferskvandmiljøer (regional
betragtning, efter opblanding). Modelberegningerne af eksponering i vandmiljøet er foretaget på
baggrund af sandsynlighedsfordelinger og derfor er der i tabellen angivet risikokvotienter både for
den modellerede mest sandsynlige koncentration og for den højeste koncentration inden for 95%-
sandsynlighedsintervallet af teoretisk mulige værdier.
ENM Type af vandmiljø
Risikokvotient (PEC/PNEC)
Mest sandsynlige værdi
Max. værdi
(95% interval)
TiO2 (fotostabilt) Udløb fra renseanlæg 0.7 5.1
Overfladevand, fersk 0.0002 0.006
TiO2 (fotokatalytisk) Udløb fra renseanlæg 0.09 0.79
Overfladevand, fersk 1.5 E-05 3.9 E-04
ZnO Udløb fra renseanlæg ≈0 - #
Overfladevand, fersk 1.8E-04 0.0052
Ag Udløb fra renseanlæg 0.042 4.88
Overfladevand, fersk 0.001 0.004
CNT Udløb fra renseanlæg 3.57E-04 4.17E-03
Overfladevand, fersk 1.19E-06 1.79E-05
CuO Udløb fra renseanlæg 3.8 12.1
Overfladevand, fersk 0.0059 0.018
nZVI Udløb fra renseanlæg - ## - ##
Overfladevand, fersk - ## - ##
CeO2 Udløb fra renseanlæg 1.79E-03 1.15E-02
Overfladevand, fersk 7.69E-07 1.92E-05
QD Udløb fra renseanlæg - ## - ##
Overfladevand, fersk - ## - ##
CB Udløb fra renseanlæg - * - *
Overfladevand, fersk - ** - **
-: PEC/PNEC ikke mulig at estimere.
* muligvis >1; **muligvis <<1
# muligvis <1; ## muligvis <<1
Det fremgår af tabellen, at hvis man tager udgangspunkt i den mest sandsynlige værdi for
miljøkoncentrationen (PEC) er der kun 1-2 materialer (kobber og muligvis CB), der har
risikokvotienter større end 1 i udløbspunktet for udledninger fra renseanlæg (dvs. der foreligger en
potentiel miljørisiko). Tages der udgangspunkt i max. koncentrationen for 95%-konfidensintervallet
6 PEC = Predicted Environmental Concentration (forventet miljømæssig koncentration);
PNEC = Predicted No-Effect Concentration (den forventede højestekoncentration uden biologiske effekter i miljøet).

14 Environmental assessment of nanomaterial use in Denmark
kommer sølv og titandioxid også med, men den maksimale risikokvotient (for kobber) er dog stadig
kun ca. 12. Et sådant niveau for nødvendig risikoreduktion vurderes som almindeligvis opnåelig i
forbindelse med renseanlæg. Der er ingen af de beregnede gennemsnitskoncentrationer i
overfladevand efter fuld fordeling i vandmiljøet, der vil føre til risikokvotienter blot i nærheden af 1.
Der skal her gøres opmærksom på, at for kobber er vurderingen baseret på en antagelse om, at al
kobberbaseret træimprægnering foregår med nano-kobber, hvilket ikke er tilfældet i dag (men
potentielt mulig i fremtiden), og for carbon black (CB) er det konservativt antaget, at hele den
anvendte mængde er som nano, hvilket ikke nødvendigvis er tilfældet i virkeligheden.
Manglende viden og usikkerheder
Ovenstående vurderinger og konklusioner er truffet på baggrund af den eksisterende viden, en viden
der på grund af, at nano er så nyt et miljøvidenskabeligt område, har en række begrænsninger både
med hensyn til egnede undersøgelsesmetoder og med hensyn til konkrete, materialespecifikke data.
I forhold til samfundets muligheder for at håndtere og eventuelt miljømæssigt regulere industrielle
nanomaterialer er følgende data/oplysninger fundet at være de væsentligste at få adresseret:
Data som kan fastlægge den miljømæssige eksponering for ENM mere præcist end i dag,
f.eks.:
- flere specifikke (danske) data om kilder og afgivelser fra industrielle virksomheder såvel
som pga. anvendelse af nanoprodukter hos almindelige forbrugere;
- data som kan klarlægge i hvilken grad og i hvor lang tid ENM, der er tilført miljøet,
vedbliver at eksistere som nanopartikler førend de enten er gået i opløsning eller ikke
længere er på nanoform pga. aggregering/agglomerering mv.
- bedre data om tilbageholdelse af ENM i renseanlæg og forbrændingsanlæg.
Data som kan verificere de modellerede PEC-værdier, dvs. analytisk-kemiske data (hvilket
vil kræve udvikling af flere og mere egnede analysemetoder).
Data som kan føre til fastsættelse af mere præcise og mere pålidelige PNEC end i dag, dvs.
flere data (især kroniske) for de enkelte ENM såvel som testmetoder, der er mere egnede
(skræddersyede) til ENM end de nuværende (som er udviklet til kemikalier).
Økotoksikologiske data for organismer i andre miljøer end ferskvand, f.eks. det marine
miljø, jord og sediment, da interpolation mellem de forskellige miljøer p.t. ikke er mulig.
Data som kan validere, at anvendelsen af eksisterende metoder til fastlæggelse af PNEC for
kemikalier også giver et tilstrækkeligt beskyttelsesniveau for ENM.

Environmental assessment of nanomaterial use in Denmark 15
1. Introduction
Background and Objective
The Danish EPA has, as part of the Danish Government's initiative "Better Control of
Nanomaterials" (“Bedre styr på nanomaterialer”), commissioned a number of projects aiming at
investigating and generating new knowledge on the presence of nanomaterials in products on the
Danish market and assess the possible associated risks to consumers and the environment. One of
these projects is the current project on nanomaterials in the Danish environment (NanoDEN),
which has the overall objective of discussing and assessing whether engineered nanomaterials
(ENMs) released to and occurring in the Danish environment give reason for concern.
The current, final sub-project of NanoDEN (sub-project 6) being reported here will partly
summarise (to some extent using identical phrases) and discuss the main results and findings of the
previous sub-projects under the NanoDEN "umbrella" and partly present an environmental
assessment of each of the ENMs selected for the study with the overall aim to address the
fundamental question of the project, i.e. if engineered nanomaterials in the Danish environment
give reason for concern.
Selection of nanomaterials
In the context of the NanoDEN project, ENMs are defined as manufactured materials with one or
more external dimensions between 1 and 100 nm. In that respect ENMs is a part of a broader group
of nanomaterials, which can result from natural, anthropogenic (incidental) and engineered
(intentional) processes, however the NanoDEN project focuses on ENMs, as this is the most
relevant group of nanomaterials from an up-stream regulatory point of view. The following
nanomaterials were selected for this project as they together are considered to comprise the
majority of currently widely used ENMs and also represent a range of typical functionalities and
applications of ENMs:
- Titanium Dioxide (TiO2) (rutile and anatase)
- Zinc Oxide (ZnO)
- Silver (Ag)
- Carbon Nanotubes (CNTs)
- Copper carbonate/Copper oxide (CuCO3 / CuO)
- Nano Zero Valent Iron (nZVI)
- Cerium Dioxide (CeO2)
- Quantum Dots (QDs)
- Carbon Black (CB)
In the NanoDEN project, CuCO3 nanoparticles are included as case study particles for copper-
containing nanoparticles. However, for the effects part of the risk assessment CuCO3 has been
replaced by CuO due to the fact that nano-CuO has been studied to some extent in ecotoxicity
studies, whereas studies for nano-CuCO3 are lacking.

16 Environmental assessment of nanomaterial use in Denmark
Contents of the report and guidance to the reader
The report is structured as follows:
Chapter 2 gives an introduction to the approach and methodology that has been applied for the
determination of sources, environmental exposure and effects, and for conducting the specific
environmental assessment of the ten nanomaterials selected for this particular study (considered
representative for the majority of current ENMs).
Chapter 3 contains the specific, individual environmental assessments of the selected ENMs and
includes for each a short summary of the main findings from the previous NanoDEN sub-projects
regarding ENM sources and releases, environmental behaviour and exposure, environmental effects
and PNECs, ending up with a formal risk assessment basically using the same approach as being
applied in REACH for chemicals. At the end of each material-specific section in the chapter, a
summary of the main "risk relevant" environmental features of the ENM in question is provided
and an overall summary of the determined aquatic risk quotients is included at the end of the
chapter.
The subsequent Chapter 4 provides a broader discussion of issues related to the main elements of
an environmental assessment of nanomaterials, namely the sources and releases of the materials to
the environment, the environmental exposure, the environmental effects and the approach to risk
assessment of ENMs as well as number of cross-cutting issues.
A number of uncertainties and data gaps encountered in the project are discussed in Chapter 5,
which address both issues related to assessment of nanomaterials in general and issues specifically
related to the selected nanomaterials.
Chapter 6 aims to discuss and conclude, to the extent possible, on overall issues and possible
general concerns related to nanomaterials in the Danish environment rather than focusing on the
individual materials. However, the previous findings on the selected materials are used to support
the overall conclusions and perspectives presented.

Environmental assessment of nanomaterial use in Denmark 17
2. Approach and methodology
This chapter presents a short summary of the approaches and methodologies that have been
applied in different parts of the NanoDEN project to review, describe, generate and assess
information of relevance for the concluding assessment of environmental risk and possible reasons
for concern, i.e. above all the two sub-projects on environmental exposure and environmental
effects, respectively, as well as the risk assessment approach in the current report. These
approaches and methods are applied in Chapter 3 for each of the individual ENMs included in the
NanoDEN project. In Chapter 4 a number of issues beyond the more formalized risk assessment of
the specific ENMs selected for this study are discussed.
2.1 Environmental exposure to ENMs
The environmental exposure model
In the NanoDEN project estimations of environmental exposure for a number of scenarios have
been provided for the selected nanomaterials based on the results of a modelling study. The basis
for obtaining the results was a comprehensive search on the manufacturing processes and the total
content of the nanomaterials in mixtures and articles for end-applications in Denmark. The data fed
into the modelling included total use and releases of nanomaterials to the environment in Denmark
based on literature and interview information, as well as dispersion and environmental fate for the
selected ENMs obtained through a critical review of recent scientific literature.
The model used was derived from a model of the flows and fate of nanomaterials in the EU and in
Switzerland developed by the Swiss Nano Modelling Consortium (SNMC). The modelling approach
was to estimate the release of nanomaterials from the technosphere to different environmental
compartments by summing up such release over the complete lifecycle of the investigated ENM,
including production, formulation and industrial processes, private or professional applications and
waste treatment. The basic inputs were quantities of nanomaterials used for industrial processes
and the total content of nanomaterials in imported mixtures and articles. The flow of the ENMs
through a series of technosphere compartments/processes was determined by a series of transfer
coefficients, which, for example, described the percentages of nanomaterials passing through
sewage treatment plants (STPs) that are eliminated by the treatment processes or released into
environmental compartments.
For four of the nanomaterials addressed by this study, a detailed analysis for the EU and
Switzerland was published in 2014 (Sun et al., 2014). These were nano-TiO2, nano-ZnO, nano-Ag
and CNT. In relation to these nanomaterials, the Swiss data on import in mixtures and articles were
partially used as a first estimate for the use in Denmark (on a per capita basis), and the transfer
coefficients developed to describe the Swiss situation was also partially applied to Denmark,
considering that the differences between the two countries with regard to the use of the mixtures
and articles and waste treatment processes are small compared to the uncertainties on the use of
data and transfer coefficients. However, a critical evaluation of the Swiss data was performed, and
the report updated outdated data by replacing them with new findings. For the other substances
addressed by the study, data on uses and transfer coefficients were completely collected as part of
this study. These substances were nano-CuCO3, nano-CuO, nZVI, nano-CeO2, quantum dots (QD)
and carbon black (CB).

18 Environmental assessment of nanomaterial use in Denmark
The probabilistic, stochastic approach7
The data collected were not fed into the model by means of single deterministic values, but instead
by computing probability distributions based on the data. For missing knowledge, assumptive
information based on expert indications had to be used. Thus, the model used was based on
probabilistic nanomaterial production and use parameters, as well as release and mass transfer
coefficients at all stages of the nanomaterial lifecycle. One type of parameter reflected tonnes or
kilogrammes of use or release of nanomaterial each year. The second type represented transfer
coefficients which indicated the percentage of the nanomaterial going into a further compartment
(nanoproducts, natural or technical environments), or being dissolved/eliminated or finally
deposited. The stochastic model combined a large number of scenarios (100,000) for each mass
transfer and mimicked a complex system of engineered nanomaterial transport and fate. This
comprehensive and explorative procedure allowed us to capture as far as possible the complete
environmental exposure spectrum based on the current knowledge.
Nanomaterial sources
None of the selected nanomaterials are manufactured in Denmark. Information on the use of
nanomaterials for formulation processes was obtained from companies involved in the manufacture
of pigments, paints and varnishes (including antifouling paints), plastics and cosmetics. As a
general trend (with a few exceptions), companies in the chemicals sector have moved production to
Eastern Europe or Asia over the past few decades, and the activities in Denmark are limited mainly
to research and some formulation of chemical products into ready-to-use products. Specific data
from industry in Denmark turned out to be hard to retrieve and due to confidentiality reasons,
details obtained on the use of nanomaterials for different formulation processes cannot be
published.
Sewage treatment plants (STPs)
STPs are considered one of the main sources of release of some of the nanomaterials studied.
However, no specific and empirical data on actual discharges of nanomaterials to the Danish
municipal sewer system or on the releases from these STPs are available. Therefore, assumptive
information and, where available, literature data for transfer coefficients were used to calculate the
quantities discharged to the sewer system from manufacturing processes, from the use of the
materials in mixtures and articles and from waste handling.
2.2 Environmental effects of ENMs
The approach to and methodology applied for the description and assessment of environmental
effects of ENMs was based on a critical literature review with the following sub-categories of
information searched for:
Current approaches to estimation of PNECs (Predicted No Effect Concentrations) and
data evaluation for traditional chemicals
Currently existing PNEC values for nanomaterials (in scientific literature and REACH
registrations)
Biological effects of the nanomaterials selected for the NanoDEN study.
For the assessment of the literature pertaining to the latter category a concept for evaluation of
ecotoxicological data for ENMs was developed specifically in this project based on the so-called
Klimisch score used under REACH, i.e. an evaluation of the reliability, relevance and adequacy of
each of the studies reviewed. Thus, the reliability assessment considers the test setup as such, the
identification and (physic-chemical) properties of the test compound, the test organism used, the
exposure conditions and the statistical design for evaluation of test results. The relevance
7 The term stochastic (random) process stands for the computing procedure that produces random numbers used to form the
probability distributions (probability density functions) of the model input and output data.

Environmental assessment of nanomaterial use in Denmark 19
assessment considers the biological relevance of the species, the endpoints studied and the
experimental conditions, as well as the exposure relevance.
Subsequently, to find scientific articles covering effect assessment of nanomaterials in relation to
risk assessment, a literature search strategy was developed. The name of each of the selected
nanomaterials was combined with “tox*” and “nano*” and “alga*/crustacean*/daphni*/fish*” in
Web of Science and resulted in 1,208 hits in total. A number of the articles were in fact replicates, as
some articles were retrieved for the same ENM, but for different organisms, or because a single
article reported data for several ENMs and therefore were retrieved for several ENMs. Across all
searched nanomaterials and search strategies, there were 677 unique articles.
Using the developed concept for data quality and relevance evaluation, the identified scientific
articles were reviewed and grouped into different categories of adequacy by combining their
reliability and relevance scores. The adequate studies were used as basis for identifying the species
and endpoints relevant for the derivation of a Predicted No Effect Concentration (PNEC) to be used
later (in the current sub-project) for calculating a risk quotient (PEC/PNEC) for each ENM by
combining the PNEC with relevant Predicted Exposure Concentrations (PECs) obtained by the
exposure modelling. In this project, the so-called Assessment Factor (AF) approach, also used e.g.
in REACH for traditional chemicals, was applied to derive the PNECS based on the ecotoxicity data
taking into account the amount of effect information available for each ENM.
2.3 Environmental risk assessment of ENMs
The assessment of the environmental risks associated with the ENMs selected for the NanoDEN
project was, in accordance with international standard procedures, carried out by comparing the
environmental exposure results (PECs) obtained for various compartments and scenarios with the
PNEC values for the aquatic environment obtained from the environmental effects sub-project.
Specifically, a risk quotient (= PEC/PNEC) was calculated for the undiluted effluent from sewage
treatment plants (STPs) and for surface waters after full dilution (i.e. a regional scenario). A risk
quotient at or above 1 indicates a risk of effects on organisms in the (aquatic) environment while a
value below indicates that this risk by convention is considered acceptably low.
The PEC values used in this study for the risk assessment were the most probable values from the
exposure modelling as well as the max. value within the 95% confidence interval as described in
more detail in Gottschalk et al. (2015a) while the PNEC values used were derived from laboratory
toxicity test data using the assessment factor (AF) method (see Lützhøft et al. (2015) for more
details).
In principle, an environmental risk assessment should include all relevant environmental
compartments, i.e. the aquatic environment (fresh and marine waters), soils, sediments, and
sewage treatment plants (STPs). However, while the exposure estimations carried out provide the
predicted exposure concentrations needed for the risk assessment the comprehensive review of the
currently available ecotoxicological studies on ENMs revealed that only for freshwater organisms
there is a sufficient amount of adequate data. Further, extrapolations from effect levels in
freshwater organisms to sewage treatment, marine, soil and sediment organisms are not
straightforward for ENMs and it was assessed not to be scientifically correct to use the
extrapolations described in the current guideline for chemical safety assessment in REACH.
Therefore, quantitative risk quotients were currently considered possible to derive only for the
aquatic environment.

20 Environmental assessment of nanomaterial use in Denmark

Environmental assessment of nanomaterial use in Denmark 21
3. Environmental risk assessment of selected ENMs
3.1 Introduction
This chapter presents for each of the nanomaterials selected for this study a brief summary of
information on sources, exposure and effects relevant for environmental risk assessment and
subsequently a calculation of risk quotients (PEC/PNEC values) for each material in the aquatic
environment (as possible/relevant) while a broader discussion of environmental risk can be found
in chapter 4.
The material-specific summaries regarding sources, exposure, environmental fate and
environmental effects of the investigated ENMs are extracts of the more comprehensive texts with
information and data presented in the previous thematic reports prepared for other sub-projects
under NanoDEN, i.e. Hartmann et al. (2014) on environmental fate and behaviour, Gottschalk et al.
(2015a) on sources and environmental exposure, and Lützhøft et al. (2015) on environmental
effects and PNECs. For detailed descriptions of the respective themes and associated references to
original literature, please consult the mentioned reports.
An environmental risk assessment should in principle include all the compartments listed in the
REACH guidance for chemical safety assessment (Part E), i.e. the aquatic environment (fresh and
marine waters), soils, sediments, and sewage treatment plants (STPs). The exposure estimations
carried out in SP4 (Gottschalk et al., 2015a) provide the predicted exposure concentrations needed
for the risk assessment. However, the comprehensive review of the currently available ecotoxicity
studies of ENMs has revealed that only for freshwater organisms there is a sufficient amount of data
adequate for risk assessment (Lützhøft et al. (2015)). As will be discussed in this report, the
extrapolations from effect levels in freshwater organisms to sewage treatment, marine, soil and
sediment organisms are not straightforward for ENMs. It is in fact evaluated not to be scientifically
correct to use extrapolations described in the current guideline for chemical safety assessment in
REACH (R.10). Therefore, the risk assessments in this report will be focused on freshwater
organisms.
The actual risk assessments for each of the ENMs in this study are carried out for the aquatic
environment by calculating the risk quotient (= PEC/PNEC) in the effluent from sewage treatment
plants (STPs) and in surface waters after full dilution (i.e. a regional scenario). A risk quotient
(PEC/PNEC value) at or above 1 indicates a risk of effects on organisms in the (aquatic)
environment, while a value below indicates that this risk by convention is considered acceptably
low.
The PEC values used in the risk assessment are the most probable values from the modelling as well
as the max. value within the 95% confidence interval as described in more detail in Gottschalk et al.
(2015a), while the PNEC values have been derived from laboratory toxicity test data using the
22 Environmental assessment of nanomaterial use in Denmark
assessment factor (AF) method in accordance with the general principles for ecotoxicological
evaluation of chemicals as described by ECHA (see Lützhøft et al. (2015) for more details).
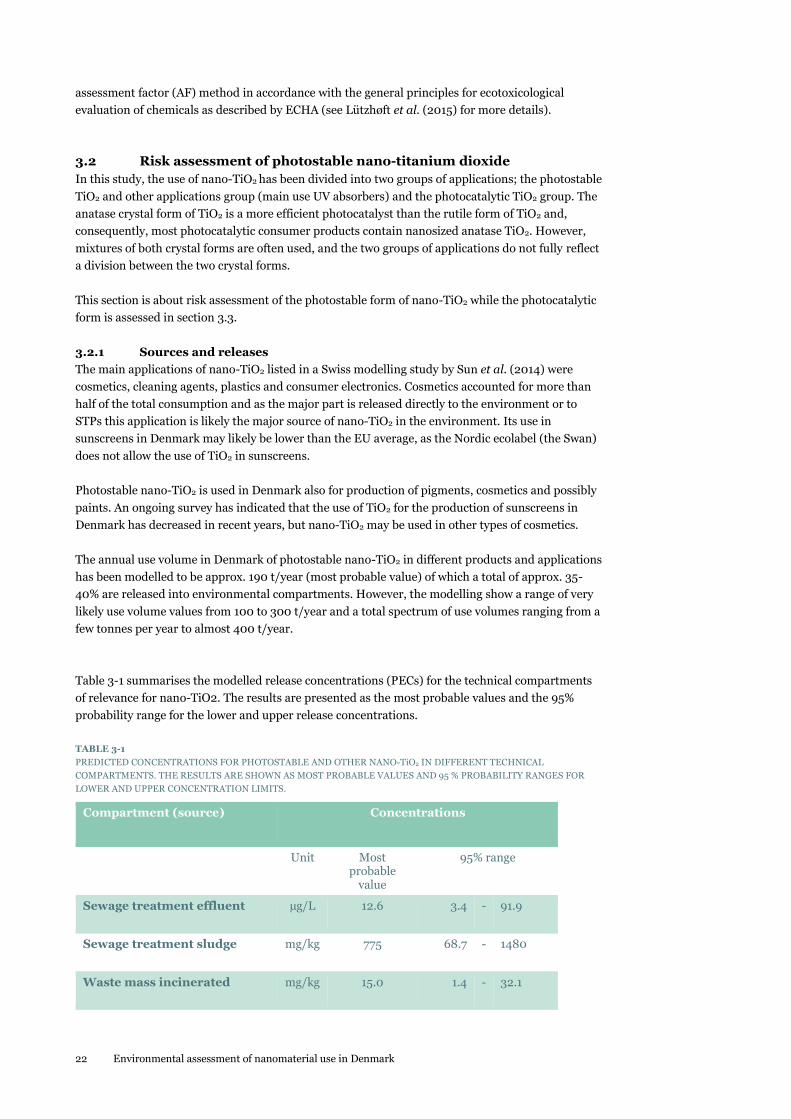
3.2 Risk assessment of photostable nano-titanium dioxide
In this study, the use of nano-TiO2 has been divided into two groups of applications; the photostable
TiO2 and other applications group (main use UV absorbers) and the photocatalytic TiO2 group. The
anatase crystal form of TiO2 is a more efficient photocatalyst than the rutile form of TiO2 and,
consequently, most photocatalytic consumer products contain nanosized anatase TiO2. However,
mixtures of both crystal forms are often used, and the two groups of applications do not fully reflect
a division between the two crystal forms.
This section is about risk assessment of the photostable form of nano-TiO2 while the photocatalytic
form is assessed in section 3.3.
Sources and releases 3.2.1
The main applications of nano-TiO2 listed in a Swiss modelling study by Sun et al. (2014) were
cosmetics, cleaning agents, plastics and consumer electronics. Cosmetics accounted for more than
half of the total consumption and as the major part is released directly to the environment or to
STPs this application is likely the major source of nano-TiO2 in the environment. Its use in
sunscreens in Denmark may likely be lower than the EU average, as the Nordic ecolabel (the Swan)
does not allow the use of TiO2 in sunscreens.
Photostable nano-TiO2 is used in Denmark also for production of pigments, cosmetics and possibly
paints. An ongoing survey has indicated that the use of TiO2 for the production of sunscreens in
Denmark has decreased in recent years, but nano-TiO2 may be used in other types of cosmetics.
The annual use volume in Denmark of photostable nano-TiO2 in different products and applications
has been modelled to be approx. 190 t/year (most probable value) of which a total of approx. 35-
40% are released into environmental compartments. However, the modelling show a range of very
likely use volume values from 100 to 300 t/year and a total spectrum of use volumes ranging from a
few tonnes per year to almost 400 t/year.
Table 3-1 summarises the modelled release concentrations (PECs) for the technical compartments
of relevance for nano-TiO2. The results are presented as the most probable values and the 95%
probability range for the lower and upper release concentrations.
TABLE 3-1
PREDICTED CONCENTRATIONS FOR PHOTOSTABLE AND OTHER NANO-TiO2 IN DIFFERENT TECHNICAL
COMPARTMENTS. THE RESULTS ARE SHOWN AS MOST PROBABLE VALUES AND 95 % PROBABILITY RANGES FOR
LOWER AND UPPER CONCENTRATION LIMITS.
Compartment (source) Concentrations
Unit Most probable
value
95% range
Sewage treatment effluent µg/L 12.6 3.4 - 91.9
Sewage treatment sludge mg/kg 775 68.7 - 1480
Waste mass incinerated mg/kg 15.0 1.4 - 32.1

Environmental assessment of nanomaterial use in Denmark 23
Bottom ash of waste incineration
mg/kg 33.0 3.4 - 87.6
Fly ash of waste incineration mg/kg 169 16.9 - 433
Figure 3-1 below shows the relative distribution of the total amount released annually from the
technosphere to the environment (35-40% of 190 t/y i.e. approx. 65-70 t/y) and the resulting
distribution of the amount in the receiving environmental compartments.
FIGURE 3-1
OVERVIEW OF THE MOST IMPORTANT SOURCES AND RECEIVERS FOR PHOTOSTABLE AND OTHER NANO-TiO2.
THE PERCENTAGES REFLECT THE MOST PROBABLE VALUES. ONLY APPROX. 35-40 % OF THE TOTAL USE VOLUME
OF NANO-TiO2 IS RELEASED FROM THE TECHNICAL COMPARTMENTS TO ENVIRONMENTAL COMPARTMENTS.
WIP = WASTE INCINERATION PLANTS;
STP = SEWAGE TREATMENT PLANTS;
PMC = PRODUCTION, MANUFACTURING AND CONCUMPTION (DIRECT RELEASE WITHOUT PRIOR TREATMENT).
Thus, only a limited part of the use volume (approx. 10% of the mass, at the most 20-25%) is
expected to reach the aquatic environment, ending up in sediments. The amount released into the
air is considered insignificant. Direct release into the aquatic environment also seems minimal (a
few tons annually), and the amount released directly to soils is assumed to be almost zero while use
of STP sludge on (agricultural) soils contributes considerably to the total load on the soil
compartment.
Important environmental fate processes 3.2.2
TiO2 is one of the more studied ENMs regarding environmental fate and exposure. Several
processes affect the fate of TiO2 nanomaterials, while others are less likely to occur. For example,
TiO2 ENMs do not dissolve, and the importance of dissolution for the environmental fate and
behaviour or TiO2 is hence considered to be low for all environmental compartments.
It is well-known that TiO2 aggregates in water with a more pronounced aggregation in salt water
compared to freshwater. TiO2 aggregation behaviour in natural waters shows a formation of larger
aggregates in brackish water compared to freshwater due to the higher ionic strength of the former
while the difference of aggregation in freshwaters with different compositions was linked to
presence of organic substances and pH. Aggregation (including hetero-aggregation, i.e. adsorption
of TiO2 to particulates present in the water) can lead to sedimentation. Therefore, aggregation and
sedimentation processes are considered of high importance for TiO2 ENMs. As regards the soil

24 Environmental assessment of nanomaterial use in Denmark
compartment, it is considered of high importance to consider adsorption/retention in soil in
environmental fate modelling of nano-TiO2.
For photostable TiO2 photochemical transformation processes are considered to be of medium
importance and as TiO2 is considered less likely to participate in electron transfer or uptake and
unlikely to dissolve to any significant extent in the environment, redox reactions and dissolution
processes are considered to be of low importance. As TiO2 is an inorganic material the process of
biodegradation is considered not to be relevant, while biomodification is evaluated as having rather
low importance in environmental fate modelling compared to other transformation processes.
Environmental exposure 3.2.3
Amongst all metal-containing nanosized materials studied for Denmark, the highest aquatic
concentration was modelled for nano-TiO2. This is in accordance with previous findings for other
countries/regions (Gottschalk et al., 2009; Sun et al., 2014), although a higher nano-TiO2
elimination in STPs was included taking recent measured data into account. .
The STP effluents showed the highest concentrations of a few to almost 100 µg/L (most probable
value around 13 µg/L).For freshwater the worst case scenario concentration was 0.1 µg/L , while for
marine water concentrations in the pg/L range were found. Soils and sediments were found to be
the most significant nano-TiO2 sinks, with approximate expected concentrations (most probable
values) for 2020 of 3 mg/kg in sludge treated soils and a few tenths of µg/kg in non-sludge-based
fertilised soils. In freshwater and marine water sediments, concentrations of 2.4 and 0.8 mg/kg
were modelled.
Table 3-2 summarises the modelled concentrations (PEC) for the environmental compartments of
relevance for nano-TiO2. The results are presented as the most probable values and the 95%
probability range for the lower and upper environmental concentrations. The figures for soils and
sediments represent the annual increase in concentrations, not the absolute values.
TABLE 3-2
PREDICTED ENVIRONMENTAL CONCENTRATIONS (PEC) FOR PHOTOSTABLE AND OTHER NANO-TiO2 IN DIFFERENT
ENVIRONMENTAL COMPARTMENTS. THE RESULTS ARE SHOWN AS MOST PROBABLE VALUES AND 95 %
PROBABILITY RANGES FOR LOWER AND UPPER CONCENTRATIONS.
FOR SOILS AND SEDIMENTS, THE FIGURES SHOWN ARE THE ANNUAL INCREASES IN PEC.
Compartment (type) Unit PEC Most probable
value
95% PEC range
Surface water (freshwater) µg/L 0.003 5.7E-04 - 0.1
Surface water (marine water) µg/L 3.2E-04 4.0E-05 - 0.001
Air µg/m3 1.1E-04 1.3E-05 - 4.9E-04
Sediments (freshwater) µg/kg/yr 180 31.1 - 4290
Sediments (marine water) µg/kg/yr 60.1 7.6 - 195
Soils (agricultural ) µg/kg/yr 0.013 0.002 - 0.1
Soils (natural) µg/kg/yr 0.028 0.004 - 0.2

Environmental assessment of nanomaterial use in Denmark 25
Soils (urban) µg/kg/yr 0.051 0.006 - 0.2
Soils (STP sludge treated) µg/kg/yr 205 19.9 - 473
Table 3-3 forecasts concentrations for photostable and other nano-TiO2 after an ENM deposition
period in soils beginning at zero in 2000 and ending at the beginning of the years 2014 and 2020,
respectively. For non-fertilized (no sewage sludge fertilizer) soil areas, our model suggests most
probable values around 80-330 ng/kg in 2014 increasing to 200-700 ng/kg in 2020 assuming an
unchanged annual use volume after 2014. It should be noted that the area of sludge-treated land is
only a few percent of the total cultivated area in Denmark.
TABLE 3-3
PREDICTED ENVIRONMENTAL CONCENTRATIONS (PEC) FOR PHOTOSTABLE AND OTHER NANO-TiO2 IN SEDIMENTS
AND SOILS. THE RESULTS ARE SHOWN AS MOST PROBABLE VALUES.
THE PEC VALUES FOR SOILS AND SEDIMENTS REFLECT THE CONCENTRATIONS OF NANO-TIO2 RESULTING FROM
ACCUMULATION IN THE PERIOD 2000 UNTIL THE BEGINNING OF 2014 AND 2020, RESPECTIVELY.
Compartment (type)
Unit
Year
2014 2020
Sediments (freshwater) µg/kg 1170 2450
Sediments (marine water) µg/kg 391 816
Soils (agricultural ) µg/kg 0.085 0.2
Soils (natural) µg/kg 0.18 0.4
Soils (urban) µg/kg 0.33 0.7
Soils (STP sludge treated) µg/kg 1330 2780
Environmental effects 3.2.4
For nano-TiO2 more than 250 articles on environmental effects were identified but most of them
did not meet basic quality or validity criteria for inclusion in the data set for derivation of a PNEC
value. Around 20 articles reporting NOEC/EC10-values including EC50 values were selected for
further assessment of which six studies were found 'adequate for regulatory use' and six studies
were assessed as ‘may be adequate for regulatory use'. In most cases, the reason for the lower
adequacy of some studies was the poor characterisation of the inherent properties of the tested
nanomaterials.
It appears that short term tests have been performed on all three trophic levels of algae, daphnia
and fish. For algae, 72-h EC50 values are seen in the range of 2.53-241 mg/L while in 48-h
immobilization studies of daphnia, LC50 values are found to be >10 and even >100 mg/L. Different
kinds of short term studies on fish have been performed revealing 48-h LC50 values >10 mg/L,
depending on the composition of the tested TiO2, and finally for embryo a 72-h LC50 value of
>2,000 mg/L for a coated TiO2 NM. Among the tested organisms the algae appear to be the most
sensitive on a short-term basis, with an EC50 of 2,53 mg/L. Chronic studies have been performed
on both algae and daphnia revealing 72-h NOEC like data from <0.5 to 3.3 mg/L.
3.2.4.1 PNEC for nano-TiO2
As data from short-term tests are available for all three base-set test organisms as well as some
long-term chronic data on the most sensitive organism group in the short term tests, an assessment
26 Environmental assessment of nanomaterial use in Denmark
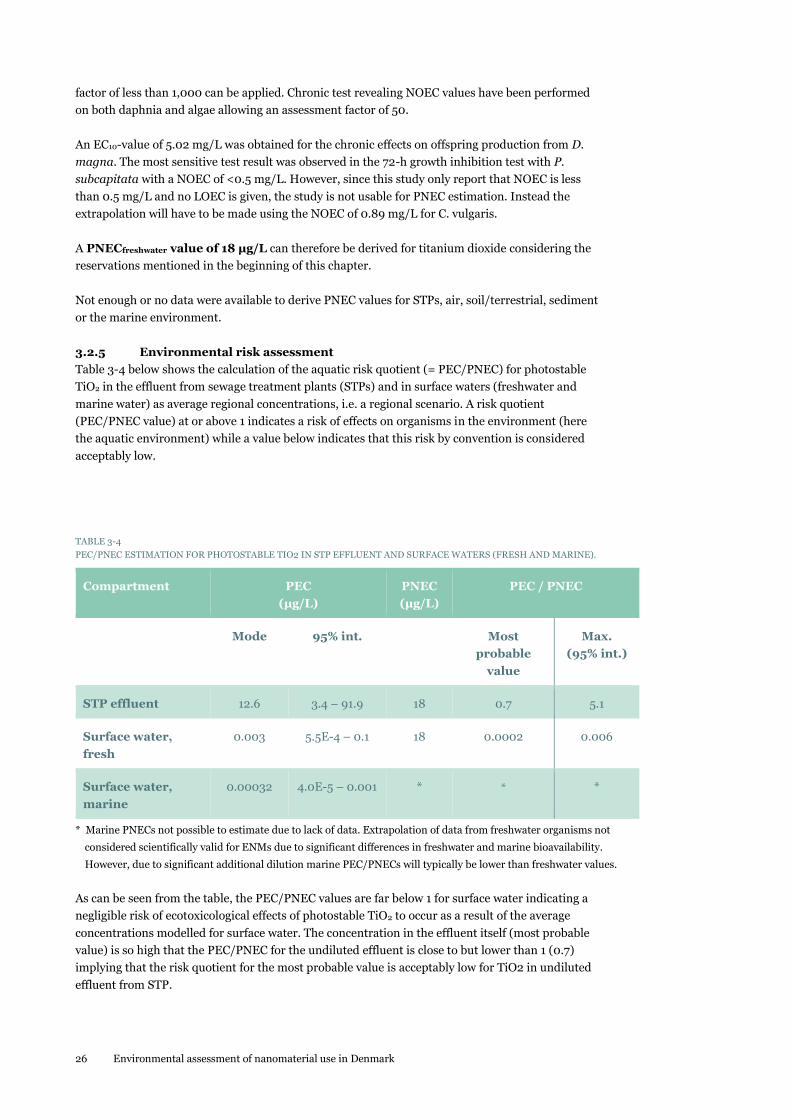
factor of less than 1,000 can be applied. Chronic test revealing NOEC values have been performed
on both daphnia and algae allowing an assessment factor of 50.
An EC10-value of 5.02 mg/L was obtained for the chronic effects on offspring production from D.
magna. The most sensitive test result was observed in the 72-h growth inhibition test with P.
subcapitata with a NOEC of <0.5 mg/L. However, since this study only report that NOEC is less
than 0.5 mg/L and no LOEC is given, the study is not usable for PNEC estimation. Instead the
extrapolation will have to be made using the NOEC of 0.89 mg/L for C. vulgaris.
A PNECfreshwater value of 18 µg/L can therefore be derived for titanium dioxide considering the
reservations mentioned in the beginning of this chapter.
Not enough or no data were available to derive PNEC values for STPs, air, soil/terrestrial, sediment
or the marine environment.
Environmental risk assessment 3.2.5
Table 3-4 below shows the calculation of the aquatic risk quotient (= PEC/PNEC) for photostable
TiO2 in the effluent from sewage treatment plants (STPs) and in surface waters (freshwater and
marine water) as average regional concentrations, i.e. a regional scenario. A risk quotient
(PEC/PNEC value) at or above 1 indicates a risk of effects on organisms in the environment (here
the aquatic environment) while a value below indicates that this risk by convention is considered
acceptably low.
TABLE 3-4
PEC/PNEC ESTIMATION FOR PHOTOSTABLE TIO2 IN STP EFFLUENT AND SURFACE WATERS (FRESH AND MARINE).
Compartment PEC
(µg/L)
PNEC
(µg/L)
PEC / PNEC
Mode 95% int. Most
probable
value
Max.
(95% int.)
STP effluent 12.6 3.4 – 91.9 18 0.7 5.1
Surface water,
fresh
0.003 5.5E-4 – 0.1 18 0.0002 0.006
Surface water,
marine
0.00032 4.0E-5 – 0.001 * * *
* Marine PNECs not possible to estimate due to lack of data. Extrapolation of data from freshwater organisms not
considered scientifically valid for ENMs due to significant differences in freshwater and marine bioavailability.
However, due to significant additional dilution marine PEC/PNECs will typically be lower than freshwater values.
As can be seen from the table, the PEC/PNEC values are far below 1 for surface water indicating a
negligible risk of ecotoxicological effects of photostable TiO2 to occur as a result of the average
concentrations modelled for surface water. The concentration in the effluent itself (most probable
value) is so high that the PEC/PNEC for the undiluted effluent is close to but lower than 1 (0.7)
implying that the risk quotient for the most probable value is acceptably low for TiO2 in undiluted
effluent from STP.

Environmental assessment of nanomaterial use in Denmark 27
In the high end of the 95% interval a dilution factor of about 5 is required to obtain a PEC/PNEC <1,
which is normally but not always possible to obtain in streams/rivers within a reasonable distance
from the discharge point, in particular in small streams in Eastern Denmark during summer.
Due to lack of ecotoxicological effect data for other environmental compartments than the aquatic,
it is not possible to make a quantitative risk assessment for e.g. the soil compartment. However, the
concentrations predicted for natural, agricultural and urban soils are low and, furthermore, it is
considered likely that various fate processes in the soil rather quickly will transform the photostable
TiO2 into larger particles (aggregates) or sorb them to NOM or other soil particles thereby reducing
the exposure to the nano-form considerably. A possible concentration in sludge-treated soils of
more than 1 mg/kg (i.e. more than 1000 times higher than in the other soil categories) has been
predicted but this is still considered quite low for a not very toxic material/substance like TiO2.

28 Environmental assessment of nanomaterial use in Denmark
Summary for photostable TiO2 3.2.6
The main findings in relation to the environmental risk assessment of photostable TiO2 are
summarised in the box below.
Summary
In line with European studies and compared to other metallic nanomaterials, the
currently highest aquatic exposure in Denmark among the ENMs in this study is
found for photostable and other nano-TiO2.
The non-diluted effluent from sewage treatment plants shows the highest
concentrations with a most probable value around 13 µg/L and a max. value of
around 92 µg/L.
The freshwater concentrations reach at most one tenth of a µg/L (worst case
scenarios) while the ones in marine water are almost completely in pg/L range.
Soils and sediments represent the most significant nanomaterial sinks with modal
concentrations for 2020 of 2.4 and 0.8 mg/kg in sediments (freshwater and marine
water), 3 mg in sludge treated soils and a few tenths µg/kg in untreated soils.
The most important processes determining the environmental fate of photostable
TiO2 are aggregation/agglomeration, sedimentation and adsorption.
Short term aquatic toxicity data on nano-TiO2 are available for fish, daphnia and
algae and chronic data exist for daphnia and algae. The effect levels are in the mg/L
range with the most sensitive endpoint being a NOEC <0.89 mg/L for algae leading to
a PNEC of 18 µg/L.
Based on this PNEC the most probable risk quotient for STP effluent is 0.7 while the
max. quotient is 5.1. The worst case value for freshwater is 0.006. These values
suggest a very low environmental risk for freshwater in general and an acceptable
local risk near STP effluent points.
The concentrations predicted for soils not treated with STP sludge are low and it is
likely that fate processes in the soil rather quickly will transform the nano-TiO2 and
thereby reduce the exposure to the nano-form considerably.
3.3 Risk assessment of photocatalytic nano-titanium dioxide
As mentioned in section 3.2 there are two main groups of nano-TiO2 applications; the photostable
TiO2 and other applications group (by far the largest use category of the two; main uses as UV
absorbers) and the photocatalytic TiO2 group (main uses for paints and other coatings). This section
is about risk assessment of the photocatalytic form of nano-TiO2 while the photostable form was
assessed in section 3.2.
UV and visible light can induce catalytic activity in photocatalytic nano-TiO2. Via the photocatalytic
effect, reactive oxygen species are formed, which can decompose organic substances and bacteria on
illuminated surfaces to achieve self-cleaning/antibacterial effects.
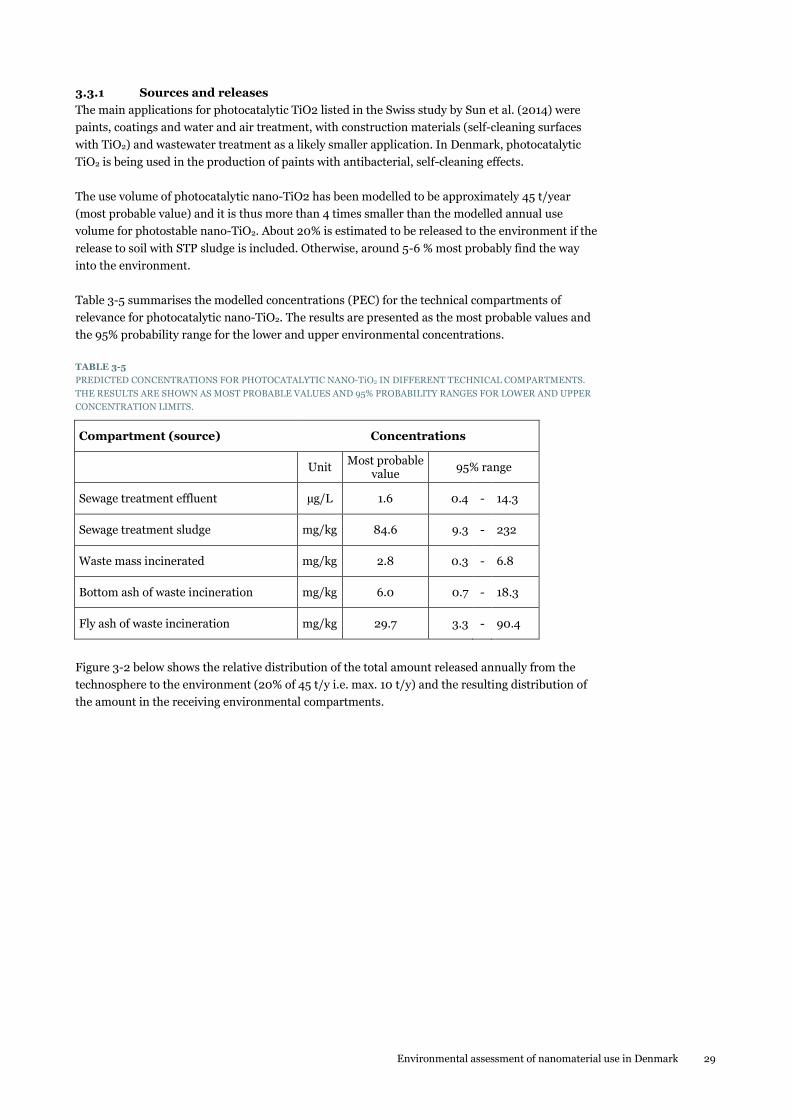
Environmental assessment of nanomaterial use in Denmark 29
Sources and releases 3.3.1
The main applications for photocatalytic TiO2 listed in the Swiss study by Sun et al. (2014) were
paints, coatings and water and air treatment, with construction materials (self-cleaning surfaces
with TiO2) and wastewater treatment as a likely smaller application. In Denmark, photocatalytic
TiO2 is being used in the production of paints with antibacterial, self-cleaning effects.
The use volume of photocatalytic nano-TiO2 has been modelled to be approximately 45 t/year
(most probable value) and it is thus more than 4 times smaller than the modelled annual use
volume for photostable nano-TiO2. About 20% is estimated to be released to the environment if the
release to soil with STP sludge is included. Otherwise, around 5-6 % most probably find the way
into the environment.
Table 3-5 summarises the modelled concentrations (PEC) for the technical compartments of
relevance for photocatalytic nano-TiO2. The results are presented as the most probable values and
the 95% probability range for the lower and upper environmental concentrations.
TABLE 3-5
PREDICTED CONCENTRATIONS FOR PHOTOCATALYTIC NANO-TiO2 IN DIFFERENT TECHNICAL COMPARTMENTS.
THE RESULTS ARE SHOWN AS MOST PROBABLE VALUES AND 95% PROBABILITY RANGES FOR LOWER AND UPPER
CONCENTRATION LIMITS.
Compartment (source) Concentrations
Unit Most probable
value 95% range
Sewage treatment effluent µg/L 1.6 0.4 - 14.3
Sewage treatment sludge mg/kg 84.6 9.3 - 232
Waste mass incinerated mg/kg 2.8 0.3 - 6.8
Bottom ash of waste incineration mg/kg 6.0 0.7 - 18.3
Fly ash of waste incineration mg/kg 29.7 3.3 - 90.4
Figure 3-2 below shows the relative distribution of the total amount released annually from the
technosphere to the environment (20% of 45 t/y i.e. max. 10 t/y) and the resulting distribution of
the amount in the receiving environmental compartments.

30 Environmental assessment of nanomaterial use in Denmark
FIGURE 3-2
OVERVIEW OF THE MOST IMPORTANT PHOTOCATALYTIC NANO-TIO2 SOURCES AND RECEIVERS. THE
PERCENTAGES REFLECT THE MOST PROBABLE VALUES.
WIP = WASTE INCINERATION PLANTS;
STP = SEWAGE TREATMENT PLANTS;
PMC = PRODUCTION, MANUFACTURING AND CONCUMPTION (DIRECT RELEASE WITHOUT PRIOR TREATMENT).
Thus, the figure shows that most photocatalytic nano-TiO2 ends up in soils following application
with STP sludge. A smaller portion (approx. 6 times smaller) can enter soils via air deposition of
PMC-based emissions. This finding confirms that the use of photocatalytic nano-TiO2 in various
types of paints and coatings may also lead to release of nanomaterial to soils via air deposition. The
results on ENM recipients here show that about 80% ends up in soils while the rest reaches the
aquatic environment. The potential air contamination again seems to be insignificant for the
current ENM use amounts and fields of application.
Important environmental fate processes 3.3.2
Photostable and photocatalytic nano-TiO2 are in many respects very similar with regard to their
environmental behaviour and fate and, therefore, only one common description of the relevant
processes was made for this nanomaterial and is repeated here for the reader's convenience.
TiO2 is one of the more studied ENMs regarding environmental fate. Several processes affect the
fate of TiO2 nanomaterials while others are less likely to occur. For example, TiO2 ENMs do not
dissolve and the importance of dissolution for the environmental fate and behaviour or TiO2 is
hence considered to be low for all environmental compartments.
It is well-known that TiO2 aggregates in water with a more pronounced aggregation in salt water
compared to freshwater. TiO2 aggregation behaviour in natural waters shows a formation of larger
aggregates in brackish water compared to freshwater due to the higher ionic strength of the former
while the difference of aggregation in freshwaters with different compositions was linked to
presence of organic substances and pH. Aggregation (including hetero-aggregation, i.e. adsorption
of TiO2 to particulates present in the water) can lead to sedimentation. Therefore, aggregation and
sedimentation processes are considered of high importance for TiO2 ENMs. As regards the soil
compartment, it is considered of high importance to consider adsorption/retention in soil in
environmental fate modelling of nano-TiO2.
Overall for TiO2, photochemical transformation processes are considered to be of medium
importance and as TiO2 is considered less likely to participate in electron transfer or uptake and
unlikely to dissolve to any significant extent in the environment, redox reactions and dissolution
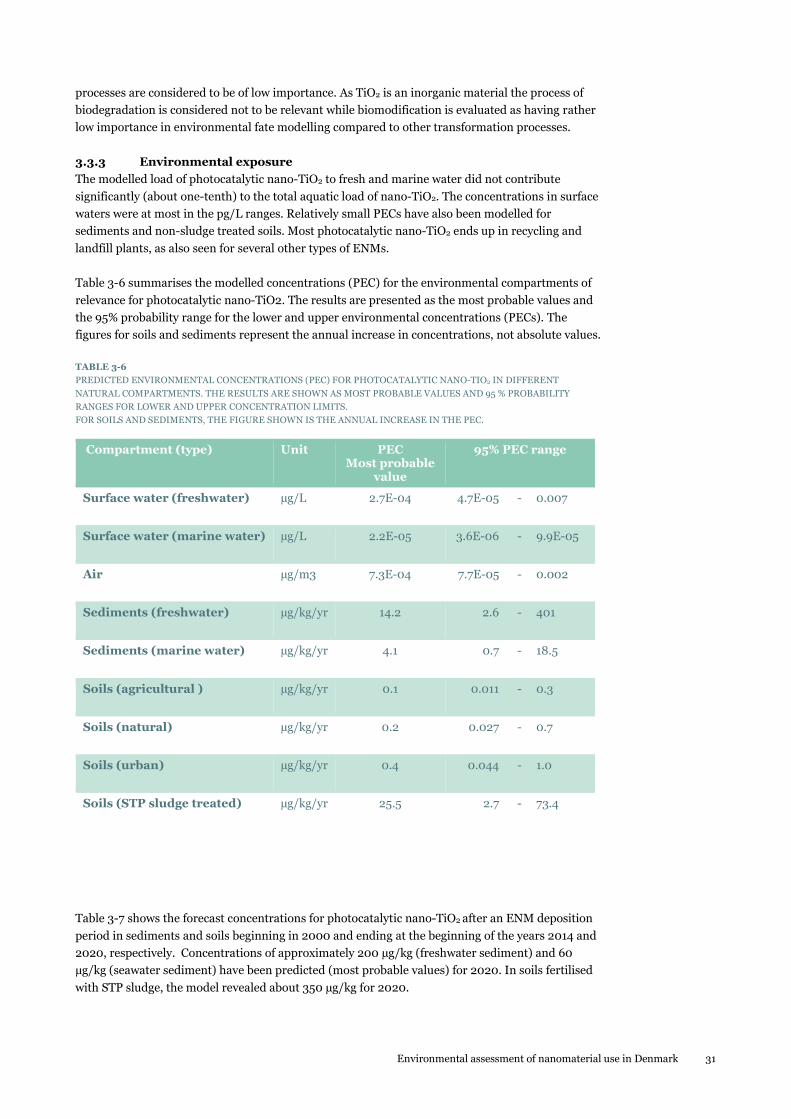
Environmental assessment of nanomaterial use in Denmark 31
processes are considered to be of low importance. As TiO2 is an inorganic material the process of
biodegradation is considered not to be relevant while biomodification is evaluated as having rather
low importance in environmental fate modelling compared to other transformation processes.
Environmental exposure 3.3.3
The modelled load of photocatalytic nano-TiO2 to fresh and marine water did not contribute
significantly (about one-tenth) to the total aquatic load of nano-TiO2. The concentrations in surface
waters were at most in the pg/L ranges. Relatively small PECs have also been modelled for
sediments and non-sludge treated soils. Most photocatalytic nano-TiO2 ends up in recycling and
landfill plants, as also seen for several other types of ENMs.
Table 3-6 summarises the modelled concentrations (PEC) for the environmental compartments of
relevance for photocatalytic nano-TiO2. The results are presented as the most probable values and
the 95% probability range for the lower and upper environmental concentrations (PECs). The
figures for soils and sediments represent the annual increase in concentrations, not absolute values.
TABLE 3-6
PREDICTED ENVIRONMENTAL CONCENTRATIONS (PEC) FOR PHOTOCATALYTIC NANO-TIO2 IN DIFFERENT
NATURAL COMPARTMENTS. THE RESULTS ARE SHOWN AS MOST PROBABLE VALUES AND 95 % PROBABILITY
RANGES FOR LOWER AND UPPER CONCENTRATION LIMITS.
FOR SOILS AND SEDIMENTS, THE FIGURE SHOWN IS THE ANNUAL INCREASE IN THE PEC.
Compartment (type) Unit PEC Most probable
value
95% PEC range
Surface water (freshwater) µg/L 2.7E-04 4.7E-05 - 0.007
Surface water (marine water) µg/L 2.2E-05 3.6E-06 - 9.9E-05
Air µg/m3 7.3E-04 7.7E-05 - 0.002
Sediments (freshwater) µg/kg/yr 14.2 2.6 - 401
Sediments (marine water) µg/kg/yr 4.1 0.7 - 18.5
Soils (agricultural ) µg/kg/yr 0.1 0.011 - 0.3
Soils (natural) µg/kg/yr 0.2 0.027 - 0.7
Soils (urban) µg/kg/yr 0.4 0.044 - 1.0
Soils (STP sludge treated) µg/kg/yr 25.5 2.7 - 73.4
Table 3-7 shows the forecast concentrations for photocatalytic nano-TiO2 after an ENM deposition
period in sediments and soils beginning in 2000 and ending at the beginning of the years 2014 and
2020, respectively. Concentrations of approximately 200 µg/kg (freshwater sediment) and 60
µg/kg (seawater sediment) have been predicted (most probable values) for 2020. In soils fertilised
with STP sludge, the model revealed about 350 µg/kg for 2020.

32 Environmental assessment of nanomaterial use in Denmark
TABLE 3-7
PREDICTED ENVIRONMENTAL CONCENTRATIONS (PEC) FOR PHOTOSCATALYTIC NANO-TIO2 IN SEDIMENTS AND
SOILS. THE RESULTS ARE SHOWN AS MOST PROBABLE VALUES.
THE PEC VALUES FOR SOILS AND SEDIMENTS REFLECT THE CONCENTRATIONS OF NANO-TIO2 RESULTING FROM
ACCUMULATION IN THE PERIOD 2000 UNTIL THE BEGINNING OF 2014 AND 2020, RESPECTIVELY.
Compartment (type)
Unit
Year
2014 2020
Sediments (freshwater) µg/kg 92.3 193
Sediments (marine water) µg/kg 26.5 55.3
Soils (agricultural ) µg/kg 0.7 1.4
Soils (natural) µg/kg 1.5 3.2
Soils (urban) µg/kg 2.7 5.6
Soils (STP sludge treated) µg/kg 166 346
Environmental effects 3.3.4
Photostable and photocatalytic nano-TiO2 are very difficult to differentiate with regard to their
environmental effects due to the lack of ecotoxicological studies distinguishing between the two
different forms of TiO2. Therefore, the following effect assessment for photocatalytic nano-TiO2 is
identical with the one presented for photostable nano-TiO2 in section 3.2.
More than 250 articles on environmental effects were identified for nano-TiO2 but most of them did
not meet basic quality or validity criteria for inclusion in the data set for derivation of a PNEC value.
Around 20 articles reporting NOEC/EC10-values including EC50 values were selected for further
assessment of which six studies were found 'adequate for regulatory use' and six studies were
assessed as ‘may be adequate for regulatory use'. In most cases, the reason for the lower adequacy of
some studies was the poor characterisation of the inherent properties of the tested nanomaterials.
It appears that short term tests have been performed on all three trophic levels of algae, daphnia
and fish. For algae, 72-h EC50 values are seen in the range of 2.53-241 mg/L while in 48-h
immobilization studies of daphnia, LC50 values are found to be >10 and even >100 mg/L. Different
kinds of short term studies on fish have been performed revealing 48-h LC50 values >10 mg/L,
depending on the composition of the tested TiO2, and finally for embryo a 72-h LC50 value of
>2,000 mg/L for a coated TiO2 NM. Among the tested organisms the algae appear to be the most
sensitive on a short-term basis, with an EC50 of 2,53 mg/L. Chronic studies have been performed
on both algae and daphnia revealing 72-h NOEC like data from <0.5 to 3.3 mg/L.
3.3.4.1 PNEC for nano-TiO2
As data from short-term tests are available for all three base-set test organisms as well as some
long-term chronic data on the most sensitive organism group in the short term tests, an assessment
factor of less than 1,000 can be applied. Chronic test revealing NOEC values have been performed
on both daphnia and algae allowing an assessment factor of 50. Due to the specific catalytic action
of photocatalytic TiO2 the effect values might be expected to be lower than for photostable TiO2 and
leading to a correspondingly lower PNEC. However, the currently available data do not allow for
such distinction between the two types of this nano material.

Environmental assessment of nanomaterial use in Denmark 33
An EC10-value of 5.02 mg/L was obtained for the chronic effects on offspring production from D.
magna. The most sensitive test result was observed in the 72-h growth inhibition test with P.
subcapitata with a NOEC of <0.5 mg/L. However, since this study only report that NOEC is less
than 0.5 mg/L and no LOEC is given, the study is not usable for PNEC estimation. Instead the
extrapolation will have to be made using the NOEC of 0.89 mg/L for C. vulgaris.
A PNECfreshwater value of 18 µg/L can therefore be derived for photocatalytic titanium dioxide
considering the reservations mentioned in the beginning of this chapter. This value is identical to
the PNEC estimated for photostable titanium dioxide.
Not enough or no data were available to derive PNEC values for STPs, air, soil/terrestrial, sediment
or the marine environment.
Environmental risk assessment 3.3.5
Table 3-8 below shows the calculation of the aquatic risk quotient (= PEC/PNEC) for photocatalytic
TiO2 in the effluent from sewage treatment plants (STPs) and in surface waters (freshwater and
marine water) as average concentrations, i.e. a regional scenario. A risk quotient (PEC/PNEC value)
at or above 1 indicates a risk of effects on organisms in the environment (here aquatic environment)
while a value below indicates that this risk by convention is considered acceptably low.
TABLE 3-8
PEC/PNEC ESTIMATION FOR PHOTOCATALYTIC TIO2 IN STP EFFLUENT AND SURFACE WATERS (FRESH AND
MARINE).
Compartment PEC
(µg/L)
PNEC
(µg/L)
PEC / PNEC
Mode 95% int. Most probable
value
Max.
(95% int.)
STP effluent 1.6 0.4-14.3 18 0.09 0.79
Surface water, fresh 2.7E-04 4.7E-05 – 0.007 18 1.5 E-5 3.9E-4
Surface water, marine 2.2E-05 3.6E-06 – 9.9E-05 * * *
* Marine PNECs not possible to estimate due to lack of data. Extrapolation of data from freshwater organisms not
considered scientifically valid for ENMs due to significant differences in freshwater and marine bioavailability.
However, due to significant additional dilution marine PEC/PNECs will typically be lower than freshwater values.
Thus, the PEC/PNEC values are below 1 even for undiluted STP effluent and << 1 for surface waters
indicating a negligible risk of ecotoxicological effects of photocatalytic TiO2 in surface waters.
Due to lack of ecotoxicological effect data for other environmental compartments than the aquatic,
it is not possible to make a quantitative risk assessment for e.g. the soil compartment. However, the
concentrations predicted for natural, agricultural and urban soils are very low and even sludge-
treated soils will contain less than 0.2 mg/kg.

34 Environmental assessment of nanomaterial use in Denmark
Summary for photocatalytic TiO2 3.3.6
The main findings in relation to the environmental risk assessment of photocatalytic TiO2 are
summarised in the box below.
Summary
Contrary to photostable nano-TiO2, and due to the different use patterns of the two
nanoforms of TiO2, the relative mass transfer of photocatalytic nano-TiO2 into waste,
recycling and landfilling processes is probably higher than that into the aquatic and
terrestrial environments.
Currently, the Danish environmental release of photocatalytic TiO2 seems not to be
too critical: the terrestrial compartments receive about 6 tons/year, while aquatic
environments receive, at the most, one ton annually. I.e. the released amount is
significantly lower than that of photostable TiO2.
Compared to photostable and other nano-TiO2 and based on current predictions of
the use amounts of photocatalytic nano-TiO2, its aquatic exposure relevance is much
lower (approx. by a factor of 10).
The most important processes determining the environmental fate of photocatalytic
TiO2 are aggregation/agglomeration, sedimentation and adsorption.
Short term aquatic toxicity data on nano-TiO2 are available for fish, daphnia and
algae and chronic data exist for daphnia and algae. The effect levels are in the mg/L
range with the most sensitive endpoint being a NOEC = 0.89 mg/L for algae leading
to a PNEC of 18 µg/L.
Due to the specific catalytic action of photocatalytic TiO2 the effect values could be
expected to be lower than for photostable TiO2. However, the currently available data
do not allow for such distinction and the estimated PNEC values are therefore
identical for the two types of nano-TiO2.
Based on this PNEC a most probable risk quotient for STP effluent of 0.09 and a max.
value of 0.79 has been calculated and a corresponding max. value for freshwater of
0.0004. These values indicate a low environmental risk for photocatalytic TiO2 in
aquatic environments.
3.4 Risk assessment of nano-zinc oxide (nano-ZnO)
Sources and releases 3.4.1
According to the study by Sun et al. (2014), the major application of nano-ZnO is as a UV filter in
sunscreens. This application accounts for more than half of the consumption. However, nano-ZnO
is not included in the list of UV filters allowed in cosmetic products in the EU and Denmark. The
pigmentary grade of ZnO still allows it to be used as a white pigment, but it is not considered a
nanomaterial. The only other potential major application identified was the use of nano-ZnO in
paint. No actual use of nano-ZnO for production processes in Denmark was identified.
The annual use volume in Denmark of nano-ZnO in different products and applications has been
modelled to be approx. 40 t/year (most probable value) of which only approx. 10% is released into
environmental compartments on nano-form (mainly directly from PMC) as nano-ZnO has been
found to be almost completely transformed into other forms during STP processes.

Environmental assessment of nanomaterial use in Denmark 35
Table 3-9 summarises the modelled concentrations (PEC) for the technical compartments of
relevance for nano-ZnO. The results are presented as the most probable values and the 95%
probability range for the lower and upper environmental concentrations (PECs).
TABLE 3-9
PREDICTED CONCENTRATIONS FOR NANO-ZNO IN DIFFERENT TECHNICAL COMPARTMENTS. THE RESULTS ARE
SHOWN AS MOST PROBABLE VALUES AND 95% PROBABLITY RANGES FOR LOWER AND UPPER CONCENTRATION
LIMITS.
Compartment (source) Concentrations
Unit
Most probable value
95% range
Sewage treatment effluent µg/L ≈0
Sewage treatment sludge mg/kg Almost no ZnO remaining in its initial nanoform.
Waste mass incinerated mg/kg 0.3 0.04 - 1.5
Bottom ash of waste incineration mg/kg 0.7 0.1 - 3.9
Fly ash of waste incineration mg/kg 3.6 0.5 - 19.2
Figure 3-3 below shows the relative distribution of the total amount released annually from the
technosphere to the environment (10% of 40 t/y i.e. <5 t/y) and the resulting distribution of the
amount in the receiving environmental compartments.
FIGURE 3-3
OVERVIEW OF THE MOST IMPORTANT NANO-ZnO SOURCES AND RECEIVERS. THE PERCENTAGES REFLECT MODAL
RESULTS (THE MOST PROBABLE VALUES).
WIP = WASTE INCINERATION PLANTS;
STP = SEWAGE TREATMENT PLANTS;
PMC = PRODUCTION, MANUFACTURING AND CONCUMPTION (DIRECT RELEASE WITHOUT PRIOR TREATMENT).
The figure shows that most of the released nano-ZnO comes from PMC (production, manufacturing,
consumption), which highlights the dominant use of nano-ZnO in cosmetic products. Consequently,

36 Environmental assessment of nanomaterial use in Denmark
most of the environmental flows, which are a few tonnes at the most, bring this ENM into the
aquatic environment (approx. 98%). The approximately 17 % of released nanomaterial that
originate from STPs have to be fully allocated to the overflow of such sewage treatment facilities.
Significant air and soil contamination is not anticipated based on the current use volumes and types
of nano-ZnO product applications.
Important environmental fate processes 3.4.2
Nano-ZnO has been shown to exert photocatalytic behaviour. However, compared to TiO2 the
photocatalytic activity is limited, and the importance of photochemical transformations is
considered to be low.
Rapid dissolution of nano-ZnO has been demonstrated but concurrent aggregation/agglomeration
will control the resulting equilibrium concentration of the suspension depending on the size of the
nanoparticles. As dissolution is considered a very important process for nano-ZnO, the processes of
agglomeration and aggregation will ‘compete’ with ENM dissolution. Additionally, sedimentation of
larger aggregates/agglomerates will still be important. Furthermore, NOM has been shown to
adsorb to nano-ZnO and is considered a relatively important fate process for this material.
Studies have shown high sorption/retention in e.g. soil columns. The sorption onto other surfaces
would be evaluated medium as the sorption most likely would be either a function of retention from
physical straining or through complexation of dissolved species from the ZnO NP.
As ZnO is an inorganic material the process of biodegradation is considered not to be relevant,
while biomodification is evaluated as having rather low importance in environmental fate modelling
compared to other transformation processes.
Environmental exposure 3.4.3
An almost complete nano-ZnO removal in the sewage treatment plants (STPs) results in low PEC
values in waters and sediments for nano-ZnO (see Table 3-10). The PEC for STP sludge and soils
treated with STP sludge are considered to be almost zero because nano-ZnO has been shown to be
almost completely transformed and is therefore not expected to be present in its initial nanoform
following sewage treatment processes.
The freshwater PECs were mainly in the pg/L to lower ng/L level; the marine water PECs were a
factor 10 lower than the freshwater PECs and all in the pg/L range. Soils and sediments represented
the final sinks; however, only very low quantities of nano-ZnO were modelled here.
Table 3-10 summarises the modelled concentrations (PEC) for the environmental compartments of
relevance for nano-ZnO. The results are presented as the most probable values and the 95%
probability range for the lower and upper environmental concentrations (PECs). The figures for
soils and sediments represent the annual increase in concentrations, not the absolute values.
TABLE 3-10
PREDICTED CONCENTRATIONS FOR NANO-ZNO IN DIFFERENT NATURAL COMPARTMENTS. THE RESULTS ARE
SHOWN AS MOST PROBABLE VALUES AND 95% PROBABLITY RANGES FOR LOWER AND UPPER CONCENTRATION
LIMITS. FOR SOILS AND SEDIMENTS, THE FIGURE SHOWN IS THE ANNUAL INCREASE IN THE PEC.
Compartment (type) Unit PEC Most probable
value
95% PEC range
Surface water (freshwater) µg/L 4.5E-04 8.6E-05
- 0.013
Surface water (marine water) µg/L 4.1E-05 5.6E-06
- 1.8E-04

Environmental assessment of nanomaterial use in Denmark 37
Air µg/m3 3.6E-05 5.2E-06
- 2.3E-04
Sediments (freshwater) µg/kg/yr 25.2 4.5 - 735
Sediments (marine water) µg/kg/yr 7.6 0.9 - 33.8
Soils (agricultural ) µg/kg/yr 0.008 0.001 - 0.1
Soils (natural) µg/kg/yr 0.017 0.003 - 0.1
Soils (urban) µg/kg/yr 0.031 0.005 - 0.2
Soils (STP sludge treated) µg/kg/yr Almost no ZnO remaining in its initial nanoform
Table 3-11 shows the forecast concentrations for nano-ZnO after an ENM deposition period in soils
beginning in 2000 and ending at the beginning of the years 2014 and 2020, respectively. In 2020, a
few hundred ng/kg are predicted in soils, and a few hundred µg/kg in sediments. These values are
much lower than, for example, the predicted few mg/kg concentrations for photostable nano-TiO2.
TABLE 3-11
PREDICTED ENVIRONMENTAL CONCENTRATIONS (PEC) FOR NANO-ZNO IN SEDIMENTS AND SOILS. THE RESULTS
ARE SHOWN AS MOST PROBABLE VALUES.
THE PEC VALUES FOR SOILS AND SEDIMENTS REFLECT THE CONCENTRATIONS OF NANO-ZNO RESULTING FROM
ACCUMULATION IN THE PERIOD 2000 UNTIL THE BEGINNING OF 2014 AND 2020, RESPECTIVELY.
Compartment (type)
Unit
Year
2014 2020
Sediments (freshwater) µg/kg 164 342
Sediments (marine water) µg/kg 49.4 103
Soils (agricultural ) µg/kg 0.052 0.1
Soils (natural) µg/kg 0.12 0.2
Soils (urban) µg/kg 0.2 0.4
Soils (STP sludge treated) µg/kg Almost no ZnO remaining in its initial nanoform
Environmental effects 3.4.4
For nano-ZnO a little less than 80 scientific papers on environmental effects were identified,
however, most of the identified papers did not meet basic quality or validity criteria for inclusion in
the data set for derivation of a PNEC value. 18 articles reporting NOEC, EC10- andEC50 values were
selected for further assessment of which five studies were found 'adequate for regulatory use' and
six studies were assessed as ‘may be adequate for regulatory use. The main reason for low reliability
of the remaining studies was the lack of characterization and especially the lack of exposure
quantification throughout the test duration.
For the freshwater compartment short-term acute tests for all trophic levels of the base-set have
been identified, with EC50 for P. subcapitata <0.5 mg/L, LC50 for D. magna of 1-100 mg/L and
LC50 for embryos of D. rerio of 1589 mg/L. Additionally chronic studies of the algae and daphnia

38 Environmental assessment of nanomaterial use in Denmark
were performed with a NOAEC for P. subcapitata <0.5 mg/L and a NOEC for D. magna of 0.125
mg/L. Cell viability studies for the fish P. lucida and the protozoa T. thermophilia were performed,
revealing NOEC values of 2-25 mg/L and EC50 values of 4-8 mg/L, respectively.
Some articles not only reported effects for the nano-form, but also for the bulk-form and/or the
ionic Zn2+ form. In most cases the ionic form was more toxic and often the nano-form was at least
as toxic as the bulk-form.
3.4.4.1 PNEC for nano-ZnO
As data from short-term tests are available for all three base-set test organisms as well as some
chronic data, an assessment factor of less than 1,000 can be applied. At the short-term acute level,
algae is the most sensitive organism group. As chronic NOEC data have been derived for both algae
and daphnia, an assessment factor of 50 can be applied to derive the PNEC value.
The reported growth inhibition NOEC value for P. subcapitata <0.5 mg/L and the reproduction
NOEC for D. magna is 0.125 mg/L.
A PNECfreshwater value of 2.5 µg/L can therefore be derived for ZnO nanoparticles.
An assessment factor of 50 was set, based on the availability of adequate data. However, if the study
used for the PNEC estimation should not be the defining study, another study with an effect data
only a factor of 4 higher could be used resulting in a PNEC value of 10 µg/L.
Not enough or no data were available to derive PNEC values for STPs, air, soil/terrestrial, sediment
or the marine environment.
Environmental risk assessment 3.4.5
Table 3-12 below shows the calculation of the aquatic risk quotient (= PEC/PNEC) for nano-ZnO in
the effluent from sewage treatment plants (STPs) and in surface waters (freshwater and marine
water) as average concentrations, i.e. a regional scenario. A risk quotient (PEC/PNEC value) at or
above 1 indicates a risk of effects on organisms in the environment (here the aquatic environment)
while a value <1 indicates by convention that this risk is considered acceptably low.
TABLE 3-12
PEC/PNEC ESTIMATION FOR NANO-ZNO IN STP EFFLUENT AND SURFACE WATERS (FRESH AND
MARINE).
Compartment PEC
(µg/L)
PNEC
(µg/L)
PEC / PNEC
Mode 95% int. Most probable
value
Max.
(95% int.)
STP effluent ≈0 - 2.5 ≈0 -
Surface water, fresh 4.5E-04
8.6E-05 -
0.013
2.5 1.8E-04 0.0052
Surface water, marine 4.1E-05
5.6E-06 -
1.8E-04
* * *
* Marine PNECs not possible to estimate due to lack of data. Extrapolation of data from freshwater organisms not
considered scientifically valid for ENMs due to significant differences in freshwater and marine bioavailability.
However, due to significant additional dilution marine PEC/PNECs will typically be lower than freshwater values.

Environmental assessment of nanomaterial use in Denmark 39
Thus, the PEC/PNEC values for nano-ZnO are well below 1 even for undiluted STP effluent and
much below 1 for the two types of surface water indicating a negligible risk of ecotoxicological
effects of nano-ZnO in surface waters.
Due to lack of ecotoxicological effect data for other environmental compartments than the aquatic,
it is not possible to make a quantitative risk assessment for e.g. the soil compartment. However, the
concentrations of nano-ZnO predicted for natural, agricultural, urban and sludge-treated soils are
predicted to be 0.2 µg/kg at the most.
Summary for nano-ZnO 3.4.6
The main findings in relation to the environmental risk assessment of nano-ZnO are summarised in
the box below.
Summary
Most of the nano-ZnO is transformed into other non-nanoparticle forms during
sewage treatment processes and is converted mainly to sulfides.
The freshwater concentrations are mostly in pg/L to the lower ng/L level while the
marine concentrations are a factor of 10 times lower and only reach pg/L levels.
Soils and sediments represent the final sink for nano-ZnO, however with very low
quantities of this ENM. For 2020, a few hundred ng/kg are expected in soils and the
same amount in µg/kg in sediments.
Emissions to and exposure via air are found to be insignificant.
The most important processes determining the environmental fate of nano-ZnO are
dissolution, aggregation/agglomeration, sedimentation and adsorption to NOM and
other surfaces.
Short term aquatic toxicity of nano-ZnO is documented for fish, daphnia and algae
and, additionally, chronic data are available for daphnia and algae. The effect levels
are in the mg/L or sub-mg/L range with the most sensitive endpoint being a NOEC of
0.125 mg/L for daphnia leading to a PNEC of 2.5 µg/L.
The risk quotient for STP effluent has been found to be close to zero due to a very low
PEC value while the max. PEC/PNEC for freshwater is 0.0052 thus indicating a very
low environmental risk of this ENM.
3.5 Risk assessment of nano-silver (nano-Ag)
Sources and releases 3.5.1
Nano-Ag has a range of applications, including as antimicrobial agents in textiles, cleaning agents,
paints, cosmetics and hygienic surfaces (e.g. kitchenware and med-tech). No actual use of nano-Ag
in production processes in Denmark was identified; therefore, the release comes entirely from the
use of products with nano-Ag as a component.
The annual use volume in Denmark of nano-Ag in different products and applications has been
modelled to be approx. 0.8 t/year (most probable value). Only about 5% of the total use volume is
estimated to be released to the environment on the nano-form. The rest is mostly released via PMC
before being captured by recycling, waste incineration and landfilling processes or is released to

40 Environmental assessment of nanomaterial use in Denmark
sewage and subsequently being transformed into non-nano forms (silver sulphide) in sewage
treatment plants.
Table 3-13 summarises the modelled concentrations (PEC) for the technical compartments of
relevance for nano-Ag. The results are presented as the most probable values and the 95%
probability range for the lower and upper environmental concentrations (PECs).
TABLE 3-13
PREDICTED CONCENTRATIONS FOR NANO-AG IN DIFFERENT TECHNICAL COMPARTMENTS. THE RESULTS ARE
SHOWN AS MOST PROBABLE VALUES AND 95% RANGES THAT ALSO ILLUSTRATE THE 95% PROBABILITY RANGE FOR
LOWER AND UPPER CONCENTRATION LIMITS.
Compartment (source) Concentrations
Unit Most probable value
95% range
Sewage treatment effluent ng/L 0.5 0.012 - 58.6
Sewage treatment sludge* µg/kg 82.1 4.2 - 254
Waste mass incinerated µg/kg 15.3 10.1 - 23.4
Bottom ash of waste incineration µg/kg 34.9 20.9 - 65.7
Fly ash of waste incineration µg/kg 174 103 - 327
Figure 3-4 below shows the relative distribution of the total amount released annually (as nano)
from the technosphere to the environment (5 % of <1 t/y i.e. <0.05 t/y) and the resulting
distribution of the amount in the receiving environmental compartments.
FIGURE 3-4
OVERVIEW OF THE MOST IMPORTANT NANO-AG SOURCES AND RECEIVERS. THE PERCENTAGES REFLECT THE
MOST PROBABLE VALUES.
WIP = WASTE INCINERATION PLANTS;
STP = SEWAGE TREATMENT PLANTS;
PMC = PRODUCTION, MANUFACTURING AND CONCUMPTION (DIRECT RELEASE WITHOUT PRIOR TREATMENT).

Environmental assessment of nanomaterial use in Denmark 41
Thus, three-quarters of all nano-Ag released to the environment come from the PMC compartment.
The remaining quarter of the nano-Ag passes the STP treatment mostly via STP overflow. Besides
untreated wastewater, such overflows are the most important sources of nanosilver in the aquatic
environment. The nearly equal and complete distribution among natural nano-Ag soils and waters
shows that there are also some product categories directly releasing some nano-Ag into soils (in
addition to STP sludge fertilization). This phenomenon may occur via paints degradation or air
transport, for example, and amount to about 3% of the total use fraction.
Important environmental fate processes 3.5.2
Nano-Ag is expected to be prone to a number of transformation processes upon release to the
environment. Of these the dominant ones are reduction/oxidation, dissolution and
aggregation/agglomeration. Silver salts are known to be unstable in the presence of light, but since
nano-Ag most commonly occurs as metallic silver the before mentioned transformation processes
are believed to be of higher importance than photochemical reactions.
Dissolution and subsequent speciation is of high importance for the fate and behaviour of nano-Ag
in the environment. Upon dissolution an interaction with the anions and other constituents of the
environmental media will occur. In surface waters this is dominated by silver chloride complexes
and precipitates, and also silver sulphides contribute significantly to the fate and behaviour of nano-
Ag. The silver sulphides are highly stable and results in significant changes in the fate and
behaviour of nano-Ag. The silver sulphides are usually considered as not bioavailable.
Interaction of nano-Ag to suspended solids in surface waters is expected and this along with
aggregation/agglomeration may result in a transfer to the sediments, where it may accumulated, be
transformed, or depending on physical, chemical, and biological conditions. As Ag NMs is an
inorganic material the process of biodegradation is considered not to be relevant, however if the
particles are coated with organic coatings like PVP or PEG a degradation of these may influence the
behaviour of the core nano-Ag significantly.
Environmental exposure 3.5.3
The modelling results show that generally freshwater PECs are expected to be practically zero as
almost all modelled values with high probabilities lie between zero and 30 pg/L. Given the current
estimated use quantities of nanosilver in Denmark, the model predicts that concentrations above 60
pg/L do not occur in freshwater. The estimated concentrations for the marine environment are all
within a much more narrow range and all inpg/L and lower levels.
These results indicate that the contribution of nano-Ag to the total silver contamination in Danish
surface water is marginally low at current use and release amounts. Consequently, the same low
contribution to the total silver contamination is seen for sediments that will contain only a few
µg/kg sediment of nano-Ag, even in 2020.
Regarding the soil concentrations, the concentrations of nano-Ag for non-fertilized soils show
annual concentration increases of a few ng/kg soil. The increases in sludge-treated soils are a bit
higher, with most probable values around 25 ng/kg soil and will lead to a maximum environmental
concentration of about 1 µg/kg soil in sewage-sludge fertilized areas in 2020.
Table 3-14 summarises the modelled concentrations (PEC) for the environmental compartments of
relevance for nano-Ag. The results are presented as the most probable values and the 95%
probability range for the lower and upper environmental concentrations (PECs). The figures for
soils and sediments represent the annual increase in concentrations, not the absolute values.

42 Environmental assessment of nanomaterial use in Denmark
TABLE 3-14
PREDICTED ENVIRONMENTAL CONCENTRATIONS (PEC) FOR NANO-AG IN DIFFERENT NATURAL COMPARTMENTS.
THE RESULTS ARE SHOWN AS MOST PROBABLE VALUES AND 95% PROBABILITY RANGES FOR LOWER AND UPPER
CONCENTRATION LIMITS.
FOR SOILS AND SEDIMENTS, THE FIGURE SHOWN IS THE ANNUAL INCREASE IN THE PECS.
Compartment (type) Unit PEC Most
probable value
95% PEC range
Surface water (freshwater) ng/L 0.015 ≈0 - 0.044
Surface water (marine water) ng/L 2.5E-04 ≈0 - 5.8E-04
Air ng/m3 0.8 ≈0 - 2.4
Sediments (freshwater) µg/kg/yr 0.046 ≈0 - 0.1
Sediments (marine water) µg/kg/yr 1.6 0.9 - 3.2
Soils (agricultural ) ng/kg/yr 3.7 2.0 - 9.3
Soils (natural) ng/kg/yr 6.1 3.5 - 12.5
Soils (urban) ng/kg/yr 25.7 3.0 - 81.6
Soils (STP sludge treated) ng/kg/yr 0.007 0.004 - 0.011
Table 3-15 shows the forecast concentrations for nano-Ag after an ENM deposition period in soils
beginning in 2000 and ending at the beginning of the years 2014 and 2020, respectively.
TABLE 3-15
PREDICTED ENVIRONMENTAL CONCENTRATIONS (PEC) FOR NANO-AG IN SEDIMENTS AND SOILS. THE RESULTS
ARE SHOWN AS MOST PROBABLE VALUES.
THE PEC VALUES FOR SOILS AND SEDIMENTS REFLECT THE CONCENTRATIONS OF NANO-SILVER RESULTING
FROM ACCUMULATION IN THE PERIOD 2000 UNTIL THE BEGINNING OF 2014 AND 2020, RESPECTIVELY.
Compartment (type)
Unit
Year
2014 2020
Sediments (freshwater) µg/kg 5.4 11.4
Sediments (marine water) µg/kg 0.3 0.6
Soils (agricultural ) ng/kg 10.3 21.4
Soils (natural) ng/kg 23.9 49.8
Soils (urban) ng/kg 39.9 83.2
Soils (STP sludge treated) ng/kg 167 350

Environmental assessment of nanomaterial use in Denmark 43
Environmental effects 3.5.4
For nano-Ag more than 260 articles on environmental effects were identified, however, many of the
identified articles did not meet basic quality or validity criteria for inclusion in the data set for
derivation of a PNEC value. No long term studies reporting chronic NOEC values were identified
through the literature search, however, a number of studies reported significant long term effects on
reproduction and or growth. Only two studies were found to be 'adequate for regulatory use' and
three studies were assessed as 'may be adequate for regulatory use'. The main reason for low
reliability of the remaining studies was the very limited characterisation of the inherent properties
of the studied nanomaterial.
In total, four studies were found adequate for risk assessment. In two of these, results from short-
term tests are reported i.e. effects on algal growth rates with EC50-values of 34 µg/L (72 hours) and
190 µg/L (96 hours). Along with the EC50 value, an EC10 value of 10 µg/L for the short-term chronic
study on algae was also reported. The same two studies also report on 48-hour acute effects on
daphnia with EC50 values of 1.2 and 40 µg/L for adults and 67 µg/L for neonates. In a mortality
study with fish, 48-hour LC50-values of 7,070 µg/L for and 7,200 µg/L were found for adults and
juveniles, respectively.
3.5.4.1 PNEC for nano-Ag
The literature review and following evaluation of studies according to regulatory adequacy revealed
that short-term data on each of the three base-set test organisms are available for nano-Ag, but also
that no long-term NOEC values could be found. Therefore, an assessment factor of 1,000 has to be
applied for PNEC estimation. The lowest effect value among the base-set test organisms was the
EC50-value for daphnia of 1.2 µg/L. However, also long-term data exist with EC10-30 values for the
daphnia of 1-50 µg/L. This, along with a reported EC10 value for algae of 10 µg/L, may be
considered to fulfil the requirement for two available chronic studies. However, since the EC50-
values of 1.2 µg/L still would be the lowest value in the data set, an assessment factor of 100 has to
be applied according to the REACH guidance.
Using this assessment factor with the lowest reported effect value result in a PNECfreshwater
value of 12 ng/L.
If the study used for the PNEC estimation should not be the defining study, an effect value one
order of magnitude higher would have been the defining value (40 µg/L for daphnia), resulting in a
PNEC of 40 ng/L. Further, if other chronic endpoints than the traditionally accepted ones are
included in the PNEC estimaton, the assessment factor could be set at 50. The use of such studies
for the risk assessment would result in a PNEC of 100 ng/L indicating that such effects are covered
by the proposed PNEC of 12 ng/L.
Not enough or no data were available to derive PNEC values for STPs, air, soil/terrestrial, sediment
or the marine environment.

44 Environmental assessment of nanomaterial use in Denmark
ENVIRONMENTAL RISK ASSESSMENT
Table 3-16 below shows the calculation of the aquatic risk quotient (= PEC/PNEC) for nano-Ag in the
effluent from sewage treatment plants (STPs) and in surface waters (freshwater and marine water) as
average concentrations, i.e. a regional scenario. A risk quotient (PEC/PNEC value) at or above 1
indicates a risk of effects on organisms in the environment (here the aquatic environment) while a
value below indicates that this risk by convention is considered acceptably low.
TABLE 3-16
PEC/PNEC ESTIMATION FOR NANO-AG IN STP EFFLUENT AND SURFACE WATERS (FRESH AND MARINE).
Compartment PEC
(ng/L)
PNEC
(ng/L)
PEC / PNEC
Mode 95% int. Mode 95% int.
STP effluent 0.5 0.012 – 58.6 12 0.042 Max. 4.88
Surface water, fresh 0.015 ≈0 – 0.044 12 0.001 Max. 0.004
Surface water, marine 2.5E-04 ≈0 – 5.8E-04 * * *
* Marine PNECs not possible to estimate due to lack of data. Extrapolation of data from freshwater organisms not
considered scientifically valid for ENMs due to significant differences in freshwater and marine bioavailability.
However, due to significant additional dilution marine PEC/PNECs will typically be lower than freshwater values.
The most probable PEC/PNEC value is considerably below 1 for undiluted STP effluent but close to
5 based on the max. PEC. The PEC is considerably below 1 for the two types of surface water (even
in the worst case) indicating a very low risk of toxic effects of nano-Ag in surface waters. A dilution
factor < 5 is required to fulfil the risk acceptance criterion (1) for the highest concentration
modelled for STP effluent (95% confidence interval). A dilution of this magnitude will normally be
possible to achieve within an acceptable mixing zone upon discharge to receiving fresh, surface
waters in Denmark and almost certainly upon discharge to marine waters.
Due to lack of ecotoxicological effect data for other environmental compartments than the aquatic,
it is not possible to make a quantitative risk assessment for e.g. the soil compartment. However, the
concentrations predicted for natural, agricultural and urban soils are very low and even sludge-
treated soils will contain less than 0.2 µg/kg.
It should, however, be kept in mind that though the release of and exposure to nano-Ag is currently
small, it still contributes to the total silver release and exposure in both the water and soil
environments. Knowing the high toxicity of silver in both dissolved and particulate forms, a full risk
assessment should comprise the total silver concentrations in such compartments, which may be
significantly higher than the ones modelled for nano-Ag.
It should also be noted that a continued discharge of nano-Ag will lead to annual increases in
sediment concentrations in the µg/kg range (see Table 3-14) leaving a potential for bioaccumulation
in sediment-living organisms and potentially further up in the food web. Taking the high toxicity of
nano-Ag into account the use and potential bioaccumulation of nano-Ag should be evaluated
continuously (see opinion by SCENIHR, 20148)
8 Extract of the SCENIHR opinion: “it is clear that Ag-NPs are taken up by organisms, translocated from the gut, in certain conditions, and also depurated, to a point. There are also indications that in certain conditions body burdens are larger following exposures to Ag-NPs, compared to the equivalent levels of dissolved silver. It must be stressed, however, that much work is still required in this area of research.”

Environmental assessment of nanomaterial use in Denmark 45
Summary for nano-Ag 3.5.5
The main findings in relation to the environmental risk assessment of nano-Ag are summarised in
the box below.
Summary
The model for nano-Ag shows a low environmental release that does not exceed the
ton/year level for waters or for soils in Denmark.
During sewage treatment, most of the nano-Ag is expected to be converted into silver
sulfide (Ag2S), which is much less toxic than silver in ionic or nanoparticulate forms.
All modelled concentrations for nano-Ag in freshwater and marine water are in the
pg/L range reaching values of almost zero. Furthermore, all estimated the soil
concentrations are very low.
Although the aquatic concentrations of nano-Ag are marginal, they do contribute to
the total silver exposure concentrations in waters and soils. However, current silver
concentrations are significantly higher than nano-Ag concentrations.
As found for all other nano-metals and nano-metal oxides in this study, the modelled
air concentrations of nano-Ag are insignificant.
The most important processes determining the environmental fate of nano-Ag are
redox processes and dissolution but also aggregation/agglomeration, sedimentation
and adsorption to NOM are relevant.
Valid short term aquatic toxicity data for nano-Ag exist for fish, daphnia and algae as
well as chronic data for daphnia and algae (valid with reservations). The most
sensitive acute endpoint is an EC50 for daphnia of 1.2 µg/L yielding a PNEC of 0.012
µg/L.
The risk quotient (PEC/PNEC) based on most probable exposure concentrations are
all considerably below the acceptability criterion (1), but the high end value (95%
conf. interval) for STP effluent results in a PEC/PNEC of almost 5 and, hence, a need
for a small dilution to meet the risk acceptability criterion.
The high toxicity of nano-Ag calls for attention even though current and near-future
estimates predicts no unacceptable risk for freshwater. Increases in use of nano-Ag as
well as potential bioaccumulation are factors that should be monitored as
precautionary actions.
3.6 Risk assessment of carbon nanotubes (CNT)
Sources and releases 3.6.1
The main applications of CNTs are as a composite and polymer additive and as a component of
batteries. End applications include flat panel displays, super composite fibres, conductive plastics,
field storage batteries, micro-electronics based on semiconductors and other conductive material.
No information on the use of CNTs in the Danish plastics industry has been obtained, but the
possibility that they are used cannot be excluded. It should be emphasized that carbon nanotubes
exist in multiple configurations, forms and sizes, but that for the purpose of this risk assessment the
CNTs has been considered as one group.
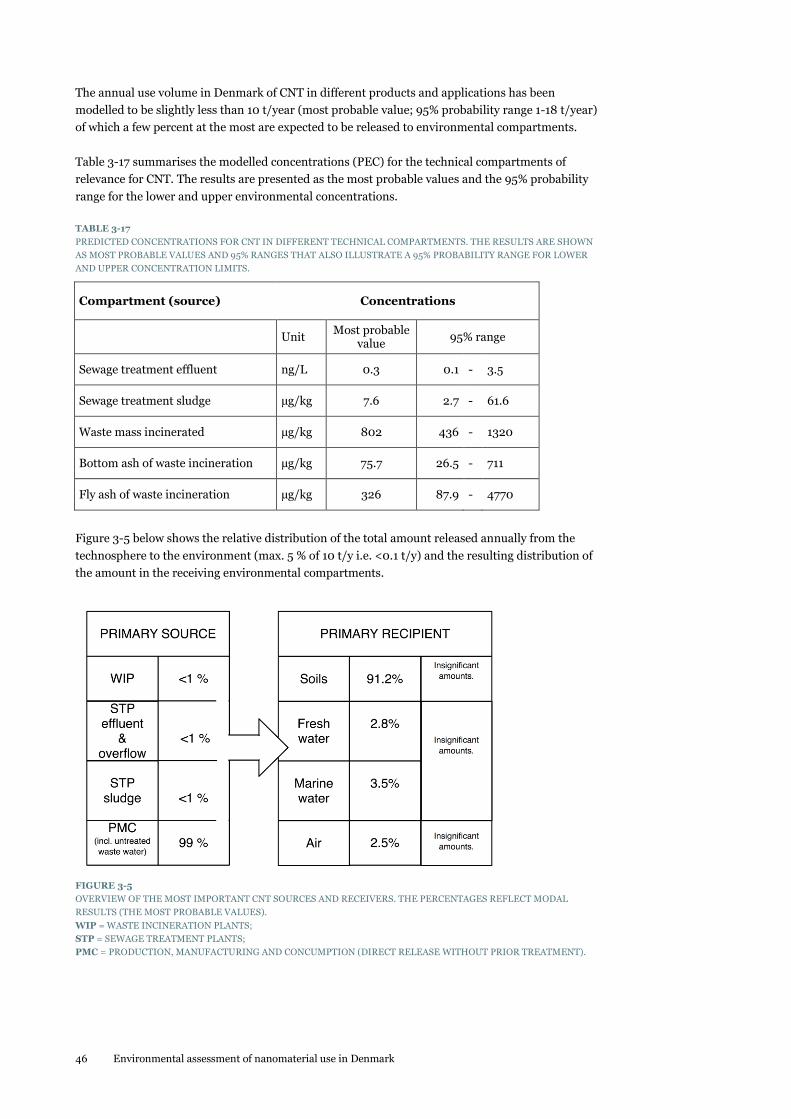
46 Environmental assessment of nanomaterial use in Denmark
The annual use volume in Denmark of CNT in different products and applications has been
modelled to be slightly less than 10 t/year (most probable value; 95% probability range 1-18 t/year)
of which a few percent at the most are expected to be released to environmental compartments.
Table 3-17 summarises the modelled concentrations (PEC) for the technical compartments of
relevance for CNT. The results are presented as the most probable values and the 95% probability
range for the lower and upper environmental concentrations.
TABLE 3-17
PREDICTED CONCENTRATIONS FOR CNT IN DIFFERENT TECHNICAL COMPARTMENTS. THE RESULTS ARE SHOWN
AS MOST PROBABLE VALUES AND 95% RANGES THAT ALSO ILLUSTRATE A 95% PROBABILITY RANGE FOR LOWER
AND UPPER CONCENTRATION LIMITS.
Compartment (source) Concentrations
Unit
Most probable value
95% range
Sewage treatment effluent ng/L 0.3 0.1 - 3.5
Sewage treatment sludge µg/kg 7.6 2.7 - 61.6
Waste mass incinerated µg/kg 802 436 - 1320
Bottom ash of waste incineration µg/kg 75.7 26.5 - 711
Fly ash of waste incineration µg/kg 326 87.9 - 4770
Figure 3-5 below shows the relative distribution of the total amount released annually from the
technosphere to the environment (max. 5 % of 10 t/y i.e. <0.1 t/y) and the resulting distribution of
the amount in the receiving environmental compartments.
FIGURE 3-5
OVERVIEW OF THE MOST IMPORTANT CNT SOURCES AND RECEIVERS. THE PERCENTAGES REFLECT MODAL
RESULTS (THE MOST PROBABLE VALUES).
WIP = WASTE INCINERATION PLANTS;
STP = SEWAGE TREATMENT PLANTS;
PMC = PRODUCTION, MANUFACTURING AND CONCUMPTION (DIRECT RELEASE WITHOUT PRIOR TREATMENT).

Environmental assessment of nanomaterial use in Denmark 47
The low CNT use volume and a high mass fraction (up to 90-95%) results in a kind of one-way
transport subsystem into recycling, waste incineration and landfilling processes. This leads to
marginal environmental exposure to this ENM for aquatic and terrestrial environments (5% at the
most). This environmental release almost exclusively occurs from direct nanoproduct use (99%).
This small material fraction reflects diffusive mass transport mostly into soils. The rest is equally
distributed to fresh and marine waters and air.
Important environmental fate processes 3.6.2
CNTs are capable of absorbing sunlight and photochemical surface modifications may also occur,
and photochemical transformation is considered to be of medium importance in fate modelling.
While pristine CNTs in general are more reactive than functionalized CNTs, their high
hydrophobicity makes them difficult to disperse in water and aggregation/agglomeration will be of
major importance when assessing their environmental fate. The agglomeration/aggregation is
influenced by pH and ionic strength of the surroundings and sedimentation is likely to occur.
The surface properties of CNTs can be greatly influenced by interaction with natural organic matter
and the formation of “natural coatings” may prolong the residence time of CNT in the water
column. CNTs are generally considered resilient to biotic degradation by microorganisms as a result
of their closed-cage structure but they may be transformed by abiotic processes. Biomodification is
likely to account only for a smaller part of the total transformation processes.
Environmental exposure 3.6.3
The estimated CNT concentrations in freshwater waters are all in the pg/L range freshwater; for
marine water, the model also revealed concentrations in fg/L levels. The sediment (fresh and
marine water) PECs are very low. Even by 2020, no more than a few µg/kg is expected in freshwater
sediments and for marine sediments it is predicted that the level will remain in the ng/kg range
until 2020 based on current CNT use amounts.
The forecasted concentration for urban soil for 2020 is in the range of a few hundred ng/kg soil.
The results for natural and agricultural areas are a bit lower due to varying soil depths and the
subsequent varying volumes for potential soil contamination. Soil fertilization with sludge has
negligible importance in this case, since it is estimated that almost no CNT ends up in such sludge.
Table 3-18 summarises the modelled concentrations (PEC) for the environmental compartments of
relevance for CNTs. The results are presented as the most probable values and the 95% probability
range for the lower and upper environmental concentrations (PECs). The figures for soils and
sediments represent the annual increase in concentrations, not the absolute values.
TABLE 3-18
PREDICTED ENVIRONMENTAL CONCENTRATIONS (PEC) FOR CNT IN DIFFERENT NATURAL COMPARTMENTS. THE
RESULTS ARE SHOWN AS MOST PROBABLE VALUES AND 95% PROBABILITY RANGES FOR LOWER AND UPPER
CONCENTRATION LIMITS. FOR SOILS AND SEDIMENTS, THE FIGURE IS THE ANNUAL INCREASE IN THE PECS.
Compartment (type) Unit PEC
Most probable value
95% PEC range
Surface water (freshwater) ng/L 0.001 1.8E-04 - 0.015
Surface water (marine water) ng/L 4.9E-05 2.2E-05 - 2.0E-04
Air ng/m3 0.042 0.022 - 0.091
Sediments (freshwater) µg/kg/yr 0.1 0.011 - 0.9
Sediments (marine water) µg/kg/yr 0.009 0.004 - 0.038

48 Environmental assessment of nanomaterial use in Denmark
Compartment (type) Unit PEC
Most probable value
95% PEC range
Soils (agricultural ) ng/kg/yr 5.3 2.8 - 11.5
Soils (natural) ng/kg/yr 12.7 6.3 - 33.1
Soils (urban) ng/kg/yr 20.6 11.0 - 44.8
Soils (STP sludge treated) ng/kg/yr 9.2 4.6 - 27.4
Table 3-19 shows the forecast concentrations for CNTs after an ENM deposition period in soils
beginning in 2000 and ending at the beginning of the years 2014 and 2020, respectively.
TABLE 3-19
PREDICTED ENVIRONMENTAL CONCENTRATIONS (PEC) FOR CNT IN SEDIMENTS AND SOILS. THE RESULTS ARE
SHOWN AS MOST PROBABLE VALUES.
THE PEC VALUES FOR SOILS AND SEDIMENTS REFLECT THE CONCENTRATIONS OF CNT RESULTING FROM
ACCUMULATION IN THE PERIOD 2000 UNTIL THE BEGINNING OF 2014 AND 2020, RESPECTIVELY.
Compartment (type)
Unit
Year
2014 2020
Sediments (freshwater) µg/kg 0.5 1.0
Sediments (marine water) µg/kg 0.1 0.1
Soils (agricultural ) µg/kg 34.5 72.0
Soils (natural) µg/kg 82.5 172
Soils (urban) µg/kg 134 279
Soils (STP sludge treated) µg/kg 59.8 125
Environmental effects 3.6.4
For CNT about 180 articles on environmental effects were identified but most of them did not meet
basic quality or validity criteria for inclusion in the data set for derivation of a PNEC value. A total
of 20 articles were found to report ecotoxicological information for CNTs and of these, 15 were
selected for further assessment due to their reporting of IC50, LC50, EC50, EC10 or NOEC data or
other relevant toxicological information. Ten studies were assessed as 'may be adequate for
regulatory use' while the remaining five studies were evaluated as 'not adequate for risk
assessment'. In most cases, the assessment of low adequacy was mainly due to the general lack of
material characterisation.
If one of the studies assessed as 'not adequate for risk assessment' is included, data for all three
trophic levels of the base-set organisms is available. However, no traditional 96-h LC50 on fish or
48-h LC50 on daphnia were reported, but a 96-h EC50 on growth inhibition on algae. The EC50
values reported were in the range of 1.8-63 mg/L. Two chronic studies on algae and daphnia
revealed a NOEC for the algae of 0.042 mg/L and a significantly reduced reproduction for the
daphnia at a concentration of 0.125 mg/L.

Environmental assessment of nanomaterial use in Denmark 49
3.6.4.1 PNEC for CNT
Provided that slightly non-standard exposure times are accepted in the data selections, and that the
fish study scored as 'not adequate for risk assessment' is accepted as well, data from short-term
tests are available for all three base-set test organisms. Furthermore, “a significant effect on
daphnia reproduction” is considered a chronic effect value, and therefore it can be argued that
chronic data for two trophic levels are available. This results in the use of an assessment factor of 50
for PNEC estimation. The reported growth inhibition NOEC value for C. vulgaris of 0.042 mg/L
constitutes the lowest of all reported effect values.
A PNECfreshwater value of 0.84 µg/L can therefore be derived for carbon nanotubes.
Not enough or no data were available to derive PNEC values for STPs, air, soil/terrestrial, sediment
or the marine environment.
Environmental risk assessment 3.6.5
Table 3-20 below shows the calculation of the aquatic risk quotient (= PEC/PNEC) for CNT in the
effluent from sewage treatment plants (STPs) and in surface waters (freshwater and marine water) as
average concentrations (i.e. a regional scenario). A risk quotient (PEC/PNEC value) at or above 1
indicates a risk of effects on organisms in the environment (here the aquatic environment) while a
value below indicates that this risk by convention is considered acceptably low.
TABLE 3-20
PEC/PNEC ESTIMATION FOR CNT IN STP EFFLUENT AND SURFACE WATERS (FRESH AND MARINE).
Compartment PEC
(ng/L)
PNEC
(ng/L)
PEC / PNEC
Mode 95% int. Most probable
value
Max.
(95% int.)
STP effluent 0.3 0.1 – 3.5 840 3.57E-04 Max. 4.17E-03
Surface water, fresh 1.0E-03 1.80E-04 –
0.015
840 1.19E-06 Max. 1.79E-05
Surface water, marine 4.90E-05 2.20E-05 -
2.00E-04
* * *
* Marine PNECs not possible to estimate due to lack of data. Extrapolation of data from freshwater organisms not
considered scientifically valid for ENMs due to significant differences in freshwater and marine bioavailability.
However, due to significant additional dilution marine PEC/PNECs will typically be lower than freshwater values.
The calculated PEC/PNEC value is more than a factor of 100 below 1 even for max. concentration in
undiluted STP effluent, and a factor of >10,000 below 1 for the two types of surface water indicating
a very low risk of toxic effects of CNT in surface waters. It is noted that the PNEC value was derived
on a quite weak data basis.
Due to lack of ecotoxicological effect data for other environmental compartments than the aquatic,
it is not possible to make a quantitative risk assessment for e.g. the soil compartment. However, the
concentrations predicted for all categories of soils are very low and only reach 0.13 µg/kg at the
most in any soil (most probable value for 2014).

50 Environmental assessment of nanomaterial use in Denmark
Summary for CNT 3.6.6
The main findings in relation to the environmental risk assessment of CNT are summarised in the
box below.
Summary
The estimated CNT use volume in Denmark is estimated to <10 tons/year of which
the most (95-99 %) ends up in technical compartments, such as waste mass and waste
incineration residues, recycling plants and landfills.
The estimated CNT concentrations in freshwater only reaches pg/L concentration
levels and even lower concentrations were estimated for freshwater and marine water.
Until 2020, no concentrations of more than a few µg/kg of CNT in freshwater
sediment are forecasted; the marine concentrations are expected to be a little lower.
STP sludge-treated soil is estimated to have negligible CNT concentrations, since
almost no CNT is expected to enter STP and thus end up in STP sludge.
Aggregation/agglomeration, sedimentation and adsorption to NOM and other
surfaces are found to be the most important processes determining the environmental
fate of CNT.
A fully valid aquatic toxicity data set is not available for CNT, however acute data
valid with reservations exist for fish, daphnia and algae as well as adequate chronic
data for daphnia and algae. The most sensitive endpoint was a chronic NOEC of 42
µg/L for algae which was used to derive a PNEC of 0.84 µg/L.
The aquatic risk quotients (PEC/PNEC) based on most probable exposure
concentrations are all a factor of >10,000 below the acceptability criterion (= 1) and,
hence, the risk of toxic effects of CNT in surface waters is considered to be negligible.
3.7 Risk assessment of nano-copper carbonate (nano-CuCO3)
The following risk assessment of nano-copper carbonate (nano-CuCO3) is partially made using
nano-copper oxide (nano-CuO) as a surrogate, mainly due to lack of environmental fate and effects
data for nano-CuCO3 but also because nano-CuO is seen as a possible substitute in the future for
some nano-CuCO3 applications.
Sources and releases 3.7.1
Three different applications of nano-copper have been considered. Of these, the use of micronized
particles of copper carbonate (CuCO3) for wood preservatives was considered to potentially account
for the major portion. Micronised CuCO3 is not intentionally a nanomaterial, but would probably
currently fall within the definition with the current particle size distribution. It is expected that in
the next few years, micronised CuCO3 may substitute for a significant part of the CuCO3 used for
wood treatment in Denmark today.
Copper carbonate is used for the production of pressure-impregnated wood in Denmark, and
micronised CuCO3 may already be present in imported treated wood. The current use volume is
estimated to be around 190 tons/year, composed of 90 tons used for wood impregnation in
Denmark and 100 tons imported with impregnated products.

Environmental assessment of nanomaterial use in Denmark 51
The use and release of CuCO3 was modelled for a future situation scenario where the micronized
CuCO3 has substituted the CuCO3 used today. Nano-CuO may be used as an alternative to CuCO3
for various applications discussed in the report, but no attempt was made to estimate the total
quantities in imported mixtures and articles. Copper oxides are widely used for antifouling paints,
and these paints may potentially become an application area for nano-CuO. Other known use areas
include solar cell technology, photovoltaic applications, gas sensors, combustion catalysts, ceramic
resistors and semiconductor applications.
Table 3-21 summarises the modelled concentrations (PEC) for the technical compartments of
relevance for nano-CuCO3. The results are presented as the most probable values and the 95%
probability range for the lower and upper environmental concentrations.
TABLE 3-21
PREDICTED CONCENTRATIONS FOR NANO-COPPER CARBONATE IN DIFFERENT TECHNICAL COMPARTMENTS.
THE RESULTS ARE SHOWN AS MOST PROBABLE VALUES AND 95% RANGES THAT ALSO ILLUSTRATE A 95%
PROBABILITY RANGES FOR LOWER AND UPPER CONCENTRATION LIMITS.
Compartment (source) Concentrations
Unit Most probable
value
95% range
Sewage treatment effluent µg/L 1.3 0.3 - 4.1
Sewage treatment sludge mg/kg 9.1 5.2 - 17.2
Waste mass incinerated mg/kg 2.0 1.3 - 3.0
Bottom ash of waste incineration mg/kg 4.4 2.7 - 8.5
Fly ash of waste incineration mg/kg 22.1 13.2 - 42.3
Figure 3-6 gives an overview of the most important sources and receiving compartments for nano-
CuCO3. The greatest portion of nano-copper environmental release (approx. 98% of theoretically
up to 190 t/y) covers direct discharge from the impregnated wood into soils. This occurs via
subsurface soil contact with such wood as well as via deposition of dust and wash-off from the
impregnated wood.

52 Environmental assessment of nanomaterial use in Denmark
FIGURE 3-6
OVERVIEW OF THE MOST IMPORTANT NANO-CUCO3 SOURCES AND RECEIVERS. THE PERCENTAGES REFLECT
MODAL RESULTS (THE MOST PROBABLE VALUES).
WIP = WASTE INCINERATION PLANTS;
STP = SEWAGE TREATMENT PLANTS;
PMC = PRODUCTION, MANUFACTURING AND CONCUMPTION (DIRECT RELEASE WITHOUT PRIOR TREATMENT).
The annual environmental release of nano-CuCO3 into the aquatic environment probably does not
exceed 1% of the total annual nano-CuCO3 mass transfer volume. A very large portion (approx.
70%) of the annual nano-CuCO3 mass ends up in technical treatment processes for nanomaterial-
containing products, such as recycling, waste incineration and landfilling while about 30% end up
in soils.
Important environmental fate processes 3.7.2
CuO is a metal oxide ENM with photo-catalytic properties. Binding of nano-CuO to dissolved
organic matter may be altered by photo-activation, as it is the case with nano-TiO2. However, the
importance of photochemical transformations as well as of redox reactions for fate assessment is
considered to be low.
Dissolution is known to be relevant for nano-CuO and therefore the processes of agglomeration and
aggregation will to some extent ‘compete’ with ENM dissolution. Also sorption/retention of nano-
CuO to soil is considered a relevant process. Dissolution will also influence the actual overall
relative importance of this process. As CuO is an inorganic material the process of biodegradation is
considered not to be relevant while biomodifications is not very well investigated but is assigned a
low-medium importance.
Environmental exposure 3.7.3
The results from the modelling of environmental exposure to nano-CuCO3 revealed concentrations
of a few ng/L for freshwater and values in pg/L levels for marine water. The annual increase in
freshwater sediment concentrations is about 140 µg/kg sediment while for marine water sediments
it is about 7 µg/kg. Such annual increases would lead to PEC values of around 2 mg/kg and 0.1
mg/kg for freshwater and marine water sediments in 2020.
The high exposure scenarios for 2020 showed values up to approximately 200 µg/kg of soil.
However, these high concentration values originate from the worst case exposure model, which
assumed a high micronized fraction of the total nano-CuCO3 used in wood impregnation.

Environmental assessment of nanomaterial use in Denmark 53
Table 3-22 summarises the modelled concentrations (PEC) for the environmental compartments of
relevance for nano-copper carbonate. The results are presented as the most probable values and the
95% probability range for the lower and upper environmental concentrations (PECs). The figures
for soils and sediments represent the annual increase in concentrations, not the absolute values.
TABLE 3-22
PREDICTED ENVIRONMENTAL CONCENTRATIONS (PEC) FOR NANO-CUCO3 IN DIFFERENT NATURAL
COMPARTMENTS. THE RESULTS ARE SHOWN AS MOST PROBABLE VALUES AND 95% PROBABILITY RANGES FOR
LOWER AND UPPER CONCENTRATION LIMITS.
FOR SOILS AND SEDIMENTS, THE FIGURE SHOWN IS THE ANNUAL INCREASE IN THE PECS.
Compartment (type) Unit PEC Most probable
value
95% PEC range
Surface water (freshwater) µg/L 0.002 1.2E-04
- 0.006
Surface water (marine water) µg/L 3.5E-05 2.0E-05
- 6.8E-05
Air µg/m3 2.1E-05 4.6E-06
- 3.9E-05
Sediments (freshwater) µg/kg/yr 136 6.7 - 322
Sediments (marine water) µg/kg/yr 6.5 3.8 - 12.8
Soils (agricultural ) µg/kg/yr 4.4 2.8 - 6.3
Soils (natural) µg/kg/yr 9.3 5.9 - 19.4
Soils (urban) µg/kg/yr 17.0 10.8 - 24.4
Soils (STP sludge treated) µg/kg/yr 7.4 5.0 - 10.7
Table 3-23 show the forecast concentrations for nano-CuCO3 after an ENM deposition period in
soils beginning in 2000 and ending at the beginning of the years 2014 and 2020, respectively.
TABLE 3-23
PREDICTED ENVIRONMENTAL CONCENTRATIONS (PEC) FOR NANO-CUCO3 IN SEDIMENTS AND SOILS. THE
RESULTS ARE SHOWN AS MOST PROBABLE VALUES.
THE PEC VALUES FOR SOILS AND SEDIMENTS REFLECT THE CONCENTRATIONS OF NANO-CUCO3 RESULTING FROM
ACCUMULATION IN THE PERIOD 2000 UNTIL THE BEGINNING OF 2014 AND 2020, RESPECTIVELY.
Compartment (type)
Unit
Year
2014 2020
Sediments (freshwater) µg/kg 884 1850
Sediments (marine water) µg/kg 42.2 88.0
Soils (agricultural ) µg/kg 28.4 59.3
Soils (natural) µg/kg 60.3 126
54 Environmental assessment of nanomaterial use in Denmark
Compartment (type)
Unit
Year
Soils (urban) µg/kg 110 230
Soils (STP sludge treated) µg/kg 48.0 100
Environmental effects 3.7.4
For nano-CuO about 50 articles on environmental effects were identified but most of them did not
meet basic quality or validity criteria for inclusion in the data set for derivation of a PNEC value. Of
the retrieved articles for nano-CuO, 16 reported IC/LC/EC50 or NOEC/LOEC/EC10 data of mainly
acute but also a few chronic effects, relevant for regulatory purposes. Only one study was found
adequate for regulatory use and nine studies were assessed as ‘may be adequate for regulatory use’.
The main reason that several of the studies have been assigned with lower adequacy was the lack of
stable and quantifiable exposure conditions.
Short-term ecotoxicity tests have been conducted for all three trophic levels of algae, daphnia and
fish. For algae, 72-h EC50 value of 150 mg/L for C. reinhardtii and a 96-h EC50 value of 0.54 mg/L
for P. subcapitata were found. For daphnia the 48-h LC50 ranged from 0.034-0.42 mg/L. 48-h and
120-h acute tests on the fish D. rerio (embryos, juveniles and adults) showed LC50 values in the
range 0.71-1.56 mg/L, with one study >10 mg/L.
Chronic NOEC values have been published for both algae and daphnia. A 72-h NOEC value of ≤100
mg/L was observed for C. reinhardtii , but no NOEC value was obtained for P. subcapitata, which
was found to be the more sensitive of the two, based on EC50 values. The one study found adequate
for regulatory use investigated long-term chronic effects on daphnia (D. magna) gave a NOEC value
of 0.06 mg/L (mortality and reproduction as endpoints).
In all of the reviewed studies where a metal salt (CuCl2 or CuSO4) has been included as a reference
for free ion toxicity, the metal salt showed higher toxicity than the CuO NP. In general, the toxicity
of Cu-compounds can be ranged in the following order: bulk CuO < CuO NP < Cu2+ based on the
results from the reviewed studies.
3.7.4.1 PNEC for nano-CuO
As data from short-term tests are available for all three base-set test organisms as well as some
chronic data, an assessment factor of less than 1,000 can be applied. At the short-term acute level,
the daphnia is the most sensitive organism. As chronic NOEC data have been derived for both the
daphnia and algae, an assessment factor of 50 can in principle be applied to derive the PNEC value.
The reported growth inhibition NOEC value for C. reinhardtii was ≤100 mg/L and the NOEC value
(mortality and reproduction) for D. magna was 0.06 mg/L. The lowest effect value in the data set
was, however, found for daphnia with a 48-h LC50 of 0.034 mg/L. Since this is a result from a short-
term acute test, an assessment factor of 100 has to be applied according to the REACH guidance.
A PNECfreshwater value of 0.34 µg/L can therefore be derived for nano-CuO.
Not enough or no adequate data were available to derive PNEC values for STPs, air, soil/terrestrial,
sediment or the marine environment.
Environmental risk assessment 3.7.5
Table 3-24 below shows the calculation of the aquatic risk quotient (= PEC/PNEC) for nano-CuO in
the effluent from sewage treatment plants (STPs) and in surface waters (freshwater and marine
water) as average concentrations (i.e. a regional scenario). A risk quotient (PEC/PNEC value) at or

Environmental assessment of nanomaterial use in Denmark 55
above 1 indicates a risk of effects on organisms in the environment (here the aquatic environment)
while a value below indicates that this risk by convention is considered acceptably low.
TABLE 3-24
PEC/PNEC ESTIMATION FOR NANO-CUO IN STP EFFLUENT AND SURFACE WATERS (FRESH AND
MARINE).
Compartment PEC
(µg/L)
PNEC
(µg/L)
PEC / PNEC
Mode 95% int. Most
probable
value
Max.
(95% int.)
STP effluent 1.3 0.3 – 4.1 0.34 3.8 12.1
Surface water, fresh 0.002 1.2E-04 –
0.006
0.34 0.0059 0.018
Surface water, marine 3.5E-05 2.0E-05 –
6.8E-05
* * *
* Marine PNECs not possible to estimate due to lack of data. Extrapolation of data from freshwater organisms not
considered scientifically valid for ENMs due to significant differences in freshwater and marine bioavailability.
However, due to significant additional dilution marine PEC/PNECs will typically be lower than freshwater values.
The PEC/PNEC value for nano-CuO is significantly higher than 1 for undiluted STP effluent (max.
value approx. 12) but below 1 for surface waters (even as max. value) indicating a low risk of toxic
effects of nano-CuO in surface waters outside a limited mixing zone close to the discharge point for
STP effluents. A dilution of a factor of 3.8 for the most probable STP effluent concentration value,
and a factor 12 for the highest concentration modelled for STP effluent (95% confidence interval), is
required to fulfil the risk acceptance criterion (1). While a 3.8 times dilution is normally achievable,
a dilution of a factor of 12 will under some circumstances (summer minimum flow) be difficult to
meet in some streams, mainly in Eastern Denmark. Thus, a risk of toxic effects beyond a typical
mixing zone cannot be completely excluded.
Due to lack of ecotoxicological effect data for other environmental compartments than the aquatic,
it is not possible to make a quantitative risk assessment for e.g. the soil compartment. However, the
concentrations predicted for all categories of soils are low and no more than 0.11 µg/kg in any soil
based on most probable value.
It should, however, be kept in mind that nano-CuO contributes to the total release of and exposure
to copper in the water and soil environments and the high end nano-CuO concentration in STP
effluent is about at the same level as "ordinary" copper.
It should also be noted that a continued discharge of nano-CuO will lead to annual increases in
sediment concentrations in the µg/kg range (see Table 3-23). As described for nano-Ag there may
be a potential for bioaccumulation in sediment-living organisms and potentially further up in the
food web, though this has not be studied to the same extent as for nano-Ag. Considering the high
toxicity of nano-CuO the use and potential bioaccumulation of this ENM should be evaluated
continuously.
Summary for nano-copper carbonate/oxide 3.7.6
The main findings in relation to the environmental risk assessment of nano-copper carbonate/oxide
are summarised in the box below.

56 Environmental assessment of nanomaterial use in Denmark
Summary
The main environmental release (approx. 98%) of nano-copper carbonate occurs
directly from impregnated wood into soils.
However, the current use of CuCO3/CuO for wood impregnation and environmental
release amounts do not lead to significant exposure to nano-Cu in surface waters and
sediments. The predicted concentrations show some few ng/L levels in freshwater
and equivalent values for pg/L levels in marine water.
Significant future exposure of soils to nano-copper carbonate should be viewed as
possible. In 2020, the high exposure scenarios do not exclude values of up to approx.
200 µg/kg soil.
Aggregation/agglomeration and sedimentation are found to be the most important
processes determining the environmental fate of nano-CuCO3/CuO.
Valid aquatic toxicity data are available for nano-CuO covering acute data for fish,
daphnia and algae as well as chronic data for daphnia and algae. The most sensitive
endpoint was an acute LC50 for daphnids of 34 µg/L which was used to derive a
PNEC of 0.34 µg/L.
The risk quotients (PEC/PNEC) for nano-CuO in surface waters based on most
probable exposure concentrations are a factor of 50 or more below the acceptability
criterion (1) while in STP effluent the most probable PEC/PNEC is 3.8 and the high
end PEC/PNEC for nano-CuO is 12. Thus, some dilution is required to fulfil the
acceptability criterion near discharge points of STP effluents and this may in some
cases require a somewhat extended mixing zone to be established.
The high toxicity of nano-CuO calls for attention, and increases in use of nano-CuO as
well as potential bioaccumulation are factors that should be monitored continuously
to prevent effects in Danish surface water systems.
3.8 Risk assessment of nano-zero valent iron (nZVI)
Sources and releases 3.8.1
For nanosized zero-valent iron (nZVI), only a local soil remediation scenario has been considered.
A few medical applications have been reported but it is the application for in situ soil/groundwater
remediation that currently seems to be the only relevant use of nano-ZVI. Data from a well-
documented, large pilot study in Denmark have been used as basis for the exposure estimation.
The nano-ZVI application for soil remediation is by nature a local event because of the high
reactivity of nano-ZVI. Through oxidation, this iron reacts with its surroundings, such as air, soil
components, and water, and forms iron oxides or hydroxides. In remediation, electrons released
from these reactions allow the reduction of different organic and inorganic soil or groundwater
contaminants.
The use volume of nZVI in Denmark is highly uncertain and probably largely theoretical at present
(although some full scale tests have been made). For the exposure estimations in this study it was
assumed that the current uses of other iron products for soil/groundwater remediation are replaced
by nZVI and it was estimated that a volume of about 100 tons/year is required for this purpose.

Environmental assessment of nanomaterial use in Denmark 57
Important environmental fate processes 3.8.2
The use of nZVI in soil/groundwater remediation has created a great demand for information on
the environmental fate and behaviour of this ENM. Through oxidation nZVI reacts with air and
water and forms iron oxides and hydroxides. The release of electrons from this reaction is utilized in
remediation to reduce several types of contamination. As nZVI is engineered to undergo this
oxidation, redox processes and conditions are important parameters for fate modelling, as they
control the chemical composition of the particles.
Uncoated nZVI exhibits little to no mobility in groundwater or soil because of its rapid
agglomeration/aggregation and subsequent straining but coating can result in greater mobility. The
importance of agglomeration is considered as high whereas the importance of solubility is
considered to be low. Sorption of pollutants to nZVI is part of the remediation process and thus
sorption to other chemicals and surfaces is relevant for nZVI.
Environmental exposure 3.8.3
Several of the soil samples from the mentioned Danish pilot study showed total iron concentrations
between 0.95% and 3.98% according to soil weight. The samples tested for background iron
concentrations contained between 0.99% and 2.14% iron. A statistical evaluation did not reveal any
difference between the background and the sample mean results.
The pilot study went beyond the general analysis and included a mass spectrometry (MS) reading
collected for the target soil areas. In contrast to the total iron analysis, the background results of the
MS reading and the one of the soil fracture sample of MS readings differed significantly. An
estimation of the absolute concentration of nZVI in the injected slurry component showed a
concentration of 14.2 g nZVI/L slurry. This concentration is, however, considered an exposure
concentration that is unlikely to be reached ever for homogeneous distribution of nZVI in Danish
soil or groundwater aquifers.
If the estimated (potential) use volume of around 100 t/y were to be distributed (and not degraded
after such distribution) into the total soil volume by an average annual concentration, an increase of
20 micro/kg would be modelled. In 2020, average nano-ZVI soil concentrations of 270 μg/kg soil
would be reached based on the same increase model used in the other ENM cases. If this worst-case
nZVI scenario of 270 μg/kg is compared to the total (natural) iron content in soil it is evident that
on a mass basis this hypothetical highest possible nZVI concentration is insignificant compared to
the naturally occurring iron content in Danish soils.
In summary, even hypothetical worst-case nZVI scenarios of some hundred μg/kg soil do not
represent a significant amount when compared to the natural concentrations of 20 g/kg to 40 g/kg.
In order to get a significant exposure, the nZVI in slurry should be directly converted into soil
concentrations, which currently seems unrealistic.
Environmental effects 3.8.4
Out of 44 hits in the literature search using "iron" and "nano" as a search terms, 7 studies were with
nZVI as a test compound. Out of the seven studies with nZVI , only two studies were reporting EC50
or LOEC-values. Additionally, six studies with other iron-based nanomaterials as test compounds
were reporting IC50, LC50, EC50 or NOEC/LOEC, and these are also included in the assessment in
order to increase the amount of data to support the PNEC estimations. Two studies were found
'adequate for regulatory use' and three studies were assessed as ‘may be adequate for regulatory
use’. The main reason for a lower reliability score is the lack of verification of exposure and
exposure conditions during the tests and lack of appropriate controls.
Varying types of short-term ecotoxicity tests have been carried out for all three trophic levels of
algae, daphnia and fish. Chronic LOEC values have also been obtained for algae. One study
58 Environmental assessment of nanomaterial use in Denmark
investigated the toxicity of zero-valent iron nanoparticles against several aquatic organisms (algae,
daphnia, fish, bacteria and plants). nZVI was found to be harmful to cyanobacteria (EC50 = 50
mg/L). The toxicity of nZVI towards the tested organisms was in the following order: cyanobacteria
> aquatic plant > algae > daphnia > fish > terrestrial plant. Besides the EC50 values for
cyanobacteria, no EC50 values were provided for other organisms, but it was mentioned that EC50 is
> 1,000 mg/L and > 2,500 mg/L for daphnia and fish, respectively.
96-h toxicity tests with different marine and freshwater microalgae and freshwater crustacean (D.
magna) was investigated in another study and resulted in a growth LOEC for P. subcapitata of 8.24
mg/L. The LOEC values towards the marine organisms were much lower, ranging from 0.42-3.1
mg/L. For D. magna, the survival LOEC was 0.5 mg/L.
3.8.4.1 PNEC for nZVI
Before PNEC estimation is carried out, it is important to realize that nZVI will react immediately
after application and will under aerobic conditions change physical and chemical form to larger
than nano-sized particles consisting of iron-oxides. Therefore, a traditional PNEC for the aquatic
environment (based on tests carried out under aerobic conditions) is more or less meaningless and
it may be more sensible to apply the principles for deriving an intermittent PNEC, where an
assessment factor of 100 is applied to the lowest acute EC50 value (ECHA, 2008).
Provided that the present data are treated as traditional effect data, the lowest acute effect data is a
96-h daphnia survival test resulting in a LOEC of 0.5 mg/L.
A PNECfreshwater, intermittent value of 5 µg/L can therefore be derived for nano zero valent iron on
an intermittent basis.
Not enough or no adequate data were available to derive PNEC values for STP, air, soil/terrestrial,
sediment or the marine environment.
Environmental risk assessment 3.8.5
nZVI differs from all the other nanomaterials assessed in this study, above all with regard to its use
and type of release to the environment. The currently only significant use of nZVI is for remediation
of soil and groundwater pollution by direct injection into the polluted subsurface soil/groundwater.
Here the material reacts rapidly with substances and surfaces in its surroundings and hereby loses
its original character by transformation into less reactive iron species and sorption to surfaces.
Hence, it is considered unlikely that nZVI should be dispersed in the environment outside a narrow
zone around the application point and, consequently, the environmental risk associated with the
current use of this ENM is considered to be low and very local.
Consequently, no modelling of exposure of surface waters has been attempted and no PEC/PNEC
values calculated.

Environmental assessment of nanomaterial use in Denmark 59
Summary for nZVI 3.8.6
The main findings in relation to the environmental risk assessment of nZVI are summarised in the
box below.
Summary
The use of nano zero-valent iron (nano-ZVI) in soil and groundwater remediation has
led to a need for information on the environmental fate and behaviour of such iron.
Due to the intended use of these nanoparticles, they will be discharged to the natural
environment, where some reactivity is expected.
The nano-ZVI-based remediation is a local event since it is driven by high and rapid
reactivity of the nano-ZVI. For more about such reactivity and transformations, see
the details in NanoDEN Report 1.
Even hypothetical worst-case nano-ZVI scenarios of some hundred μg/kg in soil do
not represent a significant amount when compared to the natural concentrations of
g/kg soil concentrations.
The most important processes determining the environmental fate of nZVI are redox
processes, aggregation/agglomeration, sedimentation and sorption to surfaces.
Acute aquatic toxicity data for nZVI include fish, daphnia and algae. As nZVI reacts
very rapidly it was only considered relevant to determine a short term PNEC. The
most sensitive endpoint was a 96 h LOEC = 500 µg/L for daphnia, which was used to
derive a short term (intermittent) PNEC of 5 µg/L.
The potential environmental risk related to the use of nZVI is very different from all
the other ENMs studied as nZVI is injected directly into subsurface soils and
groundwater. As nZVI reacts rapidly upon injection, the material is unlikely to be
dispersed in the environment outside a narrow zone around the application point.
Hence, the environmental risk is considered to be low and very local.
3.9 Risk assessment of nano-cerium dioxide (nano-CeO2)
Sources and releases 3.9.1
Data on the use of nano-CeO2 were derived from a survey of the use of nanomaterials in the EU. The
main uses in the EU were estimated to be diesel fuel additives, automotive catalyst converters, glass
polishing, paint and coatings. For each of these applications, transfer coefficients were estimated.
The use of nano-CeO2 as a UV filter in wood oil manufactured in Denmark was confirmed.
The modelled nano-CeO2 Danish use volumes were relatively low with modelled most probable
values of around 3-5 tons/year with a release fraction to the environment of less than 10%.
Table 3-25 summarises the modelled concentrations in the technical compartments relevant for
nano-CeO2. The results are presented as the most probable values and the 95% probability range for
the lower and upper environmental concentrations.
TABLE 3-25
PREDICTED CONCENTRATIONS FOR NANO-CEO2 IN DIFFERENT TECHNICAL COMPARTMENTS. THE RESULTS ARE
SHOWN AS MOST PROBABLE VALUES AND 95% RANGES THAT ALSO ILLUSTRATE A 95% PROBABILITY RANGES FOR
LOWER AND UPPER CONCENTRATION LIMITS.

60 Environmental assessment of nanomaterial use in Denmark
Compartment (source) Concentrations
Unit
Most probable value
95% range
Sewage treatment effluent ng/L 9.3 1.1 - 59.6
Sewage treatment sludge µg/kg 352 44.1 - 2310
Waste mass incinerated µg/kg 179 21.0 - 931
Bottom ash of waste incineration µg/kg 359 49.7 - 2460
Fly ash of waste incineration µg/kg 2200 243 - 12300
Figure 3-7 below shows the relative distribution of the total amount released annually from the
technosphere to the environment (max. 10 % of 3-5 t/y i.e. <0.5 t/y) and the resulting distribution
of the amount in the receiving environmental compartments.
FIGURE 3-7
OVERVIEW OF THE MOST IMPORTANT NANO-CEO2 SOURCES AND RECEIVERS. THE PERCENTAGES REFLECT THE
MOST PROBABLE VALUES.
WIP = WASTE INCINERATION PLANTS;
STP = SEWAGE TREATMENT PLANTS;
PMC = PRODUCTION, MANUFACTURING AND CONCUMPTION (DIRECT RELEASE WITHOUT PRIOR TREATMENT).
As can be seen from the table, up to approx. 10% of the total mass is released to the environment,
hereof most (approx. 84%) released directly from PMC. This can be explained by the character of
main the nano-CeO2 applications (use as fuel additives/fuel-borne catalysts or for glass polishing).
The use in paints and coatings and probably in some cosmetics and medicinal products (though not
quantified due to missing data) also leads to some fractions released to STPs.

Environmental assessment of nanomaterial use in Denmark 61
Important environmental fate processes 3.9.2Nano-CeO2 is a metal oxide ENM with photo-catalytic properties. Although the activity of CeO2 is
lower than that of TiO2, photochemical reaction may also be a relevant process for nano-CeO2.
CeO2 is an inert material and not likely to dissolve to any relevant extend under normal conditions.
Therefore, the importance of redox reactions and of dissolution for environmental fate and
behaviour or nano-CeO2 is considered to be low.
It has been found that CeO2 NPs aggregate in soil and are retained in the soil column and the
importance of sorption and retention for CeO2 is therefore evaluated to be relatively high.
As CeO2 is an inorganic material the process of biodegradation is considered not to be relevant and,
compared to other transformation processes, also biomodification (of the uncoated form) is likely to
account only for a smaller part of the total transformations.
Environmental exposure 3.9.3
The current releases of nano-CeO2 to the Danish environment appear to be small, not exceeding 0.5
ton per year. The environmental exposure mostly occurred via STP sludge fertilisation of soils and
some air emissions.
The modelled freshwater and marine water concentrations of nano-CeO2 were at pg/L levels (some
fg/L scenarios were also modelled) while sediment concentrations only reached a few µg nano-CeO2
per kg sediment (freshwater) until 2020. The ones for marine water sediments only reach µg/kg
levels in a few scenarios.
In 2020, non-STP-sludge-fertilised soil concentrations of about a few hundred ng/kg are expected,
while they will be a few µg/kg for STP-sludge-treated soils.
Table 3-26 summarises the modelled concentrations (PEC) for the environmental compartments of
relevance for nano-CeO2. The results are presented as the most probable values and the 95%
probability range for the lower and upper environmental concentrations (PECs). The figures for
soils and sediments represent the annual increase in concentrations, not the absolute values.
TABLE 3-26
PREDICTED ENVIRONMENTAL CONCENTRATIONS (PEC) FOR NANO-CEO2 IN DIFFERENT NATURAL
COMPARTMENTS. THE RESULTS ARE SHOWN AS MOST PROBABLE VALUES AND 95% PROBABILITY RANGES FOR
LOWER AND UPPER CONCENTRATION LIMITS.
FOR SOILS AND SEDIMENTS, THE FIGURE SHOWN IS THE ANNUAL INCREASE IN THE PECS.
Compartment (type) Unit PEC Most probable
value
95% PEC range
Surface water (freshwater) ng/L 0.004 5.8E-04
- 0.1
Surface water (marine water) ng/L 2.6E-04 3.2E-05
- 0.002
Air ng/m3 0.1 0.010 - 0.6
Sediments (freshwater) µg/kg/yr 0.2 0.033 - 6.9
Sediments (marine water) µg/kg/yr 0.049 0.006 - 0.3
Soils (agricultural ) ng/kg/yr 11.7 1.5 - 81.6

62 Environmental assessment of nanomaterial use in Denmark
Soils (natural) ng/kg/yr 26.9 3.7 - 224
Soils (urban) ng/kg/yr 45.6 6.0 - 316
Soils (STP sludge treated) ng/kg/yr 232 14.5 - 781
Table 3-27 show the forecast concentrations for nano-CeO2 after an ENM deposition period in soils
beginning in 2000 and ending at the beginning of the years 2014 and 2020, respectively.
TABLE 3-27
PREDICTED ENVIRONMENTAL CONCENTRATIONS (PEC) FOR NANO-CEO2 IN SEDIMENTS AND SOILS. THE RESULTS
ARE SHOWN AS MOST PROBABLE VALUES.
THE PEC VALUES FOR SOILS AND SEDIMENTS REFLECT THE CONCENTRATIONS OF NANO-CEO2 RESULTING FROM
ACCUMULATION IN THE PERIOD 2000 UNTIL THE BEGINNING OF 2014 AND 2020, RESPECTIVELY.
Compartment (type)
Unit
Year
2014 2020
Sediments (freshwater) µg/kg 1.6 3.3
Sediments (marine water) µg/kg 0.3 0.7
Soils (agricultural ) ng/kg 76.3 159
Soils (natural) ng/kg 175 364
Soils (urban) ng/kg 296 619
Soils (STP sludge treated) ng/kg 1510 3140
Environmental effects 3.9.4
Of the 19 hits in the literature search, 16 studies on nano-CeO2 have reported IC50, LC50, EC50 or
NOEC/LOEC data or other toxicological information. Two studies were found 'adequate for
regulatory use' while eight were assessed as ‘may be adequate for regulatory use'. In most cases, the
lower adequacy of some studies was due to the lack of verification of exposure and exposure
conditions during the tests.
Short-term ecotoxicity tests have been carried out for all three trophic levels of algae, daphnia and
fish. The resulting toxicity values are, however, very scattered. One study investigated the toxicity of
nano-CeO2 to zebrafish embryos and found a LC50-value of > 2,000 mg/L, which corresponds with
the results from another study, where an EC50 value of > 200 mg/L (i.e. the highest test
concentration) for the same test species .
One of the 'adequate' studies carried out acute and chronic exposures of D. magna, and found no
acute toxicity of nano-CeO2 up to the highest test concentration (10 mg/L). Up until 10 mg/L no
chronic toxicity was observed either, however, 100% mortality was found in the 10 mg/L test
concentration after 7 days exposure. However, the results from another study suggests high
variation in intraspecies sensitivity and indicates that D. magna may not be the most sensitive
species of crustaceans as an EC50-value of 0.26 mg/L was found for D. similis.
In six studies, the toxicity of micro-sized CeO2 was compared to that of nano-CeO2 and in all cases
nano-CeO2 was found to be more toxic that the micro-sized particles. The toxicity of nano-CeO2 to

Environmental assessment of nanomaterial use in Denmark 63
aquatic organisms is assumed to be due to direct physical interaction between the particles and the
organism, possible causing membrane disruption.
3.9.4.1 PNEC for nano-CeO2
As data from short-term tests are available for all three base-set test organisms as well as some
chronic data, an assessment factor of less than 1,000 can be applied. At the short-term level, the
daphnia is the most sensitive organism with an LC50 value of 0.26 mg/L. As chronic NOEC data
have been derived for both algae and daphnia, an assessment factor of 50 can be applied to derive
the PNEC value. The reported growth inhibition EC10 value for P. subcapitata was 0.7 mg/L and the
reproduction EC10 for D. magna was 8.8 mg/L. The EC10-values are used as surrogates for NOEC
values.
As the acute LC50 value for the most sensitive organism is lower than the short-term EC10 value for
the algae it is considered justifiable to use the acute LC50 value for daphnia of 0.26 mg/L, resulting
in a PNECfreshwater value of 5.2 µg/L for nano-CeO2.
An assessment factor of 50 was set, based on the availability of adequate data. However, if the study
used for the PNEC estimation should not be the defining study, the daphnia study would have to be
applied an assessment factor of 100 resulting in a PNEC value of 88 µg/L, i.e. 17 times higher.
Because of lack of relevant data it is not possible to derive PNEC values for STPs, air,
soil/terrestrial, sediment or the marine environment.
Environmental risk assessment 3.9.5
Table 3-28 below shows the calculation of the aquatic risk quotient (= PEC/PNEC) for nano-CeO2 in
the effluent from sewage treatment plants (STPs) and in surface waters (freshwater and marine
water) as average concentrations (i.e. a regional scenario). A risk quotient (PEC/PNEC value) at or
above 1 indicates a risk of effects on organisms in the environment (here the aquatic environment)
while a value below indicates that this risk by convention is considered acceptably low.
TABLE 3-28
PEC/PNEC ESTIMATION FOR NANO-CEO2 IN STP EFFLUENT AND SURFACE WATERS (FRESH AND MARINE).
Compartment PEC
(ng/L)
PNEC
(ng/L)
PEC / PNEC
Mode 95% int. Most probable
value
Max.
(95% int.)
STP effluent 9.3 1.1 – 59.6 5200 1.79E-03 Max. 1.15E-
02
Surface water, fresh 0.004 5.80E-04 – 0.1 5200 7.69E-07 Max. 1.92E-
05
Surface water, marine 2.60E-04 3.20E-05 –
0.002
* * *
* Marine PNECs not possible to estimate due to lack of data. Extrapolation of data from freshwater organisms not
considered scientifically valid for ENMs due to significant differences in freshwater and marine bioavailability.
However, due to significant additional dilution marine PEC/PNECs will typically be lower than freshwater values.
The PEC/PNEC value for nano-CeO2 is considerably below 1 even for undiluted STP effluent (most
probable value as well as max. for 95% interval) and way below 1 for the two types of surface water
indicating a very low risk of toxic effects of nano-CeO2 in surface waters.

64 Environmental assessment of nanomaterial use in Denmark
Due to lack of ecotoxicological effect data for other environmental compartments than the aquatic,
it is not possible to make a quantitative risk assessment for e.g. the soil compartment. However, the
concentrations predicted for all categories of soils are low with a maximum value 1.5 µg/kg in soil
amended with STP sludge (2014, based on most probable value).
Summary for nano-CeO2 3.9.6
The main findings in relation to the environmental risk assessment of nano-CeO2 are summarised
in the box below.
Summary
The Danish use volume of nano-CeO2 seems relatively low with a most probable value
of around 5 tons/year. The model shows a low annual load of cerium into the natural
environment, not exceeding 0.5 tons/year.
Most of the nano-CeO2 water and marine water concentrations are in pg/L
concentration levels; partially, some fg/L were also computed.
For non-STP sludge fertilized areas, the soil concentrations in 2020 are expected to
be at a few hundred ng/kg levels (most probable values). A few µg/kg are expected at
this time for STP sludge-treated areas.
Aggregation/agglomeration and sedimentation are found to be the most important
processes determining the environmental fate of nano-CeO2.
Valid aquatic toxicity data are available for nano-CeO2 covering acute data for fish,
daphnia and algae as well as chronic data for daphnia and algae. The endpoint used
for risk assessment was the acute EC50 for daphnia of 0.26 mg/L from which a PNEC
of 5.2 µg/L was derived.
The risk quotients (PEC/PNEC) for nano-CeO2 based on most probable exposure
concentrations are at least a factor of 500 below the critical level (PEC/PNEC = 1)
even in STP effluent (a factor of about 100 for the 95% interval maximum) while in
surface waters the PEC/PNEC is an additional factor of 1,000 lower indicating a very
low risk for effects of nano-CeO2 in the aquatic environment.
3.10 Risk assessment of quantum dots (QD)
Sources and releases 3.10.1
Data on quantum dots for this study were derived from a survey of the use of nanomaterials in the
EU. Quantum dots are semiconductor materials of metals such as Cd and Zn ranging from 2-10 nm
in diameter. Applications of quantum dots in products and commodities include semiconductors
transistors, solar cells, light-emitting devices (e.g. LEDs), diode lasers and medical imaging devices.
No information on the use of QDs for manufacturing in Denmark has been found, but such a use
cannot be excluded. The current Danish QD use volume is most likely well below 0.5 tons per year
and less than 1% of this volume is expected to be released to the environment.
Table 3-29 summarises the modelled concentrations for the technical compartments of relevance
for QDs. The results are presented as the most probable values and the 95% probability range for
the lower and upper concentrations.

Environmental assessment of nanomaterial use in Denmark 65
TABLE 3-29
PREDICTED CONCENTRATIONS FOR QUANTUM DOTS (QD) IN DIFFERENT TECHNICAL COMPARTMENTS. THE
RESULTS ARE SHOWN AS MOST PROBABLE VALUES AND 95% RANGES THAT ALSO ILLUSTRATE A 95% PROBABILITY
RANGES FOR LOWER AND UPPER CONCENTRATION LIMITS.
Compartments (sources) Concentrations
Unit
Most probable value
95% range
Sewage treatment effluent ng/L 3.0E-05 5.2E-06 - 0.001
Sewage treatment sludge µg/kg 2.4E-04 3.6E-05 - 0.003
Waste mass incinerated µg/kg 0.9 0.1 - 4.4
Bottom ash of waste incineration µg/kg 2.2 0.2 - 11.4
Fly ash of waste incineration µg/kg 10.3 1.0 - 56.7
The majority of the QD nanomaterial will end up in the waste management compartments or
recycling at the end of its life cycle and only about 1% goes into waste incineration or is deposited in
landfills. The remaining max. 10% of the negligibly small total mass (kg/year level) QD material is
distributed about equally to the different natural compartments. Due to the very low quantities, we
have not conducted a quantitative distinction between the aquatic, terrestrial, or air environments.
The currently more or less insignificant environmental release is a reflection of two main factors: 1)
the current low use volumes and 2) applications that do not lead to direct releases to the natural
environment.
The modelled STP effluent concentrations were almost completely in fg/L levels. Therefore, the
modelling was limited to this compartment and did not attempt to further quantify surface water
concentrations in much more diluted surface waters. The STP sludge concentrations showed values
ranging from 40 pg/kg to some ng/kg (95% value range).
Important environmental fate processes 3.10.2
Some QDs have a core-shell structure composed of a core and a shell of two different semiconductor
materials, where the shell semiconductor has a wider band gap compared to the core material.
Examples include CdS/ZnS, CdSe/ZnS and CdSe/CdS. These are high-efficient photoluminescence
materials and their photoluminescence properties can be modified by adjusting the shell thickness.
Due to their varying chemical compositions and the possibility of ‘tuning’ the specific properties of
QDs their ability to take part in environmental transformation processes cannot be generalised but
will depend on a case-by-case evaluation.
The processes of agglomeration/aggregation, sedimentation, and NOM adsorption are however
considered to be important processes for ENMs in general – and hence also for QDs. Similarly,
some sorption to other surfaces is likely to be relevant.
Environmental exposure 3.10.3
As stated above, the modelled PECs for water were so low that a realistic quantification and
evaluation of the probability distributions at fg/L and lower levels seemed meaningless and, hence,
we restrict ourselves to stating that, based on the current QD use volumes, the aquatic PEC values
are most likely negligible. In principle, similar findings apply to sediments as well; however, due to
a two-decade time period of marginal QD deposition, some values could be derived. After 20 years

66 Environmental assessment of nanomaterial use in Denmark
of sedimentation, about 3 µg/kg in freshwater sediments are predicted while marine water
sediments does not fully reach µg/kg concentrations in 2020.
Table 3-30 summarises the modelled concentrations (PEC) for the environmental compartments of
relevance for quantum dots.
TABLE 3-30
PREDICTED ENVIRONMENTAL CONCENTRATIONS (PEC) FOR QD IN DIFFERENT NATURAL COMPARTMENTS. THE
RESULTS ARE SHOWN AS MOST PROBABLE VALUES) AND 95% PROBABILITY RANGES FOR LOWER AND UPPER
CONCENTRATIONS (WHERE POSSIBLE).
Compartment (type) Unit PEC Most probable
value
95% PEC range
Surface water (freshwater) - Below fg/L nq*
Surface water (marine water) - Below fg/L nq
Air - nq nq
Sediments (freshwater) - fg/kg to some pg/kg
nq
Sediments (marine water) - fg/kg nq
Soils (agricultural ) - nq nq
Soils (natural) - nq nq
Soils (urban) - nq nq
Soils (STP sludge treated) pg/kg/yr 0.1 0.010 - 1.0
* nq = not quantified
Table 3-31 show the forecast concentrations for QD after a deposition period in soils beginning in
2000 and ending at the beginning of the years 2014 and 2020, respectively.
TABLE 3-31
PREDICTED ENVIRONMENTAL CONCENTRATIONS (PEC) FOR QD IN SEDIMENTS AND SOILS. THE RESULTS ARE
SHOWN AS MOST PROBABLE VALUES.
THE PEC VALUES FOR SOILS AND SEDIMENTS REFLECT THE CONCENTRATIONS OF QD RESULTING FROM
ACCUMULATION IN THE PERIOD 2000 UNTIL THE BEGINNING OF 2014 AND 2020, RESPECTIVELY.
Compartment (type)
Unit
Year
2014 2020
Sediments (freshwater) µg/kg 1.6 3.3
Sediments (marine water) µg/kg 0.3 0.7
Soils (agricultural ) ng/kg nq nq
Soils (natural) ng/kg nq nq

Environmental assessment of nanomaterial use in Denmark 67
Compartment (type)
Unit
Year
Soils (urban) ng/kg nq nq
Soils (STP sludge treated) ng/kg 4.5E-04 0.001
Environmental effects 3.10.4
Only 6 out of 65 articles on QDs were found to contain ecotoxicological information relevant for risk
assessment, five articles reported LC50 or EC50 values. Four studies were assessed as 'may be
adequate for regulatory use'.
For the freshwater compartment, a long-term EC50-value on the algae C. reinhardtii of 5 mg/L and
a significant effect from 0.1 mg/L towards stress response genes was found. Two other studies
reported effects from irradiation activation of different coatings of the Cd/Se-QDs on D. magna.
Except for the mercaptopropionic acid coating and white fluorescence irradiation giving an EC50-
value larger than 2.5 mg/L, all 48-h EC50 mortalities ranged from 0.01-0.4 mg/L, dependent on
coating and light conditions. Sub-lethal effects were reported down to 0.003 mg/L for significant
effects on mRNA.
Based on the MetPLATETM bioassay, measuring the β-galactosidase inhibition of E. coli in the
terrestrial compartment, up to 100 mg/L of the octadecylamine coated Cd/Se-QD nanomaterial
tested only exerted a 34% inhibition.
3.10.4.1 PNEC for QD
Given the very limited data set, the low diversity of organisms tested (two algae species, two
crustacean species, one nematode and a bacteria) and the regulatory adequacy of the studies, it is
not considered justifiable to apply the assessment factor approach for PNEC derivation. Hence, no
PNEC can be estimated for QD nanoparticles at the present state-of-knowledge.
Environmental risk assessment 3.10.5
Due to lack of reliable data it was not considered possible to derive a PNEC value for QD, which in
any case is not one, well-defined material but a type of materials with special properties that can be
based on a number of different metals/elements. However, the few existing data do not indicate high
acute aquatic toxicity of QD.
The use volumes of QDs are very low (< 1 ton/year) and the use pattern not likely to result in
significant environmental exposure (max. 10% is assessed to be released to the environment). Thus,
modelled STP effluent and surface water concentrations are at or below fg/L levels.
Consequently, with the current uses and use volumes of QD there are no indications that the use of
this ENM should be of significant environmental concern.
Summary for QD 3.10.6
The main findings in relation to the environmental risk assessment of QD are summarised in the
box below.

68 Environmental assessment of nanomaterial use in Denmark
Summary
The use volumes of QDs are most likely well below 0.5 tons/year levels.
About 90% of the total mass is assumed to be used for light emitting devices (e.g.
LEDs) that mostly end up in recycling processes at the end of their lifecycles. Only
max. 10% is assessed to be released to the environment.
The surface water and air concentration probability distributions were not quantified
and evaluated because all values were lower than fg/L (water) or fg/m3 (air).
The modelling results for STP sludge-fertilized soils in 2020 are even for high
exposure only at some pg/kg levels.
Aggregation/agglomeration and sedimentation are found to be the most important
processes determining the environmental fate of QD but also sorption to NOM and
other surfaces is relevant.
Only few reasonably adequate ecotoxicity data are available for QD. The ecotoxicity
studies do indicate some toxicity of QD but it was not considered justifiable to derive
a PNEC based on the available data.
Consequently, no risk quotients (PEC/PNEC) have been derived for QD but the
presumably moderate toxicity and low environmental exposure to this ENM do not
indicate that it should be of significant environmental concern.
3.11 Risk assessment of carbon black (CB)
Sources and releases 3.11.1
Carbon black (CB) is elemental carbon in the form of an extremely fine black powder, which is
widely used as a black pigment. The primary particles of CB meet the definition of nanomaterials.
During the production process, however, the primary particles form larger aggregates and later
agglomerates of 1–100 mm in diameter may be formed. Although the aggregation, which
spontaneously occurs in manufacturing processes, produces unbreakable aggregates of an average
size that is generally over 100 nm, CB can include a limited fraction of nanoscale materials. On a
global scale, 90% of CB is used in the rubber industry as a reinforcing filler in a variety of products,
with tyres as the major application area.
In Denmark, the use of CB as a black pigment in the manufacture of inks, paints, plastics, cosmetics
and textiles has been identified and the total volume in manufacturing processes in Denmark is
estimated to be 100-400 tons/year. The use volume of CB in Denmark is, however, assessed to be
considerably larger, approximately 36,000 tons per year (most probable value) of which around
10% is expected to be released to the environment.
Table 3-32 summarises the modelled concentrations for the technical compartments of relevance
for CB. The results are presented as the most probable values and the 95% probability range for the
lower and upper concentrations.
TABLE 3-32

Environmental assessment of nanomaterial use in Denmark 69
PREDICTED CONCENTRATIONS FOR CARBON BLACK IN DIFFERENT TECHNICAL COMPARTMENTS. THE RESULTS
ARE SHOWN AS MOST PROBABLE VALUES AND 95% RANGES THAT ALSO ILLUSTRATE A 95% PROBABILITY RANGES
FOR LOWER AND UPPER CONCENTRATIONS.
Compartments (sources) Concentrations
Unit Most probable value
95% range
Sewage treatment effluent µg/L 1241 292 - 3900
Sewage treatment sludge mg/kg 2455 582 - 7680
Waste mass incinerated mg/kg 1418 659 - 252o
Bottom ash of waste incineration
mg/kg 140 44 - 1310
Fly ash of waste incineration mg/kg 539 146 - 8630
Figure 3-8 below shows the relative distribution of the total amount released annually from the
technosphere to the environment (approx. 10 % of 36,000 t/y i.e. 3,600 t/y) and the resulting
distribution of the amount in the receiving environmental compartments.
FIGURE 3-8
OVERVIEW OF THE MOST IMPORTANT CARBON BLACK (CB) SOURCES AND RECEIVERS. THE PERCENTAGES
REFLECT MODAL RESULTS (THE MOST PROBABLE VALUES).
WIP = WASTE INCINERATION PLANTS;
STP = SEWAGE TREATMENT PLANTS;
PMC = PRODUCTION, MANUFACTURING AND CONCUMPTION (DIRECT RELEASE WITHOUT PRIOR TREATMENT).
Regarding the amounts of carbon black ending up in natural environments, we note that approx.
6-7% of the total annual mass reach surface waters and 3-4% find their way into soils. The aquatic
pathway is dominated by direct release into surface waters e.g. originating from road runoff (from
wear of car tyres) systems not connected to any water treatment. Release to soils occurs more or
less directly or via previous air transport and subsequent dry or wet (rain-based) deposition.

70 Environmental assessment of nanomaterial use in Denmark
Important environmental fate processes 3.11.2
CB has no functional groups and therefore it is insoluble in water and cannot be further degraded
by light or by photo-degradation in air or in surface water. Parameters like water solubility,
octanol/water partition coefficient, dissociation constant or adsorption/desorption cannot be
analytically measured. However, deposition in soil or sediments is considered to be most relevant
compartment for CB in the environment. This is likely to be due to aggregation/agglomeration
leading to sedimentation. Due to the high carbon content it is expected that CB will interact with
NOM and other organic compounds and have a high potential to adsorb to other surfaces.
As an inorganic compound with the chemical structure "C", carbon black will not be further
biodegraded by microorganisms OECD (2006). Potential biomodifications may include changes in
agglomeration state as a result of organism uptake but in our literature study no studies of
biomodification of CB were identified.
Environmental exposure 3.11.3
For CB the model reveals by far the highest water concentrations compared to all other
nanomaterials included in this study (assuming that all 36,000 tons are on nanoform, which may
not be the case in reality). In freshwater, values around 0.5 µg/L are predicted (most probable
value), in some high exposure scenarios up to 6 µg/L. The marine water loads show values ranging
from 15 to 80 ng/L. Consequently, the sediment loads are, according to high water exposure, also
higher than that of all other substances studied. In 2020, the modelled values are approx. 100-1000
mg/kg and 85 mg/kg for fresh and marine water sediments, respectively.
In STP-sludge-treated soils, the CB load has an expected value of 10 mg/kg in 2020. In non-
fertilized soils (agricultural, natural and urban soils) the modelled values are 1-5 mg/kg in 2020.
In line with the results presented above, the air concentrations in the model reveal the highest
values for CB among the ENMs studied in this report. Concentrations ranging from 100 to 300
ng/m3 are predicted (95% confidence range).
Table 3-33 summarises the modelled concentrations (PEC) for the environmental compartments of
relevance for CB. The results are presented as the most probable values and the 95% probability
range for the lower and upper environmental concentrations (PECs).
TABLE 3-33
PREDICTED ENVIRONMENTAL CONCENTRATIONS (PEC) FOR CB IN DIFFERENT NATURAL COMPARTMENTS. THE
RESULTS ARE SHOWN AS MOST PROBABLE VALUES AND 95% PROBABILITY RANGES FOR LOWER AND UPPER
CONCENTRATIONS.
FOR SOILS AND SEDIMENTS, THE FIGURE SHOWN IS THE ANNUAL INCREASE IN THE PECS.
Compartment (type) Unit PEC Most probable
value
95% PEC range
Surface water (freshwater) µg/L 0.5 0.1 - 6.0
Surface water (marine water) µg/L 0.034 0.015 - 0.080
Air µg/m3 0.2 0.1 - 0.3
Sediments (freshwater) mg/kg/yr 112 5.5 - 336
Sediments (marine water) mg/kg/yr 6.3 2.8 - 14.9

Environmental assessment of nanomaterial use in Denmark 71
Soils (agricultural ) mg/kg/yr 0.1 0.047 - 0.2
Soils (natural) mg/kg/yr 0.2 0.1 - 0.6
Soils (urban) mg/kg/yr 0.4 0.2 - 0.8
Soils (STP sludge treated) mg/kg/yr 0.8 0.2 - 2.6
Table 3-34 show the forecast concentrations for CNTs after an ENM deposition period in soils
beginning in 2000 and ending at the beginning of the years 2014 and 2020, respectively.
TABLE 3-34
PREDICTED ENVIRONMENTAL CONCENTRATIONS (PEC) FOR CB IN SEDIMENTS AND SOILS. THE RESULTS ARE
SHOWN AS MOST PROBABLE VALUES.
THE PEC VALUES FOR SOILS AND SEDIMENTS REFLECT THE CONCENTRATIONS OF CB RESULTING FROM
ACCUMULATION IN THE PERIOD 2000 UNTIL THE BEGINNING OF 2014 AND 2020, RESPECTIVELY.
Compartment (type)
Unit
Year
2014 2020
Sediments (freshwater) mg/kg 730 1520
Sediments (marine water) mg/kg 40.8 85.2
Soils (agricultural ) mg/kg 0.7 1.4
Soils (natural) mg/kg 1.5 3.2
Soils (urban) mg/kg 2.6 5.4
Soils (STP sludge treated) mg/kg 5.0 10.5
Environmental effects 3.11.4
Of the identified 14 articles for CB only 6 were found to contain relevant ecotoxicological
information. Only two articles have reported LC50 or EC50 values and three reported sub-lethal
effects, however, all of these studies were evaluated to be 'not adequate for regulatory use'. All
studies lacked nanomaterial characterization and exposure evaluation and this is the main reason
for the low regulatory reliability assessment.
One study investigated effects of CB with three different surfaces on larvae of a marine crustacean
(A. franciscana) and it was found that the commercially produced had the lowest LC50-value (370
mg/L), while the two surface modified particles were less toxic with LC50-values of 1000 and
>1000 mg/L, respectively. For the sub-lethal effects, both the commercial and the more
hydrophobic of the modified materials showed significant effects already at 50 mg/L, whereas the
less hydrophobic did not show significant effects.
3.11.4.1 PNEC for CB
Given the very limited data set and the diversity of organisms tested (one species of crustaceans,
molluscs, and insects) it is at present not possible to apply the assessment factor approach for PNEC
derivation. Thus, no PNEC can be estimated for CB nanoparticles at the present state-of-knowledge.

72 Environmental assessment of nanomaterial use in Denmark
Environmental risk assessment 3.11.5
Due to a limited data set with questionable validity it was not considered possible to derive a PNEC
value for CB. However, the few existing data do not indicate a high acute aquatic toxicity of CB.
On the other hand the use volume of CB in Denmark (and worldwide) is significant, estimated to be
approx. 36,000 tons/year (most probable value), which is by far the highest among the ENMs
studied, and the modelled most probable concentration in STP effluent is 1.2 mg/L leading to average
surface water concentrations (freshwater) of about 0.5 µg/L. The presently reported lowest sub-
lethal effects were at 50 mg/L corresponding to a factor of 100 between the effect level and the PEC
for STP. Thus, it can at present not be excluded that the risk quotient (PEC/PNEC) for STP effluent
could exceed 1. On the other hand, a very low risk for effects in freshwater is expected given the
currently available toxicity data (a factor of 100,000 is found between the effect level and PEC for
freshwater).
Current soil concentrations of approx. 1 mg/kg soil are presumably not an additional carbon mass
concentration that should be of concern. In 2020 up to 5 mg/kg soil can be expected and twice as
much in STP sludge-treated soils.
Summary for CB 3.11.6
The main findings in relation to the environmental risk assessment of carbon black are summarised
in the box below.
Summary
The modelled annual use volume for CB display kilo-tons values with a most probable
value of about 36,000 tons/year.
The model for CB shows for waters and soils an annual load into the environment
exceeding 1,000 tons/year levels. Most of the CB (approx. 90%) is, however, caught
by recycling and other waste mass treatment (landfilling and waste incineration).
The most probable freshwater concentrations are around 0.5 µg/L. The predicted
concentrations in marine waters are about ten times lower.
For terrestrial exposure significant contributions to the total carbon load are
predicted. Concentrations for 2020 of about 10 mg/kg (STP sludge-treated soils) and
1-5 mg/kg (other soils) cannot be excluded.
Among the ENMs in this study, the air concentrations for CB are the highest, ranging
from 100 to 300 ng/m3.
The reported exposure concentration for CB are to be considered as conservative
values since it has been neglected that CB may also be released partly as non-nano
particles.
For environmental fate assessment, aggregation/agglomeration, sedimentation and
adsorption to NOM and other surfaces are found to be the most important processes
for CB.
Only a very limited data set on environmental toxicity of CB is available and none of
the studies are considered adequate for regulatory use. The few existing studies
showed sub-lethal effects at 50 mg/L.
Environmental assessment of nanomaterial use in Denmark 73
No risk quotients (PEC/PNEC) have been derived for CB but due to the lack of
toxicity data and an estimated significant environmental release volume, it cannot be
excluded that some dilution of STP effluents are required to obtain a PEC/PNEC
value lower than 1.
3.12 RA summary
The risk quotients (RQ = PEC/PNEC values) calculated in this chapter for the selected
nanomaterials in STP effluents and fresh surface waters are summarized in Table 3-35 on the
following page.
In relation to the summary table, it should be noted that although some of the materials exist both
on the nano-form and as bulk/ionic materials (e.g. silver), the risk quotients only reflect the risk
associated with the release of the nano-form. Likewise, the risk quotients only reflect the risk posed
by the engineered nanomaterials although for some of the materials there may also be a
contribution from natural sources.
TABLE 3-35
SUMMARY OF RISK QUOTIENTS (PEC/PNEC VALUES) FOR THE SELECTED ENMS IN STP EFFLUENTS AND
IN THE FRESH SURFACE WATERS (REGIONAL VALUES).
ENM Compartment
PEC / PNEC
Most probable
value
Max value
(95% int.)
TiO2 (photostable) STP effluent 0.7 5.1
Surface water, fresh 0.0002 0.006
TiO2 (photocatalytic) STP effluent 0.09 0.79
Surface water, fresh 1.5 E-05 3.9 E-04
ZnO STP effluent ≈0 -#
Surface water, fresh 1.8E-04 0.0052
Ag STP effluent 0.042 4.88
Surface water, fresh 0.001 0.004
CNT STP effluent 3.57E-04 4.17E-03
Surface water, fresh 1.19E-06 1.79E-05
CuO STP effluent 3.8 12.1
Surface water, fresh 0.0059 0.018
nZVI STP effluent -## -##
Surface water, fresh -## -##
CeO2 STP effluent 1.79E-03 1.15E-02
Surface water, fresh 7.69E-07 1.92E-05
QD STP effluent -## -##
Surface water, fresh -## -##

74 Environmental assessment of nanomaterial use in Denmark
ENM Compartment
PEC / PNEC
Most probable
value
Max value
(95% int.)
CB STP effluent -* -*
Surface water, fresh -** -**
-: estimation of PEC/PNEC not possible
* possibly >1; **possibly <<1
# possibly <1; ## possibly <<1
NOTE: The PNEC estimations given throughout this report are based on the assumptions that
1) the current test methods are applicable to nanomaterials, and 2) that the current extrapolation
methodologies are valid for nanomaterials. Both of these assumptions are questionable (for a
further discussion of this see Lützhøft et al., 2015). The PNEC values given in this report should
therefore be taken as indicative for the order of magnitude for PNEC given the current regulatory
recommendations for the PNEC estimation methodology.
The table shows that the risk quotient (RQ) calculated for nano-CuO exceeds 1 in STP even for the
most probable value (RQ = 38) while for all the other ENMs the RQs based on the most probable
value is <1. The max. concentrations in STP effluent for photostable TiO2 and for nano-Ag also
leads to an RQ >1 for both (approx. 5). All other RQs are <1.
In surface waters (regional scenario) all RQ's are well below 1, most of them way below.
Based on the summary of PEC and PNEC values estimated in this chapter, the ENMs can tentatively
be placed some rough "risk categories" based on the current level of use in a way similar to what
could be done for chemicals:
(1) Critical ENMs: Those that have a high PEC as well as a low PNEC
(2) Potentially critical ENMs (if use/PEC increases significantly)
(3) ENMs unlikely to be critical as an ENM.
TABLE 3-36
ROUGH RISK CATEGORIES FOR SELECTED ENMS IN THE FREHWATER ENVIRONMENT.
PEC
Low High
PN
EC
Lo
w
Potentially critical ENMs*
Ag, CuO, CNT
Critical ENMs
None of the ENMs
included in NanoDEN
Hig
h
Unlikely to be critical ENMs
ZnO, nZVI**,
CeO2, QD
Potentially critical ENMs*
CB, TiO2
* If the consumption/release (PEC) increases significantly.
** Because the exposure is very local.

Environmental assessment of nanomaterial use in Denmark 75

76 Environmental assessment of nanomaterial use in Denmark
4. Nanomaterials in the environment – discussion of main findings
This chapter is dedicated to discussing central elements of the overarching question behind the
NanoDEN project– is there a reason for concern regarding nanomaterials in the Danish
environment? The chapter is divided into four main sections, all considered to be of high
importance for evaluating the possible concerns relating to nanomaterials in the environment:
Sources and releases to the environment
Environmental exposure
Environmental effects
Environmental risk assessment.
This chapter scrutinizes the central findings in the previous sub-projects, the outcome of the risk
assessment in the previous chapter as well as other concerns identified through the literature
reviews, the modelling, and the evaluations carried out in the NanoDEN project. The chapter aims
on this basis to evaluate the state of our knowledge, and the limitations herein, in relation to
potential concerns and risks related to nanomaterials in the Danish environment.
4.1 Sources and releases of ENMs
Nanomaterials are invented and produced because it has been realised that not only the chemical
composition of a material matters but also the size and other physical aspects play an important
role in defining a range of technologically interesting properties and possibilities that are new
compared to those know from traditional "macro"-materials and chemical compounds.
The functionalities characterising the materials selected for this study have a quite wide span, i.e.
they differ significantly between the individual materials, but together they represent typical types
of functionalities of many engineered nanomaterials. Examples of such functionalities are:
Absorption of UV irradiation ("UV filters") (e.g. photostable TiO2, ZnO, CEO2)
Antimicrobial/biocidal effect (e.g. Ag, CuO, photocatalytic TiO2)
Conducting/semi-conducting properties (CNT, QD, ZnO)
Chemical reactivity (nZVI)
Catalytic properties (CeO2, photocatalytic TiO2)
Pigment (CB, TiO2)
Mechanical strength (CNT).
These functional properties are interesting and useful in many types of applications and, hence,
ENMs (including those selected for this study) find their way into a wide range of uses and product
categories of which many are consumer products. Examples of product types where nanomaterials
are applied are: cosmetics (including sunscreens), paints, various other coatings including hygienic
surfaces, cleaning agents, textiles, plastic and rubber (additives), batteries, electronics, solar cells,
LED displays, wood impregnation, fuel additives, catalysts etc.).

Environmental assessment of nanomaterial use in Denmark 77
The basic nanomaterials and most of the mentioned product types with nanomaterials are not
manufactured in Denmark but are used in this country mainly as imported articles. With the
notable exception of carbon black (CB), having an estimated annual use volume of about 36,000
tons (if assuming that it all is on nano-form), the current use volumes of nanomaterials in Denmark
are presumably rather small and not exceeding 200 tons/year for any material. Photostable TiO2
and CuCO3 come close to 200 tons/year, while photocatalytic TiO2, ZnO and (potentially) nZVI are
in the range 10-100 tons/year and the annual consumption of the remaining materials is lower than
that (Ag and QD even lower than 1 ton/year). Some of the non-nano parallels to these materials
(e.g. TiO2, Zno and CuCO3) are used in much higher amounts in Denmark and worldwide. It should
be noted here that in general it has been difficult to obtain exact information on the use and release
of the studied ENMs in Denmark. This constitutes a serious limitation for the precision of the
modelling of the environmental concentrations and in most cases conservative (worst-case)
estimates had to be included.
Four main types of sources of ENM release to the environment are considered in this study:
Emissions from waste incineration plants
Effluents from sewage treatment plants and overflows of wastewater
Sludge from sewage treatment plants, and
Direct releases from production, manufacturing and consumption.
Waste/residuals in landfills or similar have in this study been considered to be sinks not leading to
environmental exposure although in Denmark reuse of a more open character of waste incineration
slags etc. take place (road fill etc.).
The extent of release to the environment differs significantly between the ENMs included in this
report, from 100% for nZVI (due to its use by injection directly into soil/groundwater), over
significant fractions (>25%) of environmental release for TiO2 and copper, to release fractions at or
lower than 10% for ZnO, silver, CNT, CeO2, QD and CB. As there appears to be only very limited
basic production or manufacturing of nano-containing materials in Denmark, most of the ENM
volumes released to the environment in this country are assessed to originate from the direct use
(consumption) of articles/materials coated with ENMs or with ENMs incorporated.
For more than half of the studied nanomaterials, a dominant part of the total environmental release
has been modelled to result directly from the use/consumption of the materials, i.e. without prior
elimination/retention in waste incineration plants (WIPs) or sewage treatment plants (STPs) or
because they are transformed into non-nano forms before release (e.g. in STP processes). This goes
for ZnO, silver, CNT, copper, nZVI, CeO2, and CB. For the two forms of TiO2, sludge from STPs is
the dominant release source while the release from the use of QDs is so small that quantification of
the distribution to source categories has not been attempted. Emissions to air are for all the studied
materials a release source of minor or negligible environmental significance.
Unfortunately, no quantifications exist for the relevant ENMs that relate the anthropogenic
nanomaterial (ENM) release to the amounts of the same nanomaterials already occurring in nature
such as e.g. organic carbon based particles and some inorganic oxides (Nowack & Bucheli, 2007).
The most prominent example of nanomaterial of natural origin presented by these authors are the
carbon based ones that have some biogenic, pyrogenic and geogenic or atmospheric sources. Farre
et al. 2010 state that the natural origin of such nanoparticles could be a significant one due to
relevant sources such as forest fires, volcanic eruptions as well as any kind of fires that also include
emissions via many industrial combustion processes.
A recent Danish review study of human exposure to nanomaterials via the environment (Larsen et
al., 2015) mainly focused on exposure to ultrafine particles (i.e. size <100 nm) in ambient air and
did not address specific nanomaterials (due to lack of data). The authors conclude that ultrafine

78 Environmental assessment of nanomaterial use in Denmark
particles are very unstable in air (agglomerate fast) and therefore the concentrations decline rapidly
with the distance from the sources (mainly ovens, traffic and other combustion sources). Carbon
based nanoparticles are the most important while it is highly uncertain how much inorganic
materials contribute.
4.2 Environmental exposure
With the exception of the special case of nZVI being injected directly into soil/groundwater, the two
main environmental compartments being exposed to ENMs are soils (highest concentrations
typically reached in those fertilized with STP sludge) and surface waters (exposed to STP effluents
or direct discharges of e.g. untreated road runoff). While release to air is of significant importance
for indoor environment and work-place exposure, the release of ENM to outdoor air is in all cases
found to be insignificant.
The concentrations of the ENMs in soil estimated for 2014 (i.e. accumulated from 2000 to 2014) are
generally at the sub-µg/kg or ng/kg level in agricultural, natural and even urban soils while for STP
sludge treated soils much higher levels are estimated for a few materials, i.e. photostable and
photocatalytic TiO2 (approx. 1.3 and 0.17 mg/kg, respectively) and CeO2 (1.5 µg/kg). Also for some
other materials the concentrations in sludge treated soils are higher but not exceeding 1 µg/kg.
In effluents from STPs only one of the studied ENMs is estimated by modelling to reach a level
above 1 mg/L, namely carbon black with 1.2 mg/L, while the second highest effluent concentration
is found for photostable TiO2 with 12.6 µg/L. Photo-catalytic TiO2 and CuCO3 are the only two other
ENMs reaching modelled levels above 1 µg/L in STP effluents (1.6 and 1.3 µg/L, respectively). All
other ENMs appear at ng/L level or even lower.
In surface waters after dilution none of the studied ENMs have been modelled to reach a
concentration of even 1 µg/L (CB highest with 0.5 µg/L) and mostly the concentrations are at the
low ng/L or even fg/L level.
A variety of chemical, physical and biological processes can affect the behaviour and fate of ENMs
on their pathway from the point of release to the end destination in an environmental
compartment. Some of the processes may transform the materials in a way that they no longer can
be regarded nano-particles and thereby the basis of the exposure scenarios can be completely
changed. Such, almost complete transformation has been demonstrated e.g. for nano-ZnO in STP
processes.
For most of the studied ENMs (and ENMs in general) the processes of aggregation and
agglomeration are considered the most important to understand and have data on when modelling
environmental fate. Also other processes affecting the size of the original nanomaterial such as
sedimentation and sorption to natural organic matter (NOM) or other surfaces/soil are important
in the understanding the environmental fate of most ENMs. The interaction with particles naturally
occurring in the environment is furthermore of great importance for the transport and fate of ENMs
in the environment. This process is strongly linked to agglomeration of particles of different origin,
a process referred to as hetero-agglomeration. An increase in particle size will generally result in
increased agglomeration and sedimentation in water and a higher retention of ENMs in soil,
independent of the chemical composition of the material. When functionalization of ENM occurs,
whether it is through natural compounds or chemically intended stabilizers, the surface charge of
that coating or stabilizer determines the interaction of the ENM with naturally occurring substances
and particles. In this respect the core composition of the ENM is of less importance. Under
environmentally more realistic conditions it is suggested that particle-to-particle agglomeration
(homo-agglomeration) plays a minor role and that the interaction with soil colloids (hetero-
agglomeration) will have the largest impact on the overall sorption behaviour of ENM. Thus soils

Environmental assessment of nanomaterial use in Denmark 79
with a higher fraction of natural colloids, e.g. soils with high content of clay, will generally show the
highest retention of ENMs. Even given the complexity of environmentally relevant soil matrices it
seems possible to describe a large part of retention and adsorption behaviour of ENM with currently
available models.
Furthermore, for some ENMs (e.g., Ag, ZnO and CuO) dissolution and chemical speciation is of
importance for their environmental fate. The process and kinetics of dissolution of ENMs in
environmental media is not yet fully understood, but is expected to be inversely correlated to the
size of the particles. In general, links between physico-chemical properties and environmental fate
and behaviour of ENMs are not yet established. This hampers the development of chemical fate
models like the ones that are currently in use in the safety assessment of chemicals (e.g. in the
EUSES models). The models for prediction of the environmental fate and behaviour of ENMs
depend on actual measured data on distribution and transformation in laboratory, pilot or field
scale experiments. Since each ENM may show a unique fate and behaviour pattern, this dependency
of experimental data constitutes a serious bottleneck for the development and implementation of
generic models for ENM exposure assessment.
Sampling and analytical-chemical determination constitutes another approach to obtaining
estimates of the environmental concentrations of ENMs. However, at present the analytical-
chemical possibilities for obtaining reliable concentrations of ENMs in complex environmental
samples are so limited that is not considered a feasible strategy to rely on environmental
monitoring. For several of the ENMs included in this report the natural background levels or
background levels originating from other uses of the materials in question (i.e., other forms than as
nanomaterials) will make a quantification of the added amount of ENM impossible.
Examples of this is the natural occurrence of iron in soils versus the addition of nZVI, or the
occurrence of larger TiO2 particles in wastewater due to its use as pigment in white paint versus the
nano-TiO2 from sun-screens. As pointed out in this report, carbon black constitutes a potential
problem due to the high loading predicted using conservative assumption in the modelling.
However, it is a significant analytical-chemical challenge to monitor and identify the contribution of
the nano-scale CB to the total organic carbon found in complex environmental samples.
It must be stated that the reliability of all predictive exposure and risk estimations directly depends
on the data used to feed the predictive algorithms. This applies also to our comprehensive studies
based on stochastic and probabilistic methods that aim at covering the whole possible spectrum of
risk events. Especially for such a full spectrum approach, a more precise overview on the future use
volumes and the life-cycle fate and environmental release of the ENMs when used in consumer
products and industrial processes would significantly improve the exposure assessment.
The identifications of the most important processes for each ENM have been used in the modelling
of environmental exposure as far as the data allowed it. To give an example, aggregation and
agglomeration with subsequent sedimentation of engineered nanomaterial in surface waters was
recognised in Sub-report 1 (Hartmann et al., 2014) as having high importance for the
environmental fate and exposure of the studied ENMs. This conclusion has fully been considered in
our exposure model but due to lack of quantitative data our model had to include probability
distributions for those factors that range from immediate and complete aggregation with
subsequent sedimentation to theoretical scenarios of no aggregation/sedimentation. On the other
hand, the full spectrum applied for aggregation etc. has allowed us to exclude that significant
exposure concentration events were not captured by our model. The stochastic approach does
therefore guarantee that based on the current knowledge all possible exposure/risk events have
been considered, it can however not replace not available precision in the environmental fate data
themselves.

80 Environmental assessment of nanomaterial use in Denmark
4.3 Environmental effects
The result of the literature review on ecotoxicity (the studies considered adequate for regulatory
use) showed effect concentrations in the range from about 1 µg/L to 900 µg/L for Ag and TiO2,
respectively. This data availability for each material was assessed and yielded PNEC values in the
range from 0.012 µg/L to 18 µg/L for the ENMs used as case materials in this study. Hence, the
PNEC values span more than three orders of magnitudes, depending on the ENM. This is not
surprising as the materials are very different in chemical composition. It should be noted that it was
not possible to identify any pattern in organism sensitivity across materials for the chronic studies
included for PNEC estimations.
The metal-containing ENMs may be grouped with respect to the order of magnitude of the
estimated PNEC values: For TiO2 and CeO2 the PNEC values were in the order of 10 µg/L, for ZnO
around 2 µg/L, and for Ag and CuO at a level of a 30 ng/L. Furthermore, the PNEC estimated for
CNTs was in the order of 1 µg/L. It is important to note that CNTs are truly novel materials that
exist only in a nano form and for which no comparable larger (or smaller) size analogues exist. The
PNEC values found in this study for nano-ZnO, nano-Ag and nano-CuO are lower than the PNEC
values for the bulk forms of the materials in the REACH registrations. Given the relatively low AF of
50 used for the PNEC estimations in this report, it does not seem to be the AF that is causing these
lower PNEC values for ENMs compared to other forms of the materials.
In comparison to PNEC values found in the open literature for the nano form a less clear picture
emerges. For Ag and ZnO the PNEC values found in the literature span several orders of magnitude.
For TiO2, CNTs and CeO2 the variation is much less. This reflects the availability of PNEC values
found in the literature, where only few studies have published PNEC values for the last mentioned
ENM but a range of studies have published PNEC values for the first mentioned ENM. Not
surprisingly, for Ag and ZnO the PNEC values derived in this report fit well within the large interval
published in the literature, but are in the lower end compared to literature values. For TiO2 the
PNEC values are within the same order of magnitude, but for CNTs and CeO2 the PNEC values
derived in this report are about 1-2 orders of magnitude lower than found in the literature.
While it is tempting to conclude that the lower PNEC values found for ENM in this report compared
to REACH registration is due to nano-specific effects, this is not supported by the findings of the
studies used to estimate the PNECs. Only in a few studies nano-specific effects were included and
found to be more sensitive endpoints compared to traditional endpoints for ecotoxicity tests.
The current regulatory paradigm is that in principle the existing risk assessment methodologies are
applicable to ENM. This means that, at present, no nano-specific arguments are included in the
estimation methods for PNEC estimation, i.e. that it is possible to extrapolate from effect
concentrations obtained in the laboratory to concentrations protective for the environment by
dividing with an assessment factor. It is, however important to note that the validity of the
fundamental assumption, i.e. that PNECs for ENMs can be estimated as though they were dissolved
chemicals, has not been evaluated. Given the range of nano-specific concerns discussed by Lützhøft
et al. (2015) it is at present not possible to claim that the use of the current approaches ensure that
organisms will be protected at concentrations below the derived PNEC. In other words, specific
circumstances related to ENMs, which differ from conventional chemicals, could likely affect the
validity of the approach for deriving PNEC in an unpredictable manner (Baun et al., 2009).
A number of transformation processes occurring during testing may furthermore influence the
effective concentrations experienced by the test organisms These are processes such as dissolution
and agglomeration that may change the properties (and concentrations) of the tested material
(Hartmann et al. 2014). These processes depend among other things on the ionic strength of the
testing medium, choice of medium constituents, time, presence of test organism (Hartmann et al.,
2014). While these processes are expected also to take place in the natural environment, they

Environmental assessment of nanomaterial use in Denmark 81
constitute a problem for the tests carried out as a part of a risk assessment as these tests are not
designed for particles and the processes related to particles may hamper interpretation of test
results and hence data reliability. It may be tempting to call for increasing the environmental
realism of standard tests; however, this will most likely be at the expense of reproducibility and
comparability violating the fundamental prerequisite of constant exposure during standard
ecotoxicity testing.
Five of the ENMs included in this report may be grouped into two groups related to which of the
transformation processes raises concerns with respect to the toxicity data used for PNEC
estimation:
For all ENMs aggregation and agglomeration is of very high importance, but especially for
TiO2 and CeO2 it is in practice difficult to maintain these particles in stable suspension.
Sedimentation of TiO2 and CeO2 ENMs are often reported, and there is a risk of biological
endpoints being influenced by this behaviour. This may lead to physical effects on test
organisms, e.g. entrapment of daphnids in larger agglomerates causing immobilization.
For the Ag, ZnO, and CuO ENMs the possible dissolution in the test medium and release of
ionic metal is often used to explain the observed toxicity. The dissolved metal ion is most
often found to be more toxic than the corresponding ENM, though exceptions have been
reported. It is not trivial to quantify this dissolution under actual test conditions, since the
dissolution depends on ENM properties like size, surface area and coating, as well as on
media composition (e.g. ionic strength and pH). Furthermore, the dissolution is time-
dependent and thus ongoing from preparation of stock suspensions and throughout the
test duration.
For the remaining four materials (CNT, nZVI, QD, CB) the evaluation of transformation processes
must rely on case-by-case evaluation.
Furthermore, the dose metric applied represents a challenge to the current procedures for PNEC
estimation. As mentioned in the Best Practice for REACH nano registrants (ECHA, 2014), a single
measure of mass is not adequate for quantifying the exposure of ENMs. Particle number or specific
surface area have been suggested as more appropriate dose-metrics (van Hoecke et al., 2008;
Arvidsson et al., 2011) ), but the number of studies that have applied these metrics is so far much
too few to draw any conclusions on whether these novel metrics represent better alternatives to
expressing the effective concentrations compared to the traditional mass-based concentrations.
On a final note, it must therefore be emphasized that PNEC estimations given throughout this
report are based on the assumptions that 1) the current test methods are applicable to
nanomaterials, and 2) that the current extrapolation methodologies are valid for nanomaterials.
Both of these assumptions are questionable (for a further discussion of this see Lützhøft et al.,
2015). The PNEC values given in this report should therefore be taken as indicative for the order of
magnitude for PNEC given the current regulatory recommendations for PNEC estimation.
4.4 Risk assessment of the ENMs
Environmental risk quotients in the form of PEC/PNEC values have been determined for the
aquatic environment for seven of the studied ENMs. Due to lack of reliable ecotoxicity data it was
not possible to determine a PNEC value for Quantum Dots (QD) and carbon black (CB) while for
nZVI such a calculation was found to be meaningless because of the high reactivity, and thereby
transformation, of this nanomaterial under the conditions of use.
The PEC/PNEC values for the average concentrations in surface waters (based on most probable
PECs) are all considerably below the critical value of 1, actually they range from about 1/1000

82 Environmental assessment of nanomaterial use in Denmark
hereof and downwards (with the exception of nano-CuO only being 20 times lower). The
PEC/PNECs for STP effluents are all well below 1, with the exception of photostable nano-TiO2 that
is only slightly below 1 and nano-CuO that is somewhat higher.
Thus, for nano-CuO a 3.8 times reduction of the most probable STP effluent value must be obtained
in the receiving water to give a risk quotient lower than 1. The PEC/PNECs for STP effluents
calculated for the max. concentration within the 95% confidence interval show that in the worst
case three of the ENMs (photostable TiO2, Ag, CuO) could require between 5 and 12 times
reductions in the risk quotients to achieve a value below 1 (factor 5 required for both photostable
TiO2 and Ag, and 12 for CuO).
Possibly, also CB could require a small reduction of the PEC/PNEC for STP effluents to meet the
acceptability criterion, however this is based on a very conservative assumption on the release of CB
(and fraction occurring on nano form) and, further, the reduction factor cannot be quantified due to
the lack of effect data for PNEC estimation. Since none of the ENMs are expected to undergo
biological degradation, it is important to emphasize that dilution in receiving surface waters
bringing down the risk quotient to an immediately acceptable level is not sufficient. The total load
to the environment has to be taken into account and the risk of (bio)accumulation of ENMs must be
evaluated further. The possible transfer of ENMs from the water phase to sediments through
processes of aggregation/agglomeration and sedimentation calls for special attention.
It should, however, also be mentioned that in general the basis for calculating the exposure (the
PECs) has been conservative. Due to lack of quantitative information on central fate processes such
as aggregation/agglomeration etc., it has been assumed that all the nanomaterial released would be
present in the environmental compartments on the nano form, i.e. no transformation into other,
non-nano forms. This has presumably lead to an overestimation of the exposure, which in some
cases could be significant.
For the soil environment, and for sediments, it has not been possible to derive risk quotients for any
of the ENMs studied. This is partly due to lack of experimental data on effects on soil/sediment-
dwelling organisms and partly because extrapolation from aquatic data is not considered possible
for ENMs at the current level of knowledge about the environmental fate processes that need to be
taken into account. It is, however, noted that the (conservatively) estimated concentrations of the
studied ENMs in soils are generally very low, below 1 µg/kg soil. This with the exception of TiO2 in
soils treated with STP sludge where the modelled concentrations (most probable values) reach 1.3
mg/kg soil and 0.17 mg/kg soil for the photostable and photocatalytic form, respectively, and CeO2
exceeds 1 µg/kg soil. As mentioned above for ENM in sediments, the potential bioaccumulation of
ENM in soil-living organisms is also an area that needs to be further investigated and for this
purpose the estimated and forecasted concentrations in the report may serve as a starting point for
defining environmentally realistic exposure conditions.
In summary, based on the existing information about the properties of the studied ENMs and their
current use volumes and applications, only the most probable value-based risk quotient for nano-
CuO in undiluted STP effluent exceeded the acceptability criterion of 1 while the risk quotient based
on the max. concentration exceeded 1 also for photostable TiO2 and nano-Ag. Soils and sediments
are for many of the ENMs the dominant environmental sinks but, with the exception of a few ENMs
in sludge-treated soils, the calculated concentrations are very low.

Environmental assessment of nanomaterial use in Denmark 83
4.5 Broader considerations regarding environmental risks
The preceding sections of the discussion have focused on the specific elements of the NanoDEN
project that have provided the basis for the assessment of environmental risks related to the use and
occurrence of the selected ENMs. These specific assessments provide an important contribution to
the perspective regarding the environmental implications of ENM use as such, with emphasis on
the situation in Denmark. The following discussion intends to address other relevant questions in
relation to assessing the general environmental implications of the use of ENM.
Were the right ENMs selected for the study?
One of the activities in the start-up phase of the project was to identify possible candidates and
among these select 10 engineered nanomaterials (ENMs) for closer examination and assessment.
The selection process was risk based and considered potential toxicity as well as expected (relevant)
exposure (tonnage and emission) of the environment. Furthermore, only ENMs applied in various
consumer and/or industrial products and ENMs under current scientific evaluation/discussion
regarding human and environmental exposure and effects were considered.
The result hereof was that the 10 selected ENMs represented partly materials currently being used
in some of the highest tonnages, partly materials that together had a wide range of applications,
partly materials of very different character (metals, other inorganics, carbon-based ENMs) and
partly materials with a significant span regarding toxicity and behaviour in the environment.
Hence, the selection made is considered to be representative considering the purpose of the
NanoDEN project and has provided a good basis for the subsequent risk assessment and
considerations on possible environmental concerns. Among the high tonnage ENMs, only silica
(SiO2) was omitted while among the metal-based ENMs e.g. those based on cobalt and nickel were
left out and also the carbon-based fullerenes were de-selected.
Did the study reveal any especially critical ENMs?
Based on the calculated PNEC values and risk quotients (PEC/PNEC) for the aquatic environment
none of the 10 selected nanomaterials appear to be critical at the present level of use and release. A
few of the materials, CuCO3/CuO and to some extent TiO2, Ag and CB, revealed risk quotients at
the discharge point for STP effluents above 1 (with a max. of 12) and would, thus, in principle
require some risk management to implemented. If no other management measures are
implemented the discharge of these ENMs would require some initial dilution (up to 12 times) in
receiving waters to achieve an acceptably low risk level. This is within the same order of magnitude
as for a number of anthropogenic chemical substances. Increasing consumption, and thereby
release, and/or new application areas could change the picture, however, the PEC part of the
calculations were conservative in the sense that possible transformation into non-nano forms after
release to the environment was not taken into account.
A few of the materials, especially nano-Ag and nano-Cu (and maybe a few other metal-based
ENMs), may be relevant to consider with regard to possible bioaccumulation.
With regard to (aquatic) toxicity, comparison with the corresponding chemicals is possible is
possible for a few of the ENMs (TiO2, ZnO, Ag and CuO). The general picture seems to be that the
toxicity of the nanomaterial is higher than the bulk form of the corresponding chemical but lower
than or equalling the toxicity of ionic form. However, it is important to note that the metals Ag and
Cu are well-known environmental toxicants independent of the form in which they are used and
emitted to the environment, and therefore increases or changes in the use of these metals should be
followed closely.

84 Environmental assessment of nanomaterial use in Denmark
Were particularly critical uses and sources/releases identified?
The 10 selected ENMs represent a wide range of uses and thereby potentially also many release
pathways. A detailed study of these many uses has not been possible within the framework of this
study but as no basic production and apparently only little manufacturing of nano-products and
materials take place in Denmark, the main environmental releases are considered to be due to the
consumption and use of nano-containing products and materials.
Sewage treatment plants (STPs) appear as a general rule to be capable of retaining (and possibly
transforming) the major part of nanomaterials that are released into the public sewage systems (e.g.
ENMs used in various cosmetics or hygienic articles), thus reducing the exposure of the aquatic
environment very significantly compared to direct discharges. Likewise, waste incineration plants
(WIPs) also normally retain most of the materials in the solid waste products. However, some STP
sludge is applied onto cultivated land and a quite large fraction of WIP residuals is used for
construction works (e.g. as road base) and therefore these retained ENM fractions could still give
rise to environmental – if they are still on nano form after passing the STP or WIP processes (which
is probably questionable).
The critical uses are in principle all those leading to direct release to and exposure of one or more
environmental compartments, i.e. without passing through e.g. STP or WIP treatment processes,
but of course the actual risk will also depend on the use amount/volume and on the toxicity of the
ENM in question. Examples of such critical uses could be outdoor paints and other coatings for
building facades or other constructions, impregnation of wood for outdoor constructions (on land
or in water), anti-fouling paints for ships, fillers for tyres, and artificial lawns (rubber filler made
from used tyres). The potential for direct release to the environment may result in locally high
exposure concentrations, which for some of the most toxic ENMs (like Ag and CuO/CuCO3) may
imply risk levels that are not acceptable.
Are there any special Danish conditions?
There seems to be very little production/manufacturing of ENMs in Denmark and this significantly
reduces the part of the total environmental exposure originating from point sources compared to
some other countries with higher degree of industrial production, while the part originating from
diffuse sources (general use) is probably the same.
In Denmark the degree of re-cycling of waste materials from waste incineration plants for outdoor
construction works (e.g. roads) is significant, and higher than in many other European countries.
This implies potentially a higher risk of environmental exposure than in many other countries (in
particular of soil and groundwater) and, hence, these material cycles could deserve a closer
examination in a future study.

Environmental assessment of nanomaterial use in Denmark 85

86 Environmental assessment of nanomaterial use in Denmark
5. Uncertainties and data gaps
In this chapter the main uncertainties and data gaps encountered in the different NanoDEN sub-
projects are summarized and discussed in thematic sections on environmental fate, environmental
exposure and environmental effects, respectively. Specific data gaps/uncertainties relating to the
individual ENMs are described in detail in the previously published sub-project reports (Hartmann
et al., 2014; Gottschalk et al., 2015a; Lützhøft et al., 2015).
5.1 Environmental fate and exposure modelling
A number of gaps have been identified in the current knowledge on transformation processes for
ENMs in environmental matrices. The identified gaps fall into four categories: Environmental fate
processes, characterisation and measuring methods, availability of data and information, and issues
related to environmental exposure modelling.
Environmental fate processes. Once in the environment, the fate and behaviour of ENMs will
be determined by the intrinsic properties of the ENM, the transformation processes and the specific
environmental conditions. By comparing the identified knowledge gaps related to specific
environmental transformation processes with the relative importance of these processes for
environmental fate modelling of ENMs the following prioritisation can be made:
- Aggregation/Agglomeration: Understanding and describing the kinetic changes in
aggregation/agglomeration including rate of growth. Possible adaptation of the DLVO theory
- Sedimentation : Understanding the role of chemical compositions, sizes, and shapes on
ENM sedimentation in surface waters
- NOM adsorption : Investigation of parameters influencing the stabilising (or de-
stabilising) effects of NOM on ENM stability
- Sorption to other surfaces: Determining the role and extent of sorption as a distribution
process for ENMs in solid-water matrices
- Dissolution: Development of models to describe dissolution process. Develop appropriate
tests to measure dissolution kinetics.
Characterisation and measuring methods. This covers gaps related to the distinct limitations
of methods to characterise and measure concentrations of ENMs. Currently, the advancement of the
understanding of ENM fate and behaviour is hampered or limited by the lack of appropriate ENM
characterization, and measuring methods and methods for measuring dissolution, redox potential,
sorption as well as aggregation in environmentally realistic samples are needed.
Availability of data and information. Common for all mass-based models and frameworks is
that they need a basic set of experimental/empirical data and information in order to be useful for
environmental exposure estimation. This includes data on quantities of ENM produced, specific
uses and use concentrations as well as data quantifying release during production, transport, use
and disposal. Currently the access to such information and data is very limited and little known
about the routes of entry for ENMs to the environment.

Environmental assessment of nanomaterial use in Denmark 87
Environmental exposure modelling. The reliability and relevance of all mass-based models
and frameworks are dependent on the availability and quality of the input data. Common for all
ENMs is the need for knowledge on real Danish ENM use quantities as well as a better
understanding for the fate and behaviour of engineered nanomaterials in all environmental
compartments. The input data for the models are based on the newest and most recent knowledge
on use quantities and applications for Denmark, or when no data specific to Denmark were
available, data and knowledge of nanomaterial use gathered in the general European (or Swiss)
context, adapted to Danish conditions, have been used. However, due to the lack of empirical
Danish data and gaps in the knowledge on Danish use quantities and fate and behaviour of the
ENMs in the different compartments, the resulting PEC values in this study are associated with very
wide 95% probability ranges. It is assessed that such empirical Danish data would be, by far, the
most important factor for improving the environmental exposure model.
The exposure estimation model applied in the current project is in principle able also to estimate
local exposure concentrations. However, within the framework of the NanoDEN project it was not
possible to develop an adequate local Danish model e.g. for river sections and coastal waters. Such
scenarios would have to include local ENM release knowledge that is almost not available. A Swiss
study by Gottschalk et al. (2011), where local scenarios for rivers were presented, could benefit from
an already available hydrological model on water level geography and sewage treatment plant
performance dynamics that is not possible to link directly to Danish ENM release situations.
Despite this, it is still our opinion that in the Danish model based on the same approach for regional
predictions, the highest local exposure in fresh surface waters should be covered by the model
through the results of non-diluted water as we find it in sewage treatment effluents.
Another factor, which affects the modelling results and add to the uncertainties regarding the
predicted environmental concentrations, is the lack of information on the fate and behaviour of the
ENMs in the different compartments. The results from sub-project 1 under NanoDEN (Hartmann et
al., 2014) revealed that the current database for incorporating, for example, photochemical
degradation, oxidation, reduction, adsorption, desorption and biotransformation in detail into the
generic mass transfer model is not satisfactory. Also knowledge about sedimentation is crucial for
estimating the residence time of the nanomaterials in water, including sewage, as well as their
subsequent discharge into sediments and sewage treatment sludge. The results from Hartmann et
al. (2014) confirmed that currently accurate scientific information is missing, and therefore a large
spectrum of materials have been modelled as having either immediate or almost no sedimentation
(water-sediment transport).
It is important to mention that for all of the predicted environmental exposure concentrations it is
still unknown whether the materials will be on nano form after being incorporated into soil and
sediments. Common to all the case-studies, the modelling stops at the point where the materials
reaches these compartments, assuming no ENM transformation, since data for ENM fate and
behaviour here is lacking. The same is the case for landfills and recycling plants where the fate of
the ENM in these processes were not studied, also due to lack of data.
As mentioned in chapter 4, even only more precise and robust knowledge on the nanomaterial
production quantities in a particular region would significantly help improving this kind of
predictive modelling. In the absence of these, we have aimed at filling most data gaps by
considering very large assumptive data ranges that should enable capturing as far as possible the
whole possible model data spectrum, which is essential to ensure that significant risk scenarios are
not missed in the analysis.

88 Environmental assessment of nanomaterial use in Denmark
5.2 Ecotoxicity and determination of level of protection
From the literature and the gap analysis carried out for each ENM in this study (as reflected in the
discussion about environmental effects in section 4.3), a number of general gaps with respect to
establishing PNEC values for nanomaterials have been identified:
- Limited number of studies at different trophic levels: It is generally found that the
diversity of organisms tested is very low with respect to the trophic level, resulting in use of
the AF approach alone for PNEC estimation.
- Lack of studies from different environmental compartments: For all of the ENMs studied
there is a pronounced lack of studies from other environmental compartments than
freshwater. This includes studies on marine organisms, as well as soil- and sediment-living
organisms. For conventional chemicals there is an option of extrapolating from freshwater
tests to other compartments by the use of partitioning coefficients. However, interpolation
between compartments is not possible for ENMs. Thus, this data gap can only be closed by
additional testing in the compartments at question.
- Most studies focus on acute toxicity: It was revealed from literature that the vast majority
of ecotoxicity data are short-term tests. For the ENMs for which it was possible to establish
a PNEC value, results from chronic tests were typically available from two studies at two
different trophic levels, i.e. algae and daphnia, resulting in the use of 50 as the AF. To
obtain less uncertainty in the determination of PNEC more studies focused at chronic
endpoints are needed.
- Testing of high ENM concentrations: Often high and environmentally unrealistic
concentrations are used in standardized ecotoxicity tests influencing the ENM behaviour
and bioavailability. This may lead to either false-negative or false-positive results, which
may influence the validity of the PNEC estimation.
Regarding the estimation of PNEC values for nanomaterials the major gap is the lack of underlying
proper data suited for risk assessment. There is a general lack of reliable data, in the sense that
despite a wide range of tests have been performed according to accepted international guidelines
(or modification thereof), they cannot be fully trusted to yield accurate and conservative estimates
of the toxicity of an ENM. This is by far due to varying exposure conditions during the
ecotoxicological testing, which is a violation of the underlying assumption of constant exposure
concentration, leading to constant organism concentrations and further to constant target
location/organ concentrations.
Another factor, common for most of the ENMs, which influenced the adequacy of the studies
already performed for regulatory risk assessment, was the general lack of material characterisation,
especially measurements of the dose metric during and at the end of the test, but in fact also for
basic data on inherent properties, e.g. for material identification and characterisation.
Finally, it should be emphasized that the PNEC estimations given throughout this report are based
on the assumptions that 1) the current test methods are applicable to nanomaterials, and 2) that the
current extrapolation methodologies are valid for nanomaterials. Both of these assumptions are
questionable (for a further discussion of this see Lützhøft et al., 2015). When ENMs are tested in
standard ecotoxicity tests the validity criteria of monotonous concentration-response curves and
stable exposure conditions are challenged due to the behaviour of ENMs in testing media and in
different test concentrations. The links between transformed states of the ENMs (e.g. dissolved or
agglomerate forms) and biological effects are at present unknown. However, it is known that
transformation during testing influence the test results. For PNEC estimation by application of an
AF this constitutes a major problem for the validity of the extrapolation from standardized tests,

Environmental assessment of nanomaterial use in Denmark 89
since environmental effects may occur at lower concentrations than those used in the standardized
tests. Thus, it is questionable whether the PNEC established by application of an AF will indeed be
protective for organisms in the environment.
5.3 Other environmental hazards related to ENMs
As described by Hansen et al. (2013) a range of “warning signs” for ENMs should be considered
besides the possible toxicity, which is already included in the estimation of PNEC values in this
report. These warning signs are not specific for ENMs and were in fact proposed by the European
Environment Agency already in 2001 as an aid to identify new, potentially problematic substances
(EEA, 2001). Related to environmental hazards of ENMs also the topic of novelty, bioaccumulation,
and persistency may play an important role.
Novelty. The assessment carried out in this report is mainly based on traditional biological
endpoints for toxicity such as mortality, growth rate inhibition and reduced reproduction. The novel
properties of ENMs may result in novel effects that are not addressed when using tests developed
for dissolved “ordinary” chemicals. In the few cases where nano-specific effects were reported for
ENMs they were considered in the PNEC estimations, but did not result in lower PNEC values.
Bioaccumulation. Bioaccumulation studies are needed for ENMs. Though bioaccumulation is not
a part of PEC/PNEC estimation, it is a crucial parameter for ERA used for classification, labelling
and PBT assessment. In the current guidance documents, criteria for assessing bioaccumulation are
given as well as estimation methods if data is lacking, however based on processes relevant for
dissolved organic chemicals (mainly molecular diffusion as the main passive uptake route). These
processes are not relevant for particles and therefore only actual measured values taking uptake and
depuration into account will be valid for ENM. Such studies are presently rare (Skjolding et al.,
2014a and 2014b).
Persistency. Another essential part of a chemical safety assessment is the question of
degradability or persistency in the environment. For this the current guidance documents provide
test recommendations and cut-off values to classify the degradability. However, as discussed in
detail by Hansen et al. (2013) these are not relevant for most ENMs since many are inorganic
compounds. As stated by Hansen et al. (2013) this could lead to a classification of all inorganic
ENMs as persistent, but the definition of persistency in the guidance documents do also include
“chemical transformations”. As discussed in this report, ENMs are likely to undergo a range of
transformation processes depending on the redox conditions and ionic strength of the
environmental media. The transformed ENMs may or may not be nanoscale. Thus, Hansen et al.
(2013) proposed that only for non-reactive inorganic nanomaterials the term “persistent” should be
considered. It should be noted that for trace organic contaminants the term “pseudopersistency”
has been introduced to describe the occurrence of readily biodegradable compounds that, because
of a continuous (low) discharge, remain in the environment (Diamond et al., 2010). This may be
the situation for some of the ENMs included in the present study as reflected in the results of the
exposure (PEC) modelling.
90 Environmental assessment of nanomaterial use in Denmark
Conclusions and perspectives
The NanoDEN project, of which this report constitutes the result of the final sub-project, has partly
provided state-of-the-art reviews of the current knowledge on engineered nanomaterials (ENMs) in
the environment and partly generated new data relating to environmental exposure and effects as
reflected in the following previously published sub-project reports:
Environmental fate and behaviour of nanomaterials – a critical review of new knowledge on
important transformation processes (Hartmann et al., 2014)
Modelling releases to and exposure of selected nanomaterials in the Danish environment
(Gottschalk et al., 2015a) with two comprehensive separate annex reports on sources of
selected ENMs in Denmark (Lassen et al., 2015) and detailed exposure modelling results
(Gottschalk et al., 2015b), respectively.
Environmental effects of selected nanomaterials with emphasis on derivation of PNEC values
(Lützhøft et al., 2015)
The current, final sub-project under NanoDEN has aimed partly to specifically perform an
environmental risk assessment for the ENMs selected for this study (based on the results of the
previous sub-projects), and partly to address the overarching question behind the NanoDEN project
as such: is there reason for concern with regard to nanomaterials in the Danish environment?
We have chosen to address the latter question by posing, and trying to answer, the following more
concrete questions:
Do some individual ENMs, or groups of ENMs, constitute an environmental risk (now or in
the future, how far are we from critical levels)?
A few ENMs are already used in quite large quantities (e.g. carbon black and TiO2) and could for
that reason potentially constitute a risk, despite not being very hazardous, if/when their use
volumes increase further. On the other side nano-Ag is the most toxic of all the ENMs studied but is
not used or released in very big quantities. With the current use patterns and use volumes none of
the selected ENMs appear to be very critical from an environmental point of view and in general the
levels are quite far from concern. TiO2 and CuO do, however, in some cases come relatively close to
levels of concern, i.e. a significant increase in the use of these ENMs could increase the risk to levels
where mitigating measures could be considered.
With regard to general environmental concern, the ENMs can be placed in some rough "risk
categories" in a way similar to what could be done for traditional chemicals.
1. Critical ENMs: Those with high PEC as well as low PNEC:
At present there appears to be none with that combination in Denmark (neither among the
studied ENMs nor others that the project team is aware of)
2. Potentially critical ENMs (if/when PEC increases significantly):

Environmental assessment of nanomaterial use in Denmark 91
2a. Highly toxic ENMs (low PNEC):
Examples: nano-Ag, nano-CuO and maybe CNT
2b. High release volume ENMS (high PEC):
Examples: nano-CB and (photostable) nano-TiO2
3. ENMs unlikely to be critical:
Examples: nano-ZnO, nZVI (because the exposure is so local), nano-CeO2 and QD
It should be emphasized that the assessment above only covers the nano form, not possible
bulk/ionic forms of the same material. Further, the assessment does not include possible risk of
local effects due to specific industrial point sources (presently considered to be of very limited
relevance in Denmark). Risk quotients (PEC/PNEC values) for the selected ENMs calculated to be
higher 1 in STP effluents could indicate a potential concern in case of (significantly) increasing use
and release of these nanomaterials. Nano-CuO is the case with the highest risk quotient, it should,
however, be kept in mind that the case is theoretical as currently the use of CuO (or CuCO3) as a
biocide is not based on the nano form.
For many of the ENMs soils and sediments will be the dominant environmental sinks but it has not
been possible to derive risk quotients for any of the ENMs studied in soil or in sediment. This is
partly due to lack of experimental data on effects on soil/sediment-dwelling organisms and partly
because extrapolation from aquatic data is not considered possible for ENMs at the current level of
knowledge. However, with the exception of a few ENMs in sludge-treated soils, the (conservatively)
calculated concentrations are generally very low, below 1 µg/kg soil. For soils and sediments, the
potential bioaccumulation of ENM in organisms is an area that needs to be further investigated and
for this purpose the estimated and forecasted concentrations in the report may serve as a starting
point for defining environmentally realistic exposure conditions.
Are ENMs, as a group, covered sufficiently by the ENMs studied in this project?
The ENMs selected for this project represent partly materials which are currently used in some of
the highest tonnages, partly materials that together have a wide range of applications, partly
materials of very different character (metals, other inorganics, carbon-based ENMs) and partly
materials with a significant span regarding toxicity and behaviour in the environment.
Hence, we believe that the selection made is representative considering the purpose of the
NanoDEN project. Among the high tonnage ENMs, only silica (SiO2) was omitted while among the
metal-based ENMs e.g. those based on cobalt and nickel were left out and also the carbon-based
fullerenes were de-selected. These delimitations are not considered to compromise the possibility of
discussing ENMs from an overall risk perspective in this report.
Are certain functionalities or types of uses of ENMs more critical than others from an
environmental perspective?
The critical functionalities and use types are in principle all those leading to direct release to and
exposure of one or more environmental compartments, i.e. without passing through e.g. STPs or
waste treatment processes, but of course the actual risk will also depend on the use amount/volume
and on the toxicity of the ENM in question. Such direct releases are estimated to be dominant for
more than half of the studied ENMs. Examples of such critical uses could be outdoor paints and
other coatings for building facades or other constructions, impregnation of wood for outdoor
constructions (on land or in water), anti-fouling paints for ships, fillers for tyres, and artificial lawns
(rubber filler made from used tyres). Some of these uses lead to aquatic exposure due to discharges
of untreated runoff from roofs and paved surfaces (e.g. CeO2 and CB) while others affect directly the
soil environment (such as use of CuO for wood impregnation) or even the marine environment
(ENMs in antifouling paints (no current examples)).
92 Environmental assessment of nanomaterial use in Denmark
Does the Danish situation with regard to ENMs deviate from the general situation in the EU?
In Denmark there is no basic production of nanomaterials and presumably quite limited
manufacturing of nano-containing materials and products. Thereby industrial point sources are
probably of less importance in Denmark than in other countries in the EU with more industrial
production.
The degree of re-cycling of waste materials from waste incineration plants for outdoor construction
works (e.g. roads) is high in Denmark, and higher than in many other European countries. Such
"open" types of re-cycling could imply a potential risk of higher total environmental exposure, in
particular of (subsurface) soil and groundwater, for some ENMs.
Significance of natural NMs compared to the corresponding ENMs
No quantifications appear to exist for the relevant ENMs that relate the release of the engineered
nanomaterials (ENM) to the amounts of the same nanomaterials already occurring in nature such
as e.g. organic carbon based nanoparticles and some inorganic oxides. It is known that the ultrafine
particles produced and released as a result of (natural) fires and/or combustion of organic material
and fossil fuels comprise some of the nanomaterials that also occur as "engineered", i.e. CNT,
fullerenes and carbon black. Possibly, also some inorganic nanoparticles are produced from e.g.
volcanic eruptions or by wind erosion of mineral surfaces (rock, soil). It is of course debatable
whether anthropogenic combustion of wood, coal etc., or exhaust from vehicles, should be
considered a "natural" source or be assessed along with the engineered nanoparticles.
In a discussion of natural sources in relation to possible impacts on the environment it should be
borne in mind that living organisms have for millions of years been exposed to the mentioned
natural nanoparticles and have therefore been able to adapt to these in the process of evolution.
Therefore, natural NPs appear to be of limited relevance to discuss in the context of environmental
risk of ENMs.
What more do we need to know (data gaps)?
The identified main data gaps and uncertainties within a number of themes considered central for
environmental assessment of ENMs are described in chapter 5. If considering this issue from a
regulatory perspective the most important gaps to be addressed are those that limit the possibilities
of introducing environmental regulation of ENMs, should such regulation be deemed necessary.
Among the data gaps mentioned in chapter 5 we consider the following to be the most important:
Data that can define the actual environmental exposure to ENMs more precisely than now, e.g.:
- more specific (Danish) data on the sources and releases from industrial facilities as well as
resulting from the use of nano-products by consumers;
- data clarifying to what extent and for how long ENMs released to the environment exist as
nanoparticles in the environment before they are either dissolved or no longer are on nano form
due to aggregation/agglomeration;
- Better data on retainment of ENMs in STPs and waste incineration plants.
Data that can verify the PECs predicted by modelling i.e. analytically measured data (which
will require better analytical methods for ENMs to be developed);
Data that can lead to more precise and reliable PNECs than today, i.e. more data (especially
chronic) on individual ENMs as well as testing methods that are more suitable to ENMs than
the current.
Data that can validate that the use of current methods for deriving PNEC will lead to
protective concentrations with regards to environmental effects of ENMs

Environmental assessment of nanomaterial use in Denmark 93
Ecotoxicity data for organisms from other compartments than freshwater (e.g. soil, marine,
and sediment-living organisms) since interpolation between environmental compartments is
presently not feasible.
And, finally, the fundamental question behind the NanoDEN project:
Is there reason for concern with regard to nanomaterials in the Danish environment?
Similar to what would be the case if the same question was asked for chemical substances, there is
not one single answer that can cover the full width of nanomaterials, which are as diverse in
properties and in uses as traditional chemicals.
On the other hand, as also indicated previously, the ENMs selected for assessment in the project are
considered to be fairly representative of the ENMs that are commercially available in Denmark
today both with regard to their properties and actual uses. Based on the review and assessments of
exposure and effects of these ENMs in this project, a significant environmental concern regarding
nanomaterials in the Danish environment seems hard to justify with the present level of knowledge
and the current level and character of use of these materials. It should be noted that sufficient data
have only been available for an assessment for the freshwater environment.
As described earlier, there are certainly many data gaps and uncertainties but, on the other hand,
our exposure assessment has been rather conservative e.g. by assuming that the nanomaterials will
remain on nano-form in the final environmental compartments where even the max. concentrations
in the 95% confidence interval do not lead to alarming risk quotients (although exceeding 1 for a few
materials).
On the effects side, generally only few adequate effect studies are available (except for 1-2 ENMs)
but it is uncertain whether more data would lead to higher or lower PNEC values (more sensitive
endpoints could be found but more data could also lead to lower assessment factors). If the PNECs
were a factor of 10 lower, the risk quotients for a few ENMs would be so high that it would call for
regulatory action. On the other hand the ENMs in question are among the most well-studied i.e. the
likelihood of obtaining a 10 times lower PNEC is considered rather low. Effects of possible
accumulation in sediments and soils of a few metal-based ENMs need to be considered further.
In conclusion, the current project has, based on data relevant for the freshwater environment, not
identified significant concerns related to nanomaterials in the Danish environment. However, a few
ENMs should probably be kept under observation. This either because the current releases have
been modelled to be quite high (TiO2, CB) or because these ENMs have release patterns and hazard
properties placing them in a "possible future concern" category (Ag, Cu). In Denmark, most of the
other ENMs are used only for very specific low-volume purposes and/or uses with practically no
environmental release and are therefore regarded to be of "low concern" with regard to the Danish
environment at the current level of use.

94 Environmental assessment of nanomaterial use in Denmark
References
Arvidsson, R., Molander, S., Sandén, B. och Hassellöv, M. (2011). Challenges in Exposure Modeling
of Nanoparticles in Aquatic Environments. Human and Ecological Risk Assessment (1080-7039).
Vol. 17 (2011), 1, p. 245–262.
Baun, A, Hartmann, N, Grieger, KD, Hansen, SF (2009). Setting the limits for engineered
nanoparticles in European surface waters – are current approaches appropriate. Journal of
Environmental Monitoring, 11, 1774–1781.
Diamond J, Latimer H, Munkittrick K, Kidd K, Thornton K, Bartell S (2010). Diagnostic Tools to
Evaluate Impact of Trace Organic Compounds, Prioritization Framework for Trace Organic
Compounds, Water Environment Research Foundation, IWA Publishing, London, UK, 2010.
ECHA (2014). Human health and environmental exposure assessment and risk characterisation of
nanomaterials - Best practice for REACH registrants. Third GAARN meeting, Helsinki, 30
September 2013. European Chemicals Agency, Helsinki, Finland. ISBN: 978-92-9244-484-6.
EEA (2001). Late Lessons From Early Warnings: The Precautionary Principle 1896–2000,
European Environmental Agency, Copenhagen, Denmark.
Farré M, Pèrez S, Gajda-Schrantz K, Osorio V, Kantiani L, Ginebreda A, Barcelü D (2010). First
determination of C60 and C70 fullerenes and N-methylfulleropyrrolidine C60 on the suspended
material of wastewater effluents by liquid chromatography hybrid quadrupole linear ion trap
tandem mass spectrometry. Journal of Hydrology 383, 44-51.
Gottschalk F, Nowack B, Lassen C, Kjølholt J, Christensen F (2015a). Nanomaterials in the Danish
environment. Modelling exposure of the Danish environment to selected nanomaterials.
Environmental Project No. 1639, 2015 from the Danish Environmental Protection Agency. 143 pp.
http://www2.mst.dk/Udgiv/publications/2015/01/978-87-93283-60-2.pdf
Gottschalk F, Nowack B, Lassen C, Kjølholt J, Christensen F (2015b). Nanomaterials in the Danish
environment. Modelling exposure of the Danish environment to selected nanomaterials. Annex II to
Environmental Project No. 1639, 2015 from the Danish Environmental Protection Agency. 66 pp.
http://www2.mst.dk/Udgiv/publications/2015/01/978-87-93283-60-2_annex2.pdf
Gottschalk, F., Ort, C., Scholz, R.W., Nowack, B., 2011. Engineered nanomaterials in rivers
- exposure scenarios for Switzerland at high spatial and temporal resolution. Environmental
Pollution 159, 3439-3445.
Gottschalk, F., Sonderer, T., Scholz, R.W., Nowack, B., 2009. Modeled environmental
concentrations of engineered nanomaterials (TiO2, ZnO, Ag, CNT, fullerenes) for different regions.
Environmental Science and Technololgy 43, 9216-9222.
Hansen S.F., Nielsen, K., Knudsen, N., Grieger, K. Baun, A. (2013). Operationalization and
Application of “Early Warning Signs” to Screen Nanomaterials for Harmful Properties.
Environmental Science: Processes & Impacts, 15, 190-203.

Environmental assessment of nanomaterial use in Denmark 95
Hartmann NIB, Skjolding LM, Hansen SF, Kjølholt J, Gottschalk, Baun A (2014). Environmental
fate and behaviour of nanomaterials. Environmental Project No. 1594, 2014 from the Danish
Environmental Protection Agency. 113 pp.
http://www2.mst.dk/Udgiv/publications/2014/08/978-87-93178-87-8.pdf
Larsen PB, Kjølholt J (2015). Exposure to nanomaterials from the Danish environment.
Environmental Project No. 1633, 2015 from the Danish Environmental Protection Agency.
http://www2.mst.dk/Udgiv/publications/2015/01/978-87-93283-54-1.pdf
Lassen C, Kjølholt J, Christensen F, Gottschalk F, Nowack B, Eriksson E (2015). Parameters for
estimation of releases of nano-materials to the environment in Denmark. Annex I to Environmental
Project No. 1639, 2015 from the Danish Environmental Protection Agency. 106 pp.
http://www2.mst.dk/Udgiv/publications/2015/01/978-87-93283-60-2_annex1.pdf
Lützhøft HCH, Hartmann NIB, Brinch A, Kjølholt J, Baun A (2015). Environmental effects of
nanomaterials. Estimations of Predicted No-effect Concentrations (PNECs). Environmental Project
No. 1787, 2015 from the Danish Environmental Protection Agency. 111 pp.
http://www2.mst.dk/Udgiv/publications/2015/09/978-87-93352-70-4.pdf
Nowack B, Bucheli TD (2007). Occurrence, behavior and effects of nanoparticles in the
environment. Environmental Pollution 150, 5-22.
SCENIHR (2014). Opinion on Nanosilver: Safety, health and environmental effects and role in
antimicrobial resistance. Scientific Committee on Emerging and Newly Identified Health Risks
SCENIHR European Commission, Health & Consumers, Luxembourg.
Skjolding, L. M., Kern, K., Hjorth, R., Hartmann, N., Overgaard, S., Ma, G., Veinot, J.G.C., Baun, A.
(2014a). Uptake and depuration of gold nanoparticles in Daphnia magna. Ecotoxicology. 23(7),
1172-1183.
Skjolding L. M., Winter-Nielsen M., Baun A. (2014b) Trophic transfer of functionalized zinc oxide
nanoparticles from crustaceans (Daphnia magna) to zebrafish (Danio rerio). Aquatic Toxicology,
157, 101-108.
Sun, T.Y., Gottschalk, F., Hungerbühler, K., Nowack, B., 2014. Comprehensive probabilistic
modelling of environmental emissions of engineered nanomaterials. Environmental Pollution 185
69-76.
Van Hoecke, K., De Schamphelaere, K.A.C., Van der Meeren, P., Lcucas, S. and Janssen, C. R.
(2008). Ecotoxicity of silica nanoparticles to the green alga Pseudokirchneriella subcapitata:
Importance of surface area. Environmental Toxicology and Chemistry, 27: 1948–1957.

96 Environmental assessment of nanomaterial use in Denmark
Appendix 1: List of Abbreviations and Acronyms
Abbreviation/Acronym Explanation
AF Assessment factor
Ag Silver
Ag2S Silver sulphide
CB Carbon black
Cd Cadmium
CeO2 Cerium dioxide
CNT Carbon nanotube
CuCO3 Copper carbonate
CuO Copper oxide
DEPA Danish Environmental Protection Agency
DLVO Derjaguin, Landau, Verwey and Overbeek theory (theory on
colloidal stability)
EC10 The concentration where an effect occurs in 10% of the
organisms in a population
EC50 The concentration where an effect occurs in 50% of the
organisms in a population
ENM Engineered nanomaterial
EPA Environmental Protection Agency
ERA Environmental risk assessment
ERC Environmental release categories
EUSES European Union System for the Evaluation of Substances
Fg Femto gram (1 fg = 0,000000000001 mg)
IC50 The concentration where inhibition occurs in10% of the
organisms in a population (typically algae or microorganisms)
LC50 The concentration where mortality occurs in 50% of the
organisms in a population
LED Light Emitting Device
LOEC Lowest Observed Effect Concentration
MC Monte Carlo
MFA Material flow analysis
MS Mass spectrometry
µg Micro gram (1 µg = 0,001 mg)
NanoDEN NANOmaterials – occurrence and effects in the Danish
ENvironment (this project)

Environmental assessment of nanomaterial use in Denmark 97
Abbreviation/Acronym Explanation
ng Nano gram (1ng = 0.000001 mg)
NM Nano material
Nm Nano meter
NOEC No Observed Effect Concentration
NOM Natural Organic Matter
NP Nano particle
nZVI Nano(sized) Zero-valent iron
PEC Predicted Environmental Concentration
PEG Polyethylene glycol
pg Pico gram (1 pg = 0.000000001 mg)
PMC Production, Manufacturing and Consumption
PNEC Predicted No-Effect Concentration
PVP polyvinylpyrrolidone
QD Quantum dot
RA Risk assessment
REACH Regulation on Registration, Evaluation, Authorisation and
Restriction of Chemicals (EU's chemical legislation framework)
RQ Risk Quotient
S Sulphur / sulphide
Se Selenium
STP Sewage treatment plants
TiO2 Titanium dioxide
UV Ultra Violet (irradiation)
WIP Waste incineration plant
Zn Zinc
ZnO Zinc oxide
ZVI Zero-valent iron

98 Environmental assessment of nanomaterial use in Denmark


Strandgade 29
1401 Copenhagen K, Denmark
Tel.: (+45) 72 54 40 00
www.mst.dk
Environmental assessment of nanomaterial use in Denmark
This is the concluding report of the project "Nanomaterials – occurrence and effects in the Danish
environment" (abbreviated NanoDEN), which part the Danish Government's initiative "Better Control of
Nanomaterials" (“Bedre styr på nanomaterialer”) which is administered by the Danish Environmental
Protection Agency. The projects in NanoDEN have aimed to investigate and generate new
environmentally relevant knowledge on of nanomaterials on the Danish market and to assess the
possible associated risks to the environment. The results from the sub-projects are summarized in the
current report and it is assessed whether and how nanomaterials may pose a risk for the environment in
Denmark.
The assessment is based on investigations of nine selected nanomaterials, which are expected to be
environmentally relevant based on knowledge of consumption quantities or how they are used. These
data contribute to an overall assessment of nanomaterials risk to the environment in Denmark.
The nine investigated nanomaterials are: Titanium Dioxide, Zinc Oxide, Silver, Carbon Nanotubes,
Copper Oxide, Zero Valent Iron, Cerium Dioxide, Quantum Dots and Carbon Black.
Dette er den afsluttende rapport i projektet "Nanomaterialer – forekomst og effekter i det danske miljø"
(forkortet NanoDEN), som udgør en del af Miljøstyrelsens udmøntning af regeringens finanslovsaftale
"Bedre styr på nanomaterialer". Projekterne i NanoDEN har haft som hovedformål, at undersøge og
generere miljørelevant viden om industrielt fremstillede nanomaterialer på det danske marked.
Resultaterne fra NanoDENs delprojekter sammenfattes i nærværende slutrapport som vurderer om og
hvordan nanomaterialer kan udgøre en risiko for miljøet i Danmark.
Vurderingen tager udgangspunkt i undersøgelser af ni udvalgte nanomaterialer, som forventes at være
miljømæssigt relevante ud fra viden om forbrugsmængder eller hvordan de anvendes. Disse data
bidrager til en samlet vurdering af nanomaterialers miljørisiko i Danmark.
De 9 undersøgte nanomaterialer er: Sølv, Titaniumdioxid, Zinkoksid, Kulstofnanorør, Kobberoksid,
Nanojern i oxidationstrin nul, Ceriumdioksid, Carbon black samt Kvantepunkter.