Environmental Applications of Oilfield...
14
44 Oilfield Review Investigation of subsurface sites before and after disposal of hazardous waste is a new and growing field for oilfield technology. Whether the problem is identifying and monitoring contaminated layers in the subsurface or characterizing a potential waste repository, techniques designed for hydrocarbon exploration and production are finding applications in a new environment. Keeping the Earth’s ecosystem a safe and healthy place to live and work is a chal- lenge today and will remain so into the 21st century. For thousands of years, humanity has sought protection from natural hazards and defense against predators and foes. Ironically, some activities designed to pro- vide such protection—the energy, defense and medical industries—also threaten us with another danger: hazardous and radioactive waste. To safeguard against unnecessary exposure to these wastes, gov- ernments now regulate the treatment, dis- posal and storage of industrial leftovers. A whole new industry, for management of environmental protection, has sprung up to defy this new danger with technologies tai- lored to the specific substances and hydro- geological settings in question. The goals of environmental management are many: to minimize generation of and exposure to hazardous waste; to dispose of waste in a manner that meets government regulations and community standards; and to assess, monitor and remediate damage caused by disposal gone awry. Several disci- plines, including agriculture, soil and groundwater engineering, and hydrocarbon exploration and production (E&P), are con- tributing measurement methods, modeling, and treatment and containment technolo- gies to achieve these goals. This article examines how oilfield technologies are helping to identify and characterize zones where waste or other substances have accu- mulated after leakage or disposal and to assess potential subsurface repositories for hazardous and radioactive waste. (For defi- nitions of types of waste see “Hazardous Waste and Radiation Basics,” page 48.) Successful application of oilfield technol- ogy for disposal site characterization and monitoring is based on understanding the differences and similarities between the E&P industry and the environmental manage- ment industry. The most significant differ- ence is in the economic incentives in the two fields. In the oil industry, the driving force behind use of technology is increased oil recovery, leading to increased profits. In contrast, in environmental management the driver is cost-effective protection of people and the environment in compliance with government regulations. In the latter case, simple, inexpensive technologies are usually chosen over sophisticated, expensive ones. Soil and groundwater samples are more rou- tine data sources than borehole logs; in some environmental management firms “logging” is a term generally associated with forestry, not with boreholes. In spite of the emphasis on low-cost solu- tions, the environmental management industry worldwide has annual revenues estimated at $250 billion. Demonstrating the value of E&P technologies is a first step to ensuring that site evaluation and restora- tion efforts harness the most effective tech- nologies available. The main similarity between the oilfield and environmental management industries is the need to describe subsurface fluid behavior through cost-effective technologies ( next page ). This implies accurate Darwin Ellis Ridgefield, Connecticut, USA Bob Engelman John Fruchter Bill Shipp Battelle Pacific Northwest National Laboratory Richland, Washington, USA Robert Jensen Rick Lewis Englewood, Colorado, USA Hugh Scott Sugar Land, Texas, USA Steve Trent Bechtel Hanford Inc. Richland, Washington Environmental Applications of Oilfield Technology For help in preparation of this article, thanks to Andrew Bowden and Robert Chaplow, United Kingdom Nirex Limited, Harwell, Oxford, England; Kevin Dodds, Schlumberger Wireline & Testing, Aberdeen, Scotland; Philippe Guerendel, Rachel Kornberg, Richard Parker, Simon Robson and Pieter van der Groen, GeoQuest, Gatwick, England; Michael Kane, Schlumberger-Doll Research, Ridgefield, Connecticut, USA; Greg Kubala, Schlumberger Limited, Sugar Land, Texas, USA; and Tim Scheibe and Steve Yabusaki, Battelle Pacific Northwest National Laboratory, Richland, Washington, USA. FMI (Fullbore Formation MicroImager), Formation MicroScanner, Litho-Density and UBI (Ultrasonic Bore- hole Imager) are marks of Schlumberger.
Transcript of Environmental Applications of Oilfield...
44
Darwin EllisRidgefield, Connecticut, USA
Bob EngelmanJohn FruchterBill ShippBattelle Pacific Northwest National LaboratoryRichland, Washington, USA
Robert JensenRick LewisEnglewood, Colorado, USA
Hugh ScottSugar Land, Texas, USA
Steve TrentBechtel Hanford Inc.Richland, Washington
Environmental Applications ofOilfield Technology
For help in preparation of this article, thanks to AndrewBowden and Robert Chaplow, United Kingdom NirexLimited, Harwell, Oxford, England; Kevin Dodds,Schlumberger Wireline & Testing, Aberdeen, Scotland;Philippe Guerendel, Rachel Kornberg, Richard Parker,Simon Robson and Pieter van der Groen, GeoQuest,Gatwick, England; Michael Kane, Schlumberger-DollResearch, Ridgefield, Connecticut, USA; Greg Kubala,Schlumberger Limited, Sugar Land, Texas, USA; and TimScheibe and Steve Yabusaki, Battelle Pacific NorthwestNational Laboratory, Richland, Washington, USA.FMI (Fullbore Formation MicroImager), FormationMicroScanner, Litho-Density and UBI (Ultrasonic Bore-hole Imager) are marks of Schlumberger.
Investigation of subsurface sites before and after disposal of
hazardous waste is a new and growing field for oilfield technology.
Whether the problem is identifying and monitoring contaminated
layers in the subsurface or characterizing a potential waste
repository, techniques designed for hydrocarbon exploration and
production are finding applications in a new environment.
Keeping the Earth’s ecosystem a safe andhealthy place to live and work is a chal-lenge today and will remain so into the 21stcentury. For thousands of years, humanityhas sought protection from natural hazardsand defense against predators and foes.Ironically, some activities designed to pro-vide such protection—the energy, defenseand medical industries—also threaten uswith another danger: hazardous andradioactive waste. To safeguard againstunnecessary exposure to these wastes, gov-ernments now regulate the treatment, dis-posal and storage of industrial leftovers. Awhole new industry, for management ofenvironmental protection, has sprung up todefy this new danger with technologies tai-lored to the specific substances and hydro-geological settings in question.
The goals of environmental managementare many: to minimize generation of andexposure to hazardous waste; to dispose ofwaste in a manner that meets governmentregulations and community standards; andto assess, monitor and remediate damagecaused by disposal gone awry. Several disci-plines, including agriculture, soil andgroundwater engineering, and hydrocarbonexploration and production (E&P), are con-tributing measurement methods, modeling,and treatment and containment technolo-gies to achieve these goals. This articleexamines how oilfield technologies arehelping to identify and characterize zoneswhere waste or other substances have accu-mulated after leakage or disposal and toassess potential subsurface repositories for
hazardous and radioactive waste. (For defi-nitions of types of waste see “HazardousWaste and Radiation Basics,” page 48.)
Successful application of oilfield technol-ogy for disposal site characterization andmonitoring is based on understanding thedifferences and similarities between the E&Pindustry and the environmental manage-ment industry. The most significant differ-ence is in the economic incentives in thetwo fields. In the oil industry, the drivingforce behind use of technology is increasedoil recovery, leading to increased profits. Incontrast, in environmental management thedriver is cost-effective protection of peopleand the environment in compliance withgovernment regulations. In the latter case,simple, inexpensive technologies are usuallychosen over sophisticated, expensive ones.Soil and groundwater samples are more rou-tine data sources than borehole logs; insome environmental management firms“logging” is a term generally associated withforestry, not with boreholes.
In spite of the emphasis on low-cost solu-tions, the environmental managementindustry worldwide has annual revenuesestimated at $250 billion. Demonstratingthe value of E&P technologies is a first stepto ensuring that site evaluation and restora-tion efforts harness the most effective tech-nologies available.
The main similarity between the oilfieldand environmental management industriesis the need to describe subsurface fluidbehavior through cost-effective technologies(next page ). This implies accurate
Oilfield Review
45
■■Characterization of soil, rock and fluids for managingenvironmental protection. As in the oil field, descriptionof subsurface layers and prediction of fluid movementrequire cost-effective technologies.
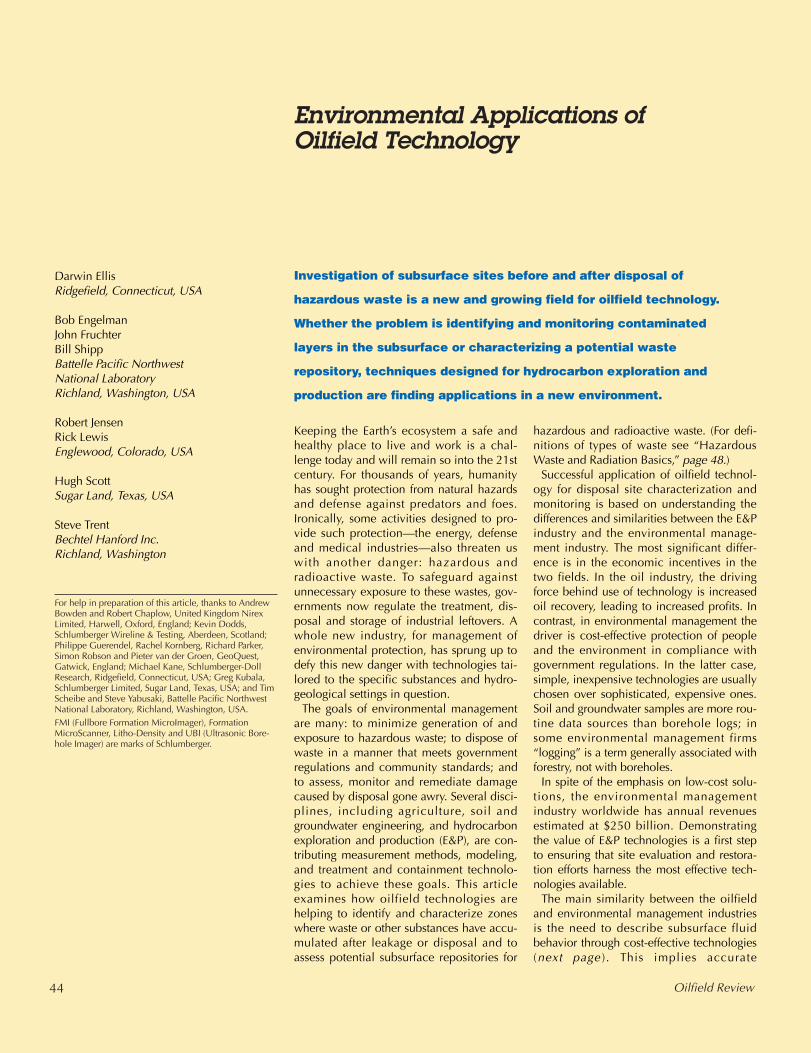
■■Hanford Site onthe banks of theColumbia River inthe state of Wash-ington, USA, chosenin the 1940s for itsremote location andample supply ofcooling water.N Reactor
Hanford SiteBoundary
N
0
0
10
10
km
miles
Richland
Columbia River
Yakima River
Seattle Spokane
W A S H I N G T O N
Richland
C A N A D AU N I T E D S T A T E S
measurement of fluid constituents and pre-diction of their movement with time. Othersimilarities—such as the actions taken tomobilize, extract or contain fluids—dependon the disposition of fluids and the desiredresults. In the oil field, the goal is to extractthe maximum percentage of hydrocarbonswhile keeping injected or connate wateraway from producing wells. In the arena ofwaste disposal, characterization is requiredfor design of repositories, so that hazardousmaterials are kept out of aquifers and reser-voirs that may communicate with the sur-face ecosystem. Whenever water suppliesare threatened to unacceptable levels,action is necessary to extract, treat or iso-late the contaminants.
In both industries, characterization of thesubsurface is essential. The following casestudies show how technologies designed forunderstanding hydrocarbon reservoirs arebeing advanced to address this need.
Hanford Site, Washington State, USAAn example of successful application of E&Ptechnology for environmental managementis the delineation and monitoring of radioac-tive and hazardous wastes in the sedimen-tary layers below the Hanford Site in Wash-ington, managed by the US Department ofEnergy (DOE) in the northwestern USA.
Built on the banks of the Columbia River inthe 1940s, Hanford is the site of the world’sfirst full-scale nuclear reactor and spent-fuelreprocessing plant, designed to produce plu-tonium (239Pu) for atomic weapons (aboveright ). The location was chosen for itsremoteness, ease of defense, mild climate,ample supply of electricity and availability ofwater for cooling the reaction process.
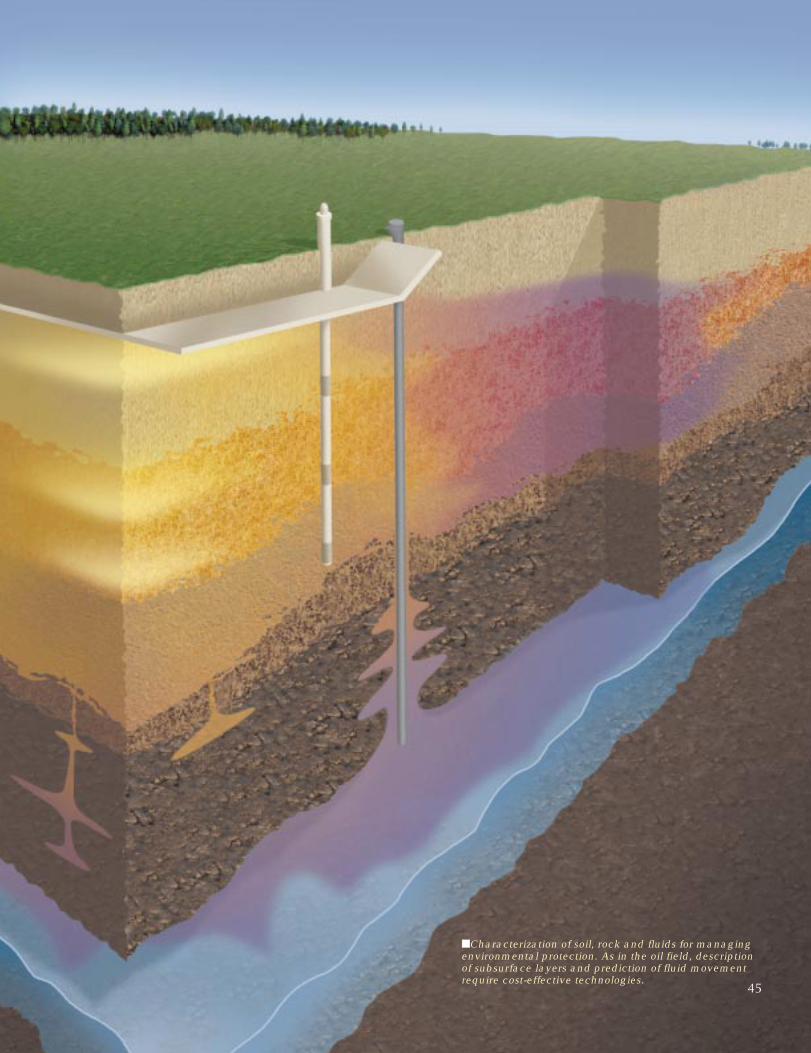
■■Tanks for storing waste from nuclear reactorat Hanford, 28 are double-shelled and 149 areThe carbon-steel tanks (left) are encased in ce(right). Sixty-seven of the single-shelled tanks h
46
Plutonium was produced at Hanford from1944 to 1987. At one time up to nine reac-tors and five reprocessing plants were activeat the site. All are still present, though inac-tive and scheduled for decontamination anddecommissioning. High-level radioactivewaste from the plutonium extraction chemi-
s. Of the 177 tanks single-shelled.ment and buriedave leaked.
Liquid
Processedair intakeLeak
detection pit
cal separation process, or reprocessing, wasplaced in single- and double-shelled car-bon-steel tanks (below). The tanks wereencased in cement and buried in “tankfarms” located on the Hanford site centralplateau, approximately 10 miles [16 km]west of the Columbia River and about 200 ft
PrimarytankSecondarytankReinforcedconcrete
Filteredair exhaust Liquid level gauge
Annular spacefor leak detection
Carbonsteel
Sludge
Oilfield Review
■■Unsaturated matrix. Air in the porespace requires new models for derivingporosity from density measurements.
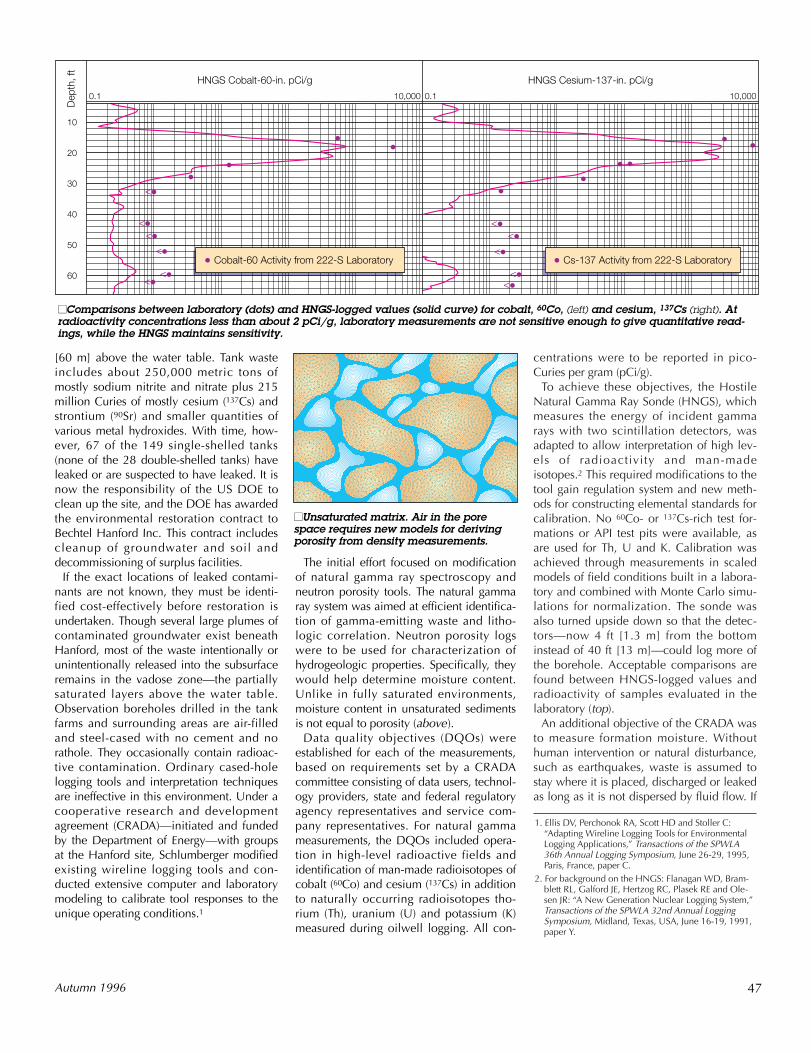
■■Comparisons between laboratory (dots) and HNGS-logged values (solid curve) for cobalt, 60Co, (left) and cesium, 137Cs (right). Atradioactivity concentrations less than about 2 pCi/g, laboratory measurements are not sensitive enough to give quantitative read-ings, while the HNGS maintains sensitivity.
0.1 10,000
HNGS Cobalt-60-in. pCi/g
0.1 10,000
HNGS Cesium-137-in. pCi/gD
epth
, ft
10
20
30
40
50
60
Cobalt-60 Activity from 222-S Laboratory Cs-137 Activity from 222-S Laboratory
<
<<
<
<<
<<
<
<<
1. Ellis DV, Perchonok RA, Scott HD and Stoller C:“Adapting Wireline Logging Tools for EnvironmentalLogging Applications,” Transactions of the SPWLA36th Annual Logging Symposium, June 26-29, 1995,Paris, France, paper C.
2. For background on the HNGS: Flanagan WD, Bram-blett RL, Galford JE, Hertzog RC, Plasek RE and Ole-sen JR: “A New Generation Nuclear Logging System,”Transactions of the SPWLA 32nd Annual LoggingSymposium, Midland, Texas, USA, June 16-19, 1991,
[60 m] above the water table. Tank wasteincludes about 250,000 metric tons ofmostly sodium nitrite and nitrate plus 215million Curies of mostly cesium (137Cs) andstrontium (90Sr) and smaller quantities ofvarious metal hydroxides. With time, how-ever, 67 of the 149 single-shelled tanks(none of the 28 double-shelled tanks) haveleaked or are suspected to have leaked. It isnow the responsibility of the US DOE toclean up the site, and the DOE has awardedthe environmental restoration contract toBechtel Hanford Inc. This contract includescleanup of groundwater and soil anddecommissioning of surplus facilities.
If the exact locations of leaked contami-nants are not known, they must be identi-fied cost-effectively before restoration isundertaken. Though several large plumes ofcontaminated groundwater exist beneathHanford, most of the waste intentionally orunintentionally released into the subsurfaceremains in the vadose zone—the partiallysaturated layers above the water table.Observation boreholes drilled in the tankfarms and surrounding areas are air-filledand steel-cased with no cement and norathole. They occasionally contain radioac-tive contamination. Ordinary cased-holelogging tools and interpretation techniquesare ineffective in this environment. Under acooperative research and developmentagreement (CRADA)—initiated and fundedby the Department of Energy—with groupsat the Hanford site, Schlumberger modifiedexisting wireline logging tools and con-ducted extensive computer and laboratorymodeling to calibrate tool responses to theunique operating conditions.1
Autumn 1996
paper Y.
The initial effort focused on modificationof natural gamma ray spectroscopy andneutron porosity tools. The natural gammaray system was aimed at efficient identifica-tion of gamma-emitting waste and litho-logic correlation. Neutron porosity logswere to be used for characterization ofhydrogeologic properties. Specifically, theywould help determine moisture content.Unlike in fully saturated environments,moisture content in unsaturated sedimentsis not equal to porosity (above).
Data quality objectives (DQOs) wereestablished for each of the measurements,based on requirements set by a CRADAcommittee consisting of data users, technol-ogy providers, state and federal regulatoryagency representatives and service com-pany representatives. For natural gammameasurements, the DQOs included opera-tion in high-level radioactive fields andidentification of man-made radioisotopes ofcobalt (60Co) and cesium (137Cs) in additionto naturally occurring radioisotopes tho-rium (Th), uranium (U) and potassium (K)measured during oilwell logging. All con-
centrations were to be reported in pico-Curies per gram (pCi/g).
To achieve these objectives, the HostileNatural Gamma Ray Sonde (HNGS), whichmeasures the energy of incident gammarays with two scintillation detectors, wasadapted to allow interpretation of high lev-els of radioactivity and man-madeisotopes.2 This required modifications to thetool gain regulation system and new meth-ods for constructing elemental standards forcalibration. No 60Co- or 137Cs-rich test for-mations or API test pits were available, asare used for Th, U and K. Calibration wasachieved through measurements in scaledmodels of field conditions built in a labora-tory and combined with Monte Carlo simu-lations for normalization. The sonde wasalso turned upside down so that the detec-tors—now 4 ft [1.3 m] from the bottominstead of 40 ft [13 m]—could log more ofthe borehole. Acceptable comparisons arefound between HNGS-logged values andradioactivity of samples evaluated in thelaboratory (top).
An additional objective of the CRADA wasto measure formation moisture. Withouthuman intervention or natural disturbance,such as earthquakes, waste is assumed tostay where it is placed, discharged or leakedas long as it is not dispersed by fluid flow. If
47
liquid, or moisture, is not present, contami-nants are immobile, and so less likely tomove away from the site. The DQO setaccuracy standards for measuring moisturein formations of up to 40% porosity with12.5%, 30% and 50% of the porosity filledwith water. Standards were also set for mea-surements in beds of different thicknessesand through different casing size. TheAccelerator Porosity Sonde (APS), a neutronporosity tool that emits neutrons and detectsthem again after they have interacted withhydrogen in the formation, was chosen.3
No calibration standards existed for log-ging moisture content, so these had to bedesigned and built. By carefully mixing drypure-quartz sand, SiO2, and aluminum tri-hydrate, Al(OH3)—a dry material containinga known amount of equivalent boundwater—and presettling the mixes on vibrat-ing tables, well understood moisture modelswere created.4 Precision and accuracy ofthe moisture measurements were demon-strated to meet or exceed required specifica-tions in tests on the specially designed cali-bration standards.
The natural gamma and moisture measure-ments were successful, so the CRADA wasextended to develop a through-casing den-sity measurement for porosity determination.The Litho-Density Sonde, an openhole den-sity tool, was altered for this purpose. This
Well Numbering Scheme
Cutaway View of Injection Experiment
Injector well1m
E-7 E-5 E-3 E-1 A-1 A-3 A-5 A-7
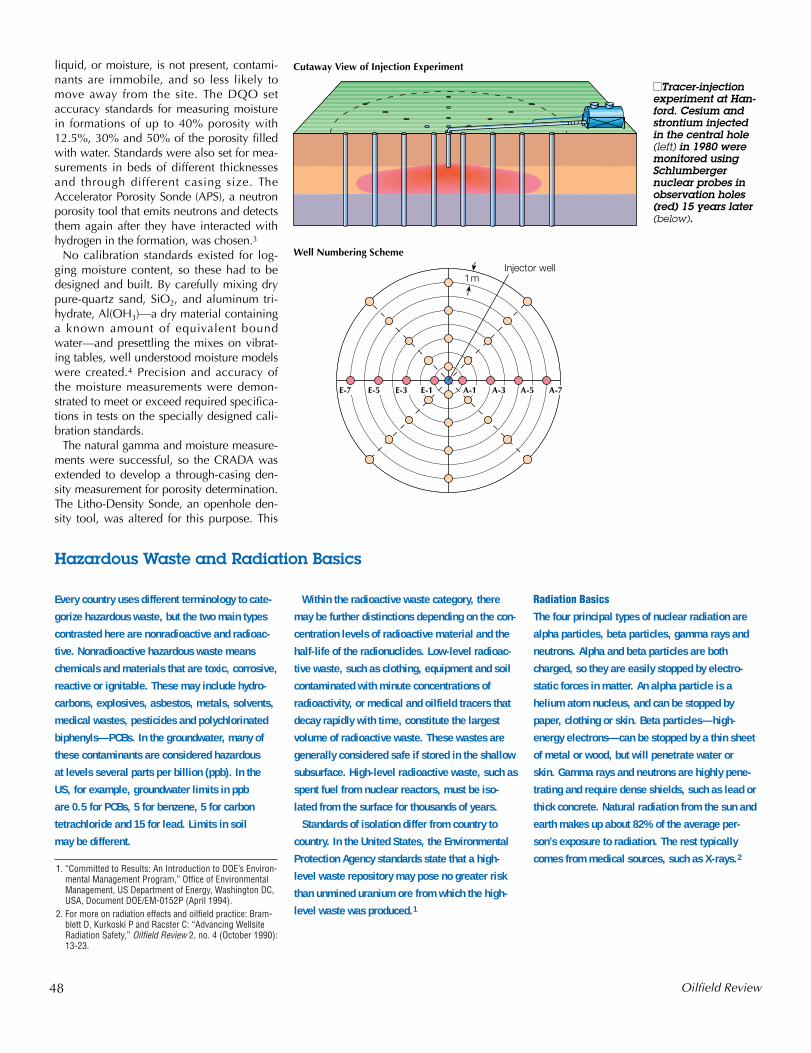
■■Tracer-injectionexperiment at Han-ford. Cesium andstrontium injectedin the central hole(left) in 1980 weremonitored usingSchlumbergernuclear probes inobservation holes(red) 15 years later(below).
48 Oilfield Review
Every country uses different terminology to cate-
gorize hazardous waste, but the two main types
contrasted here are nonradioactive and radioac-
tive. Nonradioactive hazardous waste means
chemicals and materials that are toxic, corrosive,
reactive or ignitable. These may include hydro-
carbons, explosives, asbestos, metals, solvents,
medical wastes, pesticides and polychlorinated
biphenyls—PCBs. In the groundwater, many of
these contaminants are considered hazardous
at levels several parts per billion (ppb). In the
US, for example, groundwater limits in ppb
are 0.5 for PCBs, 5 for benzene, 5 for carbon
tetrachloride and 15 for lead. Limits in soil
may be different.
Within the radioactive waste category, there
may be further distinctions depending on the con-
centration levels of radioactive material and the
half-life of the radionuclides. Low-level radioac-
tive waste, such as clothing, equipment and soil
contaminated with minute concentrations of
radioactivity, or medical and oilfield tracers that
decay rapidly with time, constitute the largest
volume of radioactive waste. These wastes are
generally considered safe if stored in the shallow
subsurface. High-level radioactive waste, such as
spent fuel from nuclear reactors, must be iso-
lated from the surface for thousands of years.
Standards of isolation differ from country to
country. In the United States, the Environmental
Protection Agency standards state that a high-
level waste repository may pose no greater risk
than unmined uranium ore from which the high-
level waste was produced.1
Radiation Basics
The four principal types of nuclear radiation are
alpha particles, beta particles, gamma rays and
neutrons. Alpha and beta particles are both
charged, so they are easily stopped by electro-
static forces in matter. An alpha particle is a
helium atom nucleus, and can be stopped by
paper, clothing or skin. Beta particles—high-
energy electrons—can be stopped by a thin sheet
of metal or wood, but will penetrate water or
skin. Gamma rays and neutrons are highly pene-
trating and require dense shields, such as lead or
thick concrete. Natural radiation from the sun and
earth makes up about 82% of the average per-
son’s exposure to radiation. The rest typically
comes from medical sources, such as X-rays.21. “Committed to Results: An Introduction to DOE’s Environ-
mental Management Program,” Office of EnvironmentalManagement, US Department of Energy, Washington DC,USA, Document DOE/EM-0152P (April 1994).
2. For more on radiation effects and oilfield practice: Bram-blett D, Kurkoski P and Racster C: “Advancing WellsiteRadiation Safety,” Oilfield Review 2, no. 4 (October 1990):13-23.
Hazardous Waste and Radiation Basics
density logging sonde irradiates formationswith medium-energy gamma rays that col-lide with electrons in the formation. Witheach collision, a gamma ray loses some of itsenergy and continues. The reduced-energygamma rays that reach the detector arecounted as an indication of the electron den-sity of the formation.
The Litho-Density algorithm for measuringdensity was calibrated to compensate forcasing and the air gap between casing andformation, since there is no annular fill mate-rial in the Hanford holes. Laboratory experi-ments were conducted at the SchlumbergerEnvironmental Effects Calibration Facility inHouston, Texas, USA to verify that the newalgorithm performed within the data qualityobjectives set by the CRADA committee.
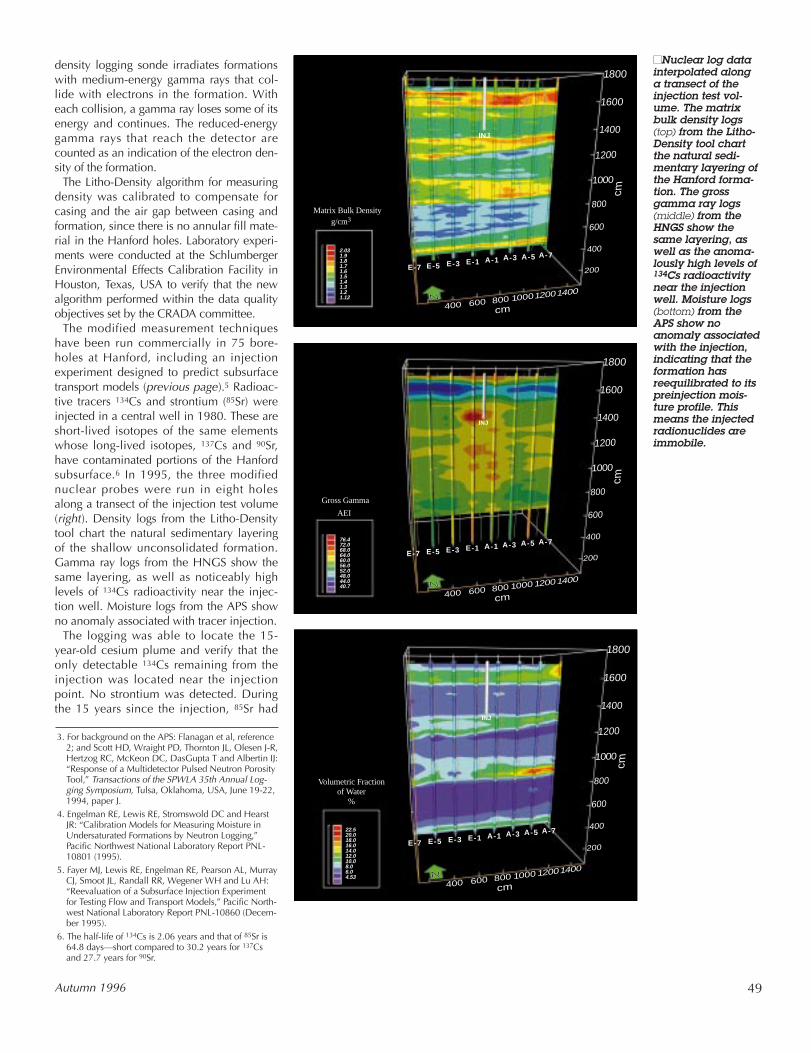
The modified measurement techniqueshave been run commercially in 75 bore-holes at Hanford, including an injectionexperiment designed to predict subsurfacetransport models (previous page).5 Radioac-tive tracers 134Cs and strontium (85Sr) wereinjected in a central well in 1980. These areshort-lived isotopes of the same elementswhose long-lived isotopes, 137Cs and 90Sr,have contaminated portions of the Hanfordsubsurface.6 In 1995, the three modifiednuclear probes were run in eight holesalong a transect of the injection test volume(right). Density logs from the Litho-Densitytool chart the natural sedimentary layeringof the shallow unconsolidated formation.Gamma ray logs from the HNGS show thesame layering, as well as noticeably highlevels of 134Cs radioactivity near the injec-tion well. Moisture logs from the APS showno anomaly associated with tracer injection.
The logging was able to locate the 15-year-old cesium plume and verify that theonly detectable 134Cs remaining from theinjection was located near the injectionpoint. No strontium was detected. Duringthe 15 years since the injection, 85Sr had
■■Nuclear log datainterpolated alonga transect of theinjection test vol-ume. The matrixbulk density logs(top) from the Litho-Density tool chartthe natural sedi-mentary layering ofthe Hanford forma-tion. The grossgamma ray logs(middle) from theHNGS show thesame layering, aswell as the anoma-lously high levels of134Cs radioactivitynear the injectionwell. Moisture logs(bottom) from theAPS show noanomaly associatedwith the injection,indicating that theformation hasreequilibrated to itspreinjection mois-ture profile. Thismeans the injectedradionuclides areimmobile.
Matrix Bulk Density g/cm3
2.031.91.81.71.61.51.41.31.21.12
E-7 E-5 E-3 E-1 A-1 A-3 A-5 A-7
400 600 800cm
100012001400N
200
400
600
800
1000
cm
1400
1200
1600
1800
INJ
Gross Gamma
AEI
76.472.068.064.060.056.052.048.044.040.7
E-7 E-5 E-3 E-1 A-1 A-3 A-5 A-7
400 600 800cm
100012001400N
200
400
600
800
1000
cm
1400
1200
1600
1800
INJ
Volumetric Fractionof Water
%
22.520.018.016.014.012.010.08.06.04.53
E-7 E-5 E-3 E-1 A-1 A-3 A-5 A-7
400 600 800cm
1000 12001400N
200
400
600
800
1000
cm
1400
1200
1600
1800
INJ
49Autumn 1996
3. For background on the APS: Flanagan et al, reference2; and Scott HD, Wraight PD, Thornton JL, Olesen J-R,Hertzog RC, McKeon DC, DasGupta T and Albertin IJ:“Response of a Multidetector Pulsed Neutron PorosityTool,” Transactions of the SPWLA 35th Annual Log-ging Symposium, Tulsa, Oklahoma, USA, June 19-22,1994, paper J.
4. Engelman RE, Lewis RE, Stromswold DC and HearstJR: “Calibration Models for Measuring Moisture inUndersaturated Formations by Neutron Logging,”Pacific Northwest National Laboratory Report PNL-10801 (1995).
5. Fayer MJ, Lewis RE, Engelman RE, Pearson AL, MurrayCJ, Smoot JL, Randall RR, Wegener WH and Lu AH:“Reevaluation of a Subsurface Injection Experimentfor Testing Flow and Transport Models,” Pacific North-west National Laboratory Report PNL-10860 (Decem-ber 1995).
6. The half-life of 134Cs is 2.06 years and that of 85Sr is64.8 days—short compared to 30.2 years for 137Csand 27.7 years for 90Sr.
decayed to less than 0.01% of the originalamount, and 134Cs to less than 1%. The factthat after 15 years Cs was detected onlynear the injection point is an indication ofthe high sorption potential in the sediments.
In another part of the Hanford facility, at theN reactor site near the river, Bechtel Hanfordhas recently completed a limited field investi-gation of two radioactive liquid waste dis-posal facilities (LWDFs). An LWDF is an engi-neered soil-column waste disposal systemdesigned for reactor effluent disposal. Startingin 1963, demineralized Columbia River cool-ing water was run through the N reactor.Sometimes the cooling water became con-taminated with radioactive waste products.This water was discharged into LWDFs up tomillions of gallons per day. From there it per-colated through surface layers, and most ofthe contaminants were retained in the soilcolumn. Tritium and strontium were amongthose contaminants that reached the ground-water and eventually contaminated someriver bank seeps—known as the N-springs. Asecond facility was constructed farther fromthe river in 1985, but contamination in thegroundwater and N-springs remained. Cur-rently a “pump and treat” process has beenimplemented to protect the Columbia Riverfrom contaminant migration. Contaminantsare pumped, or extracted, for treatment at thesurface. Bechtel and Battelle Pacific North-west National Laboratory (PNNL) are investi-gating permeable barriers for long-term pro-tection of the river (see “ContainingContaminants,” next page).
To design a remediation program, Bechtelmust locate and quantify the volume of con-taminated soil and groundwater in a cost-effective way. Usually, subsurface samplesare collected and analyzed to help charac-terize the contaminated volume. The use ofwell logs enhances the characterization bygiving continuous readings with depth,reduces worker exposure to contaminants,and helps keep costs down. In one area, thecost of a multimillion-dollar characteriza-tion program was cut in half by optimizingthe drilling and sampling plan and supple-menting it with logs.
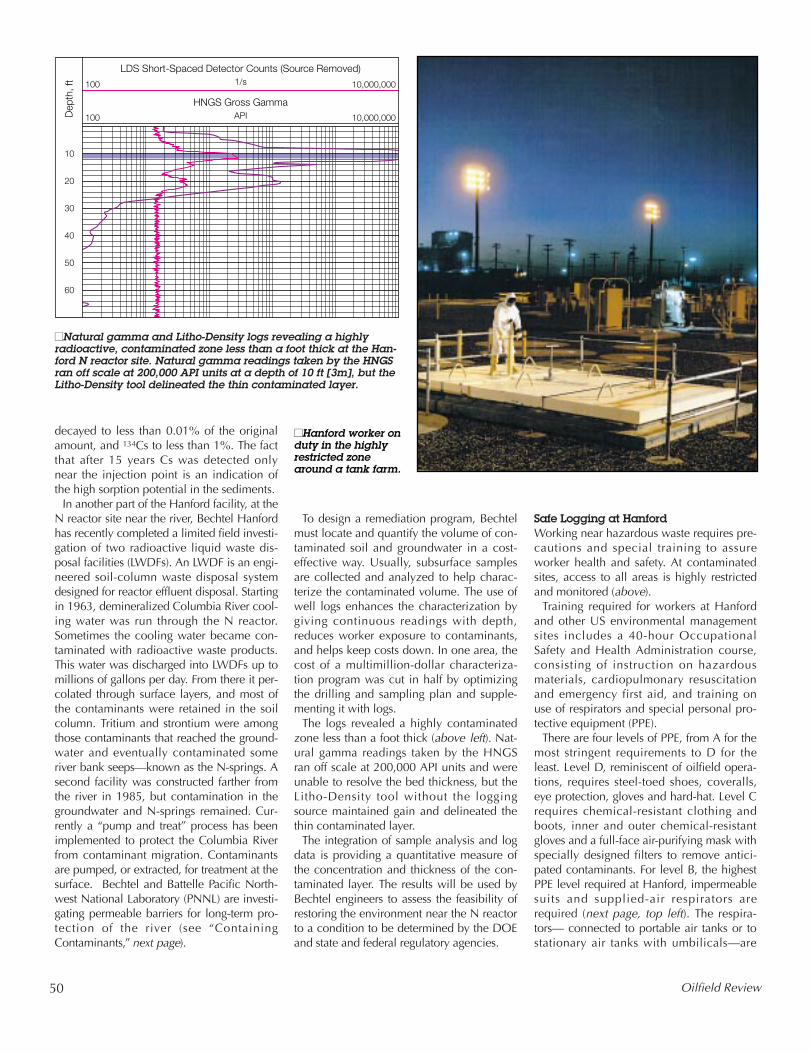
The logs revealed a highly contaminatedzone less than a foot thick (above left). Nat-ural gamma readings taken by the HNGSran off scale at 200,000 API units and wereunable to resolve the bed thickness, but theLitho-Density tool without the loggingsource maintained gain and delineated thethin contaminated layer.
The integration of sample analysis and logdata is providing a quantitative measure ofthe concentration and thickness of the con-taminated layer. The results will be used byBechtel engineers to assess the feasibility ofrestoring the environment near the N reactorto a condition to be determined by the DOEand state and federal regulatory agencies.
50 Oilfield Review
Dep
th, f
t
10
20
30
40
50
60
100 10,000,000
HNGS Gross GammaAPI
100 10,000,000
LDS Short-Spaced Detector Counts (Source Removed)1/s
■■Natural gamma and Litho-Density logs revealing a highlyradioactive, contaminated zone less than a foot thick at the Han-ford N reactor site. Natural gamma readings taken by the HNGSran off scale at 200,000 API units at a depth of 10 ft [3m], but theLitho-Density tool delineated the thin contaminated layer.
Safe Logging at HanfordWorking near hazardous waste requires pre-cautions and special training to assureworker health and safety. At contaminatedsites, access to all areas is highly restrictedand monitored (above).
Training required for workers at Hanfordand other US environmental managementsites includes a 40-hour OccupationalSafety and Health Administration course,consisting of instruction on hazardousmaterials, cardiopulmonary resuscitationand emergency first aid, and training onuse of respirators and special personal pro-tective equipment (PPE).
There are four levels of PPE, from A for themost stringent requirements to D for theleast. Level D, reminiscent of oilfield opera-tions, requires steel-toed shoes, coveralls,eye protection, gloves and hard-hat. Level Crequires chemical-resistant clothing andboots, inner and outer chemical-resistantgloves and a full-face air-purifying mask withspecially designed filters to remove antici-pated contaminants. For level B, the highestPPE level required at Hanford, impermeablesuits and supplied-air respirators arerequired (next page, top left). The respira-tors— connected to portable air tanks or tostationary air tanks with umbilicals—are
■■Hanford worker onduty in the highlyrestricted zonearound a tank farm.
51Autumn 1996
necessary for work at Hanford where theexact combination of contaminants to beencountered is unknown. Level A, an abso-lutely impermeable “moon-suit,” is requiredwhen there is risk of contaminants that canbe absorbed through the skin.
On-site health and radiation protectiontechnologists caution workers on all aspectsof job safety. Typically the biggest health riskto Hanford workers is overheating broughton by the cumbersome protective equipmentand the high summer temperatures—inexcess of 100°F [38°C]. The technologists’role ranges from reminders about bringingwater to drink when it’s hot out and whereworkers can sit during lunch breaks, to mon-itoring tools for contamination as they comeout of the hole. Any tool found with thesmallest amount of contamination is wipedclean, and the contaminated cloth disposedof in an impermeable barrel stored on site.
Field crew at the Schlumberger Wireline &Testing division in Bakersfield, California,USA who work at the Hanford site, andthose at the division in Charleston, West Vir-ginia, USA—in preparation for work at theSavannah River site in South Carolina,USA—have completed training required forlogging hazardous waste sites.7
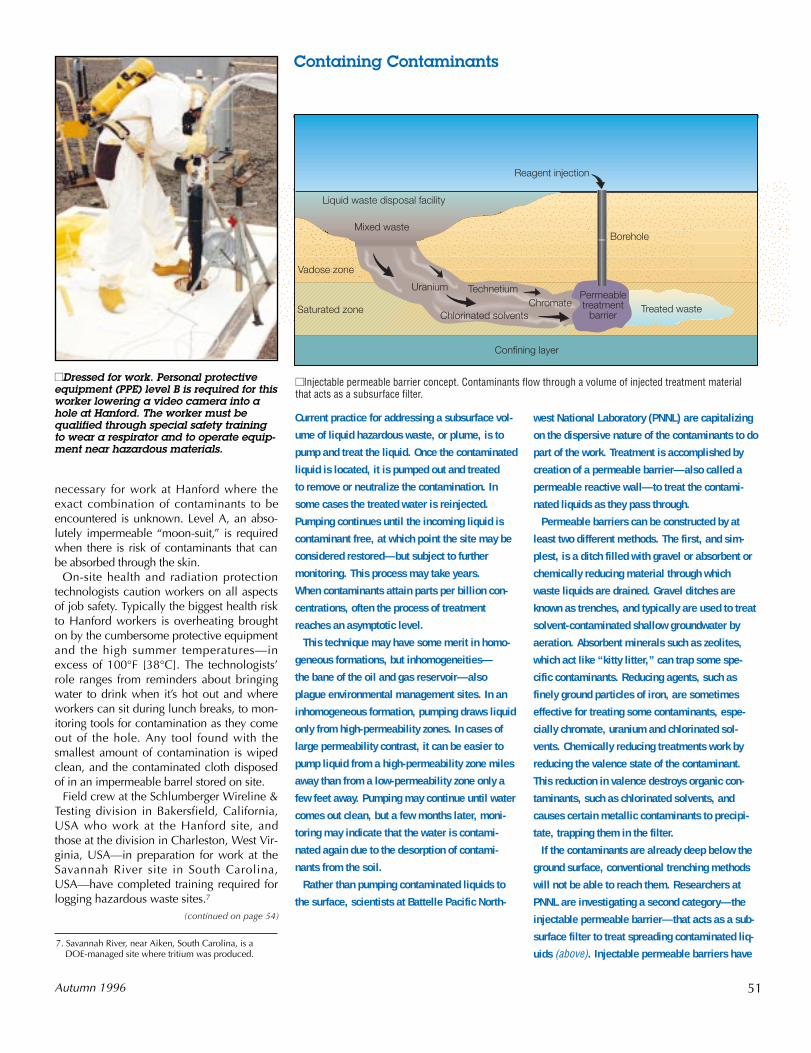
■■Injectable permeable barrier concept. Contaminants flow through a volume of injected treatment materialthat acts as a subsurface filter.
���������������������������� ���� �yyyyyyyyyyzzzzzzzzzzzz{{{{{| |||| |
Mixed waste
Liquid waste disposal facility
Reagent injection
Vadose zone
Borehole
Treated waste
Confining layer
Saturated zone
Uranium TechnetiumChromate
Chlorinated solvents
Permeabletreatment
barrier
Containing Contaminants
Current practice for addressing a subsurface vol-
ume of liquid hazardous waste, or plume, is to
pump and treat the liquid. Once the contaminated
liquid is located, it is pumped out and treated
to remove or neutralize the contamination. In
some cases the treated water is reinjected.
Pumping continues until the incoming liquid is
contaminant free, at which point the site may be
considered restored—but subject to further
monitoring. This process may take years.
When contaminants attain parts per billion con-
centrations, often the process of treatment
reaches an asymptotic level.
This technique may have some merit in homo-
geneous formations, but inhomogeneities—
the bane of the oil and gas reservoir—also
plague environmental management sites. In an
inhomogeneous formation, pumping draws liquid
only from high-permeability zones. In cases of
large permeability contrast, it can be easier to
pump liquid from a high-permeability zone miles
away than from a low-permeability zone only a
few feet away. Pumping may continue until water
comes out clean, but a few months later, moni-
toring may indicate that the water is contami-
nated again due to the desorption of contami-
nants from the soil.
Rather than pumping contaminated liquids to
the surface, scientists at Battelle Pacific North-
west National Laboratory (PNNL) are capitalizing
on the dispersive nature of the contaminants to do
part of the work. Treatment is accomplished by
creation of a permeable barrier—also called a
permeable reactive wall—to treat the contami-
nated liquids as they pass through.
Permeable barriers can be constructed by at
least two different methods. The first, and sim-
plest, is a ditch filled with gravel or absorbent or
chemically reducing material through which
waste liquids are drained. Gravel ditches are
known as trenches, and typically are used to treat
solvent-contaminated shallow groundwater by
aeration. Absorbent minerals such as zeolites,
which act like “kitty litter,” can trap some spe-
cific contaminants. Reducing agents, such as
finely ground particles of iron, are sometimes
effective for treating some contaminants, espe-
cially chromate, uranium and chlorinated sol-
vents. Chemically reducing treatments work by
reducing the valence state of the contaminant.
This reduction in valence destroys organic con-
taminants, such as chlorinated solvents, and
causes certain metallic contaminants to precipi-
tate, trapping them in the filter.
If the contaminants are already deep below the
ground surface, conventional trenching methods
will not be able to reach them. Researchers at
PNNL are investigating a second category—the
injectable permeable barrier—that acts as a sub-
surface filter to treat spreading contaminated liq-
uids (above). Injectable permeable barriers have
■■Dressed for work. Personal protectiveequipment (PPE) level B is required for thisworker lowering a video camera into ahole at Hanford. The worker must bequalified through special safety trainingto wear a respirator and to operate equip-ment near hazardous materials.
7. Savannah River, near Aiken, South Carolina, is aDOE-managed site where tritium was produced.
(continued on page 54)
been tested in the laboratory and in pilot-scale
field experiments at Hanford. In addition to
absorbent filters and chemical-reducing materi-
als, iron-reducing bacterial treatments—
similar to those applied in the oil field to treat
sour wells—have been tested.
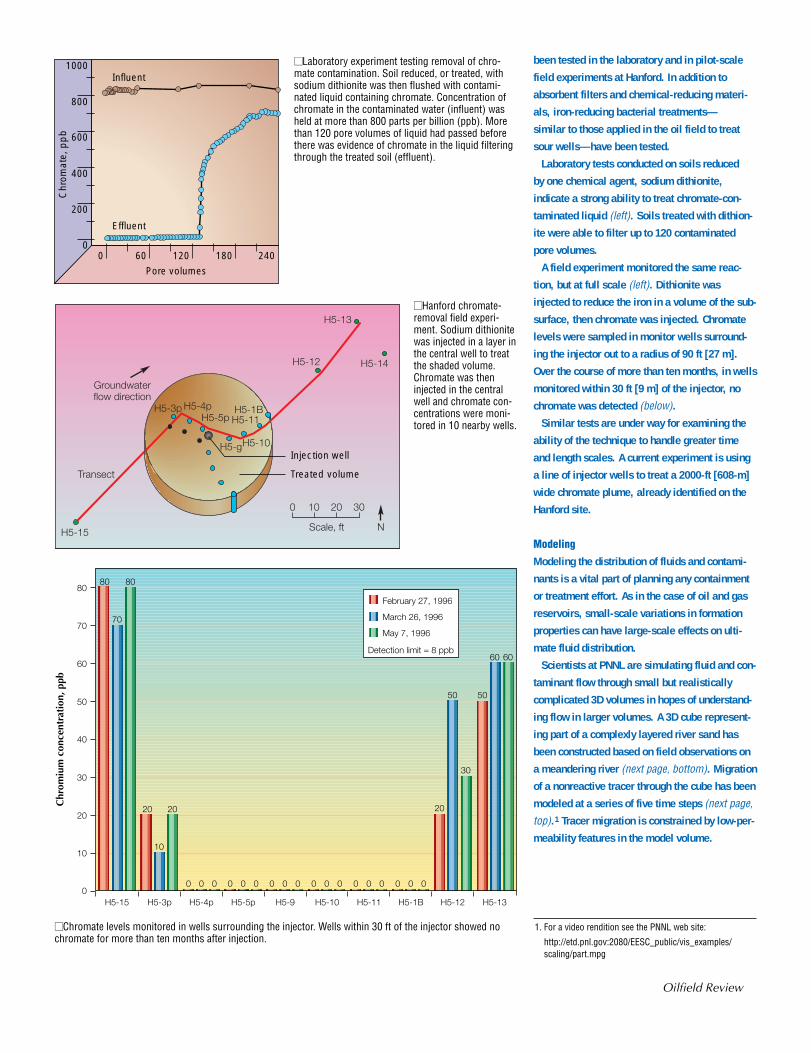
Laboratory tests conducted on soils reduced
by one chemical agent, sodium dithionite,
indicate a strong ability to treat chromate-con-
taminated liquid (left). Soils treated with dithion-
ite were able to filter up to 120 contaminated
pore volumes.
A field experiment monitored the same reac-
tion, but at full scale (left). Dithionite was
injected to reduce the iron in a volume of the sub-
surface, then chromate was injected. Chromate
levels were sampled in monitor wells surround-
ing the injector out to a radius of 90 ft [27 m].
Over the course of more than ten months, in wells
monitored within 30 ft [9 m] of the injector, no
chromate was detected (below).Similar tests are under way for examining the
ability of the technique to handle greater time
and length scales. A current experiment is using
a line of injector wells to treat a 2000-ft [608-m]
wide chromate plume, already identified on the
Hanford site.
Modeling
Modeling the distribution of fluids and contami-
nants is a vital part of planning any containment
or treatment effort. As in the case of oil and gas
reservoirs, small-scale variations in formation
properties can have large-scale effects on ulti-
mate fluid distribution.
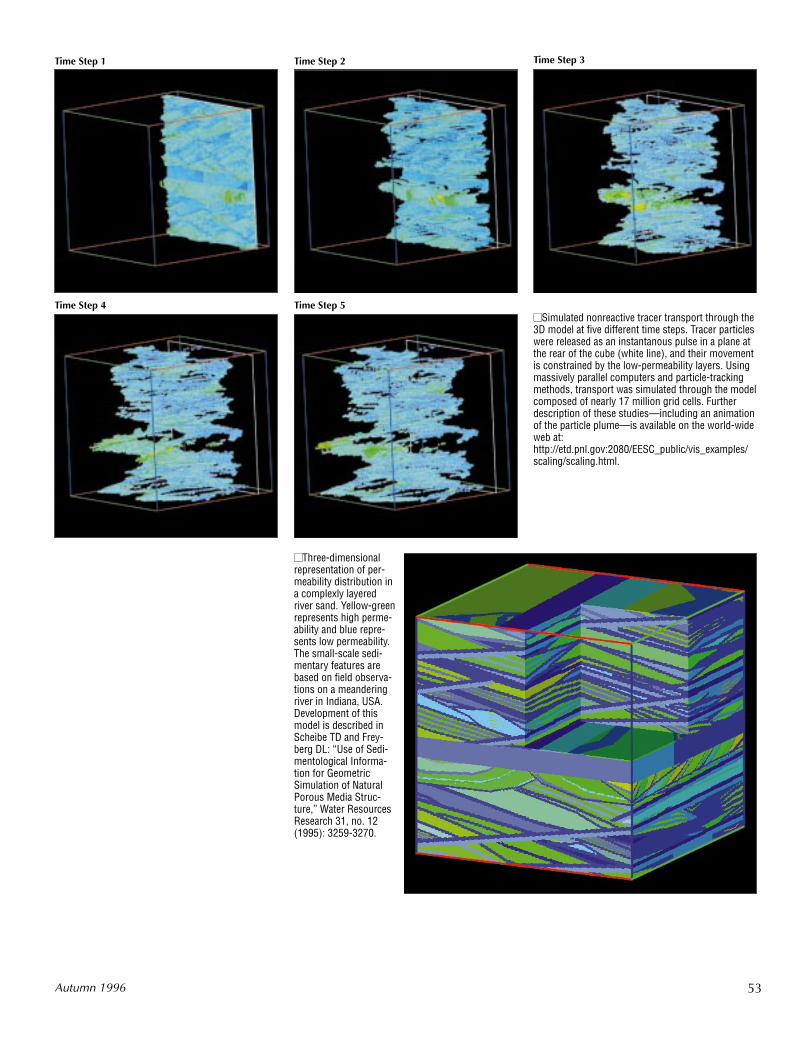
Scientists at PNNL are simulating fluid and con-
taminant flow through small but realistically
complicated 3D volumes in hopes of understand-
ing flow in larger volumes. A 3D cube represent-
ing part of a complexly layered river sand has
been constructed based on field observations on
a meandering river (next page, bottom). Migration
of a nonreactive tracer through the cube has been
modeled at a series of five time steps (next page,top).1 Tracer migration is constrained by low-per-
meability features in the model volume.
Oilfield Review
Groundwaterflow direction
Injection well
Treated volumeTransect
H5-3p H5-4pH5-5p
H5-10
H5-11H5-1B
H5-12
H5-13
H5-14
0 10
Scale, ft N
20 30
H5-g
H5-15
February 27, 1996
March 26, 1996
May 7, 1996
Detection limit = 8 ppb
0
10
H5-15
20
30
40
50
60
70
80
Chr
omiu
m c
once
ntra
tion
, ppb
H5-3p H5-4p H5-5p H5-9 H5-10 H5-11 H5-1B H5-12 H5-13
0 0 0 0 0 0 0 0 0 0 0 0 0 0 0 0 0 0
20
30
50 50
60 60
80
70
80
20 20
10
■■Hanford chromate-removal field experi-ment. Sodium dithionitewas injected in a layer inthe central well to treatthe shaded volume.Chromate was theninjected in the centralwell and chromate con-centrations were moni-tored in 10 nearby wells.
■■Chromate levels monitored in wells surrounding the injector. Wells within 30 ft of the injector showed nochromate for more than ten months after injection.
1. For a video rendition see the PNNL web site:
http://etd.pnl.gov:2080/EESC_public/vis_examples/scaling/part.mpg
■■Laboratory experiment testing removal of chro-mate contamination. Soil reduced, or treated, withsodium dithionite was then flushed with contami-nated liquid containing chromate. Concentration ofchromate in the contaminated water (influent) washeld at more than 800 parts per billion (ppb). Morethan 120 pore volumes of liquid had passed beforethere was evidence of chromate in the liquid filteringthrough the treated soil (effluent).
Influent
Effluent
Chr
omat
e, p
pb
Pore volumes
2401801206000
200
400
600
800
1000
53Autumn 1996
■■Three-dimensionalrepresentation of per-meability distribution ina complexly layeredriver sand. Yellow-greenrepresents high perme-ability and blue repre-sents low permeability.The small-scale sedi-mentary features arebased on field observa-tions on a meanderingriver in Indiana, USA.Development of thismodel is described inScheibe TD and Frey-berg DL: “Use of Sedi-mentological Informa-tion for GeometricSimulation of NaturalPorous Media Struc-ture,” Water ResourcesResearch 31, no. 12(1995): 3259-3270.
■■Simulated nonreactive tracer transport through the3D model at five different time steps. Tracer particleswere released as an instantanous pulse in a plane atthe rear of the cube (white line), and their movementis constrained by the low-permeability layers. Usingmassively parallel computers and particle-trackingmethods, transport was simulated through the modelcomposed of nearly 17 million grid cells. Furtherdescription of these studies—including an animationof the particle plume—is available on the world-wideweb at:http://etd.pnl.gov:2080/EESC_public/vis_examples/scaling/scaling.html.
Time Step 1
Time Step 4 Time Step 5
Time Step 2 Time Step 3

8. “Going Underground,” United Kingdom Nirex Lim-ited, Harwell, Oxford, England (November 1993).
9. Chaplow R: “The Geology and Hydrogeology of Sellafield: An Overview,” Quarterly Journal of Engi-neering Geology 29 (1996): S1- S12.
10. Michie U: “The Geological Framework of the Sellafield Area and Its Relationship to Hydrogeol-ogy,” Quarterly Journal of Engineering Geology 29(1996): S13-S27.
11. For a description of the technique: Hornby BE, LuthiSM and Plumb RA: “Comparison of Fracture Aper-tures Computed from Electrical Borehole Scans andReflected Stoneley Waves: An Integrated Interpreta-tion,” The Log Analyst 23, no. 1 (January-February1992): 50-66.
■■Sellafield—concept for a UK national facility for solid intermediate-level and low-level radioactive waste. Geological and hydrologic investigations are under way todetermine whether the site is suitable as a deep repository.
Characterization Before StorageA primary lesson learned from the restora-tion of sites contaminated with hazardousmaterials is that future waste storage facili-ties must be engineered with care. Countriesthat rely on nuclear energy are taking a hardlook at how to manage the inevitable wasteproducts. Most countries plan deep under-ground repositories, and the search contin-ues for the best locations.
The goal is to isolate hazardous materialfrom the surface for tens of thousands of
54
years—no small task. The subsurface vol-ume selected should be an effective shield,remain tectonically stable, reduce contact ofwaste with groundwater and air, and con-tain no useful mineral resources that wouldtempt human intervention. The storage facil-ity should allow for retrieval of the waste atsuch time that technologies become avail-able for treatment. Some countries, includ-ing Belgium, Finland, France, Germany,Sweden, Switzerland, the UK and the USAhave identified locations that appear to havemany of the desired qualities.8
In the UK, United Kingdom Nirex Limited(Nirex) is responsible for providing and man-
aging a national facility for undergroundstorage of solid intermediate- and some low-level radioactive waste. Geologic and hydro-logic investigations have been in progressaround Sellafield in West Cumbria, Englandsince 1989, to determine whether a siteadjacent to the existing nuclear establish-ment is suitable for a deep repository (left).9
Groundwater is the most likely medium bywhich radioactive waste from a repositorycould return to the surface. Controls ongroundwater flow include driving forces,such as gravity and salinity, and also thegeometry of rock units and properties of therock mass, such as permeability and fracturecharacteristics.10
The building blocks for the geological sitecharacterization consist of 27 deep bore-holes, some down to 1900 m [6200 ft] andthe majority with continuous core; 2000 km[1250 miles] of 2D seismic data and 8000km [5000 miles] of airborne geophysicaldata. Hydrogeological testing and ground-water sampling provide additional informa-tion on flow properties of the volcanic for-mation targeted for study.
A volume of the Borrowdale VolcanicGroup at about 650 m [2133 ft] below sealevel, is under consideration as an under-ground laboratory, or rock characterizationfacility (RCF). The RCF is being constructedto permit detailed examination and testingof rock at depth before selecting a finalrepository design and location. Investiga-tions have shown that groundwater flowwithin the volcanic formations occursthrough a limited number of fractures, andcurrent work focuses on characterizinghydrogeologically significant fractures.
Many techniques developed to identifyand characterize fractures in the oil field areplaying the same role at Sellafield. Integra-tion of several measurements at many scalesis essential for determining which fracturesare open and connected. At the finest scale,electrical conductivity logs of the borehole
Oilfield Review
5321
5322
5323
5324
-5
0
5-5
0
5
Dep
th, f
t
5325
5320
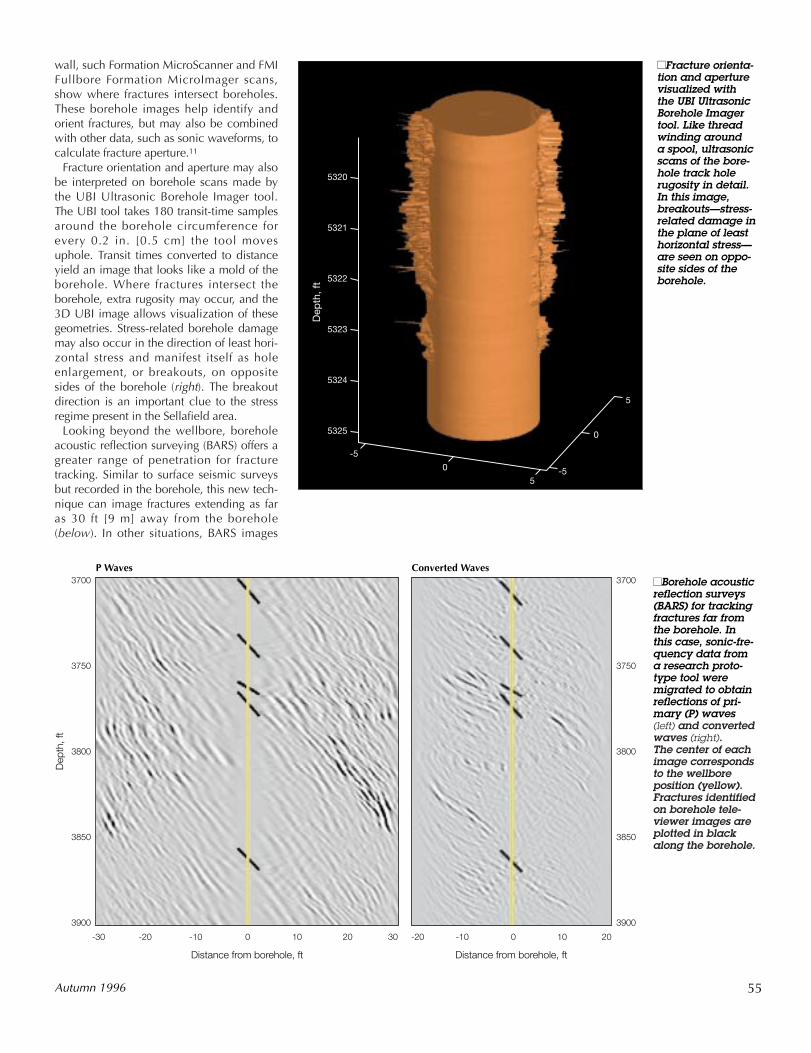
■■Fracture orienta-tion and aperturevisualized with the UBI Ultrasonic Borehole Imagertool. Like threadwinding around a spool, ultrasonicscans of the bore-hole track holerugosity in detail.In this image,breakouts—stress-related damage inthe plane of leasthorizontal stress—are seen on oppo-site sides of theborehole.
wall, such Formation MicroScanner and FMIFullbore Formation MicroImager scans,show where fractures intersect boreholes.These borehole images help identify andorient fractures, but may also be combinedwith other data, such as sonic waveforms, tocalculate fracture aperture.11
Fracture orientation and aperture may alsobe interpreted on borehole scans made bythe UBI Ultrasonic Borehole Imager tool.The UBI tool takes 180 transit-time samplesaround the borehole circumference forevery 0.2 in. [0.5 cm] the tool movesuphole. Transit times converted to distanceyield an image that looks like a mold of theborehole. Where fractures intersect theborehole, extra rugosity may occur, and the3D UBI image allows visualization of thesegeometries. Stress-related borehole damagemay also occur in the direction of least hori-zontal stress and manifest itself as holeenlargement, or breakouts, on oppositesides of the borehole (right). The breakoutdirection is an important clue to the stressregime present in the Sellafield area.
Looking beyond the wellbore, boreholeacoustic reflection surveying (BARS) offers agreater range of penetration for fracturetracking. Similar to surface seismic surveysbut recorded in the borehole, this new tech-nique can image fractures extending as faras 30 ft [9 m] away from the borehole(below). In other situations, BARS images
55Autumn 1996
■■Borehole acousticreflection surveys(BARS) for trackingfractures far fromthe borehole. Inthis case, sonic-fre-quency data froma research proto-type tool weremigrated to obtainreflections of pri-mary (P) waves(left) and convertedwaves (right). The center of eachimage correspondsto the wellboreposition (yellow).Fractures identifiedon borehole tele-viewer images areplotted in blackalong the borehole.
Dep
th, f
t
Distance from borehole, ft
3700
3750
3800
3850
3900
-30 -20 -10 0 10 20 30 -20 -10 0 10 20
3700
3750
3800
3850
3900
Distance from borehole, ft
P Waves Converted Waves
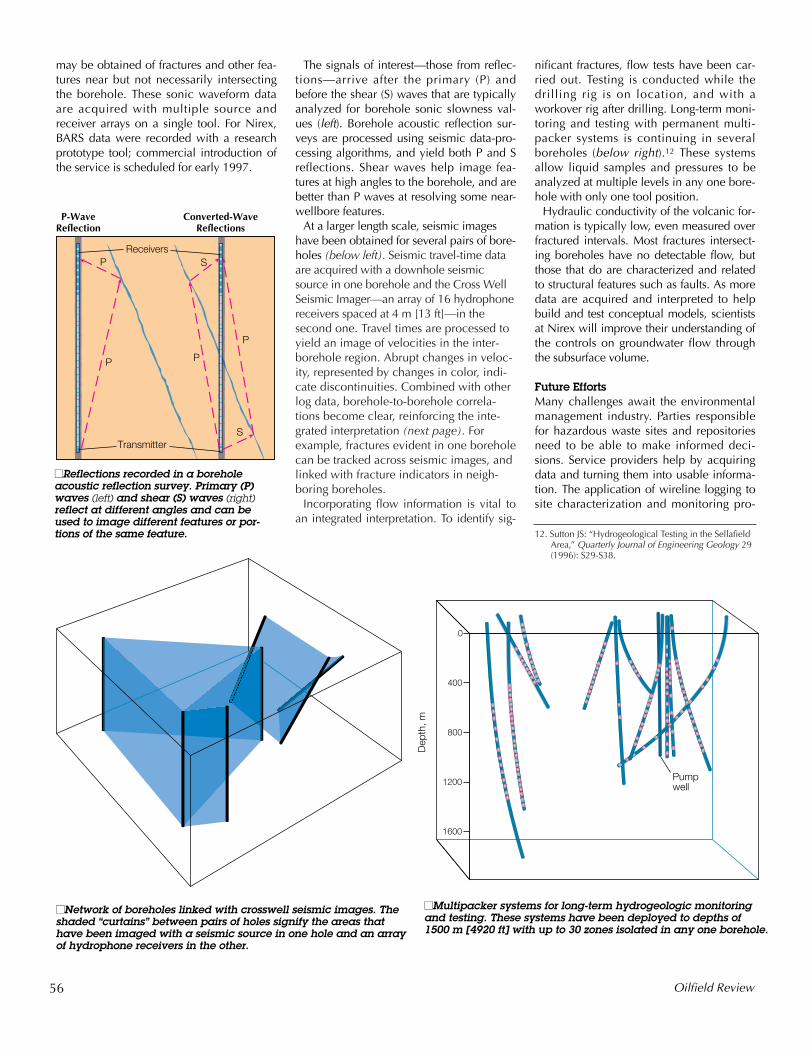
may be obtained of fractures and other fea-tures near but not necessarily intersectingthe borehole. These sonic waveform dataare acquired with multiple source andreceiver arrays on a single tool. For Nirex,BARS data were recorded with a researchprototype tool; commercial introduction ofthe service is scheduled for early 1997.
56
P
P
S
S
P
P
Receivers
Transmitter
P-WaveReflection
Converted-WaveReflections
■■Reflections recorded in a boreholeacoustic reflection survey. Primary (P)waves (left) and shear (S) waves (right)reflect at different angles and can beused to image different features or por-tions of the same feature. 12. Sutton JS: “Hydrogeological Testing in the Sellafield
■■Network of boreholes linked with crosswell shaded “curtains” between pairs of holes signhave been imaged with a seismic source in oof hydrophone receivers in the other.
The signals of interest—those from reflec-tions—arrive after the primary (P) andbefore the shear (S) waves that are typicallyanalyzed for borehole sonic slowness val-ues (left). Borehole acoustic reflection sur-veys are processed using seismic data-pro-cessing algorithms, and yield both P and Sreflections. Shear waves help image fea-tures at high angles to the borehole, and arebetter than P waves at resolving some near-wellbore features.
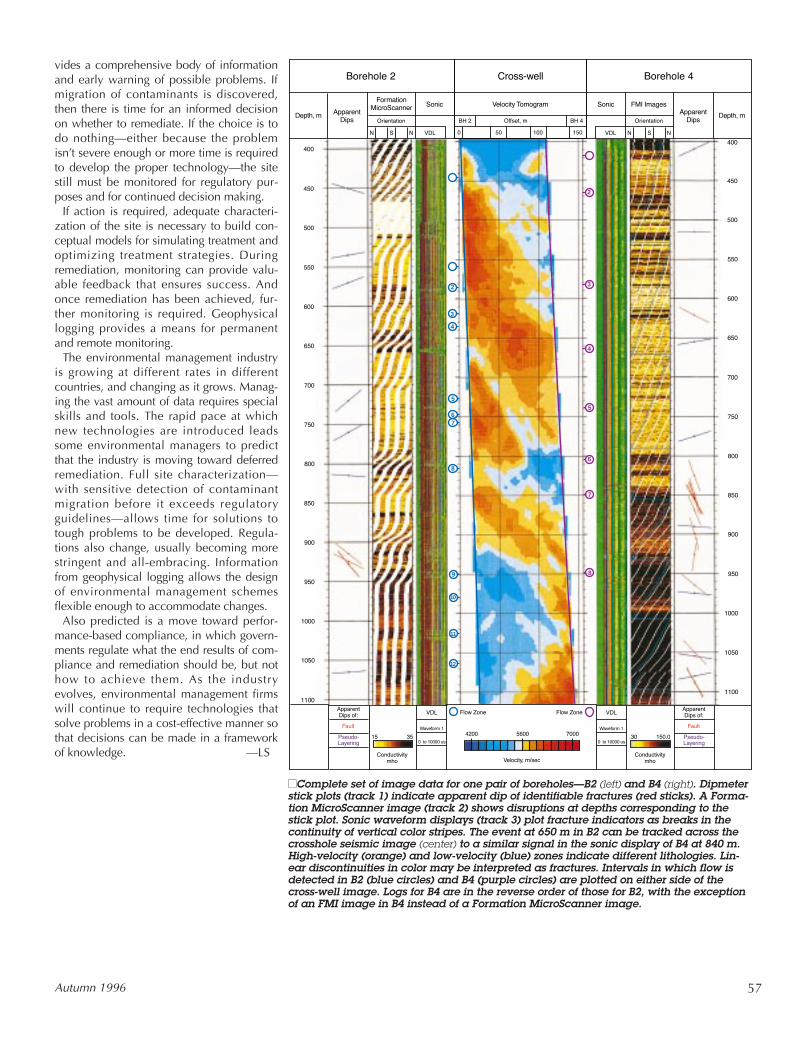
At a larger length scale, seismic imageshave been obtained for several pairs of bore-holes (below left). Seismic travel-time dataare acquired with a downhole seismicsource in one borehole and the Cross WellSeismic Imager—an array of 16 hydrophonereceivers spaced at 4 m [13 ft]—in thesecond one. Travel times are processed toyield an image of velocities in the inter-borehole region. Abrupt changes in veloc-ity, represented by changes in color, indi-cate discontinuities. Combined with otherlog data, borehole-to-borehole correla-tions become clear, reinforcing the inte-grated interpretation (next page). Forexample, fractures evident in one boreholecan be tracked across seismic images, andlinked with fracture indicators in neigh-boring boreholes.
Incorporating flow information is vital toan integrated interpretation. To identify sig-
0
400
800
1200
1600
Dep
th, m
■■Multipacker systemand testing. These s1500 m [4920 ft] wit
seismic images. Theify the areas thatne hole and an array
nificant fractures, flow tests have been car-ried out. Testing is conducted while thedrilling rig is on location, and with aworkover rig after drilling. Long-term moni-toring and testing with permanent multi-packer systems is continuing in severalboreholes (below right).12 These systemsallow liquid samples and pressures to beanalyzed at multiple levels in any one bore-hole with only one tool position.
Hydraulic conductivity of the volcanic for-mation is typically low, even measured overfractured intervals. Most fractures intersect-ing boreholes have no detectable flow, butthose that do are characterized and relatedto structural features such as faults. As moredata are acquired and interpreted to helpbuild and test conceptual models, scientistsat Nirex will improve their understanding ofthe controls on groundwater flow throughthe subsurface volume.
Future EffortsMany challenges await the environmentalmanagement industry. Parties responsiblefor hazardous waste sites and repositoriesneed to be able to make informed deci-sions. Service providers help by acquiringdata and turning them into usable informa-tion. The application of wireline logging tosite characterization and monitoring pro-
Oilfield Review
Pumpwell
s for long-term hydrogeologic monitoringystems have been deployed to depths of h up to 30 zones isolated in any one borehole.
Area,” Quarterly Journal of Engineering Geology 29(1996): S29-S38.
SonicFormation�
MicroScannerApparent�
DipsApparent�
Dips
FMI Images
450
500
550
600
650
700
750
800
850
900
950
1000
1050
1100
400
450
500
550
600
650
700
750
800
850
900
950
1000
1050
1100
400
Velocity Tomogram
OrientationDepth, m Depth, m
Orientation
1500 50VDLNSN
Sonic
VDL N S N100
BH 2 BH 4Offset, m
Cross-well Borehole 4Borehole 2
Fault
15 35
Apparent�Dips of:
Pseudo-�Layering
Fault
Apparent�Dips of:
Pseudo-�Layering
Conductivity�mho
.30 150.0
Conductivity�mho
Flow Zone
4200 70005600
Flow Zone VDL
Velocity, m/sec
Waveform 1
0 to 10000 us
VDL
Waveform 1
0 to 10000 us
2
3
4
5
67
8
9
10
11
12
2
3
4
5
6
7
8
vides a comprehensive body of informationand early warning of possible problems. Ifmigration of contaminants is discovered,then there is time for an informed decisionon whether to remediate. If the choice is todo nothing—either because the problemisn’t severe enough or more time is requiredto develop the proper technology—the sitestill must be monitored for regulatory pur-poses and for continued decision making.
If action is required, adequate characteri-zation of the site is necessary to build con-ceptual models for simulating treatment andoptimizing treatment strategies. Duringremediation, monitoring can provide valu-able feedback that ensures success. Andonce remediation has been achieved, fur-ther monitoring is required. Geophysicallogging provides a means for permanentand remote monitoring.
The environmental management industryis growing at different rates in differentcountries, and changing as it grows. Manag-ing the vast amount of data requires specialskills and tools. The rapid pace at whichnew technologies are introduced leadssome environmental managers to predictthat the industry is moving toward deferredremediation. Full site characterization—with sensitive detection of contaminantmigration before it exceeds regulatoryguidelines—allows time for solutions totough problems to be developed. Regula-tions also change, usually becoming morestringent and all-embracing. Informationfrom geophysical logging allows the designof environmental management schemesflexible enough to accommodate changes.
Also predicted is a move toward perfor-mance-based compliance, in which govern-ments regulate what the end results of com-pliance and remediation should be, but nothow to achieve them. As the industryevolves, environmental management firmswill continue to require technologies thatsolve problems in a cost-effective manner sothat decisions can be made in a frameworkof knowledge. —LS
57Autumn 1996
■■Complete set of image data for one pair of boreholes—B2 (left) and B4 (right). Dipmeterstick plots (track 1) indicate apparent dip of identifiable fractures (red sticks). A Forma-tion MicroScanner image (track 2) shows disruptions at depths corresponding to thestick plot. Sonic waveform displays (track 3) plot fracture indicators as breaks in thecontinuity of vertical color stripes. The event at 650 m in B2 can be tracked across thecrosshole seismic image (center) to a similar signal in the sonic display of B4 at 840 m.High-velocity (orange) and low-velocity (blue) zones indicate different lithologies. Lin-ear discontinuities in color may be interpreted as fractures. Intervals in which flow isdetected in B2 (blue circles) and B4 (purple circles) are plotted on either side of thecross-well image. Logs for B4 are in the reverse order of those for B2, with the exceptionof an FMI image in B4 instead of a Formation MicroScanner image.