Hamilton's Economic Renaissance: A prospertiy unevenly shared

S26
Cent Eur J Public Health 2016 Dec; 24 (Suppl): S26–S32
SUMMARYBackground and Aim: According to the World Health Organization (WHO) more than 2 million premature deaths and 7 million of total deaths
each year can be attributed to the effects of air pollution. The contribution of air pollution to the health status of population is estimated to be about 20%. Health is largely determined by factors outside the reach of healthcare sector, including low income, unemployment, poor environment, poor education, and substandard housing. The aim of the paper was to review a current knowledge of relationships among air pollution, socioeconomic health inequalities, socio-spatial differentiation, and environmental inequity. The relationships were demonstrated on an example of the Ostrava region. Also basic approaches to health valuation were reviewed.
Results: Social differences are reasons both for health inequalities and spatial patterns of unprivileged area housing. In urban environments with poor air quality there is also a large concentration of low income residents. Less affluent population groups are more often affected by inad-equate housing conditions including second-hand smoking and higher environmental burden in their residential neighbourhoods. Environmental injustice is highly correlated with other factors that link poverty with poor health, including inadequate access to medical and preventive care, lack of availability of healthful food, lack of safe play spaces for children, absence of good jobs, crime, and violence.
Conclusions: The theoretical background and also results of the studies brought evidence that population health is affected by both socio-economic and environmental inequalities. Air pollution is unevenly distributed in Ostrava and is related to distribution of socially disadvantaged environment and social exclusion as well.
Key words: socioeconomic health inequalities, socio-spatial differentiation, environmental inequity, health valuation, Ostrava region
Address for correspondence: H. Šlachtová, Centre of Epidemiological Research, Faculty of Medicine, University of Ostrava, Syllabova 19, 703 00 Ostrava, Czech Republic. E-mail: [email protected]
http://dx.doi.org/10.21101/cejph.a4535
ENVIRONMENTAL AND SOCIOECONOMIC HEALTH INEQUALITIES: A REVIEW AND AN EXAMPLE OF THE INDUSTRIAL OSTRAVA REGIONHana Šlachtová1, Vítězslav Jiřík1, Ivan Tomášek1, 2, Hana Tomášková1, 2
1Centre of Epidemiological Research, Faculty of Medicine, University of Ostrava, Ostrava, Czech Republic 2Institute of Public Health in Ostrava, Ostrava, Czech Republic
INTRODUCTION
According to the World Health Organization (WHO) clean air is considered to be a basic requirement of human health and well-being. However, air pollution continues to pose a significant threat to health worldwide. According to the WHO assessment of the burden of disease due to air pollution, more than 2 million premature deaths each year can be attributed to the effects of urban outdoor air pollution and indoor air pollution (1). The most recent WHO website news reported total estimates of 7 million air pollution related deaths in 2012. By reducing air pollution levels, countries can reduce the burden of disease from stroke, heart disease, lung cancer, and both chronic and acute respiratory diseases, including asthma (2).
Despite the serious health harms, contribution of air pollution to the overall health of population is estimated to be around 20%. Other factors affecting health status are genetic predisposition and health care (10‒15%) and the largest impact (about 50%) is ascribed to life style (3).
Health is largely determined by factors outside the reach of healthcare sector, including low income, unemployment, poor environment, poor education, and substandard housing (4).
A comparative risk assessment of burden of disease and injury attributable to 67 risk factors and risk factor clusters in 21 regions of the world in the year 2010 (5) was based on the methods of estimated cause-specific deaths (YLL – years of life lost) and disability-adjusted life years (DALYs – sum of years lived with disability). In 2010, the three leading risk factors for global disease burden were high blood pressure (7.0% of global DALYs), tobacco smoking including second-hand smoke (6.3%), and household air pollution from solid fuels – 4.3% (5). New evi-dence has led to changes in the magnitude of key risks including ambient particulate matter pollution (5).
Socioeconomic Health InequalitiesIn all countries with available data, there are significant dif-
ferences in health between socioeconomic groups. People with

S27
lower levels of education, occupation and/or income tend to have systematically higher morbidity and mortality rates (6). The health differences are based on genetic and constitutional varia-tions, age and chance also plays a role. In contrary, inequalities in health mean removable or modifiable differences of health status between population groups within countries and between countries. These inequalities are based on differences of social and economic conditions that affect lives of people and determine their risk of disease and also ways how to prevent such diseases and how to treat them (7). The interaction between individual and socioeconomic determinants of health is presented in different ways as shown e.g. in the Fig. 1 and Fig. 2.
Three distinguishing features, when combined, turn differences in health into social inequities in health. They are systematic (not randomly distributed across the population), socially produced (and
therefore modifiable) and unfair (in Europe fairness is linked to human rights) (7). Mortality and morbidity increase with declining social position and this social pattern of disease is universal (7).
Summing up briefly, social inequities in health are directly or indirectly generated by social, economic and environmental factors and structurally influenced lifestyles. These determinants of social inequities are all amenable to change (7) and are also called socioeconomic determinants of health (8).
Socio-spatial DifferentiationThe uneven distribution of population in an area indicates
socio-spatial differences (9).Different living conditions in specific types of environments
can lead to disadvantaged population groups. The spatial patterns
Fig. 1. The “rainbow” model of social determinants of health. Reprinted from Dahlgren G, Whitehead M, 2006 (33).
Fig. 2. Comission on Social Determinants of Health conceptual Framework. Reprinted from WHO 2008 (39).

S28
of social differences are based on interaction between socioeco-nomic status (SES) of population and residential preferences.
The sources of industrial air pollution are usually situated in relatively unprivileged areas that are characterized by poor hous-ing standards and high unemployment. On the other hand people with higher levels of education living in better conditions are more aware of these risks and try to avoid them (10).
In urban environments with poor air quality there are the large concentrations of low income residents, therefore, urban air pol-lution became a significant international environmental justice concern (11). These population groups often have unhealthy housing and significant exposures to indoor air pollution as well and often have higher prevalence rates of diseases such as asthma that are adversely affected by air pollution (11).
Air PollutionRisk factor quantification is a powerful and compelling tool
to support calls for policy action to improve health. Of the seven environmental risks quantified in The Global Burden of Disease 2010 Study (12), “the greatest contributions to global disease burden were from household air pollution (4.5%, and ranked fourth globally), ambient particulate matter pollution (3.1%; 9th rank), followed by unimproved sanitation, and lead exposure”.
Worldwide, outdoor air pollution contributes to approx. 800,000 deaths per year and 4.6 million healthy life-years lost per year. The burden of air pollution is not equally distributed: approximately 65% of the deaths and lost life-years is recorded in the developing countries of Asia (13).
Air pollution levels are tightly linked to climate (temperature, prevailing winds, seasonal changes) and topography (hills and valleys, dominant vegetation, surfaces). Air pollution episodes can be particularly troublesome if the affected city is located in a valley surrounded by mountains (13). This is a case of the Upper Silesian basin, where Ostrava is situated.
The major outdoor air pollutants that are routinely measured (together with lead) are: particulate matter, ozone, nitrogen oxides, carbon monoxide, and sulphur dioxide. Particulate matter is the most frequently used indicator of the air quality. It is a complex
mixture of particles that can be solid, liquid or both and varies in size, composition and origin. The summary of the major outdoor pollutants, their sources and health effects are introduced in the Fig. 3.
Environmental InequitySubsequently to health inequalities the environmental inequali-
ties are inequitably distributed across population (7). Environ-mental justice/inequity studies suggest that the level of pollution present in the environment in which vulnerable populations reside is higher than in more affluent areas (14). Subjects in poor areas are more likely to spend time close to or in traffic, working on the street, walking long distances to find transport and commuting in congested, dangerous transport (14). The term environmental injustice describes the disproportionate and inequitable exposure of poor and minority populations to hazards in the environment (15). Less affluent population groups are more often affected by inadequate housing conditions and higher environmental burden in their residential neighbourhoods (16). Housing problems vary from the extreme of homelessness to overcrowding, poor amenities, en-vironmental problems such as noise and pollution, and crime (17).
Environmental injustice is highly correlated with other factors that link poverty with poor health, including inadequate access to medical and preventive care, lack of availability of healthful food, lack of safe play spaces for children, absence of good jobs, crime, and violence (15). The study from Mexico City (14) identified the unfortunate combination of poverty and air pollution causing seri-ous adverse, and often irreversible, health outcomes in children.
The review (16) limited to European evidence identified that the less affluent population groups are most exposed to environ-mental risks in the place of residence. Inequities were reported for risks experienced within the dwelling (such as exposure to dampness, chemical contamination, noise, temperature problems, and poor sanitation) and related to residential location (neigh-bourhood quality, traffic-related pollution, proximity to pollution sites). Increased exposure to environmental risks within more affluent population groups was rarely identified. The key finding of the review brought evidence that social status and especially
Fig. 3. Summary of major outdoor polutants. Reprinted from WHO 2008 (13).
S29
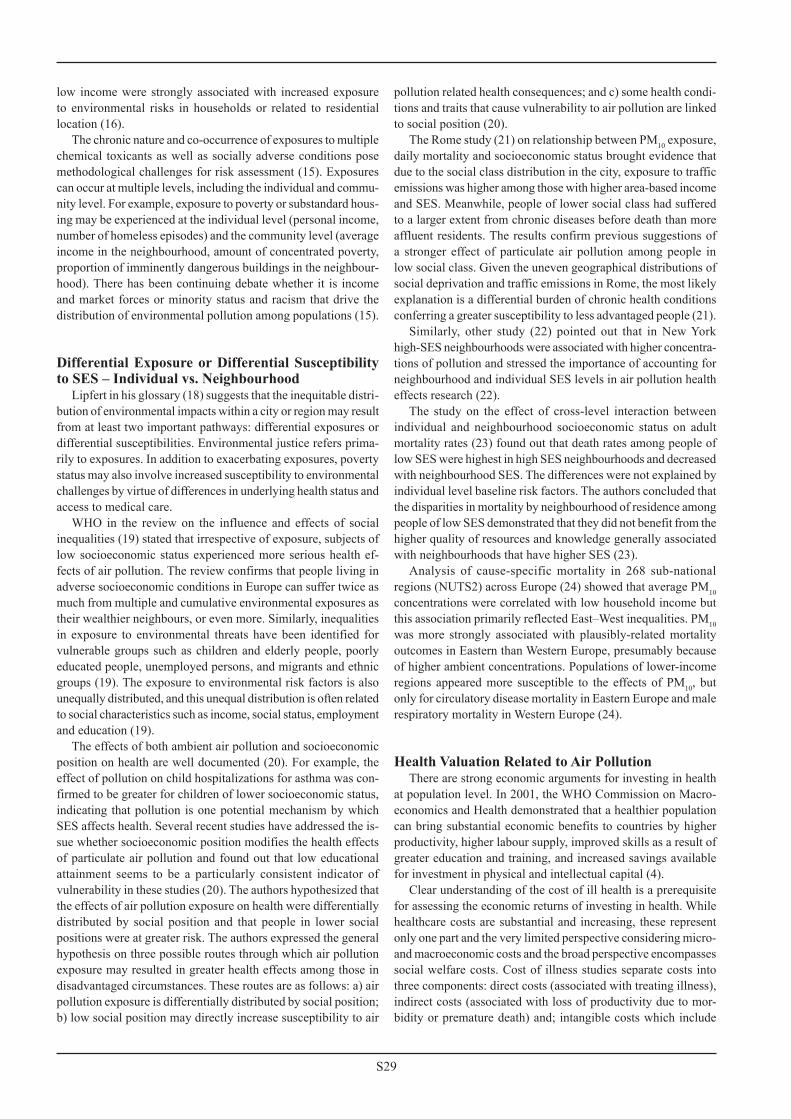
low income were strongly associated with increased exposure to environmental risks in households or related to residential location (16).
The chronic nature and co-occurrence of exposures to multiple chemical toxicants as well as socially adverse conditions pose methodological challenges for risk assessment (15). Exposures can occur at multiple levels, including the individual and commu-nity level. For example, exposure to poverty or substandard hous-ing may be experienced at the individual level (personal income, number of homeless episodes) and the community level (average income in the neighbourhood, amount of concentrated poverty, proportion of imminently dangerous buildings in the neighbour-hood). There has been continuing debate whether it is income and market forces or minority status and racism that drive the distribution of environmental pollution among populations (15).
Differential Exposure or Differential Susceptibility to SES – Individual vs. Neighbourhood
Lipfert in his glossary (18) suggests that the inequitable distri-bution of environmental impacts within a city or region may result from at least two important pathways: differential exposures or differential susceptibilities. Environmental justice refers prima-rily to exposures. In addition to exacerbating exposures, poverty status may also involve increased susceptibility to environmental challenges by virtue of differences in underlying health status and access to medical care.
WHO in the review on the influence and effects of social inequalities (19) stated that irrespective of exposure, subjects of low socioeconomic status experienced more serious health ef-fects of air pollution. The review confirms that people living in adverse socioeconomic conditions in Europe can suffer twice as much from multiple and cumulative environmental exposures as their wealthier neighbours, or even more. Similarly, inequalities in exposure to environmental threats have been identified for vulnerable groups such as children and elderly people, poorly educated people, unemployed persons, and migrants and ethnic groups (19). The exposure to environmental risk factors is also unequally distributed, and this unequal distribution is often related to social characteristics such as income, social status, employment and education (19).
The effects of both ambient air pollution and socioeconomic position on health are well documented (20). For example, the effect of pollution on child hospitalizations for asthma was con-firmed to be greater for children of lower socioeconomic status, indicating that pollution is one potential mechanism by which SES affects health. Several recent studies have addressed the is-sue whether socioeconomic position modifies the health effects of particulate air pollution and found out that low educational attainment seems to be a particularly consistent indicator of vulnerability in these studies (20). The authors hypothesized that the effects of air pollution exposure on health were differentially distributed by social position and that people in lower social positions were at greater risk. The authors expressed the general hypothesis on three possible routes through which air pollution exposure may resulted in greater health effects among those in disadvantaged circumstances. These routes are as follows: a) air pollution exposure is differentially distributed by social position; b) low social position may directly increase susceptibility to air
pollution related health consequences; and c) some health condi-tions and traits that cause vulnerability to air pollution are linked to social position (20).
The Rome study (21) on relationship between PM10 exposure, daily mortality and socioeconomic status brought evidence that due to the social class distribution in the city, exposure to traffic emissions was higher among those with higher area-based income and SES. Meanwhile, people of lower social class had suffered to a larger extent from chronic diseases before death than more affluent residents. The results confirm previous suggestions of a stronger effect of particulate air pollution among people in low social class. Given the uneven geographical distributions of social deprivation and traffic emissions in Rome, the most likely explanation is a differential burden of chronic health conditions conferring a greater susceptibility to less advantaged people (21).
Similarly, other study (22) pointed out that in New York high-SES neighbourhoods were associated with higher concentra-tions of pollution and stressed the importance of accounting for neighbourhood and individual SES levels in air pollution health effects research (22).
The study on the effect of cross-level interaction between individual and neighbourhood socioeconomic status on adult mortality rates (23) found out that death rates among people of low SES were highest in high SES neighbourhoods and decreased with neighbourhood SES. The differences were not explained by individual level baseline risk factors. The authors concluded that the disparities in mortality by neighbourhood of residence among people of low SES demonstrated that they did not benefit from the higher quality of resources and knowledge generally associated with neighbourhoods that have higher SES (23).
Analysis of cause-specific mortality in 268 sub-national regions (NUTS2) across Europe (24) showed that average PM10 concentrations were correlated with low household income but this association primarily reflected East–West inequalities. PM10 was more strongly associated with plausibly-related mortality outcomes in Eastern than Western Europe, presumably because of higher ambient concentrations. Populations of lower-income regions appeared more susceptible to the effects of PM10, but only for circulatory disease mortality in Eastern Europe and male respiratory mortality in Western Europe (24).
Health Valuation Related to Air PollutionThere are strong economic arguments for investing in health
at population level. In 2001, the WHO Commission on Macro-economics and Health demonstrated that a healthier population can bring substantial economic benefits to countries by higher productivity, higher labour supply, improved skills as a result of greater education and training, and increased savings available for investment in physical and intellectual capital (4).
Clear understanding of the cost of ill health is a prerequisite for assessing the economic returns of investing in health. While healthcare costs are substantial and increasing, these represent only one part and the very limited perspective considering micro- and macroeconomic costs and the broad perspective encompasses social welfare costs. Cost of illness studies separate costs into three components: direct costs (associated with treating illness), indirect costs (associated with loss of productivity due to mor-bidity or premature death) and; intangible costs which include

S30
the psychological dimensions of illness (only rarely measured). A review of cost of illness studies found that the cost of chronic diseases ranged from 0.02% to 6.77% of a country’s GDP. Car-diovascular disease in particular was found to account for between 1‒3% of GDP in most developed countries (4).
Social or socioeconomic value of externalities such as qual-ity of life, noise, environmental pollution etc. is perceived as “market unpriced goods” and it should be counted as an indirect cost. Social meaningfulness or social efficiency is derived from the results of cost-benefit analysis. The benefits are understood as saving lives, reducing negative impact on the environment etc. The main concepts are based on willingness to pay (WTP) for specific goods (monetary value); on willingness to accept (WTA) negative effects related to the goods clearly defined by monetary value; and on opportunity costs that are used to determine the shadow prices of goods related to human activity (25).
The social value of externalities is usually determined using a questionnaire survey and hedonic regression, where the price of externality is derived from the model with the externality as the explanatory variable. The value of human life is estimated using several models: method of human capital – based either on the sum of discounted future potential earnings, or the sum of discounted net expenditure; value of a statistical life (VSL) – based on WTP to reduce the risk of death; and value of life year (VOLY). VSL and VOLY estimate the value of life on the basis of expressed preferences (25), e.g. a limit value that the individual is willing to exchange for safety (26). The human capital approach has 300-year tradition, but is criticized as methodologically wrong (26).
When looking at health using a concept of health as both con-sumption and capital goods, health as consumption goods directly contributes to an individual’s happiness or satisfaction, and as capi-tal goods, health is an important component of the value of human beings as means of production (6). Inequalities-related losses to population health were determined by calculating the frequency of ill-health in the population not achieving adequate level of educa-tion, occupational class or income level. While the estimates of inequalities-related losses to health as a capital good seem to be modest in relative terms (1.4% of GDP), they are large in absolute terms (€141 billion). Inequalities-related losses to health account for 15% of the costs of social security systems, and for 20% of the costs of healthcare systems in the European Union (6).
A key element for the calculation of the damage costs of air pollution, namely the valuation of mortality provides the paper from 2011 (27). The authors explain that quantification of the costs of air pollution mortality by value of prevented fatality (VSL) is not correct and prefer the method of contingent valuation. Based on the results of contingent valuation survey that was conducted in 9 European countries the authors recommend VOLY estimate of 40,000 € (confidence intervals at least 25,000 € and at the most 100,000 €) for cost-benefit analysis of air pollution policies for the European Union.
The VOLY is also recommended as the most relevant metric for valuation of the health impacts of ozone and particulate mat-ter for the cost-benefit analysis being undertaken as part of the Clean Air For Europe (CAFE) programme (28). Empirical stud-ies provide direct estimates of VOLY, and there has been recent work deriving VOLY values (computationally) from VSL in the air pollution context. Consequently, mortality effects of long-term exposure to PM will be expressed both as years of life lost and as
attributable cases of premature mortality, and both are relevant for monetary valuation (28).
Studies on Environmental and Health Inequalities in Industrial Ostrava Region
In Ostrava agglomeration lives 80% of total population of the Moravian-Silesian region. At present, aging of population, high unemployment, poor educational structure and crime, especially in the peripheral parts of the region, are the main problems, and the situation threatens to get worse (29). The document Develop-ment Strategy of the Moravian-Silesian Region (30) introduces the situation in Ostrava as a typical example of accumulation of structural backwardness and load generating stress of population that combines air pollution and its health impacts, tense situation in employment, safety problems, criminality, and concentration of numerous excluded Roma localities.
Air pollution could be one of the key factors for the disper-sion of population growth and suburbanization (31). However, air pollution influences the suburbanization process only partly. Based on sociological research from 2010 only 10% of house-holds in Ostrava want to move from the city in the future and the environment is even the third of the stated reasons (after housing and work). A significant migration flow from Ostrava is directed into new houses in the eastern edge of the city with significantly worse state of the environment, but considerably cheaper land. Wealthier population prefers the western edge of the city with a better quality of environment. Similar trends can be seen also in other major cities in Europe (31).
According to the periodic survey on health and lifestyle in middle age population in 19 Czech cities (HELEN 2010), in the Ostrava region, worse socioeconomic status indicators were found comparing with other cities in the study. The highest prevalence of risk life-style factors (obesity, lack of physical activity, smoking, excessive alcohol consumption, or unhealthy diet) was indicated in Ostrava (32).
Unemployment represented 2.9% of total burden of disease caused by specific risk factors/conditions in the EU in the year 1997 (33). Socioeconomic atlas of Ostrava (34) brought infor-mation on geographical distribution of unemployed people with low education. This group of citizens together with young peo-ple shortly after school and people close to retirement who lost their jobs are among the most vulnerable in the labour market. The average proportion of low educated inhabitants in Ostrava represents 36% of the city population, but in some parts of the city this proportion reached 72% (34). The monitoring of socially excluded localities of Ostrava (35) stated that the high level of unemployed with basic education (usually more 60%) seems to be a typical symptom of gypsy communities, additionally with a high share of young people. In Ostrava, 18,000 of inhabitants (i.e. 5.4% of total population) received social benefits in 2010. The welfare recipients are concentrated predominantly in the central and eastern parts of the city. Also crime, mostly thefts, is concentrated in the central city quarters with a higher crime rate in the socially problematic locations. The lowest criminality was found in the western parts of the city (34).
In spite of the state assistance in material poverty there are some proportion of homeless population. According to the study of the state of homelessness in Ostrava (36) the total number of

S31
homeless (living outside shelters or in asylum houses) reached 890 in 2012. The authors of the study introduced hidden and potential homelessness. Hidden homeless (1,797 persons) are those without own housing living in public hostels. The largest group created potential homeless (18,833 persons) – people living in socially excluded areas and individuals without a permanent address, released from prison or young people leaving foster care. The highest concentration of homeless is in the central and western parts of the city.
The results of sociological studies point out that the effects of air pollution on health should be assessed differently depending on the social composition of the area population. The White Paper on allergy from 2011–2012 states that morbidity and mortality from asthma is more concentrated in the lower social class due to higher exposure to ambient and indoor air pollution including tobacco smoking. In spite of the differences in findings of health studies focussed on children respiratory morbidity in Ostrava (32, 37), some SES consequences were detected: a lower socioeconomic status was associated with worse control of asthma (especially in the eastern heavy polluted part of Ostrava, where also the highest prevalence of asthma was found), a higher proportion of mothers with lower education, higher prevalence of smoking mothers before conception and during pregnancy, and also higher proportion of current smoking households (32).
The article published in 2008 (38) summarizes results of studies of relationship between air pollution and population health in the Ostrava-Karvina region carried out in the period from 1994–2006 by the researchers of the Institute of Public Health in Ostrava. The results did not confirm a transparent relationship between air pollution and prevalence of allergy. However, increased con-centrations of PM10 and NO2 have been listed among other risk factors of higher frequency of cough and inhalation allergy. Lung function of children was also significantly affected by mother smoking in pregnancy and by smoking in household during their life-course (38).
CONCLUSION
The theoretical background and also results of the studies brought evidence on determinants of health status of population not only by environmental but also social factors. Individual lives and also population health are affected by both socioeco-nomic and environmental inequalities. Air pollution is unevenly distributed in Ostrava and is related with distribution of socially disadvantaged environment and social exclusion. The health studies indicated that there existed unexplained factors behind identified direct relationships between health and known risk factors and determinants and probably related to lifestyle fac-tors and socioeconomic inequalities. In spite of that the primary goal of the paper was not to assess financial costs of ill health, it provides in addition a guide for estimation of the financial losses due to environmental inequity.
REFERENCES
1. World Health Organization. WHO Air quality guidelines for particulate matter, ozone, nitrogen dioxide and sulfur dioxide. Global update 2005. Summary of risk assessment [Internet]. Geneva: WHO; 2006 [cited 2015
Jan 17]. Available from: http://whqlibdoc.who.int/hq/2006/WHO_SDE_PHE_OEH_06.02_eng.pdf?ua=1.
2. World Health Organization. Media centre. Ambient (outdoor) air quality and health. Fact sheet [Internet]. Geneva: WHO [updated 2014 March; cited 2015 Jan 20]. Available from: http://www.who.int/mediacentre/factsheets/fs313/en/.
3. Green LW, Ottoson JM. Community health. 7th ed. St. Louis: Mosby; 1994.4. Determine - an EU Consortium for Action on Socio-economic Determi-
nants of Health. [Internet]. Economic arguments for addressing social determinants of health inequalities. Determine. Working document Nr. 4. [Internet]. Determine; 2009 [cited 2014 Sept 11]. Available from: http://www.szu.cz/uploads/documents/czzp/nerovnosti/2011/Working_docu-ment_4_Economic_Arguments.pdf.
5. Lim SS, Vos T, Flaxman AD, Danaei G, Shibuya K, Adair-Rohani H, et al. A comparative risk assessment of burden of disease and injury attribut-able to 67 risk factors and risk factor clusters in 21 regions, 1990-2010: a systematic analysis for the Global Burden of Disease Study 2010. Lancet. 2012 Dec 15;380(9859):2224-60.
6. Mackenbach JP, Meerding WJ, Kunst AE, editors. Economic implications of socioeconomic inequalities in health in the European Union [Internet]. Luxembourg: European Commission; 2007 [cited 2015 Feb 15]. Avail-able from: http://ec.europa.eu/health/ph_determinants/socio_economics/documents/socioeco_inequalities_en.pdf.
7. Whitehead M, Dahlgren G. Concepts and principles for tackling social inequalities in health: levelling up part 1 [Internet]. Copenhagen: WHO Regional Office for Europe; 2006 [cited 2015 Feb 15]. Available from: http://www.euro.who.int/document/e89383.pdf.
8. Janatová H, Uličná E. Improvement of health equity in the EU by influenc-ing social determinants of health: a summary report on activities of the project “Determine - an EU Consortium for Action on Socio-economic Determinants of Health” in the first year of duration. Prague: NIPH; 2008. (In Czech.)
9. Macešková M, Ouředníček M, Temelová J. Socio-spatial differentiation in the Czech Republic: implications for public (regional) policy. Eko-nomický časopis. 2009;57(7):700-15. (In Czech.)
10. Dionne CE, Von Korff M, Koepsell TD, Deyo RA, Barlow WE, Checko-way H. Formal education and back pain: a review. J Epidemiol Com-munity Health. 2001 Jul;55(7):455-68.
11. Samet JM, White RH. Urban air pollution, health, and equity. J Epidemiol Community Health. 2004 Jan;58(1):3-5.
12. Lopez AD. Reducing risks to health: what can we learn from the Global Burden of Disease 2010 Study? Int J Public Health. 2013 Oct;58(5):645-6.
13. World Health Organization. Outdoor Air Pollution. Children's Health and the Environment. WHO Training Package for the Health Sector [Internet]. Geneva: WHO [updated 2008 July; cited 2015 Feb 24]. Available from: http://www.who.int/ceh/capacity/training_modules/en/
14. Calderón-Garcidueñas L, Torres-Jardón R. Air Pollution, Socioeconomic Status, and Children's Cognition in Megacities: The Mexico City Scenario. Front Psychol. 2012 Jul 9;3:217. doi: 10.3389/fpsyg.2012.00217.
15. Rauh VA, Landrigan PJ, Claudio L. Housing and health: intersection of poverty and environmental exposures. Ann N Y Acad Sci. 2008;1136:276-88.
16. Braubach M, Fairburn J. Social inequities in environmental risks associ-ated with housing and residential location - a review of evidence. Eur J Public Health. 2010 Feb;20(1):36-42.
17. European Commission. Combating Poverty and Social Exclusion. A statistical portrait of the European Union 2010 [Internet]. Luxembourg: European Union; 2010 [cited 2015 March 08]. Available from: http://ec.europa.eu/eurostat/documents/3217494/5723553/KS-EP-09-001-EN.PDF/beb36abc-ff29-48a0-8518-32b64ad73ca5?version=1.0.
18. Lipfert FW. Air pollution and poverty: does the sword cut both ways? J Epidemiol Community Health. 2004 Jan;58(1):2-3.
19. World Health Organization. Environment and health risks: a review of the influence and effects of social inequalities [Internet]. Copenhagen: WHO Regional office for Europe; 2010. [cited 2015 Apr 12]. Available from: http://www.euro.who.int/__data/assets/pdf_file/0003/78069/E93670.pdf?ua=1.
20. O'Neill MS, Jerrett M, Kawachi I, Levy JI, Cohen AJ, Gouveia N, et al.; Workshop on Air Pollution and Socioeconomic Conditions. Health, wealth, and air pollution: advancing theory and methods. Environ Health Perspect. 2003 Dec;111(16):1861-70.
21. Forastiere F, Stafoggia M, Tasco C, Picciotto S, Agabiti N, Cesaroni G, et al. Socioeconomic status, particulate air pollution, and daily mortality: differential exposure or differential susceptibility. Am J Ind Med. 2007 Mar;50(3):208-16.

S32
22. Hajat A, Diez-Roux AV, Adar SD, Auchincloss AH, Lovasi GS, O'Neill MSet al. Air pollution and individual and neighborhood socioeconomic status: evidence from the Multi-Ethnic Study of Atherosclerosis (MESA). Environ Health Perspect. 2013 Nov-Dec;121(11-12):1325-33.
23. Winkleby M, Cubbin C, Ahn D. Effect of cross-level interaction between individual and neighborhood socioeconomic status on adult mortality rates. Am J Public Health. 2006 Dec;96(12):2145-53.
24. Richardson EA, Pearce J, Tunstall H, Mitchell R, Shortt NK. Particulate air pollution and health inequalities: a Europe-wide ecological analysis. Int J Health Geogr. 2013 Jul 16;12:34. doi: 10.1186/1476-072X-12-34.
25. Kršková M. Determination of the market value of unpriced goods. Ekonomika a management [Internet]. 2008 [cited 2015 Apr 12];(1): [about 13 p.]. Available from: http://www.vse.cz/eam/14. (In Czech.)
26. Ščasný M, Máca V. Evaluation of impacts on mortality (Readiness to pay for a reduction in the risk of death). In: ENVIMPACT Seminar; 2012 Oct 18; Prague [Internet]. Prague: Charles University in Prague, Environment Center; 2012 [cited 2015 Apr 12]. Available from: https://www.czp.cuni.cz/czp/images/stories/2012/Dopady/5_Ocenovani_dopadu_na_umrtnost-Scasny.pdf. (In Czech.)
27. Desaigues B, Ami D, Bartczak A, Braun-Kohlová M, Chilton S, Cza-jkowski M, et al. Economic valuation of air pollution mortality: A 9-country contingent valuation survey of value of a life year (VOLY). Ecol Indic. 2011 May;11(3):902-10.
28. Hurley F, Hunt A, Cowie H, Holland M, Miller B, Pye S, et al. Methodol-ogy for the Cost-Benefit analysis for CAFE: Volume 2: Health Impact Assessment, February 2005 [Internet]. European Commission. AEAT/ED51014/Methodology:2(1). [cited 2015 Apr 04]. Available from: http://ec.europa.eu/environment/archives/cafe/pdf/cba_methodology_vol2.pdf.
29. Hruška L, Samiec M, Svobodník J, Matoláková R, Foldynová I. Socio-economic atlas of the Moravian-Silesian region [Internet]. ACCENDO - Centrum pro vědu a výzkum; 2012 [cited 2015 March 15]. Available from.: http://www.rr-moravskoslezsko.cz/file/3148/. (In Czech.)
30. Gabal I, Víšek P, et al. Basis for strategies to combat social exclusion: Basis for the formulation and implementation of inclusion policies in excluded localities in the Czech society and its social and economic structure [Internet]. Prague; 2010 May [cited 2015 March 27]. Available from: http://www.gac.cz/userfiles/File/nase_prace_vystupy/GAC_Strat-egie_soc_vylouceni.pdf. (In Czech.)
31. Hruška-Tvrdý L, et al. The study of residential structure of the Moravian-Silesian region. [Internet]. PROCES - Centrum pro rozvoj obcí a regionů;
2012 Feb [cited 2015 March 27]. Available from: https://verejna-sprava.kr-moravskoslezsky.cz/zip/upl_0_Studie_sidelni_struktury_MSK.pdf. (In Czech.)
32. Kratěnová J, Puklová V. Monitoring of allergy diseases in children in Ostrava-Karviná region in 2006. Alergie 2011;13(Suppl 2):15-20. (In Czech.)
33. Dahlgren G, Whitehead M. European strategies for tackling social inequities in health: Levelling up Part 2 [Internet]. Copenhagen: WHO Regional Office for Europe; 2006 [cited 2015 Feb 15]. Available from: http://www.euro.who.int/document/e89384.pdf.
34. Šajer I, Hruška-Tvrdý L, Kukuliač P, Foldynová I, Horák J, Ivan I. Socio-economic atlas of Ostrava. [Internet]. Ostrava: VŠB Technical University; 2011 [cited 2015 March 28]. Available from: http://homel.vsb.cz/~saj0023/BP/PVOA.html. (In Czech.)
35. Horak J, Ivan I, Inspektor T, Hruska-Tvrdy L. Monitoring of socially axcluded localities of Ostrava City. In: GIS Ostrava 2010, proceedings [Internet]. GIS Ostrava 2010, 24-27 Jan 2010, Ostrava. Ostrava: VSB-TU Ostrava; 2010 [cited 2015 Apr 07]. Available from: http://gis.vsb.cz/GIS_Ostrava/GIS_Ova_2010/sbornik/Lists/Papers/EN_5_4.pdf.
36. Hruška L, et al. Study on the state of homelessness in Ostrava [Internet]. Ostrava: PROCES; 2012 [cited 2015 Apr 7]. Available from: https://www.ostrava.cz/cs/urad/magistrat/odbory-magistratu/odbor-socialnich-veci-zdravotnictvi-a-vzdelanosti/oddeleni-socialnich-sluzeb/aktualni-informace/c-users-zivcakzd-desktop-komplexna-socia-lna-pra-ce-bezdo-movstva-studie-proces-studie_o_stavu_bezdomovectvi_v_ostrave_final.pdf. (In Czech.)
37. Dostal M, Pastorkova A, Rychlik S, Rychlikova E, Svecova V, Schallerova E, et al. Comparison of child morbidity in regions of Ostrava, Czech Republic, with different degrees of pollution: a retrospective cohort study. Environ Health. 2013 Sep 3;12(1):74. doi: 10.1186/1476-069X-12-74.
38. Šlachtová H, Kůsová J. Health impact of air pollution in the Ostrava-Karvina region. Ochr ovzduší. 2008;21(5-6):24-32. (In Czech.)
39. Commission on Social Determinants of Health. Closing the gap in a generation: health equity through action on the social determinants of health. Final Report. Geneva: World Health Organization; 2008.
Received August 28, 2015Accepted in revised form May 15, 2016