Environmental and Socio-Economic Impacts of Climate Change
288
Environmental and Socio-Economic Impacts of Climate Change on the Brue Valley Final Report for Somerset Wildlife Trust and the Brue Valley Living Landscape Project RPA May 2011
Transcript of Environmental and Socio-Economic Impacts of Climate Change

Environmental and Socio-Economic Impacts of Climate Change
on the Brue Valley
Final Report
for
Somerset Wildlife Trust and the Brue Valley Living Landscape Project
RPA May 2011


Environmental and Socio-Economic Impacts of Climate Change
on the Brue Valley
Final Report
prepared for
Somerset Wildlife Trust and the Brue Valley Living Landscape Project
by
Risk & Policy Analysts Limited, Farthing Green House, 1 Beccles Road, Loddon, Norfolk, NR14 6LT
Tel: 01508 528465 Fax: 01508 520758 Email: [email protected]
In association with
Geckoella environmental consultants pvt ltd
Suite 323, 7 Bridge Street, Taunton, TA1 1TD Tel: 0392 762334
Email: [email protected]
Environment Systems Ltd 8G Cefn Llan Science Park, Aberystwyth, Ceredigion, SY23 3AH
Tel: 01970 626688 Email: [email protected]
This report should be cited as: RPA, Geckoella and Environment Systems (2011): Environmental and Socio-Economic Impacts of Climate Change on the Brue Valley, report prepared for the Somerset Wildlife Trust Brue Valley Living Landscape Project, May 2011.
RPA REPORT – ASSURED QUALITY Project: Ref/Title
J716/Brue Valley
Approach:
In accordance with the Proposal
Report Status: Final Report Report Prepared by:
Teresa Fenn, Principal Consultant, RPA Rocio Salado, Senior Consultant, RPA Elizabeth Daly, Consultant, RPA Andy King, Co-director, Geckoella Kate Jeffreys, Co-director, Geckoella Steve Keyworth, Director, Environment Systems Eleanor Goupillon, Environment Systems
Report approved for issue by:
Meg Postle, Director, RPA
Date:
13 May 2011


Executive Summary
- i -
EXECUTIVE SUMMARY 1. Introduction Climate change is one of the main challenges to be faced by policy makers and local stakeholders in the years to come. This study focuses on assessing how climate change and socio-economic factors may interact to impact land use, habitats and biodiversity in the Brue Valley. The results will feed into the Wildlife Trusts’ ‘Living Landscape’ initiative, The European Interreg IVB NWE WAVE (Water Adaptation is Valuable for Everybody) project and Natural England’s Wetland Vision projects. By turning the Vision into reality, the aim is for partner organisations to make space for water in our countryside, help people and wildlife adapt to a changing climate, protect our heritage and reap the many benefits that wetlands can provide. 2. Objectives The overall objectives of the study are: to provide a scientifically sound assessment of the impacts of climate change on the
habitats and land uses in the Brue Valley; to deliver outputs in formats that can be easily understood and interpreted by local
stakeholders; to provide a complete record of the study such that the approach is transparent and
auditable; and to assess scenarios that take account of the variety of land uses and which identify the full
range of potential impacts (economic, environmental and social). 3. Structure of the Study
Figure 1: Study Navigation Diagram Figure 1 shows how the different aspects of the study fit together. The study begins with a baseline assessment, which involves the description of the land uses and habitats currently present in the Brue Valley. As part of this initial assessment, all areas are allocated to one of

Executive Summary
- ii -
fourteen features, e.g. lakes/ponds, dry grassland of high value for wildlife. Information from UKCP09 is then used to examine how the climate might change, and how these changes could affect the features identified. Four different socio-economic scenarios are subsequently developed. These four generic scenarios are used as the basis for developing detailed socio-economic scenarios for the Brue Valley. These detailed scenarios use the principles outlined in the IPCC Special Report on Emission Scenarios, UKCIP 2001 and the Millennium Ecosystem Assessment to build up projected futures for the Brue Valley. Figure 2 shows the basis for the four scenario types and the ideologies on which they are based. It also shows where the four detailed Brue Valley scenarios plot onto the scenario matrix. Globalisation/ Interdependence (homogeneous world)
World Markets
Global Sustainability
Localisation/ Autonomy (heterogeneous world)
Provincial Enterprise
(see A5.5)Local Stewardship
Individualism/ Consumerism (more economic focus)
Community/ Conservation
(more environmental focus)
Figure 2: Approximate location of the four scenarios developed for the Brue Valley Each scenario makes a series of assumptions with regard to a range of variables including farming methods, commitment to environmental protection, peat extraction, water management, etc. Combining these scenarios with the potential changes in climate enables the development of feature-by-feature storylines. These investigate how the habitats and land-uses might change in response to the different climatic conditions and human influences. Consideration is also given to likely adaptation actions that might be taken under the different socio-economic scenarios. Bringing together the changes at the feature level enables overall changes to the landscape and ecosystem services to be identified. This allows comparisons to be drawn between the scenarios and highlights which features are likely to be more or less vulnerable to climate change. 4. Assessing the Impact of Climate Change Climate change data from UKCP09 are used to look at how the Brue Valley might be affected. This study focuses on the high emissions scenario and takes into account both the 10% and 90% probability levels. This approach is used for two main reasons: use of the high emissions scenario maximises the projected climate change variables so
that worst-case changes can be identified; and the 10% and 90% probabilities indicate the possible changes at the two ends of a range of
climate projections. For the 10% probability, there is a 90% chance that any impacts will be greater, whilst for the 90% probability, there is a 90% chance that impacts will be

Executive Summary
- iii -
smaller. Using more than one probability also ensures that the advice of the UK Climate Projections Project (UKCPP 2011) is followed.
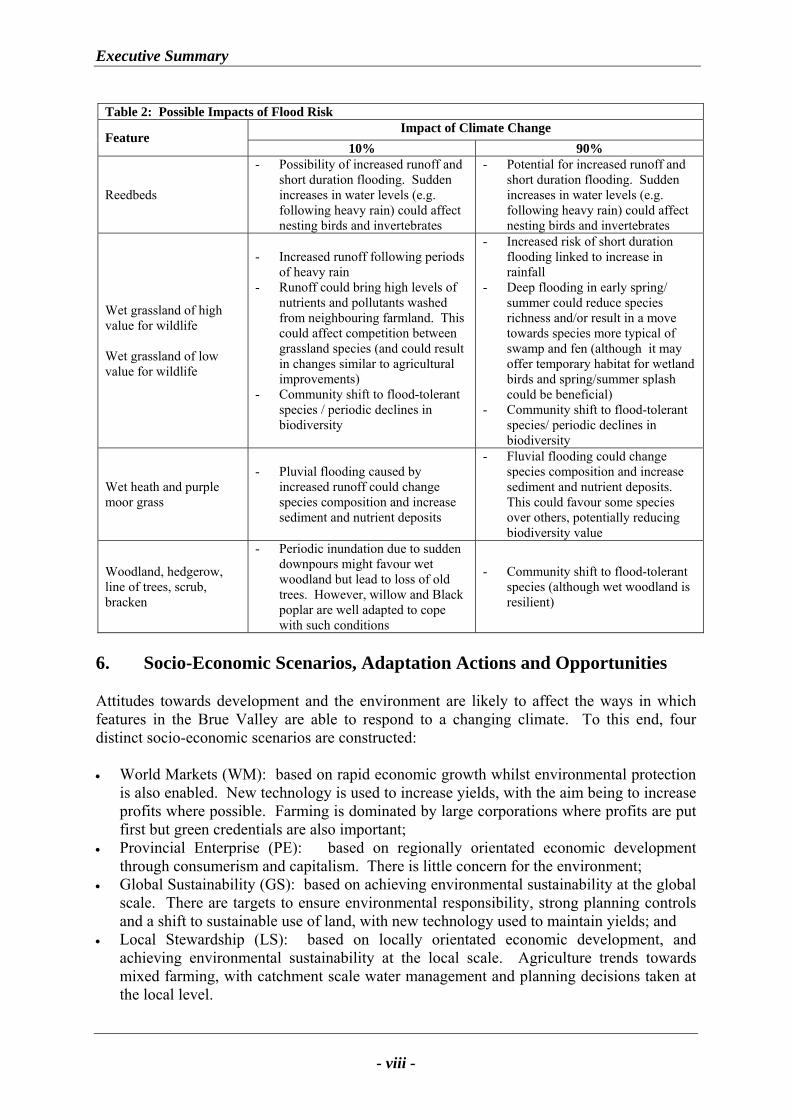
Consideration of both probabilities is particularly important given the differences between them. Under the 10% probability, conditions are anticipated to be hotter but drier, whilst under the 90% probability, conditions are hotter, but wetter. The study resources are therefore targeted towards the assessment of the climatic variables that are likely to have the greatest impacts on the features present in the Brue Valley, namely temperature and precipitation levels. 5. Impacts of Climate Change on Features Table 1 summarises some of the impacts anticipated under the two different climate probabilities, before socio-economic adaptations are taken into account. Positive and negative impacts are denoted by + and - respectively, with each referring to whether an impact is positive or negative for that particular feature, rather than for the overall landscape or environment. Anticipated impacts from the change in freshwater flood risk are shown in Table 2. Note that some features are grouped due to the projected similarity in impacts.
Table 1: Features Assessed in the Study
Impact of Climate Change Habitat
Area (ha)
Feature 10% 90%
Cereal crops 381 Cereal crops
+ Possible slight increase in maize crop
+ Slightly drier autumn may benefit cultivations
- Reduction in yields of
winter wheat crops by 14%
+ Reduction in irrigation requirements for winter wheat of 33mm
- 15% increase in autumn
rainfall may affect cultivations
Lowland meadow with calcareous indicators
0.5
Lowland meadow with acid indicators
1
Species-rich dry grassland
56
Dry grassland of high value for wildlife
- Increased temperatures in spring, summer and autumn could cause stress to livestock
-/+ Lowering of water table results in reduced biomass production – implications for management, effects on community composition
- Increased temperatures in spring, summer and autumn could cause stress to livestock
- Too much of an increase in rainfall could result in waterlogging stress.
- Increased temperatures may enable pests to survive (with particular impacts for livestock)
Grass and grass clover leys
0.0004
Improved grassland
2,377
Dry grassland of low value for wildlife
- Lowering of water table results in reduced biomass
+ Increased rainfall could increase biomass production
- Increased temperatures in spring, summer and

Executive Summary
- iv -
Table 1: Features Assessed in the Study
Impact of Climate Change Habitat
Area (ha)
Feature 10% 90%
Species-poor dry grassland
1,680
autumn could cause stress to livestock
- Too much rainfall could result in waterlogging stress
- Increased temperatures may enable pests to survive (with particular impacts for livestock)
Intensively managed orchards
1
Other non-cereal crops
35
Other arable/horticultural
2
Orchards and horticulture
- Possible small reduction in yields of around 3% due to drier conditions
- May be larger impact in terms of crop quality and difficulty of achieving uniform quality and size
- Wetter conditions could increase growing and harvesting costs
- Higher temperatures could affect yield and quality of some crops
- Warmer and wetter conditions may favour some pests and diseases
Fence 0.1
Roads
Settlements 855
Other - Increased pressure on
water resources possible - Increased run-off from
very high intensity rainfall
Ex-Peat working site
146
Bare ground 219
Peat works and bare ground
+ Peat extraction is facilitated by lower water levels
- Higher temperature in
combination with reduced precipitation enhance short-term GHG emissions through increase in rate of mineralisation from peat soils
- Recovery of habitat following restoration may take longer in hotter drier conditions
- Wetter conditions make peat extraction more difficult
Standing open water and canal
209
Eutrophic standing waters
138
Lakes, ponds
- Higher temperatures likely to decrease dissolved oxygen levels as well as affecting flora and fauna in spring and summer. Could also result in increased GHG production
- Decreased precipitation affects water table with minor impacts in winter and spring but major impacts in summer and autumn
+ Wetter conditions help ponds and lakes retain their water levels
- Effects of higher
temperatures on oxygen levels and flora and fauna (but lessened by greater rainfall). Could also result in increased GHG production

Executive Summary
- v -
Table 1: Features Assessed in the Study
Impact of Climate Change Habitat
Area (ha)
Feature 10% 90%
Reedbed 326 Reedbeds
+ Possible slight increase in biomass due to warmer temperatures
- Higher temperatures in
shallower water could result in increased GHG production
- Drier conditions affect reedbed growth and location with conditions becoming too dry in some areas, locations of some margins may change as reedbed also invades areas of previously open water
+ Wet conditions help to support reedbeds; locations of some margins may change
- Higher temperatures could
also result in increased GHG production
- Increase in biomass due to warmer temperatures leading to increase in management costs
River/stream 21
Marginal and inundation vegetation
0.8
Dry ditch 0.09
Rivers, streams, ditches, rhynes
- Higher temperatures affect dissolved oxygen levels, with negative impacts for flora and fauna (especially invertebrates) mainly felt in spring and summer. Could also result in increased GHG production
- Increase in biomass production increases vegetation management costs
- Drier conditions cause desiccation, with greater impacts during summer and autumn (depending on water table management)
- Lower flow during drier periods increases sedimentation
+ Wetter conditions support the feature and help to mitigate for eutrophic tendencies arising from warmer temperatures
- Higher temperatures affect
levels of dissolved oxygen, with negative impacts for flora and fauna all year round. Could also result in increased GHG production
- Increase in biomass production increases vegetation management costs
Swamp 140
Alkaline fen 9
Other lowland fen
17
Swamp & fen
- Increased temperature may lead to small increases in GHG production
- Lower rainfall affects the water table, with wetland communities under stress especially in summer and autumn
- Higher temperatures may affect biomass production in spring, summer and autumn; there could also be increases in GHG production
- Increased rainfall affects the water table resulting in qualitative changes in swamp and fen

Executive Summary
- vi -
Table 1: Features Assessed in the Study
Impact of Climate Change Habitat
Area (ha)
Feature 10% 90%
Species rich rush pasture
290
Species-rich wet grassland
664
Wet grassland of high value for wildlife
- Lowering of water table results in reduced biomass, effects on breeding and migrant waders, qualitative change in flower-rich wet meadows
+ Increased temperatures and rainfall could increase biomass production
- Increase temperatures in
spring, summer and autumn could cause stress to livestock
- Too much of an increase in rainfall could move wet grasslands towards swamp and fen
- Increased temperatures may enable pests to survive (with particular impacts for livestock)
Species-poor wet grassland
2,389
Species-poor rush pasture
49
Wet grassland of low value for wildlife or wet grassland of high value for wildlife
- Lowering of the water table results in reduced biomass
+ Increased temperatures and rainfall could increase biomass production
- Increased temperatures in
spring, summer and autumn could cause stress to livestock.
- Too much of an increase in rainfall could move wet grasslands towards swamp and fen.
- Increased temperatures may enable pests to survive (with particular impacts for livestock)
Species rich purple moorgrass pasture
19
Species-poor purple moor-grass pasture
35
Lowland raised mire
7
Wet heath 6
Wet heath & purple moor grass habitats
- Qualitative community changes arising from lowering of water table
+/- Higher temperatures combined with wetter conditions lead to greater biomass production with implications for management
+ Wetter conditions help to support the habitat and reduce scrub incursion
- Too much water may
change the habitat to swamp and fen

Executive Summary
- vii -
Table 1: Features Assessed in the Study
Impact of Climate Change Habitat
Area (ha)
Feature 10% 90%
Bracken 1
Species-rich hedgerow
16
Species-poor hedgerow
29
Line of trees 19
Line of trees 0.1
Scrub 26
Wet woodland 191
Deciduous woodland
59
Coniferous woodland
0.6
Woodland, hedgerow, line of trees, scrub, bracken
+ Biomass increase may lead to spread of this feature
- Changing regeneration
patterns for trees, e.g. drier conditions may result in more ash.
- Slight change in woodland community composition
+ Biomass increase may lead to spread of this feature
- Considerable change in
woodland community composition
Table 2: Possible Impacts of Flood Risk
Impact of Climate Change Feature
10% 90%
Cereal crops
- Increased risk of freshwater flooding due to increased amount of precipitation on wet days
- Land use change from cereals may arise through active transformation (e.g. convert to grassland) or through passive change (e.g. natural change to scrub / swamp)
- Increased risk of freshwater flooding due to increased precipitation overall
- Land use change from cereals may arise through active transformation (e.g. convert to grassland) or through passive change (e.g. natural change to scrub / swamp)
Dry grassland of high value for wildlife Dry grassland of low value for wildlife
- Occasional wetter days in what is otherwise much drier conditions may result in increased run-off, increasing the frequency of localised inundation
- Much wetter conditions, and more frequent wetter days increases risk of pluvial and fluvial flooding
- Increased frequency of inundation could result in increased waterlogging and move to species that prefer wetter conditions
Lakes and ponds Rivers, streams, ditches, rhynes Swamp and fen
- Freshwater flooding caused by increased runoff could bring high levels of nutrients / contaminants into these wetland habitats
- Spikes of nutrients / contaminants and sudden changes in water quality could affect biodiversity value, especially where this affects dissolved oxygen levels
- Flood management requirements reduce options for water level management for biodiversity
Orchards and horticulture
- Occasional inundation could damage crops and significantly affect income
- Increase in frequency of short duration flooding and/or runoff following heavy rainfall events
Other (settlements and roads)
- Unpredictable inundation possible, also risk of flooding of roads
- Flooding could cut off settlements and properties
- Flood risk could increase development pressure in areas outside the floodplain and decrease pressure in areas in the floodplain
Peat works and bare ground
- Unpredictable inundation due to high rainfall
- Potential negative impacts for peat extraction operations which may be delayed or stopped
Executive Summary
- viii -
Table 2: Possible Impacts of Flood Risk Impact of Climate Change
Feature 10% 90%
Reedbeds
- Possibility of increased runoff and short duration flooding. Sudden increases in water levels (e.g. following heavy rain) could affect nesting birds and invertebrates
- Potential for increased runoff and short duration flooding. Sudden increases in water levels (e.g. following heavy rain) could affect nesting birds and invertebrates
Wet grassland of high value for wildlife Wet grassland of low value for wildlife
- Increased runoff following periods of heavy rain
- Runoff could bring high levels of nutrients and pollutants washed from neighbouring farmland. This could affect competition between grassland species (and could result in changes similar to agricultural improvements)
- Community shift to flood-tolerant species / periodic declines in biodiversity
- Increased risk of short duration flooding linked to increase in rainfall
- Deep flooding in early spring/ summer could reduce species richness and/or result in a move towards species more typical of swamp and fen (although it may offer temporary habitat for wetland birds and spring/summer splash could be beneficial)
- Community shift to flood-tolerant species/ periodic declines in biodiversity
Wet heath and purple moor grass
- Pluvial flooding caused by increased runoff could change species composition and increase sediment and nutrient deposits
- Fluvial flooding could change species composition and increase sediment and nutrient deposits. This could favour some species over others, potentially reducing biodiversity value
Woodland, hedgerow, line of trees, scrub, bracken
- Periodic inundation due to sudden downpours might favour wet woodland but lead to loss of old trees. However, willow and Black poplar are well adapted to cope with such conditions
- Community shift to flood-tolerant species (although wet woodland is resilient)
6. Socio-Economic Scenarios, Adaptation Actions and Opportunities Attitudes towards development and the environment are likely to affect the ways in which features in the Brue Valley are able to respond to a changing climate. To this end, four distinct socio-economic scenarios are constructed: World Markets (WM): based on rapid economic growth whilst environmental protection
is also enabled. New technology is used to increase yields, with the aim being to increase profits where possible. Farming is dominated by large corporations where profits are put first but green credentials are also important;
Provincial Enterprise (PE): based on regionally orientated economic development through consumerism and capitalism. There is little concern for the environment;
Global Sustainability (GS): based on achieving environmental sustainability at the global scale. There are targets to ensure environmental responsibility, strong planning controls and a shift to sustainable use of land, with new technology used to maintain yields; and
Local Stewardship (LS): based on locally orientated economic development, and achieving environmental sustainability at the local scale. Agriculture trends towards mixed farming, with catchment scale water management and planning decisions taken at the local level.

Executive Summary
- ix -
For each of these scenarios, assumptions are made in relation to several factors including the extent of intensification of farmland, water management, level of environmental responsibility, management of biodiversity sites, peat extraction, development pressures, etc. These assumptions affect which adaptation actions are likely to be undertaken to minimise or mitigate the impacts of climate change. Types of adaptation action include: more investment. For example, more money might be put into water management to
ensure that a particular land use could be retained; a change in activity. This might include a shift from using land for cereal rotations to
using land for grazing; an increase in activity (intensification). More inputs (e.g. fertilisers, pesticides, water
management effort, etc.) are used to ensure that maximum yields are obtained from land; a decrease in activity (extensification). Amount of inputs is decreased, with a move
towards more sustainable production; and no adaptation taken (or needed). Land that is becoming too wet for farming may be left
to become swamp and fen, or ditches which become too dry may be abandoned to scrub. Some actions are deemed more applicable to particular scenarios. For example, under Provincial Enterprise, it is likely that intensification would only occur where profits could be increased. Areas becoming unsuitable for agricultural production would probably be abandoned. In contrast, under Global Sustainability, general movement towards the sustainable use of land would involve a shift towards extensification. In addition to the need to adapt, a changing climate is likely to bring opportunities. Such opportunities are likely to differ according to the socio-economic scenario and might include: use of new technology/techniques. In particular, this is likely to occur under the World
Markets and Global Sustainability scenarios; movement to a more profitable activity. For example, if water becomes more available in
previously dry areas, cereal cropping may become possible; movement towards funding for environmental improvements. This is particularly likely
under the Global Sustainability and Local Stewardship scenarios where concern for the environment is high, through approaches such as payment for ecosystem services;
application of existing skills. Under the Provincial Enterprise scenario, it is assumed that farmers will apply their existing skills to the new conditions; and
development of new skills. In the Local Stewardship scenario, it is probable that specialised activities would develop, thus allowing local people to become highly skilled.
7. Assessing Socio-Economic Impacts The assumptions made under each of the socio-economic scenarios can be combined with the likely climate change impacts to determine the potential implications for each of the features identified in the baseline. Table 3 summarises the impact of the socio-economic scenarios and climate change on the features and highlights which features are more vulnerable. The assessment of vulnerability combines two elements: change in area of the feature and change in environmental quality of the feature. The overall assessment of change is defined as: : increase in area and/or environmental quality, feature is unlikely to be vulnerable; : no change in area and/or environmental quality, feature is unlikely to be vulnerable;

Executive Summary
- x -
: decrease in area or environmental quality, feature is likely to be somewhat vulnerable; or
: decrease in area and environmental quality, feature is likely to be highly vulnerable.
Table 3: Impact of Socio-Economic Scenarios on the Features
Impact of Socio-Economic Scenarios
World Markets Provincial Enterprise
Global Sustainability
Local Stewardship Feature
10% 90% 10% 90% 10% 90% 10% 90%
Cereal crops Increase in area
Intensification and increase in inputs
could affect biodiversity
Limited impacts on area or quality
Localised intensification could affect biodiversity
Dry grassland of high value for wildlife
Wetter conditions could affect dry
grassland species
Lack of concern for environment, with
change to more profitable activities
Wetter conditions could affect dry
grassland species
Wetter conditions could affect dry
grassland species
Dry grassland of low value for wildlife
Converted to more profitable features
Converted to more profitable features
Converted to features offering
greater environmental
benefits
Wetter conditions could affect dry
grassland
Lakes, ponds Increased risk of pollutants getting
into water
Increased risk of pollutants getting
into water
Reduced use of nutrients, pesticides
Lakes/ponds become important
features
Orchards and horticulture
Intensification and increase in inputs
could affect biodiversity
Intensification and increase in inputs
could affect biodiversity
Increase in area to maximise new opportunities
Increase in area to diversity products
to meet local needs
Other Limited increase in development
May be increase in flood risk of development
No significant change in risk
No significant change in risk
Peat works and bare ground Reduction in area
of peat extraction Increase in area of
extraction No peat extraction
Reduction in area of peat extraction
Reedbeds Change in water
levels Reduction in level
of management Increased water
management Risk of drying out
Rivers, streams, ditches, rhynes
Increased risk of pollutants getting
into water
Increased risk of pollutants getting
into water
Reduced use of nutrients, pesticides
High focus on local management of rivers, ditches
Swamp & fen Wetter conditions favour swamp and
fen
Reduction in level of management of feature and water
Management for biodiversity
benefits
Managed for biodiversity
benefits

Executive Summary
- xi -
Table 3: Impact of Socio-Economic Scenarios on the Features
Impact of Socio-Economic Scenarios
World Markets Provincial Enterprise
Global Sustainability
Local Stewardship
Wet grassland of high value for wildlife
Drier conditions could affect wet grassland species
Land may be converted or abandoned
Change in conditions could affect grassland
species
Change in conditions could affect grassland
species
Wet grassland of low value for wildlife
Drier conditions could affect wet grassland species
Converted to more profitable features, may be abandoned
if too wet
Converted to features offering
greater environmental
benefits
Converted to features offering
greater environmental
benefits
Wet heath & purple moor grass habitats
Drier conditions could result in
increased grazing
Converted to more profitable features, may be abandoned
if too wet
Drier conditions could affect wet
heath species
Drier conditions could affect wet
heath species
Woodland, hedgerow, line of trees, scrub, bracken
Limited change
Lack of management could affect biodiversity
value
Increase in area could increase connectivity
Increase in area could increase connectivity
8. Conclusions Table 4 summarises which features are likely to be the most vulnerable, and the climatic and socio-economic changes under which the area and/or environmental quality of the features are most at risk. Although there are significant differences in impacts under the 10% (drier) and 90% (wetter) climate probabilities, there is considerable overlap in terms of which features are most vulnerable, with some features at risk whatever the climatic conditions. The projected changes in area and environmental quality of features have implications for the provision of ecosystem services in the Brue Valley. Such changes will further affect those living and working in the area. For example, improvements to biodiversity could help enhance opportunities for recreation and tourism, with knock-on impacts for the provision of local jobs. Opportunities also exist through investment in the water management regime. Benefits to water regulation can help deliver improved biodiversity (through maintaining water tables in areas of high environmental quality), food production (by maintaining levels of biomass production in grasslands), and emissions of GHGs) and the historic environment and heritage (by reducing the risk that peat soils dry out). 9. Next Steps The next steps involve developing the study findings into engagement tools for consultation with policy makers and local stakeholders. This work will need to involve two aspects:

Executive Summary
- xii -
Table 4: Summary of Projected Vulnerability of Features
Feature Reasoning
Highly Vulnerable
Dry grassland of high value for wildlife
Could be ploughed for arable crops, or improved to be more profitable (under PE).
Wetter conditions (under 90%) could make it more difficult to manage for conservation purposes
Dry grassland of low value for wildlife
Could be ploughed for arable crops (under WM, PE, LS) Could be converted to features offering higher environmental quality
and delivering more ecosystem services (under GS, LS) Wetter conditions (under 90%) could make it more difficult to manage
Reedbeds
Lack of management (under PE) increases risk of succession to scrub Lack of co-ordinated management (under LS) could affect reedbed
connectivity Risk of drying out under 10% with succession to scrub Increased risk of sudden increase in water levels under 90% affecting
species living in reedbeds Wet grassland of high value for wildlife
Wet grassland of low value for wildlife
Could be ploughed for arable crops (under WM, PE, LS and under 10%)
Could be abandoned if becomes too wet (under 90% and under PE) Drier (or wetter) conditions could change the composition of
grassland species
Wet heath and purple moor grass
Could be intensified use of land (more nutrients, pesticides) and increased grazing (under 10% and under WM and PE)
Could be abandoned if becomes too wet (under 90% and under PE) Drier conditions could change the composition of wet heath species
Slightly Vulnerable
Cereal crops Intensification (under PE and LS) could affect biodiversity
Orchards and horticulture Intensification (under PE and LS) could affect biodiversity
Peat works and bare ground Reduction in area of extraction (under WM, GS and LS) could affect
jobs and income
Lakes and ponds
Rivers, streams, ditches, rhynes
Intensification (under PE and LS) could result in increased levels of nutrients and pesticides being washed off land
Swamp and fen Lack of management (under PE) could result in swamp and fen drying
out (under 10%) or change in species composition (under 90%) as more vigorous species dominate
Woodland, hedgerow, line of trees, scrub and bracken
Lack of management (under PE) potentially increases area of scrub and bracken, woodland, etc. but benefits may be limited as any succession would also be unmanaged
Unlikely to be Vulnerable
Other (settlements and roads)
testing the findings of the study: this is particularly important given that the study is built
on scenarios (four socio-economic scenarios and two climate probabilities). In addition, many of the data sources used were at the Somerset level, rather than that of the Brue Valley. Therefore, stakeholder input is vital to ensure that the findings represent what is actually happening on the ground; and
exploring real opportunities for no regrets and ‘good value’ adaptations that can help
deliver social, economic and environmental benefits in the Brue Valley over the next 50 years.

Contents
- xiii -
CONTENTS Page
EXECUTIVE SUMMARY ......................................................................................... i 1. Introduction.................................................................................................................1 1.1 The Need for the Study .................................................................................................1 1.2 Objectives of the Study.................................................................................................2 1.3 Overview of the Tasks ..................................................................................................2 1.4 Organisation of this Report...........................................................................................3 2. Summary of the Baseline............................................................................................5 2.1 Overview.......................................................................................................................5 2.2 Identification of Features ..............................................................................................5 2.3 Description of the Features ...........................................................................................6 2.4 Description of the Current Condition of the Features...................................................9 2.5 Description of Baseline Socio-Economic Data ..........................................................17 2.6 Description of the Biodiversity Value of the Features................................................20 2.7 Baseline Ecosystem Services......................................................................................23 3. Climate Change and Future Scenarios ...................................................................29 3.1 Climate Change...........................................................................................................29 3.2 Development of Future Socio-Economic Scenarios ...................................................42 4. Implications for Features .........................................................................................49 4.1 Introduction.................................................................................................................49 4.2 Thresholds and Optimal Limits for Temperature .......................................................49 4.3 Thresholds and Optimal Limits for Changes in Water Table .....................................52 4.4 Thresholds and Optimal Limits for Flooding .............................................................57 4.5 Other Impacts Associated with Climate Change ........................................................62 4.6 Overall Estimate of Sensitivity of the Features ..........................................................63 5. Impacts by Feature ...................................................................................................67 5.1 Introduction.................................................................................................................67 5.2 Cereal Crops................................................................................................................68 5.3 Dry Grassland of High Value for Wildlife .................................................................75 5.4 Dry Grassland of Low Value for Wildlife ..................................................................84 5.5 Lakes/Ponds ................................................................................................................93 5.6 Orchards and Horticulture.........................................................................................101 5.7 Other (Settlements and Roads) .................................................................................108 5.8 Peat Works and Bare Ground ...................................................................................113 5.9 Reedbeds ...................................................................................................................119 5.10 Rivers/Streams/Ditches/Rhynes................................................................................127 5.11 Swamp and Fen.........................................................................................................136 5.12 Wet Grassland of High Value for Wildlife ...............................................................143 5.13 Wet Grassland of Low Value for Wildlife................................................................152 5.14 Wet Heath and Purple Moor Grass ...........................................................................160 5.15 Woodland/Hedgerow/Line of Trees/Scrub and Bracken..........................................168

Contents
- xiv -
6. Impacts at the Landscape Scale.............................................................................175 6.1 Introduction...............................................................................................................175 6.2 Changes under the World Markets Scenario ............................................................175 6.3 Changes under the Provincial Enterprise Scenario...................................................183 6.4 Changes under the Global Sustainability Scenario...................................................192 6.5 Changes under the Local Stewardship Scenario.......................................................200 6.6 Overall Changes .......................................................................................................207 7. Impacts on Ecosystem Services..............................................................................221 7.1 Introduction...............................................................................................................221 7.2 Level of Confidence in the Projected Change in Ecosystem Services .....................221 7.3 Changes under the World Markets Scenario ............................................................224 7.4 Changes under the Provincial Enterprise Scenario...................................................229 7.5 Changes under the Global Sustainability Scenario...................................................234 7.6 Changes under the Local Stewardship Scenario.......................................................239 7.7 Comparison of Ecosystem Services under the Scenarios .........................................244 7.8 Ecosystem Services Most Vulnerable to Climate Change........................................247 7.9 Ecosystem Services Most Vulnerable to Socio-Economic Change..........................250 8. Conclusions..............................................................................................................253 8.1 Introduction...............................................................................................................253 8.2 Change in Area of Features.......................................................................................253 8.3 Impacts on Socio-Economic Situation......................................................................255 8.4 Change in Environmental Quality ............................................................................256 8.5 Change in Ecosystem Services .................................................................................259 8.6 Key Uncertainties......................................................................................................261 8.7 Next Steps .................................................................................................................261 9. References................................................................................................................263 Annex 1: Mapping of IHS Features to Features used in this Study Annex 2: Description of the Baseline Situation Annex 3: Detailed Assessment of Ecosystem Services Annex 4: Reaction of Features to Climate Change Annex 5: Detailed Scenario Storylines Annex 6: Justification for Feature Sensitivities Annex 7: Structure of the Analysis

List of Acronyms
- xv -
LIST OF ACRONYMS
AST Appraisal Summary Table BAP Biodiversity Action Plan BASC British Association for Shooting and Conservation CAP Common Agricultural Policy CO2 Carbon Dioxide DECC Department of Energy and Climate Change DO Dissolved Oxygen ES Environmental Stewardship ESA Environmentally Sensitive Area ET Evapotranspiration FTE Full-Time Equivalent GHG GreenHouse Gas GIS Geographical Information Systems GM Genetically Modified IDB Internal Drainage Board IHS Integrated Habitat System IPCC Intergovernmental Panel on Climate Change N Nitrogen NGO Non-Governmental Organisation NNR National Nature Reserve NVC National Vegetation Classification MEA Millennium Ecosystem Assessment MG5 NVC community Cynosurus cristatus - Centaurea nigra grassland MG8 NVC community Cynosurus cristatus - Caltha palustris grassland M23 NVC community Juncus effusus/acutiflorus - Galium palustre rush-pasture M24 NVC Community Molinia caerulea - Cirsium dissectum fen-meadow M25 NVC Community Molinia caerulea - Potentilla erecta mire P Phosphorus RSPB Royal Society for the Protection of Birds RWLA Raised Water Level Areas SFP Single Farm Payment SL&M Somerset Levels and Moors SRES Special Report on Emissions Scenarios SSSI Site of Special Scientific Interest SWT Somerset Wildlife Trust UKCP UK Climate Projections WAVE Water Adaptation is Valuable for Everybody WLMP Water Level Management Plan WTP Willingness to Pay

List of Acronyms
- xvi -

Risk & Policy Analysts, Geckoella, Environment Systems
Page 1
1. INTRODUCTION
1.1 The Need for the Study
Climate change is one of the main challenges to be faced by policy makers and local stakeholders in the years to come. As rising global temperatures will bring changes in weather patterns, rising sea levels and greater frequency and intensity of extreme weather, the focus of such policies is moving towards adaptation and not mitigation alone. Climate change also places pressure on wildlife. For example, a 2°C rise in temperature can shift the natural range of some species over 150 miles to the north, or 300 metres higher up hillsides, leading to changes in the wildlife present within a particular area. Indirect effects from changes in land and water management, as people adapt to, for example, potentially more frequent storms, may also have big implications for local ecology. To help people and wildlife cope with climate changes, the Wildlife Trusts have created the ‘Living Landscapes’ initiative. This initiative involves identifying, protecting, enlarging, improving and reconnecting key areas for wildlife. The restoration of healthy landscapes can also help alleviate flooding, control pollution and help wildlife and people adapt to our changing climate. Working with local partners and communities, the creation of inspirational, accessible, wildlife rich landscapes also provides opportunities for learning, better health and sustainable economic development. There are currently more than 100 Living Landscapes across the UK, two projects are based in Somerset: the Mendip Hills, and the Brue Valley. The European Interreg IVB NWE WAVE (Water Adaptation is Valuable for Everybody) project is a collaborative venture with six regional parties in the Netherlands, Germany, England, France and Belgium. The main aim of the project is to prepare for future changes in regional water systems brought about by climate change. The UK project includes the Somerset catchments of the Parrett, Tone, Brue and Axe. Wetland Vision is a partnership of six organisations coordinated by Natural England that will set out a 50-year vision for England’s freshwater wetlands. It will show where new wetlands could be created and current wetlands restored. The hope is that by turning the Vision into reality, partner organisations can make space for water in our countryside, help people and wildlife adapt to a changing climate, protect our heritage and reap the many benefits that wetlands can provide. This study focuses on assessing the environmental and socio-economic impacts of climate change on the Brue Valley. The results will feed into each of the Living Landscape, WAVE and Wetland Vision projects. It will also provide Somerset Wildlife Trust (SWT) with information on future opportunities, covering both the environmental and socioeconomic perspectives.

Environmental and Socio-Economic Impacts of Climate Change in the Brue Valley
Page 2
1.2 Objectives of the Study The overall objectives of the study are:
to provide a scientifically sound assessment of the impacts of climate change on the habitats and land uses in the Brue Valley;
to deliver outputs in formats that can be easily understood and interpreted by the local stakeholders;
to provide a complete record of the study such that the approach is transparent and auditable; and
to assess scenarios that take account of the variety of land uses and which identify the full range of potential impacts (economic, environmental and social).
1.3 Overview of the Tasks To meet these objectives, the study has been divided into the following key
tasks (where Task 1 was the start-up meeting for the project):
2. identify baseline; 3. identify climatic and environmental changes likely to occur in the Brue Valley; 4. identify implications of environmental changes for land use and habitats; 5. identify potential for adaptation; and 6. assess the environmental and socio-economic impacts of climate change.
Each task is associated with one or more outputs: 2. identify baseline:
baseline report and maps. 3. identify climatic and environmental changes likely to occur in the Brue Valley:
task report with maps describing the climatic and environmental changes.
4. identify implication of environmental changes for land use and habitats: task report with maps describing the implications.
5. identify potential for adaptation: task report with maps describing the potential benefits of adaptation;
and information fact sheets illustrating key findings.
6. assess the environmental and socio-economic impacts of climate change: draft final report with maps summarising the findings of all tasks; storylines illustrating the outputs and what they mean on the ground;
and final report with maps.

Risk & Policy Analysts, Geckoella, Environment Systems
Page 3
1.4 Organisation of this Report This report summarises the findings of the study as a whole. It summarises the
findings of each task, with more detail available on each task provided in the annexes to this report. The remainder of the report is structured as follows:
Section 2 provides a summary of the baseline information collected and
analysed in Task 2. It also classifies the various land uses in the Brue Valley into a series of features that are to be used throughout the study as the key land use and habitat types for which the implications need to be described;
Section 3 describes the climatic changes, as predicted by UKCP over the next 50 years. It also provides a summary of the socio-economic scenarios;
Section 4 describes the potential environmental implications of the climatic changes and discusses how these changes could affect the features;
Section 5 provides detailed storylines illustrating how each feature could be affected by climate change, what adaptation measures might be used to minimise any negative effects or maximise the potential to exploit new opportunities and the overall effect of the impacts on land use, biodiversity value and socio-economic aspects of the feature;
Section 6 provides a summary of the cumulative impacts, across all features, and describes what these cumulative impacts could mean at the landscape scale;
Section 7 describes how the cumulative impacts could affect the ecosystem services provided by the Brue Valley;
Section 8 sets out the conclusions of the study; and Section 9 provides the main references.

Environmental and Socio-Economic Impacts of Climate Change in the Brue Valley
Page 4

Risk & Policy Analysts, Geckoella, Environment Systems
Page 5
2. SUMMARY OF THE BASELINE 2.1 Overview This Section summarises the baseline information that is used to assess the
future climate change impacts. This includes identification of a list of key features, based on the range and types of land use present in the Brue Valley. There then follows a description of each feature, the area covered (in hectares), an assessment of the current condition of each feature (including condition status, where appropriate), and socio-economic information. The section also includes a baseline assessment of ecosystem services currently provided by the Brue Valley.
Each table set out below is supported by a more detailed description included
in annexes to this report. 2.2 Identification of Features The habitats that are present in the Brue Valley both determine and are
determined by the land uses that currently exist. These land uses then deliver economic, environmental and social benefits within the Brue Valley. Combining habitats, land uses and the resultant benefits makes it possible to develop a concise list of features to describe the baseline, focusing on the main attributes of the Brue Valley. The results of combining land uses into features are shown in Table 2.1.
Table 2.1: Identifying Features to be Assessed in the Study
Land Use Feature to which Land Use/Habitat is Allocated
Active peat working Peat works and bare ground
Alkaline fen Swamp and fen
Bare ground Peat works and bare ground
Bracken Scrub and bracken
Cereal crop Cereal crops
Coniferous woodland Woodland
Deciduous woodland Woodland
Ditch Ditches and rhynes
Ex-peat working sites
Reedbed Pond/lake Peat works (ongoing extraction) Unrestored peat works
Horticulture Orchards and horticulture
Improved grassland Either dry grassland of low value for wildlife, wet grassland of low value for wildlife, or, for areas in RWLA (see WLMP) wet grassland of high value for wildlife
Intensively managed orchard Orchards and horticulture
Line of trees Hedgerow/line of trees Lowland meadow with acid indicators
Dry grassland of high value for wildlife

Environmental and Socio-Economic Impacts of Climate Change in the Brue Valley
Page 6
Table 2.1: Identifying Features to be Assessed in the Study
Land Use Feature to which Land Use/Habitat is Allocated Lowland meadow with calcareous indicators
Dry grassland of high value for wildlife
Marginal and inundation vegetation
Swamp and fen
Other lowland fen Swamp and fen
Pond/lake Pond/lake
Reedbed Reedbeds
River/stream River/stream
Species-rich rush pasture Wet grassland of high value for wildlife
Species-poor dry grassland Dry grassland of low value for wildlife
Species-poor hedgerow Hedgerow/line of trees Species-poor purple moorgrass pasture
Wet grassland of high value for wildlife
Species-poor wet grassland Wet grassland of low value for wildlife, or, for areas in RWLA (see WLMP) wet grassland of high value for wildlife
Species-rich dry grassland Dry grassland of high value for wildlife
Species-rich hedgerow Hedgerow/line of trees Species-rich purple moorgrass pasture
Wet grassland of high value for wildlife
Swamp Swamp and fen
Traditional orchard Orchards and horticulture
Wet heath Wet heath and purple moor grass habitats
Wet woodland Woodland
Other This includes settlements and roads
The feature typology and definitions used for features are, where practicable, compatible with Integrated Habitat System (IHS) definitions, a habitat classification system developed by Somerset Environmental Records Centre that integrates, for example, National Vegetation Classifications (NVC) with Phase I (JNCC 2007) and other botanical communities and land use typologies. This is because a robust IHS dataset for the Brue Valley has already been developed and because the IHS system allows for the integration of both habitat and land use information. Annex 1 provides more detail on how the HIS features map onto the features used here. Map 2.1 shows the distribution of each feature in the Brue Valley.
2.3 Description of the Features The area covered by each feature and a brief description of the key land uses,
habitat types and crop types are given in Table 2.2. More detail on each feature is provided in Annex 2 (the baseline Appraisal Summary Table, AST). Note that for the purposes of this study, the area considered is all land within the Brue Valley which is below 5m AOD as shown on the Ordnance Survey map.

Risk & Policy Analysts, Geckoella, Environment Systems
Page 7
Map 2.1: Distribution of Features in the Brue Valley

Environmental and Socio-Economic Impacts of Climate Change in the Brue Valley
Page 8
Table 2.2: Describing of the Features and Area Covered
Feature Details
Land producing cereals (e.g. winter wheat, fodder maize, etc.) as part of a rotation Cereal crops 381 ha, or 4% of the total area
Comprises species rich grassland, including National Vegetation Community MG5. The grassland is grazed, and used to produce hay as feed for livestock as part of a low input extensive farming system
Dry grassland of high value for wildlife
58 ha, or 1% of the total area
The grassland is grazed by cattle and sheep, and is used to produce silage or hay as feed for livestock
Dry grassland of low value for wildlife 4,057 ha, or 42% of the total area
Open water features in several SSSIs including Catcott, Edington and Chilton Moors, Tealham and Tadham Moor, Westhay Moor, Shapwick Heath, Westhay Heath, Street Heath and Sharpham Moor Plot. Species present include UK BAP species such as otters and water voles
Lakes/ponds
347 ha, or 4% of the total area
Crops include vegetables and salad, top fruit, small fruit, nursery stock and bulbs and flowers Orchards and
horticulture 39 ha, or 0.4% of the total area
Classified roads within case study area include B3151 (heads south to Westhay before going southeast to Glastonbury) and B3141 (cuts across western edge). Most other roads are unclassified. Provision of footpaths and bridleways is seen as poor due to historic reasons. Car parks at Westhay Moor NNR and at Ashcott Corner
Other (roads)
Total for ‘other’ is given as 855 ha (8% of the total area)
Main settlements in case study area are Westhay and Oxenpill. Smaller settlements include Upper Godney, Lower Godney, Burtle and Catcott Burtle. Population of around 17,000 (based on King Alfred and Mendip West)
Other (settlements)
Total for ‘other’ is given as 855 ha (8% of the total area)
Area supplies 8-10% of the UK domestic market for peat each year Peat works and bare ground 365 ha, or 4% of the total area
Species present include submerged plants as well as tall stands of Phragmites australis and Typha latifolia Reedbeds 326 ha, or 3% of the total area
Features act as drainage for area, but also as reservoirs and wet fences. The features are heavily managed to provide this dual role of drainage and water supply. The features are also important for angling
Rivers/streams/ ditches/rhynes
22 ha, or 0.2% of the total area
The habitat features in several SSSIs including Catcott, Edington and Chilton Moors, Tealham and Tadham Moor, Westhay Moor, Shapwick Heath, Westhay Heath, Street Heath and Sharpham Moor Plot. This habitat generally fringes open water and reedbed, with tall emergents such as Common bulrush Typha latifolia and Reed canary grass Phalaris arundinacea. It also includes occasional patches of sedge-rich fen habitat, generally found in wetland mosaics with the nature reserves. The UK BAP species Caprimulgus europaeus (nightjar) is present on raised bog
Swamp and fen
158 ha, or 1.5% of the total area

Risk & Policy Analysts, Geckoella, Environment Systems
Page 9
Table 2.2: Describing of the Features and Area Covered
Feature Details
This feature includes two distinct sub-features: • Raised Water Level Areas (RWLA), generally managed for wetland
birds (breeding waders and overwintering waterfowl); and • flower-rich wet meadows, supporting Marsh-marigold Caltha palustris
and Southern Marsh Orchid Dactylorhiza praetermissa. The current grassland regime requires lower water levels in winter (achieved by pumping) and higher water levels in summer (by impounding water in the major rivers and diverting it into rhynes). This feature also requires intensive land management with very specific grazing and cutting regimes
Wet grassland of high value for wildlife
953 ha, or 10% of the total area
Area is an essential part of the largest lowland wet grassland remaining in England
Wet grassland of low value for wildlife 2,439 ha, or 26% of the total area
Feature is important for biodiversity. It typically supports Erica tetralix and Molinia caerulea Wet heath and
purple moor grass 67 ha, or 1% of the total area
Hedges are scattered around the Brue Valley, for example in the Brue Lowlands, there are low hedges but very little woodland. Areas of scrub and bracken are also scattered, for example there is scrub and young woodland on Godney Island (a low irregular ridge), as well as on Godney/Meare Moors, and Meare Heath to Queen’s Sedge Moor
Woodland/hedgerow/ line of trees/scrub and bracken
341 ha, or 4% of the total area
2.4 Description of the Current Condition of the Features The current condition of the features is important as it affects how robust they
may be to climate change. Table 2.3 summarises information available on the current condition of each feature, in terms of their capacity to deliver environmental and socio-economic benefits, supplemented by information on current trends (where available). Where possible, habitat information draws on the condition assessments undertaken by Natural England for the SSSIs that are present within the area. Map 2.2 shows the current water levels for winter and summer in the Brue Valley. These water levels are important in helping to maintain the condition of the features. Map 2.3 shows the location of existing peat workings, and areas from where peat may be extracted in the future. The legend used in Map 2.3 is based on the following assumptions relating to risk:
Low: areas with high water levels (based on the summer and winter
levels); Medium: areas with medium water levels; and High: areas with low water levels.
The assessment of peat degradation is therefore based on the risk of soils drying out.

Environmental and Socio-Economic Impacts of Climate Change in the Brue Valley
Page 10
Table 2.3: Baseline Condition of the Feature
Feature Details Trends
Cereal crops
Cereal farming is mainly to provide additional food for livestock. It requires high inputs including water management, fertilisers and pesticides. Government support is needed to maintain farm incomes (Single Farm Payment, Environmental Stewardship). Arable crops, such as maize, can be widely visible in the flat and predominantly pastoral landscape
Intensification including drainage, especially through latter half of 20th Century, led to increase in feature. Since 1984, grant aid from Government has shifted from field drainage and the lack of subsidy (combined with agri-environment payments (especially through ESA) to support extensive use of land and preclude further drainage) reduced the amount of new drainage being carried out. New techniques plus declines in farm incomes fuels further changes, e.g. winter sown crops, more maize. Fluctuating income from cereals (currently high prices, but national decrease in farm income since 1997). High prices could (with a reduction in agri-environment payments) make it worthwhile restoring or enhancing drainage for agricultural production. Fall in FTE / increase diversification. Increasing profile for food and energy security. Recent increase in maize since mid-1990s due to its greater value for feeding to livestock in the winter months
Dry grassland of high value for wildlife
47% found within SSSIs and 25% in WLMP. Low profit supplemented with SFP and agri-environment payments
Condition assessments show most dry grassland of high value for wildlife is in unfavourable recovering condition. Environmental quality has been supported and maintained through agri-environment payments (e.g. ESA), with concerns that move to Environmental Stewardship could reduce income to farmers with potential impacts on management of the land for landscape and other benefits. The ESA has helped retain areas of grassland of high value for wildlife through the scheme prescriptions, requiring maintenance of grassland, avoiding overgrazing, controls on fertiliser use, controls on drainage, etc. The 1996 review of ESAs concluded that the scheme had been generally successful in arresting the ploughing up of grasslands. Problems in some areas where under-grazing with risk of scrub invasion (such that some is in unfavourable recovering condition, being addressed through WLMP, ESA and HLS agreements and improvements to water quality works)

Risk & Policy Analysts, Geckoella, Environment Systems
Page 11
Table 2.3: Baseline Condition of the Feature
Feature Details Trends
Dry grassland of low value for wildlife
11% found within SSSIs and 14% in WLMA. Dairy, beef and silage farming requires high inputs (e.g. machinery, veterinary care, etc.) including water management. Government support (SFP, ES) important to farm incomes
Intensification including drainage, especially through latter half of 20th Century, led to increase in feature. More recent decline in farm incomes leads to further changes, e.g. switch to fewer, larger farms and herds / localised land abandonment. Government support now increasingly requires delivery of wider benefits (SFP, ES), with the ESA helping to retain grassland
Lakes/ponds Some local water quality issues due to diffuse and point sources of pollution
Condition of around 80% of standing open water in SSSIs is favourable, 18% is unfavourable recovering
Orchards and horticulture
Food production is maintained through high inputs such as pesticides, labour, etc.. Small areas of old, traditional orchards remain on slightly higher ground adjacent to farms and hamlets. Withy production is an important local character land use in SL&M and is a dynamic industry with the location of withies changing each decade. Farm income relatively independent of government support
Small, old orchards on the edges of the Levels are in decline through neglect and removal. Some were destroyed when the Single Farm Payment was introduced. Potential to move to more energy crops (short rotation coppice (withy beds) and Miscanthus)
Other (roads and utility infrastructure)
Minor roads would suffer from flooding or water logging without appropriate maintenance of flood defences, main rivers and IDB Viewed Rhynes. Subsidence on peat soils
Possible new pylon routes linking Hinckley Nuclear Power Station to National Grid
Other (settlements)
Most settlements are on higher ground, outside the floodplain. Urban edge development and new roads can be very intrusive in an open landscape
Some modern development in SL&M has been inappropriate to the character of the villages. Counter-urbanisation as more people prefer living in the country, including Bristol commuters but especially older people. High prices and demand
Peat works and bare ground
Brue Valley has 2-3m thick deposits that are normally extracted over a 10-20 year period, down to the underlying clay, for horticultural purposes. There are extensive areas of high subsurface archaeological interest which require careful management of the water regime and monitoring of drainage operations
Minerals Core Strategy links to National Planning Policy where ‘future extraction should be restricted to areas which have already been significantly damaged by recent human activity and are of limited or no current nature conservation or archaeological value’. Recent Defra consultation on policies to reduce peat use in horticulture in England (note that this closed on 11 March 2011. It included proposals to phase out peat use by gardeners, growers and procurers by 2030 at the latest1)
1 See Defra’s Internet site (http://www.defra.gov.uk/news/2010/12/17/peat/).

Environmental and Socio-Economic Impacts of Climate Change in the Brue Valley
Page 12
Table 2.3: Baseline Condition of the Feature
Feature Details Trends
Reedbeds
Robust habitat with high wildlife and landscape value. Part of successional change from peat workings to wet woodland, so requires management, usually by GO or NGO, to maintain in current status
Reedbeds generally (98%) in favourable condition in SSSIs (or recovering due to restoration of peat voids), with only 2% in unfavourable but recovering condition
Rivers/streams/ ditches/rhynes
Ecological status of River Brue is Moderate (2009) predicted to be Good (2015). This is mainly linked to phosphate levels (which are rated as being moderate). Ecological status of the South Drain is Moderate Potential (2009), predicted to remain at Moderate Potential (2015). It currently has Poor status for phosphates. Ecological status of the North Drain is also Moderate Potential (2009), predicted to remain Moderate Potential (2015). Note North Drain currently has Bad status for dissolved oxygen and Poor status for phosphates. Aquatic plant samples taken in Somerset in 2007 found a marked increase (compared with the 1980s) in the frequency of stoneworts and common bladderwort (indicators of good water quality), but also an increase in duckweed (generally a sign of nutrient enrichment)
Analysis of trends of 18 characteristic ditch fauna species from 1900 to 1997 shows decline throughout much of 20th Century due to desiccation because pumping has lowered winter water levels High proportion of ditches (around 80%) in SSSIs is in unfavourable condition (no change or recovering) due to water quality, drainage, scrub and poor ditch profile. Management plan works put into place to help address shade and scrub issues. The ESA scheme has helped maintain and enhance diversity through the maintenance of ditches, and ditch fauna through restricting the use of herbicides. Samples of ditch invertebrates taken in 2007 found more species and slightly higher Species Quality Index compared with surveys in the 1980s. There was also a general increase in the number of aquatic species per sample, but a decrease in rooted submerged species
Swamp and fen High or good species diversity noted in some SSSI units (e.g. Westhay Moor)
High proportion (64%) in favourable/recovering condition, but 7% is unfavourable declining and almost 29% is in unfavourable condition no change due to drainage and peat extraction

Risk & Policy Analysts, Geckoella, Environment Systems
Page 13
Table 2.3: Baseline Condition of the Feature
Feature Details Trends
Wet grassland of high value for wildlife
43% in SSSI and 50% in WLMA. Current grassland management regime requires lower water levels in winter (achieved by pumping) and higher water levels in summer (achieved by impounding water in major rivers and diverting it into rhynes). This feature also requires particular land management with very specific grazing and cutting regimes. NGO / GO heavily involved through ownership / advice provision
Issues with drainage and under-management mean that around 83% of wet grassland in SSSIs is unfavourable, but expected to recover its biodiversity value due to planned state-funded management. A further 11% is in unfavourable condition no change, with 6% in favourable condition. Management for biodiversity and other benefits has been supported through agri-environment payments (e.g. ESA). The objective of the SL&M ESA was to protect and, where possible, enhance the wet permanent grassland character of the area, and its special landscape, wildlife and historic interests, by encouraging the maintenance and adoption of extensive pastoral farming systems. This includes minimising the use of fertilisers and management of the land to help benefit breeding and over-wintering birds. Species diversity found to have increased before and after ESA (1980-1997), with evidence that species decline was starting to be reversed. The 1996 review of ESAs concluded that the scheme had been generally successful in arresting the ploughing up of grasslands
Wet grassland of low value for wildlife
48% in SSSI and 50% in WLMA. Dairy, beef and silage farming requires high inputs including water management, machinery, veterinary care, etc.
Intensification and drainage through latter half of 20th Century. Declines in abundance and diversity of flora started by 1900. Data from 1940s to 1980s shows clear link between extent of drainage and diversity of flora. Decline in dairy – switch to fewer, larger herds. Government support now increasingly requires delivery of wider benefits (ESA, ES)
Wet heath and purple moor grass
Grazing and scrub management used to maintain sward composition and structure
The majority of wet heath and purple moor grass is in favourable, or unfavourable recovering condition. NGO / GOs own most of this feature. Remnants of previously extensive wetland habitat
Woodland/ hedgerow/line of trees/scrub and bracken
Wet woodland is present in areas previously used for peat extraction
Almost all woodland in SSSIs (254 ha) is in favourable condition. Pollarding of willows had been in decline, but was included in the ESA requirements and conservation plan operations, which has helped stem the decline to some degree

Environmental and Socio-Economic Impacts of Climate Change in the Brue Valley
Page 14
Table 2.3: Baseline Condition of the Feature
Feature Details Trends
Notes: Information on trends draws on the following sources: ADAS, Somerset Levels and Moors Sensitive Area : Landscape Assessment. Defra (2002): Somerset Levels and Moors ESA, Guidelines for Farmers. Defra (2002): Environmentally Sensitive Areas Scheme Prescriptions, Somerset Levels and Moors ESA. Environment Agency ecological status assessment (South & West Somerset Catchment). Lobley IF et al (2009): Analysis of Socio-Economic Aspects of Local and National Organic Farming Markets, Report to DEFRA, University of Exeter. National Audit Office (1997): Protecting Environmentally Sensitive Areas (1996 Review of ESAs), HMSO, London. Natural England: Somerset Levels and Moors/Mid Somerset Hills, Character Area 142/3. Natural England: Nature on the Map, Condition of SSSI units (based on assessments in 2009, 2010). Natural England (then English Nature) (1997): Somerset Levels and Moors Natural Area, A Nature Conservation Profile, July 1997. Palmer M (2008): The Ecological Status of Ditch Systems, Report to Buglife on progress in 2007. Somerset County Council (2009): Somerset Peat Paper, Consultation for the Minerals Core Strategy. Spedding A (2009): Environmental Impacts – Lowland Water Level Management and Drainage, RuSource Briefing 925. Swetnam RD et al (2004): Agri-environmental Schemes: Their Role in Reversing Floral Decline in the Brue Floodplain, Somerset, UK, J Environ Manage, 71(1), pp79-93. Winter DM (2002): Rural Policy: New Directions and New Challenges, Report to SWRDA, University of Exeter.

Risk & Policy Analysts, Geckoella, Environment Systems
Page 15
Map 2.2: Winter (top) and Summer (bottom) Water Levels in the Brue Valley

Environmental and Socio-Economic Impacts of Climate Change in the Brue Valley
Page 16
Map 2.3: Location of Active Peat Workings and Areas where Future Peat Extraction May Take Place

Risk & Policy Analysts, Geckoella, Environment Systems
Page 17
2.5 Description of Baseline Socio-Economic Data The features within the Brue Valley support a number of different industries:
agriculture, fishing, conservation management, recreation and tourism. Income generated from each of these industries then supports jobs within the local (and wider) area. Table 2.4 summarises information on the economic activities that take place within the Brue Valley and the sectors, number and type of jobs supported. More information is available in Annex 2 (baseline Appraisal Summary Table). One of the key sectors for employment is agriculture. Map 2.4 shows how the value of food production varies across the Brue Valley. Conservation is considered an economic sector in this table, encompassing land management (jobs, contracts, agri-environment payments). Premiums for conservation-grade products are accounted for under agriculture, and increases in visitor numbers and time spent in the Brue are accounted for under tourism.
Table 2.4: Jobs and Income Supported by the Features
Feature Socio-Economic Data Details
Sectors supported Agriculture (mainly as additional feed for livestock)
Cereal crops Jobs/income
Somerset 2009: 465 cereal holdings, 116 general cropping holdings. Brue Valley: estimated 11 jobs are associated with cereal farming, gross income estimated at £340,000/year
Sectors supported Agriculture (grazing livestock), Conservation and Tourism (as part of a suite of features)
Dry grassland of high value for wildlife Jobs/income
Dry grassland of high value for wildlife supports around 1 farming job and provides annual income of around £66,000. It also attracts wildlife tourists to the area, and is one of the features supporting around 280 tourism and conservation jobs in the Somerset Levels and Moors.
Sectors supported Agriculture (dairy farming, grazing livestock) Dry grassland of low value for wildlife Jobs/income
Brue Valley: estimated that the dry grassland of low value for wildlife supports around 189 farming jobs (dairy and beef/sheep farming)
Sectors supported Tourism, Angling and Conservation
Lakes/Ponds Jobs/income
Tourism: see above South West 2009: expenditure by anglers on fishing inland waters totalled around £100 million1. Fishing jobs: 3 people employed in fishing in West Poldens Ward in 2001
Sectors supported Horticulture and Withy production
Orchards and horticulture Jobs/income
Somerset 2009: 454 horticultural holdings. Brue Valley: estimated that there are 31 jobs supported by orchards and horticulture, with gross income of £480,000 per year. No job numbers are available for withy production
Sectors supported Indirectly supporting all sectors Other (roads)
Jobs/income Indirectly supporting all jobs and income

Environmental and Socio-Economic Impacts of Climate Change in the Brue Valley
Page 18
Table 2.4: Jobs and Income Supported by the Features
Feature Socio-Economic Data Details
Sectors supported
Rural Mendip: most common industries employing people aged 16-74 are wholesale and retail trades - repairs; manufacturing; and real estate, renting and business activities. Rural Sedgemoor: most common industries are wholesale and retail trade - repairs; manufacturing; and health and social work
Other (settlements)
Population
Wedmore and Mark Ward: 3,161 people economically active in 2001; West Poldens Ward: 1,750; Moor Ward: 1,995; East Poldens Ward: 1,507. Average workplace based gross weekly earning in 2009: Mendip £386.40 and Sedgemoor £354.70
Sectors supported Peat extraction
Peat works and bare ground Jobs/income
Somerset 2007: 42 people employed in peat extraction. Majority of these are likely to be in the Brue Valley due to the location of the peat production zones. Somerset supplies around 8-10% of annual UK domestic market for horticultural peat
Sectors supported Tourism and Conservation
Reedbeds Jobs/income
It attracts wildlife tourists to the area, and is one of the features supporting around 280 tourism and conservation and land management jobs in the Somerset Levels and Moors.
Sectors supported Tourism, Angling and Agriculture (wet fences and water supply) Rivers/streams
/ ditches/ rhynes Jobs/income
Tourism and Angling: see figures above Huntspill River is one of the premier coarse fisheries in the country
Sectors supported Tourism and Conservation Swamp and fen Jobs/income Tourism: see figures above
Sectors supported Tourism, Agriculture (beef grazing and dairy farming) and Conservation
Wet grassland of high value for wildlife Jobs/income
The wet grassland of high wildlife value could support around 46 livestock farming FTE jobs (4 dairy and 42 beef) and provides annual income of around £390,000, although the land is managed to deliver multi-benefits with agri-environment payments used to offset reductions in yield and output due to extensive land management
Sectors supported Agriculture (dairy farming, grazing livestock) Wet grassland of low value for wildlife Jobs/income
Agriculture: estimated that the Brue Valley supports around 237 livestock farming jobs
Sectors supported Tourism, Conservation Wet heath and purple moor grass Jobs/income Tourism: see figures above
Sectors supported Tourism, Conservation Woodland/hedgerow/line of trees/scrub and bracken
Jobs/income Tourism: see figures above
Notes: 1 See http://www.basc.org.uk/en/media/pressreleases.cfm/prid/8C7B691D-66E2-4B3A-A75693F01C2FBA8A 2 From Mills et al (2000) cited in Acreman et al (in press)

Risk & Policy Analysts, Geckoella, Environment Systems
Page 19
Map 2.4: Distribution of Food Production in the Brue Valley

Environmental and Socio-Economic Impacts of Climate Change in the Brue Valley
Page 20
2.6 Description of the Biodiversity Value of the Features An assessment of the current biodiversity value of each feature provides
information that can be used when assessing the change in biodiversity value due to climate change. Table 2.5 provides a summary of the biodiversity value. More information is available in Annex 2 (baseline Appraisal Summary Table). Map 2.5 shows the distribution of areas of low, medium and high biodiversity value. The map legend is based on the following assumptions:
high biodiversity value: includes IHS data on:
o species-rich grassland (wet and dry); o species-rich hedgerow; o deciduous and scrub woodland; o lowland meadow and fen; o marginal and inundation vegetation; and o reedbed and swamp.
medium biodiversity value: includes IHS data on: o species-poor grassland (wet and dry); o species-poor rush pasture; o species-poor hedgerow; o coniferous woodland, line of trees and bracken; and o improved grassland.
low biodiversity value: includes IHS data on: o bare ground; o active peat workings and ex-peat workings (not restored); and o cereal crops and intensively managed orchards.
Table 2.5: The Biodiversity Value of the Features
Feature Details
Cereal crops Unlikely to be of significant biodiversity value
Dry grassland of high value for wildlife
Comprises species rich grassland, including National Vegetation Community MG5 and SSSI features. As well as biodiversity benefits, the grassland is grazed, and used to produce hay as feed for livestock as part of a low input extensive farming system
Dry grassland of low value for wildlife
The grassland is grazed by cattle and sheep, and is used to produce silage or hay as feed for livestock. The current grassland regime receives lower water levels in winter (achieved by pumping) and higher water levels in summer (by impounding water in the major rivers and diverting it into rhynes)
Lakes/Ponds
This feature generally represents a successional habitat following peat extraction, eventually silting up to reedbed and wet woodland. It is also important for biodiversity, comprising key features in several SSSIs including Westhay Moor and Shapwick Heath. This feature is of international importance, because it helps to support over-wintering waterfowl such as Wigeon Anas penelope and Pochard Aythya ferina. It also supports UK BAP mammals such as otters and water voles. There are some local water quality issues relating to diffuse and point sources of pollution
Orchards and horticulture
A few traditional orchards are still present (around 35 ha)
Other (roads) Unlikely to be of significant biodiversity value
Other (settlements) Unlikely to be of significant biodiversity value

Risk & Policy Analysts, Geckoella, Environment Systems
Page 21
Table 2.5: The Biodiversity Value of the Features
Feature Details
Peat works and bare ground
Unlikely to be of significant biodiversity value when peat is being extracted. Potential for restoration after extraction
Reedbeds
Dominated by tall stands of Common reed Phragmites australis, with occasional herbs such as Marsh bedstraw Galium palustre. Reedbeds help support several UK BAP species including the Bittern Botaurus stellaris and Reed bunting Emberiza schoeniclus. The presence of reedbeds is likely to help support the tourism industry of the Brue Valley, and, as well as contributing towards the biodiversity of the area by providing habitat for high profile species such as the bittern, help manage water quality and flow. Reedbeds can also be highly productive
Rivers/streams/ ditches/rhynes
Ditches and rhynes are wet fences and irrigation sources for agriculture in summer, and are also a key feature for several SSSIs, providing habitat for rare ditch flora such as Greater water parsnip Sium latifolium and invertebrates e.g. Shining Ram’s-Horn snail Segmentina nitida. Water level management is important for the maintenance of ditch biodiversity and lower winter water levels have negatively affected several ditch flora and fauna over the years. Angling currently occurs on the Brue, Cripps, South Drain, North Drain and Huntspill, with species present including roach, bream, tench, pike, chub, carp and eel
Swamp and fen
This habitat generally fringes open water and reedbed, with tall emergents such as Common bulrush Typha latifolia and Reed canary grass Phalaris arundinacea. It also includes occasional patches of sedge-rich fen habitat, generally found in wetland mosaics with the nature reserves
Wet grassland of high value for wildlife
This feature includes two distinct sub-features: Raised Water Level Areas (RWLA), generally managed for wetland birds
(breeding waders and overwintering waterfowl); and flower-rich wet meadows, supporting Marsh-marigold Caltha palustris
and Southern Marsh Orchid Dactylorhiza praetermissa. The current grassland regime requires lower water levels in winter (achieved by pumping) and higher water levels in summer (by impounding water in the major rivers and diverting it into rhynes). This feature also requires intensive land management with very specific grazing and cutting regimes. Issues with drainage, undergrazing and under-management mean that around 84% of wet grassland in SSSIs is unfavourable, but expected to recover its biodiversity value due to planned state-funded management
Wet grassland of low value for wildlife
The wet grassland is used to graze beef and dairy livestock or for silage/hay production. The current grassland regime requires lower water levels in winter (achieved by pumping) and higher water levels in summer (by impounding water in the major rivers and diverting it into rhynes)
Wet heath and purple moor grass
The small area of wet heath is important for the biodiversity of the Brue Valley area. It includes relict Sphagnum rich lowland raised bog areas, representing a habitat that was once extensive across the Brue Valley, with Bog asphodel Narthcium ossifragum and Round-leaved sundew Drosera rotundifolia. This feature also includes heathy Molinia grassland, supporting rare invertebrates such as Large Marsh Grasshopper Stethophyma grossum (although the status of this species is currently unclear)
Woodland/ hedgerow/line of trees/scrub and bracken
Hedges, scrub and bracken are scattered around the Brue Valley. Wet woodland is present in areas previously used for peat extraction. Wet woodland has value as an adaptive feature for floodplain management. It helps to manage water flow, generally conserve peatlands and aids greenhouse gas balance, and is relatively easy to manage. In addition, it is a feature that many others will tend towards in the absence of management

Environmental and Socio-Economic Impacts of Climate Change in the Brue Valley
Page 22
Map 2.5: Distribution of Areas of Low, Medium and High Biodiversity Value

Risk & Policy Analysts, Geckoella, Environment Systems
Page 23
2.7 Baseline Ecosystem Services
To assess the current value of ecosystem services provided in the Brue valley, it is first necessary to identify which ecosystem services should be considered. This involved a review of reports and studies that identified a wide range of different ecosystem services, although most were based on the Millennium Ecosystem Assessment. A total of 38 different ecosystem services were identified. These services were then considered in terms of where there could be double counting.
The ecosystem services were also considered in terms of the economic,
environmental and social benefits that they deliver, linked to those in Tables 2.3 to 2.5, above. In addition, consideration was given as to whether services would be directly or indirectly affected by climate change. Given the uncertainties involved, only those services directly affected by climate change (and potential land use changes) are considered further. The services considered, excluded and carried forwards are shown in Table 2.6. The Table also gives a summary of the ecosystem services provided, where possible, with quantified and monetised measurements. More information, including references and background to assumptions, is available in Annex 3 (ecosystem services).
Map 2.6 shows the assessment of carbon sequestration benefits in the Brue
Valley. This comprises part of the assessment of Greenhouse Gas (GHG) balance. This map also gives an indication of the current location of areas where there are carbon losses. The legend used in Map 2.6 is based on the following assumptions:
low: cereal crops; medium: swamp, alkaline fen and lowland fen; high: species-rich purple moor grass pasture, rush pasture, wet grassland,
dry grassland; species-poor purple moor grass pasture, rush pasture, wet grassland, dry grassland; improved grassland; lowland meadow with calcareous indicator and lowland meadow with acid indicator; scrub woodland; and
carbon loss: cereal crops (when harvested), active peat working, ex-peat working (not restored).
Map 2.7 shows the soil carbon content in peat soils. This information is important when considering future land use changes, or drying of soils under warmer conditions, as such changes could result in carbon emissions. The legend is based on Brue Peat Soils series: low: Allerton, Butleigh, Catcott complex, Compton, Evesham, Fladbury,
Landford, Long Load, Podimore, Polsham, Somerton, Spetchley, Wentlloog and Worcester;
medium: Midelney; and high: Turbary Moor Complex, Sedgemoor Series, Hurcot complex,
Godney deep and Godney.

Environmental and Socio-Economic Impacts of Climate Change in the Brue Valley
Page 24
Table 2.6: Ecosystem Services
Ecosystem Service Carried
Forward? Baseline Description of Services
Supporting Services
Photosynthesis NO
Primary production NO
Soil formation NO
These services are assumed to underpin the other services so are not considered separately to avoid double counting
Provisioning Services
Biochemicals, natural medicines and pharmaceuticals
YES No baseline services, but could be opportunities under climate change
Biodiversity YES
Area of high value features for biodiversity make up 1,931 ha (19% of the total area), including wet and dry grassland of high value for wildlife, wet heath and purple moor grass, swamp and fem, reedbeds, lakes and ponds, river, streams, ditches and rhynes. These habitats support nationally and internationally important features, including breeding waders, overwintering wildfowl, botany, flora, invertebrates, and waterbirds. Features of moderate importance for biodiversity (but nonetheless rich in farmland UK BAP priority species such as Barn owl Tyto alba) make up 6,876 ha (66% of the total area). Features of low importance as compared to the above features make up 1,601 ha (15% of the total area)
Fibre production YES No baseline services, but could be opportunities under climate change
Food production YES
Area used for production of beef, dairy products and cereal crops (although much of this is for feeding of livestock). It is estimated that the annual value of food production is around £8.8 million. Food production is also estimated to support around 580 jobs
Fuel provision YES No baseline services, but could be opportunities under climate change
Genetic resources NO Considered to be captured under other services (e.g. biodiversity)
Ornamental resources YES Harvesting of willow has a considerable economic and cultural association with the area. It is mostly used for basketry but also for traditional furniture, cricket bats, artists’ charcoal and chair seating.
Peat for horticulture YES
985 ha currently used or planned for peat extraction, with around 90,000m3 of peat being extracted per year. In 2007, 42 people were employed in the peat extraction industry in Somerset (excluding those employed in growing media factory sites). By 2008, this had reduced to 34. There are 860 ha of previous extraction sites that have been (or are being) reclaimed with water levels being restored to the summer pen level adopted for that area
Provision of freshwater (and availability of freshwater)
YES
There are some local water quality issues relating to diffuse and point source pollution. Operation of pumping stations and weed-cutting can cause significant drops of DO in the summer. However, these effects are not known to produce any negative impacts in terms of drinking water (for people or livestock), although effects on biodiversity may arise
Provision of habitat NO Considered to be captured under other services (e.g. biodiversity)
Renewable energy YES No baseline services, but could be opportunities under climate change
Timber provision YES No baseline services, but could be opportunities under climate change

Risk & Policy Analysts, Geckoella, Environment Systems
Page 25
Table 2.6: Ecosystem Services
Ecosystem Service Carried
Forward? Baseline Description of Services
Regulating Services
Air quality regulation NO Unlikely to be relevant at Brue Valley scale (any small-scale impacts will be picked up under microclimate)
Bioremediation of waste
NO Unlikely to be relevant at Brue Valley scale
Emissions of GHGs YES
Peat soils emit GHG on mineralisation/drying, they also emit methane on re-wetting; but emissions of CO2 and N2O are suppressed. Maintaining permanently wet peat soils will, therefore, result in benefits (covered under climate regulation and greenhouse gas balance). Peat conservation also assists with conservation of archaeological and other heritage, and water table / flow management. Total emissions of GHGs depends on the area under different land uses and the estimated Global Warming Potential (GWP) of the emissions. As there is considerable uncertainty over the emission factors (especially for the Brue Valley specifically), an absolute measure of current GHG emissions is not estimated
Sequestration of GHGs YES As with emission factors, measures of sequestration of CO2 are highly variable. Therefore, an absolute measure of CO2 sequestration under the baseline is not provided
Microclimate YES
Weather stations in the Brue Valley show the air has a higher daytime humidity and slightly lower temperature, leading to lower vapour pressure and a reduction in evaporation. Lower temperatures could be beneficial to people and livestock, although higher humidity may be less favourable. Enhanced evaporation over a wetland surface can moisten and cool the lower atmosphere. The wetland can also change the cloud cover. The size of these impacts varies according to the size of the wetland, the contrast with surrounding regions and weather patterns
Nutrient and sediment cycling
YES
Value of N cycled: 1.4 million kg N per hectare per year x £8.82 = £12 million. Value of P cycled: 204,000 kg P per hectare per year x £12.72 = £2.6 million. (based on value estimates for removal and treatment of £8.82 per kg N per hectare per year and £12.72 per kg P per hectare per year)
Pest and disease control
YES
Effects on agricultural production of increases in pests and diseases due to increase in temperature are accounted for under agriculture. Effects on human health from possible temperature increase, e.g. Aedes mosquitoes, included under physical and mental health and well-being
Pollination NO Unlikely to be relevant at Brue Valley scale
Production of atmospheric oxygen
NO Unlikely to be relevant at Brue Valley scale
Water quality regulation
YES
Water quality issues are cited as one of the reasons why ditches, rhynes, lakes and ponds are not in favourable condition. There are local water quality issues due to diffuse and point sources of pollution. Inputs from intensive agriculture are absorbed by aquatic vegetation, which is then cut and composted. In this way, ditches and rhynes help regulate water quality, including for areas downstream of the Brue Valley
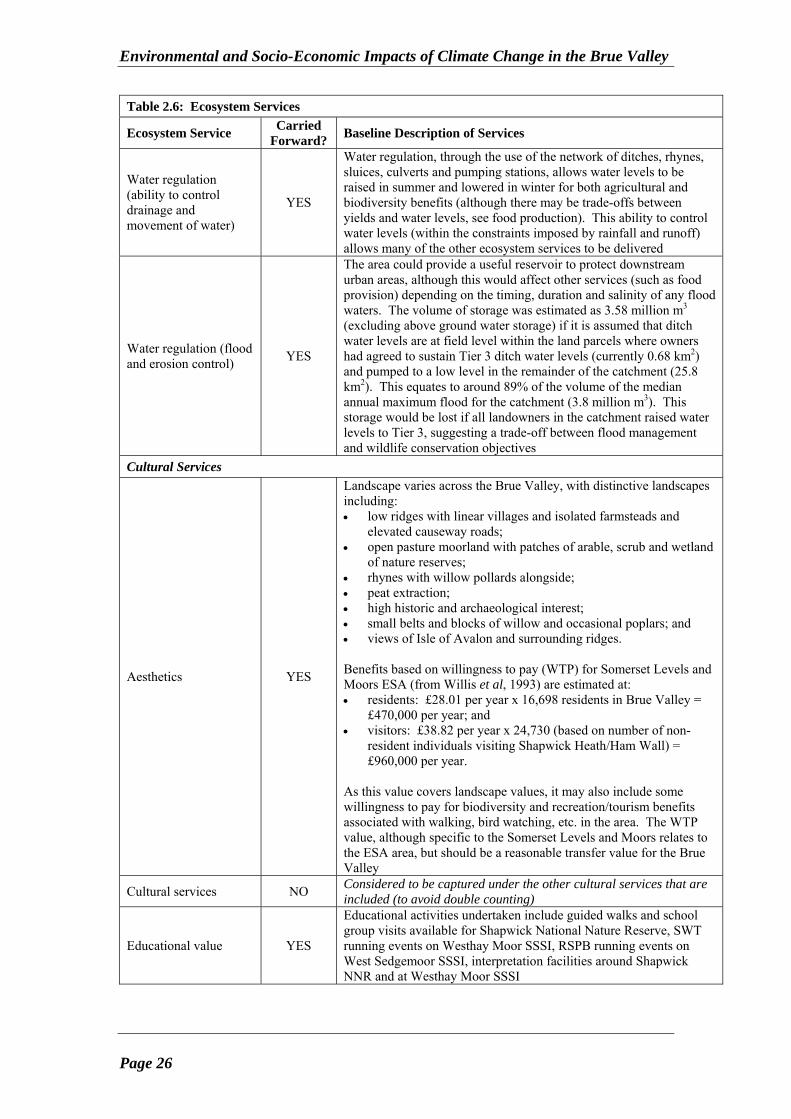
Environmental and Socio-Economic Impacts of Climate Change in the Brue Valley
Page 26
Table 2.6: Ecosystem Services
Ecosystem Service Carried
Forward? Baseline Description of Services
Water regulation (ability to control drainage and movement of water)
YES
Water regulation, through the use of the network of ditches, rhynes, sluices, culverts and pumping stations, allows water levels to be raised in summer and lowered in winter for both agricultural and biodiversity benefits (although there may be trade-offs between yields and water levels, see food production). This ability to control water levels (within the constraints imposed by rainfall and runoff) allows many of the other ecosystem services to be delivered
Water regulation (flood and erosion control)
YES
The area could provide a useful reservoir to protect downstream urban areas, although this would affect other services (such as food provision) depending on the timing, duration and salinity of any flood waters. The volume of storage was estimated as 3.58 million m3 (excluding above ground water storage) if it is assumed that ditch water levels are at field level within the land parcels where owners had agreed to sustain Tier 3 ditch water levels (currently 0.68 km2) and pumped to a low level in the remainder of the catchment (25.8 km2). This equates to around 89% of the volume of the median annual maximum flood for the catchment (3.8 million m3). This storage would be lost if all landowners in the catchment raised water levels to Tier 3, suggesting a trade-off between flood management and wildlife conservation objectives
Cultural Services
Aesthetics YES
Landscape varies across the Brue Valley, with distinctive landscapes including: low ridges with linear villages and isolated farmsteads and
elevated causeway roads; open pasture moorland with patches of arable, scrub and wetland
of nature reserves; rhynes with willow pollards alongside; peat extraction; high historic and archaeological interest; small belts and blocks of willow and occasional poplars; and views of Isle of Avalon and surrounding ridges.
Benefits based on willingness to pay (WTP) for Somerset Levels and Moors ESA (from Willis et al, 1993) are estimated at: residents: £28.01 per year x 16,698 residents in Brue Valley =
£470,000 per year; and visitors: £38.82 per year x 24,730 (based on number of non-
resident individuals visiting Shapwick Heath/Ham Wall) = £960,000 per year.
As this value covers landscape values, it may also include some willingness to pay for biodiversity and recreation/tourism benefits associated with walking, bird watching, etc. in the area. The WTP value, although specific to the Somerset Levels and Moors relates to the ESA area, but should be a reasonable transfer value for the Brue Valley
Cultural services NO Considered to be captured under the other cultural services that are included (to avoid double counting)
Educational value YES
Educational activities undertaken include guided walks and school group visits available for Shapwick National Nature Reserve, SWT running events on Westhay Moor SSSI, RSPB running events on West Sedgemoor SSSI, interpretation facilities around Shapwick NNR and at Westhay Moor SSSI

Risk & Policy Analysts, Geckoella, Environment Systems
Page 27
Table 2.6: Ecosystem Services
Ecosystem Service Carried
Forward? Baseline Description of Services
Historic environment and heritage
YES
The Brue Valley includes 25 SAMs, thousands of HERs and one conservation area and is part of an internationally important archaeological site. Excavations on the Levels and Moors have provided information about human activity from the Neolithic (9500 BC) to the end of the Iron Age (1000 BC). These include prehistoric trackways, Neolithic and Bronze Age brushwood trackways and Briquerage mounds. The peat soils also contain pollen, remains of plants, beetles, snails and insects which form a record of the past environment, on activities on the dry land and on changes in climatic conditions and sea levels
Inspiration NO Considered to be captured under the other cultural services that are included (to avoid double counting)
Knowledge systems YES
Substantial body of research on the Somerset Levels and Moors has contributed to knowledge of heritage, biodiversity, and conservation techniques, as well as historical environments relating to tree species cover and sea-level changes. Could be more opportunities under climate change
Physical and mental health and well-being
YES
There is evidence linking the natural environment with good physical health and psychological well-being. For example, living in a greener area has been positively related to self-reported mental health, while a nature walk was found to raise self-esteem and mood. The results of research to identify pleasant scenes showed that diverse landscapes with various habitats, containing trees, water, blue sky and clouds were preferred. People exposed to a pleasant rural scene showed a reduction in blood pressure of nearly 8mm mercury (compared with the control group whose blood pressure fell by 2mm mercury)
Recreation and tourism YES
Activities include canoeing, rowing, angling, boating, cycling, horse-riding, walking and bird watching. Somerset as a whole attracts some 2.5 million staying visitors each year with total annual average spend of £623 million. The number of visitors to the rural areas is much lower. Ham Wall RSPB reserve receives around 35,000 visits per year while Shapwick Heath receives around 70,000 visitors per year. Natural England estimates suggest average expenditure per visitor to the countryside is £14.64, giving total benefits of around £1.5 million based on visitors to nature reserves alone. The number of conservation and tourism jobs is estimated at 23 (4% of agriculture, conservation, tourism and peat jobs)
Sense of place NO Considered to be captured under the other cultural services that are included (to avoid double counting)
Spiritual and religious values
NO Considered to be captured under the other cultural services that are included (to avoid double counting)
Wildfowling and fishing
YES
Ramsar site notice reports that wildfowling occurs on several moors across the area. There are 800+ members of the British Association for Shooting and Conservation (BASC) in Somerset. Fishing rights on the River Brue and North Drain these are leased to local clubs. Huntspill River is one of the premier coarse fisheries in the country. Regular angling occurs on the Brue downstream of Bruton. Huntspill, South Drain, Cripps and Brue are all important angling waters, and have match fishing competitions. There are also a number of private and open fisheries in worked out peat diggings including Walton Ponds, Westhay Lake and Avalon Lakes

Environmental and Socio-Economic Impacts of Climate Change in the Brue Valley
Page 28
Map 2.6: Carbon Sequestration in the Brue Valley
Map 2.7: Carbon Content of Soils in the Brue Valley

Risk & Policy Analysts, Geckoella, Environment Systems
Page 29
3. CLIMATE CHANGE AND FUTURE SCENARIOS 3.1 Climate Change 3.1.1 Introduction to the Approach Taken Climate change data have been taken from the UKCP09 projections. The
study has looked at the effect of the low, medium and high emissions scenarios for the Brue Valley for the following variables:
change in precipitation:
o winter (low, medium and high emissions scenarios); o spring (low, medium, high); o summer (low, medium, high); and o autumn (low, medium, high).
change in temperature: o winter (low, medium, high); o spring (low, medium, high); o summer (low, medium, high); and o autumn (low, medium, high).
To assess the likely implications of climate change on the features in the Brue Valley, the high emissions scenario is used with the 10% and 90% probabilities. This approach has two advantages: it maximises the projected climate change variables (from the high
emissions scenario) allowing the worst-case changes to be identified; and the 10% and 90% probabilities give changes at two ends of the spectrum
(since they provide the projection where there is a 90% chance that the impacts will be greater (the 10% probability) and a 90% chance that the impacts will be smaller (the 90% probability). Comparison of the projected future precipitation under the 10% and 90% probabilities shows that it is important to consider both as the 10% probability shows a decrease in precipitation (i.e. drier conditions) while the 90% probability shows an increase in precipitation (i.e. wetter conditions). This difference could have significant implications for the chance of drought or flood, and the implications that these would have on the features.
In this way, the study follows the advice of UKCP092 but targets the resources (time and budget) that are available to those variables that are likely to have the greatest influence on the features (and subsequently on the land use, socio-economic situation in the Brue Valley and the ecosystem services supported). Map 3.1 also shows why the high emissions scenario and 10% and 90% probabilities have been chosen. The small differences seen between the emissions scenarios mean it is more important to select a range of probabilities. Using the high emissions scenario means that the study assesses the need to adapt in the worst-case.
2 For example, as suggested in http://ukclimateprojections.defra.gov.uk/content/view/922/500/
(and various other guidance documents and reports from UKCP09).

Environmental and Socio-Economic Impacts of Climate Change in the Brue Valley
Page 30
Map 3.1: Comparison of Temperature Increase (Winter, 2040-2069)

Risk & Policy Analysts, Geckoella, Environment Systems
Page 31
Other climatic changes (cloud cover, relative humidity, specific humidity, mean sea level pressure, net surface longwave flux, net surface shortwave flux and total downward surface shortwave flux) have been considered. They have been used, as necessary, alongside the temperature and precipitation projections when estimating changes in evapotranspiration, effective rainfall and to help estimate changes in water tables, drainage and irrigation requirements.
3.1.2 Plume Plots for Precipitation
The UKCP User Interface3 allows plume plots to be produced for future
climate change (percentage changes) and future absolute climate values. This allows data to be assessed for the following:
future climate change:
o change in precipitation (%), available annually, seasonally or monthly; and
o change in precipitation on the wettest day, available seasonally. future absolute climate values:
o precipitation (mm/day).
Each variable can also be plotted for each of the three emissions scenarios, and (depending on the variable) on annual or seasonal averages or even monthly averages. This gives the potential to produce an enormous number of plots. Figure 3.1 shows the plume plot for the high emissions scenario in the summer. It shows change in precipitation, illustrating the point made above that rainfall increases under the 90% probability, but decreases under the 67%, 50%, 33% and 10% probabilities in the 2040-2069 period (reflecting 50 years from now). Figure 3.2 shows the change in precipitation in the winter. The figure shows that winter precipitation is projected to increase under the 33% to 90% probabilities and to decrease only slightly under the 10% probability.
3 http://ukclimateprojections-ui.defra.gov.uk/ui/start/start.php.

Environmental and Socio-Economic Impacts of Climate Change in the Brue Valley
Page 32
Figure 3.1: Plume Plot for Change in Precipitation (summer, high emissions) Figure 3.2: Plume Plot for Percentage Change in Precipitation (winter, high emissions)
Change over next 50 years
Change over next 50 years

Risk & Policy Analysts, Geckoella, Environment Systems
Page 33
Table 3.1 presents the change in precipitation, by season, for the 10% to 90% probabilities under the high emissions scenario. The table shows that the largest decrease is in summer under the 10% probability (-46%), the 67% probability also shows a reduction of 12% in the summer. This suggests that there is greater than 33% chance than summer precipitation levels will be lower in 50 years time.
Table 3.1: Future Climate Changes under the Range of Probabilities
Probability Season
10% 33% 50% 67% 90%
Winter 1.2% 6.7% 11% 16% 27%
Spring 7.9% 3.0% 0.5% 2.2% 7.6%
Summer 46% 31% 21% 12% 9.3%
Autumn 4.7% 1.4% 4.8% 8.1% 15%
3.1.3 Plume Plots for Temperature Similar plots can be generated for temperature, allowing the differences
between the various probability levels to be explored. Here, the following changes can be plotted:
future climate change:
o change in mean temperature; o change in mean daily maximum temperature; o change in mean daily minimum temperature; o change in temperature of the coolest day; o change in temperature of the warmest day; o change in temperature of the coldest night; and o change in temperature of the warmest night.
future absolute climate values: o mean temperature; o mean daily maximum temperature; and o mean daily minimum temperature.
Two plots are produced below to illustrate the differences between the 10%
and 90% probabilities. Figure 3.3 presents the change in temperature for the summer high emissions scenario with Figure 3.4 presenting the same data but for the low emissions scenario. The figures show differences in change in temperature for 2030-2059 of 0.9°C (10%) to 3.8°C (90%) in the high emissions scenario and 0.9°C (10%) to 4.2°C (90%) under the low emission scenario.

Environmental and Socio-Economic Impacts of Climate Change in the Brue Valley
Page 34
Figure 3.3: Plume Plot for Mean Temperature (summer, high emissions)
Figure 3.4: Plume Plot for Mean Temperature (summer, low emissions)
Change over next 50 years
Change over next 50 years

Risk & Policy Analysts, Geckoella, Environment Systems
Page 35
Table 3.2 summarises the predicted change in temperature, by season, for the 10% to 90% probabilities for the 2040-2069 time period under the high emissions scenario. The table shows that the summer temperatures are projected to increase by 1.4°C under the 10% probability. There is a 90% probability that the temperature increase will be greater than this, with the 50% probability showing an increase of 3.1°C and the 90% probability showing an increase of 5.2°C.
Table 3.2: Future Climate Changes under the Range of Probabilities
Probability Season
10% 33% 50% 67% 90%
Winter 1.3°C 2.0°C 2.3°C 2.6°C 3.5°C
Spring 1.4°C 2.0°C 2.3°C 2.7°C 3.6°C
Summer 1.4°C 2.5°C 3.1°C 3.8°C 5.2°C
Autumn 1.8°C 2.5°C 2.9°C 3.3°C 4.2°C
3.1.4 Representing the Future Projections as a Continuum
To better reflect that the 10% to 90% probabilities are points reflecting one possible change on precipitation, the results of the plume plots are better represented using graphs showing how the variables change from 10% to 90%. Figure 3.5 provides a comparison of temperature and precipitation changes for each season, under the high emissions scenario. The charts show that temperature changes (shown by the red line) under the 10% scenario are roughly similar across all four seasons (about 1.5°C). The pattern of temperature change is reasonably similar across spring, autumn and winter, but increase much more in the summer. The seasonal patterns of precipitation changes (shown by the blue bars) are very different. Both autumn and winter shows a reduction in precipitation from 10% to around 20%. There is then an increase in precipitation above a 25% probability, with the increases being much larger in the winter. Spring shows a decrease in precipitation from 10% to around 50%. Above 50% probability, there is an increase in precipitation. This means that, for spring, there is a 50% probability that it will be drier in 50 years time and 50% probability that it will be wetter. For summer, it is much more likely that it will be drier (with up to around 80% probability). This means that there is only a 20% probability that it will be wetter in summer.

Environmental and Socio-Economic Impacts of Climate Change in the Brue Valley
Page 36
Figure 3.5: Change in Temperature and Precipitation by Season (High Emissions scenario)
0.0
0.5
1.0
1.5
2.0
2.5
3.0
3.5
4.0
4.5
5.0
5.5
0% 10% 20% 30% 40% 50% 60% 70% 80% 90% 100%
Probability (High Emissions)
Ch
ang
e in
Tem
per
atu
re (
°C)
-50%
-40%
-30%
-20%
-10%
0%
10%
20%
30%
Ch
ang
e in
Pre
cip
itat
ion
(%
)
Rainfall
Temperature
Spring: High Emissions
0.0
0.5
1.0
1.5
2.0
2.5
3.0
3.5
4.0
4.5
5.0
5.5
0% 10% 20% 30% 40% 50% 60% 70% 80% 90% 100%
Probability (High Emissions)
Ch
ang
e in
Tem
per
atu
re (
°C)
-50%
-40%
-30%
-20%
-10%
0%
10%
20%
30%
Ch
ang
e in
Pre
cip
itat
ion
(%
)
Rainfall
Temperature
Autumn: High Emissions
0.0
0.5
1.0
1.5
2.0
2.5
3.0
3.5
4.0
4.5
5.0
5.5
0% 10% 20% 30% 40% 50% 60% 70% 80% 90% 100%
Probability (High Emissions)
Ch
ang
e in
Tem
per
atu
re (
°C)
-50%
-40%
-30%
-20%
-10%
0%
10%
20%
30%
Ch
ang
e in
Pre
cip
itat
ion
(%
)
Rainfall
Temperature
Summer: High Emissions
0.0
0.5
1.0
1.5
2.0
2.5
3.0
3.5
4.0
4.5
5.0
5.5
0% 10% 20% 30% 40% 50% 60% 70% 80% 90% 100%
Probability (High Emissions)
Ch
ang
e in
Tem
per
atu
re (
°C)
-50%
-40%
-30%
-20%
-10%
0%
10%
20%
30%
40%
Ch
ang
e in
Pre
cip
itat
ion
(%
)
Rainfall
Temperature
Winter: High Emissions

Risk & Policy Analysts, Geckoella, Environment Systems
Page 37
3.1.5 Impacts of Changes in Hydrology (Floods and Droughts) Changes in Evapotranspiration and Effective Rainfall
The impacts on hydrology have been estimated using the following variables (for the 10% and 90% probabilities and the high emissions scenario) to estimate changes in evapotranspiration and effective rainfall month-by-month):
minimum temperature; maximum temperature; humidity; wind speed; hours of sunshine (based on percentage of cloud cover); and radiation.
Table 3.3 presents the estimated evapotranspiration for 2010 and for 2060 (10% and 90% probabilities, high emissions scenario). The data for 2060 are based on the UKCP projections for 2049 to 2069.
Table 3.3: Monthly Evapotranspiration Rates (mm/day)
2010 2060 (10%) 2060 (90%) Month
ETo ETo % change ETo % change
January 0.6 0.6 0% 0.6 0%
February 0.8 0.9 13% 0.8 0%
March 1.4 1.5 7% 1.5 7%
April 2 2.1 5% 2.2 10%
May 2.8 2.9 4% 3 7%
June 3.3 3.5 6% 3.7 12%
July 3.3 3.4 3% 3.9 18%
August 3 3.1 3% 3.5 17%
September 2 2.1 5% 2.2 10%
October 1.1 1.1 0% 1.4 27%
November 0.8 0.8 0% 0.8 0%
December 0.6 0.6 0% 0.6 0%
Notes: based on UKCP data and FAO ETo evapotranspiration model
Table 3.3 shows that evapotranspiration does not change considerably within
the next 50 years, even under the high emissions scenario, although any changes are an increase in evapotranspiration.
Also important when assessing hydrological changes is effective rainfall (this
is the amount of rainfall that is useable; it excludes rainfall lost due to evapotranspiration, and runoff). Table 3.4 provides the monthly effective rainfall for 2010, and for 2060 (10% and 90% probabilities). The table also shows the change in effective rainfall under the 10% and 90% probabilities in 2060, based on typical evapotranspiration across all habitats.

Environmental and Socio-Economic Impacts of Climate Change in the Brue Valley
Page 38
Table 3.4: Monthly Effective Rainfall (mm/month)
2010 2060 (10%) 2060 (90%) Month Effective
Rainfall Effective Rainfall
% change Effective Rainfall
% change
January 74.4 59.5 -20% 85.6 15%
February 58.8 47.2 -20% 72.7 24%
March 54.3 43.2 -20% 79 45%
April 45.4 37.9 -17% 46.1 2%
May 53 39.4 -26% 54.7 3%
June 45.4 24.6 -46% 53.5 18%
July 52.7 21.6 -59% 62.2 18%
August 52.7 23.7 -55% 58.4 11%
September 60.8 35.5 -42% 64.4 6%
October 62.3 46.6 -25% 64.9 4%
November 68.1 51 -25% 74 9%
December 79.1 64.3 -19% 83.1 5%
Notes: based on UKCP data and FAO CropWat 8.0 model
Table 3.4 shows that the 10% probability is drier in every month whereas the
90% probability is wetter for every month. Changes in Water Table
Information on evapotranspiration (ET) and effective rainfall can be used to estimate how the water table may change over time. It also affects the amount of water that needs to be drained from the area (to avoid flooding) or that needs to be brought into the area (for irrigation of crops or to retain wet fences). It is beyond the scope of this project to develop a detailed model of drainage and irrigation water need, however, a simple spreadsheet model has been developed that allow the change in water table to be estimated. The results are presented in Table 3.5 and are totals over the 50-year period. The depth of water is measured in mm at any point in the Brue Valley.
Table 3.5: Results of Estimates of Drainage and Irrigation Calculations
Action 2010 2060 (10%) 2060 (90%)
Depth of water that needs to be drained 12,000 mm 5,000 mm 12,000 mm
Depth of water than needs to be provided to maintain wet fences, for irrigation (with drainage to -200mm in wet months)
0 mm 10,000 mm 0 mm
Proportion of months with surface water present (with drainage)
0% 0% 11%
Proportion of months with surface water present (without drainage)
95% 20% 95%
Notes: based on simple spreadsheet model that calculates changes in water table as effective rainfall minus ET. It is assumed that drainage is down to -200mm. The 2010 calculations assume no change in effective rainfall or ET for 50 years; the 2060 calculations assume a gradual change from the 2010 effective rainfall and ET to the 2060 levels

Risk & Policy Analysts, Geckoella, Environment Systems
Page 39
The table shows that the much drier conditions under the 10% probability is likely to affect the ability to retain wet fences. Under the 90% probability, the issue is the ability to evacuate water, with the potential for surface water being present even with pumped drainage. However, when compared with the current climatic conditions (and assuming that the same climatic conditions exist in 2060), the increase in precipitation under the 90% probability can be reasonably well managed. There is a risk, though that surface water would be present 11% of the time (potentially around 40 days per year). Since the 10% and 90% probabilities provide reasonable end-points, it is likely that the actual change may fall somewhere in between. It is also important that these changes are based on the high emissions scenario, hence, are likely to be worst-case estimates of future changes in water availability.
To further illustrate the differences between the 10% and 90% probabilities, it
is possible to look at the actions that farmers would need to take to drain water in one hectare down to a level of -200mm in the summer (to maintain wet fences but avoid waterlogging stress in grasslands):
under the 90% probability in 2060: 2,440 m3/ha/year; or under the 10% probability in 2060: 4.1 m3/ha/year.
Taking current climatic conditions, it is estimated that 2,260 m3/ha/year would need to be drained. This illustrates that the 90% probability, although wetter, would only require an increase of 8% in terms of volumes drained. It also shows that the 10% probability is projected to be much drier. The simple spreadsheet model suggests that drainage would only be required in October, with water levels naturally below a level of -200mm from April to September. To maintain water levels at -200mm (and help retain wet fences), the farmer would have to ‘add’ 3,780 m3/ha/year. Changes due to Freshwater Flooding
There are two aspects to freshwater flooding:
flooding directly caused by rainfall (via runoff and/or ponding in low lying areas); and
flooding caused by increased river flows causing overtopping of ditches.
The 10% probability is typified by much drier conditions overall and, although the amount of precipitation on the wettest days is projected to decrease slightly, this will occur following drier, hotter conditions. As a result, the soil is more likely to be baked hard resulting in greater runoff and an increased risk of localised flooding direct from rainfall. This is more likely to occur where there is less vegetation cover. The risk from river flooding in 2060 is reduced slightly under the 10% probability compared with current due to the drier conditions. However, this is only really seen on extreme events with very little change on the more frequent events. There may be some localised increases in risk where runoff reduces the time it takes for rainfall to reach the ditches, rhynes, and rivers.

Environmental and Socio-Economic Impacts of Climate Change in the Brue Valley
Page 40
Table 3.6 sets out the change in frequency of flooding events, based on the recurrence interval under current conditions. It is important to note that the estimated change in recurrence interval is based on a series of assumptions and simplifications related to changes in rainfall and changes in river flow. A simple spreadsheet model has been used, not a sophisticated hydrological model. Hence, the results are indicative only.
Table 3.6: Change in Frequency of Fluvial Flooding
Under the 10% Probability (2060) Under the 90% Probability (2060) Current recurrence
interval Recurrence
Interval Change
Recurrence Interval
Change
1:2 1:2 Not significant 1:2 Not significant
1:3 1:3 Not significant 1:3 Not significant
1:5 1:5 Not significant 1:4 Increase in risk by
20%
1:10 1:10 Not significant 1:8 Increase in risk by
20%
1:15 1:16 Reduction in risk
of 5% 1:12
Increase in risk by 20%
1:20 1:21 Reduction in risk
of 5% 1:16
Increase in risk by 20%
1:25 1:26 Reduction in risk
of 5% 1:20
Increase in risk by 20%
1:50 1:53 Reduction in risk
of 6% 1:37
Increase in risk by 26%
1:100 1:107 Reduction in risk
of 7% 1:72
Increase in risk by 28%
1:200 1:215 Reduction in risk
of 8% 1:136
Increase in risk by 32%
1:500 1:540 Reduction in risk
of 8% 1:320
Increase in risk by 36%
Under the 90% probability, the amount of rainfall increases as does the precipitation on the wettest day. The amount of precipitation on the wettest day is projected to increase by 25% (winter) and 28% (autumn). The increases in spring (16%) and summer (13%) are smaller. Therefore, it is likely that pluvial flooding would become more frequent, especially in autumn and winter. Pluvial flooding is more likely to occur where the land is lower (in height) such that it is more likely to become waterlogged. Flooding from rivers is also expected to increase. This occurs due to the overall increase in precipitation in 2060 and the greater likelihood of waterlogged soils, reducing the capacity of the soils to absorb any additional rainfall. The extent to which the risk of flooding (and extent) increases will depend upon the amount of drainage that is undertaken, as well as factors such as increased tidelock on the Huntspill because of rising sea levels. Table 3.6 sets out the change in frequency of flooding events, based on the recurrence interval under current conditions.
Changes due to Tidal Flooding
Maslen Environmental, as part of their work on WAVE project for the
Environment Agency, have modelled the areas that are predicted to flood from

Risk & Policy Analysts, Geckoella, Environment Systems
Page 41
the sea assuming both existing defended and undefended coastlines. The return period flood events modelled range from 1:10 years to 1:1000 years. The results of the model are used here to assess the potential impacts of tidal flooding and the extent to which the area that could be covered by tidal flooding may change up to 2060. Map 3.2 presents the modelled flood extents for today and 50 years time for the undefended scenario (i.e. assuming the coastal defences are not maintained or replaced). The light blue area is the flood extent in 2010 and the dark blue area is the additional flood extent in 2060. The area flooded in 2060 is around 2,250 ha. With existing defences, there is no tidal flooding, except on very extreme events.
Map 3.2: Extent of tidal flooding in 2010 and in 2060 assuming Coastal
Defences are not Maintained or Replaced (Area is Undefended) 3.1.6 Using the Climate Change Predictions Adaptation to future climate change requires information on the range of
outcomes that are possible. Therefore, the study takes both the 10% and 90% probabilities as providing suitable end-points that can be used to assess the range of possible future changes. This means it is possible to assess the implications of both drier and wetter seasons, a range of temperature increases (from low increases of around 1.5% to much greater increases, up to 5.2°C in the summer). This will then give a much stronger basis for assessing the range of possible future outcomes and then the potential adaptation measures that could be used to reduce any negative effects or exploit any new opportunities that arise with the change in climate. To ensure that adaptation options are considered against the worst-case future projections, the high emissions
Tidal Flooding:
Extent (1:10 tidal
event without
defences)

Environmental and Socio-Economic Impacts of Climate Change in the Brue Valley
Page 42
scenarios are used. Although this may suggest changes are greater than they may turn out to be, it gives a better basis for identifying what adaptation options might be required and can help give an indication of adaptations that might be needed at different threshold levels of change. It also provides an opportunity for consideration of no regrets options, where actions can be taken now (or in the short-term) to avoid negative impacts or deliver benefits.
Table 3.7 summarises the projected effects of climate change on temperature,
on the water table (due to hydrology) and on the frequency and extent of flooding. It is important to remember that the changes shown in Table 3.4 represent two possible sets of projected changes; actual changes are likely to lie between these two probabilities. There is also a small chance that the impacts lie outside the range given by the 10% and 90% probabilities.
Table 3.7: Summary of Projected Climate Change Effects
10% Probability 90% Probability Climate Change Effect S S A W S S A W
Temperature 1.4°C 1.4°C 1.8°C 1.3°C 3.6°C 5.2°C 4.2°C 3.5°C
Water table 7.9% 46% 4.7% 1.2% 7.6% 9.3% 15% 27%
Flooding (Freshwater)
Reduction in flood risk of up to 8% Increase in flood risk of up to 36%
Flooding (tidal) Impacts of tidal flooding are more strongly linked to the continuation (or not) of coastal
flood defences
3.2 Development of Future Socio-Economic Scenarios 3.2.1 The Use of Global Socio-Economic Scenarios The response to future impacts caused by climate change is dependent on a
number of other (non-climate) factors, many of which are currently uncertain. They include, for example, future attitudes towards development and the extent to which this should be sustainable. To help manage some of this uncertainty and to allow a range of possible future adaptations to be assessed, a scenario approach is used. This enables four possible futures to be described. The reaction of the local community to the impacts of climate change can then be assessed in line with these four scenarios. To ensure that a range of responses is considered, four very different scenarios are used. These are based on the generic scenarios developed elsewhere (notably the IPCC Special Report on Emission Scenarios, and from these, scenarios developed by UKCIP in 2001 and the Millennium Ecosystem Assessment in 2005). Figure 3.6 shows the basis for the four scenario types and the spectra of ideologies on which they are based (localisation to globalisation, or consumerism to conservation).
3.2.2 Extending the Scenarios for Application to the Brue Valley
These four scenario types (World Markets, Provincial Enterprise, Global Sustainability and Local Stewardship) are used as the basis for developing

Risk & Policy Analysts, Geckoella, Environment Systems
Page 43
socio-economic scenarios for the Brue Valley. The detailed storylines (which are set out in full in Annex 5) use the principles outlined in the IPCC Special Report on Emission Scenarios, UKCIP 2001 and the Millennium Ecosystem Assessment to build up possible futures for the Brue Valley. It is important to remember, when considering the analysis that has been carried out, that these are four possible future projections that have been identified to enable a wide range of possible outcomes to be explored. They are not predictions. Figure 3.7 shows where the four Brue Valley scenarios plot on the scenario matrix.
Globalisation/ Interdependence (homogeneous world)
World Markets Based on the principle of rapid economic growth
Global Sustainability
Based on the principle of achieving environmental sustainability at the
global scale
Localisation/ Autonomy (heterogeneous world)
Based on regionally oriented economic development where consumerism and capitalism are the main principles Provincial Enterprise
Based on the principle of achieving environmental sustainability at the
local scale
Local Stewardship
Individualism/ Consumerism (more economic focus)
Community/ Conservation
(more environmental focus)
Figure 3.6: Matrix showing the different generic scenarios Globalisation/ Interdependence (homogeneous world)
World Markets (see A5.2)
Global Sustainability
(see A5.4)
Localisation/ Autonomy (heterogeneous world)
(see A5.3) Provincial Enterprise
(see A5.5)Local Stewardship
Individualism/ Consumerism (more economic focus)
Community/ Conservation
(more environmental focus)
Figure 3.7: Approximate location of the four scenarios developed for the Brue Valley
Conventional Development

Environmental and Socio-Economic Impacts of Climate Change in the Brue Valley
Page 44
3.2.3 Predicted Future Changes in the Brue Valley under the Scenarios The projections of the future are assessed for four main land uses:
farming; conservation; peat extraction; and development. Each scenario would result in different outcomes against each of the land uses, as summarised in Table 3.7. For more information, or the rationale behind the directions of change shown in Table 3.7, see Annex 5.
Table 3.7: Direction of Change under the Brue Valley Scenarios
Measure World Markets Provincial Enterprise
Global Sustainability
Local Stewardship
Impacts on FARMING
Intensification: high quality farmland
New technology used to increase yields. Aim is to increase profits where possible
through development of
demand for premium
products, plus increased use of
arable crops
Intensification and profit maximising
drive farming choices, including
cultivation of grassland for arable crops
Land is used more sustainability with new technology
used to help maintain yields
Local sustainability is likely to reduce intensification, with potential move to mixed farming to meet
local food demands
Intensification: lower quality farmland
Marginal farmland likely to be used for other
uses than intensive farming
Investment is on ad hoc basis to
favour areas that are easier to drain
and are more productive
Agri-environment payments help
ensure that lower quality land is
used sustainably
Trend towards mixed farming, so
lower quality farmland may be
used for a range of different purposes
Investment in, and level of management of, water regime
Driven by the requirements (and funds) of the large
corporations
Management of the water regime
will be poorly coordinated or
absent
Some management will
continue on micro-scale
Water management is
focused on catchment scale,
run by local farmers
Environmental responsibility
Large farming corporations trade
on their reputation,
concerned with making profits
first but providing environmental
benefits as well, where possible
There is little concern for the
environment
Global and national targets set to deliver greater
environmental responsibility
Local sustainability is a
key goal with local suppliers
providing local markets

Risk & Policy Analysts, Geckoella, Environment Systems
Page 45
Table 3.7: Direction of Change under the Brue Valley Scenarios
Measure World Markets Provincial Enterprise
Global Sustainability
Local Stewardship
Social responsibility
Large farming corporations trade on their reputation
Farms will try and use skills that already exist
Opportunities for skills and training increased, more volunteer roles
Development of specialised
activities gives local people
opportunities to become highly
skilled
Prices of inputs Large farming
corporation have strong buying
power
Regional fluctuations and lack of buying power mean
prices increase
Costs include the environmental
costs not previously taken into account and
the move to a more sustainable
supply chain
Costs likely to increase due to
local supply/demand,
but overall amounts of inputs
should reduce
Prices of food
Increased outputs and control of
costs mean prices remain stable
relative to incomes
Intensification requires more
inputs and higher costs such that
food prices increase
Increase in food costs relative to income due to
more sustainable production,
technological improvements
may help control the increases
Increase in food costs due to more sustainable and smaller-scale production. Money is
generally recycled through the local
economy
Impacts on CONSERVATION
Management of existing conservation sites for biodiversity benefit
Increased private contributions to
conservation organisations and agri-environment payments to meet
agreed global targets and
policies. This could include payments for provision of ecosystem
services. This enables agri-environment
payments to be targeted at highest
value areas (whether they are inside SSSIs or
not)
The sites themselves may
come under development
pressure and will also be affected
by pollution
Emphasis on sustainability ‘everywhere’
using technology to help reduce the
costs while providing
biodiversity benefits.
Payments for ecosystem
services becomes an important
management tool
Emphasis on local sustainability with strenuous efforts
to protect and enhance wildlife
(recreation pressures may
increase). Payments for
ecosystem services likely to be
focuses on local services

Environmental and Socio-Economic Impacts of Climate Change in the Brue Valley
Page 46
Table 3.7: Direction of Change under the Brue Valley Scenarios
Measure World Markets Provincial Enterprise
Global Sustainability
Local Stewardship
Opportunity to increase the size or connectivity of sites of high conservation value
Low productivity land made
available by large corporations.
Growth of membership based
conservation organisations helps fund the
purchases
Land of high value to meet
regional food and development needs so is
unlikely to be available for conservation
Low productivity land would be
available at low costs or NGOs/
conservation organisations could provide
advice and support to help create wildlife
corridors
Focus is at the catchment scale, which may not
link with sustainability
efforts elsewhere in the country,
although linkages could be
established through
conservation organisations
Impacts on PEAT EXTRACTION
Peat extraction
Imports from other countries
available at lower cost, plus higher
incomes from farming may
make this a less profitable land use
Peat extraction to meet regional
demands could increase on low quality land or
even conservation sites
Sustainability concerns, national
reporting requirements and
government restrictions all
affect peat extraction. Addition of
environmental costs onto the price of peat
reduce demand
Potential for short-term, small-scale
extractions to meet particular local
needs
Impacts on SETTLEMENTS AND DEVELOPMENT
Development pressures
Greater demand for housing and
commercial development
around the Brue Valley (although
significant development on the floodplain is unlikely, some
innovative housing designed
to be flood compatible could
occur)
Greater demand for housing and
commercial development, including on
conservation sites but with increased
flood risk
Strong planning controls and emphasis on
development in existing urban
centres
Decisions on the need and
permission for development is
made at the local level. Small-scale
developments associated with
diversification of local activities
would be allowed

Risk & Policy Analysts, Geckoella, Environment Systems
Page 47
Table 3.7: Direction of Change under the Brue Valley Scenarios
Measure World Markets Provincial Enterprise
Global Sustainability
Local Stewardship
Freshwater flood risk
Increased drainage for more
profitable croplands,
reduced drainage where there is
potential to move to agri-
environment payments and/or move to organic,
SSSI-based products
Increased drainage where it
is profitable to invest in drainage
(reducing or maintaining current flood
risk). Reduced drainage on more
marginal areas and move to a more ad hoc
approach results in increased flood
risk overall
Move to sustainable
landscape-scale floodplain
management, including zoning of some areas for
water storage which could
reduce flood risk to other areas (especially in
terms of pluvial flood risk)
Local management of water for local
needs may increase flood risk
downstream, although this is
likely to be combined with change to more
flood resilient land use
Tidal flood risk
Coastal defences are built to protect key assets such as Bridgwater and
the M5, with knock-on benefits
for the Brue Valley
Coastal defences are built to protect key assets such as Bridgwater and
the M5, with knock-on benefits
for the Brue Valley
Defences are built around key assets
with Huntspill engineered to act as a preferential flow route for extreme tidal
events (1:50 and greater)
Increased risk for Brue Valley
(although communities
nearer the coast may choose to protect their properties).
Potential for tidal flooding on events greater than 1:20
The future changes identified in Table 3.7 are used, in Section 5, to assess the adaptation responses that might be used to reduce the negative impacts of climate change. They are also used to assess if and how future opportunities might be exploited, especially where these could lead to socio-economic benefits.

Environmental and Socio-Economic Impacts of Climate Change in the Brue Valley
Page 48
Risk & Policy Analysts, Geckoella, Environment Systems
Page 49
4. IMPLICATIONS FOR FEATURES 4.1 Introduction To determine the effect that future climate change could have on the features,
it is necessary to identify:
limits when the features would be affected (negatively or positively) by climate change;
impacts of going beyond those limits; and knock-on and indirect effects that could occur due to changing climatic
conditions.
This information can then be used to assess the sensitivity of the features to the projected future climatic conditions. Two thresholds are identified: alleviation threshold: when the predicted climatic changes could affect the
condition or quality of the feature, but are unlikely to result in changes in land use; and
adaptation threshold: when the predicted climate changes are likely to result in a change in land use, either directly due to climate change, or because of adaptation measures taken to reduce negative impacts or exploit new opportunities.
4.2 Thresholds and Optimal Limits for Temperature Table 4.1 describes the possible impacts of climate change on the features. It
shows both the alleviation and adaptation thresholds and the types of impacts that might occur. The table also shows where there are data gaps. Note that precipitation (incident rainfall) effects are considered separately as water table effects and flooding, because the latter are very highly influenced by human management. Water table effects are considered in Table 4.2; hydrology, and flooding is considered under Table 4.3.

Environmental and Socio-Economic Impacts of Climate Change in the Brue Valley
Page 50
Table 4.1: Impacts of Temperature on the Features
Temperature and precipitation Feature
Qualitative Description of Climate Change Impacts Alleviation threshold Adaptation threshold
Cereal crops
Reduced frost damage Reduced cold weather
may affect vernalisation, germination and senescence
Earlier wheat maturity means the crop avoids the most severe drought stress
Lethal limits: minimum -17.2°C; maximum1: 47.5°C
Optimal temperatures1: o leaf initiation:
22.0°C o shoot growth:
20.3°C o root growth:
<16.3°C o vernalisation: 4.9°C o terminal spikelet:
10.6°C o anthesis: 21.0°C o grain filling: 20.7°C
1°C to 3°C temperature rise could have positive impacts on yields of maize and
wheat. Modelled increases in yield of
10% to 12.5% (wheat) by 20502
>3°C temperature rise likely to cause stress with yield reductions of 5% to 10% (maize)
and 0% to 25% (wheat)2
Dry grassland of high value for wildlife
Floristic changes / longer growing seasons
Competitive / woody species growth rates increase through temperature / silt loading effects
0°C to 2°C temperature rise:
possible increase in productivity (but also increased heat stress); conversely increased variability of rainfall
may reduce productivity2
>3°C temperature rise: neutral to small
positive effect on livestock (negative effect for confined
cattle)2
Dry grassland of low value for wildlife
Increased productivity / longer growing season
No threshold data found
No threshold data found
Lakes/Ponds
Lower dissolved oxygen with higher temperature
Effects on fish and invertebrate fauna from increase in water temperature
Potential for increased primary productivity (which could lead to eutrophication problems)
No threshold data found
No threshold data found

Risk & Policy Analysts, Geckoella, Environment Systems
Page 51
Table 4.1: Impacts of Temperature on the Features
Temperature and precipitation Feature
Qualitative Description of Climate Change Impacts Alleviation threshold Adaptation threshold
Orchards and horticulture
High summer temperatures will have a negative impact on yield and quality for many horticultural crops (particularly where high T° occurs around flowering and seed development stages) e.g. high summer temperatures can affect flower bud formation in apples, with impacts seen the following year
High winter temperatures are a problem for crops that have an overwintering stage (particularly when combined with late frosts)
High winter temperatures can lead to early bud break and frost susceptibility in apples
No threshold data found
No threshold data found
Other (roads and settlements)
No data found No threshold data
found No threshold data
found
Peat works and bare ground
No data found No threshold data
found No threshold data
found
Reedbeds Increased productivity No threshold data
found No threshold data
found
Rivers/streams/ ditches/rhynes
Lower dissolved oxygen with higher temperature
Water temperature influences invertebrate communities
Potential for increased primary productivity (which could lead to eutrophication problems)
No threshold data found
No threshold data found
Swamp and fen No data found No threshold data
found No threshold data
found
Wet grassland of low value for wildlife
No data found
Wet grassland of high value for wildlife
Longer growing seasons Competitive / woody
species growth rates increase through temperature / silt loading effects
0°C to 2°C temperature rise:
possible increase in productivity (but also increased heat stress); conversely increased variability of rainfall
may reduce productivity2
>3°C temperature rise: neutral to small
positive effect on livestock (negative effect for confined
cattle)2

Environmental and Socio-Economic Impacts of Climate Change in the Brue Valley
Page 52
Table 4.1: Impacts of Temperature on the Features
Temperature and precipitation Feature
Qualitative Description of Climate Change Impacts Alleviation threshold Adaptation threshold
Wet heath and purple moor grass
Temperature changes in isolation have little effect on species composition
No threshold data found
No threshold data found
Woodland / hedgerow/ line of trees / scrub / bracken
Increased productivity / longer growing season
Potential change in hedgerow plant composition
No threshold data found
No threshold data found
Key references (quantified/threshold changes): 1 Porter JR & Semenov MA (2005): Crop Responses to Climatic Variation, Phil. Trans R. Soc. B, 360, pp2021-2035. 2 IPCC (2007): Fourth Assessment Report: Climate Change 2007, Working Group II: Impacts, Adaptation and Vulnerability. General references (qualitative/descriptive changes): Heijmans MM et al (2008): Long-term Effects of Climate Change on Vegetation and Carbon Dynamics in Peat Bogs, Journal of Vegetation Science, 19, pp307–320. Natural England (2009): Responding to the Impacts of Climate Change on the Natural Environment: Dorset Downs and Cranborne Chase, 31 March 2009. Warwick HRI (2008): Vulnerability of UK Agriculture to Extreme Events, Research Report AC0301 to Defra, Final Report. For more detailed list of references and research reviewed, see Annex 4 4.3 Thresholds and Optimal Limits for Changes in Water Table Table 4.2: Impacts of Changes in the Water Table on the Features
Hydrology Feature
Qualitative Description of Climate Change Impacts Alleviation threshold Adaptation threshold
Cereal crops
Increased run-off from high intensity rainfall
Autumn cultivations may be affected by wetter winters and autumns
High rainfall can lead to leaching of nitrate, decreasing the amount of soil available nitrogen
Maximum allowable deficit (% available soil water) for maize is 50%
No threshold data found
No threshold data found
Dry grassland of high value for wildlife
Community change due to summer droughts
Increased productivity (depending on water table management)
Waterlogging stress is strongly linked to change in communities, with mean loss of 39% (±5%) per year when a threshold waterlogging tolerance is exceeded (recovery is slower at
No threshold data found
No threshold data found

Risk & Policy Analysts, Geckoella, Environment Systems
Page 53
Table 4.2: Impacts of Changes in the Water Table on the Features
Hydrology Feature
Qualitative Description of Climate Change Impacts Alleviation threshold Adaptation threshold
just 5% (±12%) per year when waterlogging stress is below the threshold)1
Increased precipitation would lead to grasslands becoming much less productive with a move towards swamp and fen3
Dry grassland of low value for wildlife
Increased run-off from high intensity rainfall
Community change to annuals over perennials due to summer droughts
Increased productivity (depending on water table management)
Increased precipitation would lead to grasslands becoming much less productive and move towards swamp and fen
No threshold data found
No threshold data found
Lakes/ponds
Lower water levels (with higher temperature and reduced precipitation)
Increased water table fluctuation
No threshold data found
No threshold data found
Orchards and horticulture
Increased run-off from high intensity rainfall
Autumn cultivations may be affected by wetter winters and autumns
Low water availability will have an adverse effect on yield and quality of many crops
Extreme events (drought) can cause major problems in terms of supply and quality for many crops
No threshold data found
No threshold data found
Other (roads and settlements)
Unpredictable inundation Increased run-off from
high intensity rainfall Increased pressure on
resources, e.g. water
No threshold data found
No threshold data found
Peat works and bare ground
Lower water levels makes extraction easier (with higher temperature and reduced precipitation)
But drainage enhances the rate of peat mineralization
No threshold data found
No threshold data found

Environmental and Socio-Economic Impacts of Climate Change in the Brue Valley
Page 54
Table 4.2: Impacts of Changes in the Water Table on the Features
Hydrology Feature
Qualitative Description of Climate Change Impacts Alleviation threshold Adaptation threshold
Reedbeds
Lower water levels (with higher temperature and reduced precipitation) (permanent inundation 200 to 1000 mm typical)2
Threshold mean water depth (winter)2:
o maximum: 1.5m o minimum: 0m Threshold mean
water depth (spring)2:
o maximum: 1.25m o minimum: -0.25m Threshold mean
water depth (summer)2:
o maximum: 0.5m o minimum: -0.8m Threshold mean
water depth (autumn)2:
o maximum: 0.75m o minimum: -1.0m
Threshold mean water depth (winter)2:
o maximum: 2.0m o minimum: -0.5m Threshold mean
water depth (spring)2:
o maximum: 1.5m o minimum: -0.4m Threshold mean
water depth (summer)2:
o maximum: 1.0m o minimum: -1.2m Threshold mean
water depth (autumn)2:
o maximum: 1.25m o minimum: -1.25m
Rivers/streams/ ditches/rhynes
Lower water levels (with higher temperature and reduced precipitation)
Increased water table fluctuation and erosion of marginal features
Higher peak flows could increase erosion, lower flows during drier periods could increase sedimentation
Threshold mean water depth (winter)2:
o maximum: 1.75m o minimum: 0m Threshold mean
water depth (spring)2:
o maximum: 2.0m o minimum: 0m Threshold mean
water depth (summer)2:
o maximum: 1.75m o minimum: 0.2m Threshold mean
water depth (autumn)2:
o maximum: 1.75m o minimum: 0.2m
Threshold mean water depth (winter)21:
o maximum: 2.0m o minimum: 0m Threshold mean
water depth (spring)2:
o maximum: 2.0m o minimum: 0m Threshold mean
water depth (summer)2:
o maximum: 2.0m o minimum: 0m Threshold mean
water depth (autumn)2:
o maximum: 2.0m o minimum: 0m

Risk & Policy Analysts, Geckoella, Environment Systems
Page 55
Table 4.2: Impacts of Changes in the Water Table on the Features
Hydrology Feature
Qualitative Description of Climate Change Impacts Alleviation threshold Adaptation threshold
Swamp and fen
Lower water levels / flows (with higher temperature and reduced precipitation). Periodic inundation up to 200mm typical for habitat2
Increased water table fluctuation
Rate of succession to wet woodland increased
Decreased summer rainfall and increased summer evaporation could put stress on wetland communities in late summer and autumn
No threshold data found
Threshold mean water depth (winter)2:
o maximum: 0.4m o minimum: -0.15m Threshold mean
water depth (spring)2:
o maximum: 0.4m o minimum: -0.03m Threshold mean
water depth (summer)2:
o maximum: 0.4m o minimum: -0.03m Threshold mean
water depth (autumn)2:
o maximum: 0.4m o minimum: -0.075m
Wet grassland of high value for wildlife
Lower water levels (with higher temperature and reduced precipitation)
Increased productivity (depending on water table management)
MG8 vulnerable to water table changes and unpredictable inundation. Hard to restore once changed3
Increased precipitation would lead to grasslands becoming much less productive and move towards swamp and fen4
Threshold mean water table depth (winter)2:
o maximum: 0.24-0.4m
o minimum: 0.03m Threshold mean
water table depth (spring)2:
o maximum: 0.3-0.45m
o minimum: 0.05-0.02m
Threshold mean water table depth (summer)2:
o maximum: 0.45-0.65m
o minimum: 0.1-0.15 Threshold mean
water table depth (autumn)21:
o maximum: 0.35-0.5m
o minimum: 0.13-0.04
Threshold mean water table depth (winter)2:
o maximum: >0.4m o minimum: no data Threshold mean
water table depth (spring)2:
o maximum: >0.45m o minimum: <0.02m Threshold mean
water table depth (summer)2:
o maximum: >0.65 o minimum: <0.15 Threshold mean
water table depth (autumn)2:
o maximum: >0.5m o minimum: <0.07

Environmental and Socio-Economic Impacts of Climate Change in the Brue Valley
Page 56
Table 4.2: Impacts of Changes in the Water Table on the Features
Hydrology Feature
Qualitative Description of Climate Change Impacts Alleviation threshold Adaptation threshold
Wet grassland of low value for wildlife
Lower water levels (with higher temperature and reduced precipitation)
Increased run-off from high intensity rainfall
Community change to annuals over perennials due to summer droughts
Increased productivity (depending on water table management)
Increased precipitation would lead to grasslands becoming much less productive and move towards swamp and fen5
Threshold mean water table depth regime variables (winter)2:
o maximum: 0.5-0.7m o minimum: 0.11-
0.08m Threshold mean
water table depth (spring)2:
o maximum: 0.65-0.8m
o minimum: 0.3-0.2m Threshold mean
water table depth (summer)2:
o maximum: 1m o minimum: 0.45-
0.35m Threshold mean
water table depth (autumn)2:
o maximum: 1m o minimum: 0.3-0.2m o readily available
water in top 0.5m: 55-45mm
Threshold mean water table depth (winter)2:
o maximum: >0.7m o minimum: <0.07m Threshold mean
water table depth (spring)2:
o maximum: >0.8m o minimum: <0.2m Threshold mean
water table depth (summer)2:
o maximum: no data o minimum: <0.35m Threshold mean
water table depth (autumn)2:
o maximum: no data o minimum: <0.2m o readily available
water in top 0.5m: <45 mm
Wet heath and purple moor grass
Lower water levels / flows (with higher temperature and reduced precipitation) (summer/autumn low flows have greatest impacts)
Loss of wetland interest and increased representation by ‘dryland’ species
Rate of succession to wet woodland increased
Decreased summer rainfall and increased summer evaporation could put stress on wetland communities in late summer and autumn
No threshold data found
No threshold data found

Risk & Policy Analysts, Geckoella, Environment Systems
Page 57
Table 4.2: Impacts of Changes in the Water Table on the Features
Hydrology Feature
Qualitative Description of Climate Change Impacts Alleviation threshold Adaptation threshold
Woodland / hedgerow/ line of trees / scrub / bracken
Unpredictable inundation (wet woodland does well with annual winter inundation, summer inundation 1:5 years)
Change in the regeneration patterns of trees, e.g. more Ash if woods become drier
Extreme events (drought) may lead to loss of landscape quality and/or landscape context through loss of old trees
No threshold data found
No threshold data found
Key references (quantified/threshold changes): 1 Cranfield University (2005): Response of Grassland Plant Communities to Altered Hydrological Management, Defra Research Report BD1321, June 2005. 2 Environment Agency (2004): Ecohydrological Guidelines for Lowland Wetland Plant Communities, Final Report, December 2004. 3 Acreman M et al (in press): Trade-off in Ecosystem Services of the Somerset Levels and Moor Wetlands, Hydrological Sciences Journal, in press. 4 Wallace H & Prosser M (2007): Prediction of Vegetation Change at West Sedgemoor Following Changes in Hydrological Management, Ecological Surveys (Bangor), Final report to RSPB, Natural England and the Environment Agency. 5 Morris J et al (2002): Economic Basis and Practicalities of Washland Creation on the Somerset Levels and Moors, Wise Use of Floodplain Project. General references (qualitative/descriptive changes): Acreman MC et al (2009): A Simple Framework for Evaluating Regional Wetland Ecohydrological Response to Climate Change with Case Studies from Great Britain, Ecohydrology, 2, pp1–17, published online in Wiley InterScience (www.interscience.wiley.com) DOI: 10.1002/eco.37. Harrison PA et al (eds.) (2001): Climate Change and Nature Conservation in Britain and Ireland: Modelling Natural Resource Responses to Climate Change (the MONARCH Project), Technical Report, Oxford, UKCIP. Natural England (2009): Responding to the Impacts of Climate Change on the Natural Environment: Dorset Downs and Cranborne Chase, 31 March 2009. For more detailed list of references and research reviewed, see Annex 4 4.4 Thresholds and Optimal Limits for Flooding Available data show that the implications of freshwater flooding vary
according to flood tolerance. Table 4.3: Impacts of Changes in the Flooding on the Features
Hydrology Feature
Qualitative Description of Climate Change Impacts Alleviation threshold Adaptation threshold
Cereal crops
Unpredictable inundation but note that shallow, short duration flooding is not necessarily bad for crops
1:10 (freshwater/pluvial) whole year or 1:25
summer (April-October)
1:50 (tidal)
1:5 (freshwater/pluvial) 1:10 (tidal)

Environmental and Socio-Economic Impacts of Climate Change in the Brue Valley
Page 58
Table 4.3: Impacts of Changes in the Flooding on the Features
Hydrology Feature
Qualitative Description of Climate Change Impacts Alleviation threshold Adaptation threshold
Dry grassland of high value for wildlife
Periodic flooding would lead to reduction in species richness
1:5 (freshwater/pluvial) whole year or 1:10
summer (April-October)
1:50 (tidal)
1:5 (freshwater/pluvial) 1:10 (tidal)
Dry grassland of low value for wildlife
Unpredictable inundation favours resilient colonisers / wetland grasses, leads to reduction in species diversity
Increased run-off from high intensity rainfall
1:5 (freshwater/pluvial) whole year or 1:10
summer (April-October)
1:50 (tidal)
1:5 (freshwater/pluvial) 1:10 (tidal)
Lakes/ponds
Higher peak flows could increase erosion, lower flows during drier periods could increase sedimentation
No threshold data found
No threshold data found
Orchards and horticulture
Unpredictable inundation Increased run-off from
high intensity rainfall Extreme events (flood)
can cause major problems in terms of supply and quality for many crops
1:20 (freshwater/pluvial) whole year or 1:100
summer (April-October)
1:50 (tidal)
1:5 (freshwater/pluvial) 1:10 (tidal)
Other (roads and settlements)
Unpredictable inundation Increased run-off from
high intensity rainfall Flooding of roads,
cutting off communities/isolated properties
No threshold data found
1:5 (usually use 1:3 for write-off of properties, likely to be longer timescale for businesses and 1:5 is modelled)
Peat works and bare ground
Unpredictable inundation No threshold data
found No threshold data
found
Reedbeds
Unpredictable inundation Increased run-off from
high intensity rainfall Higher peak flows/runoff
could increase erosion
Threshold flood duration (winter)1:
o max duration – single exposure event (drying out of channel): 5 days
o cumulative duration of exposure: 10 days
Threshold flood duration (spring)1:
o max duration – single exposure event (drying out of channel): 10 days
o cumulative duration of exposure: 20 days
Threshold flood
Threshold flood duration (winter)1:
o max duration – single exposure event (drying out of channel): 5 days
o cumulative duration of exposure: 10 days
Threshold flood duration (spring)1:
o max duration – single exposure event (drying out of channel): 10 days
o cumulative duration of exposure: 20 days
Threshold flood duration (summer)1:
o max duration –

Risk & Policy Analysts, Geckoella, Environment Systems
Page 59
Table 4.3: Impacts of Changes in the Flooding on the Features
Hydrology Feature
Qualitative Description of Climate Change Impacts Alleviation threshold Adaptation threshold
duration (summer)1: o max duration –
single exposure event (drying out of channel): 70 days
o cumulative duration of exposure: 70 days
Threshold flood duration (autumn)1:
o max duration – single exposure event (drying out of channel): 25 days
single exposure event (drying out of channel): 50 days
o cumulative duration of exposure: 50 days.
Threshold flood duration (autumn)1:
o max duration – single exposure event (drying out of channel): 10 days
Rivers/streams/ ditches/rhynes
Higher peak flows could increase erosion, lower flows during drier periods could increase sedimentation
Threshold flood duration (winter)1:
o max duration – single exposure event (drying out of channel): 20 days
o cumulative duration of exposure: 40 days
Threshold flood duration (spring)1:
o max duration – single exposure event (drying out of channel): <7 days
o cumulative duration of exposure: <12 days
Threshold flood duration (summer)1:
o max duration – single exposure event (drying out of channel): <7 days
o cumulative duration of exposure: <12 days
Threshold flood duration (autumn)1:
o max duration – single exposure event (drying out of channel): <7 days
o cumulative duration of exposure: <12 days
Threshold flood duration (winter)1:
o max duration – single exposure event (drying out of channel): 30 days
o cumulative duration of exposure: 50 days
Threshold flood duration (spring)1:
o max duration – single exposure event (drying out of channel): <10 days
o cumulative duration of exposure: <15 days
Threshold flood duration (summer)1:
o max duration – single exposure event (drying out of channel): <10 days
o cumulative duration of exposure: <15 days
Threshold flood duration (autumn)1:
o max duration – single exposure event (drying out of channel): <10 days
o cumulative duration of exposure: <15 days
Swamp and fen
Periodic inundation up to 200mm typical for habitat1
Unpredictable inundation leads to reduction in species diversity
No threshold data found
No threshold data found

Environmental and Socio-Economic Impacts of Climate Change in the Brue Valley
Page 60
Table 4.3: Impacts of Changes in the Flooding on the Features
Hydrology Feature
Qualitative Description of Climate Change Impacts Alleviation threshold Adaptation threshold
Wet grassland of high value for wildlife
Unpredictable inundation favours resilient colonisers, leads to reduction in species diversity
Breeding waders vulnerable to winter flooding reducing prey availability2
Sensitive to flooding, with risk of long-lasting decline in species-rich communities even if hydrological conditions are restored to pre-flood3
Deposition of nutrients during flooding can have significant impact4
1:5 (freshwater/pluvial)3
whole year or 1:50 (tidal)
Threshold flood duration (winter)1:
o max duration of surface flooding episode covering >10% of area: 10-18 days
o cumulative duration of flooding during season: 35-45 days
Threshold flood duration (spring)1:
o max duration of surface flooding episode covering >10% of area: 7-12 days
o cumulative duration of flooding during season: 18-30 days
Threshold flood duration (summer)1:
o max duration of surface flooding episode covering >10% of area: 3-7 days
o cumulative duration of flooding during season: 9-14 days
Threshold flood duration (autumn)1:
o max duration of surface flooding episode covering >10% of area: 7-12 days
o cumulative duration of flooding during season: 16-24 days
1:3 (freshwater/pluvial)3
1:10 (tidal) Threshold flood
duration (winter)1: o max duration of
surface flooding episode covering >10% of area: >35 days
o cumulative duration of flooding during season: >60 days.
Threshold flood duration (spring)1:
o max duration of surface flooding episode covering >10% of area: >12 days
o cumulative duration of flooding during season: >45 days.
Threshold flood duration (summer)1:
o max duration of surface flooding episode covering >10% of area: >20 days
o cumulative duration of flooding during season: >60 days.
Threshold flood duration (autumn)1:
o max duration of surface flooding episode covering >10% of area: >14 days
o cumulative duration of flooding during season: >55 days
Wet grassland of low value for wildlife
Unpredictable inundation Increased run-off from
high intensity rainfall
1:5 (freshwater/pluvial) whole year or 1:3 summer (April-
October) 1:50 (tidal)
Threshold flood
duration (winter)1: o max duration of
surface flooding
1:3 (freshwater/pluvial) 1:10 (tidal)
Threshold flood
duration (winter)1: o max duration of
surface flooding episode covering >10% of area: >18 days
o cumulative duration

Risk & Policy Analysts, Geckoella, Environment Systems
Page 61
Table 4.3: Impacts of Changes in the Flooding on the Features
Hydrology Feature
Qualitative Description of Climate Change Impacts Alleviation threshold Adaptation threshold
episode covering >10% of area: 21-35 days
o cumulative duration of flooding during season: 40-60 days
Threshold flood duration (spring)1:
o max duration of surface flooding episode covering >10% of area: 5-12 days
o cumulative duration of flooding during season: 30-45 days
Threshold flood duration (summer)1:
o max duration of surface flooding episode covering >10% of area: 8-20 days
o cumulative duration of flooding during season: 30-60 days
Threshold flood duration (autumn)1:
o max duration of surface flooding episode covering >10% of area: 7-14 days
o cumulative duration of flooding during season: 35-55 days
of flooding during season: >45 days.
Threshold flood duration (spring)1:
o max duration of surface flooding episode covering >10% of area: >12 days
o cumulative duration of flooding during season: >30 days.
Threshold flood duration (summer)1:
o max duration of surface flooding episode covering >10% of area: >7 days
o cumulative duration of flooding during season: >14 days.
Threshold flood duration (autumn)1:
o max duration of surface flooding episode covering >10% of area: a>12 days
o cumulative duration of flooding during season: >24 days
Wet heath and purple moor grass
Unpredictable inundation leads to reduction in species diversity
No threshold data found
No threshold data found
Woodland/ hedgerow/line of trees/scrub/bracken
Unpredictable inundation (wet woodland does well with annual winter inundation, summer inundation 1:5 years)1
Extreme events (flood) may lead to loss of landscape quality and/or landscape context through loss of old trees
No threshold data found
No threshold data found
Key references (quantified/threshold changes): 1 Environment Agency (2004): Ecohydrological Guidelines for Lowland Wetland Plant Communities, Final Report, December 2004. 2 Ausden et al (2001): The effects of lowland wet grassland on soil macro invertebrate prey of breeding wading birds, Journal of Applied Ecology, 38, pp320- 33. 3 Cranfield University (2005): Response of Grassland Plant Communities to Altered Hydrological Management, Defra Research Report BD1321, June 2005.

Environmental and Socio-Economic Impacts of Climate Change in the Brue Valley
Page 62
Table 4.3: Impacts of Changes in the Flooding on the Features
Hydrology Feature
Qualitative Description of Climate Change Impacts Alleviation threshold Adaptation threshold
4 Gowing DJG et al (2002): Water Regime Requirements and the Response to Hydrological Change of Grassland Plant Communities Institute of Water and Environment, Silsoe. General references (qualitative/descriptive changes): Natural England (2009): Responding to the Impacts of Climate Change on the Natural Environment: Dorset Downs and Cranborne Chase, 31 March 2009. For more detailed list of references and research reviewed, see Annex 4
4.5 Other Impacts Associated with Climate Change Table 4.4: Impacts of Other Changes on the Features
Feature Qualitative Description of Climate Change Impacts
Cereal crops
Risk of increased diseases and pests SW England becomes better place to grow crops than SE England Change to biofuels could have impact on invertebrates Expansion into biofuels could result in monocultures (sterilising effect on
landscape) Dry grassland of high value for wildlife
Risk of increased diseases and pests Species-rich grassland may be more resilient to change, but take longer to
recover Dry grassland of low value for wildlife
Risk of increased diseases and pests
Lakes/ponds Risk of increased diseases pests (including Aedes mosquitos) and invasive
species Orchards and horticulture
Risk of increased diseases and pests
Other (roads and settlements)
Increased pressure on resources, e.g. water Disruption to services
Peat works and bare ground
None identified
Reedbeds Risk of increased diseases, pests and invasive species
Rivers/streams/ ditches/rhynes
Risk of increased diseases, pests (including Aedes mosquitos) and invasive species
Swamp and fen Risk of increased diseases, pests
Wet grassland of high value for wildlife
Risk of increased diseases, pests, invasive species Breeding waders vulnerable to:
- phenological miscues - habitat changes in structure and hydrology
Winter birds may over-winter closer to breeding grounds Long-distance migrants most vulnerable
Wet grassland of low value for wildlife
Risk of increased diseases and pests
Wet heath and purple moor grass
Risk of increased diseases and pests
Woodland /hedgerow/line of trees/scrub and bracken
Qualitative change in woodland communities, especially ground flora (more shading from larger leaves and longer growing season).
Risk of increased diseases and pests (e.g. Phytophora spp. on Alder) Potential change in hedgerow plant composition

Risk & Policy Analysts, Geckoella, Environment Systems
Page 63
Table 4.4: Impacts of Other Changes on the Features
Feature Qualitative Description of Climate Change Impacts
General references (qualitative/descriptive changes): Natural England (2009): Responding to the Impacts of Climate Change on the Natural Environment: Dorset Downs and Cranborne Chase, 31 March 2009. Warwick HRI (2008): Vulnerability of UK Agriculture to Extreme Events, Research Report AC0301 to Defra, Final Report. For more detailed list of references and research reviewed, see Annex 4
4.6 Overall Estimate of Sensitivity of the Features To assess the implications of the climatic and environmental changes, it is
necessary to identify how sensitive each of these features is to the magnitude of the possible changes. Tables 4.1 to 4.4 describe the conditions under which each feature may be affected. The features may change in quality or type if future conditions lie outside optimum conditions. By analysing the conditions under which the features are affected and the projected climatic changes (as described in Section 3.1), each feature is assigned a rating to reflect its likely sensitivity:
highly sensitive (Hs): new conditions approach (or recede from) limits to
viability for the feature: slightly sensitive (Ss): new conditions approach (or recede from)
optimum conditions for the feature – is temperature or rainfall a limiting factor?:
resilient (Re): feature is able to absorb the disturbance while retaining the same basic structure and ways of functioning, and has the capacity to adapt to stress and change4:
robust (Ro): feature is able to cope with or recover from the change4:
Due to seasonal differences in the climate change variables and the likely response of the features to those variables, each feature is assigned a seasonal sensitivity rating. The results of the analysis are shown in Table 4.5. The table shows the change in temperature and precipitation from the UKCP data. The sensitivity of the features to changes in precipitation also includes an assessment of the possible change in the water table to reflect how changes in temperature and precipitation might affect water availability. It is important to remember when considering the sensitivity ratings assigned that that the confidence levels of the UKCP09 data may mean that seasonal data are less reliable projections of the future than annual data. Many of the features are also highly sensitive to both trend changes in hydrology, and to extreme flow events (drought / flood). Hydrology in the Brue Valley (considered here to be the flow of water) is heavily managed, and is therefore only partly related to incident rainfall (precipitation). Annex 6 provides the detail from which this
4 Based on the definition in the UKCP glossary:
http://ukclimateprojections.defra.gov.uk/content/view/514/690/

Environmental and Socio-Economic Impacts of Climate Change in the Brue Valley
Page 64
analysis is derived and the justification behind the sensitivities that have been assigned.
Table 4.5: Sensitivity of the Features to the Projected Climate Change Effects (2040-2069)
10% Probability 90% Probability Feature
Climate Change Effect S S A W S S A W
Temperature 1.4°C
Ss 1.4°C
Ss 1.8°C
Ss 1.3°C
Ss 3.6°C
Ss 5.2°C
Ss 4.2°C
Ss 3.5°C
Ss
Precipitation 7.9%
Ss 46%
Hs 4.7%
Ss 1.2%
Re 7.6%
Ss 9.3%
Ss 15%
Ss 27%
Ss
Flooding (freshwater)
Reduction in flood risk of up to 8% Re
Increase in flood risk of up to 36% (but much smaller increase in risk on
less extreme events) Ss
Cereal crops
Flooding (tidal)
Saline flooding Hs
Temperature 1.4°C
Re 1.4°C
Re 1.8°C
Re 1.3°C
Re 3.6°C
Ss 5.2°C
Ss 4.2°C
Ss 3.5°C
Re
Precipitation 7.9%
Ss 46%
Ss 4.7%
Ss 1.2%
Ss 7.6%
Ss 9.3%
Ss 15%
Ss 27%
Re
Flooding (freshwater)
Reduction in flood risk of up to 8% Re
Increase in flood risk of up to 36% (but much smaller increase in risk on
less extreme events) Hs
Dry grassland of high value for wildlife
Flooding (tidal)
Saline flooding Hs
Temperature 1.4°C
Re 1.4°C
Re 1.8°C
Re 1.3°C
Re 3.6°C
Ss 5.2°C
Ss 4.2°C
Ss 3.5°C
Re
Precipitation 7.9%
Hs 46%
Hs 4.7%
Hs 1.2%
Ss 7.6%
Ss 9.3%
Ss 15%
Ss 27%
Ss
Flooding (freshwater)
Reduction in flood risk of up to 8% Re
Increase in flood risk of up to 36% (but much smaller increase in risk on
less extreme events) Ss
Dry grassland of low value for wildlife
Flooding (tidal)
Saline flooding Hs
Temperature 1.4°C
Ss 1.4°C
Ss 1.8°C
Re 1.3°C
Re 3.6°C
Ss 5.2°C
Ss 4.2°C
Ss 3.5°C
Ss
Precipitation 7.9%
Ss 46%
Hs 4.7%
Hs 1.2%
Ss 7.6%
Re 9.3%
Re 15%
Re 27%
Re
Flooding (freshwater)
Reduction in flood risk of up to 8% Re
Increase in flood risk of up to 36% (but much smaller increase in risk on
less extreme events) Re
Lakes/ ponds
Flooding (tidal)
Saline flooding Hs
Temperature 1.4°C
Ss 1.4°C
Ss 1.8°C
Ss 1.3°C
Ss 3.6°C
Ss 5.2°C
Ss 4.2°C
Ss 3.5°C
Ss
Precipitation 7.9%
Ss 46%
Hs 4.7%
Re 1.2%
Re 7.6%
Re 9.3%
Re 15%
Re 27%
Re
Flooding (freshwater)
Reduction in flood risk of up to 8% Re
Increase in flood risk of up to 36% (but much smaller increase in risk on
less extreme events) Ss
Orchards and horti-culture
Flooding (tidal)
Saline flooding Hs

Risk & Policy Analysts, Geckoella, Environment Systems
Page 65
Table 4.5: Sensitivity of the Features to the Projected Climate Change Effects (2040-2069)
10% Probability 90% Probability Feature
Climate Change Effect S S A W S S A W
Temperature 1.4°C
Ro 1.4°C
Ro 1.8°C
Ro 1.3°C
Ro 3.6°C
Re 5.2°C
Ss 4.2°C
Re 3.5°C
Re
Precipitation 7.9%
Ro 46%
Ss 4.7%
Ro 1.2%
Ro 7.6%
Re 9.3%
Re 15%
Re 27%
Ss
Flooding (freshwater)
Reduction in flood risk of up to 8% Ro
Increase in flood risk of up to 36% (but much smaller increase in risk on
less extreme events) Ss
Other (roads)
Flooding (tidal)
Saline flooding Hs
Temperature 1.4°C
Re 1.4°C
Re 1.8°C
Re 1.3°C
Re 3.6°C
Re 5.2°C
Ss 4.2°C
Ss 3.5°C
Re
Precipitation 7.9%
Re 46%
Ss 4.7%
Re 1.2%
Re 7.6%
Re 9.3%
Re 15%
Ss 27%
Ss
Flooding (freshwater)
Reduction in flood risk of up to 8% Re
Increase in flood risk of up to 36% (but much smaller increase in risk on
less extreme events) Ss
Other (settle-ments)
Flooding (tidal)
Saline flooding Hs
Temperature 1.4°C
Ro 1.4°C
Ro 1.8°C
Ro 1.3°C
Ro 3.6°C
Re 5.2°C
Re 4.2°C
Re 3.5°C
Re
Precipitation 7.9%
Ro 46%
Ro 4.7%
Ro 1.2%
Ro 7.6%
Ss 9.3%
Ss 15%
Ss 27%
Ss
Flooding (freshwater)
Reduction in flood risk of up to 8% Ro
Increase in flood risk of up to 36% (but much smaller increase in risk on
less extreme events) Ss
Peat works and bare ground
Flooding (tidal)
Saline flooding Ss
Temperature 1.4°C
Re 1.4°C
Re 1.8°C
Re 1.3°C
Re 3.6°C
Re 5.2°C
Re 4.2°C
Re 3.5°C
Re
Precipitation 7.9%
Ss 46%
Ss 4.7%
Ss 1.2%
Ss 7.6%
Re 9.3%
Re 15%
Re 27%
Re
Flooding (freshwater)
Reduction in flood risk of up to 8% Re
Increase in flood risk of up to 36% (but much smaller increase in risk on
less extreme events) Re
Reed- beds
Flooding (tidal)
Saline flooding Ss
Temperature 1.4°C
Ss 1.4°C
Ss 1.8°C
Re 1.3°C
Re 3.6°C
Ss 5.2°C
Ss 4.2°C
Ss 3.5°C
Ss
Precipitation 7.9%
Ss 46%
Hs 4.7%
Hs 1.2%
Ss 7.6%
Re 9.3%
Re 15%
Re 27%
Re
Flooding (freshwater)
Reduction in flood risk of up to 8% Re
Increase in flood risk of up to 36% (but much smaller increase in risk on
less extreme events) Re
Rivers/ streams/ditches/ rhynes
Flooding (tidal)
Saline flooding Ss

Environmental and Socio-Economic Impacts of Climate Change in the Brue Valley
Page 66
Table 4.5: Sensitivity of the Features to the Projected Climate Change Effects (2040-2069)
10% Probability 90% Probability Feature
Climate Change Effect S S A W S S A W
Temperature 1.4°C
Re 1.4°C
Re 1.8°C
Re 1.3°C
Re 3.6°C
Ss 5.2°C
Ss 4.2°C
Ss 3.5°C
Ss
Precipitation 7.9%
Hs 46%
Hs 4.7%
Hs 1.2%
Hs 7.6%
Re 9.3%
Re 15%
Re 27%
Re
Flooding (freshwater)
Reduction in flood risk of up to 8% Re
Increase in flood risk of up to 36% (but much smaller increase in risk on
less extreme events) Re
Swamp and fen
Flooding (tidal)
Saline flooding Hs
Temperature 1.4°C
Re 1.4°C
Re 1.8°C
Re 1.3°C
Re 3.6°C
Ss 5.2°C
Ss 4.2°C
Ss 3.5°C
Re
Precipitation 7.9%
Hs 46%
Hs 4.7%
Hs 1.2%
Hs 7.6%
Ss 9.3%
Ss 15%
Ss 27%
Ss
Flooding (freshwater)
Reduction in flood risk of up to 8% Re
Increase in flood risk of up to 36% (but much smaller increase in risk on
less extreme events) Ss
Wet grassland of high value for wildlife
Flooding (tidal)
Saline flooding Hs
Temperature 1.4°C
Re 1.4°C
Re 1.8°C
Re 1.3°C
Re 3.6°C
Ss 5.2°C
Ss 4.2°C
Ss 3.5°C
Re
Precipitation 7.9%
Hs 46%
Hs 4.7%
Hs 1.2%
Hs 7.6%
Ss 9.3%
Ss 15%
Ss 27%
Ss
Flooding (freshwater)
Reduction in flood risk of up to 8% Re
Increase in flood risk of up to 36% (but much smaller increase in risk on
less extreme events) Ss
Wet grassland of low value for wildlife
Flooding (tidal)
Saline flooding Hs
Temperature 1.4°C
Re 1.4°C
Re 1.8°C
Re 1.3°C
Re 3.6°C
Ss 5.2°C
Ss 4.2°C
Ss 3.5°C
Ss
Precipitation 7.9%
Hs 46%
Hs 4.7%
Hs 1.2%
Hs 7.6%
Re 9.3%
Re 15%
Re 27%
Re
Flooding (freshwater)
Reduction in flood risk of up to 8% Re
Increase in flood risk of up to 36% (but much smaller increase in risk on
less extreme events) Re
Wet heath and purple moor grass
Flooding (tidal)
Saline flooding Hs
Temperature 1.4°C
Ss 1.4°C
Ss 1.8°C
Ss 1.3°C
Ss 3.6°C
Ss 5.2°C
Ss 4.2°C
Ss 3.5°C
Ss
Precipitation 7.9%
Ss 46%
Ss 4.7%
Ss 1.2%
Ss 7.6%
Ss 9.3%
Ss 15%
Ss 27%
Ss
Flooding (freshwater)
Reduction in flood risk of up to 8% Re
Increase in flood risk of up to 36% (but much smaller increase in risk on
less extreme events) Ss
Wood land/ hedge row/line of trees/ scrub and bracken Flooding
(tidal) Saline flooding
Hs

Risk & Policy Analysts, Geckoella, Environment Systems
Page 67
5. STORYLINES 5.1 Introduction This Section provides the storylines for each feature. Each storyline is
structured as follows:
brief description of the current use, or baseline; an overview of the impacts of climate change; assessment of the implications of climate change for people and the
environment. This looks at the implications before any adaptation measures could be taken. It is important to note that a negative impact on one feature or service may have benefits for others. The colours included in each storyline describe the effects of climate change on the feature in terms of ability to deliver ecosystem services and other benefits. (Implications arising from changes from one feature to another are described in Sections 6 and 7).
identification of adaptation options and responses. This identifies different adaptation measures that could be used as well as any new opportunities that could be exploited under each of the four socio-economic scenarios. It also summarises changes to land use, environmental quality of the feature and socio-economic impacts (jobs, income and skills) that could occur as a result of climate change and any adaptation options that are taken. The 10% and 90% climate change probabilities are assessed separately to reflect the different implications and adaptation measures that might be required.
Summary of changes in land use following adaptation. This provides an indication of the projected change in area of the feature as a result of adaptation to climate change.
One storyline is provided for each feature, with each storyline designed as a standalone description of the impacts that could occur as a result of climate change and then how those impacts could be reduced through the use of adaptation measures: cereal crops (covering land where cereal crops are grown as part of a
rotation); dry grassland of high value for wildlife; dry grassland of low value for wildlife; lakes and ponds; orchards and horticulture; other (settlements and roads); peat works and bare ground; reedbeds; rivers, streams, ditches and rhymes; swamp and fen; wet grassland of high value for wildlife; wet grassland of low value for wildlife; wet heath and purple moor grass; and woodland, line of trees, hedgerow and scrub and bracken.

Storyline for Cereal Crops
Page 68
Cereal Crops Current use (baseline) Cereal crops make up 4% of the current land use covering 381 ha. The dominant arable crops are cereals, particularly winter wheat and fodder maize. It is estimated that around 11 FTE jobs are associated with cereal farming5 (out of a total of around 540 for agriculture in the area), and that gross income from cereal crops is around £300,000 per annum6. Impacts of climate change The graph below shows changes in temperature and precipitation changes under the high emissions scenario, by season.
The table below uses thresholds to identify the impacts on cereal crops under the high emissions scenario, based on how temperature, precipitation and flooding change with time at the 10% and 90% probability levels. The impacts are colour coded as follows: significant negative impacts: medium/unknown negative impacts: low/negligible impacts: medium/unknown positive impacts: ; and significant positive impacts:
5 Based on Annual Labour Units from Defra Farm Accounts for 2009/10. 6 Based on data on output from cereal farms from Defra Farm Accounts for 2009/10.
0.0
0.5
1.0
1.5
2.0
2.5
3.0
3.5
4.0
4.5
5.0
5.5
0% 10% 20% 30% 40% 50% 60% 70% 80% 90% 100%
Probability (High Emissions)
Ch
ang
e in
Tem
pe
ratu
re (
°C)
-50%
-40%
-30%
-20%
-10%
0%
10%
20%
30%
Ch
ang
e in
Pre
cip
ita
tio
n (
%)
Precipitation: Spring
Precipitation: Summer
Precipitation: Autumn
Precipitation: Winter
Temperature Spring
Temperature: Summer
Temperature: Autumn
Temperature: Winter
Change in Temperature and Precipitation : High Emissions

Risk & Policy Analysts, Geckoella and Environment Systems
Page 69
Change Thresholds Impacts without adaptation
Combination of change in temperature and precipitation could result in:
10% probability: o reduction in yields of
winter wheat crops by 14%
Change in temperature
1° to 3°C increase could increase yields of maize and wheat and result in earlier maturity, but >3°C increase could cause stress and yield reductions. Reduced frost damage, but higher temperatures may affect ability to flower in spring, germination and maturing
o possible slight increase in maize crop
90% probability: o no change in yields of
winter wheat or maize
Change in rainfall
Increased rainfall in summer will reduce need for irrigation and could increase yields Decreased rainfall in summer may increase need for irrigation, or without irrigation, would reduce yields
o reduction in irrigation requirements for winter wheat of 33 mm
Land use change from cereals, e.g. to grassland, swamp, scrub, peat extraction, etc.
Change in flood risk
Increase in frequency of fluvial or pluvial floods would make cereal farming more difficult. Competition from developments for scarce resources for flood protection. Marginal land may no longer be worth farming for arable.
Crop damage would become more frequent (although short duration, shallow flooding may have little impact)
10% probability: o slightly drier autumn may
benefit cultivations Other impacts
Autumn cultivations may be affected by wetter winters and summers. Increased risk of pests and diseases
90% probability: o 15% increase in autumn
rainfall may affect cultivations
Implications of climate change for people and the environment The table below looks in more detail at the implications of the impacts described above without any adaptation measures being used. The impacts are colour coded using the same key as above. 10% probability (90% chance that climate change will result in higher temperatures and increased precipitation)
Impacts without adaptation Implications
Reduction in yields of winter wheat crops by 14% due to reduced rainfall
Reduction in farm incomes by £140 per ha per year, or £53,000 over area currently used for cereal crops7. This could result in the loss of 1.3 FTEs8
7 Assumes that 60% of the arable area is used for winter wheat (229 ha), 40% for
maize (152 ha) (based on agricultural census data for Sedgemoor and Mendip).

Storyline for Cereal Crops
Page 70
Possible slight increase in maize crop No significant change in farm incomes
Slightly drier autumn may benefit cultivations…but see impacts below due to pluvial flooding
Possible slight reduction in labour costs
Change in cropping patterns Implications depend on detailed response, including for biodiversity (e.g. farmland birds)
Drier soils increase risk of pluvial flooding due to increased runoff. Impacts will depend on timing of flooding, with increased autumn/winter flooding likely to affect farming activities and could reduce opportunities to grow winter crops
Increased costs associated with cultivation and planting, with reduction in opportunities for ploughing and drilling of crops. This could reduce attractiveness of winter cereals
90% probability (10% chance that climate change will result in higher temperatures and increased precipitation) No change in yields of winter wheat or maize
No significant change in farm incomes
Reduction in irrigation requirements for winter wheat of 33 mm
Possible slight reduction in irrigation costs (where incurred)
15% increase in autumn rainfall may affect cultivations
Possible increase in labour costs and may affect profitability of crops
Rising water tables may make cereals unviable in some areas
Reduced yields due to waterlogging of soils. Increased risk of pluvial and fluvial flooding (but change may bring environmental benefits to biodiversity, peat conservation (assuming not extracted) and GHG management)
Change in flood risk
Increased risk of freshwater flooding due to increased precipitation overall and increased amount of precipitation on wet days. Land use change from cereals may arise through active transformation (e.g. convert to grassland) or through passive change (e.g. natural change to scrub / swamp)
Implications will depend on the evacuation of water from areas under cereal crops. Potential increase in biodiversity, water quality, floodplain function, decrease in GHG / nutrient inputs / emissions (change to peat extraction though would be negative)
Uncertainty over long-term viability of cereal farming may lead to variable management from year to year
Negative impacts on biodiversity and other qualities that depend on long-term stable management to accumulate benefits
Adaptation options and responses If climate change has significant implications (whether positive or negative) for people and the environment then communities may adapt and respond. This response will depend upon the socio-economic context prevalent at the time. The table below looks at the adaptations available under each of four different socio-economic scenarios9. It also looks at whether or not these adaptation options are sufficient to alleviate adverse implications, or to make the most of
8 Calculated used Econi (online input-output multiplier model for Somerset). FTE is
full-time equivalent 9 A full description of the scenarios is given in Section 3 (and Annex 5).

Risk & Policy Analysts, Geckoella and Environment Systems
Page 71
opportunities associated with climate change for the use of the land for cereal crops. The table uses a series of symbols to illustrate the key impacts: Adaptation measures: Opportunities:
£ more investment use of new technology/techniques
change in activity move to more profitable activity
increase in activity (intensification) move to funding for
environmental improvements
decrease in activity (extensification)
application of existing skills
0 no adaptation taken (or needed) development of new skills 10% probability (90% chance that climate change will result in higher temperatures and increased precipitation) Implications without adaptation
Reduction in farm incomes by £140 per ha, or £53,000 over area currently used for cereal crops. This could result in the loss of 1.3 FTEs. No impact on maize crops although labour costs for cultivations may reduce slightly when conditions are drier in autumn/winter but could increase due to heavier rainfall on wetter days
Adaptation responses under…
World Markets Scenario
Provincial Enterprise Scenario
Global Sustainability Scenario
Local Stewardship Scenario
Adaptation actions
£ More investment in water management to provide water to wheat crops when it is needed and to allow evacuation of water during times of high rainfall and runoff. Higher profits from arable crops mean some grassland is cultivated for cereals
Lack of coordinated management may mean there is limited opportunity for irrigation, so farmers are likely to move to crops that are less likely to be affected by drier summers. This may include a move away from winter crops due to impact of wetter days on access to fields for ploughing and drilling. Potential to increase area of arable crops through cultivation of grasslands
Micro-management of water levels likely to reduce, so farmers are likely to move to crops that are less likely to be affected by drier summers / flooding. This could also affect ability to evacuate water on wetter days (autumn/ winter) and could result in move to spring crops
Need for local crops may result in intensification in crop growth where water is available. Wetter days in autumn/ winter and more piecemeal approach to drainage may make cereal crops unviable in some areas, with move to more flood resilient crops
Opportunities Use of new technology to breed wheat varieties that are high yielding in drier conditions
Potential to move to new, more profitable crops and crops that can be planted earlier or later to
and Farmers may look for alternative funding opportunities, such as agri-environment payments. Search for new crops with
Crops grown are targeted to local demand so could provide basis for local pressure for sustainable crops,

Storyline for Cereal Crops
Page 72
and/or more resilient to occasional, short duration flooding
avoid risk that soil is too wet
multiple benefits (high yield/low input/flood tolerant, etc.), or change in land use
through a move towards more mixed farming, increasing flood resilience overall
After adaptation – changes in land use
May be move towards maize crops if drier summers become more common. Potential to also move to energy crops. Increase in cereal crops likely to be at expense of grassland
Move towards maize and other crops better suited to drier conditions, especially crops that are more resilient to short duration flooding, or can be planted earlier (or later). Cultivation of grasslands
Move to maize or land uses supported by agri-environment payments. Potential to also move to energy crops
May be some intensification but on small scale and only where sufficient water is readily available in spring/summer. Potential to also move to energy crops, with increase in area under cereal crops due to move to mixed farming
After adaptation – environmental changes
Unlikely to be any significant change since cultivation will be on lowest value grasslands
Environmental costs of new crops high due to minimal regulatory regime and loss of grasslands. This could result in fragmentation of existing habitats, especially where land is converted to cereal crops
Environmental costs of new crops low due to technological advances. Environmental gains arising from land use changes
Limited negative impact where there is intensification; limited benefits from niche low-input farms. This could result in fragmentation of existing habitats (although will not affect higher quality areas)
After adaptation – socio-economic changes
Increase in area of cereal crops could create new jobs
Significant increase in area of cereal crops could create and support a large number of jobs
Job losses and reductions in income would be mostly avoided
Some additional jobs may be created through small increase in area of cereal crops. May also be an increase in new skills
90% probability (10% chance that climate change will result in higher temperatures and increased precipitation) Implications without adaptation
No significant change in farm incomes, or number of employees, although labour costs of cultivations may increase in wetter autumns. Risk of freshwater flooding increases (both pluvial and fluvial)
Adaptation responses under…
World Markets Scenario
Provincial Enterprise Scenario
Global Sustainability Scenario
Local Stewardship Scenario
Adaptation actions
£ More investment in water management techniques to help evacuate water more quickly, helping to reduce any increase in flood
0 No significant adaptation taken. Risk of flooding increases and could affect incomes in some years (when flooding affects planting of crops
May be move to more sustainable crop growth with reduced inputs, reducing level of intensification. This may help reduce the impacts from short duration flooding
Water management at catchment scale, run by farmers for farmers to evacuate water along less damaging routes will reduce impact

Risk & Policy Analysts, Geckoella and Environment Systems
Page 73
risk. Investment in new ditches on highest/driest land could permit cultivation of grasslands
or yield). Increased cultivation of grassland may make farmers more susceptible to loss of crop (or yield) due to flooding
on cereal crops
Opportunities Development of new techniques to minimise labour cost changes in wetter weather, and to help evacuate water quickly following heavy rainfall
Application of skills that farmers already have to changing conditions, including move to more resilient crops. Private payments for landowners to help manage local flooding
Development of new skills to evacuate water quickly to prevent damage to crops. Managed change in land use – floodplain function and low-input farming prioritised
Move to more mixed farming practices, with opportunity to develop new skills. Localised land use change in response to flooding
After adaptation – changes in land use
Potential increase in area due to cultivation of highest/driest grasslands and additional drainage activity
Localised land use change in response to flooding, with cereals being concentrated on higher/drier land
Shift in land use to extensive floodplain management
May be reorganisation of fields due to move to mixed farming, with small increase in area used for cereal crops (from grassland)
After adaptation – environmental changes
Increased drainage may affect adjacent habitats and ditch flora/fauna
Patchy benefits / losses, although there is significant potential for habitat fragmentation due to minimal regulatory control, and loss of grasslands
Significant benefits from restored floodplain function and low-input management. There may be opportunities to link habitats together and/or modify where cereal crops are grown. Move to areas more naturally suited to arable production
May be small benefit, but will depend on farming practices. Benefits may be patchy
After adaptation – socio-economic changes
Increase in area of cereal crops could create new jobs
Large increase in area of crops could create new jobs
No significant benefits or losses
May be (small) increase in skills due to change in farming type
Summary of Changes in Land Use following Adaptation The table below shows the projected change in area of wet grassland of high value for wildlife, taking account of adaptation measures. The degree of uncertainty in the projected changes is highlighted using the following colour codings:

Storyline for Cereal Crops
Page 74
projected change is based on data: projected change is based on the likely trend: projected change is estimated/derived from limited information: ; and projected change is not known (guesstimate):
Scenario World Markets
Scenario
Provincial Enterprise Scenario
Global Sustainability
Scenario
Local Stewardship
Scenario
Current area 381 ha 381 ha 381 ha 381 ha
Probability (where the change could range from that shown for the 10% and 90% probabilities)
Change due to: 10% 90% 10% 90% 10% 90% 10% 90%
Temperature 0 ha 0 ha 0 ha 0 ha 0 ha 0 ha 0 ha 0 ha
Precipitation (water table) and/or freshwater flooding
+1,600 ha
+650 ha
+2,700 ha
+1,100 ha
0 ha 0 ha +400
ha +110
ha
It is important to remember that there is a 90% chance that the climate change effects will be greater than those described on the 10% probability, and that there is a 10% chance that the climate change effects will be lower than those described under the 90% probability.

Risk & Policy Analysts, Geckoella and Environment Systems
Page 75
Dry grassland of high value for wildlife Current use (baseline) Dry grassland of high value for wildlife makes up 1% of the current land use covering 58 ha. It comprises species rich grassland, including National Vegetation Community MG5. As well as biodiversity benefits, the grassland is grazed and used to produce hay as feed for livestock as part of a low input extensive farming system. Dry grassland of high value for wildlife supports around 1 farming job and provides annual income of around £79,000 (assuming a premium of 20% over livestock grazed outside areas of high value for wildlife). It also attracts wildlife tourists to the area, and is one of the features supporting around 280 tourism and conservation jobs in the Somerset Levels and Moors10. The current grassland regime receives lower water levels in winter (achieved by pumping) and higher water levels in summer (by impounding water in the major rivers and diverting it into rhynes). Impacts of climate change The graph below shows changes in temperature and precipitation under the high emissions scenario, by season.
10 It is not known if these are Full-Time Equivalents (FTEs) or total number of jobs (which could
include part-time jobs).
0.0
0.5
1.0
1.5
2.0
2.5
3.0
3.5
4.0
4.5
5.0
5.5
0% 10% 20% 30% 40% 50% 60% 70% 80% 90% 100%
Probability (High Emissions)
Ch
ang
e in
Tem
pe
ratu
re (
°C)
-50%
-40%
-30%
-20%
-10%
0%
10%
20%
30%
Ch
ang
e in
Pre
cip
ita
tio
n (
%)
Precipitation: Spring
Precipitation: Summer
Precipitation: Autumn
Precipitation: Winter
Temperature Spring
Temperature: Summer
Temperature: Autumn
Temperature: Winter
Change in Temperature and Precipitation : High Emissions

Storyline for Dry Grassland of High Value for Wildlife
Page 76
The table below uses thresholds to identify the impacts on dry grassland of high value for wildlife under the high emissions scenario, based on how temperature, precipitation and flooding change with time at the 10% and 90% probability levels. The impacts are colour coded as follows: significant negative impacts: medium/unknown negative impacts: low/negligible impacts: medium/unknown positive impacts: ; and significant positive impacts: Change Thresholds Impacts without adaptation
Combination of change in temperature and precipitation could result in:
10% probability: o No impacts from change
in temperature
Change in temperature
Floristic changes / longer growing seasons
Competitive / woody species growth rates increase through temperature effects
o Lowering of water table results in reduced biomass
90% probability: o Increased temperatures
in spring, summer and autumn could cause stress to livestock
o Increased rainfall could increase biomass production…
Change in rainfall
Community change to drought resistant specialists due to summer droughts
Flower-rich dry meadows (e.g. MG5) vulnerable to water table rises and unpredictable inundation. Hard to restore once changed
Increased precipitation initially increases productivity, but then grasslands become less productive; eventual move towards swamp and fen (depending on water table management)
o …but too much of an increase could result in waterlogging stress
Change in flood risk
Unpredictable inundation favours resilient colonisers / wetland grasses, leads to reduction in species diversity
Potential increase in growth from silt loading
10% probability: o Occasional wetter days
in what are otherwise much drier conditions would result in increased run-off, increasing the frequency of localised inundation
o Increased frequency of inundation could result in a change in species composition, and move towards wetter grassland type varieties

Risk & Policy Analysts, Geckoella and Environment Systems
Page 77
90% probability: o Much wetter conditions,
and more frequent wetter days increases risk of pluvial and fluvial flooding
o Increased frequency of inundation could result in increased waterlogging and move to species that prefer wetter conditions
10% probability: o Unlikely to be significant
changes Other impacts
Risk of increased diseases and pests
Species-rich grassland may be resilient to change, but take a long time to recover
90% probability: o Increased temperatures
may enable pests to survive (with particular impacts for livestock)
Implications of climate change for people and the environment The table below looks in more detail at the implications of the impacts described above without any adaptation measures being used. The impacts are colour coded using the same key as above. 10% probability (90% chance that climate change will result in higher temperatures and increased precipitation)
Impacts without adaptation Implications
Flower rich dry meadows are maintained through the removal of biomass, through grazing or cutting. Reduced productivity could reduce costs, but could also reduce income derived from conservation grazing/cutting. Difficulty in maintaining wet fences also increases management costs in Summer. Increase in GHG emissions arising from peat mineralisation, but mitigated by low input farming and continuous vegetation cover.
Lowering of water table results in reduced biomass
Change in botanical communities within the grassland
Occasional wetter days in what are otherwise much drier conditions would result in increased run-off, increasing the frequency of localised inundation and reducing access to hay meadows
Restriction of opportunities for management of dry grassland could reduce the environmental quality of the meadows. This could reduce income derived from conservation grazing/cutting. Occasional inundation could affect the botanical communities, although hard-baked soils could result in more damage because of run-off rather than waterlogging
90% probability (10% chance that climate change will result in higher temperatures and increased precipitation) Increased temperatures in spring, summer and autumn could cause stress to livestock
Heat stress could be reduced by keeping livestock on cooler, damper fields during

Storyline for Dry Grassland of High Value for Wildlife
Page 78
the summer
Increased rainfall could increase biomass production…
Potential benefits for livestock farmers that could increase yields and/or reduce cutting/management costs
Reduces potential use of the land for grazing and hay production. This could have a significant effect on incomes for specialist conservation graziers, with losses of up to £20,000 summer finishing (for beef), some of which may be offset by agri-environment payments
Increased water tables could lead to a decline in species typical of semi-natural old hay meadows, potentially to replacement with species-poor swamp
…but too much of an increase, combined with increased risk of freshwater flooding (pluvial from more wetter days and fluvial as a result of increased rainfall, especially on extreme events) could result in waterlogging stress
…but creates new opportunities for important wetland habitats, including, depending on water table management, wet grassland of high wildlife value, or swamp / fen habitats. These would however take time to mature to support a full range of species. Overall, the biodiversity value of existing dry grassland habitats would likely decrease, unless change to wetter habitats were part of a landscape-scale floodplain restoration scheme.
Increased temperatures may enable pests to survive (with particular impacts for livestock)
Increases in pests and diseases could affect livestock mortality (including the risk of the need for culling if certain diseases are contracted). It could also increase veterinary costs, testing costs, etc.
Adaptation options and responses If climate change has significant implications (whether positive or negative) for people and the environment then communities may adapt and respond. This response will depend upon the socio-economic context prevalent at the time. The table below looks at the adaptation measures available under the four different socio-economic scenarios11. It also looks at whether or not these adaptation options are sufficient to alleviate adverse implications, or to make the most of opportunities associated with climate change for the use of land for Dry grassland with high value for wildlife. The table uses a series of symbols to illustrate the key impacts: Adaptation measures: Opportunities: £ more investment use of new technology/techniques
change in activity move to more profitable activity
increase in activity (intensification) move to funding for environmental improvements
decrease in activity (extensification) application of existing skills 0 no adaptation taken (or needed) development of new skills
11 A full description of the scenarios is given in Section 3 (and Annex 5).
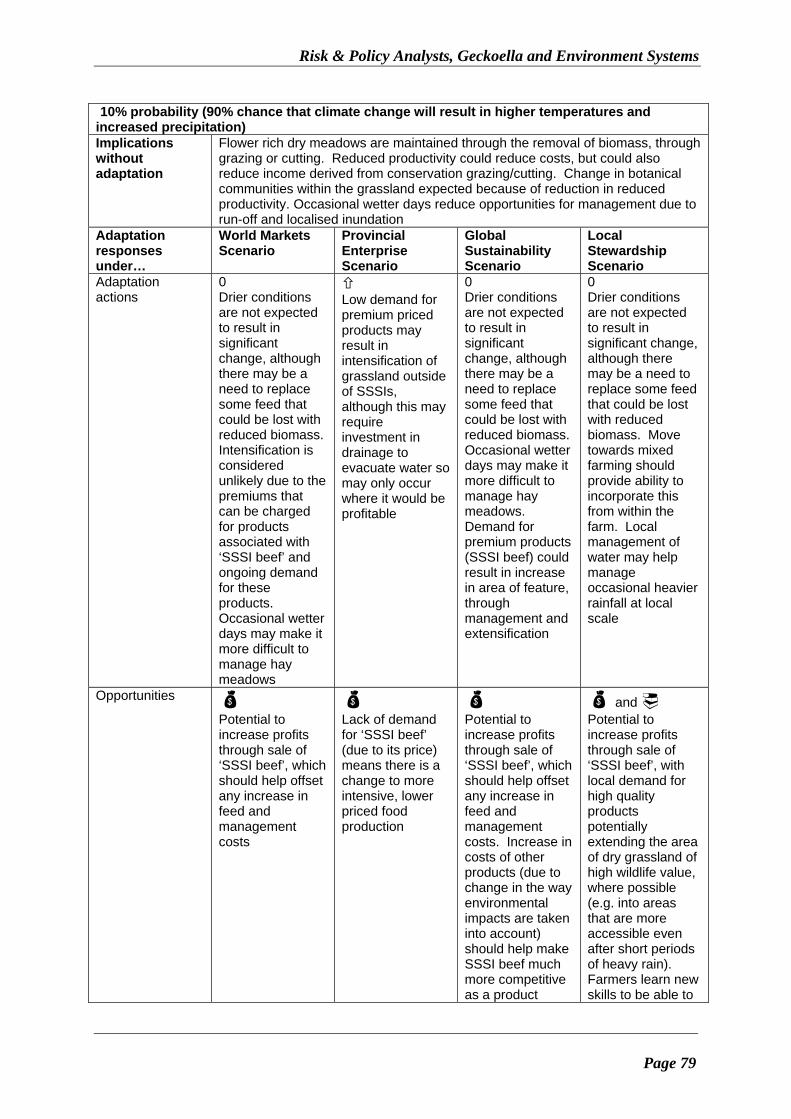
Risk & Policy Analysts, Geckoella and Environment Systems
Page 79
10% probability (90% chance that climate change will result in higher temperatures and increased precipitation) Implications without adaptation
Flower rich dry meadows are maintained through the removal of biomass, through grazing or cutting. Reduced productivity could reduce costs, but could also reduce income derived from conservation grazing/cutting. Change in botanical communities within the grassland expected because of reduction in reduced productivity. Occasional wetter days reduce opportunities for management due to run-off and localised inundation
Adaptation responses under…
World Markets Scenario
Provincial Enterprise Scenario
Global Sustainability Scenario
Local Stewardship Scenario
Adaptation actions
0 Drier conditions are not expected to result in significant change, although there may be a need to replace some feed that could be lost with reduced biomass. Intensification is considered unlikely due to the premiums that can be charged for products associated with ‘SSSI beef’ and ongoing demand for these products. Occasional wetter days may make it more difficult to manage hay meadows
Low demand for premium priced products may result in intensification of grassland outside of SSSIs, although this may require investment in drainage to evacuate water so may only occur where it would be profitable
0 Drier conditions are not expected to result in significant change, although there may be a need to replace some feed that could be lost with reduced biomass. Occasional wetter days may make it more difficult to manage hay meadows. Demand for premium products (SSSI beef) could result in increase in area of feature, through management and extensification
0 Drier conditions are not expected to result in significant change, although there may be a need to replace some feed that could be lost with reduced biomass. Move towards mixed farming should provide ability to incorporate this from within the farm. Local management of water may help manage occasional heavier rainfall at local scale
Opportunities Potential to increase profits through sale of ‘SSSI beef’, which should help offset any increase in feed and management costs
Lack of demand for ‘SSSI beef’ (due to its price) means there is a change to more intensive, lower priced food production
Potential to increase profits through sale of ‘SSSI beef’, which should help offset any increase in feed and management costs. Increase in costs of other products (due to change in the way environmental impacts are taken into account) should help make SSSI beef much more competitive as a product
and Potential to increase profits through sale of ‘SSSI beef’, with local demand for high quality products potentially extending the area of dry grassland of high wildlife value, where possible (e.g. into areas that are more accessible even after short periods of heavy rain). Farmers learn new skills to be able to

Storyline for Dry Grassland of High Value for Wildlife
Page 80
manage the grassland appropriately
After adaptation – changes in land use
Potential for expansion in area of feature due to increased demand for premium products. There may be occasional negative impacts (loss of yield, delays in mowing, drying of hay due to wetter autumn days)
Likely that grazing will continue, but inputs of fertiliser, etc. will be used to allow more livestock to be grazed on the same area of land. Occasional wetter days may mean livestock need to be moved or kept indoors for short periods
May be increase in management of land to support delivery of SSSI beef, with potential for significant national (and even international demand). This could lead to an increase in the area of dry grassland, especially if this will improve access and reduce the implications of occasional wetter days
May be increase in management of land to support delivery of SSSI beef, but may be limited due to local demand. Move to mixed farming should have little impact on hay meadows; occasional wetter days may require flexibility in timing of activities and could affect overall costs on the farm
After adaptation – environmental changes
MG5 grasslands continue to be supported by land use and unlikely to be significantly affected by drier conditions. Occasional wetter days in what are overall drier conditions are unlikely to have a significant effect. No significant change in terms of fragmentation
Loss of MG5 grasslands, replaced with species that prefer nutrient rich conditions. This will increase habitat fragmentation. Areas within SSSIs will be maintained where possible and where funded
MG5 grasslands continue to be supported by land use and unlikely to be significantly affected by drier conditions. May be an increase in the area under dry grassland, because of demand for SSSI beef. This could help reduce habitat fragmentation
MG5 grasslands continue to be supported by land use and unlikely to be significantly affected by drier conditions. Occasional wetter days may result in change in timing of activities, but overall area and quality of grassland is not predicted to change. May be small change in habitat fragmentation, but this will depend on local management of land
After adaptation – socio-economic changes
Increase in area likely to result in significant increase in jobs to manage feature
Intensification may create new jobs, but area affected (and hence numbers) will be small (<1 job)
Move to increased area of dry grassland of high value for wildlife could increase number of conservation/ management jobs
Maybe small increase in the number of jobs, with mixed farmers learning new skills to enable appropriate land management to continue
90% probability (10% chance that climate change will result in higher temperatures and increased precipitation) Implications without
Increased precipitation result in greater risk of freshwater flooding and/or waterlogging of soils so reduces potential use of the land for grazing and hay

Risk & Policy Analysts, Geckoella and Environment Systems
Page 81
adaptation production. This could have a significant effect on incomes for specialist conservation graziers, with losses of around £20,000 per year summer finishing (for beef), some of which may be offset by agri-environment payments. Increases in pests and diseases could affect livestock mortality and increase veterinary costs, testing costs, etc. Increased water tables could lead to a decline in species typical of semi-natural old hay meadows, potentially to replacement with species-poor swamp…but this creates new opportunities for important wetland habitats, including wet grassland of high wildlife value, or swamp / fen habitats. Overall, the biodiversity value of existing dry grassland habitats is likely to decrease, unless a change to wetter habitats was part of a landscape-scale floodplain restoration scheme.
Adaptation responses under…
World Markets Scenario
Provincial Enterprise Scenario
Global Sustainability Scenario
Local Stewardship Scenario
Adaptation actions
£ More investment in water management and drainage to help maintain land for livestock grazing/ hay production and biodiversity and to evacuate floodwaters/runoff more rapidly. Intensification is considered unlikely due to the premiums that can be charged for products associated with ‘SSSI beef’ and ongoing demand for these products, and the increased difficulty of drainage for more intensive grazing
Look for new approaches to farming in much wetter environment or focus effort onto smaller areas of land that are easier to drain (with those areas being drained and farmed more intensively)
Move to land uses that are more resistant to wetter conditions, with sustainable floodplain management to provide grazing areas where this is possible
£ and Wetter conditions need local investment in water management, but overall there is a reduction in dry grassland and move to wetter grasslands in line with the change in climatic conditions
Opportunities Use of agri-environment payments to help maintain management of land for biodiversity value (but may be move to wetter grasslands), where possible, selling products as organic to maximise profits, including use of increased
Application of existing skills to more intensively drain and farm land where it is most profitable to do so. Other areas would be abandoned so dry grassland areas would be lost (replaced by unmanaged floodplain)
Agri-environment payments used to help deliver environmental benefits, including opportunities to create high value wet grasslands and more sustainable use of the floodplain (with potential move to restoration of floodplain function)
Investigation into potential for new crops (e.g. watercress) or move to wet grassland as soils become increasingly waterlogged

Storyline for Dry Grassland of High Value for Wildlife
Page 82
biomass
After adaptation – changes in land use
Investment in water management maintains feature, and is part paid for through higher profits from increased biomass, organic produce and agri-environment payments. Potential to increase area in driest fields (previously dry grassland of low value), due to premiums that can be charged, but opportunities will be limited due to the overall wetter conditions
Increased drainage of land where least investment is required. Change to wet grassland or swamp/fen where it is not profitable to drain and farm, although some grazing may be able to continue on wet grassland
Change in land use in some areas to flood tolerant uses, others maintained where water table allows, change may also include areas previously under arable. Drier areas more likely to become of higher value due to sustainable land management
Change to crops, or grasses that grow better under increasingly waterlogged conditions. Reduction in livestock numbers, but on drier fields, the wildlife value is likely to increase
After adaptation – environmental changes
Change to wetter grassland communities and increasing fragmentation of dry grassland. There may be a short-term reduction in environmental quality due to time needed for wetter, high quality habitats to develop (although management of land may help)
Loss of dry grassland biodiversity, replacement with intensive farmland or wet grassland and swamp/fen (depending on water management), or scrub. This will significantly increase habitat fragmentation
Management of land maintained through agri-environment payments, but likely to be a change in species composition (away from species-rich dry grassland to wet grassland or swamp/fen conditions) as water table rises, and more natural flood plain functions develop. Loss of feature in some areas may be balanced by gains in drier parts of the Brue Valley arising from general extensification; overall areas maintained, but qualitative decline across much of the dry grassland area due to time needed for new habitats to
Reduction in grazing and increased waterlogging will change species composition (from MG5 grassland to wet grassland or swamp/fen conditions as it becomes more and more expensive to retain areas of dry grassland). This could affect all dry grassland and could result in increased habitat fragmentation for dry habitats, but reduce fragmentation for wetter habitats. Quality of dry grassland on drier fields is expected to increase or at least be maintained

Risk & Policy Analysts, Geckoella and Environment Systems
Page 83
become established
After adaptation – socio-economic changes
Increase in area of feature likely to result in increase in number of jobs
Likely to be reduction in jobs due to reduction in area that is farmed, but the small area affected means this is not significant
May be small loss of agricultural jobs, but these are likely to be replaced by land management jobs supported by agri-environment payments for move to new habitats
New skills will develop with use of new approaches to land management and potential move to wet grassland or swamp/fen communities
Summary of Changes in Land Use following Adaptation The table below shows the projected change in area of wet grassland of high value for wildlife, taking account of adaptation measures. The degree of uncertainty in the projected changes is highlighted using the following colour codings: projected change is based on data: projected change is based on the likely trend: projected change is estimated/derived from limited information: ; and projected change is not known (guesstimate):
Scenario World Markets
Scenario
Provincial Enterprise Scenario
Global Sustainability
Scenario
Local Stewardship
Scenario
Current area 58 ha 58 ha 58 ha 58 ha
Probability (where the change could range from that shown for the 10% and 90% probabilities)
Change due to: 10% 90% 10% 90% 10% 90% 10% 90%
Temperature 0 ha 0 ha 0 ha 0 ha 0 ha 0 ha 0 ha 0 ha
Precipitation (water table) and/or freshwater flooding
+450 ha
+380 ha
-35 ha -35 ha +2,500
ha +790
ha +740
ha +350
ha
It is important to remember that there is a 90% chance that the climate change effects will be greater than those described on the 10% probability, and that there is a 10% chance that the climate change effects will be lower than those described under the 90% probability.

Storyline for Dry Grassland of Low Value for Wildlife
Page 84
Dry grassland of low value for wildlife Current use (baseline) Dry grassland of low value for wildlife makes up 42% of the current land use covering 4,057 ha. The grassland is grazed by cattle and sheep, and is used to produce silage or hay as feed for livestock. Dry grassland of low value for wildlife is estimated to support around 271 farming FTE jobs (186 dairy and 86 cattle/sheep grazing) and provides annual income of around £4.7 million (based on 54% of the land being used for dairy cattle and 46% for beef/sheep farming). The current grassland regime receives lower water levels in winter (achieved by pumping) and higher water levels in summer (by impounding water in the major rivers and diverting it into rhynes). Impacts of climate change The graph below shows changes in temperature and precipitation changes under the high emissions scenario, by season.
0.0
0.5
1.0
1.5
2.0
2.5
3.0
3.5
4.0
4.5
5.0
5.5
0% 10% 20% 30% 40% 50% 60% 70% 80% 90% 100%
Probability (High Emissions)
Ch
an
ge
in T
emp
erat
ure
(°C
)
-50%
-40%
-30%
-20%
-10%
0%
10%
20%
30%
Ch
ang
e in
Pre
cip
itat
ion
(%
)
Precipitation: Spring
Precipitation: Summer
Precipitation: Autumn
Precipitation: Winter
Temperature Spring
Temperature: Summer
Temperature: Autumn
Temperature: Winter
Change in Temperature and Precipitation : High Emissions

Risk & Policy Analysts, Geckoella and Environment Systems
Page 85
The table below uses thresholds to identify the impacts on dry grassland of low value for wildlife under the high emissions scenario, based on how temperature, precipitation and flooding change with time at the 10% and 90% probability levels. The impacts are colour coded as follows: significant negative impacts: medium/unknown negative impacts: low/negligible impacts: medium/unknown positive impacts: ; and significant positive impacts: Change Thresholds Impacts without adaptation
Combination of change in temperature and precipitation could result in:
10% probability: o No impacts from change
in temperature
Change in temperature
Increased productivity / longer growing season
o Lowering of water table results in reduced biomass
90% probability: o Increased temperatures
in spring, summer and autumn could cause stress to livestock
o Increased rainfall could increase biomass production…
Change in rainfall
Increased run-off from high intensity rainfall
Community change due to summer droughts
Increased productivity (depending on water table management)
Increased precipitation would lead to grasslands becoming much less productive and move towards swamp and fen
o …but too much of an increase could result in waterlogging stress
Change in flood risk
Unpredictable inundation favours resilient colonisers / wetland grasses, leads to reduction in species diversity
Increased run-off from high intensity rainfall
10% probability: o Occasional wetter days
in what are otherwise much drier conditions would result in increased run-off, increasing the frequency of localised inundation
o Increased frequency of inundation could result in a change in species composition, and move towards wetter grassland type varieties

Storyline for Dry Grassland of Low Value for Wildlife
Page 86
90% probability: o Much wetter conditions,
and more frequent wetter days increases risk of pluvial and fluvial flooding
o Increased frequency of inundation could result in increased waterlogging and move to species that prefer wetter conditions
10% probability: o Unlikely to be significant
changes Other impacts
Risk of increased diseases and pests
90% probability: o Increased temperatures
may enable pests to survive (with particular impacts for livestock)
Implications of climate change for people and the environment The table below looks in more detail at the implications of the impacts described above without any adaptation measures being used. The impacts are colour coded using the same key as above. 10% probability (90% chance that climate change will result in higher temperatures and increased precipitation)
Impacts without adaptation Implications
Lowering of water table results in reduced biomass, increase in GHG emissions
Reduced productivity would also reduce the nutrient quality and biomass of the hay/silage and/or the value of the grazing (with the potential need for additional feed to be provided). If forage area needs to increase by 1/3, the gross margin lost would be £84/ha for summer beef finishing or £460/ha for dairy farming. Over the 4,057 ha of dry grassland, this could result in annual lost income of £160,000 (beef) and £1 million (dairy), a total of £1.2 million per year. This could result in the loss of 30 agricultural jobs. Increased peat mineralisation leading to increase in GHG emissions
Occasional wetter days in what are otherwise much drier conditions would result in increased run-off, increasing the frequency of localised inundation
Occasional short duration flooding could affect access to livestock, but impacts are likely to be limited due to localised nature of flooding and the short time over which it is expected to be experienced
Increased frequency of inundation could result in a change in species composition, and move towards wetter grassland type varieties
Occasional inundation could affect the botanical communities, although hard-baked soils could result in more damage because of run-off rather than waterlogging
90% probability (10% chance that climate change will result in higher temperatures and

Risk & Policy Analysts, Geckoella and Environment Systems
Page 87
increased precipitation)
Increased temperatures in spring, summer and autumn could cause stress to livestock
Heat stress could be reduced by keeping livestock on cooler, damper fields during the summer
Increased rainfall could increase biomass production…
Potential benefits for livestock farmers that could increase yields and/or reduce cutting/management costs
Reduces potential use of the land for grazing and hay production. This could have a significant effect on incomes for farmers with losses of up to £336/ha summer finishing (for beef) or £1,849/ha for dairy cows. This is equivalent to annual lost income of £4.1 million (dairy) and £630,000 (beef), a total of £4.7 million per year. This could result in the loss of the 271 FTE jobs directly supported by agriculture, plus a further 20 FTEs from knock-on effects12.
Increased water tables / flooding could lead to a decline in species typical of the dry grassland habitats, potentially to replacement with species-poor swamp...
…but too much of an increase, combined with increased risk of freshwater flooding (pluvial from more wetter days and fluvial as a result of increased rainfall, especially on extreme events) could result in waterlogging stress
....but creates new opportunities for important wetland habitats, including, depending on water table management, wet grassland of high wildlife value, or swamp / fen habitats. These would however take time to mature to support a full range of species. Overall, the biodiversity value of existing dry grassland habitats would likely decrease, unless change to wetter habitats were part of a landscape-scale floodplain restoration scheme.
Increased temperatures may enable pests to survive (with particular impacts for livestock)
Increases in pests and diseases could affect livestock mortality (including the risk of the need for culling if certain diseases are contracted). It could also increase veterinary costs, testing costs, etc.
Adaptation options and responses If climate change has significant implications (whether positive or negative) for people and the environment then communities may adapt and respond. This response will depend upon the socio-economic context prevalent at the time. The table below looks at the adaptations available under each of four different socio-economic scenarios13. It also looks at whether or not these adaptation options are sufficient to alleviate adverse implications, or to make the most of opportunities associated with climate change for the use of the land for dry grassland of low value for wildlife. The table uses a series of symbols to illustrate the key impacts:
12 Based on all agricultural jobs being lost due a reduction in income of £4.1 million, with knock-
on jobs lost estimated using Econ-i. 13 A full description of the scenarios is given in Section 3 (and Annex 5).

Storyline for Dry Grassland of Low Value for Wildlife
Page 88
Adaptation measures: Opportunities: £ more investment use of new technology/techniques
change in activity move to more profitable activity
increase in activity (intensification) move to funding for environmental improvements
decrease in activity (extensification) application of existing skills 0 no adaptation taken (or needed) development of new skills
10% probability (90% chance that climate change will result in higher temperatures and increased precipitation) Implications without adaptation
Reduced productivity would also reduce the nutrient quality and biomass of the hay/silage and/or the value of the grazing (with the potential need for additional feed to be provided). If forage area needs to increase by 1/3, the gross margin lost would be £84/ha for summer beef finishing or £460/ha for dairy farming. Over the 4,057 ha of dry grassland, this could result in annual lost income of £160,000 (beef) and £1 million (dairy), a total of £1.2 million per year. This could result in the loss of 30 agricultural FTE jobs
Adaptation responses under…
World Markets Scenario
Provincial Enterprise Scenario
Global Sustainability Scenario
Local Stewardship Scenario
Adaptation actions
0 to Drier conditions are not expected to result in significant change, although there may be a need to replace some feed that could be lost with reduced biomass, or intensification. Increased risk of localised flooding could increase management costs and/or lead to in localised loss of hay/silage/ biodiversity. Move to increase profits may encourage move to premium products, supporting more SSSI beef and/or cultivation of grassland
Intensification to take advantage of opportunities offered by drier conditions, including cultivation of grassland. Occasional wetter days may result in some losses due to increased runoff (and potential damage), but this is expected to be limited
0 Drier conditions are not expected to result in significant change, although there may be a need to replace some feed that could be lost with reduced biomass. Increased risk of localised flooding could increase management costs and/or result in localised loss of hay/silage/ biodiversity. Potential to move to more sustainable, premium grazing land
0 Drier conditions are not expected to result in significant change, although there may be a need to replace some feed that could be lost with reduced biomass. Move towards mixed farming should provide ability to incorporate this from within the farm, with potential to target management of land based on any change in local (short-term) flood risk
Opportunities Drier conditions allow farmers to move to more intensive farming
Drier conditions allow farmers to move to more intensive farming
and Drier conditions offer opportunities to use agri-environment
Move to mixed farming with increased opportunities to

Risk & Policy Analysts, Geckoella and Environment Systems
Page 89
to increase yields. Occasional wetter days likely to be manageable but may result in higher costs following heavy rainfall events. May be opportunities for some areas to be converted to wildlife-rich grassland (dry or wet, depending on water management) to improve green credentials of farms and/or move towards production of premium beef
to increase yields, this may include increased use of fertiliser to address reductions in biomass. Some areas may be better suited to arable use. Occasional wetter days and resulting runoff may affect the suitability of areas that could be converted to arable crops
payments to deliver more species-rich grassland and wetland habitats at the landscape scale, with potential premiums for beef raised in this way (similar to SSSI beef). As a result, land use could be managed to reduce runoff from more intense rainfall
rotate land and use it for a variety of different land uses. This may increase biodiversity. It may also mean that intense rainfall events are managed more sustainably, e.g. with water being retained on site where possible
After adaptation – changes in land use
Change to more intensive / specialist use, although this may still be based on grazing, with potential to improve wildlife value to produce more premium (SSSI beef) products
Likely that grazing will continue over some land, with intensification of livestock and move to more cropping (although this may be limited by water stress)
May be increase in management of land to support delivery of premium beef, with potential for significant national (and even international demand)
May be change to how land is used (more mixed farming to meet local demands) but likely to tend towards organic, high quality produce
After adaptation – environmental changes
Unlikely to be significant change in biodiversity, most of the area is likely to remain species-poor. Around 10% may be converted to species-rich grasslands where there are opportunities to increase profits (e.g. SSSI beef/ organic products) giving some environmental benefits overall. This could help reduce habitat fragmentation
Biodiversity likely to remain species-poor but there could be some reduction in species with conversion to arable land and intensification. As a result, habitat fragmentation may increase, including increased isolation of designated areas. Abandonment of wetter areas could benefit biodiversity, but lack of management may reduce the potential benefits
Potential increase in biodiversity value if there is sufficient demand for premium beef and a move to wildlife-rich features. This could reduce habitat fragmentation, but time would be required before the higher quality habitats are fully established. The extent to which these changes can occur will depend on demand for premium beef and/or agri-environment
Grasslands and extensive farming provide opportunity for increase in biodiversity through a mosaic of habitats. This also enables more infrequent but heavier rainfall to be better utilised around the farm. The move to a mosaic of habitats may change habitat fragmentation. The direction of change will depend on whether there are more smaller areas of habitat and/or the level of connectivity

Storyline for Dry Grassland of Low Value for Wildlife
Page 90
payments, together with landscape-scale wetland management to cope with the rainfall arriving in more intense rainstorms
between the habitats
After adaptation – socio-economic changes
Change in area may reduce number of agricultural jobs associated with this feature, but these should be replaced by jobs associated with other features
Intensification may create new jobs, although this may be spread over other features (e.g. cereal crops)
Move to increase areas with high value for wildlife could increase number of conservation/ management jobs, to compensate for agricultural losses
Mixed farmers learning new skills to enable appropriate land management to continue. Potential reduction in number of jobs associated with this feature due to decrease in area, but these will be replaced by jobs in land management/ conservation on other features
90% probability (10% chance that climate change will result in higher temperatures and increased precipitation) Implications without adaptation
Reduces potential use of the land for grazing and hay production with losses of up £4.7 million per year. This could result in the loss of the 271 jobs directly supported by agriculture, plus a further 20 from knock-on effects14. Increases in pests and diseases could affect livestock mortality and increase veterinary costs. Increased water tables could lead to a decline in species typical of dry grassland habitats, potentially to replacement with species-poor swamp…but creates new opportunities for important wetland habitats, including wet grassland, or swamp / fen. These would however take time to mature to support a full range of species. Overall, the biodiversity value of existing dry grassland habitats could increase.
Adaptation responses under…
World Markets Scenario
Provincial Enterprise Scenario
Global Sustainability Scenario
Local Stewardship Scenario
Adaptation actions
£ More investment in water management and drainage to help maintain land for livestock grazing/ hay production and biodiversity and to evacuate floodwaters/runoff more rapidly, although may be move to wetter grasslands
Look for new approaches to farming in much wetter environment or focus of effort onto smaller areas of land that are easier to drain (with those areas being drained and farmed more intensively, including with more flood
Move to land uses that are more resistant to wetter conditions, with sustainable floodplain management to provide ‘wet’ grazing areas where this is possible
£ and Wetter conditions need local investment in water management, but overall there is a reduction in dry grassland and move to wetter grasslands in line with the change in level of rainfall
14 Based on all agricultural jobs being lost due a reduction in income of £4.7 million, with knock-
on jobs lost estimated using Econ-i.

Risk & Policy Analysts, Geckoella and Environment Systems
Page 91
resilient crops)
Opportunities Use of agri-environment payments to help increase management of land for biodiversity value (but may be move to wetter grasslands), where possible, selling products as organic to maximise profits
Application of existing skills to more intensively drain and farm land where it is most profitable to do so. Other areas would be abandoned so dry grassland areas would be lost (replaced by unmanaged floodplain)
Agri-environment payments used to help deliver environmental benefits, including opportunities to create high value wet grasslands (or move to naturally functioning wetland) and more sustainable use of the floodplain (with potential move to restoration of floodplain function)
Investigation into potential for new crops (e.g. watercress) or move to wet grassland as soils become increasingly waterlogged
After adaptation – changes in land use
Investment in water management maintains grazing but likely to be on wetter soils, and is part paid for through higher profits from increased biomass, organic produce and potential for agri-environment payments. Lower-input farming.
Increased drainage of land where the least investment is required. Change to wet grassland or swamp/fen where it is not profitable to drain and farm, although some grazing may be able to continue on wet grassland, wetter land will be abandoned
Change in land use in some areas to flood tolerant uses (e.g. withy growing), grazing maintained where water table allows but may be on wetter grassland, change may also include areas previously under arable
Change to crops and grasses that grow better under increasingly waterlogged conditions. This could include withy growing. Reduction in livestock numbers, but may be able to move to delivery of premium products (dependent on local demand)
After adaptation – environmental changes
Change to grassland communities, to much wetter varieties over almost the whole area. Increase in biodiversity and other environmental benefits. Increasing area of wetter grassland communities could help reduce habitat fragmentation, but time will be needed before the wet grassland
Loss of dry grassland biodiversity, replacement with intensive farmland or wet grassland and swamp/fen (depending on water management), or scrub. This is likely to increase habitat fragmentation, although there could be greater connectivity between wetter habitats where this is
Management of land maintained through agri-environment payments, but likely to be a change in species composition (to wet grassland or swamp/fen conditions) as water table rises, and more natural floodplain functions develop. Loss of feature is outweighed by gains from general extensification
Reduction in grazing and increased waterlogging will change species composition (to wet grassland or swamp/fen conditions as it becomes more and more expensive to retain areas of dry grassland). This will affect all dry grassland. Fragmentation of dry grassland habitats will increase, but

Storyline for Dry Grassland of Low Value for Wildlife
Page 92
communities are fully established
concentrated in lower areas. Lack of management may limit benefits in abandoned areas
and increased habitat connectivity through more structured floodplain management
wetter habitats will be better connected
After adaptation – socio-economic changes
Significant reduction in area will significantly reduce jobs associated with this feature, but these should be replaced (by gains related to other features)
Likely to be reduction in jobs due to reduction in area that is farmed, with a reduction in jobs and income (but these impacts may be reduced by gains on other features)
May be small loss of agricultural jobs, but these may be replaced by land management jobs supported by agri-environment payments for move to new habitats
New skills will develop with use of new approaches to land management and potential move to wet grassland or swamp/fen communities. May be some job losses due to reduction in area of feature
Summary of Changes in Land Use following Adaptation The table below shows the projected change in area of dry grassland of low value for wildlife, taking account of adaptation measures. The degree of uncertainty in the projected changes is highlighted using the following colour codings: projected change is based on data: projected change is based on the likely trend: projected change is estimated/derived from limited information: ; and projected change is not known (guesstimate):
Scenario World Markets
Scenario
Provincial Enterprise Scenario
Global Sustainability
Scenario
Local Stewardship
Scenario
Current area 4,057 ha 4,057 ha 4,057 ha 4,057 ha
Probability (where the change could range from that shown for the 10% and 90% probabilities)
Change due to: 10% 90% 10% 90% 10% 90% 10% 90%
Temperature 0 ha 0 ha 0 ha 0 ha 0 ha 0 ha 0 ha 0 ha
Precipitation (water table) and/or freshwater flooding
-2,200 ha
-3,700 ha
-1,600 ha
-3,400 ha
-2,200 ha
-3,700 ha
-1,000 ha
-3,100 ha
It is important to remember that there is a 90% chance that the climate change effects will be greater than those described on the 10% probability, and that there is a 10% chance that the climate change effects will be lower than those described under the 90% probability.

Risk & Policy Analysts, Geckoella and Environment Systems
Page 93
Lakes and Ponds Current use (baseline) Lakes/ponds make up 4% of the current land use covering 347 ha and are important for water flow and quality management, recreation (angling). In the Brue Valley, this feature generally represents a successional habitat following peat extraction, eventually silting up to reedbed and wet woodland. It is also important for biodiversity, comprising key features in several SSSIs including Westhay Moor and Shapwick Heath. This feature is of international importance, because it helps to support over-wintering waterfowl such as Wigeon Anas penelope and Pochard Aythya ferina. It also supports UK BAP mammals such as otters and water voles. There are some local water quality issues relating to diffuse and point source pollution. Impacts of climate change The graph below shows changes in temperature and precipitation under the high emissions scenario, by season.
0.0
0.5
1.0
1.5
2.0
2.5
3.0
3.5
4.0
4.5
5.0
5.5
0% 10% 20% 30% 40% 50% 60% 70% 80% 90% 100%
Probability (High Emissions)
Ch
an
ge
in T
emp
era
ture
(°C
)
-50%
-40%
-30%
-20%
-10%
0%
10%
20%
30%
Ch
ang
e in
Pre
cip
itat
ion
(%
)
Precipitation: Spring
Precipitation: Summer
Precipitation: Autumn
Precipitation: Winter
Temperature Spring
Temperature: Summer
Temperature: Autumn
Temperature: Winter
Change in Temperature and Precipitation : High Emissions

Storyline for Lakes and Ponds
Page 94
The table below uses thresholds to identify the impacts on lakes and ponds under the high emissions scenario, based on how temperature, precipitation and flooding changes with time at the 10% and 90% probability levels. The impacts are colour coded as follows: significant negative impacts: medium/unknown negative impacts: low/negligible impacts: medium/unknown positive impacts: ; and significant positive impacts: Change Thresholds Impacts without adaptation
Combination of change in temperature and precipitation could result in:
10% probability: o Higher temperatures
likely to reduce dissolved oxygen levels as well as affect flora and fauna in spring and summer. Could also result in increase in methane production
Change in temperature
Higher temperatures could affect levels of dissolved oxygen, flora and fauna (but deeper water buffers effects). At 10% probability, temperature increase is reasonably low thus impacts are only likely in spring and summer. At 90% probability, impacts are likely all year round (but lessened by increased rainfall, and deep water). o Decreased precipitation
affects water table with minor impacts for ponds and lakes in winter and spring, but major impacts in summer and autumn
90% probability: o Effects of higher
temperature on oxygen levels and flora and fauna (lessened by increase in rainfall, especially for deepwater habitats). Could also result in increase in methane production
Change in rainfall
Less precipitation has minor impacts for ponds and lakes in winter and spring (they are sensitive to cumulative water table impacts), but in summer and autumn impacts are greater with conditions being too dry for 1 year in 4 or 5. Some open water lost to swamp and reedbed as water table drops but Deeper water buffers effects. Wetter conditions (leading to a higher water table) support ponds and lakes.
o Wetter conditions help ponds and lakes retain their water levels
Change in flood risk
Freshwater flooding caused by increased runoff could bring high levels of contaminants into lakes and ponds
Spikes in contaminants and
sudden changes in water quality could affect the biodiversity value of the lakes and ponds, especially where this affects dissolved oxygen levels

Risk & Policy Analysts, Geckoella and Environment Systems
Page 95
Other impacts
Increased vegetation growth rate aids colonisation by aquatic invasives
o Increased temperature leads to decreased biodiversity and choked waterways from growth of aquatic invasives such as Parrot feather Myriophyllum aquaticum
Implications of climate change for people and the environment The table below looks in more detail at the implications of the impacts described above without any adaptation measures being used. The impacts are colour coded using the same key as above. 10% probability (90% chance that climate change will result in higher temperatures and increased precipitation)
Impacts without adaptation Implications
Higher temperatures likely to decrease dissolved oxygen levels as well as affecting flora and fauna in spring and summer
Change in flora and fauna: some species may be outcompeted as conditions become warmer, lower dissolved oxygen levels may favour generalists over specialists, leading to decrease in biodiversity. But deep water can help to buffer changes
Decreased precipitation affects water table with minor impacts for ponds and lakes in winter and spring, but major impacts in summer and autumn
Aquatic populations decrease due to low water levels. Very dry conditions may affect shallower water bodies, with possible change to reedbed habitats
Occasional wetter days could result in higher runoff and greater movement of contaminants from the land into lakes and ponds
Effects on flora and fauna due to raised pollutant levels and reduction in dissolved oxygen. Such changes will affect the more sensitive species and may decrease the biodiversity value. The impacts are likely to be greater where water levels are reduced and in shallower lakes/ponds
90% probability (10% chance that climate change will result in higher temperatures and increased precipitation)
Higher temperatures likely to reduce dissolved oxygen levels and affect flora and fauna all year round
Lower dissolved oxygen levels affect the suitability of the feature as a habitat, limiting population levels and general biodiversity, but mitigated by increased water table levels and flow arising from increased precipitation
Wetter conditions help ponds and lakes retain their water levels
Water levels in ponds and lakes are retained, helping to maintain the habitat and its associated biodiversity
Occasional wetter days could result in higher runoff and greater movement of contaminants from the land into lakes and ponds
Effects on flora and fauna due to raised pollutant levels and reduction in dissolved oxygen. Such changes will affect the more sensitive species and may decrease the biodiversity value. The impacts may be reduced due to overall wetter conditions (compared with the 10% probability)

Storyline for Lakes and Ponds
Page 96
Adaptation options and responses If climate change has significant implications (whether positive or negative) for people and the environment then communities may adapt and respond. This response will depend upon the socio-economic context prevalent at the time. The table below looks at the adaptation measures available under each of four different socio-economic scenarios15. It also looks at whether or not these adaptation options are sufficient to alleviate adverse implications, or to make the most of opportunities associated with climate change for the use of the land for pond/lake. The table uses a series of symbols to illustrate the key impacts: Adaptation measures: Opportunities: £ more investment use of new technology/techniques
change in activity move to more profitable activity
increase in activity (intensification) move to funding for environmental improvements
decrease in activity (extensification) application of existing skills 0 no adaptation taken (or needed) development of new skills
10% probability (90% chance that climate change will result in higher temperatures and increased precipitation) Implications without adaptation
Change in flora and fauna anticipated since some species may be outcompeted as conditions become warmer. Also, lower dissolved oxygen levels (due to lower water levels, warmer conditions and increased level of contaminants due to runoff) may favour generalists over specialists. Both these factors can decrease biodiversity. Very dry conditions may affect shallower water bodies in particular, with possible change to reedbed habitats. But deep water can help to buffer changes.
Adaptation responses under…
World Markets Scenario
Provincial Enterprise Scenario
Global Sustainability Scenario
Local Stewardship Scenario
Adaptation actions
£ Water levels are managed to retain ponds and lakes which have high species diversity. Other ponds and lakes are allowed to adapt to the prevailing conditions, possibly even changing to swamp and fen. Occasional increase in pollutant levels may affect species diversity
0 Passive increase arising from peat extraction through creation of new lakes and ponds. Balanced by local losses as water table drops and due to increased levels of pollutant from runoff across land, especially where there has been intensification
£ Investment in management to maintain variety of pond and lake species despite warmer and drier conditions. Influx of pollutants due to runoff may be managed by more sustainable land use around lakes/ponds
£ High priority placed on maintaining some ponds and lakes for their biodiversity and also their recreation, and local water quality / flow management potential. Influx of pollutants will be reduced due to creation of new lakes/ponds intended to capture water for use on the farm (through careful
15 A full description of the scenarios is given in Section 3 (Annex 5).

Risk & Policy Analysts, Geckoella and Environment Systems
Page 97
siting of ponds and management of land around them)
Opportunities Agri-environment funding is used to manage remaining ponds and lakes to ensure biodiversity is retained
Current management skills are used to retain deep lakes and ponds for angling / flood management / wildfowling purposes where this brings income to the area
Funding for environmental improvements is used to ensure that deeper lakes and ponds are managed to maintain their resilience to drier conditions
Drier conditions allow more ponds and lakes to be opened up to visitor access, helping to generate income to help support conservation activities. New ponds created to capture runoff on heavier rainfall days
After adaptation – changes in land use
Some loss of ponds and lakes to other wetland habitats e.g. swamp and fen, and reedbeds due to reduction in management in some areas. Restoration of old peat workings creates new lakes and ponds
Some loss of ponds and lakes to other wetland habitats e.g. swamp and fen and reedbeds due to lack of management (other than on angling lakes). No restoration of old peat workings, unless there are opportunities for new angling businesses
Potential for some loss of ponds and lakes especially where it is not sustainable to retain habitat in the long term, with these converted to swamp/fen and reedbed. Overall increase in ‘fringe’ habitat of shallow water. Restoration of old peat workings creates new lakes and ponds
Potential loss of some habitat quality due to greater disturbance, but new ponds are dug to intercept and retain rainfall for use around the farm. Restoration of old peat workings creates new lakes and ponds
After adaptation – environmental changes
No overall loss of biodiversity since some ponds and lakes retained. However, decrease in population numbers for some aquatic species in the Brue Valley, and possible reduction in biodiversity due to occasional influx of pollutants. May be some increase in habitat fragmentation
Loss of aquatic biodiversity likely since minimal management for wildlife is undertaken. Loss of biodiversity quality due to runoff on heavier rainfall days carrying with it pollutants from intensified agricultural use on surrounding land. Increase in habitat fragmentation due to loss of ponds and lakes.
Overall biodiversity is not lost since efforts are made to ensure that species rich ponds and lakes are retained despite the drier conditions. Risk of pollutants entering ponds and lakes is also managed to protect the highest quality areas. Landscape-scale approach to management reduces fragmentation
Overall biodiversity retained due to conservation efforts. New ponds/lakes may offer opportunities for some increase in biodiversity quality, especially where the network of lakes and ponds is less fragmented

Storyline for Lakes and Ponds
Page 98
After adaptation – socio-economic changes
Land management jobs change (due to changing habitats present) but are not lost
Some conservation/land management jobs may be replaced by angling / wildfowling jobs, but there could be a small decrease in total number of jobs supported by this feature
Work for NGOs and conservation organisations in wetland management increases given the drier conditions. Funds might be available from agri-environment schemes and large corporations wishing to show their green credentials
A small number of new jobs may be created associated with recreation and tourism due to greater access
90% probability (10% chance that climate change will result in higher temperatures and increased precipitation) Implications without adaptation
Lower dissolved oxygen levels affect the suitability of the feature as a habitat, limiting population levels and general biodiversity, but mitigated by increased water table levels and flow arising from increased precipitation. Increased risk of runoff due to more waterlogged soils and heavier rainfall events means more pollutants could be washed into lakes and ponds. Water levels in ponds and lakes are retained, helping to maintain the habitat and its associated biodiversity, but occasional spikes of pollutants could reduce biodiversity, especially where it affects dissolved oxygen levels
Adaptation responses under…
World Markets Scenario
Provincial Enterprise Scenario
Global Sustainability Scenario
Local Stewardship Scenario
Adaptation actions
0 No adaptation actions likely – wetter conditions help support feature despite warmer temperatures
0 Localised increase for flood management to protect settlements / intensive agriculture as water table rises
Careful management of land around lakes and ponds to minimise risk from pollutants in runoff
Careful management of land around lakes and ponds to minimise risk from pollutants in runoff
Opportunities Current management practices used to retain biodiversity (although some decreases may occur due to increased runoff and associated pollutants)
Current management continues where this brings in income, for example, if ponds are stocked for fishing. Increase in time following peat extraction, and to manage water table. Increases in runoff and pollutants could affect water quality
Current management practices used to retain biodiversity, perhaps supported by agri-environment schemes. Location of water bodies may change as part of landscape-scale floodplain management scheme and to minimise risk of pollutant levels increasing
Wetter conditions provide the opportunity to increase habitat connectivity by allowing ponds and lakes to expand and merge. Careful land management (rotation and extensification) should also help reduce pollutant levels in runoff
After adaptation – Little change in Little change in No overall change Potential increase

Risk & Policy Analysts, Geckoella and Environment Systems
Page 99
changes in land use
land use due to increased precipitation supporting ponds and lakes despite greater evaporation. Restoration of old peat workings creates new lakes/ponds
land use since wetter conditions retain ponds and lakes despite higher temperatures. Lakes/ponds develop in old peat workings (due to wetter conditions) but are not managed
in land use expected. Restoration of old peat workings creates new lakes/ponds
in open water area. Restoration of old peat workings creates new lakes/ponds
After adaptation – environmental changes
May be small decline in water quality due to pollutants washed into lakes/ponds after heavy rainfall events. No significant impact in terms of habitat fragmentation
Potential for some loss of biodiversity if ponds and lakes are not managed for wildlife, also due to higher pollutant levels washed into lakes and ponds from runoff from land surrounding lakes and ponds that is more intensively farmed
Biodiversity in ponds and lakes is retained and enhanced. No change in habitat fragmentation
Potential for aquatic biodiversity to increase as pond and lake habitat expands, increasing connectivity; potential effects on birds from recreational disturbance
After adaptation – socio-economic changes
Restoration and management of lakes/ponds may provide opportunities for new conservation jobs (but this is likely to be limited)
No significant changes anticipated since amount of habitat is expected to stay fairly constant (there could be an increase in area of lakes/ponds if there is increased peat extraction)
Restoration and management of lakes/ponds may provide opportunities for new conservation jobs (but this is likely to be limited)
Potentially more jobs in pond and lake management, but these may replace employment previously dependent on drier habitats
Summary of Changes in Land Use following Adaptation The table below shows the projected change in area of dry grassland of low value for wildlife, taking account of adaptation measures. The degree of uncertainty in the projected changes is highlighted using the following colour codings: projected change is based on data: projected change is based on the likely trend: projected change is estimated/derived from limited information: ; and projected change is not known (guesstimate):

Storyline for Lakes and Ponds
Page 100
Scenario World Markets
Scenario
Provincial Enterprise Scenario
Global Sustainability
Scenario
Local Stewardship
Scenario
Current area 347 ha 347 ha 347 ha 347 ha
Probability (where the change could range from that shown for the 10% and 90% probabilities)
Change due to: 10% 90% 10% 90% 10% 90% 10% 90%
Temperature 0 ha 0 ha 0 ha 0 ha 0 ha 0 ha 0 ha 0 ha
Precipitation (water table) and/or freshwater flooding
+20 ha +120
ha -120 ha -10 ha +20 ha
+180 ha
+140 ha
+120 ha
It is important to remember that there is a 90% chance that the climate change effects will be greater than those described on the 10% probability, and that there is a 10% chance that the climate change effects will be lower than those described under the 90% probability.

Risk & Policy Analysts, Geckoella and Environment Systems
Page 101
Orchards and Horticulture Current use (baseline) Orchards and horticulture make up 0.4% of the current land use covering 39 ha. Crops include vegetables and salad, top fruit, small fruit, nursery stock and bulbs and flowers. Willow harvesting has a considerable economic and cultural association with the area. Withy production covers around 80ha of the Moors. Willow is used for basketry, traditional furniture, cricket bats, artists’ charcoal and chair seating. It is estimated that around 31 FTE jobs are associated with orchards and horticulture16, (out of a total of around 540 FTEs for agriculture in the area), and that gross income from orchards and horticulture is £480,000 per annum17. Impacts of climate change The graph below shows changes in temperature and precipitation under the high emissions scenario, by season.
The table below uses thresholds to identify the impacts on cereal crops under the high emissions scenario, based on how temperature, precipitation and flooding change with time at the 10% and 90% probability levels. The impacts are colour coded as follows: significant negative impacts:
16 Based on Annual Labour Units from Defra Farm Accounts for 2009/10. 17 Based on data on output from horticulture from Defra Farm Accounts for 2009/10.
0.0
0.5
1.0
1.5
2.0
2.5
3.0
3.5
4.0
4.5
5.0
5.5
0% 10% 20% 30% 40% 50% 60% 70% 80% 90% 100%
Probability (High Emissions)
Ch
ang
e in
Tem
per
atu
re (
°C)
-50%
-40%
-30%
-20%
-10%
0%
10%
20%
30%
Ch
ang
e in
Pre
cip
itat
ion
(%
)
Precipitation: Spring
Precipitation: Summer
Precipitation: Autumn
Precipitation: Winter
Temperature Spring
Temperature: Summer
Temperature: Autumn
Temperature: Winter
Change in Temperature and Precipitation : High Emissions

Storyline for Orchards and Horticulture
Page 102
medium/unknown negative impacts: low/negligible impacts: medium/unknown positive impacts: ; and significant positive impacts: Change Thresholds Impacts without adaptation
Combination of change in temperature and precipitation could result in: 10% probability:
o Possible small reduction in yields of around 3% due to drier conditions
Change in temperature
High summer temperatures will have a negative impact on yield and quality for many horticultural crops (particularly where high T° occurs around flowering and seed development stages) e.g. high summer temperatures can affect flower bud formation in apples, with impacts seen the following year
High winter temperatures are a problem for crops that have an overwintering stage (particularly when combined with late frosts)
High winter temperatures can lead to early bud break and frost susceptibility in apples
o May be larger impact in terms of crop quality and difficulty of achieving uniform quality and size
90% probability: o No impact on yields as
wetter conditions provide sufficient water for crops
o Wetter conditions could increase growing and harvesting costs
Change in rainfall
Increased run-off from high intensity rainfall
Autumn cultivations may be affected by wetter winters and autumns
Low water availability will have an adverse effect on yield and quality of many crops
Extreme events (drought) can cause major problems in terms of supply and quality for many crops
o Higher temperatures could affect yield and quality of some crops
Change in flood risk
Increase in frequency of short duration flooding and/or runoff following heavy rainfall events
Freshwater flooding: Occasional inundation could
damage crops and significantly affect income. Short-term effect on orchards should be minimal
10% probability: o Change to drier and
slightly warmer conditions unlikely to significantly change pests and diseases
Other impacts
Risk of increased diseases and pests
90% probability: o Warmer and wetter
conditions may favour some pests and diseases
Implications of climate change for people and the environment The table below looks in more detail at the implications of the impacts described above without any adaptation measures being used. The impacts are colour coded using the same key as above.

Risk & Policy Analysts, Geckoella and Environment Systems
Page 103
10% probability (90% chance that climate change will result in higher temperatures and increased precipitation)
Impacts without adaptation Implications
Possible small reduction in yields of around 3% due to drier conditions
Loss of farm income of around £190 per ha per year, or £7,300 over the 39 ha of land currently used for orchards and horticulture. This would have a minimal effect on jobs. Potential benefits for withy production
May be larger impact in terms of crop quality and difficulty of achieving uniform quality and size
Loss of quality and/or uniform size may affect the value of the crop and, hence, ability to sell the crop. If this effect is repeated year-on-year it could affect jobs and income
Change to drier and slightly warmer conditions unlikely to significantly change pests and diseases
May be a small increase in costs of pesticides and treatment of crops
Occasional short-term periods of heavy rainfall could cause runoff that could damage horticultural crops. Impacts on orchards likely to be minimal
Loss of farm income [but this depends on a lot of factors such as increased frequency of heavy rainfall, whether runoff damages crops, etc. so is highly uncertain]
90% probability (10% chance that climate change will result in higher temperatures and increased precipitation)
Loss of profits with potential impacts on future investment, but likely to be small. Potential benefits for withy production
Wetter conditions could increase growing and harvesting costs
Potential environmental benefits arise from change to low input / low emissions / high biodiversity land use that conserves peat soils and aids flood management
Higher temperatures could affect yield and quality of some crops
Will depend on crop types, but could affect viability of some fruit (e.g. apples)
Warmer and wetter conditions may favour some pests and diseases
May result in an increase in costs of pesticides and treatment of crops and/or could affect viability of some crops (particularly established orchards). Potential need for money to be spent on chemicals and other pest control methods if required to protect withys.
Increased risk of short duration flooding could damage horticultural crops. Impacts on orchards likely to be minimal (although timing of runoff/flood events could delay opportunities to harvest the crops)
Loss of farm income, but this is difficult to estimate due to the number of factors involved and the high level of uncertainty
Adaptation options and responses If climate change has significant implications (whether positive or negative) for people and the environment then communities may adapt and respond. This response will depend upon the socio-economic context prevalent at the time. The table below looks at the adaptation measures available under each of the four different socio-economic scenarios18. It also looks at whether or not these adaptation options are sufficient to alleviate adverse implications, or to make the most of opportunities associated with climate change for the use of the land for
18 A full description of the scenarios is given in Section 3 (and Annex 5).

Storyline for Orchards and Horticulture
Page 104
orchards and horticulture. The table uses a series of symbols to illustrate the key impacts: Adaptation measures: Opportunities: £ more investment use of new technology/techniques
change in activity move to more profitable activity
increase in activity (intensification) move to funding for environmental improvements
decrease in activity (extensification) application of existing skills 0 no adaptation taken (or needed) development of new skills
10% probability (90% chance that climate change will result in higher temperatures and increased precipitation) Implications without adaptation
Loss of farm income due to yield reduction associated with water shortages, but also due to occasional flooding and/or runoff damage following infrequent periods of heavy rainfall. These changes may also affect quality and size of the crop, which may affect its price and saleability. Costs of treating pests and diseases may also increase slightly. Potential benefits for withy production set against greater risk of pests and diseases.
Adaptation responses under…
World Markets Scenario
Provincial Enterprise Scenario
Global Sustainability Scenario
Local Stewardship Scenario
Adaptation actions
£ More investment in water management to provide water and reduce impacts on yields and quality, including potential to evacuate water quickly following heavy rain. Withy production could be increased and is unlikely to be affected by runoff following heavy rainfall events
Increased investment from horticultural farmers (most of whom are in close proximity), but risk of damage to crops from runoff following heavy rain
£ Horticultural farmers work together to maintain water management and to provide evacuation routes for runoff to minimise damage to crops
£ Horticultural farmers form their own cooperative and work together to manage water and crops, with collection of runoff in ponds to minimise damage to crops
Opportunities Develop more efficient ways of irrigating horticultural crops
Potential to move to more profitable crops or higher yields with more secure source of water (but with risk of occasional losses due to runoff damage). Potential for Brue Valley to become one of main withy production areas
Horticultural farmers employ new technology to help maintain yields and quality. Use longer growing season to increase withy production
Horticultural farmers grow to meet local demands and supply growing local markets, take advantage of longer growing season to increase withy production

Risk & Policy Analysts, Geckoella and Environment Systems
Page 105
in the region
After adaptation – changes in land use
Area of withy production and horticultural crops may be expanded (if commercially viable and sufficient water is available), converted from grassland
Area of withy production and horticultural crops may be expanded to maximise profits, converted from grassland
Withy production to expand on land previously used as grassland, otherwise limited impacts, with water evacuation routes avoiding most productive areas
Area of withy production and horticultural crops may be expanded through conversion of grassland
After adaptation – environmental changes
Increased use of pesticides and fertilisers to maintain and increase yields reduces environmental quality of land. No impact on habitat fragmentation or transition to habitats of high environmental quality
Intensification of production reduces environmental quality of land. Habitat fragmentation may not increase, but may be sharp transition between intensively used land and habitats of high environmental quality
No change from current environmental quality of land. No impact on habitat fragmentation or transition to habitats of high environmental quality
More diverse crops could increase environmental quality, but change may be insignificant. More diverse crops could help improve connectivity (but will depend on crops grown). Reduction in intensity of land use could help reduce transition to habitats of high environmental quality
After adaptation – socio-economic changes
Increased costs (of inputs) may reduce profits but jobs may be created with increased withy production and move to horticultural crops
Increased profits may create new jobs. May be some increase in skills
Potential for increased withy production could result in increase in number of jobs
Supports existing jobs and may help develop new skills as new orchard and/or horticultural crops are grown or withy production increases
90% probability (10% chance that climate change will result in higher temperatures and increased precipitation) Implications without adaptation
Increased costs associated with growing the crops (control of pests and diseases and cultivating/harvesting due to the warmer and wetter conditions). Some crops may become less viable with increasing temperatures, especially if this affects overwintering and flowering stages. Short duration flooding may affect horticultural crops causing some loss of yield and income following flood events. Potential environmental benefits arise from change to low input / low emissions / high biodiversity land use that conserves peat soils and aids flood management
Adaptation responses under…
World Markets Scenario
Provincial Enterprise Scenario
Global Sustainability Scenario
Local Stewardship Scenario
Adaptation actions
£ Increased investment to control pests and diseases and to evacuate water away from high value crops
Intensification in the most viable crops to maximise yields, with this investment made in areas with lower flood risk
Change to more temperature and/or flood resistant crops (or varieties)
Increase in number and type of crops grown to reduce sensitivity to pests and diseases

Storyline for Orchards and Horticulture
Page 106
Opportunities Breeding of more resistant varieties. Potential to expand withy production
Application of skills that farmers already have to changing conditions. Potential for Brue Valley to become one of main withy production areas in the region
Breeding of more resistant varieties and use of natural predators. Potential to expand withy production on land previously used as grassland
New skills to grow new crops in ways that reduce the effect of pests and diseases. Also, potential to expand withy production (if local demand exists)
After adaptation – changes in land use
Land still used for horticultural crops but potential to increase (e.g. withy production) converted from dry grassland
Intensified use of land, but still for horticulture. May be small increases associated with move to withy production
Change to crops grown, but land use still horticultural. Land managed to evacuate floodwater away from high value horticultural crops
Change to crops grown, but land use still horticultural. High value crops grown in areas that are less vulnerable to flooding. Some increase in withy converted from grassland
After adaptation – environmental changes
May be reduction in environmental quality due to increased use of pesticides
Reduction in environmental value, with sharp transition to habitats of higher environmental quality
Change in crops grown, but unlikely to have significant impact. Evacuation of water away from horticultural crops could increase connectivity of wetter habitats
Change in crops grown, but unlikely to have significant impact on environmental quality or transition to habitats of high environmental quality
After adaptation – socio-economic changes
Potential for increased withy production and increase in area of horticultural crops likely to lead to new jobs
May be increase in profits and jobs with increased output and withy production, main area of supply for the region
Increased withy production could lead to creation of new jobs
Development of new skills. Number of jobs and income will depend on crops grown and if local demand exists for increased withy production
Summary of Changes in Land Use following Adaptation The table below shows the projected change in area of wet grassland of high value for wildlife, taking account of adaptation measures. The degree of uncertainty in the projected changes is highlighted using the following colour codings: projected change is based on data: projected change is based on the likely trend: projected change is estimated/derived from limited information: ; and projected change is not known (guesstimate):

Risk & Policy Analysts, Geckoella and Environment Systems
Page 107
Scenario World Markets
Scenario
Provincial Enterprise Scenario
Global Sustainability
Scenario
Local Stewardship
Scenario
Current area 39 ha 39 ha 39 ha 39 ha
Probability (where the change could range from that shown for the 10% and 90% probabilities)
Change due to: 10% 90% 10% 90% 10% 90% 10% 90%
Temperature 0 ha 0 ha 0 ha 0 ha 0 ha 0 ha 0 ha 0 ha
Precipitation (water table) and/or freshwater flooding
+810 ha
+410 ha
+700 ha
+200 ha
+410 ha
+410 ha
+370 ha
+200 ha
It is important to remember that there is a 90% chance that the climate change effects will be greater than those described on the 10% probability, and that there is a 10% chance that the climate change effects will be lower than those described under the 90% probability.
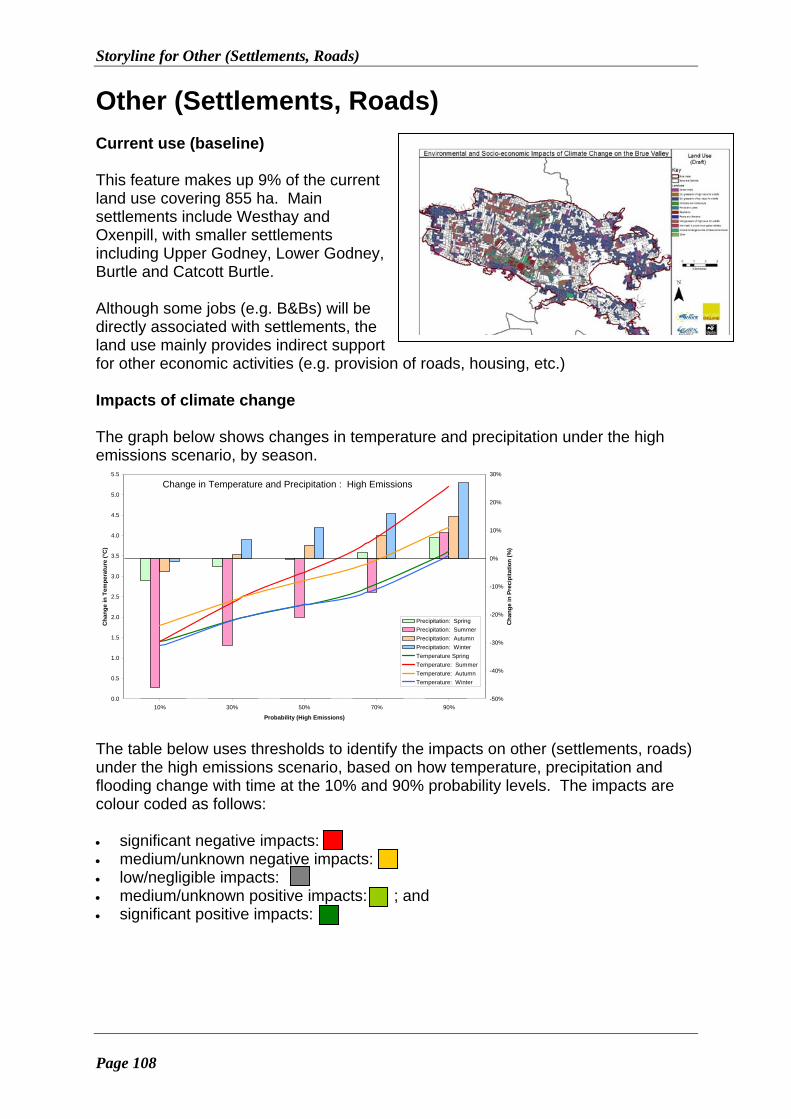
Storyline for Other (Settlements, Roads)
Page 108
Other (Settlements, Roads) Current use (baseline) This feature makes up 9% of the current land use covering 855 ha. Main settlements include Westhay and Oxenpill, with smaller settlements including Upper Godney, Lower Godney, Burtle and Catcott Burtle. Although some jobs (e.g. B&Bs) will be directly associated with settlements, the land use mainly provides indirect support for other economic activities (e.g. provision of roads, housing, etc.) Impacts of climate change The graph below shows changes in temperature and precipitation under the high emissions scenario, by season.
The table below uses thresholds to identify the impacts on other (settlements, roads) under the high emissions scenario, based on how temperature, precipitation and flooding change with time at the 10% and 90% probability levels. The impacts are colour coded as follows: significant negative impacts: medium/unknown negative impacts: low/negligible impacts: medium/unknown positive impacts: ; and significant positive impacts:
0.0
0.5
1.0
1.5
2.0
2.5
3.0
3.5
4.0
4.5
5.0
5.5
0% 10% 20% 30% 40% 50% 60% 70% 80% 90% 100%
Probability (High Emissions)
Ch
ang
e in
Tem
pe
ratu
re (
°C)
-50%
-40%
-30%
-20%
-10%
0%
10%
20%
30%
Ch
ang
e in
Pre
cip
ita
tio
n (
%)
Precipitation: Spring
Precipitation: Summer
Precipitation: Autumn
Precipitation: Winter
Temperature Spring
Temperature: Summer
Temperature: Autumn
Temperature: Winter
Change in Temperature and Precipitation : High Emissions

Risk & Policy Analysts, Geckoella and Environment Systems
Page 109
Change Thresholds Impacts without adaptation
Combination of change in temperature and precipitation could result in:
10% probability: o no temperature impacts
expected
Change in temperature
No impact expected
o increased pressure on water resources possible
90% probability: o no temperature impacts
expected
Change in rainfall
Decreased precipitation could put pressure on water resources, whilst very high intensity rainfall could increase run-off o increased run-off from
very high intensity rainfall
Flooding could cut off settlements and properties
Change in flood risk
Unpredictable inundation possible, also risk of flooding of roads
Flood risk could increase development pressure in areas outside the floodplain
10% probability: o no other impacts
expected Other impacts
No other impacts expected 90% probability:
o no other impacts expected
Implications of climate change for people and the environment The table below looks in more detail at the implications of the impacts described above without any adaptation measures being used. The impacts are colour coded using the same key as above.

Storyline for Other (Settlements, Roads)
Page 110
10% probability (90% chance that climate change will result in higher temperatures and increased precipitation)
Impacts without adaptation Implications
No temperature impacts expected None anticipated
Increased pressure on water resources possible
Water may become more expensive, affecting profitability of agriculture as well as tourism related enterprises e.g. B&Bs.
No other impacts expected None anticipated
90% probability (10% chance that climate change will result in higher temperatures and increased precipitation)
No temperature impacts expected None anticipated
Increased run-off from very high intensity rainfall
Adjacent land uses (e.g. crop land, orchards, environmentally important habitats) may be negatively impacted by contaminated run-off
No other impacts expected None anticipated
Change in flood risk
Flooding could cut off settlements and properties
Knock-on impacts for economic activity (due to disruption and damage to properties)
Flood risk could increase development pressure in areas outside the floodplain
Property values within the at-risk zone may drop, whilst areas outside the at-risk zone may become more densely populated
Adaptation options and responses If climate change has significant implications (whether positive or negative) for people and the environment then communities may adapt and respond. This response will depend upon the socio-economic context prevalent at the time. The table below looks at the adaptation measures available under each of four different socio-economic scenarios19. It also looks at whether or not these adaptation options are sufficient to alleviate adverse implications, or to make the most of opportunities associated with climate change for the use of the land for ‘other’. The table uses a series of symbols to illustrate the key impacts: Adaptation measures: Opportunities: £ more investment use of new technology/techniques
change in activity move to more profitable activity
increase in activity (intensification) move to funding for environmental improvements
decrease in activity (extensification) application of existing skills 0 no adaptation taken (or needed) development of new skills
19 A full description of the scenarios is given in Section 3 (or Annex 5).

Risk & Policy Analysts, Geckoella and Environment Systems
Page 111
10% probability (90% chance that climate change will result in higher temperatures and increased precipitation) Implications without adaptation
Water may become more expensive, affecting profitability of agriculture as well as tourism related enterprises e.g. B&Bs
Adaptation responses under…
World Markets Scenario
Provincial Enterprise Scenario
Global Sustainability Scenario
Local Stewardship Scenario
Adaptation actions
Technology will be employed to minimise water use
Individuals will use technology to minimise water use where this is economically viable
Schemes will promote careful use of water (but only at local level)
Local groups (e.g. cooperatives) work together to promote careful use of water and ensure biodiversity is protected
Opportunities Water efficient and water saving technologies will be adopted
Water efficient and water saving technologies will be adopted at local level (where cost effective)
Activities will be changed to those which use less water
Water efficient and water saving technologies will be adopted
After adaptation – changes in land use
Some increase in development on drier areas (to minimise increase in flood risk)
Development around and on floodplain (due to poor planning controls)
No development permitted on the floodplain
Very limited development, to meet local needs
After adaptation – environmental changes
None anticipated None anticipated None anticipated Conservation habitats retain their biodiversity
After adaptation – socio-economic changes
Water use is decreased overall, thus limiting the rise in costs
Water use is decreased by some
Water use is decreased
Water use is decreased at the local level
90% probability (10% chance that climate change will result in higher temperatures and increased precipitation) Implications without adaptation
Adjacent land uses (e.g. crop land, orchards, environmentally important habitats) may be negatively impacted by contaminated run-off
Adaptation responses under…
World Markets Scenario
Provincial Enterprise Scenario
Global Sustainability Scenario
Local Stewardship Scenario
Adaptation actions
£ Increase in investment in water management to minimise impacts on valuable land uses (agriculture and conservation)
0 No significant adaptation taken unless those owning the adjacent land take action
Possible move towards more sustainable run-off management with long term solutions
Water management at catchment scale where appropriate
Opportunities Use new technologies and engineering to minimise run-off
Application of skills already held to deal with run-off
Development of new skills to deal with run off water to minimise
Use simple technologies to minimise run-off

Storyline for Other (Settlements, Roads)
Page 112
damage
After adaptation – changes in land use
Development on floodplain not permitted
Wetter conditions prevent development on floodplain
No development permitted on the floodplain
Wetter conditions concentrate development outside floodplain
After adaptation – environmental changes
None anticipated None anticipated None anticipated None anticipated
After adaptation – socio-economic changes
Knock-on impacts of run-off are minimised
Changes are dependent on actions of those owning the adjacent land
No significant benefits or losses
Knock-on impacts of run-off in the local area are minimised
Summary of Changes in Land Use following Adaptation The table below shows the projected change in area of wet grassland of high value for wildlife, taking account of adaptation measures. The degree of uncertainty in the projected changes is highlighted using the following colour codings: projected change is based on data: projected change is based on the likely trend: projected change is estimated/derived from limited information: ; and projected change is not known (guesstimate):
Scenario World Markets
Scenario
Provincial Enterprise Scenario
Global Sustainability
Scenario
Local Stewardship
Scenario
Current area 855 ha 855 ha 855 ha 855 ha
Probability (where the change could range from that shown for the 10% and 90% probabilities)
Change due to: 10% 90% 10% 90% 10% 90% 10% 90%
Temperature 0 ha 0 ha 0 ha 0 ha 0 ha 0 ha 0 ha 0 ha
Precipitation (water table) and/or freshwater flooding
+12 ha 0 ha +45 ha 0 ha 0 ha 0 ha +4 ha 0 ha
It is important to remember that there is a 90% chance that the climate change effects will be greater than those described on the 10% probability, and that there is a 10% chance that the climate change effects will be lower than those described under the 90% probability.

Risk & Policy Analysts, Geckoella and Environment Systems
Page 113
Peat Works and Bare Ground Current use (baseline) Peat works and bare ground make up 4% of the current land use covering 365 ha. The Somerset area supplies around 8-10% of the UK domestic market for horticultural peat each year. The Brue Valley has the thickest deposits (typically around 2-3m) and most extensive peat workings of the Somerset Moors. In 2007, 42 people were employed in peat extraction in Somerset20. Due to the location of the peat production zones, it is assumed that the majority of these are employed in the Brue Valley. Impacts of climate change The graph below shows changes in temperature and precipitation under the high emissions scenario, by season.
The table below uses thresholds to identify the impacts on peat works and bare ground under the high emissions scenario, based on how temperature, precipitation and flooding change with time at the 10% and 90% probability levels. The impacts of climate change on peat works and bare ground are colour coded as follows: significant negative impacts: medium/unknown negative impacts: low/negligible impacts:
20 It is not known if these are Full-Time Equivalents (FTEs) or total number of jobs (which could
include part-time jobs).
0.0
0.5
1.0
1.5
2.0
2.5
3.0
3.5
4.0
4.5
5.0
5.5
0% 10% 20% 30% 40% 50% 60% 70% 80% 90% 100%
Probability (High Emissions)
Ch
ang
e in
Tem
pe
ratu
re (
°C)
-50%
-40%
-30%
-20%
-10%
0%
10%
20%
30%
Ch
ang
e in
Pre
cip
ita
tio
n (
%)
Precipitation: Spring
Precipitation: Summer
Precipitation: Autumn
Precipitation: Winter
Temperature Spring
Temperature: Summer
Temperature: Autumn
Temperature: Winter
Change in Temperature and Precipitation : High Emissions

Storyline for Peat Works and Bare Ground
Page 114
medium/unknown positive impacts: ; and significant positive impacts: Change Thresholds Impacts without adaptation
Combination of change in temperature and precipitation could result in:
10% probability: o Higher temperatures in
combination with reduced precipitation enhance short-term GHG emissions through increase in rate of peat mineralization
Change in temperature
Higher temperatures in combination with reduced precipitation could increase the rate of mineralization
o Peat extraction is facilitated by lower water levels
90% probability: o Higher temperature with
greater precipitation is not thought to have any significant impact
Change in rainfall
Decreased precipitation and hence lower water levels facilitate extraction
o Higher water levels make peat extraction more difficult
Change in flood risk
Unpredictable inundation due to high rainfall
Potential negative impacts for peat extraction operations which may be delayed or stopped
10% probability: o restoration of peat works
may take longer in hotter and drier conditions Other
impacts
Restoration of old peat works (i.e. bare ground) may be more difficult and take longer in hotter and drier conditions
90% probability: o none anticipated
Implications of climate change for people and the environment The table below looks in more detail at the implications of the impacts described above without any adaptation measures being used. The impacts are colour coded using the same key as above.

Risk & Policy Analysts, Geckoella and Environment Systems
Page 115
10% probability (90% chance that climate change will result in higher temperatures and increased precipitation)
Impacts without adaptation Implications
Higher temperatures in combination with reduced precipitation enhance the rate of peat mineralization
Mineralization of peat releases carbon dioxide to the atmosphere contributing to global warming
Peat extraction is facilitated by lower water levels, boosting economic gains
Peat extraction companies have lower costs since they are spending less on pumping water
Restoration of peat works may take longer in hotter and drier conditions
Time taken to restore peat works may increase with greater costs for conservation and negative impacts for biodiversity
90% probability (10% chance that climate change will result in higher temperatures and increased precipitation) Higher temperature with greater precipitation is not thought to have any significant impact
No implications
Higher water levels make peat extraction more difficult
Peat extraction companies have to spend more money on pumping water out of workings
Change in flood risk
Potential negative impacts for peat extraction operations which may be delayed or stopped
Peat extraction companies may reduce the size of their operations, or even move out of the area, leading to job losses
Adaptation options and responses If climate change has significant implications (whether positive or negative) for people and the environment then communities may adapt and respond. This response will depend upon the socio-economic context prevalent at the time. The table below looks at the adaptation measures available under each of four different socio-economic scenarios21. It also looks at whether or not these adaptation options are sufficient to alleviate adverse implications, or to make the most of opportunities associated with climate change for the use of the land for peat works and bare ground. The table uses a series of symbols to illustrate the key impacts: Adaptation measures: Opportunities: £ more investment use of new technology/techniques
change in activity move to more profitable activity
increase in activity (intensification) move to funding for environmental improvements
decrease in activity (extensification) application of existing skills 0 no adaptation taken (or needed) development of new skills
21 A full description of the scenarios is given in Section 3 (or Annex 5).

Storyline for Peat Works and Bare Ground
Page 116
10% probability (90% chance that climate change will result in higher temperatures and increased precipitation) Implications without adaptation
Drier conditions mean that peat extraction companies have lower costs since they are spending less on pumping water. Occasional flooding due to runoff following periods of heavy rain is unlikely to result in significant impacts. However, mineralization of peat releases carbon dioxide to the atmosphere contributing to global warming. Also, time taken to restore peat works may increase with greater costs for conservation and negative impacts for biodiversity
Adaptation responses under…
World Markets Scenario
Provincial Enterprise Scenario
Global Sustainability Scenario
Local Stewardship Scenario
Adaptation actions
£ More investment in water management and other techniques by extraction companies in response to environmental legislation / incentives
Peat extraction increases due to drier conditions and lack of environmental regulation / incentives
£ Investment in water management regime to limit mineralization of peat. Peat extraction decreases overall because of environmental concerns and development of peat substitutes
Peat extraction decreases overall because of environmental concerns. Local water management limits mineralization
Opportunities Use of new techniques and approaches to restore old peat workings
Application of skills already in existence to extract more peat
Focus on environmental improvements means funding is available for habitat restoration
Development of new skills ensure restoration of old workings to enhance biodiversity
After adaptation – changes in land use
Limited since extraction continues
Peat extraction may increase due to decrease in pumping required, and lack of concern for GHG balance
Peat extraction may stop completely given environmental concerns, leading to environmental benefits, especially for GHG balance
Overall area of peat extraction decreases but some areas are intensively worked to meet local demands
After adaptation – environmental changes
Old workings are restored to provide high quality habitats and recreation sites. This could help reduce habitat fragmentation. Mineralization is reduced
Peat extraction areas likely to be expanded, with little concern for restoration of old workings (other than for potential angling benefits). This is likely to increase habitat fragmentation
Peat mineralization is minimised by water management and old workings are restored. Restoration will help reduce habitat fragmentations
Amount of old workings which are restored increases. Restoration will help reduce habitat fragmentation
After adaptation – socio-economic changes
Small reduction in number of jobs supported by peat extraction
Peat extraction companies may grow, potentially increasing number of jobs
Job losses due to cessation of peat extraction but opportunities in conservation
Reduction in area of peat extraction likely to result in reduction in number of jobs

Risk & Policy Analysts, Geckoella and Environment Systems
Page 117
90% probability (10% chance that climate change will result in higher temperatures and increased precipitation) Implications without adaptation
Peat extraction companies have to spend more money on pumping water out of workings, especially following periods of flooding. This may increase pumping costs or delay extraction. No other implications have been identified.
Adaptation responses under…
World Markets Scenario
Provincial Enterprise Scenario
Global Sustainability Scenario
Local Stewardship Scenario
Adaptation actions
£ More investment in water management by extraction companies, but overall extraction is likely to decline due to costs of additional pumping
0 No significant adaptation taken
Reduction in peat extraction due to environmental concerns, availability of peat substitutes and difficulties of drainage, leaving wetter areas to conservation
Peat extraction decreases due to environmental concerns and high water levels
Opportunities Use of new technology to extract peat in wetter conditions (where costs do not exceed potential income, especially when competing with peat from other countries)
Existing skills and technology used to extract peat where conditions are dry enough
Funding means that wetter areas unsuitable for peat extraction are managed for biodiversity
New skills are used to manage old workings for biodiversity
After adaptation – changes in land use
Peat extraction will be more costly, so there may be a reduction in volumes extracted
Reduction in extraction due to increased drainage costs and reduced profits
Area of peat workings projected to decline to zero
Area of peat workings may decrease, but some extraction continues to meet local demand
After adaptation – environmental changes
None anticipated. Fragmentation may be reduced through restoration, but may be increased where further peat extraction occurs
Peat extraction may occur on conservation sites if they are dry enough (but likely to be limited due to wetter conditions). Fragmentation is likely to increase where extraction continues or expands
Biodiversity benefits as funding is put into conservation. Fragmentation of reedbeds or lakes/ponds could reduce due to restoration Peat conservation and GHG benefits
Biodiversity benefits as funding is put into conservation. Fragmentation of restored habitats will reduce
After adaptation – socio-economic changes
More costly peat extraction may mean job losses to retain profits
May be small reduction in number of jobs due to difficulties and costs of extraction
Potential job losses in peat extraction, but opportunities in conservation
Potential job losses in peat extraction, but some extraction continues where possible to meet local demand

Storyline for Peat Works and Bare Ground
Page 118
Summary of Changes in Land Use following Adaptation The table below shows the projected change in area of peat works and bare ground, taking account of adaptation measures. The degree of uncertainty in the projected changes is highlighted using the following colour codings: projected change is based on data: projected change is based on the likely trend: projected change is estimated/derived from limited information: ; and projected change is not known (guesstimate):
Scenario World Markets
Scenario
Provincial Enterprise Scenario
Global Sustainability
Scenario
Local Stewardship
Scenario
Current area 365ha 365ha 365ha 365ha
Probability (where the change could range from that shown for the 10% and 90% probabilities)
Change due to: 10% 90% 10% 90% 10% 90% 10% 90%
Temperature 0 ha 0 ha 0 ha 0 ha 0 ha 0 ha 0 ha 0 ha
Precipitation (water table) and/or freshwater flooding
-50 ha -160 ha +110
ha -90 ha -365 ha -365 ha -160 ha -140 ha
It is important to remember that there is a 90% chance that the climate change effects will be greater than those described on the 10% probability, and that there is a 10% chance that the climate change effects will be lower than those described under the 90% probability.

Risk & Policy Analysts, Geckoella and Environment Systems
Page 119
Reedbeds Current use (baseline) Reedbeds make up 3% of the current land use covering 326 ha. They are dominated by tall stands of Common reed Phragmites australis, with occasional herbs such as Marsh bedstraw Galium palustre. Reedbeds help support several UK BAP species including the Bittern Botaurus stellaris and Reed bunting Emberiza schoeniclus. The presence of reedbeds is likely to help support the tourism industry of the Brue Valley, and, as well as contributing towards the biodiversity of the area by providing habitat for high profile species such as the bittern, help manage water quality and flow. Reedbeds can also be highly productive. Impacts of climate change The graph below shows changes in temperature and precipitation under the high emissions scenario, by season.
0.0
0.5
1.0
1.5
2.0
2.5
3.0
3.5
4.0
4.5
5.0
5.5
0% 10% 20% 30% 40% 50% 60% 70% 80% 90% 100%
Probability (High Emissions)
Ch
ang
e in
Tem
per
atu
re (
°C)
-50%
-40%
-30%
-20%
-10%
0%
10%
20%
30%
Ch
ang
e in
Pre
cip
itat
ion
(%
)
Precipitation: Spring
Precipitation: Summer
Precipitation: Autumn
Precipitation: Winter
Temperature Spring
Temperature: Summer
Temperature: Autumn
Temperature: Winter
Change in Temperature and Precipitation : High Emissions

Storyline for Reedbeds
Page 120
The table below uses thresholds to identify the impacts on reedbeds under the high emissions scenario, based on how temperature, precipitation and flooding change with time at the 10% and 90% probability levels. The impacts are colour coded as follows: significant negative impacts: medium/unknown negative impacts: low/negligible impacts: medium/unknown positive impacts: ; and significant positive impacts: Change Thresholds Impacts without adaptation
Combination of change in temperature and precipitation could result in:
10% probability: o possible slight increase
in biomass due to warmer temperatures. Higher temperatures in shallower water could also result in increased methane production
Change in temperature
Reedbeds are generally not very sensitive to changes in temperature.
o drier conditions affect reedbed growth and location with conditions becoming too dry in some areas
90% probability: o increase in biomass due
to warmer temperatures. Higher temperatures could also result in increased methane production
Change in rainfall
Threshold for mean water depth minimums/maximums of 0m/+1.5m in winter, -0.25m/+1.25m in spring, -0.8m/+0.5m in summer and -1m/+0.75m in autumn) o wet conditions help to
support reedbeds; locations of some margins may change
Change in freshwater flood risk
Threshold for maximum duration of a single exposure event of 5 days in winter, 10 days in spring, 70 days in summer and 25 days in autumn.
Potential for increased runoff and short duration flooding (especially under 90% probability). Runoff could carry pollutants, although this may have limited impacts on the reedbeds, they may affect species supported by the reedbeds. Sudden increases in water levels (e.g. following heavy rain) could affect nesting birds or overwintering insects

Risk & Policy Analysts, Geckoella and Environment Systems
Page 121
Implications of climate change for people and the environment The table below looks in more detail at the implications of the impacts described above without any adaptation measures being used. The impacts are colour coded using the same key as above. 10% probability (90% chance that climate change will result in higher temperatures and increased precipitation)
Impacts without adaptation Implications
Possible slight increase in biomass due to warmer temperatures
Reedbed vegetation has greater productivity, thus sequestering more carbon but increasing costs of cutting for conservation management; GHG emissions may vary as water table shifts
Drier conditions affect reedbed growth and location with conditions becoming too dry in some areas
Species composition of reedbeds changes as terrestrial woody species take over in some areas. In others, reedbed may invade areas that were previously open water as the water table drops. This may affect the ability of the reedbeds to support other species.
Potential for increased runoff and short duration flooding. Runoff could carry pollutants, although this may have limited impacts on the reedbeds, they may affect species supported by the reedbeds. Sudden increases in water levels (e.g. following heavy rain) could affect nesting birds or overwintering insects
Species composition could be affected due to occasional flooding or influx of pollutants. The effects will depend on surrounding land use and risk of significant pollutant spikes following heavy rainfall events.
90% probability (10% chance that climate change will result in higher temperatures and increased precipitation)
Increase in biomass due to warmer temperatures
Reedbed vegetation has greater productivity, thus sequestering more carbon, but increasing costs of cutting for conservation management; GHG emissions may also vary as water table shifts
Wet conditions help to support reedbeds; locations of some margins may change
Wetter conditions are conducive to growth of reedbeds, providing greater areas of habitat suitable for BAP species such as bitterns (value of gains depends on which habitats are replaced)
Potential for increased runoff and short duration flooding due to increase in extreme rainfall events. Runoff could carry pollutants, although this may have limited impacts on the reedbeds, they may affect species supported by the reedbeds. Sudden increases in water levels (e.g. following heavy rain) could affect nesting birds or overwintering insects
Species composition could be affected due to occasional flooding or influx of pollutants. The effects will depend on surrounding land use and risk of significant pollutant spikes following heavy rainfall events. Any increase in the area of reedbeds due to the wetter conditions could reduce the impacts, especially where the reeds themselves can moderate runoff and/or pollutant levels
Adaptation options and responses If climate change has significant implications (whether positive or negative) for people and the environment then communities may adapt and respond. This response will depend upon the socio-economic context prevalent at the time. The

Storyline for Reedbeds
Page 122
table below looks at the adaptations measures available under each of four different socio-economic scenarios22. It also looks at whether or not these adaptation options are sufficient to alleviate adverse implications, or to make the most of opportunities associated with climate change for the use of the land for reedbeds. The table uses a series of symbols to illustrate the key impacts: Adaptation measures: Opportunities: £ more investment use of new technology/techniques
change in activity move to more profitable activity
increase in activity (intensification) move to funding for environmental improvements
decrease in activity (extensification) application of existing skills 0 no adaptation taken (or needed) development of new skills
10% probability (90% chance that climate change will result in higher temperatures and increased precipitation) Implications without adaptation
Reedbed vegetation has greater productivity, sequestering more carbon but increasing the costs of cutting for conservation management. In some areas, species composition of reedbeds changes as terrestrial woody species take over. These changes affect the ability of reedbeds to support other species. Reedbed species themselves invade areas that were previously open water as the water table drops, but sudden increases due to runoff following heavy rain could affect species supported by the reedbeds. Greenhouse gas emissions may vary as water table shifts.
Adaptation responses under…
World Markets Scenario
Provincial Enterprise Scenario
Global Sustainability Scenario
Local Stewardship Scenario
Adaptation actions
£ Invest in water management to retain species rich areas of reedbed rather than allow colonisation by terrestrial species. Occasional increase in pollutants may affect species diversity
Drier conditions allow former areas of reedbed to be colonised by woody species; reedbed viable in other previously open-water areas. But decrease in management in nature reserves due to lack of funds. Potential for increased level of pollutants from runoff over more intensively farmed land
Where sustainable, species rich areas of reedbed are retained by water management. Other areas are allowed to become drier. Influx of pollutants and runoff managed by more sustainable land use, especially around species rich areas. Floodplain-scale management in drier conditions may lead to invasion of some open-water areas and ditch habitats.
Local water management helps maintain some areas of species rich reedbed. Areas which become drier may be put to other uses such as withy production or even agricultural use. Careful water use and reduction of inputs on land reduces impacts from runoff
22 A full description of the scenarios is given in Section 3 (or Annex 5).

Risk & Policy Analysts, Geckoella and Environment Systems
Page 123
Opportunities Use of agri-environment payments to manage improvement in markets for reedbeds (water/ carbon/nutrient/ biodiversity management)
Improvement in markets for reedbeds (water/carbon/ nutrient/ biodiversity management), but harvesting would be for profit rather than environmental quality
Use of new technology to manage water table to minimise greenhouse gas release from reedbeds
Development of new skills to maximise output from drier areas whilst maintaining species richness and habitat quality of wetter areas. Opportunities for commercial reed growing reduced due to drier conditions
After adaptation – changes in land use
Potentially some loss of low quality areas of reedbed, but these may be replaced by reedbed species colonising open water
Loss in area of reedbed to scrub, but some movement by reedbed species to colonise open water/former peat extraction areas
Change in land use in some areas. Other areas are maintained where water table allows. This habitat would respond well to landscape-scale management
Loss of some areas of reedbed as they become drier and are put to other uses, balanced by colonisation of some areas of open water. Fragmentation of existing reedbed habitats could increase
After adaptation – environmental changes
Unlikely to be any significant change or overall loss of species due to management. May be small increase in habitat fragmentation where lower quality areas are lost (but only where these are not replaced, over time, by colonisation of open water). Impacts on carbon flux where peat soils dry out
Likely decrease in reedbed species diversity as overall quality and area decreases. Also increase in habitat fragmentation. Increased intensification of land use may also make the transition to reedbed habitats much sharper. Impacts on carbon flux due to peat soils drying out
Management and enhancement of species rich reedbed areas retained through agri-environment payments and landscape-scale approach. Localised losses where water management is not thought sustainable, offset by gains elsewhere. Overall, habitat fragmentation could be reduced slightly. Benefits for carbon flux as greater area of peat soils is kept wet and vegetated
Potential decrease in reedbed area and connectivity/ coordinated management. Mostly offset by local invasion of open-water habitats. Local benefits retained through targeted management. Small benefits for carbon flux from increase in area of reedbeds
After adaptation – socio-economic changes
No change anticipated since any loss of employment associated with lost areas of
Potential loss in conservation employment; offsets depend on enhanced markets for
Maintenance in overall area of reedbed and conservation/land management jobs
Potential for increase in employment since dried out reedbed areas may be brought into

Storyline for Reedbeds
Page 124
reedbed will be compensated for by greater management required in remaining areas
reedbed services productive use, also possibly jobs in local nature reserve management including recreation
90% probability (10% chance that climate change will result in higher temperatures and increased precipitation) Implications without adaptation
Reedbed vegetation has greater productivity, sequestering more carbon, but increasing costs of cutting reeds for conservation management. Wetter conditions support growth of reedbeds, providing greater areas of habitat suitable for BAP species such as bitterns (but the value of gains depends on which habitats are replaced). Greenhouse gas emissions may also vary as water table shifts. Heavier rainfall could increase runoff and result in sudden increases in the water table. This may affect species living in the reedbeds
Adaptation responses under…
World Markets Scenario
Provincial Enterprise Scenario
Global Sustainability Scenario
Local Stewardship Scenario
Adaptation actions
0 No adaptation taken
0 No adaptation taken
Expanding reedbeds are managed to deliver greenhouse gas, water flow, water quality and biodiversity benefits. Careful land management around reedbeds to avoid loss of nutrients in runoff
Localised management gives gains/losses. Careful land management helps to reduce nutrient losses to reedbeds
Opportunities Potential for use of agri-environment payments to manage reedbeds for biodiversity
Application of existing skills to manage reedbeds to deliver e.g. flood management functions, especially in terms of runoff/ flood water management following heavy rainfall events
Agri-environment schemes help pay for reedbed management as well as for other services as part of a landscape-scale wetland scheme
To increase their green credentials, there is the potential for farmers to manage areas of reedbed for local greenhouse gas, water flow and quality, and biodiversity benefits. There could also be opportunities for commercial reed production, supported by local demand and conservation grants
After adaptation – changes in land use
Reedbed may expand into other habitats which cope less well
Area of reedbed increases due to abandonment of wetter areas (but
Reedbeds expand to cover larger areas, potentially taking over former
Land use in areas of reedbed may expand, especially in wetter areas of

Risk & Policy Analysts, Geckoella and Environment Systems
Page 125
with high water tables
this would be unmanaged change)
rhyne and ditch habitats, and open water, as well as wetter areas of former grassland
former grassland
After adaptation – environmental changes
Diversity of reedbed species retained but possible loss of species present in other habitats. May also be impacts on species living in reedbeds where the water table suddenly rises. Increase in area of reedbeds could reduce habitat fragmentation. Wetter conditions favour reedbeds with potential for carbon flux benefits
Area of reedbed increases, but in unmanaged way May be impacts on species supported by reedbeds where the water table increases following heavy rainfall and due to freshwater flooding. Transition to reedbeds may be sudden from surrounding, intensively used land, but will be softer where land is abandoned. Abandonment of wetter areas may result in carbon flux benefits, due to peat soils remaining wet and vegetated
Reedbed species diversity is retained, but there may be some loss of biodiversity relating to habitats into which reedbeds expand. Land management could result in flood flows being directed to reedbeds, with impacts on species living in the reeds. Habitat fragmentation could reduce over time as new reedbeds become established. Potential carbon flux benefits from increase in area of reedbeds
Reedbed species diversity is retained since climatic conditions favour growth of reedbeds. Land management could result in flood flows being directed to reedbeds, with impacts on species living in the reeds. Habitat fragmentation is unlikely to change significantly. Potential carbon flux benefits from increase in area of reedbeds
After adaptation – socio-economic changes
Potential for more jobs in conservation due to need for more frequent cutting of reeds
Employment relating to reedbeds stays relatively constant
Potential for increase in land management jobs associated with reedbeds as they are managed for environmental service delivery
Possible increase in reedbed management due to greater need to manage reedbeds because of multiple local demands
Summary of Changes in Land Use following Adaptation The table below shows the projected change in area of wet grassland of high value for wildlife, taking account of adaptation measures. The degree of uncertainty in the projected changes is highlighted using the following colour codings: projected change is based on data: projected change is based on the likely trend: projected change is estimated/derived from limited information: ; and projected change is not known (guesstimate):

Storyline for Reedbeds
Page 126
Scenario World Markets Scenario
Provincial Enterprise Scenario
Global Sustainability Scenario
Local Stewardship Scenario
Current area 326 ha 326 ha 326 ha 326 ha
Probability (where the change could range from that shown for the 10% and 90% probabilities)
Change due to: 10% 90% 10% 90% 10% 90% 10% 90%
Temperature 0 ha 0 ha 0 ha 0 ha 0 ha 0 ha 0 ha 0 ha
Precipitation (water table) and/or freshwater flooding
-30 ha +40 ha -130 ha +70 ha +40 ha +110
ha +6 ha
+110 ha
It is important to remember that there is a 90% chance that the climate change effects will be greater than those described on the 10% probability, and that there is a 10% chance that the climate change effects will be lower than those described under the 90% probability.
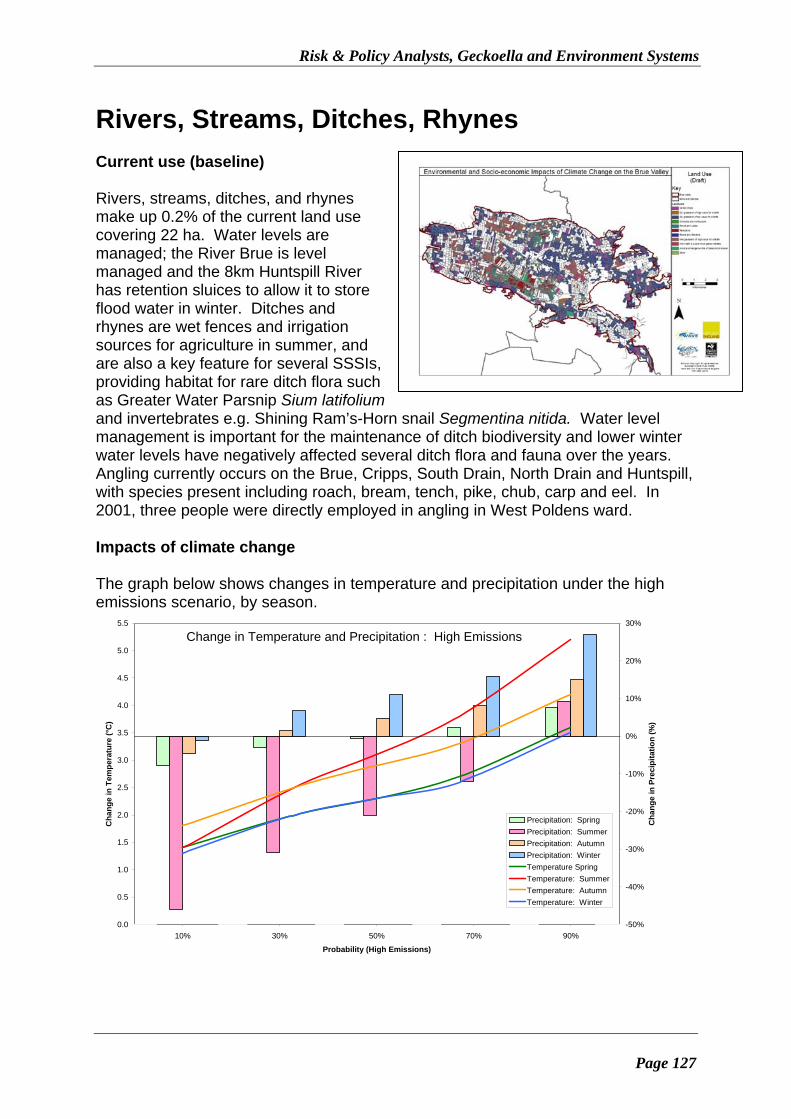
Risk & Policy Analysts, Geckoella and Environment Systems
Page 127
Rivers, Streams, Ditches, Rhynes Current use (baseline) Rivers, streams, ditches, and rhynes make up 0.2% of the current land use covering 22 ha. Water levels are managed; the River Brue is level managed and the 8km Huntspill River has retention sluices to allow it to store flood water in winter. Ditches and rhynes are wet fences and irrigation sources for agriculture in summer, and are also a key feature for several SSSIs, providing habitat for rare ditch flora such as Greater Water Parsnip Sium latifolium and invertebrates e.g. Shining Ram’s-Horn snail Segmentina nitida. Water level management is important for the maintenance of ditch biodiversity and lower winter water levels have negatively affected several ditch flora and fauna over the years. Angling currently occurs on the Brue, Cripps, South Drain, North Drain and Huntspill, with species present including roach, bream, tench, pike, chub, carp and eel. In 2001, three people were directly employed in angling in West Poldens ward. Impacts of climate change The graph below shows changes in temperature and precipitation under the high emissions scenario, by season.
0.0
0.5
1.0
1.5
2.0
2.5
3.0
3.5
4.0
4.5
5.0
5.5
0% 10% 20% 30% 40% 50% 60% 70% 80% 90% 100%
Probability (High Emissions)
Ch
ang
e in
Tem
per
atu
re (
°C)
-50%
-40%
-30%
-20%
-10%
0%
10%
20%
30%
Ch
ang
e in
Pre
cip
itat
ion
(%
)
Precipitation: Spring
Precipitation: Summer
Precipitation: Autumn
Precipitation: Winter
Temperature Spring
Temperature: Summer
Temperature: Autumn
Temperature: Winter
Change in Temperature and Precipitation : High Emissions

Storyline for Rivers, Streams, Ditches, Rhynes
Page 128
The table below uses thresholds to identify the impacts on rivers, streams, ditches, rhynes under the high emissions scenario, based on how temperature, precipitation and flooding change with time at the 10% and 90% probability levels. The impacts are colour coded as follows: significant negative impacts: medium/unknown negative impacts: low/negligible impacts: medium/unknown positive impacts: ; and significant positive impacts: Change Thresholds Impacts without adaptation
Combination of change in temperature and precipitation could result in:
10% probability: o higher temperatures affect
dissolved oxygen levels, with negative impacts for flora and fauna (especially invertebrates) mainly felt in spring and summer. Could also result in increased methane production
o increase in biomass production increases vegetation management costs
Change in temperature
Higher temperatures affect dissolved oxygen levels in water, with negative impacts for flora and fauna. Under 10% probability, feature is mostly resistant in autumn and winter because anticipated temperature changes are small, however impacts are expected in spring and summer. Decreased precipitation (10% probability) means that conditions are too dry for 1 year in 4/5 in summer and autumn and 1 year in 6/7 in spring and winter (depending on water table management) Increased temperatures enhance the risk of diseases, pests (including Aedes mosquito) and invasive species. Deeper water buffers effects. Higher temperatures increase biomass production
o drier conditions cause desiccation, with greater impacts during summer and autumn (depending on water table management)
90% probability: o higher temperatures affect
levels of dissolved oxygen, with negative impacts for flora and fauna all year round. Could also result in increased methane production
o increase in biomass production increases vegetation management costs
Change in rainfall
Under 90% probability, impacts are expected all year round. More rainfall helps to support the habitat, but could lead to increase in primary productivity if combined with warmer temperatures Changes in water table levels may have knock-on impacts for greenhouse gas emissions, e.g. methane from ditches
o wetter conditions support the feature and help to mitigate for eutrophic tendencies arising from warmer temperatures
Change in freshwater flood risk
Freshwater flooding caused by increased runoff could bring high levels of contaminants into rivers, streams, ditches and rhynes
Spikes of contaminants and sudden changes in water quality could affect the biodiversity value of the lakes and ponds,

Risk & Policy Analysts, Geckoella and Environment Systems
Page 129
especially where this affects dissolved oxygen levels
10% probability: o lower flow during drier
periods increase sedimentation Other
impacts Changing flow levels require changes in management effort 90% probability:
o higher flows not expected to have any significant impacts on river banks
Implications of climate change for people and the environment The table below looks in more detail at the implications of the impacts described above without any adaptation measures being used. The impacts are colour coded using the same key as above. 10% probability (90% chance that climate change will result in higher temperatures and increased precipitation)
Impacts without adaptation Implications
Higher temperatures affect dissolved oxygen levels, with negative impacts for flora and fauna (especially invertebrates) mainly felt in spring and summer
Population size and ultimately species diversity (in particular of invertebrates) may decrease due to less hospitable conditions
Increase in biomass production increases vegetation management costs
Greater management effort needed to ensure river and stream channels are not blocked with vegetation, and to maintain biodiversity
Drier conditions cause desiccation, with greater impacts during summer and autumn (depending on water table management)
Aquatic species are lost during drier years (conditions are too dry every 1 in 4/5 years). Recolonisation may be limited if conditions remain unsuitable
Reduced flow and lower water levels as a result of drier conditions could affect the use of rivers, streams, ditches and rhynes as wet fences and sources of drinking water for livestock. This would have a significant implication for management of the fields and could be a major factor in land abandonment
Lower flow during drier periods increase sedimentation
Higher management costs and effects on biodiversity may be incurred during drier seasons and years as sediment is deposited and channels are blocked.
Occasional wetter days could result in higher runoff and greater movement of contaminants from the land
Effects on flora and fauna due to raised pollutant levels and reduction in dissolved oxygen. Such changes will affect the more sensitive species and may decrease the biodiversity value. The impacts are likely to be greater where water levels are reduced due to the overall drier condition
Increased temperature and longer growing season favour invasive species such as Parrot feather Myriophyllum aquaticum
Adverse effects on biodiversity and water flow

Storyline for Rivers, Streams, Ditches, Rhynes
Page 130
90% probability (10% chance that climate change will result in higher temperatures and increased precipitation) Higher temperatures affect levels of dissolved oxygen, with negative impacts for flora and fauna all year round
Population size and ultimately species diversity (in particular of invertebrates) may decrease due to less hospitable conditions
Increase in biomass production increases vegetation management costs
Warmer conditions may lead to rapid growth of some aquatic vegetation species (e.g. Lemna spp.), affecting the level of light reaching the river bed as well as the nutrients available for other species to utilise
Wetter conditions support the feature and help to mitigate for eutrophic tendencies arising from warmer temperatures
Rivers and streams are supported by wetter conditions, but there may be some increase in management costs as vegetation growth rate increases
Occasional wetter days could result in higher runoff and greater movement of contaminants from the land
Effects on flora and fauna due to raised pollutant levels and reduction in dissolved oxygen. Such changes will affect the more sensitive species and may decrease the biodiversity value. The impacts may be reduced due to overall wetter conditions (compared with the 10% probability)
Higher flows not expected to have any significant impacts on river banks. However, increased priority for flood management may require levels of vegetation management that would be sub-optimal for biodiversity.
However, flood management concerns may demand intensive vegetation management, and low water levels, to the detriment of biodiversity.
Increased temperature and longer growing seasons favour invasive species such as Parrot Feather Myriophyllum aquaticum
Adverse effects on biodiversity and water flow
Adaptation options and responses If climate change has significant implications (whether positive or negative) for people and the environment then communities may adapt and respond. This response will depend upon the socio-economic context prevalent at the time. The table below looks at the adaptation measures available under each of four different socio-economic scenarios23. It also looks at whether or not these adaptation options are sufficient to alleviate adverse implications, or to make the most of opportunities associated with climate change for the use of the land for rivers, streams, ditches and rhynes. The table uses a series of symbols to illustrate the key impacts: Adaptation measures: Opportunities: £ more investment use of new technology/techniques
change in activity move to more profitable activity
increase in activity (intensification) move to funding for environmental improvements
decrease in activity (extensification) application of existing skills 0 no adaptation taken (or needed) development of new skills
23 A full description of the scenarios is given in Section 3 (Annex 5).

Risk & Policy Analysts, Geckoella and Environment Systems
Page 131
10% probability (90% chance that climate change will result in higher temperatures and increased precipitation) Implications without adaptation
Reduced flow and lower water levels as a result of drier conditions could affect the use of rivers, streams, ditches and rhynes as wet fences, with a significant implication for management of the fields and could be a major factor in land abandonment. Population size and ultimately species diversity (in particular of invertebrates) may decrease due to less hospitable conditions. Greater management effort needed to ensure river and stream channels are not blocked with vegetation or sediment. Aquatic species are likely to be locally lost during drier years (conditions are too dry every 1 in 4/5 years). Recolonisation may be limited if conditions remain unsuitable. Lower dissolved oxygen levels (due to lower water levels, warmer conditions and increased level of contaminants due to runoff) may favour generalists over specialists. Flood concerns may lead to more intensive waterway vegetation management and lower water levels. Invasive species may flourish.
Adaptation responses under…
World Markets Scenario
Provincial Enterprise Scenario
Global Sustainability Scenario
Local Stewardship Scenario
Adaptation actions
0 or £ Current river and stream management activities continue with maintenance of wet fences as far as possible, but some land use change (away from grazing) may occur where wet fences cannot be maintained. This could result in some species being lost from some stretches of watercourses during drier years. Fencing could also be used to maintain livestock grazing areas, especially on larger farms, with bowser water provision or piped infrastructure. More resilient species are allowed to colonise these stretches. Occasional increase in pollutant levels may affect species diversity (especially more sensitive
£ and Investment will occur in stretches of rivers and streams where angling occurs to maintain income. Other areas will be left alone. This may result in increased abandonment of land for livestock grazing, or use of fencing to keep livestock in appropriate fields. Occasional increase in pollutant levels may affect species diversity (especially more sensitive invertebrate species). This may be greater than under the other scenarios due to more intensive use of the land. Local flooding concerns will prompt intensive vegetation management and low water levels for key waterways.
£ Increased investment in water management to help maintain diversity in rivers and streams as far as possible. Water will be directed to areas where wet fences are required, although reduced volumes of water may mean some areas need to be managed differently in drier years. Some loss of ditch habitat due to more extensive approach to management, offset in part by gains in ‘fuzzy’ wetland edges elsewhere. Influx of pollutants due to runoff may be managed by more sustainable land use around the watercourses.
£ High priority placed on maintaining these habitats for their recreation, flood management, water quality, biodiversity and tourism potential. Wet fences will be maintained in areas of highest environmental quality and focused onto key livestock grazing areas. Influx of pollutants due to runoff may be managed by more sustainable land use around the watercourses. Wet ditches lost where habitat and water level management too expensive to maintain in fragmented ownership.

Storyline for Rivers, Streams, Ditches, Rhynes
Page 132
invertebrate species)
Opportunities Agri-environment payments are made available to retain the most species rich stretches of rivers and streams, rhynes and ditches
Current management skills are used to maintain stretches of river for angling purposes where this brings income to the area
Funding for environmental improvements is used to adapt to landscape-scale floodplain management.
Local agri-environment funding prioritises rivers, rhynes and streams. Opportunity to open up wetland nature reserves including rivers and streams to visitors to generate income to help support conservation activities
After adaptation – changes in land use
Reduction in water levels requires greater level of water management and movement, to enable wet fences to continue in areas of highest environmental quality/highest grazing value – management in these areas improves for biodiversity. Elsewhere, some losses of low quality ditches, replaced with fencing and bowser / piped water for livestock, and/or accompanied by abandonment to scrub.
Condition of rivers and streams changes, with vegetation and silt blocking channels. This may be cleared by individuals where it causes detrimental impacts on adjacent land (e.g. flooding of crop land). Fencing used to replace wet fences where profitable. Elsewhere, ditch abandonment will lead to loss of feature, and knock-on effects of loss of wet ditches on management of grassland habitats (but this will only occur on marginal land where it is not profitable to continue farming)
Ditches maintained and enhanced where water levels allow. Elsewhere, extensive approach to management means some local losses expected where conditions not naturally suited to the feature. These losses partially offset by ‘fuzzy edges’ to open water in a habitat matrix. This may maintain species populations, although not the exact ditch floral / faunal communities.
Move to mixed farming may mean wet fences can be maintained around some grazing areas, but this will depend on local water management and priorities. Some losses of ditch habitat expected.
After adaptation – environmental changes
High priority areas for biodiversity retained by agri-environment payments, including targeting water management so
Likely loss of biodiversity since only real management of habitat is for angling purposes. Increased use of fencing and
Unlikely to be significant overall change due to funding for environmental improvements helping to retain biodiversity
Overall biodiversity retained due to conservation efforts and more sustainable land management around the watercourses.

Risk & Policy Analysts, Geckoella and Environment Systems
Page 133
wet fences can be retained in areas of highest environmental quality. Elsewhere, potential decrease in biodiversity in some areas as communities adapt to less water being available. Use of fencing may also reduce ditch side habitat for breeding birds (especially for feeding of breeding waders) and, if combined with reduced management and increased scrub growth, could increase shading of ditch habitats. May be some negative impacts where pollutants enter rivers following periods of heavy rainfall
reduced scrub control will reduce quality of ditch habitats, and access for breeding birds (especially for feeding for breeding waders) Rhynes outside nature reserves either choked with vegetation or completely cleared, with risk of greater inputs of pollutants (including nutrients) – reducing biodiversity
through landscape-scale floodplain approach. This will help maintain feeding habitats for breeding waders, but there may be some loss of ditch habitats in particularly dry years, and some change in feature location and type (gradations with swamp and fen).
May be some reduction in ditch habitats, though, where water volumes mean some wet fences are lost. This could have localised impacts on feeding grounds for breeding waders
After adaptation – socio-economic changes
Unlikely to be significant change
Jobs in angling are retained, however, there are likely to be losses in conservation and environmental management
Unlikely to be significant change
New jobs may be created associated with recreation and tourism due to greater access as area becomes drier
90% probability (10% chance that climate change will result in higher temperatures and increased precipitation) Implications without adaptation
Population size and ultimately species diversity (in particular of invertebrates) may decrease due to less hospitable conditions (too warm, lower dissolved oxygen, especially where nutrients and pollutants enter the watercourses through runoff following heavy rain). Warmer conditions may lead to rapid growth of some aquatic vegetation species (e.g. Lemna spp., invasive species), affecting the level of light reaching the river bed as well as the nutrients available for other species to utilise. Rivers and streams are supported by wetter conditions, but there may be some increase in management costs as vegetation growth rate increases.
Adaptation responses under…
World Markets Scenario
Provincial Enterprise Scenario
Global Sustainability Scenario
Local Stewardship Scenario
Adaptation actions
£ Investment in river and stream management
Wetter conditions enhance the habitat available
£ Investment in water management to
£ High priority placed on maintaining these

Storyline for Rivers, Streams, Ditches, Rhynes
Page 134
activities increases since some species e.g. Lemna spp. require more frequent clearance to ensure overall biodiversity is maintained. Also investment in digging new ditches to help maintain drainage of grassland and cropland
for angling, thus increasing the potential income from rivers and streams. Intensive waterway management used to alleviate local flood risk, but fragmented approach.
ensure that species diversity is retained despite likely rapid growth of some species. Extensive management of land around watercourses to minimise agricultural runoff following heavy rain, including digging of new ditches to maintain drainage
habitats for their recreation, flood management, water quality, biodiversity, and tourism potential. Careful management of land around watercourses to minimise agricultural runoff following heavy rain, including digging of new ditches to maintain drainage and enable mixed farming to continue
Opportunities Agri-environment funding is used to manage rivers and streams to ensure biodiversity is retained (although some decreases may occur due to increased runoff and associated pollutants)
Rivers and streams are stocked with fish to bring in anglers and generate income for the area. Increases in runoff and pollutants could affect water quality
and Wetter conditions offer opportunities to extend the spread of wetland habitats, increasing habitat connectivity, including through digging of new ditches
and Opportunity to expand wetland habitats and open up areas for visitors to generate income to help support conservation activities. This includes digging of new ditches to help maintain drainage
After adaptation – changes in land use
Increase in area of ditches and rhynes due to need to improve drainage for agricultural activities
Ditches and rhynes are abandoned in/around land that is no longer farmed, resulting in loss of around 20% of ditches to scrub
Possible expansion of area covered by ditches and rhynes
Potential for increase in overall area of ditches and rhynes
After adaptation – environmental changes
May be small decline in water quality due to pollutants washed into watercourses after heavy rainfall events. Overall, fragmentation of habitats is unlikely to be significantly affected. Increased drainage used to maintain potential to evacuate water
Aquatic biodiversity expected to decrease as rivers and streams are managed purely for fishing purposes, also due to higher pollutant levels washed into lakes and ponds from runoff from land that is more intensively
Potential for increased freshwater biodiversity as habitat connectivity is enhanced, with benefits for breeding waders; some ditch communities may change (but species may continue in different assemblages?).
Potential for increased freshwater biodiversity as habitat connectivity is enhanced

Risk & Policy Analysts, Geckoella and Environment Systems
Page 135
and should have limited negative effects on biodiversity due to overall wetter conditions
farmed. May be increased fragmentation of higher quality areas and intensification of surrounding land and management of ditches for angling may reduce connectivity
After adaptation – socio-economic changes
Minimal change in employment opportunities expected since habitats remain
Overall number of jobs in the area likely to stay the same since angling jobs increase but conservation jobs will probably decrease
Unlikely to be any change in overall employment since jobs lost through wetland expansion may be replaced by conservation opportunities
Potential to create new jobs associated with conservation, recreation and tourism, as well as potentially replacing any lost farming jobs with angling ones
Summary of Changes in Land Use following Adaptation The table below shows the projected change in area of rivers, streams, ditches, and rhynes, taking account of adaptation measures. The degree of uncertainty in the projected changes is highlighted using the following colour codings: projected change is based on data: projected change is based on the likely trend: projected change is estimated/derived from limited information: ; and projected change is not known (guesstimate):
Scenario World Markets Scenario
Provincial Enterprise Scenario
Global Sustainability Scenario
Local Stewardship Scenario
Current area 22 ha 22 ha 22 ha 22 ha
Probability (where the change could range from that shown for the 10% and 90% probabilities)
Change due to: 10% 90% 10% 90% 10% 90% 10% 90%
Temperature 0 ha 0 ha 0 ha 0 ha 0 ha 0 ha 0 ha 0 ha
Precipitation (water table) and/or freshwater flooding
0 ha +12 ha -2 ha -4 ha 0 ha +12 ha 0 ha +12 ha
It is important to remember that there is a 90% chance that the climate change effects will be greater than those described on the 10% probability, and that there is a 10% chance that the climate change effects will be lower than those described under the 90% probability.

Storyline for Swamp and Fen
Page 136
Swamp and Fen Current use (baseline) Swamp and fen makes up 2% of the current land use covering 158 ha. The habitat features in several SSSIs including Catcott, Edington and Chilton Moors, Tealham and Tadham Moor, Westhay Moor, Shapwick Heath, Westhay Heath, Street Heath and Sharpham Moor Plot. This habitat generally fringes open water and reedbed, with tall emergents such as Common bulrush Typha latifolia and Reed canary grass Phalaris arundinacea. It also includes occasional patches of sedge-rich fen habitat, generally found in wetland mosaics with the nature reserves. Swamp and fen help attract wildlife tourists to the Brue Valley, as well as contributing towards the biodiversity of the area. The feature helps support around 280 tourism and conservation jobs in the Somerset Levels and Moors. Impacts of climate change The graph below shows changes in temperature and precipitation under the high emissions scenario, by season.
0.0
0.5
1.0
1.5
2.0
2.5
3.0
3.5
4.0
4.5
5.0
5.5
0% 10% 20% 30% 40% 50% 60% 70% 80% 90% 100%
Probability (High Emissions)
Ch
ang
e in
Tem
per
atu
re (
°C)
-50%
-40%
-30%
-20%
-10%
0%
10%
20%
30%
Ch
ang
e in
Pre
cip
itat
ion
(%
)
Precipitation: Spring
Precipitation: Summer
Precipitation: Autumn
Precipitation: Winter
Temperature Spring
Temperature: Summer
Temperature: Autumn
Temperature: Winter
Change in Temperature and Precipitation : High Emissions

Risk & Policy Analysts, Geckoella and Environment Systems
Page 137
The table below uses thresholds to identify the impacts on swamp and fen under the high emissions scenario, based on how temperature, precipitation and flooding change with time at the 10% and 90% probability levels. The impacts are colour coded as follows: significant negative impacts: medium/unknown negative impacts: low/negligible impacts: medium/unknown positive impacts: ; and significant positive impacts: Change Thresholds Impacts without adaptation
Combination of change in temperature and precipitation could result in:
10% probability: o small increases in
temperature are not expected to have any significant impacts, although there may be small increases in methane production
Change in temperature
Swamp and fen are assumed to be resilient to small increases in temperature but warmer conditions may increase evaporation. Larger temperature increases may affect biomass production in spring, summer and autumn.
o lower rainfall affects the water table. Wetland communities will be under stress especially in summer and autumn
90% probability: o higher temperatures may
affect biomass production in spring, summer and autumn. There could also be increases in methane production
Change in rainfall
Lower precipitation impacts the water table, leading to conditions which are too dry for swamp and fen for 1 year in 5. Periodic inundation of up to 200mm is typical for habitat. Minimum mean water depth is -0.75m in winter, -0.9m in spring, -1.0m in summer and -0.9m in autumn. Greater precipitation leads to qualitative changes for swamp and fen as a result of cumulative water table changes. Maximum mean water depth is 1.5m in winter, 1.25m in spring, 1.25m in summer and 1.3m in autumn.
o increased rainfall affects the water table resulting in qualitative changes in swamp and fen
Change in freshwater flood risk
Freshwater flooding caused by increased runoff could bring high levels of contaminants into swamps and fens
Spikes of contaminants and sudden changes in water quality could affect the biodiversity value

Storyline for Swamp and Fen
Page 138
Implications of climate change for people and the environment The table below looks in more detail at the implications of the impacts described above without any adaptation measures being used. The impacts are colour coded using the same key as above. 10% probability (90% chance that climate change will result in higher temperatures and increased precipitation)
Impacts without adaptation Implications
Small increases in temperature are not expected to have any significant impacts
Higher temperatures may lead to slightly greater biomass production
Lower rainfall affects the water table. Wetland communities will be under stress especially in summer and autumn
Species diversity may decrease since some species will not be able to tolerate the drier conditions
Occasional spikes of contaminants and sudden changes in water quality caused by runoff following periods of heavy rain could affect sensitive species
Increased nutrient levels could favour some species over others, changing the species composition and, potentially reducing the biodiversity value of the swamps and fens
90% probability (10% chance that climate change will result in higher temperatures and increased precipitation)
Higher temperatures may affect biomass production in spring, summer and autumn
Greater biomass production may result in greater need for vegetation management, but any additional costs are likely to be negligible
Increased rainfall affects the water table resulting in qualitative changes in swamp and fen
Higher water table leads to slight changes in the species composition of areas of swamp and fen
Occasional spikes of contaminants and sudden changes in water quality caused by runoff following periods of heavy rain could affect sensitive species
Increased nutrient levels could favour some species over others, changing the species composition and, potentially reducing the biodiversity value of the swamps and fens
Change in flood risk
Potential loss of species which are not able to withstand unpredictable inundation
Decreased species diversity due to some species not being able to withstand unpredictable inundation
Adaptation options and responses If climate change has significant implications (whether positive or negative) for people and the environment then communities may adapt and respond. This response will depend upon the socio-economic context prevalent at the time. The table below looks at the adaptation measures available under each of four different socio-economic scenarios24. It also looks at whether or not these adaptation options are sufficient to alleviate adverse implications, or to make the most of opportunities associated with climate change for the use of the land for swamp and fen. The table uses a series of symbols to illustrate the key impacts: Adaptation measures: Opportunities: £ more investment use of new technology/techniques
24 A full description of the scenarios is given in Section 3 (or Annex 5).

Risk & Policy Analysts, Geckoella and Environment Systems
Page 139
change in activity move to more profitable activity
increase in activity (intensification) move to funding for environmental improvements
decrease in activity (extensification) application of existing skills 0 no adaptation taken (or needed) development of new skills
10% probability (90% chance that climate change will result in higher temperatures and increased precipitation) Implications without adaptation
Higher temperatures may lead to slightly greater biomass production, but increased nutrient concentrations (and pollutants) that could be washed into the swamp and fen following periods of heavy rain could affect species composition. Species diversity will be decreased since some species will not be able to tolerate the drier conditions
Adaptation responses under…
World Markets Scenario
Provincial Enterprise Scenario
Global Sustainability Scenario
Local Stewardship Scenario
Adaptation actions
0 Land management activities such as grazing continue, otherwise swamp and fen habitats are allowed to adapt themselves to drier conditions. Occasional increase in pollutant levels may affect species diversity (especially more sensitive species)
Drier conditions make the land more suitable for grazing. Occasional increase in pollutant levels may affect species diversity (especially more sensitive species). This may be greater than under the other scenarios due to more intensive use of the land
£ Increased investment in land and water management to help maintain diversity in the swamp/fen as far as possible. Influx of pollutants due to runoff may be managed by more sustainable land use around areas of swamp and fen
£ High priority placed on maintaining these habitats for their GHG management, biodiversity and tourism potential. Influx of pollutants due to runoff may be managed by more sustainable land use around areas of swamp and fen
Opportunities Contributions to membership-based conservation organisations are used to help manage the transition and to maintain opportunities for species-rich communities
Opportunity to increase use of the area for grazing, with change in feature to grassland
Potential to obtain low productive land for enhancement, including through grazing of the swamp and fen, but potential may be limited by water availability
Local agri-environment funding prioritises wetlands and management of wetlands, such as through grazing. Opportunity to open up nature reserves for visitors to generate income to help support conservation activities
After adaptation – changes in land use
May be change away from swamp/fen towards wet grassland, but
Change of drier areas of swamp/fen to wet grassland
No signification change in area (water limits potential to expand the
No significant change in area. May be increased disturbance, but reduction in peat

Storyline for Swamp and Fen
Page 140
also potentially to peat extraction
habitat), but reduction in peat extraction means some areas of swamp/fen remain that would otherwise have been extracted
extraction means some areas of swamp/fen remain that would otherwise have been extracted
After adaptation – environmental changes
There is a change in the community, but management by conservation organisation (funded by their members) helps pay to maintain species-rich communities. However, there may be an increase in habitat fragmentation
Loss of swamp/fen species, potential to be replaced with wet grassland such that fragmentation of swamp/fen increases (but wet grassland decreases), but drier conditions and use of grazing activities that do not consider the environment may mean the wet grassland is species-poor
Drier conditions may make it more difficult to maintain the swamp/fen habitats. If so, it is likely that there would be a change to wet grassland of high value for wildlife (although this will take time to become established), with loss of connectivity between swamp/fen habitats.
Drier conditions may make it more difficult to maintain the habitats and may favour some species over others. This is likely to increase fragmentation of swamp and fen habitats
After adaptation – socio-economic changes
Unlikely to be a significant change
Increase in activity may support more farming jobs, at the expense of conservation jobs
May create new conservation jobs, although the number is likely to be small (and much of the work may be done by volunteers)
New jobs may be created associated with conservation management
90% probability (10% chance that climate change will result in higher temperatures and increased precipitation) Implications without adaptation
Greater biomass production may result in greater need for vegetation management, but any additional costs are likely to be negligible Higher water table leads to slight changes in the species composition of areas of swamp and fen. Higher water tables could also affect the extent to which swamp and fen can be grazed. Risk of runoff bringing nutrients and pollutants that could have implications for the species composition
Adaptation responses under…
World Markets Scenario
Provincial Enterprise Scenario
Global Sustainability Scenario
Local Stewardship Scenario
Adaptation actions
£ Investment in management to maintain species diversity through grazing where appropriate, but may be slight change in composition due to higher water tables and
0 Areas of grassland become too wet and are abandoned with potential for move to wet woodland or deep swamp conditions. No grazing is undertaken. No
£ Investment in management to maintain variety of swamp and fen species through grazing where appropriate, potentially through different water regimes in different locations.
£ High priority placed on maintaining a variety of swamp and fen habitats. Careful management through grazing where appropriate of land around watercourses to

Risk & Policy Analysts, Geckoella and Environment Systems
Page 141
impacts of nutrients and pollutants washed into swamp/fen following periods of heavy rain
adaptation measures taken. There may be opportunities for development of new wetland habitats, but these will be unmanaged
Careful management of land around watercourses to minimise loss of nutrients following heavy rain
minimise loss of nutrients following heavy rain
Opportunities Wetter conditions offer opportunities to extend the range of swamp and fen. Conservation organisations able to buy land of low productivity and manage for conservation purposes
None Wetter conditions mean swamp and fen are likely to be abandoned (and may change species composition, e.g. to wet woodland)
and Wetter conditions offer opportunities to extend the range of swamp and fen, from grassland and avoidance of peat extraction. Agri-environment payments help landowners move into land management for biodiversity, with some grazing continuing on swamp and fen
and Opportunity to expand swamp and fen habitats (mainly from grassland becoming too wet) and open up areas for visitors to generate income to help support conservation activities, with some grazing continuing on swamp and fen
After adaptation – changes in land use
Potential for increase in area covered by swamp and fen, replacing areas of dry grassland
Gradual change in species composition to those preferring higher water tables, with loss of grassland and wet heath due to wetter conditions
Potential for significant increase in area covered by swamp and fen as land currently under other features, especially grassland, becomes more difficult to farm or manage
Potential for significant increase in area covered by swamp and fen, and to use water management to provide different water depths as land currently under other features, especially grassland, becomes more difficult to farm or manage
After adaptation – environmental changes
Potential for increase in environmental value (although this will depend on the land that is purchased and the management regime used and if a variety of water table conditions can be maintained). Over time, increase in
Reduction in biodiversity as more vigorous species out compete and dominate, especially where nutrients are washed into the swamp/fen from surrounding intensively farmed land. This may increase fragmentation of
Potential for increase in environmental value (although this will depend on the current features that will change and how the water regime is managed). Over time (as swamp and fen habitats become established over a larger area),
Potential for increase in environmental value (although this will depend on the current features that will change and if there is a varied management of the water regime). Over time (as swamp and fen habitats become established over a

Storyline for Swamp and Fen
Page 142
swamp and fen should reduce habitat fragmentation
higher quality swamp and fen habitats
habitat fragmentation will decrease
larger area), habitat fragmentation will decrease
After adaptation – socio-economic changes
Potential to create new jobs in land and water management
Loss of conservation or land management jobs
Potential to replace lost agricultural jobs through land management, making use of the existing skills of landowners/ farmers
Potential to create new jobs associated with wildlife tourism, as well as replacing lost agricultural jobs with land management ones
Summary of Changes in Land Use following Adaptation The table below shows the projected change in area of wet grassland of high value for wildlife, taking account of adaptation measures. The degree of uncertainty in the projected changes is highlighted using the following colour codings: projected change is based on data: projected change is based on the likely trend: projected change is estimated/derived from limited information: ; and projected change is not known (guesstimate):
Scenario World Markets
Scenario
Provincial Enterprise Scenario
Global Sustainability
Scenario
Local Stewardship
Scenario
Current area 158 ha 158 ha 158 ha 158 ha
Probability (where the change could range from that shown for the 10% and 90% probabilities)
Change due to: 10% 90% 10% 90% 10% 90% 10% 90%
Temperature 0 ha 0 ha 0 ha 0 ha 0 ha 0 ha 0 ha 0 ha
Precipitation (water table) and/or freshwater flooding
+12 ha +500
ha -24 ha
+1,700 ha
+190 ha
+2,000 ha
+85 ha +2,500
ha
It is important to remember that there is a 90% chance that the climate change effects will be greater than those described on the 10% probability, and that there is a 10% chance that the climate change effects will be lower than those described under the 90% probability.

Risk & Policy Analysts, Geckoella and Environment Systems
Page 143
Wet grassland of high value for wildlife Current use (baseline) Wet grassland of high value for wildlife makes up 10% of the current land use covering 953 ha. The area of wet grassland is an essential part of the largest lowland wet grassland remaining in England. The wet grassland is used to graze beef and dairy livestock, with around 5% (48 ha used for dairy farming) and 95% (905 ha) used for beef finishing. The wet grassland of high wildlife value could support around 46 livestock farming FTE jobs (4 dairy and 42 beef) and provides annual income of around £470,000 (assuming a premium of 20% is payable for meat from animals grazed on wet grassland of high value for wildlife), although the land is managed to deliver multi-benefits with agri-environment payments used to offset reductions in yield and output due to extensive land management. This feature includes two distinct sub-features:
Raised Water Level Areas (RWLA), generally managed for wetland birds (breeding waders and overwintering waterfowl); and
flower-rich wet meadows, supporting Marsh-marigold Caltha palustris and Southern Marsh Orchid Dactylorhiza praetermissa
The current grassland regime requires lower water levels in winter (achieved by pumping) and higher water levels in summer (by impounding water in the major rivers and diverting it into rhynes). This feature also requires intensive land management with very specific grazing and cutting regimes. Issues with drainage, undergrazing and under-management mean that around 84% of wet grassland in SSSIs is unfavourable, but expected to recover its biodiversity value due to planned state-funded management. Impacts of climate change The graph shows changes in temperature and precipitation under the high emissions scenario, by season. 0.0
0.5
1.0
1.5
2.0
2.5
3.0
3.5
4.0
4.5
5.0
5.5
0% 10% 20% 30% 40% 50% 60% 70% 80% 90% 100%
Probability (High Emissions)
Ch
ang
e in
Tem
pe
ratu
re (
°C)
-50%
-40%
-30%
-20%
-10%
0%
10%
20%
30%
Ch
ang
e in
Pre
cip
ita
tio
n (
%)
Precipitation: Spring
Precipitation: Summer
Precipitation: Autumn
Precipitation: Winter
Temperature Spring
Temperature: Summer
Temperature: Autumn
Temperature: Winter
Change in Temperature and Precipitation : High Emissions

Storyline for Wet Grassland of High Value for Wildlife
Page 144
The table below uses thresholds to identify the impacts on wet grassland of high value for wildlife under the high emissions scenario, based on how temperature, precipitation and flooding change with time at the 10% and 90% probability levels. The impacts are colour coded as follows: significant negative impacts: medium/unknown negative impacts: low/negligible impacts: medium/unknown positive impacts: ; and significant positive impacts: Change Thresholds Impacts without adaptation
Combination of change in temperature and precipitation could result in:
10% probability: o no impacts from change
in temperature Change in temperature
Longer growing seasons Competitive / woody species growth
rates increase through temperature / silt loading effects
Breeding waders vulnerable to phenological miscues
Winter birds may over-winter closer to breeding grounds
o Lowering of water table results in reduced biomass, effects on RWLA birds, qualitative change in flower-rich wet meadows
90% probability: o Increased temperatures
in spring, summer and autumn could cause stress to livestock
o Increased temperatures and rainfall could increase biomass production…
Change in rainfall
Lower water table levels (with higher temperature and reduced precipitation) favour dryland species
Increased productivity (depending on water table management)
Flower-rich wet meadows (e.g. MG8) vulnerable to water table changes and unpredictable inundation. Hard to restore once changed
Increased precipitation initially increases productivity, but then grasslands become less productive and move towards swamp and fen
Breeding waders vulnerable to changes in habitat structure and hydrology
…but too much of an increase could move wet grasslands towards swamp and fen.
Change in freshwater flood risk
Increased runoff following periods of heavy rain
Increased risk of short duration flooding linked to increase in rainfall (90% probability)
Runoff could bring high levels of nutrients and pollutants washed from farmland that could affect competition between grassland species (and could result in changes similar to agricultural improvements)
Deep flooding in early spring/ summer could reduce species richness and/or result in a move towards species more typical of swamp and fen

Risk & Policy Analysts, Geckoella and Environment Systems
Page 145
10% probability: o Unlikely to be significant
changes
Other impacts
Risk of increased diseases, pests, invasive species
90% probability: o Increased temperatures
may enable pests to survive (with particular impacts for livestock)
Implications of climate change for people and the environment The table below looks in more detail at the implications of the impacts described above without any adaptation measures being used. The impacts are colour coded using the same key as above. 10% probability (90% chance that climate change will result in higher temperatures and increased precipitation)
Impacts without adaptation Implications
Reduces value of grass for livestock, reducing yields from livestock (or reductions in stocking numbers) and/or costs associated with providing additional feed. If forage area needs to increase by 1/3, the gross margin lost would be £84/ha for summer beef finishing or £460/ha for dairy farming. Over the 953 ha of wet grassland, this could result in annual lost income of £76,000 (beef) and £22,000 (dairy), a total of £98,000 per year. This could result in the loss of 2.5 agricultural (FTE) jobs
Reduces botanical diversity within the grassland, increases GHG emissions
Lowering of water table results in reduced biomass, effects on RWLA birds, qualitative change in flower-rich wet meadows
Impacts on breeding waders with reduced availability of invertebrates for chicks to feed on. Relationship between grassland and waterbody (ditches, wet scrapes etc.), which is important to breeding wader success becomes difficult to maintain in Spring and Summer, including provision of wet fences / water to manage stock. Cumulative water table lowering may also make winter splash harder to maintain – depends on recharge. May also be impacts in terms of ability to retain wet fences
Runoff could bring high levels of nutrients and pollutants washed from farmland that could affect competition between grassland species
Increased nutrients could result in changes in species composition similar to those resulting from agricultural improvements. This will be more of an issue for flower-rich meadows than for RWLA grasslands.
90% probability (10% chance that climate change will result in higher temperatures and increased precipitation) Increased temperatures in spring, summer and autumn could cause stress to livestock
Heat stress could be reduced by keeping livestock on cooler, damper fields during

Storyline for Wet Grassland of High Value for Wildlife
Page 146
the summer
Increased temperatures and rainfall could increase biomass production…
Increases competition between species and may result in some less competitive grassland species being outcompeted. This is more of an issue for flower-rich meadows than RWLA grassland.
Reduces potential use of the land for livestock grazing. If sales of products from the land were the only income to farmers, this would have a significant effect on incomes with losses of up to £336/ha summer finishing (for beef) or £1,849/ha for dairy cows. This is equivalent to annual lost income of £89,000 (dairy) and £300,000 (beef), a total of £390,000 per year. This could result in the loss of the 46 jobs directly supported by agriculture. Agri-environment payments may help to reduce the reduction in incomes. Declining income from conservation management may either need to be compensated for from state/private funds, or decline in quality/extent of feature would result.
Reduces botanical interest (the potential loss of MG8 grassland would be of national significance). Also reduces invertebrate interest for wet grassland species, which in turn can be important for lowland breeding waders.
…but too much of an increase could move wet grasslands towards swamp and fen
…but creates new swamp and fen habitats. These may however take time to mature to support a full range of species. Overall, the biodiversity value of existing wet grassland habitats would decrease.
Increased temperatures may enable pests to survive (with particular impacts for livestock)
Increases in pests and diseases could affect livestock mortality (including the risk of the need for culling if certain diseases are contracted). It could also increase veterinary costs, testing costs, etc.
Runoff could bring high levels of nutrients and pollutants washed from farmland that could affect competition between grassland species
Increased nutrients could result in changes in species composition similar to those resulting from agricultural improvements. This is more of an issue for flower-rich meadows than RWLA grassland
Change in flood risk
More frequent / prolonged flooding could have significant consequences for stock, productivity, breeding wader populations and flower-rich wet meadow communities
Breeding waders have very specific habitat requirements that are currently mainly delivered in RWLA. Flower-rich wet meadows have different, but also very exacting water table and land-management requirements. The SL&M are a floodplain habitat, and periodic inundation is a natural part of the ecosystem. However, prolonged or very frequent flooding can have adverse effects.

Risk & Policy Analysts, Geckoella and Environment Systems
Page 147
Adaptation options and responses If climate change has significant implications (whether positive or negative) for people and the environment then communities may adapt and respond. This response will depend upon the socio-economic context prevalent at the time. The table below looks at the adaptation measures available under each of four different socio-economic scenarios25. It also looks at whether or not these adaptation options are sufficient to alleviate adverse implications, or to make the most of opportunities associated with climate change for the use of the land for wet grassland of high value for wildlife. The table uses a series of symbols to illustrate the key impacts: Adaptation measures: Opportunities: £ more investment use of new technology/techniques
change in activity move to more profitable activity
increase in activity (intensification) move to funding for environmental improvements
decrease in activity (extensification) application of existing skills 0 no adaptation taken (or needed) development of new skills
10% probability (90% chance that climate change will result in higher temperatures and increased precipitation) Implications without adaptation
Reduces value of grass, yields or stock numbers. Over the 953 ha of wet grassland, this could result in annual lost income of £98,000 per year. This could result in the loss of 2.5 agricultural FTE jobs. Reduces botanical diversity within the grassland, and impacts on breeding waders. Cumulative water table lowering may make winter splash harder to maintain. Occasional runoff following heavy rain could bring increased levels of nutrients onto the grassland and could change the species composition. The value of other wetlands is important to the value of the Brue Valley. However, profile of, and funding for, conservation management of Somerset Levels and Moors, including Brue Valley, may increase as other sites are effectively lost.
Adaptation responses under…
World Markets Scenario
Provincial Enterprise Scenario
Global Sustainability Scenario
Local Stewardship Scenario
Adaptation actions
Reduction in yields of grass likely to lead to extensification, with impacts for management of grasslands. Profits could be maintained by promoting conservation products (dairy, beef)
Intensification through addition of fertiliser to improve the grassland and take advantage of drier conditions to increase livestock densities (as far as the nutrient quality of the improved grassland will allow)
Reduction in yields of grass likely to lead to extensification, and reductions in livestock numbers, sustainable floodplain management at the landscape scale
Move to more mixed farming, providing a balance of feed for livestock to counteract any reductions in biomass as a result of drier conditions. Water management on local scale may help maintain some areas of
25 A full description of the scenarios is given in Section 3 (and Annex 5).

Storyline for Wet Grassland of High Value for Wildlife
Page 148
wetter grassland
Opportunities Potential use of agri-environment payments or organic farming to enable additional management needed to maintain biodiversity and quality of grassland
Improvement of grassland, allowing intensification to take place, resulting in some loss of areas of high wildlife value
Use of agri-environment payments to help maintain the biodiversity value of the grasslands; new conservation objectives / techniques to make the most of the new conditions. Drier conditions mean some wet grassland is converted to dry grassland
Development of new skills to maximise output from grassland while maintaining the environmental quality in drier conditions
After adaptation – changes in land use
Continued use of land for livestock grazing unless nutrient value falls too low for dairy/beef farming to be profitable, with little or no loss of wet grassland of high value for wildlife, but qualitative decline / increased management costs. Drier conditions result in some swamp and fen converting to wet grassland
Move to more intensive use of grassland (for cereals, dairy, silage, peat extraction) with loss of areas of wet grassland of high value for wildlife located outside SSSIs; decline in quality of feature within SSSIs
Continued use of land for grazing with additional management to help maintain environmental quality. Some change in feature / area, but overall conservation value maintained within the Brue Valley
Moved to mixed farming. High priority accorded to conservation would lead to local protection of most areas, especially within SSSIs. However, management may be patchy (and expensive); around 20% of the area outside the SSSIs may be lost or decline in quality26
After adaptation – environmental changes
May be reduction in biodiversity due to drier conditions that may not be addressed by increased investment in water management. Environmental benefits arising from extensification. Unlikely to be significant
Significant decrease in the biodiversity value of the grassland, potentially to species-poor dry grassland. Increase in habitat fragmentation and may be sharper transition between areas of high environmental quality and
Although agri-environment payments and sustainable floodplain management should help conserve the feature overall, this scenario can reasonably include around 25% by area reducing in quality.
Patchy, localised gains and losses – some areas delivering more high value services, others delivering less. Localised impacts may result in an increase in habitat fragmentation
26 Based on average land use on mixed farm (from Defra Farm Accounts 2009/10 for average
mixed farm).

Risk & Policy Analysts, Geckoella and Environment Systems
Page 149
impacts on habitat fragmentation
surrounding, intensively farmed land
Landscape-scale floodplain management may however better link remaining areas to each other, and to other habitats.
After adaptation – socio-economic changes
Possible loss of jobs, although agri-environment payments and move to organic may mean that costs covering additional management could be used to provide new (land management) jobs
May be some loss of farming jobs associated with this feature, but these may be outweighed by new jobs associated with features that increase in area. New jobs could be created if more livestock are supported on the farm
May be loss of some agricultural jobs, but these may be replaced (at least in part) by land/water management jobs related to conservation of the highest quality areas of wet grassland
Move to mixed farming likely to support existing jobs, although there may be some decreases where the move is from dairy to mixed farming (around 3 jobs lost per 100 ha converted from dairy to mixed, 1 job created per 100 ha converted from beef to mixed). Opportunities for conservation / volunteer work.
90% probability (10% chance that climate change will result in higher temperatures and increased precipitation) Implications without adaptation
Reduces potential use of the land for livestock grazing. If sales of products from the land were the only income to farmers, this would have a significant effect on incomes with losses of up £390,000 per year. Agri-environment payments may help to reduce the reduction in incomes. Veterinary costs may increase with increased risk of disease/pests. Declining income from conservation management may either need to be compensated for from state/private funds, or decline in quality/extent of feature would result. Increased rainfall and increased risk of short duration flooding increasing competition and reduction in the botanical interest for wet grassland species…but there is the potential for new swamp and fen habitats. Overall, the biodiversity value would decrease. The potential loss of MG8 grassland would be of national significance.
Adaptation responses under…
World Markets Scenario
Provincial Enterprise Scenario
Global Sustainability Scenario
Local Stewardship Scenario
Adaptation actions
£ More investment in water management and drainage to help maintain land for livestock grazing/ silage production and biodiversity
Look for new approaches to farming in much wetter environment or focus of effort onto smaller areas of land that are easier to drain (with those areas being drained and farmed more intensively)
Move to land uses that are more resistant to wetter conditions, with sustainable floodplain management to provide grazing areas where this is possible
£ and Wetter conditions need local investment in water management, but overall there is a reduction in grazing activity

Storyline for Wet Grassland of High Value for Wildlife
Page 150
Opportunities Use of agri-environment payments to help maintain management of land for biodiversity value, where possible, selling products as organic to maximise profits
Application of existing skills to more intensively drain and farm land where it is most profitable to do so. Other areas would be abandoned
Agri-environment payments used to help deliver environmental benefits. There may be the potential for much greater change if the area is converted to a naturally functioning wetland
Investigation into potential for new crops (e.g. watercress) as soils become increasingly waterlogged
After adaptation – changes in land use
Investment in water management maintains feature, and is part paid for through higher profits from organic produce and agri-environment payments. Some dry grassland becomes much wetter extending area of the feature
Increased drainage of land where the least investment is required. Change to swamp/fen where it is not profitable to drain and farm
Change in land use in some areas, others maintained where water table allows, change may include increase in wet grassland from areas previously under arable or dry grassland
Change to grasses that grow better under increasingly waterlogged conditions. Reduction in livestock numbers per hectare, but wetter conditions mean increase in wet grassland (from dry grassland)
After adaptation – environmental changes
Little or no change providing water management costs do not exceed profits available from organic sales, but production of hay could be expensive and more difficult in wetter conditions. No significant impacts in terms of habitat fragmentation
Loss of wet grassland biodiversity, replacement with swamp/fen and loss of all wet grassland of high value for wildlife located outside SSSIs; decline in quality of feature within SSSIs as it becomes more expensive for conservation organisations to manage the grassland and knock-on effects from adjacent areas. Potential for significant increase in habitat fragmentation and loss of networks/ connectivity of areas of higher environmental
Management of land maintained through agri-environment payments, but likely to be localised changes in species composition (away from species-rich and breeding wader grassland to more swamp/fen conditions). This is expected to affect around 50% of the wet grassland (with potential to move to a naturally functioning wetland), both inside and outside of SSSIs. However, some gains in wet grassland area,
Reduction in grazing and increased waterlogging will change species composition (away from MG8 grassland to more swamp/fen conditions as it becomes more and more expensive to retain areas of wet grassland. In time, all wet grassland outside SSSIs would be affected, the quality of wet grassland in SSSIs would be reduced.

Risk & Policy Analysts, Geckoella and Environment Systems
Page 151
quality from dry features, may compensate in part. Landscape-scale management could mean that habitat fragmentation decreases
After adaptation – socio-economic changes
Possible increase in jobs as a result of increase in area, but this may be associated more with conservation and land management than farming
Likely to be reduction in jobs due to reduction in area that is farmed
May be loss of some agricultural jobs, but these may be replaced by land/water management jobs supported by agri-environment payments
Increase in number of jobs possible, although these may be associated with new approaches to land management
Summary of Changes in Land Use following Adaptation The table below shows the projected change in area of wet grassland of high value for wildlife, taking account of adaptation measures. The degree of uncertainty in the projected changes is highlighted using the following colour codings: projected change is based on data: projected change is based on the likely trend: projected change is estimated/derived from limited information: ; and projected change is not known (guesstimate):
Scenario World Markets
Scenario
Provincial Enterprise Scenario
Global Sustainability
Scenario
Local Stewardship
Scenario
Current area 953 ha 953 ha 953 ha 953 ha
Probability (where the change could range from that shown for the 10% and 90% probabilities)
Change due to: 10% 90% 10% 90% 10% 90% 10% 90%
Temperature 0 ha 0 ha 0 ha 0 ha 0 ha 0 ha 0 ha 0 ha
Precipitation (water table) and/or freshwater flooding
0 ha +430
ha -380 ha -240ha -40 ha
+870 ha
-130 ha +660
ha
It is important to remember that there is a 90% chance that the climate change effects will be greater than those described on the 10% probability, and that there is a 10% chance that the climate change effects will be lower than those described under the 90% probability.
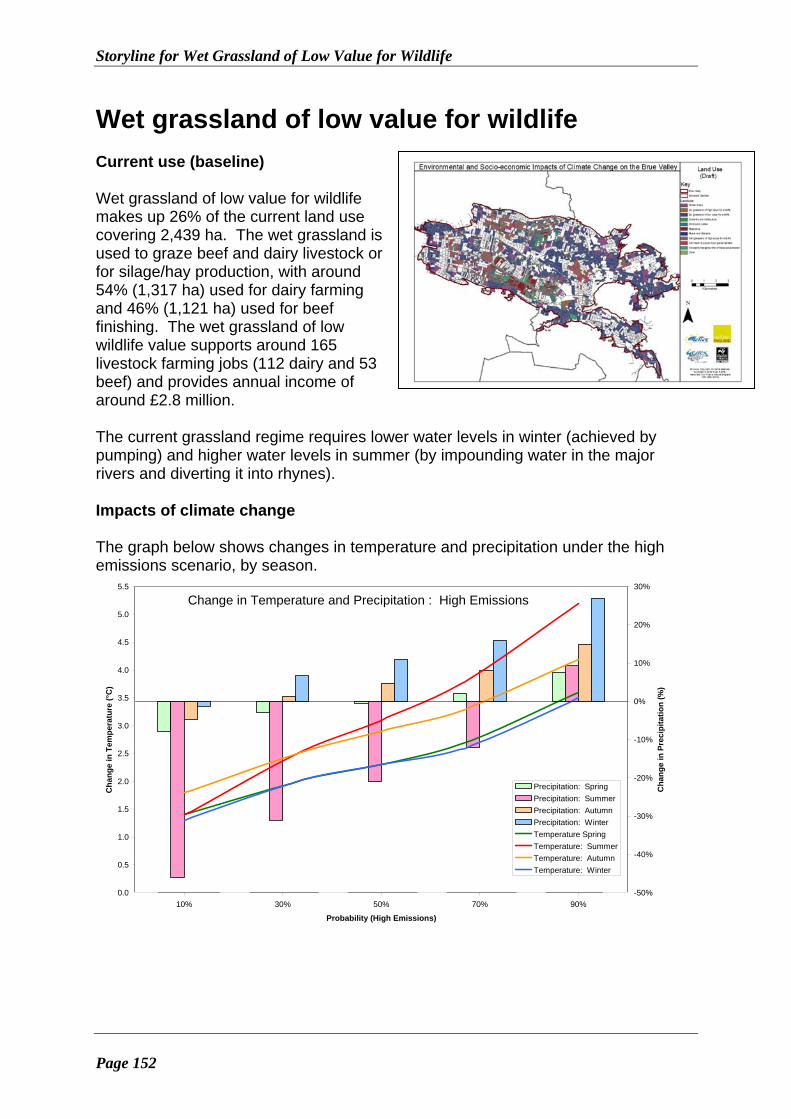
Storyline for Wet Grassland of Low Value for Wildlife
Page 152
Wet grassland of low value for wildlife Current use (baseline) Wet grassland of low value for wildlife makes up 26% of the current land use covering 2,439 ha. The wet grassland is used to graze beef and dairy livestock or for silage/hay production, with around 54% (1,317 ha) used for dairy farming and 46% (1,121 ha) used for beef finishing. The wet grassland of low wildlife value supports around 165 livestock farming jobs (112 dairy and 53 beef) and provides annual income of around £2.8 million. The current grassland regime requires lower water levels in winter (achieved by pumping) and higher water levels in summer (by impounding water in the major rivers and diverting it into rhynes). Impacts of climate change The graph below shows changes in temperature and precipitation under the high emissions scenario, by season.
0.0
0.5
1.0
1.5
2.0
2.5
3.0
3.5
4.0
4.5
5.0
5.5
0% 10% 20% 30% 40% 50% 60% 70% 80% 90% 100%
Probability (High Emissions)
Ch
ang
e in
Tem
per
atu
re (
°C)
-50%
-40%
-30%
-20%
-10%
0%
10%
20%
30%
Ch
ang
e in
Pre
cip
itat
ion
(%
)
Precipitation: Spring
Precipitation: Summer
Precipitation: Autumn
Precipitation: Winter
Temperature Spring
Temperature: Summer
Temperature: Autumn
Temperature: Winter
Change in Temperature and Precipitation : High Emissions

Risk & Policy Analysts, Geckoella and Environment Systems
Page 153
The table below uses thresholds to identify the impacts on wet grassland of low value for wildlife under the high emissions scenario, based on how temperature, precipitation and flooding change with time at the 10% and 90% probability levels. The impacts are colour coded as follows: significant negative impacts: medium/unknown negative impacts: low/negligible impacts: medium/unknown positive impacts: ; and significant positive impacts: Change Thresholds Impacts without adaptation
Combination of change in temperature and precipitation could result in:
10% probability: o no impacts from change
in temperature
Change in temperature
Longer growing seasons Competitive / woody species growth
rates increase through temperature / silt loading effects
o Lowering of water table results in reduced biomass
90% probability: o Increased temperatures
in spring, summer and autumn could cause stress to livestock
o Increased temperatures and rainfall could increase biomass production…
Change in rainfall
Lower water levels (with higher temperature and reduced precipitation)
Increased run-off from high intensity rainfall
Community change to annuals over perennials due to summer droughts
Increased productivity (depending on water table management)
Increased precipitation would lead to grasslands becoming much less productive and move towards swamp and fen
…but too much of an increase could move wet grasslands towards swamp and fen.
Change in freshwater flood risk
Increased runoff following periods of heavy rain
Increased risk of short duration flooding linked to increase in rainfall (90% probability)
Runoff could bring high levels of nutrients and pollutants washed from neighbouring farmland
Deep flooding in early spring/ summer could restrict farming, and, if prolonged, result in a move towards species more typical of swamp and fen (although it may offer temporary habitat for wetland birds and spring/summer splash could be beneficial)
10% probability: o Unlikely to be significant
changes Other impacts
Risk of increased diseases and pests
90% probability: o Increased temperatures
may enable pests to survive (with particular impacts for livestock)

Storyline for Wet Grassland of Low Value for Wildlife
Page 154
Agriculture on wetlands gains competitive edge if water becomes nationally scarce
10% probability: o Profit margin for
agriculture in the Brue Valley increases
Implications of climate change for people and the environment The table below looks in more detail at the implications of the impacts described above without any adaptation measures being used. The impacts are colour coded using the same key as above. 10% probability (90% chance that climate change will result in higher temperatures and increased precipitation)
Impacts without adaptation Implications
Reduces value of grass for livestock, reducing yields from livestock (or reductions in stocking numbers) and/or costs associated with providing additional feed. If forage area needs to increase by 1/3, the gross margin lost would be £84/ha for summer beef finishing or £460/ha for dairy farming. Over the 2,439 ha of wet grassland, this could result in annual lost income of £94,000 (beef) and £610,000 (dairy), a total of £700,000 per year. This could result in the loss of 18 agricultural jobs. Greenhouse gas emissions increase as water table drops
Lowering of water table results in reduced biomass
…but agriculture on wetlands gains competitive edge if water becomes nationally scarce with increase in profit margins for Brue Valley. The potential for such benefits might be limited in drier years when it becomes more difficult to maintain wet fences
Flooding washes fertilisers, pesticides and soil from land, damages grasses and restricts farming. Temporary wetland habitats
Increase in biomass production due to nutrient deposition offsets losses due to leaching, reduction in biomass due to damaged grass crop, and costs of restricted farming. Temporary habitats for wetland birds
90% probability (10% chance that climate change will result in higher temperatures and increased precipitation)
Increased temperatures in spring, summer and autumn could cause stress to livestock
Heat stress could be reduced by keeping livestock on cooler, damper fields during the summer
Increased temperatures and rainfall could increase biomass production…
Increased agricultural productivity
…but too much of an increase could move wet grasslands towards swamp and fen (depending on evapo-transpiration balance – higher temperatures may reduce wetting effects of more rainfall)
Reduces potential use of the land for livestock grazing. This would have a significant effect on incomes for farmers with losses of up to £336/ha summer finishing (for beef) or £1,849/ha for dairy cows. This is equivalent to annual lost income of £2.4 million (dairy) and £380,000 (beef), a total of £2.8 million per year. This

Risk & Policy Analysts, Geckoella and Environment Systems
Page 155
could result in the loss of the 165 jobs directly supported by agriculture, plus a further 12 from knock-on effects27.
Flooding washes fertilisers, pesticides and soil from land, damages grasses and restricts farming. Temporary wetland habitats
Increase in biomass production due to nutrient deposition offsets losses due to leaching, reduction in biomass due to damaged grass crop, and costs of restricted farming. Temporary habitats for wetland birds
Increased temperatures may enable pests to survive (with particular impacts for livestock)
Increases in pests and diseases could affect livestock mortality (including the risk of the need for culling if certain diseases are contracted). It could also increase veterinary costs, testing costs, etc.
Adaptation options and responses If climate change has significant implications (whether positive or negative) for people and the environment then communities may adapt and respond. This response will depend upon the socio-economic context prevalent at the time. The table below looks at the adaptation measures available under each of four different socio-economic scenarios28. It also looks at whether or not these adaptation options are sufficient to alleviate adverse implications, or to make the most of opportunities associated with climate change for the use of the land for wet grassland of low value for wildlife. The table uses a series of symbols to illustrate the key impacts: Adaptation measures: Opportunities: £ more investment use of new technology/techniques
change in activity move to more profitable activity
increase in activity (intensification) move to funding for environmental improvements
decrease in activity (extensification) application of existing skills 0 no adaptation taken (or needed) development of new skills
27 Based on all agricultural jobs being lost due a reduction in income of £2.8 million, with knock-
on jobs lost estimated using Econ-i. 28 A full description of the scenarios is given in Section 3.2 (and Annex 5).

Storyline for Wet Grassland of Low Value for Wildlife
Page 156
10% probability (90% chance that climate change will result in higher temperatures and increased precipitation) Implications without adaptation
Reduces value of grass for livestock, reducing yields or stock numbers) and/or costs associated with providing additional feed. If forage area needs to increase by 1/3, the annual lost income could be £700,000 per year. This could result in the loss of 18 agricultural jobs…but agriculture on wetlands may also gain a competitive edge if water becomes nationally scarce with increase in profit margins for Brue Valley. Greenhouse gas emissions increase as water table drops. Increased risk of runoff following heavy rain could wash off nutrients from the grasslands, increasing management costs (or causing pollution elsewhere)
Adaptation responses under…
World Markets Scenario
Provincial Enterprise Scenario
Global Sustainability Scenario
Local Stewardship Scenario
Adaptation actions
Reduction in yields of grass likely to lead to extensification, with impacts for management of grasslands. Profits could be maintained by promoting conservation products (dairy, beef) and because of greater productivity in other areas
Intensification to maintain profits, conversion of some areas e.g. to arable, peat extraction. This could have impacts on adjacent features due to runoff following periods of heavy rainfall
Reduction in yields of grass likely to lead to extensification, and reductions in livestock numbers, sustainable floodplain management at the landscape scale
Move to more mixed farming, providing a balance of feed for livestock to counteract any reductions in biomass as a result of drier conditions. Water management on local scale may help maintain some areas of wetter grassland
Opportunities Potential use of agri-environment payments or organic farming to enable additional management needed to maintain environmental qualities of grassland
Increase in income (but loss of nutrients following heavy rainfall could increase management costs)
Use of agri-environment payments to help maintain the biodiversity value of the grasslands; new conservation objectives / techniques to make the most of the new conditions –changes in feature area.
Development of new skills to maximise output from grassland while maintaining the environmental quality in drier conditions
After adaptation – changes in land use
Continued use of land for livestock grazing, but some areas will be converted to cereal crops to help maximise profits
Move to more intensive use of land (for cereals, dairy, silage, peat extraction) with loss of much of the wet grassland of low value for wildlife
Continued use of land for grazing, but move to increasing biodiversity value and to drier grassland and woodland as part of wider floodplain restoration
Move to mixed farming, with maintenance of much of the grassland. Around 10% could be converted to cereals and 10% to horticulture
After adaptation – environmental
May be reduction in environmental
Decrease in the environmental
Agri-environment payments and
Likely to be move towards dry

Risk & Policy Analysts, Geckoella and Environment Systems
Page 157
changes services due to drier conditions that may not be addressed by increased investment in water management. This could increase fragmentation of habitats, especially higher quality habitats; environmental benefits arising from extensification.
value of the grassland, potentially to species-poor dry grassland (or cropland). This will result in increases in habitat fragmentation
sustainable floodplain management should help conserve the feature overall, although particular locations may change. Careful management could help reduce impacts associated with habitat fragmentation, for example, by increasing connectivity
grassland, but sensitive management may result in increase in biodiversity value (e.g. to species-rich dry grassland) on remaining grassland. Potential increase in habitat fragmentation
After adaptation – socio-economic changes
Possible loss of jobs, although agri-environment payments and move to organic may mean that costs covering additional management could be used to provide new (land management) jobs
Potential loss of jobs associated with wet grassland of low value for wildlife, but these could be more than replaced by gains in jobs associated with management of other features
May be loss of some agricultural jobs, but these may be replaced (at least in part) by land/water management jobs related to increasing the conservation value of the new and existing areas of wet grassland and other features
Move to mixed farming likely to support existing jobs, although there may be some decreases where the move is from dairy to mixed farming (around 3 jobs lost per 100 ha converted from dairy to mixed, 1 job created per 100 ha converted from beef to mixed)
90% probability (10% chance that climate change will result in higher temperatures and increased precipitation) Implications without adaptation
Increased agricultural productivity from higher temperatures, but increased rainfall and increased risk of flooding could change feature to swamp and fen, leading to reduction in potential use of the land for livestock grazing with potential lost income of £2.8 million per year. This could result in the loss of the 165 jobs directly supported by agriculture, plus a further 12 from knock-on effects29. Heat stress could be reduced by keeping livestock on cooler, damper fields during the summer. Increases in pests and diseases could affect livestock mortality and increase veterinary costs.
Adaptation responses under…
World Markets Scenario
Provincial Enterprise Scenario
Global Sustainability Scenario
Local Stewardship Scenario
Adaptation actions
£ More investment in water management and drainage to help maintain land for livestock grazing/ silage production
Look for new approaches to farming in much wetter environment or focus of effort
Move to land uses that are more appropriate to wetter conditions, with sustainable floodplain
£ and Wetter conditions need local investment in water management, but overall there is a
29 Based on all agricultural jobs being lost due a reduction in income of £2.8 million, with knock-
on jobs lost estimated using Econ-i.

Storyline for Wet Grassland of Low Value for Wildlife
Page 158
onto smaller areas of land that are easier to drain (with those areas being drained and farmed more intensively)
management to provide grazing areas where this is possible
reduction in grazing activity
Opportunities Use of agri-environment payments to help maintain management of land for biodiversity value, where possible, selling products as organic to maximise profits
Application of existing skills to more intensively drain and farm land where it is most profitable to do so. Other areas would be abandoned
Agri-environment payments used to help deliver environmental benefits. There may be the potential for much greater change if the area is converted to a naturally functioning wetland
Investigation into potential for new crops (e.g. watercress) as soils become increasing waterlogged
After adaptation – changes in land use
Investment in water management maintains feature, and is part paid for through higher profits from organic produce and agri-environment payments. Wetter conditions result in area of wet grassland being expanded, replacing dry grassland
Increased drainage of land where the least investment is required. Change to swamp/fen where it is not profitable to drain and farm, balanced to some extent by conversion of dry grassland to wet grassland.
Change in land use in some areas, others maintained where water table allows, change may include areas previously under arable or dry grassland. Where grassland becomes too wet, it becomes swamp and fen (but some may continue to be grazed)
Change to crops and grasses that grow better under increasingly waterlogged conditions. Reduction in livestock numbers. Where grassland becomes too wet, it becomes swamp and fen (but some may continue to be grazed) and some dry grassland will become wetter
After adaptation – environmental changes
Little or no change providing water management costs do not exceed profits available from sales. Overall, habitat fragmentation is not expected to change significantly
Loss of wet grassland, replacement with swamp/fen over at least 50% of the area, balanced to some extent by dry grassland becoming much wetter. Potential biodiversity benefits, but swamp/fen would not be managed. This could result in fragmentation of managed, higher quality habitats with
Management of land maintained through agri-environment payments, but likely to be a change in species composition (away from wet grassland to more swamp/fen conditions). This is expected to affect around 50% of the wet grassland (with potential to move to a naturally functioning wetland). This
Reduction in grazing, increased waterlogging and increased flood risk will change species composition, away from wet grassland to more swamp/fen conditions as it becomes more and more expensive to retain areas of wet grassland. In time, around 75% (1,829 ha) would be affected. This will increase fragmentation of

Risk & Policy Analysts, Geckoella and Environment Systems
Page 159
sharper transition between intensively farmed land and conservation land
will change habitat fragmentation: increased for wet grassland but reduced for swamp and fen
wet grassland, but reduce fragmentation of swamp and fen
After adaptation – socio-economic changes
Potential increase in jobs due to increase in area of feature
Likely to be reduction in jobs due to reduction in area that is farmed
May be loss of some agricultural jobs, but these may be replaced (at least in part) by land/water management jobs supported by agri-environment payments
Reduction in number of jobs likely, although new skills will develop with development of new approaches to land management (move away from dairy and grazing will overall result in loss of 2 jobs per 100 ha)
Summary of Changes in Land Use following Adaptation The table below shows the projected change in area of wet grassland of low value for wildlife, taking account of adaptation measures. The degree of uncertainty in the projected changes is highlighted using the following colour codings: projected change is based on data: projected change is based on the likely trend: projected change is estimated/derived from limited information: ; and projected change is not known (guesstimate):
Scenario World Markets
Scenario
Provincial Enterprise Scenario
Global Sustainability
Scenario
Local Stewardship
Scenario
Current area 2,439 ha 2,439 ha 2,439 ha 2,439 ha
Probability (where the change could range from that shown for the 10% and 90% probabilities)
Change due to: 10% 90% 10% 90% 10% 90% 10% 90%
Temperature 0 ha 0 ha 0 ha 0 ha 0 ha 0 ha 0 ha 0 ha
Precipitation (water table) and/or freshwater flooding
-650 ha +1,200
ha -1,500
ha +190ha
-1,100 ha
-1,100 ha
-1,300 ha
-1,500 ha
It is important to remember that there is a 90% chance that the climate change effects will be greater than those described on the 10% probability, and that there is a 10% chance that the climate change effects will be lower than those described under the 90% probability.
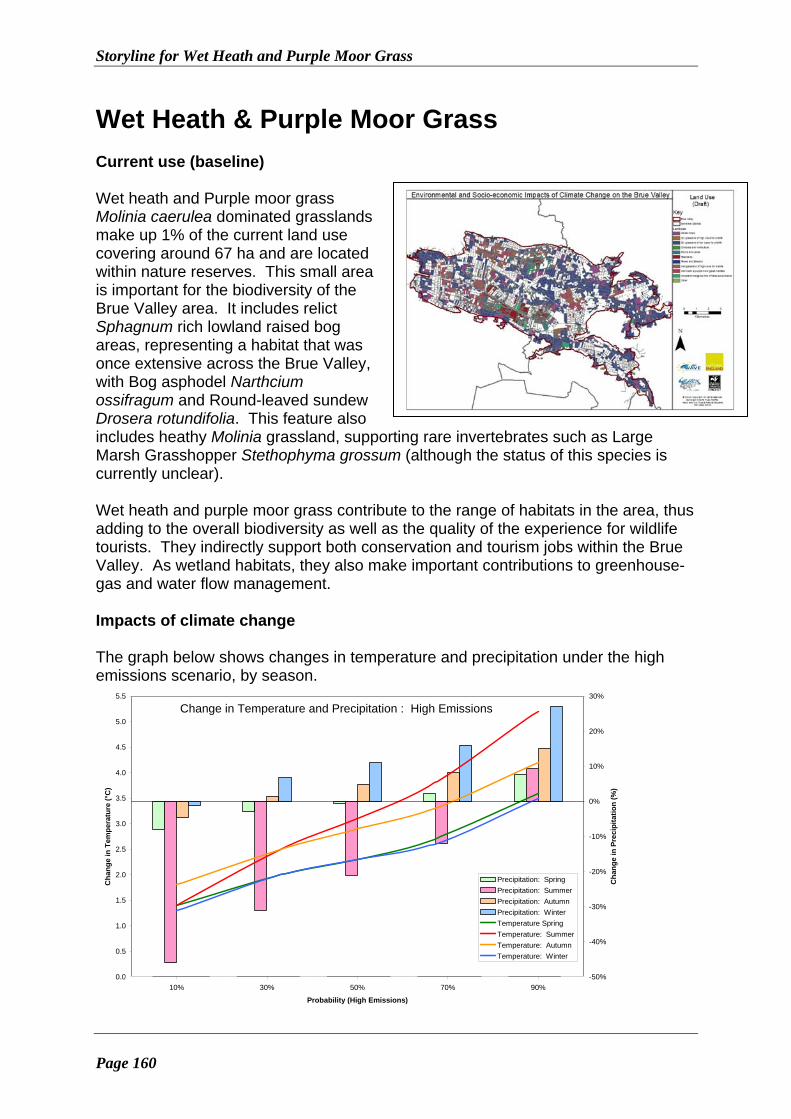
Storyline for Wet Heath and Purple Moor Grass
Page 160
Wet Heath & Purple Moor Grass Current use (baseline) Wet heath and Purple moor grass Molinia caerulea dominated grasslands make up 1% of the current land use covering around 67 ha and are located within nature reserves. This small area is important for the biodiversity of the Brue Valley area. It includes relict Sphagnum rich lowland raised bog areas, representing a habitat that was once extensive across the Brue Valley, with Bog asphodel Narthcium ossifragum and Round-leaved sundew Drosera rotundifolia. This feature also includes heathy Molinia grassland, supporting rare invertebrates such as Large Marsh Grasshopper Stethophyma grossum (although the status of this species is currently unclear). Wet heath and purple moor grass contribute to the range of habitats in the area, thus adding to the overall biodiversity as well as the quality of the experience for wildlife tourists. They indirectly support both conservation and tourism jobs within the Brue Valley. As wetland habitats, they also make important contributions to greenhouse-gas and water flow management. Impacts of climate change The graph below shows changes in temperature and precipitation under the high emissions scenario, by season.
0.0
0.5
1.0
1.5
2.0
2.5
3.0
3.5
4.0
4.5
5.0
5.5
0% 10% 20% 30% 40% 50% 60% 70% 80% 90% 100%
Probability (High Emissions)
Ch
an
ge
in T
emp
erat
ure
(°C
)
-50%
-40%
-30%
-20%
-10%
0%
10%
20%
30%
Ch
ang
e in
Pre
cip
ita
tio
n (
%)
Precipitation: Spring
Precipitation: Summer
Precipitation: Autumn
Precipitation: Winter
Temperature Spring
Temperature: Summer
Temperature: Autumn
Temperature: Winter
Change in Temperature and Precipitation : High Emissions

Risk & Policy Analysts, Geckoella and Environment Systems
Page 161
The table below uses thresholds to identify the impacts on wet heath and purple moor grass under the high emissions scenario, based on how temperature, precipitation and flooding change with time at the 10% and 90% probability levels. The impacts are colour coded as follows: significant negative impacts: medium/unknown negative impacts: low/negligible impacts: medium/unknown positive impacts: ; and significant positive impacts: Change Thresholds Impacts without adaptation
Combination of change in temperature and precipitation could result in:
10% probability: o slight temperature
increase has minimal effect on wet heath and purple moor grass Change in
temperature
Slight increases in temperature are likely to have little impact on wet heath and purple moor grass. Higher temperature increases may affect biomass production, particularly in spring, summer and autumn.
o decreased precipitation affects the water table with conditions being too dry for wet heath and purple moor grass for 1 year in 5. Wet heath and purple moor grass areas start to be dominated by plants which are more typical of dry habitats
90% probability: o higher temperatures
combined with wetter conditions lead to greater biomass production
Change in rainfall
Decreased precipitation (along with higher temperatures) leads to lower water levels, putting stress on wetland communities especially in summer and autumn. Wetter conditions help to support the habitat, and reduce scrub incursion, but too much water may change habitat to swamp / fen. Sphagnum mosses flourish when rainfall is between 700 and 1000 mm, and 150 and 175 rain days per annum.
o Wetter conditions help to support the habitat, and reduce scrub incursion, but too much water may change habitat to swamp / fen
Change in freshwater flood risk
Pluvial flooding caused by increased runoff, and fluvial flooding both change species composition and increase sedminent / nutrient deposits
Flooding and changed nutrient / toxin levels could favour some species over others, potentially reducing biodiversity value
Implications of climate change for people and the environment The table below looks in more detail at the implications of the impacts described above without any adaptation measures being used. The impacts are colour coded using the same key as above.

Storyline for Wet Heath and Purple Moor Grass
Page 162
10% probability (90% chance that climate change will result in higher temperatures and increased precipitation)
Impacts without adaptation Implications
Slight temperature increase has minimal effect on wet heath and purple moor grass
Minor changes in species composition/ growth
Decreased precipitation affects the water table with conditions being too dry for wet heath for 1 year in 5. Wet heath and purple moor grass areas start to be dominated by plants which are more typical of dry habitats
As areas of wet heath and purple moor grass become populated with plants from drier habitats, wet heath and purple moor grass communities and their associated species are lost from the Brue Valley. Management costs (cutting / grazing) increase. Greenhouse gas emissions increase. Water flow management function decreases
Increased sediment / nutrient / pollutant deposits and sudden changes in water quality caused by fluvial flooding could affect sensitive species. Potential scouring of habitat near watercourses from pluvial flooding.
Change in species composition. Wet heath is particularly vulnerable to fluvial sediment / pollutant deposition and fluctuating conditions. Potential move towards more purple moor grass, and eventual shift to scrub
90% probability (10% chance that climate change will result in higher temperatures and increased precipitation) Higher temperatures combined with wetter conditions lead to greater biomass production
Increased biomass may require greater management to avoid some species being outcompeted and lost from the area
Wetter conditions help to support the habitat, and reduce scrub incursion, but too much water may change habitat to swamp / fen
Habitat vulnerable to water table changes
Increased sediment / nutrient / pollutant deposits and sudden changes in water quality caused by fluvial flooding could affect the biodiversity value, especially if it encourages invasive species that out compete more typical wet heath species. Potential scouring of habitat near watercourses from pluvial flooding.
Wet heath particularly vulnerable to fluvial sediment / pollutant deposition and fluctuating conditions. Potential move towards more purple moor grass and eventual shift to wet scrub. Change in mineral content of water could also affect the quality of the habitat, especially where there is increased fluvial flood risk
Adaptation options and responses If climate change has significant implications (whether positive or negative) for people and the environment then communities may adapt and respond. This response will depend upon the socio-economic context prevalent at the time. The table below looks at the adaptation measures available under each of four different socio-economic scenarios30. It also looks at whether or not these adaptation options are sufficient to alleviate adverse implications, or to make the most of opportunities associated with climate change for the use of the land for wet heath. The table uses a series of symbols to illustrate the key impacts: Adaptation measures: Opportunities: £ more investment use of new technology/techniques
30 A full description of the scenarios is given in Section 3 (and Annex 5).

Risk & Policy Analysts, Geckoella and Environment Systems
Page 163
change in activity move to more profitable activity
increase in activity (intensification) move to funding for environmental improvements
decrease in activity (extensification) application of existing skills 0 no adaptation taken (or needed) development of new skills
10% probability (90% chance that climate change will result in higher temperatures and increased precipitation) Implications without adaptation
As areas of wet heath and purple moor grass become populated with plants from drier habitats, wet heath and purple moor grass communities and their associated species become rarer in the Brue Valley. This may be exacerbated by an increase in nutrients and pollutants washed into the wet heath and purple moor grass in runoff from surrounding fields following infrequent periods of heavy rain. Management costs (cutting / grazing) increase, greenhouse gas emissions increase and water flow management function decreases
Adaptation responses under…
World Markets Scenario
Provincial Enterprise Scenario
Global Sustainability Scenario
Local Stewardship Scenario
Adaptation actions
£ Increased investment in land and water management to help maintain the habitats. Occasional increase in pollutant levels may affect species diversity (with increased nutrient levels potentially favouring invasive species)
Drier conditions make the land more suitable for grazing. Occasional increase in pollutant levels may affect species diversity (especially more sensitive species). This may be greater than under the other scenarios due to more intensive use of the surrounding land
£ Increased investment in land and water management to help maintain the habitats as part of landscape-scale floodplain management. Influx of pollutants due to runoff may be managed by more sustainable land use around areas of wet heath and purple moor grass
£ High priority placed on maintenance of these habitats. Influx of pollutants due to runoff may be managed by more sustainable land use around areas of wet heath and purple moor grass
Opportunities Contributions to membership-based conservation organisations could be used to conserve the small areas of wet heath. Potential market development for ‘SSSI beef’.
Opportunity to use the area for intensive grazing, with change in feature to grassland. Some swamp/fen may change to this habitat through drying out.
Potential to obtain low quality agricultural land for conversion to wet heath or purple moor grass, but this may be limited by water availability. Potential market development for ‘SSSI beef’. Some swamp-fen could change to this habitat, other areas could be lost to grassland
Opportunity to develop wildlife-tourism income from visitors and locals, and markets for ‘SSSI-beef’ to generate income to help support conservation activities

Storyline for Wet Heath and Purple Moor Grass
Page 164
as the more naturally suitable habitat to the conditions.
After adaptation – changes in land use
No or little change providing there is sufficient water to maintain the habitats, and if nutrient-rich runoff can be directed away from areas of wet heath. Drier conditions may allow increased grazing
Loss of much of the wet heath and purple moor grass area depending on water-table / management changes for other features. Drier conditions may result in change to wet grassland and lack of management may result in encroachment of scrub
No signification change in area, although boundaries may change (general summer water-shortage limits potential to expand the habitat)
Drier conditions may result in some being converted to wet grassland, may be increased disturbance
After adaptation – environmental changes
May be a small decline in environmental quality in drier periods, but this will be managed (by membership-based conservation organisations) as far as possible. No impacts on habitat fragmentation
Loss of wet heath species, potential to be replaced with grassland, but drier conditions and intensification of activities may mean the grassland is species-poor. Increased fragmentation of remaining areas of feature and sharper transition from surrounding, more intensively farmed land
Drier conditions may make it more difficult to maintain the habitats. If so, it is likely that there would be a change to wet grassland (or dry grassland) of high value for wildlife, balanced by a change from swamp-fen to Molinia. Fragmentation decreases as floodplain scale management is favoured, with gradual transition between features
Drier conditions may make it more difficult to maintain the habitats, disturbance may also affect some species. This will result in increased habitat fragmentation
After adaptation – socio-economic changes
May create new conservation jobs, although the number is likely to be small
Increase in activity may support more farming jobs, at the expense of conservation jobs
May create new conservation jobs, although the number is likely to be small (and much of the work may be done by volunteers)
New jobs and volunteer opportunities may be created associated with recreation, tourism and conservation management (but likely to be small, due to small area of feature)
90% probability (10% chance that climate change will result in higher temperatures and increased precipitation) Implications without adaptation
Increased biomass may require greater management to avoid some species being outcompeted and lost from the area. Wet heath and purple moor grass habitats are vulnerable to water table changes. Risk of runoff bringing nutrients

Risk & Policy Analysts, Geckoella and Environment Systems
Page 165
and pollutants that could have implications for the species composition. Increased risk of short duration flooding, especially on more extreme rainfall events
Adaptation responses under…
World Markets Scenario
Provincial Enterprise Scenario
Global Sustainability Scenario
Local Stewardship Scenario
Adaptation actions
£ Investment in management to maintain wet heath and purple moor grass, but species composition may change due to impacts of nutrients and pollutants washed in following periods of heavy rain
0 Areas become too wet and are abandoned with potential for more vigorous species to take over. Some grassland areas change to purple moor grass habitat as conditions become wetter, but, unmanaged, these quickly revert to wet-scrub.
£ Investment in landscape-scale floodplain management to maintain wet heath and purple moor grass. Careful management of land around watercourses to minimise loss of nutrients following heavy rain. Some change in purple moor grass habitats depending on local hydro-topography.
£ High priority placed on maintaining wet heath habitats. Careful management of land around watercourses to minimise loss of nutrients following heavy rain
Opportunities Wetter conditions offer opportunities to extend the range of wetland habitats including purple moor grass habitat, and, in the long term, peatland restoration may be possible. Conservation organisations able to buy land of low productivity and manage for conservation purposes
None Habitat unmanaged develops into fen and finally wet woodland habitat.
and Wetter conditions offer opportunities to extend the range of wetland habitats as part of a landscape-scale restoration of natural floodplain function. Agri-environment payments help landowners move into land management for biodiversity and other environmental benefits
and Local communities value and expand wet heath and purple moor grass habitats and forms one of the attractions for visitors to generate income to help support conservation activities; ; local employment and volunteer involvement in nature reserve management;
After adaptation – changes in land use
Potential for increase in area covered by wet heath and purple moor grass, from grassland as conditions become wetter
Gradual loss of all wet heath and purple moor grass and conversion to swamp and fen and wet woodland type communities
Potential for increase in area covered by wet heath and purple moor grass as land currently under other features, especially dry grassland, becomes more difficult to farm or
Potential for increase in area covered by wet heath and purple moor grass as land currently under other features, especially dry grassland, becomes more difficult to farm or manage

Storyline for Wet Heath and Purple Moor Grass
Page 166
manage
After adaptation – environmental changes
Potential for increase in environmental value (although this will depend on the land that is purchased and the management regime used). This could reduce habitat fragmentation. It will also require nutrient-rich runoff to be directed away from areas of wet heath
Reduction in biodiversity as more vigorous species out compete and dominate, especially where nutrients are washed into the swamp/fen from surrounding intensively farmed land. Increased fragmentation of habitats and sharp transition from surrounding land uses
Potential for increase in environmental value (although this will depend on the current features that will change and be managed as wet heath and purple moor grass). Potential for significant reduction in habitat fragmentation
Potential for increase in environmental value (although this will depend on the current features that will change and be managed as wet heath and purple moor grass). Potential for significant reduction in habitat fragmentation
After adaptation – socio-economic changes
Potential to create a small number of new jobs in land and water management
Loss of a small number of conservation or land management jobs
Potential to replace lost agricultural jobs through land management, making use of the existing skills of landowners/ farmers (but likely to be small for wet heath)
Potential to create a small number of new jobs associated with recreation and tourism, as well as replacing lost agricultural jobs with land management ones
Summary of Changes in Land Use following Adaptation The table below shows the projected change in area of wet grassland of high value for wildlife, taking account of adaptation measures. The degree of uncertainty in the projected changes is highlighted using the following colour codings: projected change is based on data: projected change is based on the likely trend: projected change is estimated/derived from limited information: ; and projected change is not known (guesstimate):
Scenario World Markets
Scenario
Provincial Enterprise Scenario
Global Sustainability
Scenario
Local Stewardship
Scenario
Current area 67 ha 67 ha 67 ha 67 ha
Probability (where the change could range from that shown for the 10% and 90% probabilities)
Change due to: 10% 90% 10% 90% 10% 90% 10% 90%
Temperature 0 ha 0 ha 0 ha 0 ha 0 ha 0 ha 0 ha 0 ha
Precipitation (water table) and/or freshwater flooding
-14 ha +65 ha -67 ha -67 ha -7 ha +42 ha +1 ha +34 ha

Risk & Policy Analysts, Geckoella and Environment Systems
Page 167
It is important to remember that there is a 90% chance that the climate change effects will be greater than those described on the 10% probability, and that there is a 10% chance that the climate change effects will be lower than those described under the 90% probability.

Storyline for Woodland, Hedgerow, Line of Trees, Scrub, Bracken
Page 168
Woodland, Hedgerow, Line of Trees, Scrub, Bracken Current use (baseline) This feature makes up 4% of the current land use covering 341 ha. Hedges, scrub and bracken are scattered around the Brue Valley. Wet woodland is present in areas previously used for peat extraction. Wet woodland has value as an adaptive feature for floodplain management. It helps to manage water flow, generally conserves peatlands, aids greenhouse gas balance, and is relatively easy to manage. In addition, it is a feature that many others will tend towards in the absence of management. Impacts of climate change The graph below shows changes in temperature and precipitation under the high emissions scenario, by season.
The table below uses thresholds to identify the impacts on woodland, hedgerow, line of trees, scrub and bracken under the high emissions scenario, based on how
0.0
0.5
1.0
1.5
2.0
2.5
3.0
3.5
4.0
4.5
5.0
5.5
0% 10% 20% 30% 40% 50% 60% 70% 80% 90% 100%
Probability (High Emissions)
Ch
an
ge
in T
emp
erat
ure
(°C
)
-50%
-40%
-30%
-20%
-10%
0%
10%
20%
30%
Ch
an
ge
in P
rec
ipit
atio
n (
%)
Precipitation: Spring
Precipitation: Summer
Precipitation: Autumn
Precipitation: Winter
Temperature Spring
Temperature: Summer
Temperature: Autumn
Temperature: Winter
Change in Temperature and Precipitation : High Emissions

Risk & Policy Analysts, Geckoella and Environment Systems
Page 169
temperature, precipitation and flooding change with time at the 10% and 90% probability levels. The impacts are colour coded as follows: significant negative impacts: medium/unknown negative impacts: low/negligible impacts: medium/unknown positive impacts: ; and significant positive impacts: Change Thresholds Impacts without adaptation
Combination of change in temperature and precipitation could result in:
10% probability: o changing regeneration
patterns for trees, e.g. drier conditions may result in more ash
o longer growing season
Change in temperature
Higher temperatures may mean a longer growing season and greater productivity. Equally they could increase the risk of pests and diseases (e.g. Phytophora spp. on alder)
o greater risk of pests and diseases
90% probability: o wetter and warmer winters
could lead to greater risk of pests and diseases, including more active root pathogens
Change in rainfall
Under drier conditions, regeneration patterns for trees may change. Wetter conditions in winter could also affect the risk of pests and diseases
o longer growing season
Change in flood risk
Extreme floods may lead to loss of old trees. But wet woodland does well with annual winter inundation, and summer inundation with a 1:5 year frequency.
Periodic inundation might favour wet woodland but lead to loss of old trees, although willow and Black poplar are well adapted to cope with periodic inundations
10% probability: o slight change in woodland
community composition Other impacts
Longer growing season could affect light levels under the canopy (in particular those for ground flora)
90% probability: o considerable change in
woodland community composition
Implications of climate change for people and the environment The table below looks in more detail at the implications of the impacts described above without any adaptation measures being used. The impacts are colour coded using the same key as above. 10% probability (90% chance that climate change will result in higher temperatures and increased precipitation)
Impacts without adaptation Implications
Changing regeneration patterns for trees, Appearance of the landscape could change

Storyline for Woodland, Hedgerow, Line of Trees, Scrub, Bracken
Page 170
e.g. drier conditions may result in more Ash where drier conditions benefit some species (e.g. Ash) but cause problems for others (e.g. Oak is drought sensitive), but most species will still be within their limits. May be a general expansion of woodland across other features
Longer growing season
May be some qualitative changes to biodiversity: some ground flora species may be shaded out in spring, some tree species may be outcompeted by those better able to increase biomass production. Increased biomass / carbon storage, may offer harvest / sequestration opportunities, but increase scrub management costs for grassland / wetland features
Greater risk of pests and diseases Impacts likely to be small as there is very little commercial forestry
Change in relationship between day length and temperature
Qualitative changes to biodiversity: wildlife takes its springtime cues from daylength and temperature. A changing relationship may result in miscues, for example between birds and their food and shelter, and changes to the usual sequence in woodland flower emergence
Periodic inundation following periods of heavy rainfall
Inundation might favour wet woodland but lead to loss of old trees, although Willow and Black Poplar are well adapted to cope with periodic inundations
90% probability (10% chance that climate change will result in higher temperatures and increased precipitation)
Wetter and warmer winters could lead to more active root pathogens
Roots may become damaged over winter, affecting ability of trees to withstand hotter summers. Impacts would be visible at the landscape level since some trees might die.
Longer growing season
May be some qualitative changes to biodiversity: some ground flora species may be shaded out in spring, some tree species may be outcompeted by those better able to increase biomass production
Greater risk of pests and diseases Impacts likely to be small as there is very little commercial forestry
Change in relationship between day length and temperature
Qualitative changes to biodiversity: wildlife takes its springtime cues from day length and temperature. A changing relationship may result in miscues, for example between birds and their food and shelter, and changes to the usual sequence in woodland flower emergence
Periodic inundation following periods of heavy rainfall and runoff from waterlogged soils
Inundation might favour wet woodland but lead to loss of old trees, although willow and black poplar are well adapted to cope with periodic inundations. Waterlogged soils could affect woodland and hedgerows
Change in flood risk
Periodic inundation might favour wet woodland but lead to loss of old trees, although willow and black poplar are well adapted to cope with periodic inundations
Loss of old trees could lead to loss of landscape quality and/or landscape context

Risk & Policy Analysts, Geckoella and Environment Systems
Page 171
Adaptation options and responses If climate change has significant implications (whether positive or negative) for people and the environment then communities may adapt and respond. This response will depend upon the socio-economic context prevalent at the time. The table below looks at the adaptation measures available under each of four different socio-economic scenarios31. It also looks at whether or not these adaptation options are sufficient to alleviate adverse implications, or to make the most of opportunities associated with climate change for the use of the land for woodland and hedgerow habitats. The table uses a series of symbols to illustrate the key impacts: Adaptation measures: Opportunities: £ more investment use of new technology/techniques
change in activity move to more profitable activity
increase in activity (intensification) move to funding for environmental improvements
decrease in activity (extensification) application of existing skills 0 no adaptation taken (or needed) development of new skills
10% probability (90% chance that climate change will result in higher temperatures and increased precipitation) Implications without adaptation
Appearance of landscape changes as some species become more common whilst others die off. Generally dry and warm conditions favour woodland development where scrub is not removed..
Adaptation responses under…
World Markets Scenario
Provincial Enterprise Scenario
Global Sustainability Scenario
Local Stewardship Scenario
Adaptation actions
Wet woodland and hedgerows of conservation value managed to favour wildlife most likely to thrive under new conditions
Some formerly wet scrub areas are put to use for crop growing or dairy farming. Elsewhere, scrub invades abandoned areas
Wet woodland and hedgerows of conservation value managed to favour wildlife most likely to thrive under drier conditions
Previously wet areas of scrub may be put to profitable use if they dry out. Remaining areas managed for biodiversity
Opportunities Woodland production could be increased and floodplain woodland developed to help manage heavy rainfall events
Local markets for tree / woodland products
Wet woodland promoted as floodplain feature and for GHG management
Wet woodland promoted as floodplain feature and for GHG management
After adaptation – changes in land use
Area of multi-use woodland production may be expanded (if commercially viable); feature
May expand as other features drop out of management, elsewhere, woodland / scrub
Floodplain woodland to increase as part of landscape-scale restoration
Wet woodland local nature reserves.
31 A full description of the scenarios is given in Section 3 (and Annex 5).

Storyline for Woodland, Hedgerow, Line of Trees, Scrub, Bracken
Page 172
area increases as other features drop out of management
may be lost to agricultural intensification or development
After adaptation – environmental changes
Change in species composition of feature likely, increase in scrub. Increase in area reduces habitat fragmentation of woodland, scrub and bracken but unlikely to increase environmental quality due to increased fragmentation/loss of quality for other habitats
Change in species composition of feature likely, also loss of managed woodland and increase in unmanaged scrub. Reduction in fragmentation, but with little environmental benefit (due to increased fragmentation of higher quality habitats)
Change in species composition of feature likely, increase in floodplain woodland. Reduction in fragmentation of floodplain woodland
Change in species composition of feature likely, also potential for decrease in area of scrub, increase in floodplain woodland. May be increase in habitat fragmentation due to more localised management (but could also be decrease where focus is on maintaining networks of higher environmental quality habitats)
After adaptation – socio-economic changes
Land use management jobs maintained and potentially increased slightly
Increased agricultural output makes up for loss of managed woodland jobs
Land use management jobs maintained, some new jobs could be created
Jobs retained through changing land use (move to agriculture) and new jobs could be created as a result of local management of land and farms
90% probability (10% chance that climate change will result in higher temperatures and increased precipitation) Implications without adaptation
Appearance of landscape changes as some species become more common whilst others die off, with this linked to increased waterlogging of soils. Potential benefits for withy production set against greater risk of pests and diseases, in particular root damage
Adaptation responses under…
World Markets Scenario
Provincial Enterprise Scenario
Global Sustainability Scenario
Local Stewardship Scenario
Adaptation actions
Wet woodland and hedgerows of conservation value managed to favour wildlife most likely to thrive under new conditions
0 No adaptation actions likely – no desire to retain habitat, feature area may increase as other features drop out of management
Wet woodland and hedgerows of conservation value managed to favour wildlife most likely to thrive under new conditions
Some water management to maintain biodiversity within feature
Opportunities Wet woodland promoted as floodplain feature
Local markets for tree / woodland products
Wet woodland promoted as floodplain feature
Wet woodland promoted as floodplain feature
After adaptation – changes in land use
Feature area increases as other features drop out
May expand as other features drop out of
Floodplain woodland to increase with
Wet woodland local nature reserves with

Risk & Policy Analysts, Geckoella and Environment Systems
Page 173
of management management conversion based on areas of low wildlife value (formerly dry and wet grassland)
conversion based on areas of low wildlife value (formerly dry and wet grassland).
After adaptation – environmental changes
Greater area of wet woodland, species composition change but wildlife value generally retained. Reduced fragmentation of wet woodland
Greater area of wet woodland due to abandonment/ lack of management of wetter areas, species composition change. Reduced fragmentation of wet woodland, but may be at expense of other habitats. May also be sharp transition between habitats
Greater area of wet woodland, species composition change but wildlife value generally retained. Reduction in fragmentation of wet woodland, good quality gradations between habitats at floodplain scale
Fewer old trees but more wet woodland, species variety retained. Reduction in fragmentation of wet woodland (but overall fragmentation will depend on management of other habitats)
After adaptation – socio-economic changes
Land management jobs retained and could be increased slightly
Decrease in land management with loss of conservation/ woodland management jobs
Land management jobs retained and could be increased
Land management jobs retained and could be increased (e.g. through local management of hedgerows)
Summary of Changes in Land Use following Adaptation The table below shows the projected change in area of wet grassland of high value for wildlife, taking account of adaptation measures. The degree of uncertainty in the projected changes is highlighted using the following colour codings: projected change is based on data: projected change is based on the likely trend: projected change is estimated/derived from limited information: ; and projected change is not known (guesstimate):
Scenario World Markets
Scenario
Provincial Enterprise Scenario
Global Sustainability
Scenario
Local Stewardship Scenario
Current area 341 ha 341 ha 341 ha 341 ha
Probability (where the change could range from that shown for the 10% and 90% probabilities)
Change due to: 10% 90% 10% 90% 10% 90% 10% 90%
Temperature 0 ha 0 ha 0 ha 0 ha 0 ha 0 ha 0 ha 0 ha
Precipitation (water table) and/or freshwater flooding
+30 ha +30 ha +370
ha +560
ha +490
ha +690
ha +930 ha
+690 ha

Storyline for Woodland, Hedgerow, Line of Trees, Scrub, Bracken
Page 174
It is important to remember that there is a 90% chance that the climate change effects will be greater than those described on the 10% probability, and that there is a 10% chance that the climate change effects will be lower than those described under the 90% probability.

Risk & Policy Analysts, Geckoella and Environment Systems
Page 175
6. IMPACTS AT THE LANDSCAPE SCALE 6.1 Introduction This section of the report brings together the results described for the individual
features in the storylines. It projects changes in areas of each feature, assumptions made when estimating the changes (both losses and gains in area) and describes how the environmental quality of the features may change. Descriptions are given for both the 10% and 90% probabilities (high emissions scenario) and for each of the four socio-economic scenarios. It is important to remember that these modelled projections are not firm predictions, but are example plausible scenarios, based on our current understanding of how the climate will change, and using a range of possible socio-economic contexts. The socio-economic contexts are important because the Brue Valley is a highly modified landscape, and the type and intensity of management will have a very large influence on the ecosystem services and other benefits derived from features in the area. This technique helps us to identify the features most likely to change in the Brue Valley, the direction of change, and to explore the ‘knock on’ effects of change in one feature on the other features in the area.
The discussion is organised by scenario and identifies overall change in area of each
feature, shown in the tables as:
reduction in area of feature of 50% or greater: reduction in area of features of more than 10% but less than 50%: reduction in area of feature of 10% or less: no change in area (or increases balance losses): increase in area of feature of 10% or less: increase in area of feature of more than 10% but less than 50%: increase in area of feature of 50% or greater:
6.2 Changes under the World Markets Scenario Table 6.1 presents the gains and losses in area of each feature under the World
Markets scenario, under both the 10% and 90% probabilities32. Figure 6.1 gives an overview of the change in area from the 10% to the 90% probabilities, compared with the current area of each feature. The change in areas shown in Table 6.1 and Figure 6.1 relate to percentage change in the overall area under each feature, which are presented as a number of hectares lost or gained (given to two significant figures). These are estimates based on projected percentage changes and, as such, are uncertain. They are used to give an indication of the likely direction and potential magnitude of change.
Table 6.2 summarises the key environmental and socio-economic effects of climate
change that emerge under the World Markets scenario, across the range of temperature and rainfall changes that UKCP models suggest are likely.
32 Note all numbers are given to two significant figures, thus they may not sum exactly.

The Environmental and Socio-Economic Impacts of Climate Change in the Brue Valley
Page 176
Table 6.1: Gains and Losses of Each Feature under the World Markets Scenario
10% Probability 90% Probability Current
2060 2060 Feature
Area (ha)
Loss of Area (ha)
Gain in area (ha)
Final area and overall change
Change in Environmental
Quality
Loss of Area (ha)
Gain in area (ha)
Final area Change in
Environmental Quality
Cereal crops 381
-8 ha 8 ha to other
(settlements and roads)
+1600 ha 1000 ha from
dry grassland of low wildlife
value; 610 ha from wet grassland of low
wildlife value
2,000 ha
Some loss of lower quality
features where there is no premium
0
+650 ha 406 ha from dry grassland of low wildlife value;
240 ha from wet grassland of low
wildlife value
1,000 ha
Some loss of lower quality
features where there is no premium
Dry grassland of high wildlife value
58 0
+450 ha 410 ha from dry grassland of low wildlife value; 50 ha from wet
grassland of high wildlife
value
510 ha
Slight increase due to gain in area from dry
grassland of low wildlife value
-29 ha 29 ha to wet grassland of high wildlife value (due to
wetter conditions)
+410 ha 410 ha from dry grassland of low
wildlife value (due to
premiums which can be charged)
440 ha
Gain in environmental
quality (but may take some time
before improvements can be seen)
Dry grassland of low wildlife value
4,057
-2,300 ha 1,000 ha to
cereal crops; 410 ha to dry grassland of high wildlife
value; 810 ha to orchards and
horticulture; 4ha to other
(settlements and roads);
41 ha to peat works and bare
+60 ha 60 ha from wet
grassland of low wildlife value
1,800 ha
Little overall change due to movement to
both lower (e.g. cereal crops)
and higher (e.g. dry grassland of
high wildlife value) quality
features
-3,700 ha 410 ha to cereal crops; 410 ha to dry grassland of
high wildlife value; 410 ha to
orchards and horticulture; 410 ha to swamp and
fen; 410 ha to wet grassland of
high wildlife value; 1,600 ha to wet grassland
0 370 ha
Potential for some increase in environmental
quality, but may take time before increase is fully
seen

Risk & Policy Analysts, Geckoella and Environment Systems
Page 177
Table 6.1: Gains and Losses of Each Feature under the World Markets Scenario
10% Probability 90% Probability Current
2060 2060 Feature
Area (ha)
Loss of Area (ha)
Gain in area (ha)
Final area and overall change
Change in Environmental
Quality
Loss of Area (ha)
Gain in area (ha)
Final area Change in
Environmental Quality
ground of low wildlife value; 41 ha to wet heath and purple moor
grass
Lakes/ponds 347
-69 ha 35 ha to
reedbeds; 35 ha to swamp and
fen
+90 ha 90ha from peat works and bare
ground (restoration)
370 ha
Reduction in quality due to contaminants that may be washed off surrounding
land following heavy rainfall
0
+120 ha 120 ha from
peat works and bare ground
470 ha
Reduction in quality due to
contaminants in runoff following
heavy rainfall (on more
waterlogged soils)
Orchards and horticulture
39 0
+811 ha 811 ha from dry grassland of low
wildlife value
850 ha
Increased use of pesticides and
fertilisers likely to affect
environmental quality of
feature
0
+410 ha 410 ha from dry grassland of low
wildlife value
450 ha
Minimal change in
environmental quality expected
Other (settlements and roads)
855 0
+12 ha 8 ha from cereal crops; 4 ha from dry grassland of
low wildlife value
870 ha
Minimal change in
environmental quality
0 0 855 ha No change in environmental
quality
Peat works and bare ground
365 -90 ha
90 ha to lakes and ponds
+41 ha 41 ha from dry
grassland of low wildlife value
320 ha
Restoration of old peat works
improves environmental
-160 ha 120 ha to lakes and ponds; 37 ha to reedbeds
0 210 ha
Improvement in environmental quality due to
wetter

The Environmental and Socio-Economic Impacts of Climate Change in the Brue Valley
Page 178
Table 6.1: Gains and Losses of Each Feature under the World Markets Scenario
10% Probability 90% Probability Current
2060 2060 Feature
Area (ha)
Loss of Area (ha)
Gain in area (ha)
Final area and overall change
Change in Environmental
Quality
Loss of Area (ha)
Gain in area (ha)
Final area Change in
Environmental Quality
quality, and reduces
mineralisation
conditions
Reedbeds 326
-66 ha 33ha to swamp and fen; 33ha to
woodland/ hedgerow/line of trees/scrub and bracken
+35 ha
35 ha from lakes and ponds
300 ha
Move to woodland reduces
environmental value
-33 ha 33ha to
woodland/ hedgerow/line of trees/scrub and bracken
+68 ha 37 ha from peat works and bare
ground; 32 ha from
swamp and fen
360 ha
Although overall area of habitat extends, sudden increases
in water table following heavy rain (on already
waterlogged soils) could
affect species living in reedbeds
Rivers/streams/ ditches/rhynes
22 0 0 22 ha
Reduction in quality due to contaminants that may be washed off surrounding
land following heavy rainfall
0
+12 ha 12 ha from wet
grassland of low wildlife value
34 ha
Habitat area extends, but reduction in
quality is likely due to
contaminants in runoff following
heavy rainfall (on more
waterlogged soils)
Swamp and fen 158
-56 ha 40 ha to wet grassland of high wildlife
+67 ha 35 ha from lakes
and ponds; 33 ha from
170 ha Minimal overall
change
-32 ha 32 ha to
reedbeds (due to wetter
+530 ha 410 ha from dry grassland of low wildlife value;
650 ha
Potential improvement but this will depend on

Risk & Policy Analysts, Geckoella and Environment Systems
Page 179
Table 6.1: Gains and Losses of Each Feature under the World Markets Scenario
10% Probability 90% Probability Current
2060 2060 Feature
Area (ha)
Loss of Area (ha)
Gain in area (ha)
Final area and overall change
Change in Environmental
Quality
Loss of Area (ha)
Gain in area (ha)
Final area Change in
Environmental Quality
value; 16 ha to wet grassland of
low wildlife value
reedbeds conditions) 120 ha from wet grassland of low
wildlife value
management regime
Wet grassland of high value for wildlife
953
-47 ha 47 ha to dry grassland of high wildlife
value
+47 ha 40 ha from
swamp and fen; 7 ha from wet
heath and purple moor grass
953 ha
Drier conditions could make it
more difficult o maintain wet
grassland
0
+430 ha 29 ha from dry
grassland of high wildlife value; 405 ha
from dry grassland of low
wildlife value
1,400 ha
Management restrictions due
to wetter conditions could
reduce biodiversity
value
Wet grassland of low value for wildlife
2,439
-670 ha 610 ha to cereal crops; 61 ha to
dry grassland of low wildlife
value
+ 23 ha 16 ha from
swamp and fen; 7 ha from wet
heath and purple moor grass
1,800 ha
Drier conditions likely to make it more difficult to
maintain wet grassland
-400 ha 240 ha to cereal crops; 12 ha to rivers/streams/ ditches/rhynes;
120 ha to swamp and fen;
24 ha to wet heath and purple
moor grass
+1,600 ha 1,600 ha from
dry grassland of low wildlife
value
3,700 ha No change in environmental
quality
Wet heath and purple moor grass
67
-14 ha 7 ha to wet grassland of high wildlife
value; 7 ha to wet
grassland of low wildlife value
0 53 ha
Loss of some of specialist feature
leads to reduction in
environmental quality
0
+65 ha 41 ha from dry
grassland of low wildlife value; 24 ha from wet
grassland of low wildlife value
130 ha
Potential benefits with
improved management of
high quality habitats, maybe some negative
impacts if runoff

The Environmental and Socio-Economic Impacts of Climate Change in the Brue Valley
Page 180
Table 6.1: Gains and Losses of Each Feature under the World Markets Scenario
10% Probability 90% Probability Current
2060 2060 Feature
Area (ha)
Loss of Area (ha)
Gain in area (ha)
Final area and overall change
Change in Environmental
Quality
Loss of Area (ha)
Gain in area (ha)
Final area Change in
Environmental Quality
is not directed away from areas
of wet heath
Woodland/hedgerow/line of trees/scrub and bracken
341 0 +33 ha
33 ha from reedbeds
370 ha
Increases by 33 ha, but at
expense of higher quality
features
0 +33 ha
33 ha from reedbeds
370 ha
Increases by 33 ha, but at
expense of higher quality
features

Risk & Policy Analysts, Geckoella and Environment Systems
Page 181
0 500 1000 1500 2000 2500 3000 3500 4000 4500
Rivers/streams/ditches/rhynes
Orchards and horticulture
Dry grassland of high wildlife value
Wet heath and purple moor grass
Swamp and fen
Reedbeds
Woodland/hedgerow/line of trees/scrub and bracken
Lakes/ponds
Peat works and bare ground
Cereal crops
Other (settlements and roads)
Wet grassland of high value for wildlife
Wet grassland of low value for wildlife
Dry grassland of low wildlife value
Area (ha)
CURRENT
World Markets (10%)
World Markets (90%)
Figure 6.1: Change in Area from Current under the World Markets Scenario

The Environmental and Socio-Economic Impacts of Climate Change in the Brue Valley
Page 182
Table 6.2: Key Changes under the World Markets Scenario
Factor Description of Changes
Overview of scenario
Rapid economic growth, with farming undertaken by large corporations which use new technology to increase yields. Since costs are controlled, prices remain stable relative to incomes. Businesses are focused on profits, but are concerned about the environment and their reputations, with agri-environment payments targeted at the highest value areas. There may even be some movement towards payments for ecosystem services. Peat extraction declines, but pressure for housing and commercial development increases in the Brue Valley. Significant investment in water and flood risk management occurs, with drainage increased for profitable croplands, but seen as less important where there is the potential to move to agri-environment payments or SSSI/premium products. Coastal defences are built to protect key assets (e.g. M5, Bridgwater, etc.) with benefits for the Brue Valley.
Overall environmental quality
The balance of wet / dry features may change, although the final direction is currently uncertain. Managed gradual changes could lead to overall increase in environmental quality, especially where the climate becomes much wetter
Localised changes in environmental quality
Increased pollutants in runoff following heavy rain could affect watercourses, ponds and lakes (especially where more fertilisers and pesticides are used). Drier conditions could increase the area of scrub and bracken, and lead to some loss of wet grassland (potentially up to 650ha), although land management by conservation organisations will help reduce the impacts in areas of higher environmental quality
Impacts on freshwater availability
Water management is increased for profitable croplands to ensure that they are protected whether conditions become wetter or drier. Although some ponds will dry out to reedbeds and swamp and fen under drier conditions, the overall area covered by lakes and ponds is expected to expand (potentially by 20 ha under drier conditions and 120 ha under wetter conditions) as peat workings are restored. Where land is not in productive use and is of lower environmental quality, water management will be seen as less important; however ditches and rhynes will be retained, particularly where biodiversity is high
Impacts on biodiversity
The balance of wet / dry features may change, although the final direction is currently uncertain. Change in mosaic of features could affect some species (e.g. those associated with dry grassland of high wildlife value). Runoff contaminated with pollutants could affect invertebrates; nesting birds could be affected by sudden increases in water levels (e.g. due to flood flows following heavy rainfall). Careful management by conservation organisations could help to avoid impacts on key species
Socio-economic impacts
Development of new technology to minimise impacts on jobs (e.g. wheat varieties which can withstand drought and short duration flooding, use of new techniques to quickly evacuate water, etc.). Demand for high quality products along with an increase in arable farming (fivefold increase in area under cereal rotation in drier conditions, more than doubling of area under wetter conditions) could help secure some jobs. However, wetter conditions could affect overall jobs supported by agriculture; these could be replaced by more jobs in conservation and land management. Peat extraction would be expected to reduce, especially under wetter conditions. Potential opportunity to move to energy crops
Greenhouse gas flux
Old peat workings restored to enhance areas of wetland and reduce mineralisation of any remaining peat soils. Drier conditions overall, though, could increase mineralisation from peat soils in the Brue Valley. In contrast, wetter conditions would benefit peat conservation and GHG management, since peat abstraction would become more difficult. However, fluctuating water levels would make the overall GHG balance uncertain. Reduction in peat extraction could help shift Brue to GHG neutral
Regional and national context
Under drier conditions, the Brue Valley may become more important for agriculture, as other areas become too hot or too dry to farm. Brue Valley may also become more important at the national and international scale as a refuge for lowland wet grassland communities (including wintering birds and breeding waders), as other wetlands (coastal, SE England) suffer faster declines arising

Risk & Policy Analysts, Geckoella and Environment Systems
Page 183
from climate change. However, the value of other wetlands is important to the value of the Brue Valley; e.g. wintering birds require network of sites along migration route: the Brue may become of increasing importance for a declining feature. It is possible that wintering birds will not regularly come in large numbers in the future (favouring instead newly warmed sites to the north). The SL&M will still be important as a hard weather refuge however, for the extreme events considered likely to increase in frequency. Overall, the profile of, and demands made of the Somerset Levels and Moors, including Brue Valley, may increase for a range of uses, especially under drier conditions.
6.3 Changes under the Provincial Enterprise Scenario Table 6.3 presents the gains and losses in area of each feature under the Provincial
Enterprise scenario, under both the 10% and 90% probabilities. Figure 6.2 gives an overview of the change in area from the 10% to the 90% probabilities, compared with the current area of each feature. The change in areas shown in Table 6.3 and Figure 6.3 relate to percentage change in the overall area under each feature, which are then presented as a number of hectares. These are estimates and are given to a maximum of two significant figures to reflect uncertainty.
Table 6.4 summarises the key environmental effects of climate change that emerge
under the Provincial Enterprise scenario, across the range of temperature and rainfall changes that UKCP models suggest are likely.

The Environmental and Socio-Economic Impacts of Climate Change in the Brue Valley
Page 184
Table 6.3: Gains and Losses of Each Feature under the Provincial Enterprise Scenario
10% Probability 90% Probability Current
2060 2060 Feature
Area (ha)
Loss of Area (ha)
Gain in area (ha)
Final area and overall change
Change in Environmental
Quality
Loss of Area (ha)
Gain in area (ha)
Final area Change in
Environmental Quality
Cereal crops 381 0 ha
+2,700 ha 6 ha from dry grassland of high wildlife
value; 2,000 ha from dry
grassland of low wildlife value; 48 ha from wet
grassland of high wildlife value; 610 ha
from wet grassland of low
wildlife value
3,100 ha
Increased use of fertilisers and
pesticides reduces
environmental quality
-76 ha 8 ha to swamp
and fen; 60 ha to wet grassland of
low wildlife value; 8 ha to
woodland/ hedgerow/line of trees/scrub and bracken
+1,200 ha 12 ha from dry
grassland of high wildlife
value; 1,200 ha from dry
grassland of low wildlife value
1,500 ha
Changes in land use, combined with increased risk of flooding
results in reduction in
environmental quality
Dry grassland of high wildlife value
58
-35 ha 6 ha to cereal
crops; 29 ha to dry grassland of
low wildlife value
0 23 ha
Change in composition of
grassland species, with
MG5 replaced by species that prefer nutrient rich conditions
-35 ha 12 ha to cereal crops; 6 ha to
swamp and fen; 12 ha to wet
grassland of low wildlife value; 6 ha to woodland/ hedgerow/line of trees/scrub and bracken
0 23 ha
Loss of dry grassland
biodiversity, replacement
likely to be wet grassland, or
low/no management swamp/fen or
scrub
Dry grassland of low wildlife value
4,057
-2,500 ha 2,000 ha to
cereal crops; 410 ha to
+880 ha 29 ha from dry
grassland of high wildlife
2,400 ha
Reduction due to increase in pesticide and
fertiliser use and
-3,400 ha 1,200 ha to
cereal crops; 200 ha to
0 610 ha
Loss of dry grassland
biodiversity, replacement

Risk & Policy Analysts, Geckoella and Environment Systems
Page 185
Table 6.3: Gains and Losses of Each Feature under the Provincial Enterprise Scenario
10% Probability 90% Probability Current
2060 2060 Feature
Area (ha)
Loss of Area (ha)
Gain in area (ha)
Final area and overall change
Change in Environmental
Quality
Loss of Area (ha)
Gain in area (ha)
Final area Change in
Environmental Quality
orchards and horticulture; 20
ha to other (settlements and roads); 41 ha to peat works and
bare ground
value; 240 ha from wet
grassland of high wildlife value; 610 ha
from wet grassland of low
wildlife value
conversion of land for more intensive uses
orchards and horticulture; 410 ha to swamp and fen; 1,200 ha to wet grassland of
low wildlife value; 410 ha to
woodland/ hedgerow/line of trees/scrub and bracken
likely to be wet grassland, or
low/no management swamp/fen or
scrub
Lakes/ponds 347
-140 ha 69 ha to
reedbeds; 69 ha to swamp and
fen
+20 ha 20 ha from peat works and bare
ground
230 ha
Loss of aquatic diversity due to
lack of management for
wildlife and potential
increase in nutrient content (from runoff)
-100 ha 35 ha to
reedbeds, 35 ha to swamp and fen; 35 ha to woodland/
hedgerow/line of trees/scrub and bracken
(due to lack of management)
+90 ha 90 ha from peat works and bare
ground
330 ha
Reduction in level of
management for wildlife and
increased risk of nutrient and pollutants
entering lakes and ponds
through runoff following heavy
rain/flooding
Orchards and horticulture
39 0
+700 ha 410 ha from dry grassland of low wildlife value; 48 ha from wet
grassland of high wildlife
740 ha
Intensification and increased
use of pesticides and fertilisers
reduces environmental
quality
0
+200 ha 200 ha from dry grassland of low
wildlife value
240 ha
Intensification and increased
use of pesticides and fertilisers
reduces environmental
quality

The Environmental and Socio-Economic Impacts of Climate Change in the Brue Valley
Page 186
Table 6.3: Gains and Losses of Each Feature under the Provincial Enterprise Scenario
10% Probability 90% Probability Current
2060 2060 Feature
Area (ha)
Loss of Area (ha)
Gain in area (ha)
Final area and overall change
Change in Environmental
Quality
Loss of Area (ha)
Gain in area (ha)
Final area Change in
Environmental Quality
value; 244 ha from wet
grassland of low wildlife value
Other (settlements and roads)
855 0
+45 ha 20 ha from dry
grassland of low wildlife value; 24 ha from wet
grassland of low wildlife value
900 ha
Some loss of habitat due to development
pressures
0 0 860 ha No change in environmental
quality
Peat works and bare ground
365 -20 ha
20 ha to lakes and ponds
+130 ha 41 ha from dry
grassland of low wildlife value;
40 ha from swamp and fen; 48 ha from wet
grassland of low wildlife value
470 ha
Decreased environmental quality due to expansion of
peat workings
-90 ha 90 ha to lakes
and ponds 0 280 ha
Potential for increase in
environmental quality as peat
workings decline due to
wetter conditions
Reedbeds 326
-200 ha 33 ha to swamp and fen; 160 ha to woodland/
hedgerow/line of trees/scrub and
bracken
+69 ha 69 ha from lakes/ponds
200 ha
Decrease in diversity of
species supported by
reedbeds due to reduction in
quality and area of reedbeds
0
+74 ha 35 ha from lakes and ponds; 40 ha from swamp and
fen
400 ha
Although area of feature extends, sudden increases
in water table due to flood
flows/following heavy rain could affect reedbeds and the species
they support

Risk & Policy Analysts, Geckoella and Environment Systems
Page 187
Table 6.3: Gains and Losses of Each Feature under the Provincial Enterprise Scenario
10% Probability 90% Probability Current
2060 2060 Feature
Area (ha)
Loss of Area (ha)
Gain in area (ha)
Final area and overall change
Change in Environmental
Quality
Loss of Area (ha)
Gain in area (ha)
Final area Change in
Environmental Quality
Rivers/streams/ ditches/rhynes
22
-2 ha 2 ha to
woodland/ hedgerow/line of trees/scrub and
bracken
0 20 ha
Decreased environmental
quality as ditches
abandoned and become scrub
-4 ha 4 ha to
woodland/ hedgerow/line of trees/scrub and bracken
0 18ha
Decreased environmental
quality as ditches
abandoned and become scrub
and wet woodland
Swamp and fen 158
-126 ha 40 ha to peat
works and bare ground; 71 ha to wet grassland of
low wildlife value; 16 ha to
woodland/ hedgerow/line of trees/scrub and
bracken
+100 ha 69 ha to swamp and fen; 33 ha to
reedbeds
130 ha
Loss of feature as well as move
to land management which is not tailored to
maintaining environmental
quality results in loss of species
diversity
-120 ha 40 ha to
reedbeds; 79 ha to woodland/ hedgerow/line of trees/scrub and bracken
+1,800 ha 8 ha from cereal crops; 6 ha from dry grassland of
high wildlife value; 410 ha
from dry grassland of low wildlife value;
35 ha from lakes and ponds; 119
ha from wet grassland of high wildlife
value; 1,200 ha from wet
grassland of low wildlife value; 45 ha from wet
heath and purple moor grass
(abandonment of
1,900 ha
Decrease in environmental quality as some high value and
specialist habitats are lost
due to wetter conditions and
abandonment of management

The Environmental and Socio-Economic Impacts of Climate Change in the Brue Valley
Page 188
Table 6.3: Gains and Losses of Each Feature under the Provincial Enterprise Scenario
10% Probability 90% Probability Current
2060 2060 Feature
Area (ha)
Loss of Area (ha)
Gain in area (ha)
Final area and overall change
Change in Environmental
Quality
Loss of Area (ha)
Gain in area (ha)
Final area Change in
Environmental Quality
wettest areas)
Wet grassland of high value for wildlife
953
-380 ha 48 ha to cereal
crops; 240 ha to dry grassland of
low wildlife value; 48 ha to orchards and
horticulture; 48 ha to woodland/ hedgerow/line of trees/scrub and
bracken
0 ha 570 ha
Significant reduction in
species diversity as grassland
changes to land uses with much
lower biodiversity
value
-240 ha 120 ha to
swamp and fen ( too wet to farm);
120 ha to wet grassland of low
wildlife value (agricultural
improvements undertaken to
increase profits)
0 720 ha
Decreased environmental quality due to agricultural
improvements and loss of biodiversity
Wet grassland of low value for wildlife
2,439
-1,700 ha 610 ha to cereal crops; 610 ha to dry grassland of
low wildlife value; 240 ha to
orchards and horticulture; 24
ha to other (settlements and roads); 48 ha to peat works and bare ground;
120 ha to woodland/
hedgerow/line of trees/scrub and
+120 ha 71 ha from
swamp and fen; 45 ha from wet
heath and purple moor grass
900 ha
Change to dry grassland of low
value for wildlife and
cereal crops and horticulture,
with potential increase in use
of fertilisers and pesticides
-1,200 ha 1,200 ha to
swamp and fen
+1,400 ha 60 ha from
cereal crops; 12 ha from dry grassland of high wildlife
value; 1,200 ha from dry
grassland of low wildlife value;
120 ha from wet grassland of high wildlife
value
2,600 ha
Potential for biodiversity
benefits due to gain in swamp
and fen (although some
loss of other high value
features), but there may be a time gap before
good quality swamp/fen habitats are established

Risk & Policy Analysts, Geckoella and Environment Systems
Page 189
Table 6.3: Gains and Losses of Each Feature under the Provincial Enterprise Scenario
10% Probability 90% Probability Current
2060 2060 Feature
Area (ha)
Loss of Area (ha)
Gain in area (ha)
Final area and overall change
Change in Environmental
Quality
Loss of Area (ha)
Gain in area (ha)
Final area Change in
Environmental Quality
bracken
Wet heath and purple moor grass
67
-67 ha 45 ha to wet grass of low
wildlife value; 22 ha to
woodland/ hedgerow/line of trees/scrub and
bracken
0 0 ha
Complete loss of wet heath and purple moor
grass
-67 ha 45 ha to swamp and fen; 22 ha to
woodland/ hedgerow/line of trees/scrub and bracken
0 0 ha
Complete loss of wet heath and purple moor
grass
Woodland/hedgerow/line of trees/scrub and bracken
341 0
+370 ha 160 ha from
reedbeds; 16 ha from swamp and fen; 48 ha from wet grassland of
high wildlife value; 120 ha
from wet grassland of low wildlife value; 22 ha from wet
heath and purple moor grass
710 ha
Some decline in quality expected
due to abandonment of
high value habitats (e.g. wet heath and purple moor
grass)
0
+560 ha 8 ha from cereal crops; 6 ha from dry grassland of
high wildlife value; 410 ha
from dry grassland of low wildlife value;
35 ha from lakes and ponds; 4 ha
from rivers/streams/ ditches/rhynes;
79 ha from swamp and fen; 22 ha from wet
heath and purple moor grass
900 ha
Some decline in quality expected
due to abandonment of
high value habitats (e.g. wet heath and purple moor
grass)
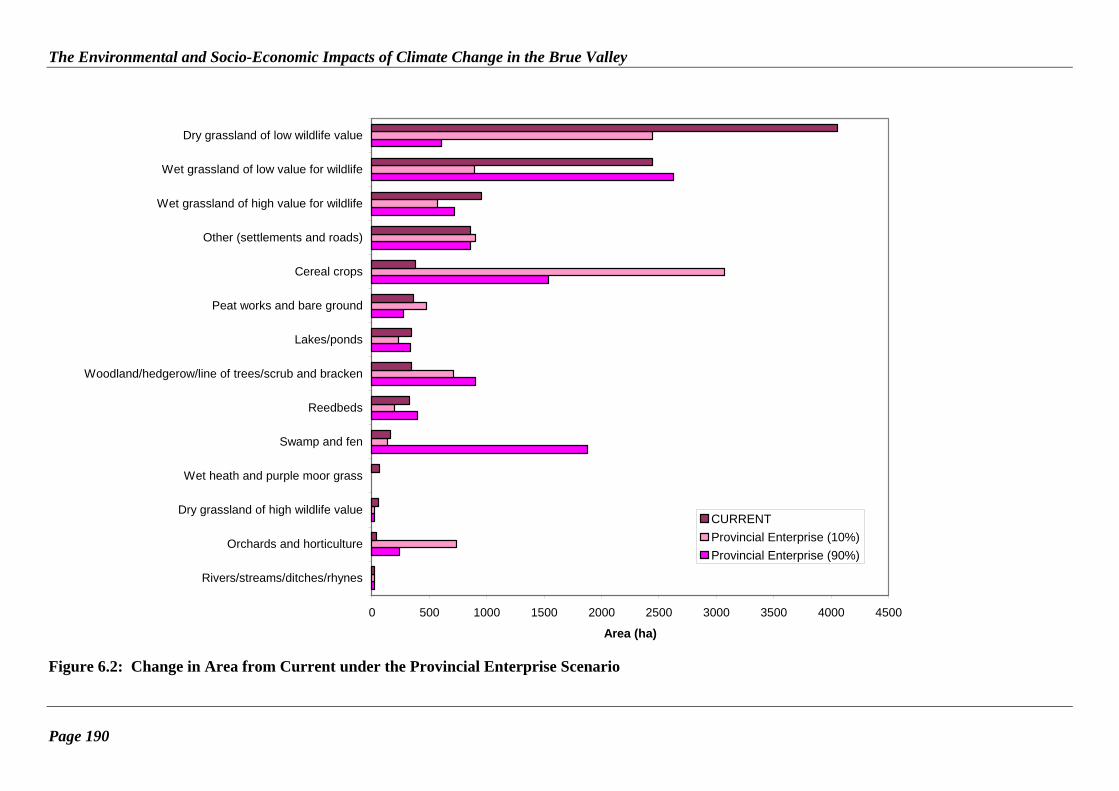
The Environmental and Socio-Economic Impacts of Climate Change in the Brue Valley
Page 190
0 500 1000 1500 2000 2500 3000 3500 4000 4500
Rivers/streams/ditches/rhynes
Orchards and horticulture
Dry grassland of high wildlife value
Wet heath and purple moor grass
Swamp and fen
Reedbeds
Woodland/hedgerow/line of trees/scrub and bracken
Lakes/ponds
Peat works and bare ground
Cereal crops
Other (settlements and roads)
Wet grassland of high value for wildlife
Wet grassland of low value for wildlife
Dry grassland of low wildlife value
Area (ha)
CURRENT
Provincial Enterprise (10%)
Provincial Enterprise (90%)
Figure 6.2: Change in Area from Current under the Provincial Enterprise Scenario

Risk & Policy Analysts, Geckoella and Environment Systems
Page 191
Table 6.4: Key Changes under the Provincial Enterprise Scenario
Factor Description of Changes
Overview of scenario
Profit maximisation is seen as the most important aspect of farming, with considerable intensification and minimal concern for the environment. Even biodiversity rich sites come under pressure from development or intensification. Cost of inputs rises due to regional fluctuations and a lack of buying power. This has knock on impacts for food prices, which also rise. Peat extraction could increase to meet regional demands. Water management only takes place where it is required to protect profitable land uses. In other areas, wetland habitats are abandoned. Overall flood risk increases due to the ad hoc approach to land drainage and management. However, coastal defences are built to protect key assets, so tidal flooding is not a problem
Overall environmental quality
Significant reduction in environmental quality of Brue Valley, due to intensification (drier conditions) or lack of management and abandonment of areas (wetter conditions)
Localised changes in environmental quality
Local increases in pesticide and fertiliser use resulting in reduction in environmental quality. Changes to use of land leads to greater fragmentation of habitats with high quality habitats typically becoming more isolated and/or surrounded by land that is used more intensively
Impacts on freshwater availability
Area covered by lakes and ponds decreases under both wetter (-14 ha) and drier conditions (-120 ha) due to lack of management. Some ponds may become very polluted by runoff water from intensively farmed land (particularly after heavy downpours). Ditches will be abandoned to scrub in some areas. This could have implications for farming, with fencing required to replace wet fencing where grazing remains profitable
Impacts on biodiversity
Loss of much of the dry grassland high value feature (-35 ha whether conditions become drier or wetter). Wet grassland of high value is also lost (-380 ha in drier future; -240 ha in wetter future). Change in area and quality of most valuable features. Plant and invertebrate assemblages in watercourses will change due to increases in nutrients / pesticides. The number and type of birds species that can be supported, e.g. on grasslands, will be reduced due to declining management, especially under drier conditions. Increased risk of flooding may affect breeding birds or overwintering invertebrates
Socio-economic impacts
Intensification may increase jobs in some locations and associated with some features (e.g. grazing on dry grassland of low value for wildlife, intensification of horticulture), but abandonment of land (especially in wetter conditions, where swamp and fen increases by 1,700 ha) and lack of conservation management will reduce jobs elsewhere. There may be potential for angling/wildfowling jobs to be created, where management of land and watercourses is tailored to these activities e.g. through fish stocking
Greenhouse gas flux
Increased tillage increases GHG emissions from peat soils. Drier conditions and / or fluctuating water tables may increase GHG emissions. Increased peat extraction would increase GHG emissions and mineralisation from exposed soils
Regional and national context
Fast declining environmental quality of other areas for agriculture, development, conservation, etc. may make the relatively cool and wet Brue Valley more attractive for a range of uses. Brue Valley SSSIs become much more isolated and surrounded by more intensively farmed land (drier conditions) or land that is increasingly unmanaged where it is too wet to farm (wetter conditions). The value of the SSSIs may increase due to loss of wider environmental quality but funding for continued conservation management is likely to decrease, so that, overall SSSI condition declines (this includes the replacement of dry grassland of high wildlife value under wetter conditions to wet grassland of high value for wildlife)

The Environmental and Socio-Economic Impacts of Climate Change in the Brue Valley
Page 192
6.4 Changes under the Global Sustainability Scenario Table 6.5 presents the gains and losses in area of each feature under the Global
Sustainability scenario, under both the 10% and 90% probabilities. Figure 6.3 gives an overview of the change in area from the 10% to the 90% probabilities, compared with the current area of each feature. The change in areas shown in Table 6.5 and Figure 6.3 relate to percentage change in the overall area under each feature, which are then presented as a number of hectares. These are estimates and are given to a maximum of two significant figures to reflect uncertainty.
Table 6.6 summarises the key environmental and socio-economic effects of climate
change that emerge under the Global Sustainability scenario, across the range of temperature and rainfall changes that UKCP models suggest are likely.

Risk & Policy Analysts, Geckoella and Environment Systems
Page 193
Table 6.5: Gains and Losses of Each Feature under the Global Sustainability Scenario
10% Probability 90% Probability Current
2060 2060 Feature
Area (ha)
Loss of Area (ha)
Gain in area (ha)
Final area and overall change
Change in Environmental
Quality
Loss of Area (ha)
Gain in area (ha)
Final area Change in
Environmental Quality
Cereal crops 381 0 0 380 ha
Use of new technology
avoids decline in environmental
quality
-76 ha 0 310 ha
Significant benefits from
low-input management
Dry grassland of high wildlife value
58 0
+2,500 ha 2,000 ha from
dry grass of low wildlife value;
240 ha from wet grass of high
wildlife value; 240 from wet grass of low
wildlife value
2,600 ha
MG5 grasslands continue to be
supported, with potential
increase in area
-24 ha 6 ha to swamp
and fen; 12 ha to wet grass of high wildlife value; 6ha to wet heath and purple moor
grass
+810 ha 810 ha from dry grassland of low
wildlife value
850 ha
Wetter conditions result
in change in species
composition
Dry grassland of low wildlife value
4,057
-2,400 ha 2,000 ha from
dry grassland of high wildlife value; 410 ha from orchards
and horticulture
0 1,900 ha
Demand for high value
products results in improvement to dry grassland of high wildlife
value
-3,700 ha 810 ha to dry grassland of high wildlife
value; 410 ha to orchards and
horticulture; 610 ha to swamp and
fen; 810 ha to wet grass of high wildlife
value; 810 ha to wet grass of low wildlife value;
0 370 ha
Change to wetter features with potential for significant
increase in environmental
quality

The Environmental and Socio-Economic Impacts of Climate Change in the Brue Valley
Page 194
Table 6.5: Gains and Losses of Each Feature under the Global Sustainability Scenario
10% Probability 90% Probability Current
2060 2060 Feature
Area (ha)
Loss of Area (ha)
Gain in area (ha)
Final area and overall change
Change in Environmental
Quality
Loss of Area (ha)
Gain in area (ha)
Final area Change in
Environmental Quality
41 ha to wet heath and purple moor grass; 200 ha to woodland/ hedgerow/line of trees/scrub and
bracken
Lakes/ponds 347
-69 ha 35 ha to
reedbeds; 35 ha to swamp and
fen
+90 ha 90 ha from peat works and bare ground (created
following restoration)
370 ha
Features managed to
maintain species richness, but
runoff containing
nutrients could offset any gains
0
+183 ha 183 ha from peat works and bare
ground (following restoration)
530 ha
Biodiversity is retained and
enhanced through wider
floodplain management and
restoration of peat workings
Orchards and horticulture
39 0
+406 ha 406 ha from dry grassland of low
wildlife value
450 ha No change in environmental
quality 0
+406 ha 406 ha from dry grassland of low
wildlife value
450 ha
Crops grown may change, but environmental
impacts are predicted to be
minimal
Other (settlements and roads)
855 0 0 860 ha No change in environmental
quality 0 0 860 ha
No change in environmental
quality anticipated
Peat works and bare ground
365
-370 ha 90 ha to lakes and ponds; 37 ha to reedbeds;
120 ha to
0 0 ha Old peat works
restored, no new peat extraction
-370 ha 180 ha to lakes and ponds; 180 ha to reedbeds
0 0 ha
Funding targeted to conservation and restoration of peat soils, no
new peat

Risk & Policy Analysts, Geckoella and Environment Systems
Page 195
Table 6.5: Gains and Losses of Each Feature under the Global Sustainability Scenario
10% Probability 90% Probability Current
2060 2060 Feature
Area (ha)
Loss of Area (ha)
Gain in area (ha)
Final area and overall change
Change in Environmental
Quality
Loss of Area (ha)
Gain in area (ha)
Final area Change in
Environmental Quality
swamp and fen; 119 ha to wet grass of high wildlife value
extraction
Reedbeds 326 -33 ha
33 ha to swamp and fen
+71 ha 35 ha from lakes and ponds; 37 ha from peat works and bare ground
370 ha
Maintenance and
enhancement of species rich
reedbed areas
0
+210 ha 180 ha from peat works and bare ground; 32 ha
from swamp and fen
540 ha
Some gain from restoration of
peat workings, but also possible
reduction in quality where
reedbeds replace habitats that are
more biodiversity rich
Rivers/streams/ ditches/rhynes
22 0 0 22 ha
No change in environmental quality due to
management to retain
biodiversity
0
+12 ha 12 ha from wet
grassland of low wildlife value
34 ha
Potential to increase habitat
connectivity, some
community compositions may change
Swamp and fen 158
-16 ha 16 ha from wet
grassland of high wildlife
value
+190 ha 35 ha from lakes and ponds; 120
ha from peat works and bare ground; 33 ha from reedbeds
330 ha
Drier conditions result in some movement to
wet grasslands, but losses are
more than offset by gains from other features
e.g. former peat
-32 ha
+2,100 ha
6 ha from dry grassland of high wildlife value; 610 ha
from dry grassland of low wildlife value;
2,200 ha
Potential for increase,
depending on management of water regime and feature

The Environmental and Socio-Economic Impacts of Climate Change in the Brue Valley
Page 196
Table 6.5: Gains and Losses of Each Feature under the Global Sustainability Scenario
10% Probability 90% Probability Current
2060 2060 Feature
Area (ha)
Loss of Area (ha)
Gain in area (ha)
Final area and overall change
Change in Environmental
Quality
Loss of Area (ha)
Gain in area (ha)
Final area Change in
Environmental Quality
workings 238 ha from wet grassland of high wildlife value; 1,220
from wet grassland of low wildlife value; 7
ha from wet heath and purple
moor grass
Wet grassland of high value for wildlife
953
-240 ha 240 ha to dry grassland of high wildlife
value
+260 ha 120 ha from peat works and bare ground; 16 ha
from swamp and fen; 120 ha from wet grass of low wildlife value; 7
ha from wet heath and purple
moor grass
1,000 ha
Small gain of area of high value wet grassland
-240 ha 240 ha to swamp
and fen
+1,100 ha 38 ha from
cereal crops; 12 ha from dry grassland of high wildlife value; 810 ha
from dry grassland of low wildlife value;
240 ha from wet grassland of low
wildlife value
1,800 ha
Potential for some gain in
environmental quality if feature is well managed (but note some loss of other high quality
features)
Wet grassland of low value for wildlife
2,439
-1,100 ha 240 ha to dry grassland of high wildlife
value; 240 ha to dry grassland of
low wildlife
0 1,300 ha
No change in environmental
quality, but movement to dry grassland (due to lower water levels)
-2,000 ha 12 ha to
rivers/streams/ ditches/rhynes;
1,200 ha to swamp and fen;
240ha to wet
+850 ha 38 ha from
cereal crops; 810 ha from dry
grass of low wildlife value
1,300 ha
Change in species
composition, but potential
benefits from move to a more
naturally
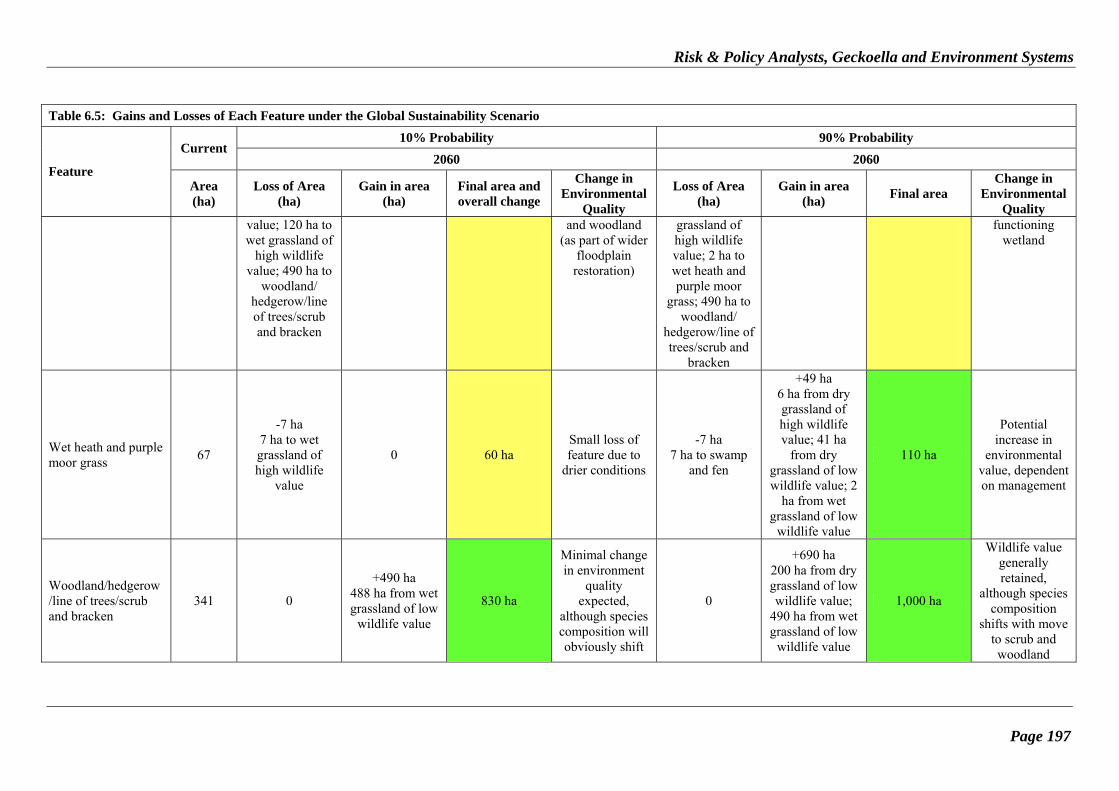
Risk & Policy Analysts, Geckoella and Environment Systems
Page 197
Table 6.5: Gains and Losses of Each Feature under the Global Sustainability Scenario
10% Probability 90% Probability Current
2060 2060 Feature
Area (ha)
Loss of Area (ha)
Gain in area (ha)
Final area and overall change
Change in Environmental
Quality
Loss of Area (ha)
Gain in area (ha)
Final area Change in
Environmental Quality
value; 120 ha to wet grassland of
high wildlife value; 490 ha to
woodland/ hedgerow/line of trees/scrub and bracken
and woodland (as part of wider
floodplain restoration)
grassland of high wildlife value; 2 ha to wet heath and purple moor
grass; 490 ha to woodland/
hedgerow/line of trees/scrub and
bracken
functioning wetland
Wet heath and purple moor grass
67
-7 ha 7 ha to wet grassland of high wildlife
value
0 60 ha Small loss of feature due to
drier conditions
-7 ha 7 ha to swamp
and fen
+49 ha 6 ha from dry grassland of high wildlife value; 41 ha
from dry grassland of low wildlife value; 2
ha from wet grassland of low
wildlife value
110 ha
Potential increase in
environmental value, dependent on management
Woodland/hedgerow/line of trees/scrub and bracken
341 0
+490 ha 488 ha from wet grassland of low
wildlife value
830 ha
Minimal change in environment
quality expected,
although species composition will obviously shift
0
+690 ha 200 ha from dry grassland of low wildlife value;
490 ha from wet grassland of low
wildlife value
1,000 ha
Wildlife value generally retained,
although species composition
shifts with move to scrub and woodland

The Environmental and Socio-Economic Impacts of Climate Change in the Brue Valley
Page 198
0 500 1000 1500 2000 2500 3000 3500 4000 4500
Rivers/streams/ditches/rhynes
Orchards and horticulture
Dry grassland of high wildlife value
Wet heath and purple moor grass
Swamp and fen
Reedbeds
Woodland/hedgerow/line of trees/scrub and bracken
Lakes/ponds
Peat works and bare ground
Cereal crops
Other (settlements and roads)
Wet grassland of high value for wildlife
Wet grassland of low value for wildlife
Dry grassland of low wildlife value
Area (ha)
CURRENT
Global Sustainability (10%)
Global Sustainability (90%)
Figure 6.3: Change in Area from Current under the Global Sustainability Scenario

Risk & Policy Analysts, Geckoella and Environment Systems
Page 199
Table 6.6: Key Changes under the Global Sustainability Scenario
Factor Description of Changes
Overview of scenario
High quality farmland is used more sustainably, with new technology employed to maintain yields. Agri-environment payments help ensure lower quality land is used in a sustainable way, since there are global and national targets to promote environmental responsibility. Peat extraction is affected by environmental costs and national reporting requirements. Food prices also increase relative to income due to the more sustainable methods of production used. Planning controls are extensive and development only really occurs in existing urban areas. Paying for ecosystem services becomes a key approach. Opportunities for training and learning skills increase, with an expansion of volunteer roles. Conservation organisations provide support and advice on creating wildlife corridors, since low productivity land is likely to be used to benefit biodiversity. Water management continues on a small scale, with zoning of some areas for water storage to reduce pluvial flood risk to other areas. Defences are built around key assets to provide some protection from tidal flooding; the Huntspill is engineered to act as a preferential flow route for extreme tidal events
Overall environmental quality
Significant improvement in environmental quality, with maintenance of areas already at high quality and improvements elsewhere. This includes the restoration of floodplain function in some areas, combined with a move to low-input farming in others
Localised changes in environmental quality
Impacts from pollutants in runoff minimised due to better overall management at the floodplain/landscape scale
Impacts on freshwater availability
Overall area covered by lakes and ponds increases under both wetter (+20 ha) and drier (+180 ha) conditions due mainly to restoration of peat workings. However, under drier conditions, some old lakes and ponds dry out to become reedbeds and swamp and fen, so freshwater availability does not remain the same spatially. Since water management does occur, there is no real loss of rivers, streams, ditches and rhynes if conditions become drier. Indeed, if conditions become wetter, there is the opportunity to expand wetland habitats, with the area covered by watercourses and ditches increasing by 12ha
Impacts on biodiversity
Benefits for supported species through a maintained and higher quality environment, with better linkages between different habitat types to provide a better network through the Brue Valley (and beyond). Change in feature composition could affect species compositions, especially for breeding waders (note that under drier conditions, whilst wet grassland of high value might be increased in area by 25ha, wet grassland of low value could decrease in area by around 1,100 ha)
Socio-economic impacts
Increased use of technology and development of new skills enables food production to be maximised but in more sustainable way, that works with the climate. Possible small reduction in agricultural jobs, but these are replaced by land management and conservation jobs (supported by agri-environment payments). Moves to greater areas of dry grassland with high value for wildlife (linked to premiums for SSSI beef) could lead to a significant increase in agricultural/land management jobs (area increases by 2,500 ha under drier conditions, and 790 ha under wetter conditions)
Greenhouse gas flux Restoration of old workings enhances areas of wetland and minimises the likelihood of mineralisation from any remaining peat soils. Peat extraction in the Brue Valley ceases whether conditions become drier or wetter
Regional and national context
Efforts are made to protect habitats and associated biodiversity in the Brue Valley, with a view to maintaining connectivity between habitats and management at the landscape scale. If conditions become wetter, there may be the potential for management of the area as a functioning floodplain. Drier conditions may not necessarily lead to lower environmental quality, but could mean that the Brue Valley becomes less important as a wetland area

The Environmental and Socio-Economic Impacts of Climate Change in the Brue Valley
Page 200
6.5 Changes under the Local Stewardship Scenario Table 6.7 presents the gains and losses in area of each feature under the Local
Stewardship scenario, under both the 10% and 90% probabilities. Figure 6.4 gives an overview of the change in area from the 10% to the 90% probabilities, compared with the current area of each feature. The change in areas shown in Table 6.7 and Figure 6.4 relate to percentage change in the overall area under each feature, which are then presented as a number of hectares. These are estimates and are given to a maximum of two significant figures to reflect uncertainty.
Table 6.8 summarises the key environmental and socio-economic effects of climate
change that emerge under the Local Stewardship scenario, across the range of temperature and rainfall changes that UKCP models suggest are likely.

Risk & Policy Analysts, Geckoella and Environment Systems
Page 201
Table 6.7: Gains and Losses of Each Feature under the Local Stewardship Scenario
10% Probability 90% Probability Current
2060 2060 Feature
Area (ha)
Loss of Area (ha)
Gain in area (ha)
Final area and overall change
Change in Environmental
Quality
Loss of Area (ha)
Gain in area (ha)
Final area Change in
Environmental Quality
Cereal crops 381
-4 ha 4 ha to other
(settlements and roads)
+410 ha 160 ha from dry grassland of low wildlife value;
240 ha from wet grassland of low
wildlife value
780 ha
Potential for slight decrease
in environmental quality as more
land is converted to
crop land
-95 ha 19 ha to swamp and fen; 38 ha to wet grassland of
high wildlife value; 38 ha to
wet grassland of low wildlife
value
+200 ha 200 ha from dry grassland of low
wildlife value
490 ha
Overall decrease expected as
cropped area expands, but
note that quality is likely to
increase in areas which become
too wet for crops
Dry grassland of high wildlife value
58 0
+740 ha 410 ha from dry grassland of low wildlife value; 95 ha from wet
grassland of high wildlife value; 240 ha
from wet grassland of low
wildlife value
800 ha
Increase in environmental
quality expected provided land management is
adequate
-58 ha 6 ha to swamp
and fen; 52 ha to wet grassland of
high wildlife value
410 ha from dry grassland of low
wildlife value 410 ha
Minimal change expected since
losses of feature are balanced by
gains in area
Dry grassland of low wildlife value
4,057
-1,300 ha 160 ha to cereal crops; 410 ha to dry grassland of
high wildlife value; 81 ha to
lakes and ponds; 200 ha to
orchards and horticulture; 410
+240 ha 240 ha from wet grassland of low
value for wildlife
3,000 ha
Increases overall due to
some movement to higher quality
features (but note some loss to cereal crops)
-3,100 ha 200 ha to cereal crops; 410 ha to dry grassland of
high wildlife value; 200 ha to
orchards and horticulture; 410 ha to swamp and
fen; 810 ha to
0 1,000 ha
Potential for considerable increase in
environmental quality, but may take time before increase is fully
seen

The Environmental and Socio-Economic Impacts of Climate Change in the Brue Valley
Page 202
Table 6.7: Gains and Losses of Each Feature under the Local Stewardship Scenario
10% Probability 90% Probability Current
2060 2060 Feature
Area (ha)
Loss of Area (ha)
Gain in area (ha)
Final area and overall change
Change in Environmental
Quality
Loss of Area (ha)
Gain in area (ha)
Final area Change in
Environmental Quality
ha to woodland/ hedgerow/line of trees/scrub and bracken
wet grassland of high wildlife
value; 810 ha to wet grassland of
low wildlife value; 41 ha to wet heath and purple moor
grass; 200 ha to woodland/
hedgerow/line of trees/scrub and
bracken
Lakes/ponds 347
-38 ha 35 ha to
reedbeds; 3 ha to swamp and
fen
+180 ha 81 ha from dry
grassland of low wildlife value; 90 ha from peat works and bare
ground
490 ha
Potential for gain in
environmental quality as lakes and ponds are managed to
store rainwater
0
+120 ha 120 ha from
peat works and bare ground
470 ha
Increase in environmental quality as peat
workings restored
Orchards and horticulture
39 0
+370 ha 200 ha from dry grassland of low wildlife value; 48 ha from wet
grassland of high wildlife value; 120 ha
from wet grassland of low
410 ha
Potential loss of environmental quality as high
value habitat are brought into
productive use (with more to
mixed farming)
0
+200 ha 200 ha from dry grassland of low
wildlife value (linked to move
to mixed farming)
240 ha
Unlikely to be any significant
change in environmental
quality

Risk & Policy Analysts, Geckoella and Environment Systems
Page 203
Table 6.7: Gains and Losses of Each Feature under the Local Stewardship Scenario
10% Probability 90% Probability Current
2060 2060 Feature
Area (ha)
Loss of Area (ha)
Gain in area (ha)
Final area and overall change
Change in Environmental
Quality
Loss of Area (ha)
Gain in area (ha)
Final area Change in
Environmental Quality
wildlife value
Other (settlements and roads)
855 0 + 4 ha
4 ha from cereal crops
860 ha Minimal change
in quality expected
0 0 860 ha -
Peat works and bare ground
365
-200 ha 90 ha to lakes and ponds; 37 ha to reedbeds; 73 ha to swamp
and fen;
0 170 ha
Restoration of old peat works
improves environmental
quality, and reduces
mineralisation
-190 ha 120 ha to lakes
and ponds; 73 ha to reedbeds
0 170 ha
Restoration of disused peat works brings
some environmental
benefits
Reedbeds 326
-66ha 33 ha to swamp and fen; 33 ha to
woodland/ hedgerow/line of trees/scrub and bracken
+71 ha 35 ha from lakes
and ponds; 37 ha from peat
works and bare ground
330 ha Minimal change
expected 0
+110 ha 73 ha from peat works and bare ground; 32 ha
from swamp and fen
430 ha
Despite some losses to swamp and fen, overall
benefits expected due to restoration of peat works
Rivers/streams/ ditches/rhynes
22 0 0 22 ha Environmental quality likely to be maintained
0
+12 ha 12 ha from wet
grassland of low wildlife value
34 ha Environmental quality likely to be maintained
Swamp and fen 158
-24 ha 16 ha to wet grassland of high wildlife value; 8 ha to wet heath and purple moor
grass
+110 ha 3 ha from lakes and ponds; 73 ha from peat
works and bare ground; 33 ha from reedbeds
240 ha
Environmental quality probably
maintained, although dry
conditions are limiting
-32 ha 32 ha to reedbeds
+2,500 ha 19 ha from
cereal crops; 6 ha from dry grassland of high wildlife value; 410 ha
from dry
2,600 ha Environmental quality likely to
be enhanced

The Environmental and Socio-Economic Impacts of Climate Change in the Brue Valley
Page 204
Table 6.7: Gains and Losses of Each Feature under the Local Stewardship Scenario
10% Probability 90% Probability Current
2060 2060 Feature
Area (ha)
Loss of Area (ha)
Gain in area (ha)
Final area and overall change
Change in Environmental
Quality
Loss of Area (ha)
Gain in area (ha)
Final area Change in
Environmental Quality
grassland of low wildlife value;
240 ha from wet grassland of high wildlife
value; 1,800 ha from wet
grassland of low wildlife value; 7
ha from wet heath and purple
moor grass
Wet grassland of high value for wildlife
953
-150 ha 95 ha to dry grassland of high wildlife value; 9 ha to
lakes and ponds; 48 ha to
orchards and horticulture
+23 ha 16 ha from
swamp and fen; 7 ha from wet
heath and purple moor grass
820 ha
Partial loss. No overall change in environmental quality expected for remainder
-240 ha 240 ha to swamp
and fen
+900 ha 38 ha from
cereal crops; 52 ha from dry grassland of high wildlife value; 810 ha
from dry grassland of low wildlife value;
1,600 ha
Potential for increase in
environmental quality since
habitat is expected to be well managed
Wet grassland of low value for wildlife
2,439
-1,300 ha 240 ha to cereal crops; 240 ha to dry grassland of
high wildlife value; 240 ha to dry grassland of
low wildlife
0 1,100 ha
Environmental quality benefits due to increase
in area of habitat for high wildlife value.
Offset by loss of permanent
-2,300 ha 12 ha to
rivers/streams/ ditches/rhynes;
1,800 ha to swamp and fen;
490 ha to woodland/
+850 ha 38 ha from
cereal crops; 810 ha from dry grassland of low
wildlife value
960 ha
Potential for increase in
environmental quality if
wetland habitats prioritised for
funding

Risk & Policy Analysts, Geckoella and Environment Systems
Page 205
Table 6.7: Gains and Losses of Each Feature under the Local Stewardship Scenario
10% Probability 90% Probability Current
2060 2060 Feature
Area (ha)
Loss of Area (ha)
Gain in area (ha)
Final area and overall change
Change in Environmental
Quality
Loss of Area (ha)
Gain in area (ha)
Final area Change in
Environmental Quality
value; 120 ha to orchards and
horticulture; 490 ha to woodland/ hedgerow/line of trees/scrub and bracken
grassland, with peat
conservation and GHG
adverse effects arising from
drier conditions
hedgerow/line of trees/scrub and
bracken
Wet heath and purple moor grass
67
-7 ha 7 ha to wet grassland of high wildlife
value
+8 ha 8 ha from
swamp and fen 68 ha
No change in quality since
efforts are made to ensure that rare feature is well managed
-7 ha 7 ha to swamp
and fen
+41 ha 41 ha from dry
grassland of low wildlife value
100 ha
High priority placed on
maintaining and extending this habitat type
Woodland/hedgerow/line of trees/scrub and bracken
341 0
+930 ha 410 ha from dry grassland of low wildlife value;
33 ha from reedbeds; 490 ha
from wet grassland of low
value for wildlife
1,300 ha
Potential decrease in quality as
wetland habitats are lost
0
+690 ha 200 ha from dry grassland of low wildlife value;
490 ha from wet grassland of low
wildlife value
1,000 ha
Wildlife value generally retained,
although species composition
shifts with move to scrub and woodland

The Environmental and Socio-Economic Impacts of Climate Change in the Brue Valley
Page 206
0 500 1000 1500 2000 2500 3000 3500 4000 4500
Rivers/streams/ditches/rhynes
Orchards and horticulture
Dry grassland of high wildlife value
Wet heath and purple moor grass
Swamp and fen
Reedbeds
Woodland/hedgerow/line of trees/scrub and bracken
Lakes/ponds
Peat works and bare ground
Cereal crops
Other (settlements and roads)
Wet grassland of high value for wildlife
Wet grassland of low value for wildlife
Dry grassland of low wildlife value
Area (ha)
CURRENT
Local Stewardship (10%)
Local Stewardship (90%)
Figure 6.4: Change in Area from Current under the Local Stewardship Scenario

Risk & Policy Analysts, Geckoella and Environment Systems
Page 207
Table 6.8: Key Changes under the Local Stewardship Scenario
Factor Description of Changes
Overview of scenario
Intensification of farmland reduces with a move towards local sustainability. Operations trend towards mixed farming, with water management undertaken at the catchment scale and run by local farmers. People become highly skilled as specialised activities develop locally. However, costs of inputs increase due to local supply and demand. Consequently, food prices increase due to more sustainable and smaller scale production. Peat extraction may occur at the local level to meet demand in the vicinity. Planning decisions are also made at the local level. Management of flood risk is undertaken locally; however this may increase the risk downstream. In terms of saline intrusion, the Brue Valley is reliant on coastal communities deciding to protect against tidal flooding
Overall environmental quality
Potential for maintenance or even increase in environmental quality due to movement away from dry grassland of low wildlife value towards that of high wildlife value (and towards wetland habitats e.g. swamp and fen under the 90% scenario)
Localised changes in environmental quality
Moves to meet local demands could result in greater mosaic of habitats, this could lead to fragmentation and/or smaller pockets of habitats rather than larger continuous areas
Impacts on freshwater availability
Water management (in particular, digging of ponds by farmers under drier conditions) along with restoration of peat workings means that the area of lakes and ponds increases whether conditions become wetter (+120 ha) or drier (+140 ha). Management avoids change in area of rivers, streams, ditches or rhynes if conditions become drier. However, with wetter conditions, more drainage is required, thus increasing the area covered by watercourses and ditches by 12 ha (from 22 ha)
Impacts on biodiversity
Local changes in species composition likely. Drier conditions likely to result in loss of wetland habitats (including wet grassland of high value for wildlife, which might decrease by 130 ha). Much wetter conditions could result in loss of both dry and wet grassland, with both potentially becoming swamp and fen. Although conservation would probably have a high priority, management would likely be patchy, thus impacts on supported species and protected areas could be negative
Socio-economic impacts
Development of new skills to minimise impacts on jobs whilst maintaining environmental quality, whether conditions become drier or wetter. Movement towards mixed farming could help support existing jobs, but could be some loss if move is from dairy to mixed. Potential for taking advantage of new marketing ideas and products such as “SSSI beef”
Greenhouse gas flux Mineralisation will decrease since there will be less peat extraction under both wetter and drier conditions. Peat workings will be restored, thus enhancing wetland habitats
Regional and national context
Efforts are made to protect habitats and associated biodiversity in the Brue Valley, however, patchy management and desire for local environmental sustainability means that there are pressures on some habitats. If conditions become wetter, the area covered by wetland habitats is likely to increase as wetland species thrive. Drier conditions may not necessarily lead to lower environmental quality, but could mean that the Brue Valley becomes less important as a wetland area, for example, there is loss of both wet grassland of high value for wildlife (-130 ha) and of low value for wildlife (-1,300 ha)
6.6 Overall Changes
Figure 6.5 shows whether the changes relate to a move to higher or lower environmental quality, and wetter or drier features overall. Table 6.9 identifies which features have been allocated to the wetter and drier features.

The Environmental and Socio-Economic Impacts of Climate Change in the Brue Valley
Page 208
Table 6.9: Allocation of Features to Wetter and Drier
Wetter Features Drier Features
Lakes/ponds Cereal crops
Reedbeds Dry grassland of high value for wildlife
Rivers/ditches/streams/rhynes Dry grassland of low value for wildlife
Swamp and fen Orchards and horticulture
Wet grassland of high value for wildlife Other (settlement and roads)
Wet grassland of low value for wildlife Peat works and bare ground
Wet heath and purple moor grass Woodland/hedgerow/lines of trees/scrub and bracken
Reduction in environmental quality Improvement in environmental quality
Ch
ang
e in
are
a o
f fe
atu
res
(ha)
Current
World Markets (10%)
World Markets (90%) Mo
ve t
o w
ette
r fe
atu
res
Mo
ve
to d
rie
r fe
atu
res
Provincial Enterprise (90%)
Provincial Enterprise (10%)
Local Stewardship (90%)
Local Stewardship (10%)
Global Sustainability (10%)
Global Sustainability (90%)
Figure 6.5: Overall Change in Environmental Quality and Move to Wetter or Drier Features under the Scenarios33
Figure 6.5 highlights the differences between the socio-economic scenarios in terms
of areas of features based on their biodiversity value combined with impacts on environmental quality of the features themselves. Actions under the Global
33 The points at which each socio-economic scenario and probability have been plotted are based on the
area of wetter or drier habitats and a weighted average of the environmental change calculated by multiplying the area under each feature by a score assigned to the biodiversity quality of each feature using the same classification as for Map 2.5, where high = +1, medium = 0, and low = -1. The impact of the scenario on the environmental quality of the feature itself is reflected as increase in quality (+1), no change (0), decrease in quality (-1). This ignores any change in area and considers the likely impact of pressures caused by each scenario on environmental quality. This is a simplification used to illustrate the variation in change between the four socio-economic scenarios and the two climate change probabilities.

Risk & Policy Analysts, Geckoella and Environment Systems
Page 209
Sustainability (90%) scenario result in the greatest improvements in environmental quality. Actions under the Global Sustainability (10%) scenario and both Local Stewardship scenarios also result in significant improvements, but are slightly less beneficial for the environment than the Global Sustainability (90%) scenario. The World Markets scenarios (under both climate probabilities) show slight reductions in environmental quality, whilst the Provincial Enterprise scenarios perform the worst. Indeed, the Provincial Enterprise (10%) scenario results in significant decreases in environmental quality. Figure 3.6 (see Section 3) shows that conventional development lies more towards the World Markets scenario, with a trend towards increasing globalisation and a more economic, consumerism focus. This suggests that the move from current could tend towards a slight decrease in environmental quality.
To better illustrate the move to drier or wetter features, Figure 6.6 (a to i) sets out a series of pie-charts showing how the proportion of drier and wetter features changes from current, across each of the four socio-economic scenarios. The figure shows that the 90% probability typically results in a much higher proportion of wetter habitats, which reflects the much wetter conditions projected. The pattern of changes is similar for all four scenarios under the 90% probability. For the 10% probability, the Provincial Enterprise scenario results in a significant increase in the area of drier habitats when compared with the other three scenarios, which show broadly similar areas. However, despite the similarities at the landscape scale between the Local Stewardship, Global Sustainability and World Markets scenarios (in terms of wetter and drier habitats), it is important to remember that there are local differences as discussed in the storylines.
Wet habitats4,31241%
Drier habitats6,09659%
Key: Wetter habitats Drier habitats
Figure 6.6a: Current proportion of wetter and drier features

The Environmental and Socio-Economic Impacts of Climate Change in the Brue Valley
Page 210
Figure 6.6b: Proportion of wetter and drier features under World Markets 10%
Figure 6.6c: Proportion of wetter and drier features under World Markets 90%
Figure 6.6d: Proportion of wetter and drier features under Provincial Enterprise 10%
Figure 6.6e: Proportion of wetter and drier features under Provincial Enterprise 90%
Figure 6.6f: Proportion of wetter and drier features under Global Sustainability 10%
Figure 6.6g: Proportion of wetter and drier features under Global Sustainability 90%
Wet habitats3,65135%
Drier habitats6,75765%
Wet habitats6,69664%Drier habitats
3,71236%
Wet habitats2,04920%
Drier habitats8,35980%
Wet habitats
5,97057%Drier habitats
4,43843%
Wet habitats3,46233%
Drier habitats6,94667%
Wet habitats6,56163%
Drier habitats3,84737%

Risk & Policy Analysts, Geckoella and Environment Systems
Page 211
Figure 6.6h: Proportion of wetter and drier features under Local Stewardship 10%
Figure 6.6i: Proportion of wetter and drier features under Local Stewardship 90%
The patterns shown in Figure 6.6 give an indication of the overall change in wetter and drier features, but there are also impacts in terms of habitat fragmentation and isolation. The Provincial Enterprise and Local Stewardship scenarios, which are based on localism, are more likely to increase fragmentation. The Provincial Enterprise scenario is likely to result in the highest level of habitat fragmentation due to the way that the area is managed. The World Markets and Global Sustainability scenarios will reduce fragmentation. In particular, the approach to floodplain-style management under the Global Sustainability scenario is expected to result in significant biodiversity benefits at the landscape scale. Table 6.10 sets out the features that are most likely to change as a result of future climate change and the potential adaptation measures that could be used under the socio-economic scenarios. This identifies which features are likely to be more (and less) sensitive to climate change, and the adaptation measures suggested under the socio-economic scenarios. In this way, the table identifies which features may be priorities in terms of future management and adaptation options.
Table 6.10: Features Most Likely to be Impacted by Climate Change and the Implications
Feature Impacts Implications
Lik
ely
Hig
hes
t P
rior
ity
Wet grassland of high value for wildlife
Drier conditions lower water levels with knock-on impacts for biomass production and qualitative change in species composition as well as impacts on RWLA birds
Lower biomass could affect value of grass for livestock, reducing yield and leading to increased costs for alternative feed. However, drier conditions could also increase the length of the grazing season (since ground would not be too wet) Qualitative changes affect ability of habitat to support other species e.g. breeding waders
Wet habitats3,07730%
Drier habitats7,33170%
Wet habitats6,24060%
Drier habitats4,16840%

The Environmental and Socio-Economic Impacts of Climate Change in the Brue Valley
Page 212
Table 6.10: Features Most Likely to be Impacted by Climate Change and the Implications
Feature Impacts Implications
Hotter and wetter conditions may increase biomass production, but could lead to move towards swamp and fen. Potential negative impacts for flower-rich wet meadows and breeding waders
Change in feature to swamp and fen decreases potential for use of land for livestock grazing, with associated impacts on income. Overall biodiversity value may decrease. However, careful management of move to wetter features could increase habitat connectivity for wetland areas
Reduced biomass in drier conditions
Possible reduction in income to farmers (but note that given overall water availability in the Brue, hay crops might stay higher than in other parts of the country, potentially leading to increased revenue from hay)
Dry grassland of high wildlife value
Much wetter conditions could result in waterlogging stress. Increased runoff and flooding could change species composition
Potential for change in species composition or, where changes are greater, for a move to a different habitat
Lower rainfall decreases water table, leading to change in species composition as drier species are favoured
Potential for loss of wet heath, purple moor grass and associated species from Brue Valley as areas dry out. Greenhouse gas emissions could increase. Potential also for management costs (cutting and grazing) to increase
Wet heath and purple moor grass
Wetter conditions in combination with higher temperatures increase biomass production, but too much water could lead to change to swamp and fen
Potential for loss of wet heath, purple moor grass and associated species from Brue Valley as areas become too wet. Potential for management costs (cutting and grazing) to increase. However, areas which were previously too dry might become suitable for wet heath and purple moor grass
Potential for desiccation and lower dissolved oxygen levels to affect biodiversity
Loss of aquatic flora and fauna during drier years, with negative impacts for biodiversity. Also possible loss of wet fences
Rivers/streams/ditches/rhynes Wetter conditions support the habitat, but contaminated run-off may be a problem. Also, higher temperatures affect dissolved oxygen levels
Potential for some loss of habitat quality due to runoff, as well as low dissolved oxygen. Possible negative impacts for biodiversity

Risk & Policy Analysts, Geckoella and Environment Systems
Page 213
Table 6.10: Features Most Likely to be Impacted by Climate Change and the Implications
Feature Impacts Implications
Peat extraction may be facilitated by drier conditions, opening up access to areas which were previously too wet (dependent on scenario). Note however that a recent Defra consultation has examined the potential phasing out of the use of peat by 2030, so extraction may not be permitted whatever the climatic conditions
Change in greenhouse gas flux likely. Potential change in number of jobs in the peat extraction industry
Peat works and bare ground
Peat extraction may be hindered by wetter conditions (note that extraction may not be permitted in any case if current plans to eliminate the use of peat are put into action)
Jobs supported by peat extraction may reduce due to fewer extraction opportunities and/or increased costs due to need for increased pumping of water. Change in greenhouse gas flux likely
Potential for decreased rainfall to lower water table and lead to decreased biomass production
Decreased biomass production decreases value of grass for livestock, with negative impacts for income levels (but note that given water availability in the Brue, hay crops might stay higher than in other parts of the country, potentially leading to increased revenue from hay)
Wet grassland of low value for wildlife
Increased temperature and rainfall could increase biomass production, but large increase could lead to change to swamp and fen. Contaminated runoff could affect species competition
Potential change to swamp and fen decreases suitability of habitat for livestock, with higher temperatures also affecting pest and disease levels. Potential impacts for income levels
Reduced biomass in drier conditions
Reduction in income to farmers (but note that given water availability in the Brue, hay crops might stay higher than in other parts of the country, potentially leading to increased revenue from hay)
Dry grassland of low wildlife value
Increased runoff and flooding could change species composition Much wetter conditions could result in waterlogging stress
Potential for change in species composition or, where changes are greater, for a move to a different habitat
Drier conditions may lead to change in species composition with terrestrial woody species benefiting
Expansion of areas of carr woodland, increasing fragmentation of reedbeds
Reedbeds Wetter conditions support reedbeds, with productivity increasing with higher temperatures
Increased growth of reedbeds leads to greater carbon sequestration and brings benefits for reedbed species

The Environmental and Socio-Economic Impacts of Climate Change in the Brue Valley
Page 214
Table 6.10: Features Most Likely to be Impacted by Climate Change and the Implications
Feature Impacts Implications
Potential (small) reductions in yields under drier conditions
Loss of farm income, with potential knock-on effect on jobs from reduced quality or yield of crops (but potential opportunity to grow new varieties which are more suited to hotter, drier condition)
Orchards and horticulture
Potential impacts from pests and diseases under warmer, wetter conditions. Flooding could damage crops, reducing incomes
Loss of farm income, with potential knock-on effect on jobs from reduced quality or yield of crops
Drier conditions may put habitat under stress, affecting some species
Potential for loss of biodiversity in swamp and fen communities as sensitive species affected by changing water table and water quality (due to occasional spikes in contaminant levels)
Swamp and fen
Wetter and hotter conditions likely to lead to qualitative changes in species composition as well as increasing biomass production
Species composition of existing swamp and fen may alter, but new areas may also form as other features (e.g. wet grassland) become too wet, so ultimately there could be benefits for swamp and fen species
Potential reduction in yields under drier conditions
Reduction in income to farmers (unless varieties which are less sensitive to drought are grown)
Cereal crops Potential impacts from waterlogged soils under wetter conditions
Reduction in yields and income to farmers (unless varieties which are more tolerant of waterlogging are grown)
Reduction in dissolved oxygen (DO) levels due to warmer and drier conditions
Effects on flora and fauna due to reduced DO. Where significant, this could limit population levels and biodiversity
Lakes/ponds
Potential increase in nutrients from runoff under wetter conditions
Effects on flora and fauna due to raised pollutant levels. Where significant, this could limit population levels and biodiversity
Increased pressure on water resources for drinking water under drier conditions Decreased risk of pluvial flooding
May affect tourism-related enterprises and recreation (e.g. access to habitats and features). But benefits for property owners/occupiers in terms of reduced flood risk
Other (settlements and roads)
Increased risk of flooding following heavy rain and/or due to increasingly waterlogged soils
May affect tourism-related enterprises and recreation (e.g. access to habitats and features)
Lik
ely
Low
est
Pri
orit
y
Woodland/hedgerow/line of trees/scrub and bracken
Higher temperatures and lower rainfall increase growing season but also change regeneration patterns and increase the risk of pests and diseases
Some qualitative changes in biodiversity anticipated. Longer growing season may bring benefits, possibly allowing hedges to replace wet fences where conditions are too dry to maintain water levels
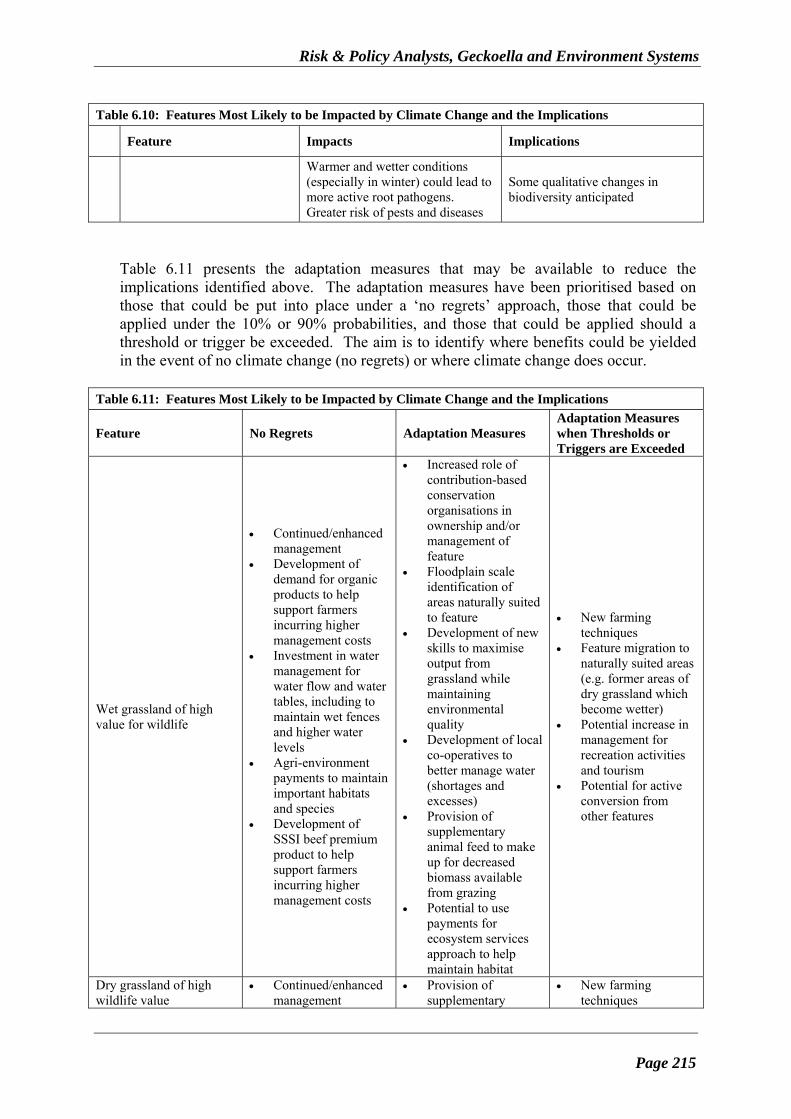
Risk & Policy Analysts, Geckoella and Environment Systems
Page 215
Table 6.10: Features Most Likely to be Impacted by Climate Change and the Implications
Feature Impacts Implications
Warmer and wetter conditions (especially in winter) could lead to more active root pathogens. Greater risk of pests and diseases
Some qualitative changes in biodiversity anticipated
Table 6.11 presents the adaptation measures that may be available to reduce the implications identified above. The adaptation measures have been prioritised based on those that could be put into place under a ‘no regrets’ approach, those that could be applied under the 10% or 90% probabilities, and those that could be applied should a threshold or trigger be exceeded. The aim is to identify where benefits could be yielded in the event of no climate change (no regrets) or where climate change does occur.
Table 6.11: Features Most Likely to be Impacted by Climate Change and the Implications
Feature No Regrets Adaptation Measures Adaptation Measures when Thresholds or Triggers are Exceeded
Wet grassland of high value for wildlife
Continued/enhanced management
Development of demand for organic products to help support farmers incurring higher management costs
Investment in water management for water flow and water tables, including to maintain wet fences and higher water levels
Agri-environment payments to maintain important habitats and species
Development of SSSI beef premium product to help support farmers incurring higher management costs
Increased role of contribution-based conservation organisations in ownership and/or management of feature
Floodplain scale identification of areas naturally suited to feature
Development of new skills to maximise output from grassland while maintaining environmental quality
Development of local co-operatives to better manage water (shortages and excesses)
Provision of supplementary animal feed to make up for decreased biomass available from grazing
Potential to use payments for ecosystem services approach to help maintain habitat
New farming techniques
Feature migration to naturally suited areas (e.g. former areas of dry grassland which become wetter)
Potential increase in management for recreation activities and tourism
Potential for active conversion from other features
Dry grassland of high wildlife value
Continued/enhanced management
Provision of supplementary
New farming techniques

The Environmental and Socio-Economic Impacts of Climate Change in the Brue Valley
Page 216
Table 6.11: Features Most Likely to be Impacted by Climate Change and the Implications
Feature No Regrets Adaptation Measures Adaptation Measures when Thresholds or Triggers are Exceeded
Investment in water management for water flow and water tables, including to maintain wet fences and higher water levels
Agri-environment payments to maintain important habitats and species
animal feed to make up for decreased biomass available from grazing
Change to crops or management of grassland that reflects changing water flow / table level
Floodplain scale identification of areas naturally suited to feature
Increased role of contribution-based conservation organisations in ownership and/or management of feature
Development of new skills to maximise output from grassland while maintaining environmental quality
Potential to use payments for ecosystem services approach to help maintain habitat
Feature migration to naturally suited areas
Potential for active conversion from other features (e.g. wet grassland which is drying out)
Wet heath and purple moor grass
Continued/enhanced management
Investment in water management to enable continued (or improved) control water levels
Development of demand for organic products to help support farmers incurring higher management costs
Management of land surrounding watercourses to minimise risk of pollutants in runoff
Targeting of agri-environment payments to maintain important habitats
Increased role of contribution-based conservation organisations in ownership and/or management of feature
Feature migration to naturally suited areas e.g. close to other wetland habitats to enhance habitat connectivity
Potential for active conversion from other features
Potential increase in management for recreation activities and tourism
Rivers/streams/ditches/ rhynes
Continued/enhanced management
Investment in water management to
Management of banks (slopes, scrub)
Management of land surrounding
Potential increase in management for angling or other recreation activities

Risk & Policy Analysts, Geckoella and Environment Systems
Page 217
Table 6.11: Features Most Likely to be Impacted by Climate Change and the Implications
Feature No Regrets Adaptation Measures Adaptation Measures when Thresholds or Triggers are Exceeded
enable continued (or improved) control water levels
watercourses to minimise risk of pollutants entering the water
Targeting of agri-environment payments to maintain important habitats
Increased role of contribution-based conservation organisations in ownership and/or management of feature
Potential to use payments for ecosystem services approach to help maintain habitat
Potential for active conversion from other features
Replacement of wet fences with fencing to allow grazing to continue
Peat works and bare ground
Investment in water management to restore sites to high ecological quality and also better control mineralisation of any remaining peat soils
Use of new skills and technology to restore peat workings and bring benefits for wetlands
Abandonment of peat workings due to wetter conditions (note peat extraction may not be permitted in any case)
Wet grassland of low value for wildlife
Investment in water management for water flow and water tables, including to maintain wet fences and higher water levels
Provision of supplementary animal feed to make up for decreased biomass available from grazing
Intensification (e.g. to secure food supplies and/or to allow other areas to be maintained for biodiversity)
Move to mixed farming to better manage land in line with changing climatic conditions
Potential development of local co-operatives to better manage water (shortages and excesses)
Targeting of agri-environment payments to maintain
Feature migration to naturally suited areas (e.g. dry grassland which becomes too wet)
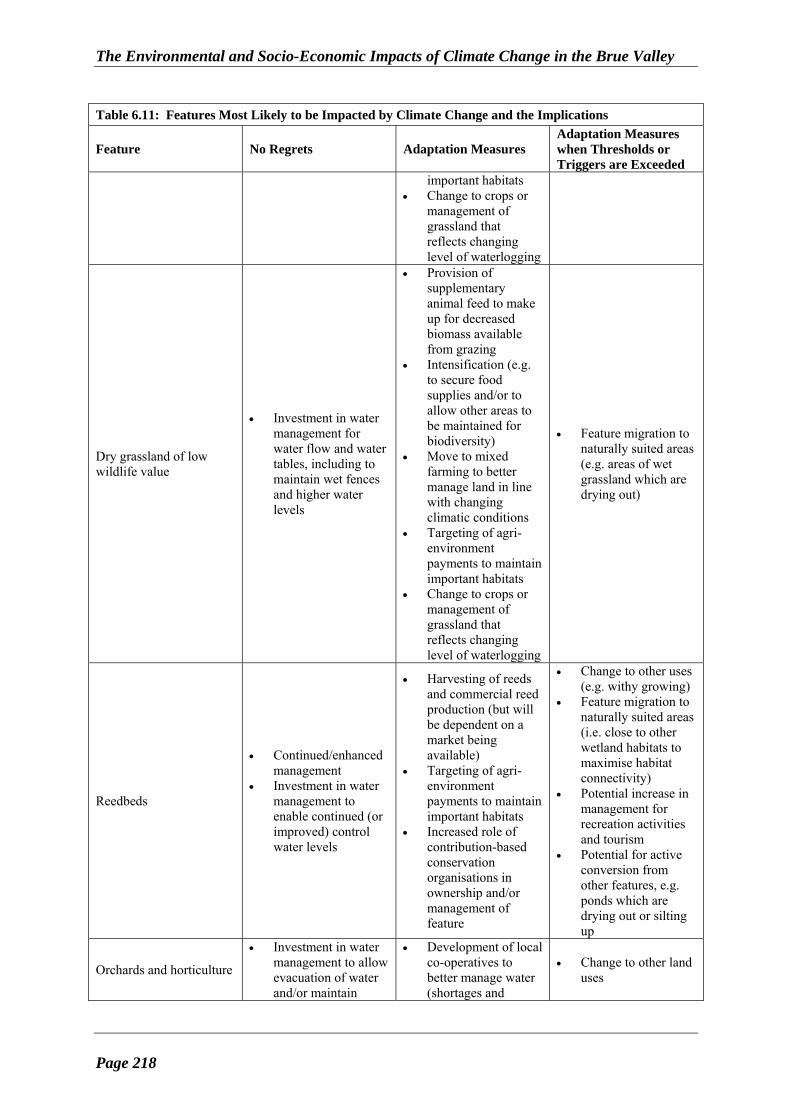
The Environmental and Socio-Economic Impacts of Climate Change in the Brue Valley
Page 218
Table 6.11: Features Most Likely to be Impacted by Climate Change and the Implications
Feature No Regrets Adaptation Measures Adaptation Measures when Thresholds or Triggers are Exceeded
important habitats Change to crops or
management of grassland that reflects changing level of waterlogging
Dry grassland of low wildlife value
Investment in water management for water flow and water tables, including to maintain wet fences and higher water levels
Provision of supplementary animal feed to make up for decreased biomass available from grazing
Intensification (e.g. to secure food supplies and/or to allow other areas to be maintained for biodiversity)
Move to mixed farming to better manage land in line with changing climatic conditions
Targeting of agri-environment payments to maintain important habitats
Change to crops or management of grassland that reflects changing level of waterlogging
Feature migration to naturally suited areas (e.g. areas of wet grassland which are drying out)
Reedbeds
Continued/enhanced management
Investment in water management to enable continued (or improved) control water levels
Harvesting of reeds and commercial reed production (but will be dependent on a market being available)
Targeting of agri-environment payments to maintain important habitats
Increased role of contribution-based conservation organisations in ownership and/or management of feature
Change to other uses (e.g. withy growing)
Feature migration to naturally suited areas (i.e. close to other wetland habitats to maximise habitat connectivity)
Potential increase in management for recreation activities and tourism
Potential for active conversion from other features, e.g. ponds which are drying out or silting up
Orchards and horticulture
Investment in water management to allow evacuation of water and/or maintain
Development of local co-operatives to better manage water (shortages and
Change to other land uses

Risk & Policy Analysts, Geckoella and Environment Systems
Page 219
Table 6.11: Features Most Likely to be Impacted by Climate Change and the Implications
Feature No Regrets Adaptation Measures Adaptation Measures when Thresholds or Triggers are Exceeded
water tables excesses) Investment in new
pest and disease resistant crops
Change in growing methods/ management to reduce effect of pests and diseases
Targeting of agri-environment payments to maintain important habitats (e.g. old orchards)
Swamp and fen
Continued/enhanced management
Investment in water management to enable continued (or improved) control water levels
Management of land surrounding watercourses to minimise risk of pollutants in runoff
Targeting of agri-environment payments to maintain important habitats
Increased role of contribution-based conservation organisations in ownership and/or management of feature
Feature migration to naturally suited areas, for example, wet grassland if conditions become wetter
Potential increase in management for recreation activities and tourism
Potential for active conversion from other features, such as areas of reedbed if these have silted up and are becoming drier
Cereal crops
Investment in water management to allow evacuation of water and/or maintain water tables
Change to more resilient or resistant crops
Extensification Change in land use
away from crops
Lakes/ponds
Continued/enhanced management
Water levels managed to retain lakes and ponds with high species diversity
Agri-environment payments to maintain important wetland features
Creation of new lakes/ponds to capture rainwater and improve habitat connectivity
Localised deepening and more ‘ledges’ for waterbodies to maintain edges and deep water habitats across a range of water flow / table conditions
Use of lakes/ponds as part of wider restoration of floodplain function
Potential for active conversion from other features
Potential increase in management for recreation activities and tourism
Other (settlements and roads)
Water efficiency/ conservation to avoid wastage of drinking water
Use of technology to minimise water use/ water loss
Development of co-operatives to manage local water supplies

The Environmental and Socio-Economic Impacts of Climate Change in the Brue Valley
Page 220
Table 6.11: Features Most Likely to be Impacted by Climate Change and the Implications
Feature No Regrets Adaptation Measures Adaptation Measures when Thresholds or Triggers are Exceeded
Woodland/hedgerow/line of trees/scrub and bracken
Continued/enhanced management (including to avoid negative impacts associated with corvids)
Targeting of agri-environment payments to maintain important habitats (including networks)
Feature migration to naturally suited areas
Risk & Policy Analysts, Geckoella and Environment Systems
Page 221
7. IMPACTS ON ECOSYSTEM SERVICES 7.1 Introduction This Section assesses the impacts of the changes under each scenario and probability
on the provision of ecosystem services. The potential changes are compared against the baseline description of ecosystem services (Section 2.5). Full details of the changes are provided in Annex 3.
7.2 Level of Confidence in the Projected Change in Ecosystem Services
It is important to recognise when considering the description of ecosystem services provided under each scenario that these comprise one possible projection of the likely change in ecosystem services. They are not predictions. The use of scenarios is intended to help ‘tease out’ the salient issues, including identification of the ecosystem services most likely to come under pressure, or to improve in delivery, taking climate change into account. The main sources of uncertainty in the projected change in ecosystem services are: the direction of change for the main land uses: farming, conservation, peat
extraction and settlements and developments (see Section 3.2.3). The key implications of these uncertainties are that changes in some of the principles underlying the scenarios would affect the projected changes in ecosystem services. For example, changes in the price of food and/or inputs (e.g. commodities) that affect the profitability of the land are likely to have a significant impact on the response. Under Provincial Enterprise, for example, a reduction in profitability may lead to abandonment of large areas of land as there is little concern for farming for the environment, with declining agri-environment payments. An increase in profitability of cereal crops could see further increases in the area of arable land (with this also likely under the World Markets scenario).
the predicted impacts on each feature from climate change (see Section 4.6). By
taking the high emissions scenario and a range of probabilities (10% and 90%), it has been possible to identify a range of adaptation measures that could reduce the negative impacts of climate change. If future changes in precipitation (in particular) are lower than projected, then fewer adaptation measures may be needed. This has been assessed to some extent in Section 6.6, through consideration of which adaptation measures might be needed under different future changes in climate.
non-linear changes in response to climate change. Feature sensitivity to frequency
and duration of extreme events such as flooding can in some cases be derived from published data. In addition to these extreme events, climate changes and responses are unlikely to be linear in character or rate. Temperature and rainfall, as well as state support and economic fortunes, are likely to ebb and flow over time, with, for example, predicted CP09 changes, representing average values for

The Environmental and Socio-Economic Impacts of Climate Change in the Brue Valley
Page 222
a variable trend. The approach taken enables the qualitative assessment of the implications of non-linear change within the storylines. However, this topic is recommended for further study, especially for ecosystem services such as biodiversity, which are particularly vulnerable to non-linear and unpredictable change.
the projected change in area of each feature. These area changes reflect
cumulative impacts from climate and socio-economic change. Different socio-economic scenarios have a different character of response to climate change, relating to, for example, adaptive investment in management of the water regime. The direction of change for the main land uses will therefore vary from scenario to scenario (see the storylines for each scenario in Section 5). The area change figures presented offer a plausible result for each combination of socio-economic and climate factors, taking into account successional relationships between different features, where every change in area has knock-on effects for other areas. There are, in fact, a range of area changes that would be possible for each combination of socio-economic and climate factors. The objective here is to present a coherent series of plausible area changes, to help identify over-arching patterns of feature response that hold true across a range of circumstances. Area changes should not therefore be considered in isolation, and are not predictions. The projected changes in area take account of adaptation measures under the more extreme climate change projections. They also reflect the expected response to climate change in line with the projected socio-economic changes under each scenario. If the direction of change of these drivers were to change from the assumptions made in Section 3.2.3 (and described more fully in Annex 5), then it is likely that the projected areas of each feature would also change. It should also be borne in mind that there are location specific limitations to adaptation. Although the projected area changes are considered generally realistic across the Brue Valley area, the likelihood of change in a particular location will be influenced by local water table and flow, topography, and socio-economic factors such as fragmented ownership and access for management. This spatial element has not yet been modelled in detail, but would be ripe for future study, to refine adaptation recommendations to those more naturally suited to a particular location.
the projected change in environmental quality of the feature, also driven by the
projected impacts on each feature from climate change and the direction of change for the main land uses under the scenarios (summarised in Section 6). As with the change in area, the projected change in environmental quality reflects the climate change projections and the socio-economic drivers. Any changes to either of these would be expected to affect the projected change in environmental quality of the features.
The change in area and environmental quality are used as the main indicators of changes in ecosystem services under each scenario. In addition to the uncertainties arising as a result of the approach used to estimate changes in area and environmental quality of each feature, there are also uncertainties associated with the description and quantification of ecosystem services provided. For some services, uncertainty arises as a result of:

Risk & Policy Analysts, Geckoella and Environment Systems
Page 223
a lack of detailed data on the current level of services, especially for the Brue Valley specifically (rather than the Somerset Levels and Moors, or the county of Somerset). For example, this affects services such as nutrient cycling where the amounts of N and P cycled in the soils are based on generic factors rather than feature specific factors. As a result, it is not possible to reflect changes in the amounts of N and P cycled that reflect changes in the areas of the different features.
lack of an agreed dataset or approach to estimate the change in service. For
example, this affects the confidence levels for emissions of GHGs and sequestration of GHGs. Here it has been possible to report changes due to data being available for the Brue Valley. However, the approach used is not considered robust enough to be used to report absolute levels for the baseline.
the predicted level of services being defined as a direct relationship to the area of
the features considered to provide that service (although changes in environmental quality are also taken into account, where possible, and for some services, such as landscape, qualitative assessments at the valley scale have been included). For example, this affects the confidence levels for biodiversity, where a simple scoring system has been used to convert the change in area and change in environmental quality into an overall assessment of likely change in biodiversity ‘quality’.
use of current valuations to estimate changes level of income and jobs. Use has
been made of existing models (such as Econi34), where possible, to ensure that any uncertainties are consistent across different services. For example, this affects the confidence levels for food production, peat for horticulture and recreation and tourism where multipliers are used to assess the number of jobs supported by current levels of income and are assumed to be applicable to the future situation. The ‘conservation economy’, where biodiversity and heritage are a large part of the job description for workers is a sector important to the Brue Valley. Assumptions on the economic value of this sector in terms of jobs and income have been adapted from the tourism and agriculture sectors where local and specific datasets have not been available.
data that reflect baseline information that are difficult to use when projecting the
change in outcomes under the scenarios. For example, this affects confidence levels for aesthetics (where benefits are based on a willingness to pay (wtp) survey, but changes in landscape value cannot be estimated using the wtp results as it is not possible to match up projected changes to the landscape with the wtp values derived) and recreation and tourism (where future income from changes in visitor numbers cannot be quantified with even a low degree of confidence).
Overall, therefore, the level of confidence in the results for each ecosystem services is likely to be variable. However, the use of scenarios and projected outcomes means that there is moderate level of confidence when considering differences between the scenarios. Although the fine details for each ecosystem service, in some cases, need
34 http://www.economicsystems.co.uk/south-west/index.php

The Environmental and Socio-Economic Impacts of Climate Change in the Brue Valley
Page 224
more data, the collated trends are expected to hold broadly true based on current knowledge. These trends reveal that different socio-economic contexts can have large effects on how ecosystem services are delivered in the Brue Valley, taking into account climate change. This provides an opportunity to focus on the ecosystem services most at risk under a wide range of climate and socio-economic scenarios, and to identify the ecosystem services that represent the greatest opportunity for gains. It also helps us to assess the implications of broad policy directions.
7.3 Changes under the World Markets Scenario The World Markets scenario is characterised by greater globalisation and rapid
economic growth. It is based on an increase in consumerism and privatisation, but with central Government control to help meet global targets and policies. It results in a move towards larger farming corporations and increased private contributions to conservation organisations and agri-environment payments to meet the global targets and policies on sustainability and environmental quality. The focus on profitability means that some grassland is likely to be converted to arable (due to reduction in agri-environment payments such as ESA), although grassland of high value for wildlife that is managed to produce premium products (such as SSSI beef) is likely to be retained (and may be expanded) to increase opportunities from profits.
Table 7.1 compares the changes projected under the World Markets scenario for the
10% and 90% probabilities with the baseline ecosystem services.
Table 7.1: Ecosystem Services under the World Markets Scenario
World Markets Ecosystem Service
Baseline Description of Services 10% 90%
Provisioning Services
Biochemicals, natural medicines and pharmaceuticals
None Investment in new crops may identify potential for biochemicals
Investment in new crops may identify potential for biochemicals
Biodiversity
High value features: 1,931 ha (19% of the total area), Moderate value features: 6,876 ha (66% of the total area). Low value features: 1,601 ha (15% of the total area)
Area under high value features increases to 23% Area under moderate value features reduces to 47% Area under low value features increases to 31% Overall, biodiversity value is expected to decrease slightly in area of high quality habitat compared with the baseline, in addition some habitats may undergo qualitative declines arising from changing conditions
Area under high value features increases to 33% Area under moderate value features reduces to 47% Area under low value features increases to 20% Overall, biodiversity value is expected to increase slightly in area of high quality habitat compared with the baseline, although some habitats may undergo qualitative declines arising from changing conditions (and there will be change of around 800 ha from grassland to arable land)
Fibre production None Potential for increased withy production, but unlikely to be significant
Potential for increased withy production, but unlikely to be significant

Risk & Policy Analysts, Geckoella and Environment Systems
Page 225
Table 7.1: Ecosystem Services under the World Markets Scenario
World Markets Ecosystem Service
Baseline Description of Services 10% 90%
benefits in terms of fibre benefits in terms of fibre
Food production
Annual value of food production is around £8.8 million, supporting around 530 agricultural jobs
Annual value of food production increases by almost 100% (to £17 million) due to a large increase in the area of cereal crops (+1,600 ha) and orchards and horticulture (+800 ha). Number of agriculture jobs increases significantly to more than 1,000
Annual value of food production increases by almost 40% (to £12 million) due to an increase in the area of cereal crops (+650 ha), orchards and horticulture (+400 ha) and wet grassland (+1,600 ha). Number of agriculture jobs increases to around 730
Fuel provision None Unlikely to be opportunities for increased fuel provision
Unlikely to be opportunities for increased fuel provision
Ornamental resources Limited withy production Potential for increased withy production, including for basketry
Potential for increased withy production, including for basketry
Peat for horticulture
985 ha currently used or planned for peat extraction, supporting 34 jobs (2008). There is 860 ha that have been (or are being) reclaimed and restored
Peat extraction decreases, jobs reduce to 29. May be more conservation jobs from restoration and tourism jobs following restoration
Peat extraction decreases due to wetter conditions, jobs reduce to 19. May be more conservation jobs from restoration and tourism jobs following restoration
Provision of freshwater (and availability of freshwater)
Some local water quality issues relating to diffuse and point source pollution. These are not known to produce any negative impacts in terms of drinking water, although effects on biodiversity may arise
Increase in use of nutrients due to increase in cropped area by around 2,400 ha could increase risk of pollutants being washed off fields. However, this will be managed to ensure that nutrient levels are targeted to maximise profits without causing negative impacts on the environment. It is unlikely though that this will result in significant impacts for livestock drinking water
Increase in use of nutrients due to increase in cropped area by around 800 ha could increase risk of pollutants being washed off fields. However, this will be managed to ensure that nutrient levels are targeted to maximise profits without causing negative impacts on the environment. It is unlikely though that this will result in significant impacts for livestock drinking water
Renewable energy None Potential to increase the area of energy crops being grown
Wetter conditions may limit energy crops (although short rotation coppice based on willow could be used)
Timber provision None
Development and management of multi-purpose woodlands could increase timber provision. Woodland increases by around 33 ha
Increase in wet woodland, may not be suitable as timber
Regulating Services
Emissions of GHGs Peat soils emit GHG on mineralisation/drying.
GHG emissions increase slightly by 5% due to
GHG emissions decrease by 19% due to wetter

The Environmental and Socio-Economic Impacts of Climate Change in the Brue Valley
Page 226
Table 7.1: Ecosystem Services under the World Markets Scenario
World Markets Ecosystem Service
Baseline Description of Services 10% 90%
An absolute measure of current GHG emissions is not reported due to uncertainties with the absolute measurement
change in land use (especially due to increase in cereal crops and orchards and horticulture). This excludes any increase in GHG associated with increased pumping of water
conditions and a move to wetter features (even though there is an increase in area of cereal crops). This excludes any increase in GHG associated with increased pumping of water
Sequestration of GHGs
As with emission factors, measures of sequestration of CO2 are highly variable. Therefore, an absolute measure of CO2 sequestration is not reported
Carbon sequestration reduces by around 18% due to replacement of areas of grassland by cereal crops
Carbon sequestration increases by 19% due to wetter conditions and changes in land use that increase the area of wetland features (with much smaller area of grassland converted to cereal crops)
Microclimate
Enhanced evaporation over a wetland surface can moisten and cool the lower atmosphere
Area of wetter habitats reduces from 41% to 35%, which could reduce the microclimate effect
Increase in wetter habitats (to 64%) may increase microclimate effect, although there will also be higher humidity. As the 90% probability also has higher temperatures, the overall effect may be beneficial
Nutrient and sediment cycling
Value of N cycled: 1.4 million kg N per hectare per year x £8.82 = £12 million Value of P cycled: 204,000 kg P per hectare per year x £12.72 = £2.6 million (based on value estimates for removal and treatment of £8.82 per kg N per hectare per year and £12.72 per kg P per hectare per year)
Conversion of some 2,400 ha of grassland to cereal crops (1,600 ha) and orchards and horticulture (800 ha) is likely to increase use of inputs from outside the area. There will be an emphasis on sustainable use of nutrients, where possible, and where profits can be maintained. Risk of loss of nutrients from fields following heavy rain
Conversion of some 800 ha of grassland to cereal crops (650 ha) and orchards and horticulture (120 ha) is likely to increase use of inputs from outside the area. There will be an emphasis on sustainable use of nutrients, where possible, and where profits can be maintained. Risk of loss of nutrients from fields following heavy rain
Pest and disease control
Increases in pests and diseases could affect food production. Effects on human health could affect physical and mental health and well-being
Use of technology to breed pest resistant crops and livestock
Use of technology to breed pest resistant crops and livestock
Water quality regulation
Water quality issues are cited as one of the reasons why ditches, rhynes, lakes and ponds are not in favourable condition
Increased use of nutrients could negatively affect water quality and condition of ditches, rhynes, lakes and ponds. However, this should be minimised as far as possible through careful,
Increased use of nutrients could negatively affect water quality and condition of ditches, rhynes, lakes and ponds. However, this should be minimised as far as possible through careful,

Risk & Policy Analysts, Geckoella and Environment Systems
Page 227
Table 7.1: Ecosystem Services under the World Markets Scenario
World Markets Ecosystem Service
Baseline Description of Services 10% 90%
targeted use of nutrients targeted use of nutrients
Water regulation (ability to control drainage and movement of water)
Ability to control water levels (within the constraints imposed by rainfall and runoff) allows many of the other ecosystem services to be delivered
Investment in water management regime maintained. Drier conditions may make it more difficult to retain wet fences but increase in area of cropped land may make it possible to target water to where it is needed most (but this could be targeted towards are of greater profit)
Investment in water management regime retained. This may help reduce impacts associated with waterlogging of soils, although this will also be managed by changes in land use (e.g. moving to wet grassland where it is more practical to do so). This will help to reduce costs of drainage and, hence, carbon costs associated with pumping of water
Water regulation (flood and erosion control)
The area could provide a reservoir to protect downstream areas, although this would affect other services (such as food provision)
Occasional heavy rain may require rapid evacuation to minimise flood risk. Investment in water regulation will help minimise change in flood risk
Continued investment in water regulation will help minimise the effect of increased flood risk, although this is likely to also require changes to more resilient land uses
Cultural Services
Aesthetics
The distinctive landscape includes low ridges with linear villages, open pasture moorland with patches of arable, scrub and wetland of nature reserves, rhynes, willow pollards, peat extraction and views of Isle of Avalon. Benefits based on willingness to pay (WTP) for Somerset Levels and Moors ESA (from Willis et al, 1993) are estimated at £1.4 million per year
Significant change in area of cropped land (+2,400 ha) and loss of grassland (-2,400 ha) could affect landscape benefits. There is also a move towards more drier and fewer wetter habitats (±660 ha)
Significant change in balance of wetter and drier habitats (with increase of wetter habitats by 2,400 ha). There is also an increase in area of cropland (+800 ha) with loss of dry grassland of low value for wildlife
Educational value
Educational activities undertaken include interpretation facilities, guided walks, school group visits and events on the nature reserves
Increase in involvement of private and membership-based organisations may increase opportunities for educational activities and learning
Increase in involvement of private and membership-based organisations may increase opportunities for educational activities and learning
Historic environment and heritage
The Brue Valley includes 25 SAMs, thousands of HERs and one conservation area and is part of an internationally important archaeological site
Drier conditions increase risk that soils will dry out reducing the value of any archaeological or historical remains. Ploughing of grasslands for arable use may also affect the value of remains
Wetter conditions should help preserve archaeology and historical remains, and may also reduce opportunities for peat extraction. Ploughing of grasslands for arable use may negatively affect the

The Environmental and Socio-Economic Impacts of Climate Change in the Brue Valley
Page 228
Table 7.1: Ecosystem Services under the World Markets Scenario
World Markets Ecosystem Service
Baseline Description of Services 10% 90%
value of remains
Knowledge systems
Substantial body of research on the Somerset Levels and Moors has contributed to knowledge of heritage, biodiversity, and conservation techniques
Focus is on developing new technologies and techniques to increase profits, while maintaining a high degree of environmental quality. This should help increase knowledge
Focus is on developing new technologies and techniques to increase profits, while maintaining a high degree of environmental quality. This should help increase knowledge
Physical and mental health and well-being
There is evidence linking the natural environment with good physical health and psychological well-being.
Increase in arable land could have negative impacts on mental health, but the effects are uncertain (good management of the arable land could help reduce any negative impacts)
Gain in wetter habitats could increase variety of habitats on landscape scale. Increase in arable land could have negative impacts on mental health, but the effects are uncertain (good management of the arable land could help reduce any negative impacts)
Recreation and tourism
Activities include canoeing, rowing, angling, boating, cycling, horse-riding, walking and bird watching. The number of visitors to the nature reserves at Ham Wall and Shapwick Heath is around 105,000 visits per year. Expenditure of around £1.5 million is estimated based on visitors to nature reserves alone, supporting 23 conservation and tourism jobs
Potential increase in access due to drier conditions and due to demand from members of conservation organisations. Increase in area of arable crops could negatively affect recreation value (but careful land management should minimise this). Conservation and tourism jobs increase slightly to 28
Membership organisations will have to fund maintenance of paths, boardwalks, etc. to maintain access. Increase in area of arable crops could negatively affect recreation value (but careful land management should minimise this). Conservation and tourism jobs increase to 39
Wildfowling and fishing
Wildfowling occurs on several moors across the area. Regular angling occurs on the Brue downstream of Bruton, Huntspill, South Drain, Cripps and Brue. Huntspill River is one of the premier coarse fisheries in the country. There are also a number of private and open fisheries in old peat diggings
Water quality is not expected to change significantly, so there may be limited benefits for the quality of angling (depending also on water quantities). Access could be lost if fencing is used to replace wet fences. Wildfowling could be more widely available, to increase profitability of marginal land
Water quality is not expected to change significantly, so there may be limited benefits for the quality of angling. Access for angling could be reduced if land becomes much wetter and/or waterlogged. Wildfowling opportunities could be made more widely available, to increase profitability of marginal land

Risk & Policy Analysts, Geckoella and Environment Systems
Page 229
7.4 Changes under the Provincial Enterprise Scenario The Provincial Enterprise scenario is characterised by a move towards regionally
oriented economic development. It is based on an increase in consumerism and privatisation with the free market allowed to develop, but on a regional basis. There is a tendency towards a move to more intensive farming concentrated in a small number of large farms, with little public concern about biodiversity resulting in environmental pollution and degradation. There is action taken to improve intensification on all land, with (where it pays) increased investment in drainage and the water management regime.
Table 7.2 compares the changes projected under the Provincial Enterprise scenario for
the 10% and 90% probabilities with the baseline ecosystem services.
Table 7.2: Ecosystem Services under the Provincial Enterprise Scenario
Provincial Enterprise Ecosystem Service
Baseline Description of Services 10% 90%
Provisioning Services
Biochemicals, natural medicines and pharmaceuticals
None
Intensification may reduce opportunities for discovery of new biochemicals, reliance on existing skills and knowledge
Wetter conditions may lead to abandonment of some areas so discovery of new biochemicals or natural medicines is unlikely
Biodiversity
High value features: 1,931 ha (19% of the total area), Moderate value features: 6,876 ha (66% of the total area). Low value features: 1,601 ha (15% of the total area)
High value features = 1,176 ha (11% of total area) Moderate value features = 4,786 ha (46%) Low value features = 4,446 ha (43%) Overall, biodiversity value is expected to decrease significantly compared with the baseline
High value features = 3,369 ha (32% of total area), but conversion to these features is through abandonment of land so no management would be undertaken and the biodiversity value of the feature is likely to decline over time Moderate value features = 4,375 ha (42%) Low value features = 2,664ha (26%) Overall, biodiversity value is expected to decrease significantly compared with the baseline
Fibre production None
May be expansion of withy production, as part of wider intensification (but benefits for fibre production
Potential for Brue Valley to become one of the main withy production areas in the region (but benefits for fibre production are likely to be limited)
Food production
Annual value of food production is around £8.8 million, supporting around 530 jobs
Income from food production increases to £16 million (+77%) Jobs supported by agriculture increase to 930, due to a large increase in
Income from food production decreases to £8.3 million (-6%) Jobs supported by agriculture decline to around 490 due to

The Environmental and Socio-Economic Impacts of Climate Change in the Brue Valley
Page 230
Table 7.2: Ecosystem Services under the Provincial Enterprise Scenario
Provincial Enterprise Ecosystem Service
Baseline Description of Services 10% 90%
jobs associated with intensification
abandonment of wetter areas of land
Fuel provision None Unlikely to be opportunities for increased fuel provision
Unlikely to be opportunities for increased fuel provision
Ornamental resources Limited withy production
Withy production may be expanded, but is likely to be on smaller scale than other scenarios due to intensification of agricultural land uses
Wetter conditions may make withy production preferred land use (rather than abandonment), but this will depend on the extent of waterlogging and access, and potential to make a profit
Peat for horticulture
985 ha currently used or planned for peat extraction, supporting 34 jobs (2008). There is 860 ha that have been (or are being) reclaimed and restored
Jobs supported by peat extraction increase due to larger area being extracted, to 44
Jobs supported by peat extraction likely to be affected by increasing costs of drainage and evacuation of water. As a result, jobs supported estimated reduce to 26
Provision of freshwater (and availability of freshwater)
Some local water quality issues relating to diffuse and point source pollution. These are not known to produce any negative impacts in terms of drinking water, although effects on biodiversity may arise
Intensification across much of the area is likely to increase levels of nutrients and pesticides that are washed off the land following heavy rainfall events and increase the risk for livestock drinking water in ditches (with possible impacts for young livestock with levels of nitrates that exceed 100 mg/l). Drier conditions are likely to reduce the amount of water that is available for livestock (including use of water as wet fences)
Intensification on some areas is balanced (to some degree) by abandonment of land where it is too wet to farm. Thus, increase in nutrients levels entering ditches and rivers will be reduced compared with the 10% probability
Renewable energy None
More likely to be increased agricultural output (e.g. cereal crops and intensification). However, this could include opportunities to grow more energy crops. Drier conditions could open up opportunities for wind farms, or solar farms on less profitable land
Likely that wetter land will be abandoned, which is unlikely to lead to any benefits in terms of renewable energy (although the area of scrub is likely to increase). Land could be used to wind farms or solar farms, but this will depend on access and ground conditions
Timber provision None
Existing trees and woodland could be exploited for their timber value (see also renewable energy). Woodland expected to increase by
Increase in wet woodland and scrub by 560 ha due to abandonment of wetter areas, but unlikely to be suitable as timber (see also renewable energy)

Risk & Policy Analysts, Geckoella and Environment Systems
Page 231
Table 7.2: Ecosystem Services under the Provincial Enterprise Scenario
Provincial Enterprise Ecosystem Service
Baseline Description of Services 10% 90%
around 370 ha
Regulating Services
Emissions of GHGs
Peat soils emit GHG on mineralisation/drying. An absolute measure of current GHG emissions is not reported due to uncertainties with the absolute measurement
GHG emissions increase by 16% due to intensification of farming, increased arable use of the land, use of more nutrients and pesticides and increased peat extraction
GHG emissions decrease by 15% as wetter areas of land are abandoned; drier areas or areas that can be more easily drained are used more intensively
Sequestration of GHGs
As with emission factors, measures of sequestration of CO2 are highly variable. Therefore, an absolute measure of CO2 sequestration is not reported
Carbon sequestration reduced by 39% due to reduction in grassland in favour of arable crops and increased peat extraction
Carbon sequestration increased by 58% due to wetter conditions forcing some areas of land to be abandoned. Although not managed, these wetland areas will be able to sequester larger amounts of carbon
Microclimate
Enhanced evaporation over a wetland surface can moisten and cool the lower atmosphere
Change to drier habitats is likely to reduce the microclimate effect. There may be benefits from increased shade from increased areas of woodland
Increase in wetter habitats may increase cooling effect (although this may be accompanied by greater humidity). There may also be benefits from increased shade from increased areas of woodland
Nutrient and sediment cycling
Value of N cycled: 1.4 million kg N per hectare per year x £8.82 = £12 million Value of P cycled: 204,000 kg P per hectare per year x £12.72 = £2.6 million (based on value estimates for removal and treatment of £8.82 per kg N per hectare per year and £12.72 per kg P per hectare per year)
Cycling of nutrients becomes much less sustainable, relying on inputs from outside the area. Risk of significant loss of nutrients from fields following heavy rain
Cycling of nutrients becomes much less sustainable, relying on inputs from outside the area. Risk of significant loss of nutrients from fields following heavy rain, with reduced windows for applications of nutrients due to the overall wetter climate
Pest and disease control
Increases in pests and diseases could affect food production. Effects on human health could affect physical and mental health and well-being
Increased use of pesticides to control pests and diseases
Increased use of pesticides to control pests and diseases
Water quality regulation
Water quality issues are cited as one of the reasons why ditches, rhynes, lakes and ponds are not in favourable condition.
Increased use of inputs combined with heavy rainfall events could wash sudden pulses of pollutants into ditches, rhynes, lakes and ponds and have a significant effect on the
Heavy rainfall events could wash sudden pulses of pollutants into ditches, rhynes, lakes and ponds. The overall wetter conditions mean some areas will be abandoned

The Environmental and Socio-Economic Impacts of Climate Change in the Brue Valley
Page 232
Table 7.2: Ecosystem Services under the Provincial Enterprise Scenario
Provincial Enterprise Ecosystem Service
Baseline Description of Services 10% 90%
biodiversity
with a reduction in inputs in those locations. It is also likely that ditches and rhynes will be abandoned and vegetation in them will no longer be cut and composted
Water regulation (ability to control drainage and movement of water)
Ability to control water levels (within the constraints imposed by rainfall and runoff) allows many of the other ecosystem services to be delivered
Poorly co-ordinated management means it will become much more difficult to maintain wet fences and to evacuate water quickly after heavy rainfall events. The need for wet fences may be reduced due to intensification and a move towards larger areas of cereal crops
Poorly co-ordinated management means it will become much more difficult to evacuate water in the wetter conditions. This means some areas will be abandoned. This is expected to result in abandonment of ditches and rhynes, as well as farmland, further affecting the ability to move water around the area
Water regulation (flood and erosion control)
The area could provide a reservoir to protect downstream areas, although this would affect other services (such as food provision)
Overall flood risk is expected to reduce due to the drier conditions, although there may be occasional pluvial floods following heavy rainfall. A more piecemeal approach to water regulation will mean some areas are likely to be more prone to flooding
Increased rainfall and much wetter conditions will increase the flood risk (fluvial and pluvial). A more piecemeal approach to water regulation will mean some areas are likely to be more prone to flooding (areas that are less profitable and/or more marginal), resulting in abandonment of some areas, such that they are much more likely to flood
Cultural Services
Aesthetics
The distinctive landscape includes low ridges with linear villages, open pasture moorland with patches of arable, scrub and wetland of nature reserves, rhynes, willow pollards, peat extraction and views of Isle of Avalon. Benefits based on willingness to pay (WTP) for Somerset Levels and Moors ESA (from Willis et al, 1993) are estimated at £1.4 million per year
Loss of much of current landscape value (of ESA) as land is converted to arable and more intensive land uses. This could result in loss of much of the £1.4 million per year that residents and visitors were willing to pay to maintain the current landscape
Abandonment of wetter areas that cannot be farmed intensively could increase the amount of scrub and would, therefore, change the appearance of the landscape from a managed one to a (partly) unmanaged one. This could change people's views of the landscape
Educational value Educational activities undertaken include interpretation facilities,
Low environmental concern may reduce demand for educational
Low environmental concern may reduce demand for educational

Risk & Policy Analysts, Geckoella and Environment Systems
Page 233
Table 7.2: Ecosystem Services under the Provincial Enterprise Scenario
Provincial Enterprise Ecosystem Service
Baseline Description of Services 10% 90%
guided walks, school group visits and events on the nature reserves
activities linked to conservation, but may be opportunities for farmers to gain new skills related to increasing profits and outputs from farming
activities linked to conservation, but may be new opportunities for farmers related to increasing profits and outputs from farming
Historic environment and heritage
The Brue Valley includes 25 SAMs, thousands of HERs and one conservation area and is part of an internationally important archaeological site
Drier conditions increase risk that soils will dry out reducing the value of any archaeological or historical remains in the peat soils. Intensification and more tillage-based agriculture may result in significant dis-benefits
Wetter conditions should help preserve archaeology and historical remains in the peat soils. Wetter conditions may also make it more costly to extract peat, which could postpone extraction. Intensification and more tillage-based agriculture may result in significant dis-benefits
Knowledge systems
Substantial body of research on the Somerset Levels and Moors has contributed to knowledge of heritage, biodiversity, and conservation techniques
Focus is on maximising income using current skills, but there will be efforts to improve profitability and out-compete rival farms (or regions) such that knowledge levels of farmers are likely to increase. Opportunities for increased knowledge in other areas is likely to decrease
Focus is on maximising income using current skills, but there will be efforts to improve profitability and out-compete rival farms (or regions) such that knowledge levels of farmers are likely to increase. Opportunities for increased knowledge in other areas is likely to decrease
Physical and mental health and well-being
There is evidence linking the natural environment with good physical health and psychological well-being.
Change to more intensive landscape may reduce physical and mental well-being associated with views of the landscape
Change to more intensive or unmanaged landscape may reduce the benefits associated with views of the landscape
Recreation and tourism
Activities include canoeing, rowing, angling, boating, cycling, horse-riding, walking and bird watching. The number of visitors to the nature reserves at Ham Wall and Shapwick Heath is around 105,000 visits per year. Expenditure of around £1.5 million is estimated based on visitors to nature reserves alone, supporting 23 conservation and tourism jobs
Drier conditions may make it easier for landowners to restrict access, although publicly owned areas should still be accessible. Habitat fragmentation may result in increased visitor numbers to publicly owned areas. Jobs associated with conservation and tourism decline to 19
Wetter conditions may make it more difficult to maintain access, and conservation organisations may not have sufficient funds to maintain paths, etc. Jobs associated conservation and tourism jobs reduce 19, mostly linked to tourism and recreational activities (angling and shooting)
Wildfowling and fishing
Wildfowling occurs on several moors across the area. Regular angling occurs on
Opportunities for angling and wildfowling could be exploited to increase income from more
Opportunities for angling and wildfowling could be exploited to increase income from more

The Environmental and Socio-Economic Impacts of Climate Change in the Brue Valley
Page 234
Table 7.2: Ecosystem Services under the Provincial Enterprise Scenario
Provincial Enterprise Ecosystem Service
Baseline Description of Services 10% 90%
the Brue downstream of Bruton, Huntspill, South Drain, Cripps and Brue. Huntspill River is one of the premier coarse fisheries in the country. There are also a number of private and open fisheries in old peat diggings
marginal areas, although levels of wild game may reduce due to reduction in environmental quality of area. Intensification of angling activities could require fish stocking (which may impact upon natural fish populations)
marginal areas, although levels of wild game may reduce due to reduction in environmental quality of area. Intensification of angling activities could require fish stocking (which may impact upon natural fish populations)
7.5 Changes under the Global Sustainability Scenario
The Global Sustainability scenario is characterised by a move towards greater globalisation and rapid economic growth. It is based on an increase in concern for the environment and sustainability at the global scale, tackling key global issues. The scenario is defined as a move to low input farming and sustainable landscape management. Technology and science are also used to help minimise the inputs needed at the same time as maintaining yields. There is a focus on maintaining the existing quality of the environment, and improving it through landscape-scale sustainable management.
Table 7.3 compares the changes projected under the Global Sustainability scenario for
the 10% and 90% probabilities with the baseline ecosystem services.
Table 7.3: Ecosystem Services under the Global Sustainability Scenario
Global Sustainability Ecosystem Service
Baseline Description of Services 10% 90%
Provisioning Services
Biochemicals, natural medicines and pharmaceuticals
None
Development of new skills and move to more sustainable uses of land may encourage investigation into possible new sources of biochemicals but there may be reliance on bringing in resources from elsewhere
Move to more extensive floodplain management could increase opportunities for new discoveries, but these would have to compete on a global marketplace
Biodiversity
High value features: 1,931 ha (19% of the total area), Moderate value features: 6,876 ha (66% of the total area). Low value features: 1,601 ha (15% of the total area)
High value features = 4,691 ha (45% of total area) Moderate value features = 4,481 ha (43%) Low value features = 1,236 ha (12%) Overall, biodiversity value is expected to increase significantly compared
High value features = 6,085 ha (58% of total area) Moderate value features = 3,163 ha (30%) Low value features = 1,159 ha (11%) Overall, biodiversity value is expected to increase significantly compared

Risk & Policy Analysts, Geckoella and Environment Systems
Page 235
Table 7.3: Ecosystem Services under the Global Sustainability Scenario
Global Sustainability Ecosystem Service
Baseline Description of Services 10% 90%
with the baseline with the baseline
Fibre production None
Potential for increased withy production, with some potentially being used for chair seating (but benefits are likely to be limited)
Potential for increased withy production, with some potentially being used for chair seating (but benefits are likely to be limited)
Food production
Annual value of food production is around £8.8 million, supporting around 530 jobs
Income from food production increases to £13 million (+52%). Jobs supported by agriculture increase to around 670. Potential to promote products associated with high conservation value, such as SSSI beef
Income from food production increases to £9.7 million (+10%). Jobs supported by agriculture increase around 580. Potential to promote products associated with high conservation value, such as SSSI beef
Fuel provision None Unlikely to be opportunities for increased fuel provision
Unlikely to be opportunities for increased fuel provision
Ornamental resources Limited withy production
Potential to increase withy production as alternative, sustainable land use. Extent will depend on global demand for materials and/or finished products
Wetter conditions may favour increase in withy production, with benefits in terms of ornamental resources
Peat for horticulture
985 ha currently used or planned for peat extraction, supporting 34 jobs (2008). There is 860 ha that have been (or are being) reclaimed and restored
Peat extraction stops because of environmental concerns and development of peat substitutes. As a result, there are no jobs supported by peat extraction
Increasing environmental concerns and availability of peat substitutes mean peat extraction stops
Provision of freshwater (and availability of freshwater)
Some local water quality issues relating to diffuse and point source pollution. These are not known to produce any negative impacts in terms of drinking water, although effects on biodiversity may arise
Lower use of inputs should help reduce the risk of high levels of nutrients and pesticides entering livestock drinking water. Drier conditions are likely to reduce the amount of water that is available for livestock (including use of water as wet fences)
Floodplain management to help evacuate water quickly and safely, with extensification and more sustainable land uses should help reduce the risk to livestock of low quality drinking water
Renewable energy None
Potential to move to energy crops through move to crops that provide multiple benefits
Wetter conditions may reduce opportunities for some energy crops, although willow-based short rotation coppice could become a way of utilising the land
Timber provision None Likely increase in woodland as floodplain feature by almost 490 ha.
Increase in floodplain woodland by 690 ha, but may not increase timber

The Environmental and Socio-Economic Impacts of Climate Change in the Brue Valley
Page 236
Table 7.3: Ecosystem Services under the Global Sustainability Scenario
Global Sustainability Ecosystem Service
Baseline Description of Services 10% 90%
Management of woodland may release some wood as timber
provision as wood is likely to be wet and/or concentrated in wetter areas
Regulating Services
Emissions of GHGs
Peat soils emit GHG on mineralisation/drying. An absolute measure of current GHG emissions is not reported due to uncertainties with the absolute measurement.
GHG emissions increase by 4% due to the drier climatic conditions even though approaches to farming are generally much more sustainable. This ignores the reduction in GHG emissions that would occur due to reduced pumping of water
GHG emissions decrease by 22% due to the wetter conditions favouring sustainable land use of wetter features and associated reduction in peat extraction
Sequestration of GHGs
As with emission factors, measures of sequestration of CO2 are highly variable. Therefore, an absolute measure of CO2 sequestration is not reported.
Carbon sequestration increased by 6% due to more sustainable use of the land, including a move towards more grassland
Carbon sequestration increased by 94% due to management of wetland features with the aim of improving carbon sequestration to help deliver global carbon targets
Microclimate
Enhanced evaporation over a wetland surface can moisten and cool the lower atmosphere.
Change to drier habitats is likely to reduce the microclimate effect to some degree. This may have dis-benefits for those living and working in the area
Increase in wetter habitats may increase cooling effect (although this may be accompanied by greater humidity). As the 90% probability also has higher temperatures, this may be beneficial
Nutrient and sediment cycling
Value of N cycled: 1.4 million kg N per hectare per year x £8.82 = £12 million Value of P cycled: 204,000 kg P per hectare per year x £12.72 = £2.6 million (based on value estimates for removal and treatment of £8.82 per kg N per hectare per year and £12.72 per kg P per hectare per year)
Cycling of nutrients is undertaken much more sustainably, with reduced inputs from outside the area. Value of nutrient cycling is recognised in agri-environment schemes, which include funding for ecosystem services provided
Cycling of nutrients is undertaken much more sustainably, with reduced inputs from outside the area. Value of nutrient cycling is recognised in agri-environment schemes, which include funding for ecosystem services provided
Pest and disease control
Increases in pests and diseases could affect food production. Effects on human health could affect physical and mental health and well-being
Use of new technologies to combat pests and diseases and move to more resistant crops and breeds
Use of new technologies to combat pests and diseases and move to more resistant crops and breeds
Water quality regulation
Water quality issues are cited as one of the reasons
Reduced use of nutrients and pesticides could help
Reduced use of nutrients and pesticides could help

Risk & Policy Analysts, Geckoella and Environment Systems
Page 237
Table 7.3: Ecosystem Services under the Global Sustainability Scenario
Global Sustainability Ecosystem Service
Baseline Description of Services 10% 90%
why ditches, rhynes, lakes and ponds are not in favourable condition
reduce the potential that water quality affects favourable condition status of ditches, rhynes, lakes and ponds. Continued management of ditches and rhynes should help reduce any impacts following runoff after heavy rainfall events
reduce the potential that water quality affects favourable condition status of ditches, rhynes, lakes and ponds. Overall wetter conditions may help reduce the concentrations of any pollutants that remain due to increased dilution
Water regulation (ability to control drainage and movement of water)
Ability to control water levels (within the constraints imposed by rainfall and runoff) allows many of the other ecosystem services to be delivered
Investment in water management is likely to decrease slightly to reduce reliance on pumping, and a move to a more naturally functioning floodplain. Drier conditions will make it more difficult to maintain wet fences
Investment in water management is likely to decrease slightly to reduce reliance on pumping, and a move to a more naturally functioning floodplain. The aim is to move towards land uses that are more compatible with wetter conditions, with the potential for sustainable floodplain management
Water regulation (flood and erosion control)
The area could provide a reservoir to protect downstream areas, although this would affect other services (such as food provision)
Overall flood risk is expected to reduce due to climate change, although there may be occasional pluvial floods following heavy rainfall. This may need to be managed through resilient land uses in areas that are most susceptible to pluvial flooding, with a move to using land for water storage and restoration of floodplain function
Increased rainfall and the much wetter conditions will increase the flood risk (fluvial and pluvial). Freshwater flood risk is expected to increase in a managed, sustainable way with a move to using land for water storage and restoration of floodplain function. This will enable future increases in flood risk to be managed in a way that results in significant environmental benefits combined with moves to economic land uses that maintain incomes for landowners
Cultural Services
Aesthetics
The distinctive landscape includes low ridges with linear villages, open pasture moorland with patches of arable, scrub and wetland of nature reserves, rhynes, willow pollards, peat extraction and views of Isle of Avalon. Benefits based on willingness to pay (WTP)
Drier conditions enable a move to dry grassland of high value for wildlife, and could encourage move towards traditional hay meadows. Continued grazing of livestock and management of the land in a more sustainable manner may improve the landscape value
Increasingly wetter conditions combined with a move to sustainable floodplain management could change the landscape from a farmed landscape to one with much more water and wet features (although livestock farming is likely to continue where possible and will be associated with

The Environmental and Socio-Economic Impacts of Climate Change in the Brue Valley
Page 238
Table 7.3: Ecosystem Services under the Global Sustainability Scenario
Global Sustainability Ecosystem Service
Baseline Description of Services 10% 90%
for Somerset Levels and Moors ESA (from Willis et al, 1993) are estimated at £1.4 million per year
premium, conservation products). This landscape would resemble the character of pre-20th C SL & M
Educational value
Educational activities undertaken include interpretation facilities, guided walks, school group visits and events on the nature reserves
Increased role for NGOs and conservation organisations could increase opportunities for education, especially related to informing and educating on increasing sustainability of land use
Increased role for NGOs and conservation organisations could increase opportunities for education, especially related to informing and educating on increasing sustainability of land use
Historic environment and heritage
The Brue Valley includes 25 SAMs, thousands of HERs and one conservation area and is part of an internationally important archaeological site
Drier conditions increase risk that soils will dry out reducing the value of any archaeological or historical remains. Careful land use management should help reduce the impacts, while reduction in peat extraction (due to environmental concerns and development of peat substitutes) could provide further benefits
Wetter conditions should help preserve archaeology and historical remains in the peat soils. Wetter conditions may also reduce opportunities for peat extraction, which may provide benefits
Knowledge systems
Substantial body of research on the Somerset Levels and Moors has contributed to knowledge of heritage, biodiversity, and conservation techniques
Technology and science are used to help minimise inputs needed at the same time as maintaining yields. Increased roles for NGOs and conservation organisations increase the potential for improved knowledge systems in the area of conservation and sustainable land use. This could include formal training opportunities such as apprenticeships in land management
Technology and science are used to help minimise the inputs needed at the same time as maintaining yields. Increased roles for NGOs and conservation organisations also increase the potential for improved knowledge systems in the area of conservation and sustainable land use. This could include formal training opportunities such as apprenticeships in land management
Physical and mental health and well-being
There is evidence linking the natural environment with good physical health and psychological well-being
Significant improvement in biodiversity quality may lead to increased enjoyment. More traditional hay meadows may reduce the variety of the landscape, but the changing nature of these meadows could add additional benefits
Significant improvement in biodiversity quality may lead to increased enjoyment. Move to a much wetter landscape could change the value of the area for physical and mental well-being, but a combination of water, trees and sky could be more common
Recreation and tourism Activities include canoeing, rowing, angling, boating, cycling, horse-
Drier conditions may make access more generally available, while NGOs and
Wetter conditions may make it more difficult to access some areas,

Risk & Policy Analysts, Geckoella and Environment Systems
Page 239
Table 7.3: Ecosystem Services under the Global Sustainability Scenario
Global Sustainability Ecosystem Service
Baseline Description of Services 10% 90%
riding, walking and bird watching. The number of visitors to the nature reserves at Ham Wall and Shapwick Heath is around 105,000 visits per year. Expenditure of around £1.5 million is estimated based on visitors to nature reserves alone, supporting 23 conservation and tourism jobs
conservation based organisations encourage volunteers to help manage habitats for both conservation and recreation benefits. Jobs associated with conservation and tourism jobs increase significantly to 56
requiring investment by NGOs to maintain appropriate levels of access. Costs may be reduced through use of volunteers. Jobs associated with conservation and tourism jobs increase significantly to 72
Wildfowling and fishing
Wildfowling occurs on several moors across the area. Regular angling occurs on the Brue downstream of Bruton, Huntspill, South Drain, Cripps and Brue. Huntspill River is one of the premier coarse fisheries in the country. There are also a number of private and open fisheries in old peat diggings
Improved water quality may increase the quality of angling, although reductions in water quantity could affect fish populations. Access for angling could be reduced if fencing is needed to replace wet fences Wildfowling is unlikely to be widely supported
Improved water quality may increase the quality of angling. Access for angling could be reduced if land becomes much wetter and/or waterlogged Wildfowling is unlikely to be widely supported, with NGOs likely to buy-up land to enable it to be farmed for wildlife purposes
7.6 Changes under the Local Stewardship Scenario The Local Stewardship scenario is characterised by a move towards local
environmental sustainability. It is based on an increase in local environmental concern and the development of a strong local economy. As a result, the aim is to meet local needs through production of local products, working together wherever possible to deliver local sustainability. There is a focus on improving the existing quality of the environment, with strenuous efforts to protect wildlife. At the same time, though, there is also greater interest in interacting with nature such that recreation demands increase.
Table 7.4 compares the changes projected under the Local Stewardship scenario for
the 10% and 90% probabilities with the baseline ecosystem services.
Table 7.4: Ecosystem Services under the Local Stewardship Scenario
Local Stewardship Ecosystem Service
Baseline Description of Services 10% 90%
Provisioning Services
Biochemicals, natural medicines and pharmaceuticals
None
Increase in efforts to meet local demand could maximise use of local natural medicines and
Increase in efforts to meet local demand could maximise use of local natural medicines and

The Environmental and Socio-Economic Impacts of Climate Change in the Brue Valley
Page 240
Table 7.4: Ecosystem Services under the Local Stewardship Scenario
Local Stewardship Ecosystem Service
Baseline Description of Services 10% 90%
biochemical resources (where available) as part of a trend towards diversification and mixed farming
biochemical resources (where available) as part of a trend towards diversification and mixed farming (where possible due to increasingly wet conditions)
Biodiversity
High value features: 1,931 ha (19% of the total area), Moderate value features: 6,876 ha (66% of the total area). Low value features: 1,601 ha (15% of the total area)
High value features = 2,779 ha (27% of total area) Moderate value features = 5,822 ha (56%) Low value features = 1,807 ha (17%) Overall, biodiversity value is expected to increase slightly
High value features = 5,686 ha (55% of total area) Moderate value features = 3,207 ha (31%) Low value features = 1,515 ha (15%) Overall, biodiversity value is expected to increase significantly
Fibre production None
Farmers work together to meet local demands for fibre, which may include increased withy production (see ornamental resources)
Farmers work together to meet local demands for fibre, which may include increased withy production (see ornamental resources)
Food production
Annual value of food production is around £8.8 million, supporting around 530 jobs
Income from food production increases to £12 million (+36%). Jobs supported by agriculture increase to around 680, linked to the move to mixed farming. Potential to promote products associated with high conservation value, such as SSSI beef, where local demand exists
Income from food production decreases to £6.9 million (-21%). Jobs supported by agriculture decline to around 420. Potential to promote products associated with high conservation value, such as SSSI beef, where local demand exists
Fuel provision None Unlikely to be any opportunities for increased fuel provision
Unlikely to be any opportunities for increased fuel provision
Ornamental resources Limited withy production
Where local demand exists, there is the potential for increased withy production as part of a diversified, mixed farming approach
Wetter conditions may encourage diversification into withy production to make best use of the available land
Peat for horticulture
985 ha currently used or planned for peat extraction, supporting 34 jobs (2008). There is 860 ha that have been (or are being) reclaimed and restored
Environmental concerns result in reduction in peat extraction, although some needs to continue to meet local demand. The number of jobs supported reduces to 15
High water levels (and associated drainage costs) plus environmental concerns result in reduction in peat extraction, reducing number of jobs supported to 16
Provision of freshwater (and availability of freshwater)
Some local water quality issues relating to diffuse and point source pollution.
Mixed farming, with more rotations and better use of inputs should help reduce
Careful management undertaken to minimise loss of nutrients following

Risk & Policy Analysts, Geckoella and Environment Systems
Page 241
Table 7.4: Ecosystem Services under the Local Stewardship Scenario
Local Stewardship Ecosystem Service
Baseline Description of Services 10% 90%
These are not known to produce any negative impacts in terms of drinking water, although effects on biodiversity may arise.
impacts of nutrients on livestock drinking water. Drier conditions are likely to reduce the amount of water that is available for livestock so additional ponds may be dug to intercept water so it can be used on the farm
heavy rainfall events helps reduce impacts on water quality and maintains good quality drinking water for livestock
Renewable energy None
Potential to move to energy crops to help meet local demand (e.g. heating through biomass)
Wetter conditions mean energy crops may be focused more on short rotation coppice willow and reedbeds
Timber provision None
Previous wet areas of scrub may be put to profitable use (potentially as wood for fuel) if they dry out. Other areas will be managed for biodiversity benefits
Unlikely to be any increase in fuel provision even though there may be more wet woodland as this will be managed as a floodplain feature
Regulating Services
Emissions of GHGs
Peat soils emit GHG on mineralisation/drying. An absolute measure of current GHG emissions is not reported due to uncertainties with the absolute measurement
GHG emissions increase by 4% due to the drier climatic conditions and the move to mixed farming that may see some peat soils tilled for arable crops on a rotation (overall, though there will be a move to more sustainable land management)
GHG emissions decrease by 19% due to the wetter conditions favouring sustainable land use of wetter features and associated reduction in peat extraction
Sequestration of GHGs
As with emission factors, measures of sequestration of CO2 are highly variable. Therefore, an absolute measure of CO2 sequestration is not reported
No change to overall level of carbon sequestration due to change to mixed farming that may increase some areas of arable crops (to meet local demand)
Carbon sequestration increased by 103% due to management of wetland features in a sustainable manner, with increase in areas of high conservation value
Microclimate
Enhanced evaporation over a wetland surface can moisten and cool the lower atmosphere
Change to drier habitats (to 70% of the area) is likely to reduce the microclimate effect to some degree. This may have dis-benefits for those living and working in the area. There may be benefits from increased shade from greater areas of woodland
Increase in wetter habitats (to 60% of the area) may increase cooling effect (although this may be accompanied by greater humidity). As the 90% probability also has higher temperatures, this may be beneficial
Nutrient and sediment cycling
Value of N cycled: 1.4 million kg N per hectare per year x £8.82 = £12 million Value of P cycled:
Cycling of nutrients is undertaken much more sustainably, with inputs recycled around the farm. Runoff following heavy
Cycling of nutrients is undertaken much more sustainably, with inputs recycled around the farm. Runoff following heavy

The Environmental and Socio-Economic Impacts of Climate Change in the Brue Valley
Page 242
Table 7.4: Ecosystem Services under the Local Stewardship Scenario
Local Stewardship Ecosystem Service
Baseline Description of Services 10% 90%
204,000 kg P per hectare per year x £12.72 = £2.6 million (based on value estimates for removal and treatment of £8.82 per kg N per hectare per year and £12.72 per kg P per hectare per year)
rain may remove sediment from fields, but this should be limited due to the mosaic of habitats
rain may remove sediment from fields, but this should be limited due to the mosaic of habitats
Pest and disease control
Increases in pests and diseases could affect food production. Effects on human health could affect physical and mental health and well-being
Increased use of rotations and mixed farming methods to reduce potential for build-up of disease and pests
Increased use of rotations and mixed farming methods to reduce potential for build-up of disease and pests
Water quality regulation
Water quality issues are cited as one of the reasons why ditches, rhynes, lakes and ponds are not in favourable condition
Reduced use of nutrients and pesticides could help reduce the potential that water quality affects favourable condition status of ditches, rhynes, lakes and ponds. Continued management of ditches and rhynes should help reduce any impacts following runoff after heavy rainfall events
Reduced use of nutrients and pesticides could help reduce the potential that water quality affects favourable condition status of ditches, rhynes, lakes and ponds. Overall wetter conditions may help reduce the concentrations of any pollutants that remain due to increased dilution
Water regulation (ability to control drainage and movement of water)
Ability to control water levels (within the constraints imposed by rainfall and runoff) allows many of the other ecosystem services to be delivered
Water management is undertaken by local farmers through a co-operative organisation, such as an IDB, to deliver local needs for water/ evacuation of water
Water management is undertaken through a co-operative organisation to deliver local needs for water/evacuation of water. The wetter conditions are likely to require some additional investment in the water management regime, although there will also be a move towards land uses that are more suited to the conditions
Water regulation (flood and erosion control)
The area could provide a reservoir to protect downstream areas, although this would affect other services (such as food provision)
Occasional, heavy rainfall events may result in the need for rapid evacuation of water and/or storage of water. Overall flood risk is expected to reduce due to the drier conditions, although there may be occasional pluvial floods. The catchment-scale approach to water management may have some negative effects on downstream areas if there
Increased rainfall and the much wetter conditions will increase the flood risk (fluvial and pluvial). The catchment-scale approach to water management may have some negative effects on downstream areas if there is a need to evacuate water quickly from the area. Increased flood risk will be managed through a move to more resilient land uses, as well as local

Risk & Policy Analysts, Geckoella and Environment Systems
Page 243
Table 7.4: Ecosystem Services under the Local Stewardship Scenario
Local Stewardship Ecosystem Service
Baseline Description of Services 10% 90%
is a need to evacuate water quickly from the area
investment in drainage
Cultural Services
Aesthetics
The distinctive landscape includes low ridges with linear villages, open pasture moorland with patches of arable, scrub and wetland of nature reserves, rhynes, willow pollards, peat extraction and views of Isle of Avalon. Benefits based on willingness to pay (WTP) for Somerset Levels and Moors ESA (from Willis et al, 1993) are estimated at £1.4 million per year
Moved to mixed farming may break up the landscape, giving a more 'traditional' farmed landscape with multiple land uses over a reasonably small area (a mosaic). This will maintain areas of crops and livestock farming and extensification should help retain many attractive landscape features
The wetter conditions will restrict landowners ability to move to mixed farming (as much as under the 10% probability) but there is still likely to be a much more mixed landscape due to localised management, with moves to more resilient crops and/or land uses. This may result in a landscape dominated by more swamp and fen
Educational value
Educational activities undertaken include interpretation facilities, guided walks, school group visits and events on the nature reserves
Move to more local organisations may reduce co-ordinated (e.g. national) educational use of the area, but there may be increased opportunities for the local population
Move to more local organisations may reduce co-ordinated (e.g. national) educational use of the area, but there may be increased opportunities for the local population
Historic environment and heritage
The Brue Valley includes 25 SAMs, thousands of HERs and one conservation area and is part of an internationally important archaeological site
Drier conditions increase risk that soils will dry out reducing the value of any archaeological or historical remains. Careful land use management should help reduce the impacts, while reduction in peat extraction (due to environmental concerns) could provide further benefits (although this will depend on the need to meet local demand)
Wetter conditions should help preserve archaeology and historical remains in the peat soils. Wetter conditions may also reduce opportunities for peat extraction, which may provide benefits
Knowledge systems
Substantial body of research on the Somerset Levels and Moors has contributed to knowledge of heritage, biodiversity, and conservation techniques
Localised land management brings opportunities for people to develop specialised skills, and then to share these skills through co-operatives that could raise the local knowledge base
Localised land management brings opportunities for people to develop specialised skills, and then to share these skills through co-operatives that could raise the local knowledge base
Physical and mental health and well-being
There is evidence linking the natural environment with good physical health and psychological well-being
Slight improvement in biodiversity quality may lead to increased enjoyment. Move to a mosaic of habitats could have benefits from a
Significant improvement in biodiversity quality may lead to increased enjoyment. Move to a mosaic of habitats, with more wetter habitats, could

The Environmental and Socio-Economic Impacts of Climate Change in the Brue Valley
Page 244
Table 7.4: Ecosystem Services under the Local Stewardship Scenario
Local Stewardship Ecosystem Service
Baseline Description of Services 10% 90%
physical and mental well-being perspective
have benefits from a physical and mental well-being perspective
Recreation and tourism
Activities include canoeing, rowing, angling, boating, cycling, horse-riding, walking and bird watching. The number of visitors to the nature reserves at Ham Wall and Shapwick Heath is around 105,000 visits per year. Expenditure of around £1.5 million is estimated based on visitors to nature reserves alone, supporting 23 conservation and tourism jobs
Drier conditions may make access more generally available, increasing tourism and recreational visits. This may also increase disturbance. Jobs associated with conservation and tourism increase to 41
Wetter conditions may make it more difficult to access some areas, requiring investment by local conservation organisations (or co-operatives) to maintain appropriate levels of access. There is a big increase in jobs associated with tourism and conservation, to 68
Wildfowling and fishing
Wildfowling occurs on several moors across the area. Regular angling occurs on the Brue downstream of Bruton, Huntspill, South Drain, Cripps and Brue. Huntspill River is one of the premier coarse fisheries in the country. There are also a number of private and open fisheries in old peat diggings
Improved water quality may increase the quality of angling, although reductions in water quantity could affect fish populations. Access for angling could be reduced if fencing is needed to replace wet fences. Wildfowling is unlikely to be widely supported, although some limited shooting could be permitted to help farmers diversify their activities
Improved water quality may increase the quality of angling. Access for angling could be reduced if land becomes much wetter and/or waterlogged. Wildfowling is unlikely to be widely supported although some limited shooting could be permitted to help farmers diversify their activities
7.7 Comparison of Ecosystem Services under the Scenarios Sections 7.2 to 7.5 describe the impacts of the scenarios (and climate change under
the 10% and 90% probabilities). This section compares the implications of each scenario and assesses where there may be benefits or dis-benefits. Table 7.5 provides an overview of the potential for benefits and dis-benefits for each ecosystem service, each scenario and the 10% and 90% probabilities. The table also provides an indication of the magnitude of each benefit (or dis-benefit) using a simple rating system (colour coding is also used in Table 7.5 to make it easier to see the pattern of ratings across each scenario and each probability):
++: significant benefit; +: slight benefit; 0: no impact - : slight dis-benefit; and --: significant dis-benefit.

Risk & Policy Analysts, Geckoella and Environment Systems
Page 245
The table also assigns a relative importance to each ecosystem service to reflect the some services are likely to be much more significant to the Brue Valley than others. A simple rating is again given: High: service is important in the Brue Valley and is likely to form a significant
part of the overall level of ecosystem services that are being provided; Medium: service is (or could become) important in the Brue Valley, but the
level of benefits provided is only slightly significant to the overall level of ecosystem services that are being provided, for example, because it is limited in extent;
Low: service is not currently important in the Brue Valley, and is unlikely to become important under climate change or the socio-economic scenarios.
Table 7.5: Rating of Ecosystem Services Provided under Each Scenario and Probability
World Markets
Provincial Enterprise
Global Sustainability
Local Stewardship Ecosystem Service
Importance of Service
10% 90% 10% 90% 10% 90% 10% 90%
Provisioning Services
Biochemicals, natural medicines and pharmaceuticals
Low + + - -- + + + +
Biodiversity High - + -- -- ++ ++ + ++
Fibre production Low 0 0 0 0 0 0 0 0
Food production High ++ ++ ++ - ++ + ++ -
Fuel provision Low 0 0 0 0 0 0 0 0
Ornamental resources
Medium + ++ + + + + + +
Peat for horticulture High - - + - -- -- - -
Provision of freshwater (and availability of freshwater)
Medium 0/- 0/- -- - +/- + +/- +
Renewable energy Medium + +/- +/- +/- + + + +
Timber provision Medium + 0 + 0 + 0 + 0
Regulating Services
Emissions of GHGs High - + - + - ++ - +
Sequestration of GHGs
High - + -- ++ + ++ 0 ++
Microclimate Medium - + - + - + - +
Nutrient and sediment cycling
High 0/- 0/- -- - ++ ++ + +
Pest and disease control
Medium + + +/- +/- + + +/- +/-
Water quality regulation
High 0/- 0/- -- - + + + +
Water regulation (ability to control drainage and movement of water)
High 0 + -- -- - - 0 +

The Environmental and Socio-Economic Impacts of Climate Change in the Brue Valley
Page 246
Table 7.5: Rating of Ecosystem Services Provided under Each Scenario and Probability
World Markets
Provincial Enterprise
Global Sustainability
Local Stewardship Ecosystem Service
Importance of Service
10% 90% 10% 90% 10% 90% 10% 90%
Water regulation (flood and erosion control)
High + +/- - -- + +/- +/- +/-
Cultural Services
Aesthetics High -- - -- - 0/+ +/- +/- +/-
Educational value Medium ++ ++ +/- +/- ++ ++ + +
Historic environment and heritage
High - +/- -- 0/- 0/- + 0/- +
Knowledge systems Medium + + +/- +/- ++ ++ + +
Physical and mental health and well-being
Medium 0/- +/- -- - + + + +
Recreation and tourism
High + + - - ++ ++ + ++
Wildfowling and fishing
High 0 0 0/+ 0/+ + + + +
Table 7.6 summarises the information above across the high and medium ecosystem services, to give an indication of the best (and worst) scenarios. If a scenario (or probability) has been assigned a score of 0/-, etc. both ratings are counted. The table gives a visual interpretation of the number of categories that have been assigned each rating for each scenario, and each probability.
Table 7.6: Summary of Ecosystem Services Provided by Each Scenario and Probability
World Markets
Provincial Enterprise
Global Sustainability
Local Stewardship Ecosystem Service
No. Categories Assigned Rating of
10% 90% 10% 90% 10% 90% 10% 90%
++ ● ● ● ● ●●●● ●●●●●
● ●●●
+ ●● ●●●●●●●
●● ●● ●●●●●
●●●●●●
●●●●●●●
●●●●●●●●
0 ●●●● ●●● ● ●● ●● 0 ●●● 0
- ●●●●●●●
●●●●●●
●●● ●●●●●●●
●●● ●●● ●●●●●
●●●●
HIGH categories (13 out of 25)
-- ● 0 ●●●●●●●
●●● ● ● 0 0
++ ■ ■■ 0 0 ■■ ■■ 0 0
+ ■■■■■
■■■■■
■■■■■■
■■■■■■
■■■■■■
■■■■■■
■■■■■■■■
■■■■■■■■
0 ■■ ■■ 0 ■ 0 ■ 0 ■
- ■■■ ■■■ ■■■■■
■■■■■■
■■ 0 ■■■ ■
MEDIUM categories (9 out of 25)
-- 0 0 ■■ 0 0 0 0 0

Risk & Policy Analysts, Geckoella and Environment Systems
Page 247
Figures 7.1a to 7.1d provide an illustration of the differences between the ratings assigned to the four scenarios for the High categories only. The figures show that the Global Sustainability scenario scores most ++ ratings, especially under the 90% probability. However, both the 10% and 90% probabilities under the Global Sustainability scenario do score a three – and one -- ratings. The Local Stewardship scenario tends towards + ratings, again mainly on the 90% probability, although again there are five – ratings under the 10% probability. The World Markets scenario (90% probability) has a high proportion of + ratings (seven). The 10% probability only has two + ratings, with seven - ratings. The Provincial Enterprise scenario shows a tendency for lower ratings with the -- ratings dominating on the 10% probability, ad – rating for the 90% probability. The wetter conditions under the 90% probability help to minimise some of the potential dis-benefits in ecosystem services, but even then the overall pattern is biased towards negative impacts. This is mainly because of the lack of management of wetter habitats where land is abandoned, because it is too wet to use for agriculture.
7.8 Ecosystem Services Most Vulnerable to Climate Change
Using the description of the changes in ecosystem services (from Tables 7.1 to 7.4, and the detailed Appraisal Summary Table (AST) from Annex 3), it is possible to identify those that are likely to be most vulnerable to climate change in the Brue Valley. These services are: provisioning services:
o biodiversity; and o provision of freshwater (and availability of freshwater).
regulating services: o pest and disease control; o water quality regulation; o water regulation (ability to control drainage and movement of water);
and o water regulation (flood and erosion control).
cultural services: o aesthetics; o historic environment and heritage; and o recreation and tourism.
Table 7.7 summarises the impacts of each scenario and each probability for the most vulnerable ecosystem services.

The Environmental and Socio-Economic Impacts of Climate Change in the Brue Valley
Page 248
Figure 7.1a: Ratings Assigned to World Markets Figure 7.1b: Ratings Assigned to Provincial Enterprise Scenario Figure 7.1c: Ratings Assigned to Global Sustainability Scenario Figure 7.1d: Ratings Assigned to Local Stewardship Scenario
0
1
2
3
4
5
6
7
8
9
10
++ + 0 - --
No
. ra
tin
gs
ass
ign
ed
World Markets (10%)World Markets (90%)
0
1
2
3
4
5
6
7
8
9
10
++ + 0 - --
No
. ra
tin
gs
ass
ign
ed
Provincial Enterprise (10%)Provincial Enterprise (90%)
0
1
2
3
4
5
6
7
8
9
10
++ + 0 - --
No
. ra
tin
gs
ass
ign
ed
Global Sustainability (10%)Global Sustainability (90%)
0
1
2
3
4
5
6
7
8
9
10
++ + 0 - --
No
. ra
tin
gs
ass
ign
ed
Local Stewardship (10%)Local Stewardship (90%)

Risk & Policy Analysts, Geckoella and Environment Systems
Page 249
Table 7.7: Rating of Ecosystem Services that are Most Vulnerable to Climate Change
World Markets
Provincial Enterprise
Global Sustainability
Local Stewardship Ecosystem Service
Vulnerability to Climate
Change 10% 90% 10% 90% 10% 90% 10% 90%
Provisioning Services
Biodiversity High - + -- -- ++ ++ + ++
Provision of freshwater (and availability of freshwater)
Medium 0/- 0/- -- - +/- + +/- +
Regulating Services
Pest and disease control
Medium + + +/- +/- + + +/- +/-
Water quality regulation
High 0/- 0/- -- - + + + +
Water regulation (ability to control drainage and movement of water)
High 0 + -- -- - - 0 +
Water regulation (flood and erosion control)
High + +/- - -- + +/- +/- +/-
Cultural Services
Aesthetics High -- - -- - 0/+ +/- +/- +/-
Historic environment and heritage
High - +/- -- 0/- 0/- + 0/- +
Recreation and tourism
High + + - - ++ ++ + ++
Table 7.8 summarises the ratings across these nine services (the total for each scenario/probability may exceed nine due to 0/-, etc. ratings counting twice, once for 0, once for -). The table gives a visual representation, as well as the number, of the ratings assigned. It shows a marked difference between the Provincial Enterprise scenario and the other scenarios. The World Markets scenario shows a reasonable balance between negative and positive ratings, although there is an overall negative outcome under the 10% probability. The Global Sustainability and Local Stewardship scenarios both show overall positive patterns.
Table 7.8: Extent of Impacts on Services that are Highly or Slightly Vulnerable to Climate Change
World Markets Provincial Enterprise
Global Sustainability
Local Stewardship Ecosystem
Service
No. Categories Assigned Rating of 10% 90% 10% 90% 10% 90% 10% 90%
++ 0 0 0 0 ●● ●● 0 ●●
+ ●●● ●●●●●●
● ● ●●●●●
●●●●●●
●●●●●●●
●●●●●●●
0 ●●● ●● 0 ● ●● 0 ●● 0
- ●●●● ●●●●●
●●● ●●●●●●
●●● ●●● ●●●●●
●●●
Highly vulnerable categories (9 out of 25)
-- ● 0 ●●●●●●
●●● 0 0 0 0

The Environmental and Socio-Economic Impacts of Climate Change in the Brue Valley
Page 250
7.9 Ecosystem Services Most Vulnerable to Socio-Economic Change Similarly, it is possible to assess which of the services are most vulnerable to the socio-economic changes described in the scenarios. This is done by considering which services have the greatest difference in impacts (from -- to ++). Taking the most vulnerable services as those where there is a range in impacts across the four scenarios and two probabilities by four or five ratings (i.e. -- to ++, -- to +, or - to ++), these services are: provisioning services:
o biochemicals, natural medicines and pharmaceuticals; o biodiversity; o food production; o peat for horticulture; and o provision of freshwater (and availability of freshwater).
regulating services: o emissions of GHGs; o sequestration of GHGs; o nutrient and sediment cycling; o water quality regulation; o water regulation (ability to control drainage and movement of water);
and o water regulation (flood and erosion control).
cultural services: o historic environment and heritage; o physical and mental health and well-being; and o recreation and tourism.
Table 7.9 summarises the impacts of each scenario and each probability for the most vulnerable ecosystem services.
Table 7.9: Rating of Ecosystem Services that are Most Vulnerable to Socio-Economic Changes
World Markets
Provincial Enterprise
Global Sustainability
Local Stewardship Ecosystem Service
Vulnerability to Socio-
Economic Change
10% 90% 10% 90% 10% 90% 10% 90%
Provisioning Services
Biochemicals, natural medicines and pharmaceuticals
High + + - -- + + + +
Biodiversity High - + -- -- ++ ++ + ++
Food production High ++ ++ ++ - ++ + ++ -
Peat for horticulture High - - + - -- -- - -
Provision of freshwater (and availability of freshwater)
High 0/- 0/- -- - +/- + +/- +
Regulating Services
Emissions of GHGs High - + - + - ++ - +
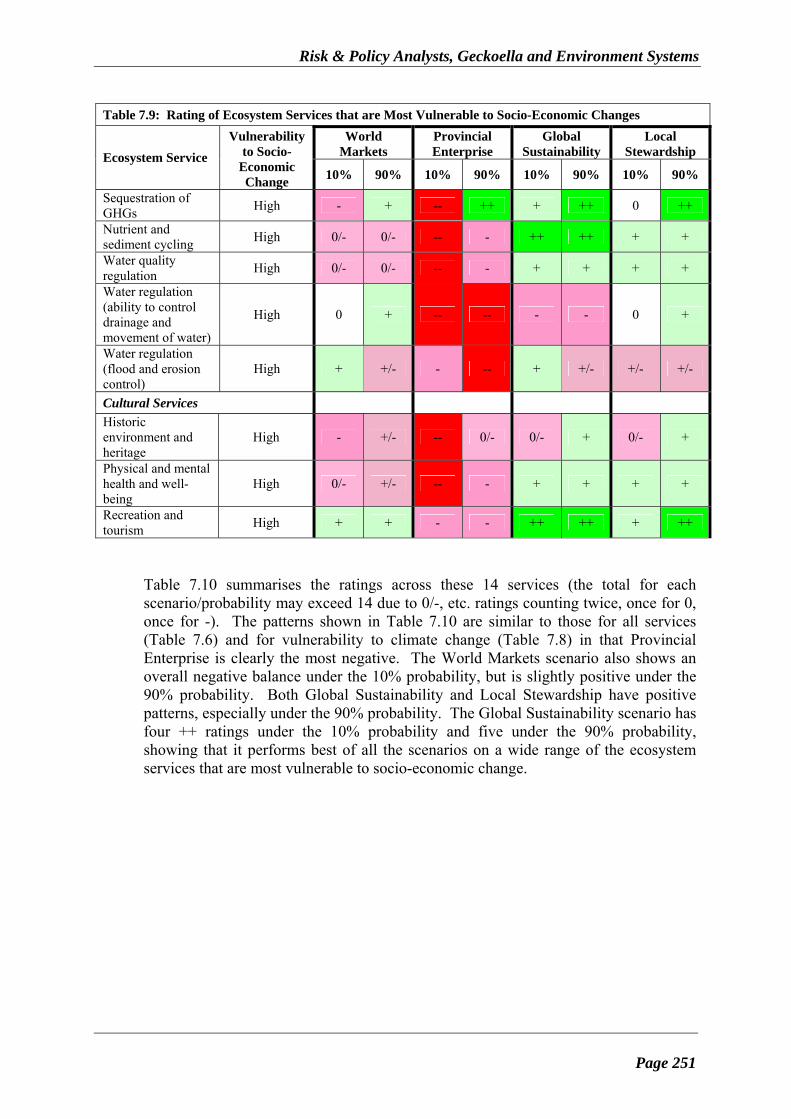
Risk & Policy Analysts, Geckoella and Environment Systems
Page 251
Table 7.9: Rating of Ecosystem Services that are Most Vulnerable to Socio-Economic Changes
World Markets
Provincial Enterprise
Global Sustainability
Local Stewardship Ecosystem Service
Vulnerability to Socio-
Economic Change
10% 90% 10% 90% 10% 90% 10% 90%
Sequestration of GHGs
High - + -- ++ + ++ 0 ++
Nutrient and sediment cycling
High 0/- 0/- -- - ++ ++ + +
Water quality regulation
High 0/- 0/- -- - + + + +
Water regulation (ability to control drainage and movement of water)
High 0 + -- -- - - 0 +
Water regulation (flood and erosion control)
High + +/- - -- + +/- +/- +/-
Cultural Services
Historic environment and heritage
High - +/- -- 0/- 0/- + 0/- +
Physical and mental health and well-being
High 0/- +/- -- - + + + +
Recreation and tourism
High + + - - ++ ++ + ++
Table 7.10 summarises the ratings across these 14 services (the total for each scenario/probability may exceed 14 due to 0/-, etc. ratings counting twice, once for 0, once for -). The patterns shown in Table 7.10 are similar to those for all services (Table 7.6) and for vulnerability to climate change (Table 7.8) in that Provincial Enterprise is clearly the most negative. The World Markets scenario also shows an overall negative balance under the 10% probability, but is slightly positive under the 90% probability. Both Global Sustainability and Local Stewardship have positive patterns, especially under the 90% probability. The Global Sustainability scenario has four ++ ratings under the 10% probability and five under the 90% probability, showing that it performs best of all the scenarios on a wide range of the ecosystem services that are most vulnerable to socio-economic change.

The Environmental and Socio-Economic Impacts of Climate Change in the Brue Valley
Page 252
Table 7.10: Extent of Impacts on Services that Most Vulnerable to Socio-Economic Changes
World Markets Provincial Enterprise
Global Sustainability
Local Stewardship Ecosystem
Service
No. Categories Assigned Rating of 10% 90% 10% 90% 10% 90% 10% 90%
++ ● ● ● ● ●●●● ●●●●●
● ●●●
+ ●● ●●●●●●●●
● ● ●●●●●
●●●●●●
●●●●●●●
●●●●●●●●
0 ●●●●●
●●● 0 ● ● 0 ●●● 0
- ●●●●●●●●●
●●●●●●●
●●● ●●●●●●●●
●●●● ●● ●●●●●
●●●
Highly vulnerable categories (14 out of 25)
-- 0 0 ●●●●●●●●
●●● ● ● 0 0

Risk & Policy Analysts, Geckoella and Environment Systems
Page 253
8. CONCLUSIONS 8.1 Introduction This Section summarises the key findings of the study, drawing together the projected
changes in areas of each feature as a result of climate change and the impacts that this could have on the socio-economic situation in the Brue Valley. It also discusses the next steps needed to build upon the results and to begin the work needed with local stakeholders to help ensure that negative effects associated with climate change are minimised and that new opportunities are exploited.
8.2 Change in Area of Features Table 8.1 summarises the extent of change of area of each feature, where:
area of feature increases by at least 100%; area of feature increases, but by less than 100%; ~ area of feature remains roughly the same (less than ±10%); area of feature decreases, but by less than half; area of feature decreases by at least half.
This information is then used to identify which of the features are likely to be the
most vulnerable in terms of area due to climate change and socio-economic change. Table 8.1: Change in Area of Features
World Markets Provincial Enterprise
Global Sustainability
Local StewardshipFeature
10% 90% 10% 90% 10% 90% 10% 90%
~ Cereal crops
Not vulnerable Not vulnerable Unlikely to be vulnerable
Not vulnerable
Dry grassland of high wildlife value Not vulnerable Highly vulnerable Not vulnerable Not vulnerable
Dry grassland of low wildlife value Highly vulnerable
Somewhat vulnerable Highly vulnerable Somewhat
vulnerable ~ ~ ~
Lakes/ponds Not vulnerable Possibly vulnerable Not vulnerable Not vulnerable Orchards and
horticulture (includes withy growing) Not vulnerable Not vulnerable Not vulnerable Not vulnerable
~ ~ ~ ~ ~ ~ ~ ~ Other (settlements and roads) Unlikely to be
vulnerable Unlikely to be
vulnerable Unlikely to be
vulnerable Unlikely to be
vulnerable Peat works and bare
ground Possibly vulnerable Possibly vulnerable Highly vulnerable Highly vulnerable

The Environmental and Socio-Economic Impacts of Climate Change in the Brue Valley
Page 254
Table 8.1: Change in Area of Features
World Markets Provincial Enterprise
Global Sustainability
Local StewardshipFeature
10% 90% 10% 90% 10% 90% 10% 90%
~ ~ Reedbeds
Not vulnerable Somewhat vulnerable Not vulnerable Not vulnerable
~ ~ ~ ~ Rivers/streams/ ditches/rhynes Not vulnerable Possibly vulnerable Not vulnerable Not vulnerable
~ Swamp and fen Unlikely to be
vulnerable Possibly vulnerable Not vulnerable Not vulnerable
~ ~ Wet grassland of high value for wildlife Not vulnerable Somewhat
vulnerable Not vulnerable Possibly vulnerable
~ Wet grassland of low value for wildlife Possibly vulnerable
Unlikely to be vulnerable
Somewhat vulnerable Highly vulnerable
~ Wet heath and purple moor grass Possibly vulnerable Highly vulnerable Possibly vulnerable Not vulnerable
~ ~ Woodland/hedgerow/line of trees/scrub and bracken
Unlikely to be vulnerable Not vulnerable Not vulnerable Not vulnerable
Table 8.1 shows that the most vulnerable features are:
Dry grassland of high value for wildlife: this is most vulnerable under the Provincial Enterprise scenario as there is little or no concern for the environment here. This is reflected in a lack of demand for premium and, potentially high profit, products (such as SSSI beef) that enable this feature to extend its area under the other scenarios. If there is continued or increased demand for premium products than this feature is likely to be less vulnerable as there will be opportunities to maximise income from the grassland through management in a way that also benefits biodiversity.
Dry grassland of low value for wildlife: this feature becomes highly vulnerable
under the World Markets and Global Sustainability scenarios and because of wetter conditions under the 90% probability. The main pressure on this feature is the lack of profitability it offers (for example, under World Markets) and its low value for wildlife. This means it cannot be used to produce premium, high-profit products and does also not provide a high level of ecosystem services. As a result, it tends to be converted to more profitable features (such as cereal crops) under the World Markets scenario and to features offering higher environmental benefits (including to dry grassland of high value for wildlife).
Peat works and bare ground: this feature becomes highly vulnerable because of
changes in attitude to extraction of peat and changes in demand for peat. Under

Risk & Policy Analysts, Geckoella and Environment Systems
Page 255
the Global Sustainability scenario, demand for peat reduces to zero so extraction of peat stops completely. Under Local Stewardship, there is a small level of local demand for peat, but growing environmental concerns reduce peat extraction significantly.
Reedbeds: this feature may be somewhat vulnerable under the Provincial
Enterprise scenario, notably the 10% probability, where a lack of management for conservation means reedbeds become succeeded by scrub and, eventually woodland.
Wet grassland of high value for wildlife: this feature may be somewhat
vulnerable under the Provincial Enterprise scenario because of the lack of concern for the environment and the lack of management of land for environmental benefits. As a result, the land would be converted to more profitable land uses, such as arable crops and horticulture.
Wet grassland of low value for wildlife: this feature is vulnerable under the
Global Sustainability and Local Stewardship scenarios and both the 10% and 90% probabilities. This is because these scenarios place a high value on environmental value such that features would be managed to provide higher value for wildlife. The drier conditions under the 10% probability also make it more difficult to maintain wet fences, with water targeted towards higher value biodiversity features.
Wet heath and purple moor grass: this feature is highly vulnerable under the
Provincial Enterprise scenario. Under the 10% probability, the drier conditions increase opportunities for grazing of the feature and the emphasis on intensification means that the biodiversity value of this habitat is expected to be lost due to efforts to improve the grassland through addition of fertilisers. Under the 90% probability, the feature would become wetter and would be abandoned under the Provincial Enterprise scenario, with no management of the wet heath such that it reverts to wet scrub.
8.3 Impacts on Socio-Economic Situation Table 8.2 provides the projected change in number of jobs, income from food
production and skills levels under the four scenarios and 10% and 90% probabilities. All number of jobs and income are given to two significant figures to reflect the degree of uncertainty associated with the projections. The estimated current number of jobs is 580 (530 in agriculture, 20 in conservation and tourism, and 30 associated with peat extraction), with current income from food production estimated at £8.8 million.

The Environmental and Socio-Economic Impacts of Climate Change in the Brue Valley
Page 256
Table 8.2: Jobs, Income and Skills under each Scenario and Probability
World Markets Provincial Enterprise
Global Sustainability
Local StewardshipFeature
10% 90% 10% 90% 10% 90% 10% 90%
Total jobs: 1,090 790 990 530 730 650 740 510
- jobs in agriculture 1,040 730 930 490 670 580 680 420
- jobs in conservation and recreation
30 40 20 20 60 70 40 70
- jobs in peat extraction
30 20 40 30 0 0 20 20
Total income from food production (£ millions)
£17m £12m £16m £8m £13m £10m £12m £7m
Skills level
Investment in new technology and
techniques and how to apply these to
maximise incomes
Reliance on existing skills and
knowledge to maximise incomes
Investment in new technology and techniques to
minimise environmental
impact/maximise environmental
benefit
Move to mixed farming/specialist produce to meet
local demands with opportunities for
diversification and development of
new skills 8.4 Change in Environmental Quality The change in area of the feature alone does not reflect the potential implications of
climate change and socio-economic change on the environmental quality of the Brue Valley. An assessment has also been made of the potential impact of changes on the features themselves that could either improve or decrease their environmental value. Table 8.3 summarises the extent to which environmental quality is projected to change under each of the four scenarios and the 10% and 90% probabilities:
environmental quality is expected to increase significantly; environmental quality is not expected to change significantly; and environmental quality is expected to decrease significantly.
The projected change in environmental quality is used to identify where there may be
the greatest risks to biodiversity. Table 8.3: Change in Environmental Quality of Features
World Markets Provincial Enterprise
Global Sustainability
Local StewardshipFeature
10% 90% 10% 90% 10% 90% 10% 90%
Cereal crops No change in risk
to biodiversity Possible loss of
biodiversity Potential benefits to
biodiversity Possible loss of
biodiversity
Dry grassland of high wildlife value Possible loss of
biodiversity Possible loss of
biodiversity
Risk to biodiversity under some conditions
Possible loss of biodiversity

Risk & Policy Analysts, Geckoella and Environment Systems
Page 257
Table 8.3: Change in Environmental Quality of Features
World Markets Provincial Enterprise
Global Sustainability
Local StewardshipFeature
10% 90% 10% 90% 10% 90% 10% 90%
Dry grassland of low wildlife value Possible loss of
biodiversity Possible loss of
biodiversity
Risk to biodiversity under some conditions
Possible loss of biodiversity
Lakes/ponds Possible loss of
biodiversity Possible loss of
biodiversity Potential benefits to
biodiversity Potential benefits to
biodiversity Orchards and
horticulture (includes withy growing)
Possible loss of biodiversity
Possible loss of biodiversity
No change in risk to biodiversity
No change in risk to biodiversity
Other (settlements and roads) No change in risk
to biodiversity No change in risk
to biodiversity No change in risk
to biodiversity No change in risk
to biodiversity Peat works and bare
ground Potential benefits to biodiversity
Possible loss of biodiversity
Potential benefits to biodiversity
Potential benefits to biodiversity
Reedbeds Possible loss of biodiversity
Possible loss of biodiversity
Potential benefits to biodiversity
Risk to biodiversity under some conditions
Rivers/streams/ ditches/rhynes Possible loss of
biodiversity Possible loss of
biodiversity Potential benefits to
biodiversity Potential benefits to
biodiversity
Swamp and fen Potential benefits to biodiversity
Possible loss of biodiversity
Potential benefits to biodiversity
Potential benefits to biodiversity
Wet grassland of high value for wildlife
Possible loss of biodiversity
Possible loss of biodiversity
Possible loss of biodiversity
Possible loss of biodiversity
Wet grassland of low value for wildlife Possible loss of
biodiversity Possible loss of
biodiversity Possible loss of
biodiversity Possible loss of
biodiversity
Wet heath and purple moor grass Potential benefits to
biodiversity Possible loss of
biodiversity Risk to biodiversity
under some conditions
Risk to biodiversity under some conditions
Woodland/hedgerow/line of trees/scrub and bracken
No change in risk to biodiversity
Possible loss of biodiversity
Potential benefits to biodiversity
No change in risk to biodiversity
Table 8.3 shows that there may be risks to biodiversity for the following features
(from high to low value for biodiversity): Features of High Value for Wildlife Dry grassland of high value for wildlife: impacts occur mainly under the 90%
probability due to the wetter conditions and the difficulty of managing dry

The Environmental and Socio-Economic Impacts of Climate Change in the Brue Valley
Page 258
grassland. The Provincial Enterprise scenario is also projected to reduce the environmental value of this feature, although this is mainly associated with improvement of the grassland such that it would change to grassland of low value for wildlife.
Lakes and ponds: the environmental quality of this feature could be affected by
increased use of nutrients and pesticides that could be washed into the waterbodies following periods of heavy rain, under both the 10% and 90% probabilities and the World Markets and Provincial Enterprise scenarios.
Reedbeds: under the 10% probability for the World Markets and Provincial
Enterprise scenarios there is a risk that reedbeds could dry out and/or be succeeded by scrub due to a reduction in management. The Local Stewardship scenario could result in a reduction in environmental quality due to the risk of a reduction in reedbed connectivity as a result of a lack of co-ordinated management. Under the 90% probability, the projected change in environmental quality is linked to increased flood risk affecting species living in the reedbeds.
Rivers, streams, ditches and rhynes: as for lakes and ponds, the main potential
impact on environment quality is increased levels of nutrients and pesticides entering the watercourses following heavy rain, on the World Markets and Provincial Enterprise scenarios.
Swamp and fen: under the Provincial Enterprise scenario, it is projected that
swamp and fen habitats would not be managed and are likely to dry out under the 10% probability. Under the 90% probability, lack of management is likely to result in more vigorous species dominating, with a reduction in overall biodiversity.
Wet grassland of high value for wildlife: drier conditions under the 10%
probability may make it more difficult to manage the grassland, with this potentially affecting environmental quality under all four scenarios. Under the 90% probability, there is a risk that the conditions could be too wet for some grass species, which could also affect overall biodiversity value.
Wet heath and purple moor grass: under Provincial Enterprise, there is a risk
that this feature could be converted to more profitable land uses, while drier conditions under the 10% probability could affect the balance of species.
Features of Moderate Value for Wildlife Dry grassland of low value for wildlife: risk of intensification under the
Provincial Enterprise scenario and the 10% probability. The biggest risks to environmental quality of this feature are associated with the wetter conditions under the 90% probability.
Orchards and horticulture: increased use of pesticides and fertilisers under the
World Markets and Provincial Enterprise scenario is projected to reduce the

Risk & Policy Analysts, Geckoella and Environment Systems
Page 259
environmental quality of this feature. No significant benefits to biodiversity are expected under the Global Sustainability or Local Stewardship scenarios.
Wet grassland of low value for wildlife: as for wet grassland of high value for
wildlife, the impacts under the 10% probability are associated with drying out, while under the 90% probability are associated with water tables being too high for many grassland species.
Woodland, hedgerow, line of trees, scrub and bracken: under the Provincial
Enterprise scenario, there may be opportunity for scrub and bracken (and eventually woodland) to colonise other features that have been abandoned (especially under the 90% probability where they may be too wet to be used profitably). However, the scrub and woodland would not be managed so the biodiversity potential may be limited.
Features of Low Value for Wildlife Cereal crops: intensification under the Provincial Enterprise scenario could
reduce biodiversity value. There may also be localised intensification under the Local Stewardship scenario.
Peat works and bare ground: restoration of old peat workings is projected to
result in an increase in environmental quality, but this is not expected to be managed (or proactively undertaken) under the Provincial Enterprise scenario.
8.5 Change in Ecosystem Services
The implications of changes in area and environmental quality are reflected in changes in the level of ecosystem services provided. Table 8.4 summarises the change in ecosystem services that are the most important in the Brue Valley, are most vulnerable to climate change and/or to socio-economic change.
Table 8.4: Changes to Key Ecosystem Services
Key Service because…
World Markets
Provincial Enterprise
Global Sustainability
Local Stewardship
Ecosystem Service
Imp
orta
nt
to B
rue
Val
ley
Mos
t vu
lner
able
to
clim
ate
chan
ge
Mos
t vu
lner
able
to
soci
o-ec
onom
ic c
han
ge
10% 90% 10% 90% 10% 90% 10% 90%
Provisioning Services
Biodiversity ● ● ● - + -- -- ++ ++ + ++
Food production ● ● ++ ++ ++ - ++ + ++ -
Peat for horticulture ● ● - - + - -- -- - -

The Environmental and Socio-Economic Impacts of Climate Change in the Brue Valley
Page 260
Table 8.4: Changes to Key Ecosystem Services
Key Service because…
World Markets
Provincial Enterprise
Global Sustainability
Local Stewardship
Regulating Services
Emissions of GHGs ● ● - + - + - ++ - +
Sequestration of GHGs
● ● - + -- ++ + ++ 0 ++
Nutrient and sediment cycling
● ● 0/- 0/- -- - ++ ++ + +
Water quality regulation
● ● ● 0/- 0/- -- - + + + +
Water regulation (ability to control drainage and movement of water)
● ● ● 0 + -- -- - - 0 +
Water regulation (flood and erosion control)
● ● ● + +/- - -- + +/- +/- +/-
Cultural Services
Aesthetics ● ● -- - -- - 0/+ +/- +/- +/-
Historic environment and heritage
● ● ● - +/- -- 0/- 0/- + 0/- +
Recreation and tourism
● ● ● + + - - ++ ++ + ++
Table 8.4 shows that the Provincial Enterprise is clearly the worst scenario in terms of provision of ecosystem services. This would be expected with the emphasis being on profit maximisation with little concern for the environment. The table also shows that there are negative and positive impacts under all the scenarios, suggesting that improvements in some services requiring a trade-off reduction in others. Other services are clearly linked, with benefits in one helping to generate benefits in another. One such example is biodiversity, where benefits help to improve opportunities for recreation and tourism. This is one opportunity that can be exploited through the adaptation measures to help maintain and enhance the socio-economic situation in the Brue Valley. Opportunities also exist through investment in the water management regime. Benefits to this service can help deliver improved biodiversity (through maintaining water tables in areas of high environmental quality), food production (by maintaining levels of biomass production in grasslands, and emissions of GHGs) and the historic environment and heritage (by reducing the risk that peat soils dry out). The results of the assessment of ecosystem services can, therefore, be used to help identify the processes by which benefits can be delivered across a range of services. This information can then be applied to identify where adaptation measures could and should be applied to help deliver social, environmental and economic benefits.

Risk & Policy Analysts, Geckoella and Environment Systems
Page 261
8.6 Key Uncertainties This report relies on a wealth of source data that has been used throughout the study.
Where sufficient data were available, a hierarchy has been applied with preference for data that are specific to the Brue Valley and that have been derived from peer-reviewed publications. However, the volume of data needed and the specific nature of this study (being focused on the Brue Valley) have meant that other data sources have also been utilised to help fill data gaps. As a result, the conclusions are based on extrapolation of data from: other locations, with reducing certainty depending on whether these data are specific to the Somerset Levels and Moors, Somerset (the county) or further afield; and from expert opinion and analysis.
It is also important to recognise that the findings are based on scenarios. These
include the UKCP09 scenarios, where the study has used the high emissions scenario and the 10% and 90% probabilities to explore a range of impacts. The use of socio-economic scenarios allows the study to assess the implications of climate change, and social and economic change on the Brue Valley over the next 50 years. The socio-economic scenarios have been described in detail and this highlights that they provide four possible futures, out of an infinite number of possible futures. The findings are, therefore, projections of what could happen under those four possible futures. They are not predictions. Changes to any of the underlying principles in any of the four socio-economic scenarios could affect the implications in terms of the projected area of each feature, change in environmental quality, change in jobs and income or change in ecosystem services.
It is not possible to quantify the level of uncertainty due to the range of data sources
used and the scenario approach that has been followed. However, the use of scenarios and projected outcomes means that there is moderate level of confidence when considering differences between the scenarios.
8.7 Next Steps The findings provided in this study are based on analysis and interpretation of data
across four scenarios and two UKCP09 probabilities (10% and 90% under the high emissions scenarios). This has identified a range of possible adaptation measures that could be applied to minimise potential negative effects on jobs, income and the environment. The storylines provide the basis for communication of the projected implications of climate change on each feature and the potential for adaptation measures to reduce negative implications. They are intended to provide the context to, and direction for, decisions concerning the future management of the Brue Valley.
The next steps involve the development of the findings of this study into engagement tools for consultation with policy makers and local stakeholders. It will be important that this community engagement both tests the findings of the study and explores real opportunities for no regrets and ‘good value’ adaptations that can help deliver social, economic and environmental benefits in the Brue Valley over the next 50 years.

The Environmental and Socio-Economic Impacts of Climate Change in the Brue Valley
Page 262

Risk & Policy Analysts, Geckoella and Environment Systems
Page 263
9. REFERENCES The following references have been used through the study to inform the description and assessment of the features, ecosystem services provided by those features, the implications of climate change on the features, the development of socio-economic scenarios and the identification of adaptation measures that may be used to help reduce or remove negative impacts associated with climate change. Acreman M et al (in press): Trade-off in Ecosystem Services of the Somerset Levels and
Moor Wetlands, Hydrological Sciences Journal, in press. Acreman MC et al (2009): A Simple Framework for Evaluating Regional Wetland
Ecohydrological Response to Climate Change with Case Studies from Great Britain, Ecohydrology, 2, pp1–17, published online in Wiley InterScience (www.interscience.wiley.com) DOI: 10.1002/eco.37.
Ausden et al (2001): The Effects of Lowland Wet Grassland on Soil Macro Invertebrate
Prey of Breeding Wading Birds, Journal of Applied Ecology, 38, pp320- 33. Broadmeadow M (ed.) (2002): Climate Change: Impacts on UK Forests, Bulletin 125,
Forestry Commission: Edinburgh. Cranfield University (2005): Response of Grassland Plant Communities to Altered
Hydrological Management, Defra Research Report BD1321, June 2005. Couwenberg J (2009): Emission factors for Managed Peat Soils, An Analysis of IPCC
Default Values, report to Wetlands International, Ede, June 2009. Couwenberg J (2009): Methane Emissions from Peat Soils, Facts, MRV-ability, Emission
Factors, report to Wetlands International, Ede, August 2009. Crick H (2004): The Impact of Climate Change on Birds, Ibis, 146 (Suppl.1), pp48–56. DECC (2009) Carbon Valuation in UK Policy Appraisal: A Revised Approach, Climate
Change Economics, July 2009. Defra (2010): June Survey of Agricultural and Horticultural Activity Defra (2010): Farm Accounts in England 2009/10, available from: http://www.defra.gov.uk/evidence/statistics/foodfarm/farmmanage/fbs/published-
data/farmaccounts/2010/index.htm. Defra (2009): Ecosystem Services of Peat - Phase 1, Project Code: SP0572. Duranel1 AJ et al (2007): Assessing the Hydrological Suitability of Floodplains for Species-
rich Meadow Restoration: a Case Study of the Thames Floodplain, UK Hydrol. Earth Syst. Sci., 11, pp170-179: www.hydrol-earth-syst-sci.net/11/170/2007/ doi:10.5194/hess-11-170-2007.

The Environmental and Socio-Economic Impacts of Climate Change in the Brue Valley
Page 264
Economic Systems: ECON i Online v1.0, available from: http://www.economicsystems.co.uk/south-west/index.php.
Environment Agency (2006): Fishing for the Future. Environment Agency (2009): North and Mid Somerset Catchment Flood Management
Plan, Summary Report December 2009, Managing Flood Risk. Environment Agency (2004): Ecohydrological Guidelines for Lowland Wetland Plant
Communities, Final Report, December 2004. FAO: CropWat version 8.0, available from:
http://www.fao.org/nr/water/infores_databases_cropwat.html. FAO: ETo Calculator, version 3.1, January 2009, available from:
http://www.fao.org/nr/water/eto.html.
Farming Futures (2007): General Opportunities and Challenges, Fact Sheet 2 Climate Change Series.
Farming Futures (2007): Focus on Dairy, Fact Sheet 8 Climate Change Series. Farming Futures (2008): Focus on Livestock, Fact Sheet 5 Climate Change Series. Farming Future (2009): Focus on: Water Management, Fact Sheet 18 Climate Change: be
part of the Solution. Farming Futures (2010): Focus on Arable Crops, Fact Sheet 10 Climate Change Series. Forestry Commission (2006): Climate Change in the South West: A Practical Guide for
Woodland Owners and Agents, October 2006. Forestry Commission (1999): Phytophora Pathogens of Trees: Their Rising Profile in
Europe, FCIN30. Forest Research (2010): Benefits of Green Infrastructure, report to Defra and CLG
WC0807, October 2010. Forest Research (2004): The Potential Effects of Climate Change for Trees and
Woodland in the South West, SW Climate Change Report, 6 May 2004. Gowing DJG et al (2002): Water Regime Requirements and the Response to
Hydrological Change of Grassland Plant Communities Institute of Water and Environment, Silsoe.
Grime et al (2000): in Clewett Price EA: Lowland Grassland and Heathland Habitats.

Risk & Policy Analysts, Geckoella and Environment Systems
Page 265
Harrison PA et al (eds.) (2001): Climate Change and Nature Conservation in Britain and Ireland: Modelling Natural Resource Responses to Climate Change (the MONARCH Project), Technical Report, Oxford, UKCIP.
Harrison PA et al (2008): Impacts of Socio-economic and Climate Change Scenarios on
Wetlands: Linking Water Resource and Biodiversity Meta-models, Climatic Change, 90, Numbers 1-2, pp113-139, DOI: 10.1007/s10584-008-9454-5.
Heijmans MM et al (2008): Long-Term Effects of Climate Change on Vegetation and
Carbon Dynamics in Peat Bogs, Journal of Vegetation Science, 19, pp307–320. doi: 10.3170/2008-8-18368.
IPCC (2007): Climate Change 2007, Fourth Assessment Report, Working Group 1 Report
on the Physical Science Basis. IPCC (2007): Fourth Assessment Report: Climate Change 2007, Working Group II:
Impacts, Adaptation and Vulnerability. Ireland SN et al (2005): Establishment of Wetland Ground Flora: An Analysis of
Planting Methodologies in Natural and Constructed Wetlands, Nutrients, Metals and Management, pp. 91-11 edited by J. Vymazal: Buckhuys Publishers, Leiden, The Netherlands.
JNCC (1997): Information Sheet on Ramsar Wetlands (RIS), Somerset Levels and
Moors, completed 26th June 1997 by JNCC, Peterborough. JNCC (2007): Handbook for Phase 1 Habitat Survey – a Technique for Environmental
Audit, England Field Unit, Nature Conservancy Council (1990), revised reprint by the Joint Nature Conservation Committee, Peterborough, 78pp.
Kechavarzi et al (2007): Water-Table Management in Lowland UK Peat Soils and its
Potential Impact on CO2 Emission, Soil Use and Management 23, pp359–367. Local Futures Group (2010): The State of Somerset, An economic, social and
environmental audit of Somerset, February 2010. Lower Brue District Drainage Board (2009a): Environmental Report: South Drain
Favourable Condition Project, December 2009. Lower Brue District Drainage Board (2009b): Environmental Report: North Drain
Favourable Condition Project, December 2009. Marlin - The Marine Life Information Network, Accesssed December 2010.
http://www.marlin.ac.uk/habitats.php. McInnes RJ et al (2008): Management of the Otmoor Protected Area (Oxfordshire),
Multifunctional Wetlands in Agricultural Landscapes: An Evaluation of Values, Impacts and the Application of the Ecosystem-Based Approach, WWT Report to Defra, NR0112, September 2008.

The Environmental and Socio-Economic Impacts of Climate Change in the Brue Valley
Page 266
Mendip District Council (1997): Landscape Assessment of Mendip District, Appendix A: Mendip Landscape Character Assessments.
Morison JIL et al (2008): Improving Water Use on Crop Production, Phil. Trans. R. Soc. B.,
363, pp639-658. Morris, J et al (2002): Economic Basis and Practicalities of Washland Creation on the
Somerset Levels and Moors, Wise Use of Floodplain Project. Natural England (2009): Responding to the Impacts of Climate Change on the Natural
Environment: The Broads, 31 March 2009. Natural England (2009): Responding to the Impacts of Climate Change on the Natural
Environment: Dorset Downs and Cranborne Chase, 31 March 2009. Neighbourhood Statistics: 2001 Census data, available from: http://www.neighbourhood.statistics.gov.uk/dissemination/. Nellemann C et al (Eds) (2009): The Environmental Food Crisis – The Environment’s
Role in Averting Future Food Crises. A UNEP rapid response assessment, United Nations Environment Programme, GRID-Arendal, www.grida.no.
Ostle NJ et al (2009): UK Land Use and Soil Carbon Sequestration, Land Use Policy, 26S,
S274-S283. PACEC (2004): The Great Fen Socio Economic Study Final Report, prepared by PACEC
on behalf of the Wildlife Trust, October 2004. Porter JR & Semenov MA (2005): Crop Responses to Climatic Variation, Phil. Trans. R.
Soc. B, 360, pp2021-2035. Pound D (2009): Adopting Effective Stakeholder Engagement Processes to Deliver
Regional Marine Protected Area (MPA) network, Natural England Commissioned Report, Number 008.
Rawlins (2008): The Socio-economic Aspects of Peatland Management: An Ecosystems
Approach, PhD Thesis, School of Applied Sciences, Department of Natural Resources, Cranfield.
Ray D (2008): Impacts of Climate Change on Forestry in Wales, Forestry Commission:
Wales. Ray D et al (2010): Climate Change - Impacts and Adaptation in England's Woodlands,
Forestry Commission Research Note 201. Rehfisch MM et al (2004): The Possible Impact of Climate Change on the Future
Distributions and Numbers of Waders on Britain’s Non-estuarine Coast, Ibis, 146 (Suppl.1), pp70–81.

Risk & Policy Analysts, Geckoella and Environment Systems
Page 267
Roy HE et al (2009): Nuisance Insects and Climate Change, Defra report. Scherr S and McNeely JA (2008): Biodiversity Conservation and Agricultural
Sustainability: Towards a New Paradigm of ‘Ecoagriculture’ Landscapes, Phil. Trans. R. Soc. B., 363, pp477-494.
Somerset Water & Wetlands Habitat Action Plan. South West Climate Change Impacts Partnership (SWCCIP) (2009): The Parrett
Catchment Flood Risk Management and Biodiversity, August 2009. South West Future Landscapes Programme (2009): Phase 1 Technical Report, for Natural
England, Prepared by Land Use Consultants, March 2009 South West Tourism (2008): Value of Tourism 2008: Somerset. Team Tourism Consulting (2010): Shapwick Heath National Nature Reserve, Visitor
Access Report, January 2010. Thompson D (2008): Carbon Management by Land and Marine Managers, Natural England
Research Report NERR026, November 2008. University of Essex (2008): Green Spaces – Measuring the Benefits drawing on case
studies from the East of England, report for the National Trust. Wallace H & Prosser M (2007): Prediction of Vegetation Change at West Sedgemoor
Following Changes in Hydrological Management. Ecological Surveys (Bangor), Final report to RSPB, Natural England and the Environment Agency.
Walther GR (2010): Community and Ecosystem Responses to Recent Climate Change, Phil.
Trans. R. Soc. B, 365, pp2019-2024. Warwick HRI (2003): The Impact of Climate Change on the Delivery of Biodiversity
through Agri-Environment Schemes, Defra Research Report AC0304, Final Report.
Warwick HRI (2008): Vulnerability of UK Agriculture to Extreme Events, Research
Report AC0301 to Defra, Final Report. White JW (2009): Adapting Cropping Patterns to Climate Change, Proceedings of the 21st
Annual Conference to the National Agricultural Biotechnology Council, hosted by the College of Agriculture and Bioresources, University of Saskatchewan, Saskatoon, Saskatchewan, Jun 24-26, 2009, pp104-115.
Willis K et al (1993): Valuation of the South Downs and Somerset Levels and Moors
Environmentally Sensitive Area Landscapes by the General Public, Research Report to MAFF, November 1993.

The Environmental and Socio-Economic Impacts of Climate Change in the Brue Valley
Page 268