
Environmental and Social Impact Assessment Final …...Environmental and Social Impact Assessment...
84
Environmental and Social Impact Assessment Final Report: Appendixes (Part 3) Project Number: 49086-001 June 2018 NEP: Upper Trishuli-1 Hydropower Project Prepared by Environmental Resources Management (ERM) for the Nepal Water & Energy Development Company Pvt. Ltd. And the Asian Development Bank. The environmental and social impact assessment report is a document of the borrower. The views expressed herein do not necessarily represent those of ADB's Board of Directors, Management, or staff, and may be preliminary in nature. In preparing any country program or strategy, financing any project, or by making any designation of or reference to a particular territory or geographic area in this document, the Asian Development Bank does not intend to make any judgments as to the legal or other status of any territory or area.
Transcript of Environmental and Social Impact Assessment Final …...Environmental and Social Impact Assessment...
Environmental and Social Impact Assessment Final Report: Appendixes (Part 3)
Project Number: 49086-001 June 2018
NEP: Upper Trishuli-1 Hydropower Project
Prepared by Environmental Resources Management (ERM) for the Nepal Water & Energy
Development Company Pvt. Ltd. And the Asian Development Bank.
The environmental and social impact assessment report is a document of the borrower. The views expressed herein do not necessarily represent those of ADB's Board of Directors, Management, or staff, and may be preliminary in nature. In preparing any country program or strategy, financing any project, or by making any designation of or reference to a particular territory or geographic area in this document, the Asian Development Bank does not intend to make any judgments as to the legal or other status of any territory or area.

Appendix C
Flora within the Environmental
Area of Influence
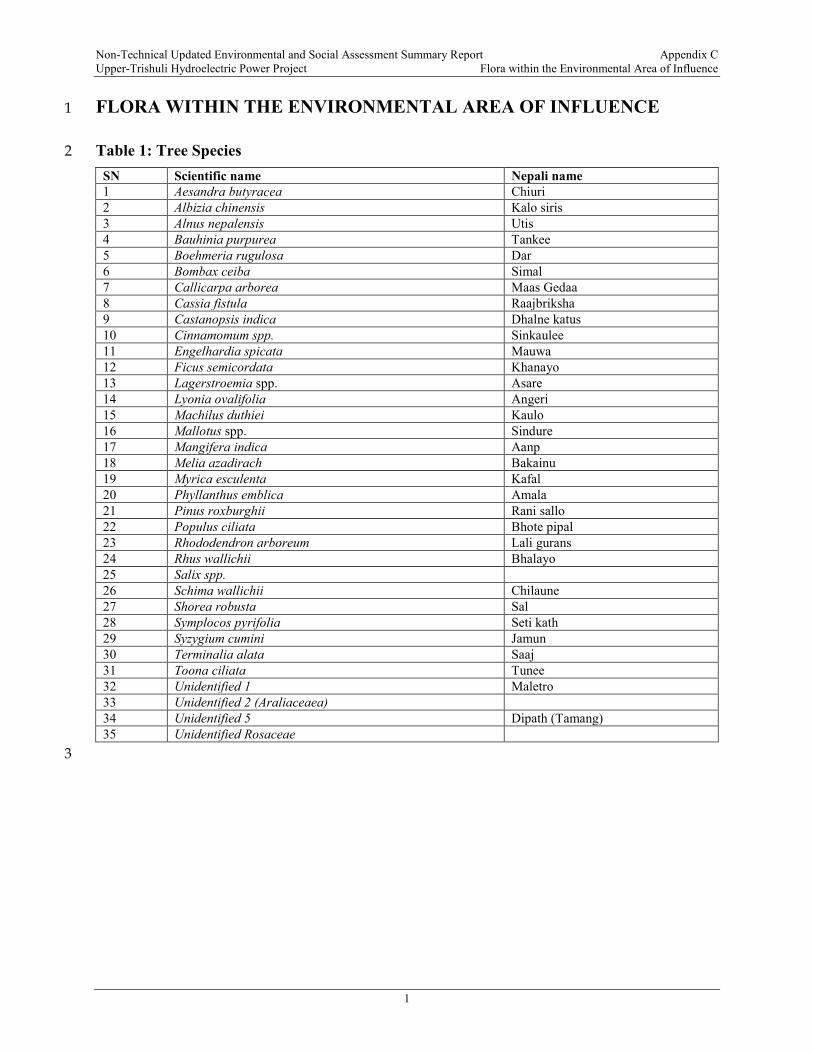
Non-Technical Updated Environmental and Social Assessment Summary Report Appendix C Upper-Trishuli Hydroelectric Power Project Flora within the Environmental Area of Influence
1
FLORA WITHIN THE ENVIRONMENTAL AREA OF INFLUENCE 1
Table 1: Tree Species 2
SN Scientific name Nepali name
1 Aesandra butyracea Chiuri
2 Albizia chinensis Kalo siris
3 Alnus nepalensis Utis
4 Bauhinia purpurea Tankee
5 Boehmeria rugulosa Dar
6 Bombax ceiba Simal
7 Callicarpa arborea Maas Gedaa
8 Cassia fistula Raajbriksha
9 Castanopsis indica Dhalne katus
10 Cinnamomum spp. Sinkaulee
11 Engelhardia spicata Mauwa
12 Ficus semicordata Khanayo
13 Lagerstroemia spp. Asare
14 Lyonia ovalifolia Angeri
15 Machilus duthiei Kaulo
16 Mallotus spp. Sindure
17 Mangifera indica Aanp
18 Melia azadirach Bakainu
19 Myrica esculenta Kafal
20 Phyllanthus emblica Amala
21 Pinus roxburghii Rani sallo
22 Populus ciliata Bhote pipal
23 Rhododendron arboreum Lali gurans
24 Rhus wallichii Bhalayo
25 Salix spp.
26 Schima wallichii Chilaune
27 Shorea robusta Sal
28 Symplocos pyrifolia Seti kath
29 Syzygium cumini Jamun
30 Terminalia alata Saaj
31 Toona ciliata Tunee
32 Unidentified 1 Maletro
33 Unidentified 2 (Araliaceaea)
34 Unidentified 5 Dipath (Tamang)
35 Unidentified Rosaceae
3

Non-Technical Updated Environmental and Social Assessment Summary Report Appendix C Upper-Trishuli Hydroelectric Power Project Flora within the Environmental Area of Influence
2
Table 2: Shrub Species 4
SN Scientific name Nepali name
1 Achyranthes aspera Datiwan
2 Agave americana Ketuki
3 Ageratina adenophora Banmara
4 Berberis asiatica Chutro
5 Boehmeria platyphylla Kamle
6 Chromolaena odorata Aule banmara
7 Clerodondron serratum
8 Colebrookia oppositifolia Dhusure
9 Cotoneaster microphyllus
10 Desmodium tiliaefolium Rato bakre ghans
11 Euphorbia royleana Siundee
12 Gaultheria fragrantissima Dhasingare
13 Hypericum cordifolium Areli
14 Indigofera constricta
15 Indigofera dosua Phusre ghans
16 Inula cappa Gaitihare
17 Lonicera quinquelocularis Bangjhi
18 Maesa chisia Bilauni
19 Mimosa spp.
20 Murraya paniculata
21 Osbeckia stellata Rato chulsi
22 Osyris wightiana Nun Dhicki
23 Oxyspora paniculata
24 Phyllanthus parvifolius Khareto
25 Prinsepia utilis Dhatelo
26 Rhamnus virgatus Kande painyu
27 Rubia manjith Majitho
28 Rubus ellipticus Ainselu
29 Rubus foliolosus Kalo ainselu
30 Sarcococca coriacea Fiti fiya
31 Senna occidentalis Thulo Tapre
32 Senna tora Tapre
33 Solanum aculeatissimum Kantakaari
34 Viburnum erubescens Ganmane
35 Woodfordia fruticosa Dhainyaro
36 Zanthoxylum acanthopodium Boke timmur
37 Unidentified 4 (Urticaceae)
5

Non-Technical Updated Environmental and Social Assessment Summary Report Appendix C Upper-Trishuli Hydroelectric Power Project Flora within the Environmental Area of Influence
3
Table 6.2-5: Herb Species Report from the Environmental Area of Influence 6
SN Scientific name Nepali name
1 Ageratum conyzoides Gandhe
2 Amaranthus spinosus Lunde kanda
3 Arisaema concinnum Sarpa ko makai
4 Arisaema tortuosum Sarpa ko makai
5 Artemisia vulgaris Titepati
6 Arthraxon lancifolius Chitre bans
7 Arundinaria spp.
8 Arundinella nepalensis Phurke Khar
9 Begonia picta Magar kanche
10 Bidens pilosa Tikhe kuro
11 Boenninghausenia albiflora Daampate
12 Brachiaria ramosa Likhe Banso
13 Calanthe puberula
14 Carex cruciata Lamo hat katuwa
15 Cheilanthes spp.
16 Chrysopogon gryllus Dhaple ghans
17 Cissampelos pareira Batul pate
18 Clematis spp.
19 Commelina benghalensis Kane
20 Crassocephalum crepidioides Anikale jhar
21 Curcuma angustifolia Kalo besar
22 Cynodon dactylon Dubo
23 Cynoglossum zeylanicum Kanike kuro
24 Cyperus niveus Seto mothe
25 Delphinium altissimum Bikhadi ghans
26 Dicranopteris linearis
27 Dioscorea bulbifera Gitthe tarul
28 Dioscorea deltoidea Bhyakur tarul
29 Drepanostachyum falcatum Sano nigalo
30 Dryoathyrium spp. Kalo neuro
31 Dryopteris chrysocoma
32 Eulaliopsis binata Babiyo
33 Fragaria nubicola Bhuin ainselu
34 Galium asperuloides
35 Geranium nepalense
36 Girardinia diversifolia Allo sisnu
37 Hedychium ellipticum Rato saro
38 Impatiens amplexicaulis Tiuree
39 Imperata cylindrica Siru
40 Ipoemea spp.
41 Iris decora Padam pushkar
42 Leucostegia immersa
43 Lindelofia longiflora
44 Malaxis muscifera
45 Mentha spp.
46 Murdannia edulis Nigale gava
47 Nephrolepis cordifolia Paniamala
48 Oleandra wallichii
48 Onychium spp.
50 Osbeckia stellate Rato chulsi
51 Persicaria spp.
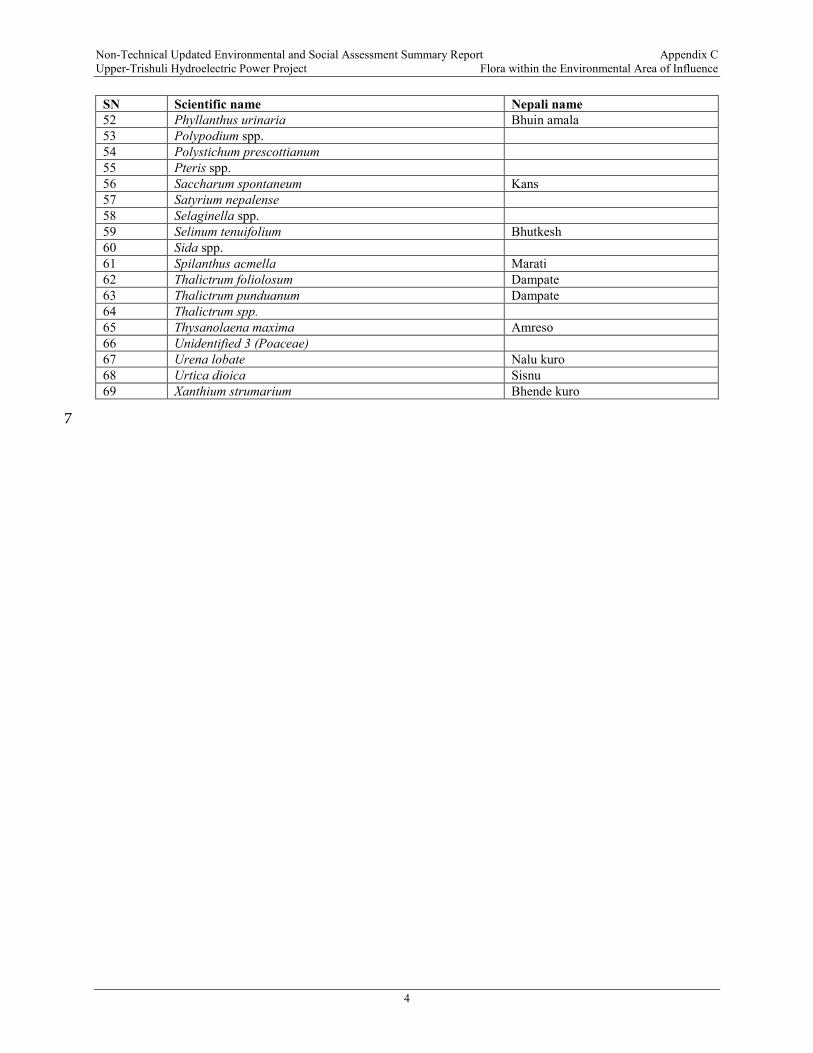
Non-Technical Updated Environmental and Social Assessment Summary Report Appendix C Upper-Trishuli Hydroelectric Power Project Flora within the Environmental Area of Influence
4
SN Scientific name Nepali name
52 Phyllanthus urinaria Bhuin amala
53 Polypodium spp.
54 Polystichum prescottianum
55 Pteris spp.
56 Saccharum spontaneum Kans
57 Satyrium nepalense
58 Selaginella spp.
59 Selinum tenuifolium Bhutkesh
60 Sida spp.
61 Spilanthus acmella Marati
62 Thalictrum foliolosum Dampate
63 Thalictrum punduanum Dampate
64 Thalictrum spp.
65 Thysanolaena maxima Amreso
66 Unidentified 3 (Poaceae)
67 Urena lobate Nalu kuro
68 Urtica dioica Sisnu
69 Xanthium strumarium Bhende kuro
7

Appendix D
Fish Ladder Reports

Appendix D.1
Principles For Design Of Fish
Ladder For UT-1 HPP
1
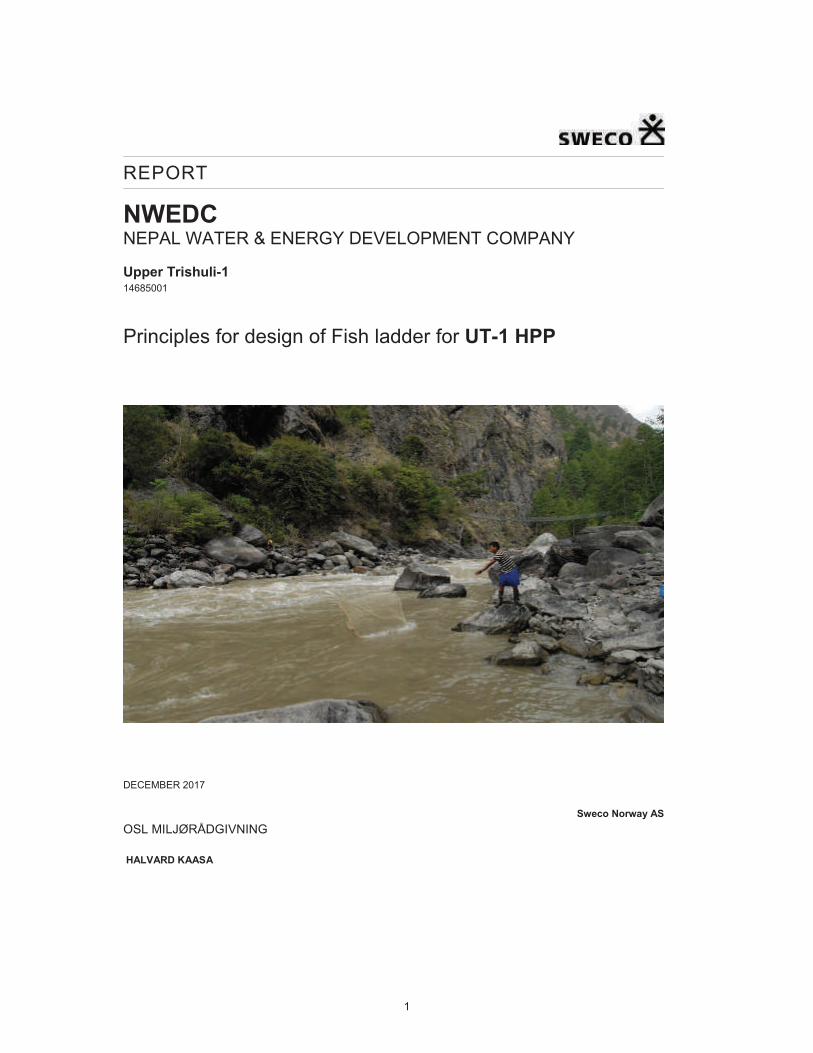
REPORT
NWEDC
NEPAL WATER & ENERGY DEVELOPMENT COMPANY
Upper Trishuli-1 14685001
Principles for design of Fish ladder for UT-1 HPP
DECEMBER 2017
Sweco Norway AS
OSL MILJØRÅDGIVNING
HALVARD KAASA

2(15) REPORT DECEMBER 2017
repo001.d
ocx
2015-1
0-0
5
KH p:\134\14685001 upper trishuli-1\15 ut 1 fish ladder\09 rapport\rapport final fish ladder december 2017.docx
REPORT
Report no.: Project no.: Date:
4 14685001 December 2017
Client:
NWEDC
Principles for design of Fish ladder for
Upper Trisuli-1 HPP
This report describes the principles of the fish ladder at the UT-1 intake site, and as requested by NWEDC the report give comments to other challenges connected to the UT-1 HP development and to the river connectivity.
Created by:
Halvard Kaasa
Sign:
Project responsible / dept.:
Manager approval:
Sweco Norway AS Karel Grootjans

3
Content
1 Introduction 4
2 Conditions for design 4
3 The fish ladder 5
3.1 The entrance pool outside the fish ladder 5
3.2 Fish ladder pool no 1 5
3.3 Fish ladder pool no 2 7
3.4 Fish ladder pool no 3 to 8 8
3.5 Fish ladder pool no 9 9
3.6 Fish ladder pool no 10 and to the top of the ladder 10
4 Upstream migrating challenges not connected to the fish ladder 11
5 Downstream fish migration 11
Attachments
1) Fish Ladder- conceptual design, Sweco, 26.04.2017 2) Illustration of overflow trough flapped gates

4(15) DECEMBER 2017
repo001.d
ocx
2015-1
0-0
5
KH p:\134\14685001 upper trishuli-1\15 ut 1 fish ladder\09 rapport\rapport final fish ladder december 2017.docx
1 Introduction
The 216 MW upper Trishuli-1 Hydropower Project is located in the Rashuwa District of Nepal. It is a run-of-the-river project, and the developer is the Nepal Water & Energy Development Company Private Limited (NWEDC). As a part of the process to ensure compliance of the Upper Trishuli-1 Hydropower Project (UT-1HPP) with Nepal national regulations and the IFC’s Performance Standard 6: Biodiversity Conservation and Sustainable Management of Living Resources, NWEDC are required to build a fish passage across the intake weir. This report give comments and recommendations for technical solutions to keep river connectivity when the UT-1 is in operation.
2 Conditions for design
A) Fish species The overall dominat species in the UT-1 area of Trisuli is Asala (Shizothorax richardsonii). Shizothorax progastus per the EIA with recordings from 2011, and a report from DoFD from 2008/2009, has been detected in the area of UT-1 for 6 and 9 years ago. In the agreement between NWEDC and Sweco Norge AS it is clearly mentioned that the fish ladder design shall be accommodated for the target species Shizothorax richardsonii and also for the Shizothorax progastus if this species is present in the area. The last years S. progastus is not registered during field studies connected to the environmental program of UT-1. Normally S.progastus has its preferred biotopes in lower altitudes (300 -850 m above sea level) and in warmer waters than at UT1. It might therefore be a possible explanation that S.progastus can be observed in the UT-1 area in varying degree depending of ecological conditions as water temperature, flow and population size. Another important measure might be the possibilities of upstream migrating obstacles as the cross-section dam at UT3 just downstream the UT-1 area. This UT3 dam site has been without a fish ladder the last years, but a fish ladder is planned to be built. As discussed with NWEDC the design of the fish ladder for UT-1 will be with focus on Shizothorax richardsonii and, as last years of registrations show, not accommodated for S. progastus.
B) Flow through the fish ladder The decision about e-flows is not finalised, and in this report the fish ladder flow proposal interplay with the NWEDC minimum release proposal that is 10% of mean monthly flow which men approximately 4 m3/s during the spring season. On that basis, the flow in the fish ladder will approximately be 1 m3/s and with additional attraction water to the entrance of the fish ladder of 1 m3/s. This mean that the total flow connected to the fish ladder entrance is approximately 50% of the minimum flow.

5
The rest of the e-flow that will be released from the weir shall flow into the pool at the entrance of the fish ladder. The fish ladder flow might vary over the year cycle, and the ladder might also be closed during the period when there is now upstream fish migration in the UT-1 area.
C) Available space The space along the riverside downstream the dam is per information from NWEDC restricted and there is not available area to prepare a nature liker fish way. Due to the height of the dam and the available space there is need to design a compact fish ladder.
3 The fish ladder
The fish ladder shall mainly serve the upstream migration of the target species Snow Trout (Shizothorax richardsonii). The total height of the fish ladder will be approximately 30 m. The exact height will be decided when the design of the fish ladder entrance pool is settled. To meet the requirements for migration of Snow Trout the total number of pools will be close to 100.
3.1 The entrance pool outside the fish ladder
In principle, the entrance pool just outside the fish ladder shall be attractive for Snow Trout. Substantial flow and spurt of water are qualities needed to attract this species. Approximately 50% of the proposed minimum flow will enter the pool from the fish ladder. Rest of the e-flow passing the weir shall also enter the pool outside the fish ladder. See figure 1. The conditions in the pool outside the fish ladder entrance is crucial for the functionality of the fish ladder.
A. The conditions in the river up to the outlet from the fish ladder must be adapted to the behaviour of the migrating fish species during the whole upstream fish migrating season.
B. The fish ladder entrance pool shall be situated close to the upper part of the fish migrating section.
C. Water velocity in the pool where water passing outside of the entrance of pool no 1, shall be no more than 0,3m - 0,6 m/s during the upstream migrating period.
D. The pool shall be equipped with some hiding-places for fish E. The spillway design shall meet the requirements mentioned in Sweco report of
15.08.2016, Fish Passage, Evaluation of plans and recommendations, chapter 2.4, and of point B and C
F. The depth outside the entrance of the fish ladder shall be at least 2m. G. If needed this pool shall be sheltered from high flows and high current velocities
originated from the spillway and from the radial gates. This to prevent damage on the fish ladder entrance and to avoid bad conditions for fish.
3.2 Fish ladder pool no 1
The pool no 1 is 5m x 4,3 m and the inside height is 2,5 m (see Figure no 1 and the enclosed drawings in attachment 1). The outlet from the chamber has two vertical slots with the ability to let trough 1,5 m3/s with highest water velocity of 1m/s and that the step between water level in the outside pool and in the chamber no 1 is between 0,20 – 0,25 m dependent of the flow variations. The width of the openings is 0,6 m (Figure 2).

6(15) DECEMBER 2017
repo001.d
ocx
2015-1
0-0
5
KH p:\134\14685001 upper trishuli-1\15 ut 1 fish ladder\09 rapport\rapport final fish ladder december 2017.docx
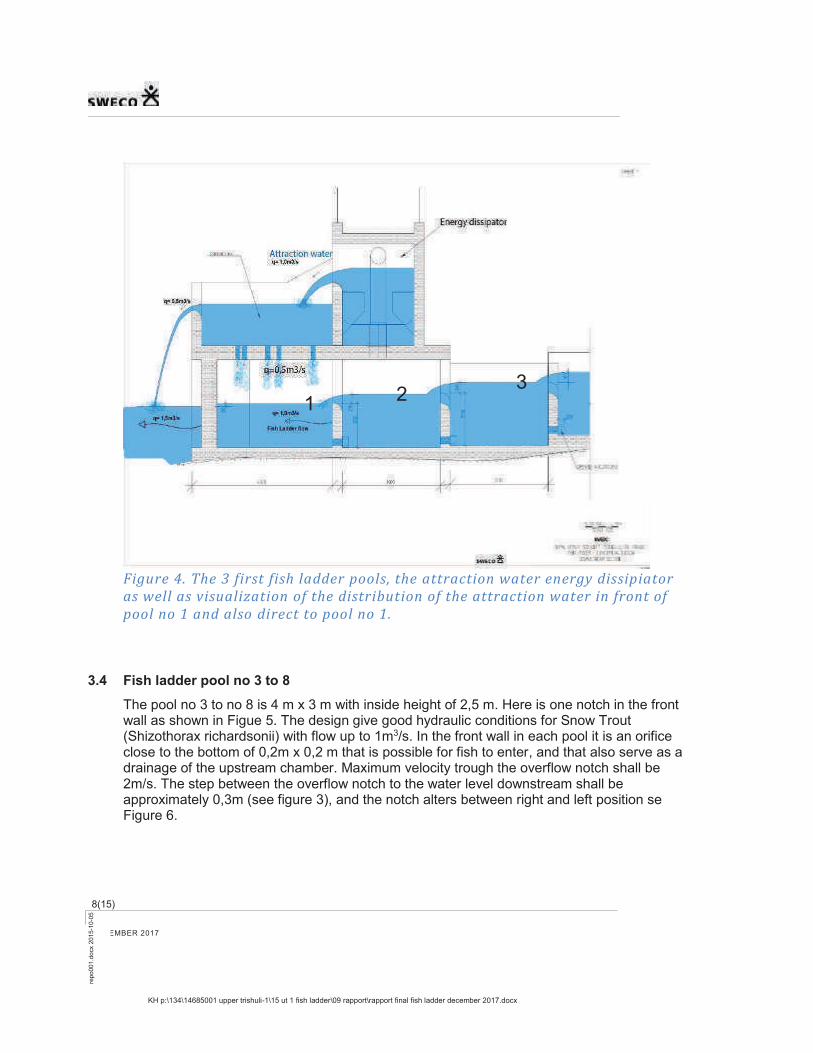
At the bottom of the chamber there shall be constructed hiding places for Shizothoracx richardsonii. Where they can hide during daytime. This hiding places must be constructed to make it possible to clean for sediments if needed. Attraction water shall be added at the top of the concrete roof that is covering chamber 1 and 2. (see Figure 4). Water shall fall from the 5 m wide front of the distributor bay and hit the water surface just outside the vertical slot entrance. Attraction water shall also enter Pool no 1 trough pipes in the concrete roof. The total amount of attraction water added shall be approximately the same flow as in the fish ladder. See figure 1 and attached drawing of the fish ladder entrance (Attachment 1).
. Fig. 1 The principal of the fish ladder entrance.
Attraction spurt

7
Figure 2. Transekt med vertical slots
3.3 Fish ladder pool no 2
The pool no 2 is 5m x 3 m and the inside height is 2,5 m. Here are two notches in the front wall to slow down the water velocity, see figure 3. The water velocity shall be below 1,5m/s and the step between chamber 1 and chamber 2 shall be between 0,23 – 0,27 m dependent of the flow variations. There is an orifice at the right side and close to the bottom of 0,2m x 0,2 m that is possible for fish to enter and also serve as a drainage of the upstream chamber.
Fig. 3 Outlet from pool no 2 have 2 overflow notches.
Drainage of energy dissipiator
8(15) DECEMBER 2017
repo001.d
ocx
2015-1
0-0
5
KH p:\134\14685001 upper trishuli-1\15 ut 1 fish ladder\09 rapport\rapport final fish ladder december 2017.docx
Figure 4. The 3 first fish ladder pools, the attraction water energy dissipiator
as well as visualization of the distribution of the attraction water in front of
pool no 1 and also direct to pool no 1.
3.4 Fish ladder pool no 3 to 8
The pool no 3 to no 8 is 4 m x 3 m with inside height of 2,5 m. Here is one notch in the front wall as shown in Figue 5. The design give good hydraulic conditions for Snow Trout (Shizothorax richardsonii) with flow up to 1m3/s. In the front wall in each pool it is an orifice close to the bottom of 0,2m x 0,2 m that is possible for fish to enter, and that also serve as a drainage of the upstream chamber. Maximum velocity trough the overflow notch shall be 2m/s. The step between the overflow notch to the water level downstream shall be approximately 0,3m (see figure 3), and the notch alters between right and left position se Figure 6.
1 2 3

9
Figure 5 The outlet from fish ladder pool no 3 to no 8 has a notch designed to
give good hydraulic conditions with flow up to 1m 3/s. This notch is alternating
right and left as moving upstream.
3.5 Fish ladder pool no 9
The fish ladder pool no 9 is a resting pool of 5 x 4m and inside height 2,5 m see Figure 1. The inlet and outlet notches of this chamber is as in chamber nr 3 to 8. See figure 5 and 7. At the bottom of the chamber there shall be constructed hiding places for Shizothoracx richardsonii. This hiding places must be constructed so as it is possible to clean the pool for sediments. This type of resting pools shall be repeated upstream in the fish ladder with 6 normal pools in-between.
Figure 6 Principal of altering notches in a fish ladder

10(15) DECEMBER 2017
repo001.d
ocx
2015-1
0-0
5
KH p:\134\14685001 upper trishuli-1\15 ut 1 fish ladder\09 rapport\rapport final fish ladder december 2017.docx
3.6 Fish ladder pool no 10 and to the top of the ladder
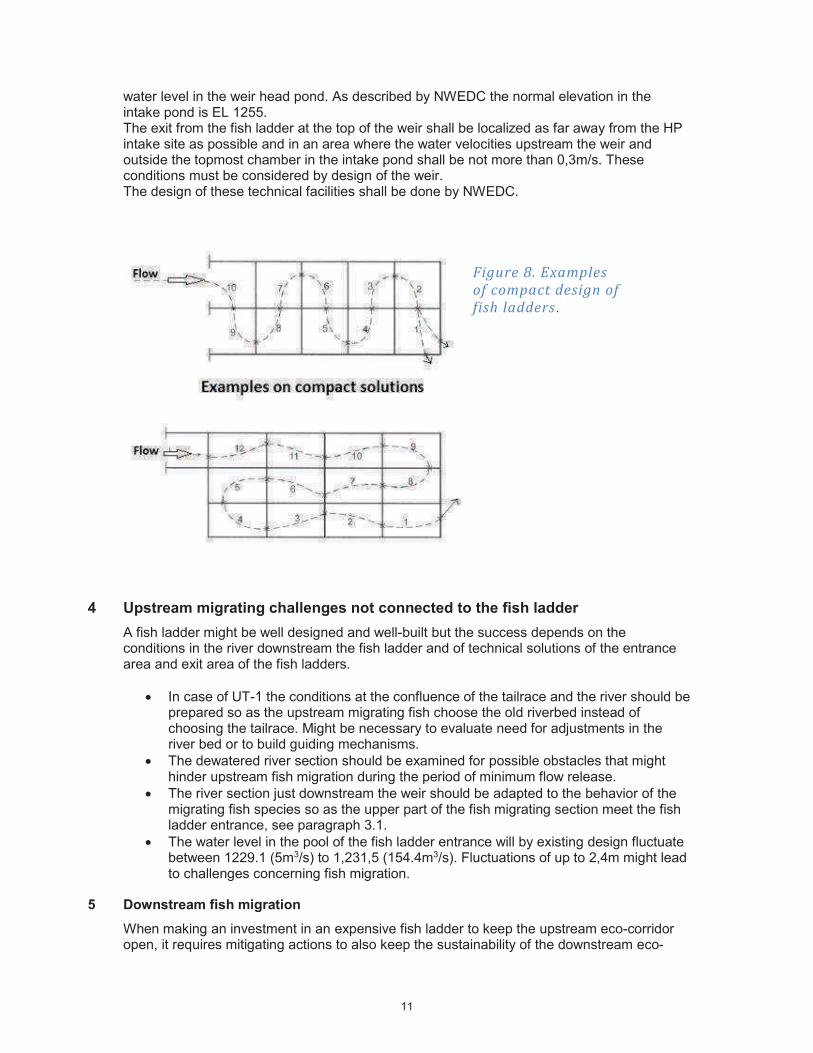
After pool no 9 every seventh pool shall be a resting pool, the other pools shall be of same size and principle as chamber 3 with alternating notches. The pools might be built in other combinations than straight after each other. For instance, different compact solutions, see examples Fig. 8. This way of preparing the design must be decided by NWEDC as a function of the available space at Haku site. At the top of the fish ladder where the ladder enters the weir there shall be a technical solution that may adjust the flow into the ladder according to the water level in the intake pond. The top fish ladder pool shall be 4m x 3m as pool no 3, and the flow from the inlet weir head pond approximately 1 m3/s with relative slow velocities with maximum 0,7m/s from the weir head pond to the top fish ladder pool. This make it easy for migrating fish to enter the weir head pond. The inlet from the head pond to the fish ladder must be equipped with a gate to control and finetune the flow in the fish ladder. It must also be possible to turn of the fish ladder flow and if necessary to include an automatic adjustment of the fish ladder flow as a function of the
Figure 7 Resting camber or
resting pool is bigger than
the normal fish ladder pools
and is equipped with hiding
structures at the bottom
level in the calm part of the
pool.
11
water level in the weir head pond. As described by NWEDC the normal elevation in the intake pond is EL 1255. The exit from the fish ladder at the top of the weir shall be localized as far away from the HP intake site as possible and in an area where the water velocities upstream the weir and outside the topmost chamber in the intake pond shall be not more than 0,3m/s. These conditions must be considered by design of the weir. The design of these technical facilities shall be done by NWEDC.
4 Upstream migrating challenges not connected to the fish ladder
A fish ladder might be well designed and well-built but the success depends on the conditions in the river downstream the fish ladder and of technical solutions of the entrance area and exit area of the fish ladders.
· In case of UT-1 the conditions at the confluence of the tailrace and the river should be prepared so as the upstream migrating fish choose the old riverbed instead of choosing the tailrace. Might be necessary to evaluate need for adjustments in the river bed or to build guiding mechanisms.
· The dewatered river section should be examined for possible obstacles that might hinder upstream fish migration during the period of minimum flow release.
· The river section just downstream the weir should be adapted to the behavior of the migrating fish species so as the upper part of the fish migrating section meet the fish ladder entrance, see paragraph 3.1.
· The water level in the pool of the fish ladder entrance will by existing design fluctuate between 1229.1 (5m3/s) to 1,231,5 (154.4m3/s). Fluctuations of up to 2,4m might lead to challenges concerning fish migration.
5 Downstream fish migration
When making an investment in an expensive fish ladder to keep the upstream eco-corridor open, it requires mitigating actions to also keep the sustainability of the downstream eco-
Figure 8. Examples
of compact design of
fish ladders .

12(15) DECEMBER 2017
repo001.d
ocx
2015-1
0-0
5
KH p:\134\14685001 upper trishuli-1\15 ut 1 fish ladder\09 rapport\rapport final fish ladder december 2017.docx
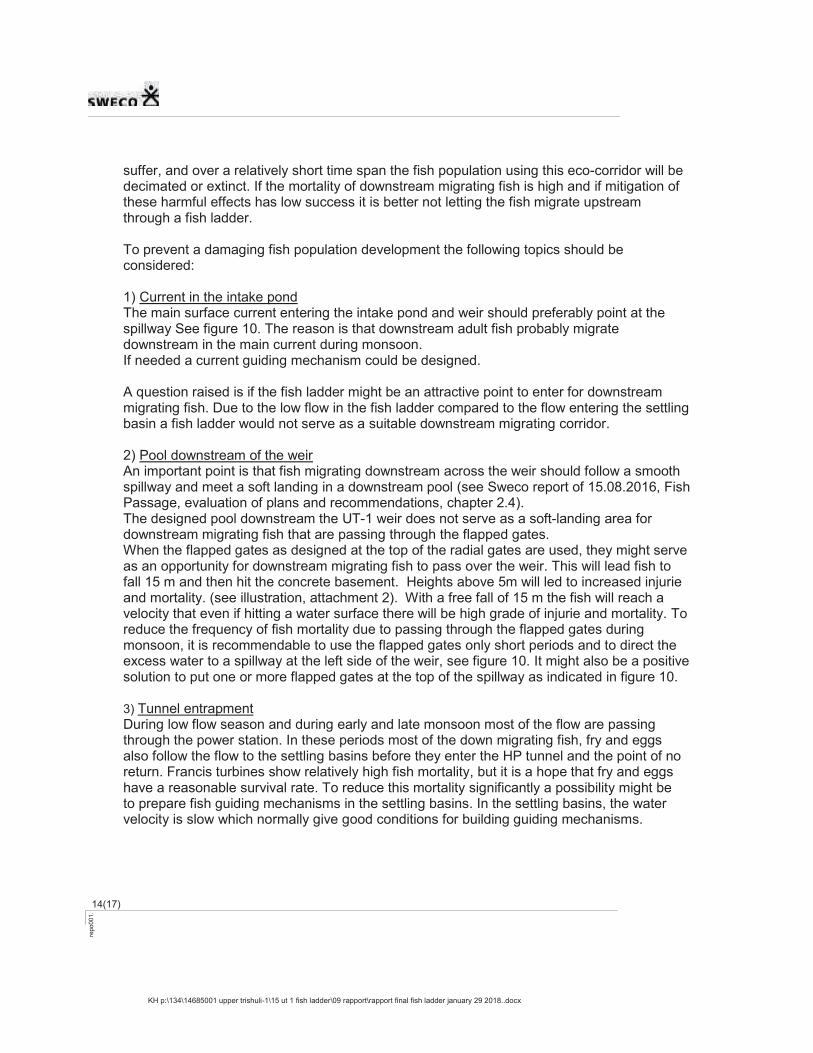
corridor. If the mortality of downstream migrating fish is high, the eco-system services will suffer, and over a relatively short time span the fish population using this eco-corridor will be decimated or extinct. If the mortality of downstream migrating fish is high and if mitigation of these harmful effects has low success it is better not letting the fish migrate upstream through a fish ladder. To prevent a damaging fish population development the following topics should be considered: 1) Current in the intake pond The main surface current entering the intake pond and weir shall point at the overflow gates and the spillway See figure 9. The reason is that downstream adult fish probably migrate downstream in the main current during monsoon. It is during high flow when debris enter the weir that also fish are migrating downstream. As reported by NWEDC this Flapped gates might be in frequent use during monsoon. If needed a current guiding mechanism should be designed. Normally a concrete structure will be perfect. The fish ladder with low flow compared to the flow entering the settling basin is not suitable as a downstream migrating corridor. 2) Pool downstream of the weir An important point is that fish migrating downstream across the weir should follow a smooth spillway and meet a soft landing in a downstream pool (see Sweco report of 15.08.2016, Fish Passage, evaluation of plans and recommendations, chapter 2.4). The designed pool downstream the UT-1 weir does not serve as a soft-landing area for downstream migrating fish that are passing through the flapped gates. This is due to two reasons: 1)The flapped gates designed at the top of the radial gates will lead fish to fall 15 m and then hit the concrete basement. Heights above 5m will led to increased injurie and mortality. It might also be a risk for the fish to hit the steel construction of the radial- and flapped gates. (see illustration, attachment 2) 2) With a free fall of 15 m the fish will reach a velocity that even if hitting a water surface there will be high grade of injurie and mortality. As reported by NWEDC the flapped gates might be in frequent use during monsoon, and the present weir design (DAELIM&KYERYONG, C. 16.11, Detail design) will probably lead to high fish mortality when fish are passing downstream through the flapped gates. 3) Tunnel entrapment During low flow season and during early and late monsoon most of the flow are passing through the power station. This means that most of the down migrating fish, fry and eggs also follow the flow to the settling basins before they enter the HP tunnel and the point of no return. Francis turbines show relatively high fish mortality, but it is a hope that fry and eggs have a reasonable survival rate. To reduce this mortality significantly is possible to prepare fish guiding mechanisms in the settling basins. In the settling basins, the water velocity is slow which normally give good conditions for building guiding mechanisms.

13
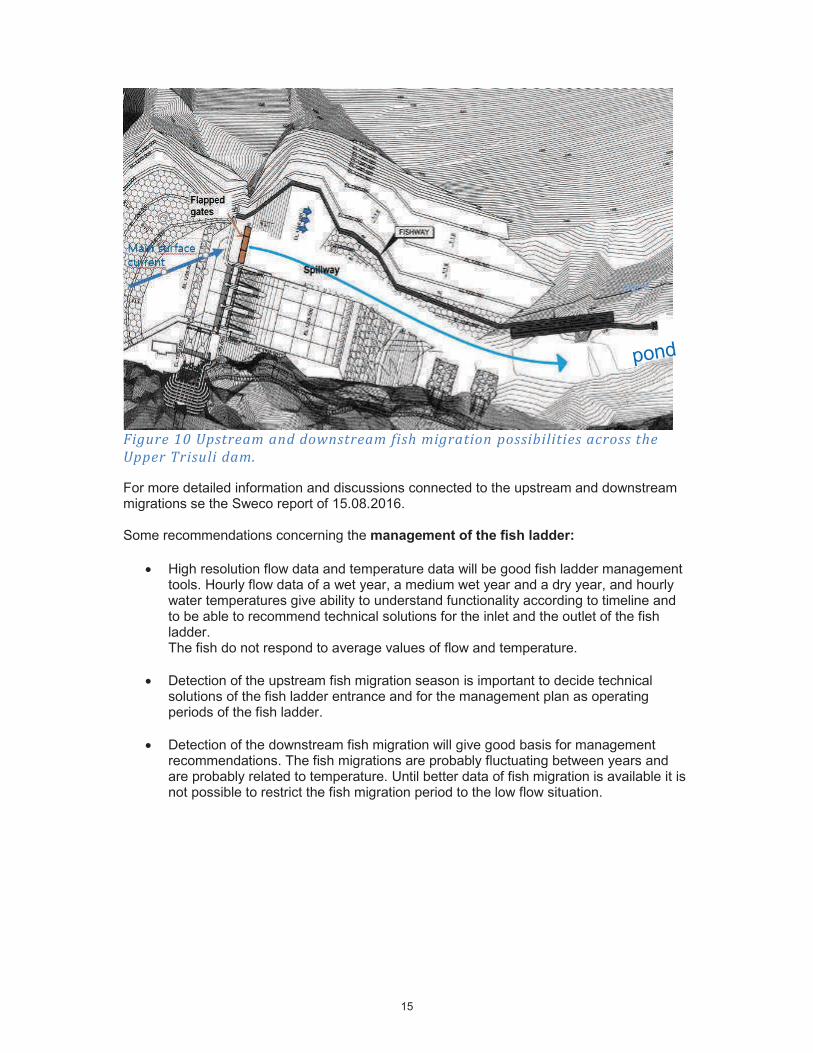
Figure 9 Upstream and downstream fish migration possibilities across the
Upper Trisuli dam. For more detailed information and discussions connected to the upstream and downstream migrations se the Sweco report of 15.08.2017. See also the emails of 19th of April and 3rd of May from Halvard Kaasa to NWEDC. To be able to give good recommendations concerning the management of the fish ladder it is still some data missing:
· High resolution flow data and temperature data as: hourly flow data of a wet year, a medium wet year and a dry year, and hourly water temperatures. This is to understand functionality according to timeline and to be able to recommend technical solutions for the inlet and the outlet of the fish ladder. The fish do not respond to average values of flow and temperature.
· Detection of the upstream fish migration season. Important for technical solutions of
the fish ladder entrance and for the management plan.
· Detection of the downstream fish migration data. This will give good basis for management recommendations. The fish migrations are probably fluctuating between years and are probably related to temperature. Until better data of fish migration is available it is not possible to restrict the fish migration period to the low flow situation.

14(15) DECEMBER 2017
repo001.d
ocx
2015-1
0-0
5
KH p:\134\14685001 upper trishuli-1\15 ut 1 fish ladder\09 rapport\rapport final fish ladder december 2017.docx
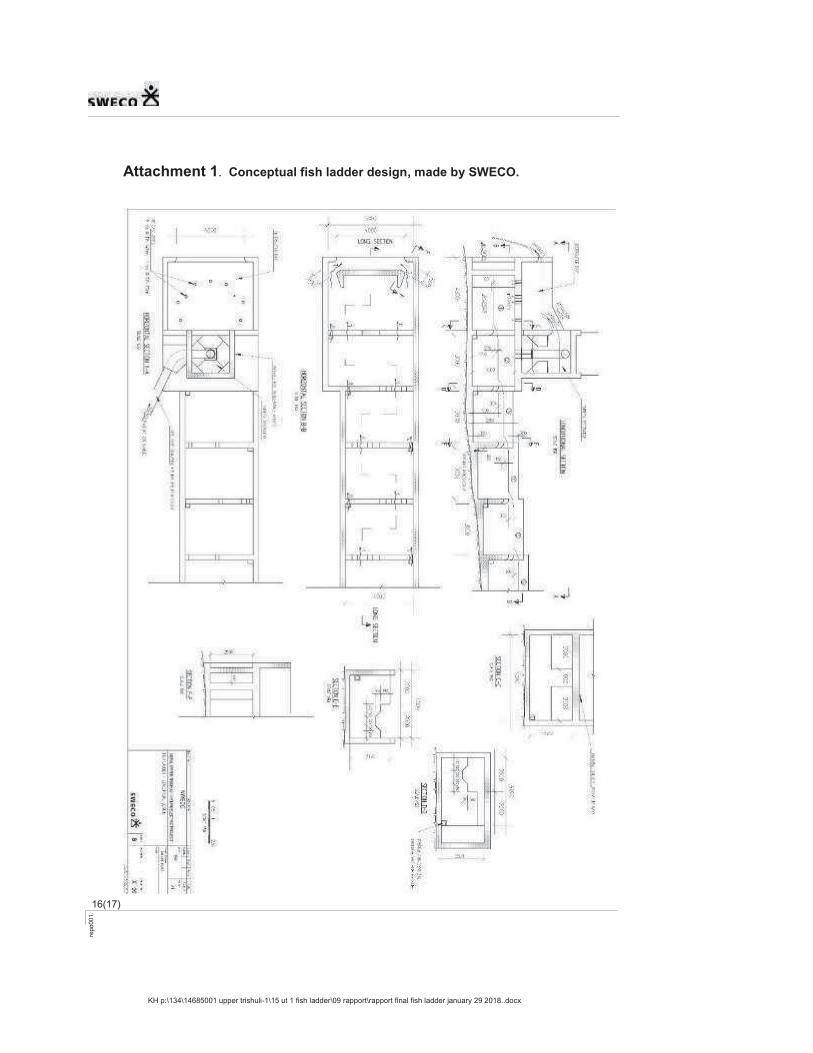
Attachment 1. Conceptual fish ladder design

15
Attachment 2. Illustration of overflow trough flapped gates at the top of the radial gates.

Appendix D.2
Design Advice On Fish Ladder
And Associated Spillway Designs
at the Upper Trishuli-1
Hydropower Project

1
REPORT
NWEDCNEPAL WATER & ENERGY DEVELOPMENT COMPANY
Upper Trishuli-114685001
Design Advice on Fish Ladder and Associated Spillway Designs at the Upper Trisuli-1 Hydropower Project
JANUARY 2018
Sweco Norway AS
DEPARTMENT OF ENVIRONMENT
HALVARD KAASA

2(17)
18
repo001.
KH p:\134\14685001 upper trishuli-1\15 ut 1 fish ladder\09 rapport\rapport final fish ladder january 29 2018..docx
REPORT
Report no.: Project no.: Date:
4 14685001 January 2018
Client:
NWEDC
Design Advice on Fish Ladder and Associated Spillway Designs at the
Upper Trisuli-1 Hydropower Project
This report describes the design advice on fish ladder and associated spillway at the UT-1 intake site,and as requested by NWEDC the report give comments to other challenges connected to the UT-1 HP development and to the river connectivity.
NWEDC comments 19th of January 2018 Report revised 29th of January 2018
Created by:
Halvard Kaasa
Sign:
Project responsible / dept.: Manager approval:
Sweco Norway AS Karel Grootjans

3
Content
1 Introduction 4
2 Conditions for design 4
3 The fish ladder principles 5
3.1 The entrance pool outside the fish ladder 5
3.2 Fish ladder pool no 1 6
3.3 Fish ladder pool no 2 7
3.4 Fish ladder pool no 3 to 8 8
3.5 Fish ladder pool no 9 9
3.6 Fish ladder pool no 10 and to the top of the ladder 10
4 Evaluation of the fish ladder design prepared by NWEDC’s Design engineers (DKJV).11
5 Upstream migrating challenges not connected to the fish ladder 13
6 Downstream fish migration 13
Attachments1) Fish Ladder- conceptual design, Sweco, 26.04.20172) Illustration of overflow trough flapped gates

4(17)
18
repo001.
KH p:\134\14685001 upper trishuli-1\15 ut 1 fish ladder\09 rapport\rapport final fish ladder january 29 2018..docx
1 Introduction
The 216 MW upper Trishuli-1 Hydropower Project is located in the Rashuwa District of Nepal. It is a run-of-the-river project, and the developer is the Nepal Water & Energy Development Company Private Limited (NWEDC).
As a part of the process to ensure compliance of the Upper Trishuli-1 Hydropower Project (UT-1HPP) with Nepal national regulations and the IFC’s Performance Standard 6: Biodiversity Conservation andSustainable Management of Living Resources, NWEDC are required to build a fish passage across the intake weir.This report gives comments and recommendations for technical solutions to keep river connectivity when the UT-1 is in operation.
2 Conditions for design
A) Fish speciesThe overall dominat species in the UT-1 area of Trisuli is Asala (Shizothoraxrichardsonii). Shizothorax progastus per the EIA with recordings from 2011, and areport from DoFD from 2008/2009, has been detected in the area of UT-1 for 6 and 9years ago.In the agreement between NWEDC and Sweco Norge AS it is clearly mentioned thatthe fish ladder design shall be accommodated for the target species Shizothoraxrichardsonii and also for the Shizothorax progastus if this species is present in thearea.The last years S. progastus is not registered during field studies connected to theenvironmental program of UT-1.Normally S.progastus has its preferred biotopes in lower altitudes (300 -850 m above sealevel) and in warmer waters than at UT1. It might therefore be a possible explanation thatS.progastus can be observed in the UT-1 area in varying degree depending of ecologicalconditions as water temperature, flow and population size. Another important measure mightbe the possibilities of upstream migrating obstacles as the cross-section dam at UT3A justdownstream the UT-1 area. This UT3A dam site has been without a fish ladder the last years,but a fish ladder is planned to be built. Information given by NWEDC indicate that there isanother HP planed just upstream of UT-1 Called UT-2 HEP that shall be developed with across section dam and a fish ladder.

5
As discussed with NWEDC the design of the fish ladder for UT-1 will be with focus onShizothorax richardsonii and, as last years of registrations show, not accommodated for S. progastus.
Flow through the fish ladderIn this report, the fish ladder flow proposal interplay with the NWEDC minimumrelease proposal that is 10% of mean monthly flow which mean a little bit less than 4m3/s during the spring season (UT-1 Detail Design Report 2017). On that basis, theflow in the fish ladder will approximately be 1 m3/s and with additional attraction waterto the entrance of the fish ladder of 1 m3/s. This mean that the total flow connected tothe fish ladder entrance is approximately 50% of the minimum flow. The rest of the e-flow that will be released from the head pond, shall flow into the pool at the entranceof the fish ladder. From an ecological point of view the fish ladder do not need to beoperated during the period when there is now upstream fish migration in the UT-1area.
Available spaceThe space along the riverside downstream the dam is per information from NWEDCrestricted and there is not available area to prepare a nature liker fish way. Due to theheight of the dam and the available space there is need to design a compact fishladder.
3 The fish ladder principles
The fish ladder shall mainly serve the upstream migration of the target species Snow Trout (Shizothorax richardsonii). The total height of the fish ladder will be approximately 30 m. The exact height will be decided when the design of the fish ladder entrance pool is settled. To meet the requirements for migration of Snow Trout the total number of pools will be close to 100.
3.1 The entrance pool outside the fish ladder
In principle, the entrance pool just outside the fish ladder shall be attractive for Snow Trout. Substantial flow and spurt of water are qualities needed to attract this species. Approximately 50% of the proposed minimum flow will enter the pool from the fish ladder. Rest of the e-flow passing from the head pond shall also enter the pool outside the fish ladder. See figure 1.
The conditions in the pool outside the fish ladder entrance is crucial for the functionality of the fish ladder.
A. The conditions in the river up to the outlet from the fish ladder must be adapted to thebehaviour of the migrating fish species during the whole upstream fish migratingseason.
B. The fish ladder entrance pool shall be situated close to the upper part of the fishmigrating section.
C. Water velocity in the pool where water passing outside of the entrance of pool no 1,shall be no more than 0,3m - 0,6 m/s during the upstream migrating period.
D. The pool shall be equipped with some hiding-places for fishE. The depth outside the entrance of the fish ladder shall be at least 2m.F. If needed this pool shall be sheltered from high flows and high current velocities
originated from the spillway and from the radial gates. This to prevent damage on thefish ladder entrance and to avoid bad conditions for fish.

6(17) 18
repo001.
KH p:\134\14685001 upper trishuli-1\15 ut 1 fish ladder\09 rapport\rapport final fish ladder january 29 2018..docx
3.2 Fish ladder pool no 1
The pool no 1 is 5m x 4,3 m and the inside height is 2,5 m (see Figure no 1 and the enclosed drawings in attachment 1). The outlet from the chamber has two vertical slots with the ability to let trough 1,5 m3/s with highest water velocity of 1m/s and that the step between water level in the outside pool and in the chamber no 1 is between 0,20 – 0,25 m dependent of the flow variations. The width of the openings is 0,6 m (Figure 2). At the bottom of the chamber there shall be constructed hiding places for Shizothoracx richardsonii, where they can hide during daytime. These hiding places should be possible to cleane for sediments if needed. Attraction water shall be added at the top of the concrete roof that is covering chamber 1 and 2. (see Figure 4). Water shall fall from the 5 m wide front of the distributor bay and hit the water surface just outside the vertical slot entrance. Attraction water shall also enter Pool no 1 trough pipes in the concrete roof. The total amount of attraction water added shall be approximately the same flow as in the fish ladder. See figure 1 and attached drawing of the fish ladder entrance (Attachment 1).
.
Fig. 1 The principal of the fish ladder entrance.
Attraction spurt

7
Figure 2. Transekt including vertical slots
3.3 Fish ladder pool no 2
The pool no 2 is 5m x 3 m and the inside height is 2,5 m. Here are two notches in the front wall to slow down the water velocity, see figure 3. The water velocity shall be below 1,5m/s and the step between chamber 1 and chamber 2 shall be between 0,23 – 0,27 m dependent of the flow variations. There is an orifice at the right side and close to the bottom of 0,2m x 0,2 m that is possible for fish to enter and also serve as a drainage of the upstream chamber.
Fig. 3 Outlet from pool no 2 have 2 overflow notches.
Drainage of energy dissipiator

8(17) 18
repo001.
KH p:\134\14685001 upper trishuli-1\15 ut 1 fish ladder\09 rapport\rapport final fish ladder january 29 2018..docx
Figure 4. The 3 first fish ladder pools, the attraction water energy dissipiator
as well as visualization of the distribution of the attraction water in front of
pool no 1 and also direct to pool no 1.
3.4 Fish ladder pool no 3 to 8
The pool no 3 to no 8 is 4 m x 3 m with inside height of 2,5 m. Here is one notch in the front wall as shown in Figue 5. The design gives good hydraulic conditions for Snow Trout (Shizothorax richardsonii) with flow up to 1m3/s. In the front wall in each pool it is an orifice close to the bottom of 0,2m x 0,2 m that is possible for fish to enter, and that also serve as a drainage of the upstream chamber. Maximum velocity trough the overflow notch shall be 2m/s. The step between the overflow notch to the water level downstream shall be approximately 0,3m (see figure 3), and the notch alters between right and left position se Figure 6.
1 2 3

9
Figure 5 The outlet from fish ladder pool no 3 to no 8 has a notch designed to
give good hydraulic conditions with flow up to 1m 3/s. This notch is alternating
right and left as moving upstream.
3.5 Fish ladder pool no 9
The fish ladder pool no 9 is a resting pool of 5 x 4m and inside height 2,5 m see Figure 1. The inlet and outlet notches of this chamber is as in chamber nr 3 to 8. See figure 5 and 7. At the bottom of the chamber there shall be constructed hiding places for Shizothoracx richardsonii. This hiding places must be constructed so as it is possible to clean the pool for sediments. This type of resting pools shall be repeated upstream in the fish ladder with 6 normal pools in-between.
Figure 6 Principal of altering notches in a fish ladder

10(17) 18
repo001.
KH p:\134\14685001 upper trishuli-1\15 ut 1 fish ladder\09 rapport\rapport final fish ladder january 29 2018..docx
3.6 Fish ladder pool no 10 and to the top of the ladder
After pool no 9 every seventh pool shall be a resting pool, the other pools shall be of same size and principle as chamber 3 with alternating notches. The pools might be built in other combinations than straight after each other. For instance, different compact solutions, see examples Fig. 8. This way of preparing the design must be decided by NWEDC as a function of the available space at Haku site. At the top of the fish ladder where the ladder enters the weir there shall be a technical solution that may adjust the flow into the ladder according to the water level in the intake pond. The top fish ladder pool shall be 4m x 3m as pool no 3, and the flow from the inlet weir head pond approximately 1 m3/s with relative slow velocities with maximum 0,7m/s from the weir head pond to the top fish ladder pool. This make it easy for migrating fish to enter the weir head pond. The inlet from the head pond to the fish ladder must be equipped with a gate to control and finetune the flow in the fish ladder. It must also be possible to turn of the fish ladder flow and if necessary to include an automatic adjustment of the fish ladder flow as a function of the
Figure 7 Resting camber or
resting pool is bigger than
the normal fish ladder pools
and is equipped with hiding
structures at the bottom
level in the calm part of the
pool.
11
water level in the weir head pond. As described by NWEDC the normal elevation in the intake pond is EL 1255. The exit from the fish ladder at the top of the weir shall be localized as far away from the HP intake site as possible and in an area where the water velocities upstream the weir and outside the topmost chamber in the intake pond shall be not more than 0,3m/s. These conditions must be considered by design of the weir. The design of these technical facilities shall be done by NWEDC.
4 Evaluation of the fish ladder design prepared by NWEDC’s Design engineers (DKJV).
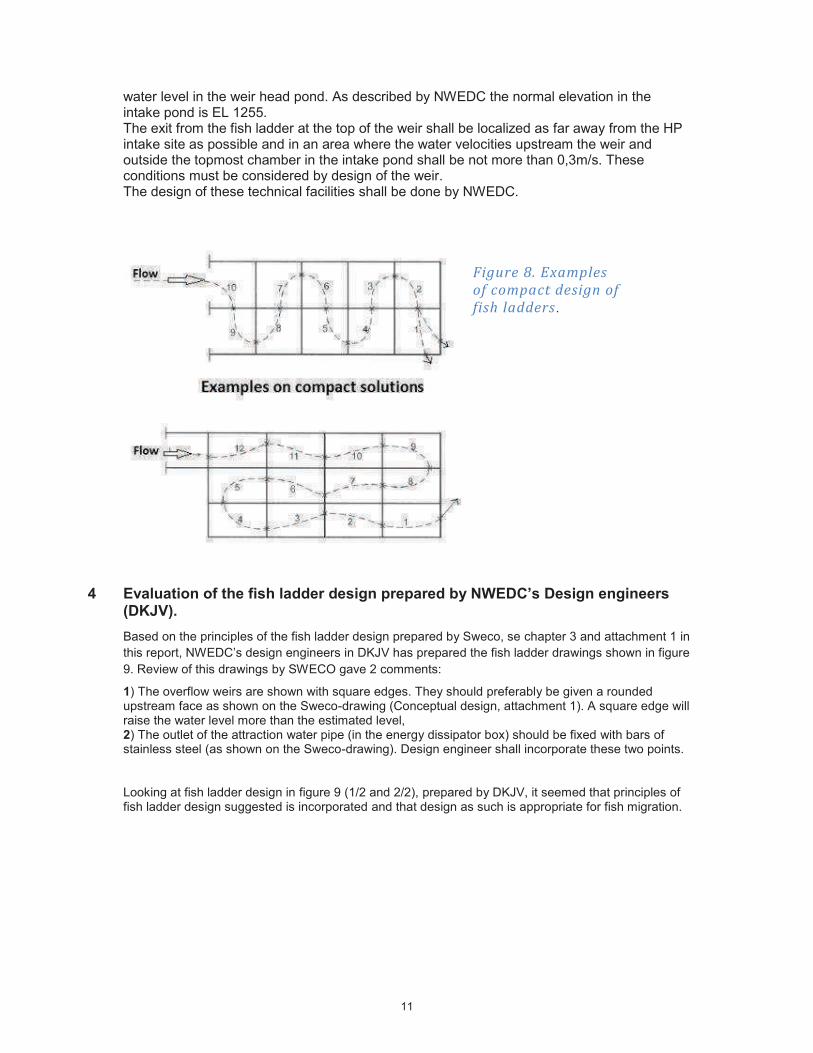
Based on the principles of the fish ladder design prepared by Sweco, se chapter 3 and attachment 1 in this report, NWEDC’s design engineers in DKJV has prepared the fish ladder drawings shown in figure 9. Review of this drawings by SWECO gave 2 comments:
1) The overflow weirs are shown with square edges. They should preferably be given a rounded upstream face as shown on the Sweco-drawing (Conceptual design, attachment 1). A square edge will raise the water level more than the estimated level, 2) The outlet of the attraction water pipe (in the energy dissipator box) should be fixed with bars of stainless steel (as shown on the Sweco-drawing). Design engineer shall incorporate these two points. Looking at fish ladder design in figure 9 (1/2 and 2/2), prepared by DKJV, it seemed that principles of fish ladder design suggested is incorporated and that design as such is appropriate for fish migration.
Figure 8. Examples
of compact design of
fish ladders .

12(17) 18
repo001.
KH p:\134\14685001 upper trishuli-1\15 ut 1 fish ladder\09 rapport\rapport final fish ladder january 29 2018..docx

13
Figure 9, consisting of two parts 1/2 and 2/2. Plan Profile and Typical Section
of Fish Ladder prepared by NWEDC's Design Engineer (DKJV)
5 Upstream migrating challenges not connected to the fish ladder
A fish ladder might be well designed and well-built but the success depends on the conditions in the river downstream the fish ladder and of technical solutions of the entrance area and exit area of the fish ladders.
· The conditions at the confluence of the tailrace and the river should be paid attention so as the upstream migrating fish easily find the old riverbed.
· The dewatered river section should be examined for possible obstacles that might hinder upstream fish migration during the period of minimum flow release.
· The river section just downstream the weir should be adapted to the behavior of the migrating fish species so as the upper part of the fish migrating section meet the fish ladder entrance, see paragraph 3.1.
· The water level in the pool of the fish ladder entrance will by existing design fluctuate between 1229.1 (5m3/s) to 1,231,5 (154.4m3/s). Fluctuations of up to 2,4m might lead to challenges concerning fish migration.
6 Downstream fish migration
When making an investment in an expensive fish ladder to keep the upstream eco-corridor open, it requires mitigating actions to also keep the sustainability of the downstream eco- corridor. If the mortality of downstream migrating fish is high, the eco-system services will
14(17) 18
repo001.
KH p:\134\14685001 upper trishuli-1\15 ut 1 fish ladder\09 rapport\rapport final fish ladder january 29 2018..docx
suffer, and over a relatively short time span the fish population using this eco-corridor will be decimated or extinct. If the mortality of downstream migrating fish is high and if mitigation of these harmful effects has low success it is better not letting the fish migrate upstream through a fish ladder. To prevent a damaging fish population development the following topics should be considered: 1) Current in the intake pond The main surface current entering the intake pond and weir should preferably point at the spillway See figure 10. The reason is that downstream adult fish probably migrate downstream in the main current during monsoon. If needed a current guiding mechanism could be designed. A question raised is if the fish ladder might be an attractive point to enter for downstream migrating fish. Due to the low flow in the fish ladder compared to the flow entering the settling basin a fish ladder would not serve as a suitable downstream migrating corridor. 2) Pool downstream of the weir An important point is that fish migrating downstream across the weir should follow a smooth spillway and meet a soft landing in a downstream pool (see Sweco report of 15.08.2016, Fish Passage, evaluation of plans and recommendations, chapter 2.4). The designed pool downstream the UT-1 weir does not serve as a soft-landing area for downstream migrating fish that are passing through the flapped gates. When the flapped gates as designed at the top of the radial gates are used, they might serve as an opportunity for downstream migrating fish to pass over the weir. This will lead fish to fall 15 m and then hit the concrete basement. Heights above 5m will led to increased injurie and mortality. (see illustration, attachment 2). With a free fall of 15 m the fish will reach a velocity that even if hitting a water surface there will be high grade of injurie and mortality. To reduce the frequency of fish mortality due to passing through the flapped gates during monsoon, it is recommendable to use the flapped gates only short periods and to direct the excess water to a spillway at the left side of the weir, see figure 10. It might also be a positive solution to put one or more flapped gates at the top of the spillway as indicated in figure 10. 3) Tunnel entrapment During low flow season and during early and late monsoon most of the flow are passing through the power station. In these periods most of the down migrating fish, fry and eggs also follow the flow to the settling basins before they enter the HP tunnel and the point of no return. Francis turbines show relatively high fish mortality, but it is a hope that fry and eggs have a reasonable survival rate. To reduce this mortality significantly a possibility might be to prepare fish guiding mechanisms in the settling basins. In the settling basins, the water velocity is slow which normally give good conditions for building guiding mechanisms.
15
Figure 10 Upstream and downstream fish migration possibilities across the
Upper Trisuli dam. For more detailed information and discussions connected to the upstream and downstream migrations se the Sweco report of 15.08.2016. Some recommendations concerning the management of the fish ladder:
· High resolution flow data and temperature data will be good fish ladder management tools. Hourly flow data of a wet year, a medium wet year and a dry year, and hourly water temperatures give ability to understand functionality according to timeline and to be able to recommend technical solutions for the inlet and the outlet of the fish ladder. The fish do not respond to average values of flow and temperature.
· Detection of the upstream fish migration season is important to decide technical
solutions of the fish ladder entrance and for the management plan as operating periods of the fish ladder.
· Detection of the downstream fish migration will give good basis for management
recommendations. The fish migrations are probably fluctuating between years and are probably related to temperature. Until better data of fish migration is available it is not possible to restrict the fish migration period to the low flow situation.
16(17) 18
repo001.
KH p:\134\14685001 upper trishuli-1\15 ut 1 fish ladder\09 rapport\rapport final fish ladder january 29 2018..docx
Attachment 1. Conceptual fish ladder design, made by SWECO.

17
Attachment 2. Illustration of overflow trough flapped gates at the top of the radial gates.

1 (1)
Sw e co No rge AS
mem
o04.d
ocx
2013-0
6-1
4
KH c:\nepal\s. progastus trisuli.docx
NOTE
14.05.2018
Upper Trisuli HP-1
Suplementary information concerning Schizothorax progastus.
In general Upper Trisuli as a snow feed river is cold and muddy most of the year. This means that the ecological conditions in the main river are not optimal both concerning fish production or invertebrate production. This is probably the reason why the population of Schizothorax richardsonii is low in the main river. In the tributaries with warmer and more clear water the fish densities are high. Moving downstream in Trisuli the temperature showed slightly increased values, still low densities of fish but with higher species diversity. Al examined tributaries showed higher temperature and far higher fish densities than in Trisuli. These findings indicate that temperature is a major factor in the fish population spreading and for the species dominance. Since the registered density of S. richardsonii is very low in Upper Trisuli it might be an indication that the river ecology conditions are not far from the species spreading boundary. Schizothorax progastus This species normally lives in in lower altitudes where the water temperatures are higher than in the Upper Trisuli area. Presence of a species is connected to natural adaptions and spreading ability. Temperature, that is vital for the ability to generate muscle power in cold-blooded animals, is also very well known as a major limiting factor in most ecosystems. S. progastus was not registered when I was doing my field studies in Upper Trisuli. According to other studies and when taking the ecological conditions into account, it seems natural that the UT-1 area is outside the normal living area of this species. It might be that in years with warmer water the species could be able to reach the UT-1 area in low numbers, but probably it would only be a temporary visit with no effect for the species spreading process. The designed fish ladder at UT-1 will get hydraulic conditions making it possible to climb for S. progastus if the water temperature satisfy the species requirements.
Halvard Kaasa Scientific manager Aquatic ecology expert

Appendix D.3
Swimming Performance of
Schizothorax Sp.
repo001.d
ocx
2015-1
0-0
5
RAPPORT
14685001
UPPER TRISULI -1 HP
SWIMMING PERFORMANCE OF SCHIZOTHORAX SP
[STATUS]
28.03.2017
NWEDC
[NAME]
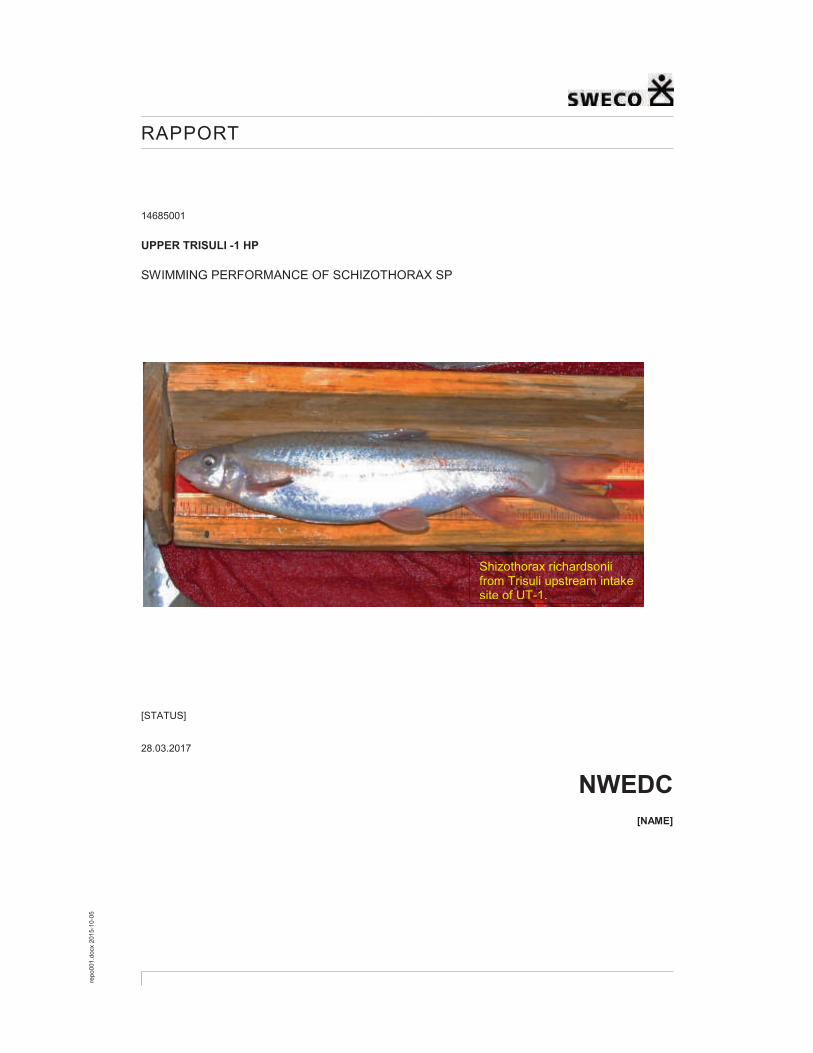
Shizothorax richardsonii from Trisuli upstream intake site of UT-1.

Sweco Drammensveien 260 NO 0212 Oslo, Norge Telefon +47 67 12 80 00 www.sweco.no
Sweco Norge AS Org.nr: 967032271 Hovedkontor: Oslo
Halvard Kaasa Director Department of Environment Mobil +47 951 05 045 [email protected]
Sammendrag:
Final Draft
Prepared by Sign.:
Halvard Kaasa
Sign.:
Peter Rivinoja
Project manager
Halvard Kaasa
This report summarises knowledge on swimming performance of Shizothorax richardsonii
(Snow trout) with focus on qualities connected to design of fish ladders.
Data on swimming performance for many of the native fish species in Nepal are scarce which complicates the design of suitable eco-adapted fishways. In general, nature like fish passages allow most of the species to migrate, followed by vertical slot fishways and thereafter of fish ladders of pool-and-weir type. The key is to construct fish ladders that give hydraulic conditions in the fish ladder that is adapted to the available energy output that the target species can perform under the actual ecological conditions.

Sweco Drammensveien 260 NO 0212 Oslo, Norge Telefon +47 67 12 80 00 www.sweco.no
Sweco Norge AS Org.nr: 967032271 Hovedkontor: Oslo
Halvard Kaasa Director Department of Environment Mobil +47 951 05 045 [email protected]
1 Background
In many countries around the Himalayas the fish, commonly named snow-trout, is an important species for various fisheries activities. The name may refer to various species with different local names within the native genus Schizothorax sp. In a literature review by Rufford (2015) the species S. richardsonii is described to be found both in Nepal and India, often inhabiting the cold mountain rivers at altitudes up to 2800 masl (meter above sea level) (FAO Fisheries paper 431). Fish sizes of up to its maximum length of 60 cm have been reported from Nepal at an altitude of ca 2800 masl. (Ranjan Jah 2006). The species inhabits mountain streams and rivers of about 4-20 °C, where the adults generally prefer to live among rocks at stream depths of around 1-2 m (Rufford 2015, Froese & Pauly 2016). The adult fish have powerful muscular streamlined body and the spawning of mature fish (common sizes of 120-350 mm) might happened twice a year during spring an early monsoon, and during autumn or late monsoon (Shekhar et al. 1993). Koshi et al. (2016) say that spawning also may take place twice in a year from June-October and January-March. These documentations point at a species with high flexibility and good adaptability to local ecological conditions. Since both S. richardsonii and S. progastus are mentioned as species in Upper Trisuli section some basic information about these two species shall be mentioned. With refernce to the Gandaki river system the S. richardsonii zone is between 850m – 2810 m above sea level, while the S.progastus zone is in between 300m and 850 m above sea-level. In the FAO fisheries technical paper 431 it is stated that in the lover S.progastus zone the S.richardsonii will gradually be replaced by S. progastus. This difference in habitat selection seems to point at that S.progastus might be a species adapted to higher water temperatures than is the S. richardsonii. Although S. richardsonii is widely spread along the Himalayan, observations over the last 5-10 years indicate a severe decline of the populations in many areas and the species is now categorized under “vulnerable category” (IUCN 2006).
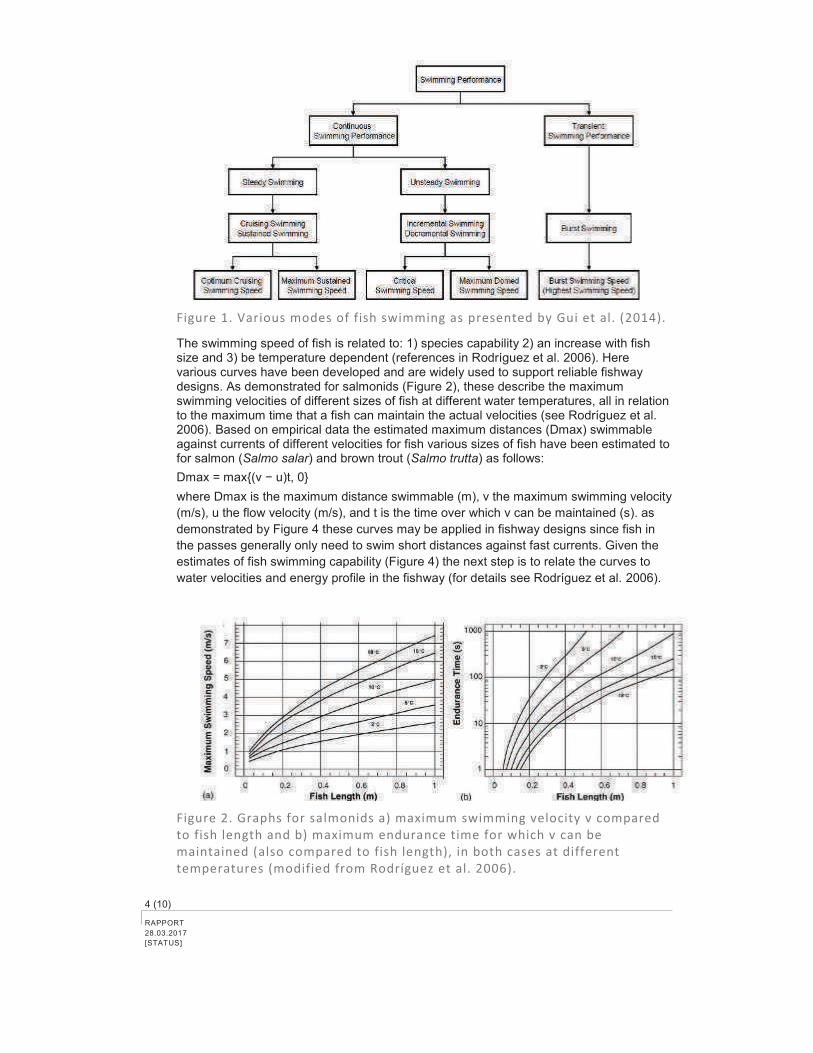
2 General considerations on fish swimming speeds
Commonly the fish swimming speeds are classified into five categories: 1) Optimum Swimming Speed, 2) Maximum Sustained Swimming Speed, 3) Critical Swimming Speed, 4) Maximum Domed Swimming Speed, and 5) Burst Swimming Speed (references in Gui et al. 2014). The maximum speed of fish (Burst), is an anaerobic process and can be sustained only for periods of around 15-20 seconds, related to fish size and water temperature. As stated by Gui et al. (2014) the Burst Swimming Speed (BSS) can be estimated to a upper limit of 10 body lengths per second (BL/s) for many fish species. Yet the BSS depends on the duration of the performed burst, which declines exponentially with time and increases with size in absolute units (cm/s), but decreases in relative units (BL/s). Temperature affect the fish physiology and thereby also the swimming speed of the fish.
4 (10) RAPPORT 28.03.2017 [STATUS]
Figure 1. Various modes of fish swimming as presented by Gui et al. (2014).
The swimming speed of fish is related to: 1) species capability 2) an increase with fish size and 3) be temperature dependent (references in Rodríguez et al. 2006). Here various curves have been developed and are widely used to support reliable fishway designs. As demonstrated for salmonids (Figure 2), these describe the maximum swimming velocities of different sizes of fish at different water temperatures, all in relation to the maximum time that a fish can maintain the actual velocities (see Rodríguez et al. 2006). Based on empirical data the estimated maximum distances (Dmax) swimmable against currents of different velocities for fish various sizes of fish have been estimated to for salmon (Salmo salar) and brown trout (Salmo trutta) as follows:
Dmax = max{(v u)t, 0}
where Dmax is the maximum distance swimmable (m), v the maximum swimming velocity (m/s), u the flow velocity (m/s), and t is the time over which v can be maintained (s). as demonstrated by Figure 4 these curves may be applied in fishway designs since fish in the passes generally only need to swim short distances against fast currents. Given the estimates of fish swimming capability (Figure 4) the next step is to relate the curves to water velocities and energy profile in the fishway (for details see Rodríguez et al. 2006).
Figure 2. Graphs for salmonids a) maximum swimming velocity v compared
to fish length and b) maximum endurance time for which v can be
maintained (also compared to fish length), in both cases at different
temperatures (modified from Rodríguez et al. 2006).

1(6)
RAPPORT 28.03.2017 [STATUS]
KH p:\134\14685001 upper trishuli-1\15 ut 1 fish ladder\09 rapport\rapport hka shizothorax richardsonii.docx
repo001.d
ocx
2015-1
0-0
5
Figure 3. Il lustration of maximum swimmable distance (D m a x, m) compared
to different water velocities, for 25- and 35-cm fish, at a water temperature
of 10, 15 or 20 °C (from Rodríguez et al. 2006).
3 Swimming performance of Schizothorax sp. and resembling species
The adult Schizothorax sp. in the Himalayas have powerful muscular streamlined bodies and are generally dwelling in rapid high volume of water. Studies have demonstrated that Cyprinids living in these types of rapid-flow habitats generally have adapted to a higher swimming speed than fish originating from lentic areas: In total there are currently 64 recognized species in the Schizothorax sp. genus of which the swimming capability of most of the species has not been studied. The detailed data that was found in various reports are listed below.
3.1 Interspecific variation in hypoxia tolerance, swimming performance and
plasticity in cyprinids that prefer different habitats
Fu et al. (2014) quantified and compared hypoxia tolerance and swim performance among cyprinid fish species from rapid-, slow- and intermediate-flow habitats (four species per habitat) in China. The data demonstrated that Cyprinids living in rapid-flow habitats generally have higher swimming performance than fish originating from lentic areas. This was expressed as maximum velocities where fish can maintain their position and are not swept downstream, abbreviation U crit-values. Critical swimming speed (U crit) for juvenile S. prenanti (85 mm in length) was found to be around 6-7 body lengths (BL)/s.

2(6) RAPPORT 28.03.2017 [STATUS]
repo001.d
ocx
2015-1
0-0
5
KH p:\134\14685001 upper trishuli-1\15 ut 1 fish ladder\09 rapport\rapport hka shizothorax richardsonii.docx
3.2 Effect of temperature on swimming performance of juvenile Schizothorax
prenanti
Cai et al. (2014) estimated the swimming performance of S. prenanti at four temperatures (15, 19, 23, 27 °C), and numerical models were used to characterize the effect of temperature on swimming performance. As temperature increases, critical swimming speed (U crit) increased from 15 to 23 °C and then decreases significantly. The highest U crit (around 7.7 BL/s) was at 24 °C. Swimming efficiency was similar from 19 to 23 °C, but decreases significantly at 27 °C. The results of the investigation advance the knowledge of fish metabolism while swimming provides data critical for fishway design.
3.3 Aerobic swimming performance of juvenile Schizothorax chongi (Pisces,
Cyprinidae) in the Yalong River, southwestern China
Tu et al. (2010) studied Schizothorax chongi that is found in rapid stream of southwestern China, and rely on energy reserves to carry out their upriver spawning migration. Energy-saving behavior may thus be crucial for upriver migrants at difficult passage and be valuable for designing effective fishways. Their bioenergetic model (fish of body length c. 10-13 cm and body mass from 14 to 36 g) demonstrated an optimal swimming speed (U opt) of 5.5 BL/s, whereas at the highest velocities usually > 9-10 BL/s the swimming became less steady and darting bursts were used to maintain position, causing rapid movement forward in the flume before resuming continuous swimming. The authors conclude that fishway design must take into account the kinematics of fish swimming ability in terms of swim pattern including tail beat frequency (TBF) and tail beat amplitude (TBA). This means that the minimal slot width (in the vertical slot fishway), should be calculated for the largest individuals of S. chongi (60 cm) and thus not be less than 60 cm x TBAmax. Since the authors found TBAmax to around 0.27 BL/s this means that a fishway for the species should have slot widths of minimum 16 cm, yet the authors mention the need for further research to support the design of effective and comprehensive fishways.
3.4 Evaluation of the swimming ability of wild caught Onychostoma barbatula
(Cyprinidae) and applications to fishway design for rapid streams in
Taiwan.
Lin et al. (2008) evaluated the swimming of Onychostoma barbatula, a migratory Cyprinid found in mountain rivers of Taiwan in order to obtain data that be applied to the design fishways. They found that swimming speed increased progressively to 13 BL/s at 16 °C) for the studied fish of total body length from 5 to 21 cm. The stated that for these small fish a suitable fishway should have a minimal width of 9 cm (for individual fish) and a maximal water velocity of c. 1.27 m/s.
3.5 Swimming capability of Schizothorax oconnori
Ye et al. (2013) tested swimming of the endemic species Schizothorax oconnori in the Yarlung Zangbo River. The results showed that the absolute critical swimming speed increased with the body length and the relational relationship was Y1=-39.369+13.23X-

3(6)
RAPPORT 28.03.2017 [STATUS]
KH p:\134\14685001 upper trishuli-1\15 ut 1 fish ladder\09 rapport\rapport hka shizothorax richardsonii.docx
repo001.d
ocx
2015-1
0-0
5
0.371X2+0.004X3(Y1 was cruising swimming speed, X was body length), while the relative critical swimming speed declined with the increase of body length .Absolute burst swimming speed increased with the increase of body length and the relation was approximately linearity, but the relative burst swimming speed declined with the increase of body length. Under three tested velocities the sustained swimming speed of the fish was 60 cm/s, while the endurance swimming speeds were 80 cm/s and 100 cm/s. The authors claim that the information can be useful for fishway designs.
4 General concerns in fisheries management projects at regulated sites
In general, both large and small scale run of the river hydropower schemes have resembling impact on the local river environment. Most studies in regulated rivers have focused on how the longitudinal connectivity affects the migrations of fish species which involves up- and downstream movements along river corridors. To maintain river connectivity fish ways can be constructed. Nevertheless, relatively few studies have evaluated their efficiencies and only a handful have looked at the overall effect of re-establishing or maintaining the connectivity. Furthermore, just facilitating longitudinal connectivity will not have any long-term effects unless essential requirements for affected species and life-stages are considered. For fish this should include appropriate habitats for spawning, rearing and foraging. The flow alterations occurring in regulated rivers may stress the aquatic fauna and cause limited amounts of appropriate habitats. The effects of hydropower on the biota are likely to vary dependent on the type of the hydropower facility and the specific river environment. Still, the knowledge on the ecodynamic situation in regulated rivers seems rather scarce.
At present a variety of fish ways exist. Common bypasses for upstream migrating fish consist of technical ladders, which are normally designed in three varieties: 1) Pool and weir, 2) Denil slot, and 3) Vertical slot. In addition, nature-like bypasses are being developed and seems to be the preferable solution if space and areal conditions are available. In river ecosystems with many fish species it is favourable that the fish ladder designs are adapted to the weakest swimmers in the run, or if one target species is selected the hydraulic situation in the fish passage shall be adapted to the ecological situation that statistically require the lowest burst speed of the target species. The effectivity of the fish passage should aim to pass more than 95% of the adult upstream migrants in a safe and rapid manner (see Rivinoja et al. 2010). Mature migrating adult fish generally search for the highest flows, and as a result passage problems can arise due to low attraction flows in bypasses. This might hinder fish if they are attracted towards impassable routes from turbine outlets or dams rather than to bypasses. Delays at power stations may be considerable in terms of increased energy costs, which may lead to a lowered reproductive fitness during spawning. For fishways to function properly not only must the fish be able to find the fishway (attraction efficiency) but they must also be able to successfully ascend it (passage efficiency). To guide fish towards fishways is often complicated, especially when fish must leave the main stem of the river. In many cases, and particularly in larger rivers, channels and

4(6) RAPPORT 28.03.2017 [STATUS]
repo001.d
ocx
2015-1
0-0
5
KH p:\134\14685001 upper trishuli-1\15 ut 1 fish ladder\09 rapport\rapport hka shizothorax richardsonii.docx
dewatered sections are associated with low residual flow conditions and may have partial obstacles that may cause the fish to move slowly or even stop and return downstream (see Rivinoja 2005). When the fishway is situated in the main stem, close to a power station, or close to a spillway with high flows, the design of the fishway entrance and its position in relation to the tail-race or the spillway water is crucial for the effect of the fish path. In the Himalayas the main objective of many fishery development plans is to improve the habitat and to ensure the up- and downstream migrations of fish, especially Schizothorax
richardsonii that constitutes an important food resource.
5 Conclusions
Data on swimming performance for many of the native fish species in Nepal are scarce which complicates the design of suitable eco-adapted fishways. In general, nature like fish passages allow most of the species to migrate, followed by vertical slot fishways and thereafter of fish ladders of pool-and-weir type. The key is to construct fish ladders that give hydraulic conditions in the fish ladder that is adapted to the available energy output that the target species can perform under the actual ecological conditions.
5(6)
RAPPORT 28.03.2017 [STATUS]
KH p:\134\14685001 upper trishuli-1\15 ut 1 fish ladder\09 rapport\rapport hka shizothorax richardsonii.docx
repo001.d
ocx
2015-1
0-0
5
References
· ADB. 2014. Asian development bank. ENVIRONMENTAL SAFEGUARD COMPLIANCE ASSESSMENT Dagachhu Hydro Power Corporation. Additional Financing of Green Power Development Project (RRP BHU 37399). Available 2017-03-08 at: https://www.adb.org/sites/default/files/linked-documents/37399-043-bhu-sd-02.pdf
· Cai L, Liu G, Taupier R, Fang M, Johnson D, Tu Z & Huang Y. Effect of temperature on swimming performance of juvenile Schizothorax prenanti. Fish Physiol Biochem. 2014 Apr;40(2):491-8. doi: 10.1007/s10695-013-9860-0. Epub 2013 Sep 24.
· CISMHE 2010. Centre for inter-disciplinary studies of mountain & hill environment. Executive summary of EIA & EMP report. Environmental impact assesmenet study of the proposed Tawang E.E. project stage-I: ttp://www.moef.nic.in/sites/default/files/Executive%20Summary_Tawang%20I.pdf
· Froese R & Pauly D. Editors. 2016. FishBase. World Wide Web electronic publication.(10/2016). Available 2017-03-06 at: www.fishbase.org
· Fu SJ, Fu C, Yan GJ, Cao ZD, Zhang AJ & Pang X. 2014. Interspecific variation in hypoxia tolerance, swimming performance and plasticity in cyprinids that prefer different habitats. The Journal of Experimental Biology 217, 590-597 doi:10.1242/jeb.089268
· Gui F, Wang P & Wu C. 2014. Evaluation approaches of fish swimming performance. Agricultural Sciences 5(2), 106-113. http://dx.doi.org/10.4236/as.2014.52014
· IUCN 2016. The IUCN Red List of Threatened Species. Version 2016-3. <http://www.iucnredlist.org>. Downloaded on 07 December 2016. http://www.iucnredlist.org/details/166525/0
· Joshi KD, Das SCS, Khan AU, Pathak RK & Sarkar UK. 2016. Reproductive Biology of Snow Trout, Schizothorax richardsonii (Gray,1832) in a Tributary of River Alaknanda, India and Their Conservation Implications. International Journal of Zoological Investigations 2(1), 109-114.
· Lin PJ, Ni IH, & Huang BQ. 2008. Evaluation of the swimming ability of wild caught Onychostoma barbatula (Cyprinidae) and applications to fishway design for rapid streams in Taiwan. The Raffles Bulletin of Zoology, December 2008.
· Ranjan JHA 2006. Fish ecological studies and its application in assessing ecological integrity of rivers in Nepal. PhD thesis. Department of biological and environmental science. Kathmandu University, Dhulikhel, Nepal. http://www.ku.edu.np/env/pdf/bibhuti_diss_final.all-subodh6.pdf
· Rivinoja P. 2005. Migration problems of Atlantic salmon (Salmo salar L.) in flow regulated rivers. PhD-thesis, Acta Universitatis Agriculturae Sueciae, Umeå, Sweden 2005:114.
· Rivinoja, P. 2005. Migration problems of Atlantic salmon (Salmo salar L.) in flow regulated rivers. PhD-thesis, Acta Universitatis Agriculturae Sueciae, Umeå, Sweden 2005:114.
· Rivinoja, P., Calles, O., Karlsson, S. and S. Lundström. 2010. Effects of small scale hydropower on aquatic fauna. 21 pages. Department of Wildlife, Fish, and Environmental studies, Swedish University of Agricultural Sciences. Report 4.

6(6) RAPPORT 28.03.2017 [STATUS]
repo001.d
ocx
2015-1
0-0
5
KH p:\134\14685001 upper trishuli-1\15 ut 1 fish ladder\09 rapport\rapport hka shizothorax richardsonii.docx
· Rodríguez TT, Agudo JP, Mosquera LP & Gonzalez EP. 2006. Evaluating vertical-slot fishway designs in terms of fish swimming capabilities. Ecological Engineering 27(1), 37-48
· Rufford. 2015. The Rufford Foundation. Assessment of Nika Chu Freshwater Ecology under Jigme Singye Wangchuck National Park through using fresh water fish diversity and habitats as bio-indicator. Available 2017-03-14 at: http://www.rufford.org/files/16189-1%20Detailed%20Final%20Report.pdf
· Shekar C, Malhotra YR & Dutta SPS. 1993. Food and feeding habits of Schizothorax richardsonii (Gray and Hard) inhabiting Neeru nullah, Bhaderwah, Jammu. J. Indian Inst. Sci., May-June 1993, 73, 247-251
· Shrestha TK. 2003. Conservation and management of fishes in the large Himalayan Rivers of Nepal. Paper presented to the Second International Symposium on the Management of large rivers for fisheries, 1–19. Available 03-09 at: http://52.7.188.233/sites/default/files/Conservation%20and%20Management%20of%20Fishes%20in%20the%20Large%20Himalayan%20Rivers%20of%20Nepal.pdf
· Tu Z, Yuan X, Han J, Shi X, Huang Y & Johnson D. 2010. Aerobic swimming performance of juvenile Schizothorax chongi (Pisces, Cyprinidae) in the Yalong River, southwestern China. Hydrobiologia 675, 119–127
· YE C, Wang et al. 2013. Swimming capability of schizothorax oconnori. Freshwater fisheries 2013-03. http://en.cnki.com.cn/Article_en/CJFDTOTAL-DSYY201303007.htm

Appendix D.4
Fish Ladder For Upper Trishuli-
1 HPP, Margenex International
Review Memo

. . . . . . . . .
. . . . . . . . . . . . . . . . . . . . . . . . . . . .
Margenex International
January 16, 2018
Dr. Leeanne Alonso
4618 Duncan Drive
Annandale, VA 22003
Re: Fish ladder for Upper Trishuli-1 HPP
Dear Dr. Alonso:
Thank you for the opportunity to review the report entitled “Principles for Design of Fish
ladder for UT-1 HPP” by Halvard Kaasa, a civil engineer and fish scientist for Sweco
Norway AS. I have reviewed this report in detail, with focus on the fish ladder design.
This report gives comments and recommendations for technical solutions to keep river
connectivity when the Upper Trishuli-1 Hydropower project (UT-1) is in operation. The
dominant species in the UT-1 area of Trishuli River is the Asala (Shizothorax
richardsonii), a species of Snow Trout that migrates upstream and downstream for
breeding, feeding and rearing purposes on a seasonal basis. The total height of the fish
ladder will be approximately 30 m. The exact height will be decided when the design of
the fish ladder entrance pool is settled. To meet the requirements for migration of Snow
Trout, the total number of pools will be close to 100.
The report provides adequate details of the conditions for the fish ladder design,
considering the characteristics of the target fish species, flows through the fish ladder,
and available space in the geophysical setting. The report lays out details of the crucial
lower entrance of the ladder and explains, with appropriate figures, the design of each of
the ten pools at the lower end, as well at the set up for the water of attraction. The latter is
key to enticing fish to enter the facility.
Regarding the design of the proposed fish ladder, I like the alternating weir notches in
each of the pools. The maximum water level drop of just under 12 inches, coupled with
the 8 inch square drain openings near the bottom of each pool, should allow adequate
upstream passage of adult Snow Trout during low flows of March and April. In my
experience in Washington State, a very conservative weir drop is 9 inches is desired to
accommodate small salmonids (mainly Cutthroat Trout, which would be analogous to
P.O. Box 25635
Seattle, Washington 98165 +1 206-362-4217
+1 206-434-8762 cell
Serving the International Biodiversity Community

Page 2
adult Snow Trout, in this case), but most Pacific NW professionals would say that 12
inches should be satisfactory. I am also fine with the lower entrance pool and upper exit
pool schemes.
The report provides a reasoned description of upstream fish migration challenges not
related to the proposed fish ladder, and notes considerations for downstream fish
migration, including current in the intake pond, the pool downstream of the weir, and
tunnel entrapment. It also outlines the types of data that should be obtained in order to
properly manage the fish ladder.
My main concerns mirror what has been stated in the report:
• The conditions in the pool outside the fish ladder entrance is crucial for the
functionality of the fish ladder; and
• The water level in the pool of the fish ladder entrance will, by existing design,
fluctuate between 1229.1 m (5 m3/s) to 1,231.5 m (154.4 m
3/s). Fluctuations of up
to 2.4 m (8.9 ft) might lead to challenges concerning fish migration.
In conclusion, it is my opinion that there is reasonable likelihood this fish ladder will
function to meet the project objective of allowing Asala connectivity above and below
the hydropower project, based on the approach described in the Sweco Norway AS
report.
I would like to see the details of how they plan to carry out monitoring to quantify fish
use of the ladder, such as conventional tagging, sonic tagging or observations. If the
latter, I recommend two to four fish viewing windows, evenly spaced along the ladder,
for quantifying upstream migration.
I look forward to working with you on this project in the future. Please contact me if you
have any questions.
Sincerely,
Margenex International S/S Mark G. Pedersen Mark G. Pedersen, M.S. FP-C. President and Senior Fisheries Consultant to the IFC

Appendix E
Scenario-Based Evaluation of
Flow Impacts on S. richardsonni
in the Trishuli River

i
Nepal Water and Energy Development Company
(NWEDC) Limited
Naxal, Kathmandu
A Final Report
on
Upper Trishuli-1 HEP, Nepal: Scenario-based evaluation
of flow impacts on S. richardsonii in the Trishuli River
Report Prepared by:
S.A.N. Engineering Solutions Pvt. Ltd.
Bakhundole, Lalitpur
Ph.: 01-5530600
Email: [email protected]
April 2017

ii
Executive Summary
Nepal has a huge potential for hydropower development. After the introduction of
Hydropower Development Policy, 2001 there has been active involvement of private sector in
hydropower development of Nepal. Most of the projects are being constructed by the local
hydropower developers whereas some of the projects with greater installed capacities are
being developed under the financial assistance by international funding agencies such as the
World Bank and Asian Development Bank.
The Upper Trishuli-1 Hydroelectric Project (216 MW) is a Run-of-River type project being
developed by Nepal Water and Energy Development Company (NWEDC). The project is
funded by the International Finance Corporation (IFC). As a requirement of sustainable
hydropower development and to meet the performance standards of IFC with regards to
biodiversity conservation, an Eflows assessment followed by formulation of Environmental
Flows Management Plan (EFMP) is carried out.
The Eflows assessment is carried out at three sites, viz.: upstream of dam site, in the
dewatered river reach and downstream of the powerhouse site. About 12 km of the dewatered
river reach is considered for eflows assessment. DRIFT model developed by Southern Waters
is used to study the consequences of flow alteration due to project development on the life of
Schizothorax richardsonii. Thus, the ecosystem indicators that are likely to be influential in
the life of S. richardsonii as a result of flow changes are considered in this study. Similarly,
baseline ecological status of each study site is evaluated and possible ecological changes of
these sites due to flow alteration after the hydropower project is in place are evaluated.
The results of the study shows that the baseline ecological status of eflows site 1 (upstream of
dam site) and site 3 (downstream of powerhouse site) are not changed significantly and seems
to have minimum effect on the life of S. richardsonii. On the other hand, the ecological
integrity and fish populations will be impacted in the dewatered river reach due to flow
diversion for power generation. However, with the provision of efficient and functional fish
passage the effects can be minimized. The results of the EFlows assessment also show that the
best EFlows scenario for the S. richardsonii is the release of more water during the winter
(low flow) months. However, power generation will be negatively impacted with the release
of more water, with a loss of approximately 4.9 % of power if 20% of mean monthly flow is
released. And, it is highly unlikely that the project will be financially viable with this power
loss.
As NWEDC has exhibited commitment to biodiversity management for UT-1 through
extensive baseline data collection, inclusion of a fish ladder that will meet international
standards, a cumulative impacts assessment and this EFlows assessment, release of agreed
eflows followed by appropriate mitigation measures during the project implementation shall
be recommended for reducing the impacts on S. Richardsonii in the dewatered river reach.

iii
Table of contents
1 INTRODUCTION .............................................................................................................. 1
1.1 Background .................................................................................................................. 1
1.1.1 The Trishuli River ................................................................................................. 1
1.1.2 The Project ........................................................................................................... 1
1.2 The EFlows assessment ............................................................................................... 3
1.2.1 Terms of Reference ............................................................................................... 3
1.3 Limitations of the study ............................................................................................... 5
2 EFLOWS SITES ............................................................................................................... 6
3 HYDROLOGY .................................................................................................................. 7
4 LIFE HISTORY CONSIDERATIONS – SCHIZOTHORAX RICHARDSONII ............................ 11
4.1 Presence of S. richardsonii at EFlow Site 1 and 2 in winter ..................................... 11
5 ECOSYSTEM INDICATORS ............................................................................................ 14
6 ECOLOGICAL STATUS .................................................................................................. 15
6.1 Baseline Ecological Status of the EFlows sites ......................................................... 15
7 RESPONSE CURVES ....................................................................................................... 16
8 SCENARIOS ................................................................................................................... 24
8.1 Assumption for barriers to fish .................................................................................. 25
9 RESULTS OF SCENARIO ANALYSES .............................................................................. 26
9.1 Site 1 .......................................................................................................................... 26
9.1.1 Characteristics of the flow regime of each scenario at Site 1 ............................ 26
9.1.2 Mean percentage changes .................................................................................. 27
9.1.3 Overall Integrity ................................................................................................. 27
9.2 Site 2 .......................................................................................................................... 28
9.2.1 Characteristics of the flow regime of each scenario at Site 2 ............................ 28
9.2.2 Mean percentage changes .................................................................................. 29
9.2.3 Overall Integrity ................................................................................................. 30
9.3 Site 3 .......................................................................................................................... 32
9.3.1 Characteristics of the flow regime of each scenario at Site 3 ............................ 32
9.3.2 Mean percentage changes .................................................................................. 32
9.3.3 Overall Integrity ................................................................................................. 32
10 ENERGY PRODUCTION AND ECOSYSTEM INTEGRITY AT SITE 2 ................................. 34
11 ADDITIONAL CONSIDERATIONS .................................................................................. 36
11.1 The effect of rainbow trout ........................................................................................ 36
11.2 The effect of downstream and tributary HEPs .......................................................... 36
11.3 Contributions from Tributaries .................................................................................. 36
11.4 Fish Passage ............................................................................................................... 36
11.5 S. richardsonii migration patterns ............................................................................. 37
12 CONCLUSIONS AND NEXT STEPS ................................................................................. 38
13 REFERENCES ................................................................................................................ 39
APPENDIX A. OVERVIEW OF DRIFT ................................................................................... 41
A.1. Response Curves........................................................................................................ 42
A.2. Scoring system ........................................................................................................... 45

iv
A.3. Identification of ecologically-relevant elements of the flow regime ......................... 47
A.4. Major assumptions and limitations of DRIFT ........................................................... 48
A.5. References ................................................................................................................. 49

v
List of figures
Figure 1.1 Location of Upper Trishuli-1 HEP, Nepal (Approved EIA Report of UT-1 HEP) . 2
Figure 1.2 Study area for the Upper Trishuli-1 HEP EFlows assessment ................................ 4
Figure 3.1 One year (1967) of the baseline hydrological record at Site 2, showing the
seasonal divisions, from left to right, into: Dry, Transitional 1, Wet, Transitional
2, and back into Dry. ............................................................................................... 7
Figure 3.2 Examples of year-on-year variation in flows and flow seasons in the baseline time-
series at Site 2. The maximum discharge is indicated at the top left of each
example. .................................................................................................................. 8
Figure 3.3 Examples of annual time-series of a DRIFT flow indicator: average daily volume
in the dry season (showing four scenarios). .......................................................... 10
Figure 9.1 Overall ecosystem integrity scores for the scenarios at Site 1. .............................. 28
Figure 9.2 Overall ecosystem integrity scores for the scenarios at Site 2 – assuming S.
richardsonii is a year-round resident. .................................................................... 31
Figure 9.3 Overall ecosystem integrity scores for the scenarios at Site 2 – assuming S.
richardsonii is a summer resident. ........................................................................ 31
Figure 9.4 Overall ecosystem integrity scores for the scenarios at Site 3. .............................. 33
Figure 10.1 Energy production under different EFlows scenarios ........................................... 35
Figure 10.2 Ecosystem Integrity (median of the Sites) vs energy production .......................... 35
List of tables
Table 1.1 Upper Trishuli-1 HEP design features (NWEDC) ................................................... 2
Table 3.1 Parameters used for seasonal divisions .................................................................... 8
Table 3.2 Flow indicators used in the Upper Trishuli River .................................................... 9
Table 4.1 Summary of key life history aspects of S. richardsonii ......................................... 12
Table 5.1 Ecosystem indicators ............................................................................................. 14
Table 6.1 Categories for Baseline Ecological Status (after Kleynhans 1997) ....................... 15
Table 6.2 BES of the EFlows sites on the Upper Trishuli River at 2016. ............................. 15
Table 7.1 Exposed sand and gravel bars ................................................................................ 16
Table 7.2 Exposed cobble and boulder bars .......................................................................... 17
Table 7.3 Median bed sediment size ...................................................................................... 18
Table 7.4 Area of secondary channels and backwaters ......................................................... 18
Table 7.5 Algae ...................................................................................................................... 19
Table 7.6 EPT (Ephemeroptera, Plecoptera and Trichoptera) ............................................... 19
Table 7.7 Snow trout - S. richardsonii ................................................................................... 20
Table 8.1 Scenarios selected for assessment .......................................................................... 24
Table 9.1 Characteristics of the baseline flow regime at Site 1. Median values are given for
the flow indicators. ................................................................................................ 26
Table 9.2 Site 1: The mean percentage changes (relative to Baseline, which equals 100%)
for the indicators for each scenario. Change representing an improvement in
condition relative to baseline is marked in green. Change representing a decline in

vi
condition relative to baseline is marked as follows: Orange = change >40-70%;
red = change >70%. ............................................................................................... 27
Table 9.3 Characteristics of the baseline and scenario flow regimes at Site 2. Median values
are given for the flow indicators. ........................................................................... 28
Table 9.4 Site 2: The mean percentage changes (relative to Baseline, which equals 100%)
for the indicators for each scenario – assuming S. richardsonii is resident at Site 2
year-round. Change representing an improvement in condition relative to baseline
is marked in green. Change representing a decline in condition relative to baseline
is marked as follows: Orange = change >40-70%; red = change >70%. .............. 29
Table 9.5 Site 2: The mean percentage changes assuming S. richardsonii migrates
downstream and away from Site 2 in the winter ................................................... 30
Table 9.6 Characteristics of the baseline flow regime at Site 3. Median values are given for
the flow indicators. ................................................................................................ 32
Table 9.7 Site 3: The mean percentage changes (relative to Baseline, which equals 100%)
for the indicators for each scenario. Change representing an improvement in
condition relative to baseline is marked in green. Change representing a decline in
condition relative to baseline is marked as follows: Orange = change >40-70%;
red = change >70%. ............................................................................................... 33
Table 10.1 Energy Production under different EFlows scenarios ........................................... 34

vii
Acronyms
DRIFT Downstream Response to Imposed Flow Transformation
EFlows Environmental Flows
EFMP Environmental Flows Management Plan
HEP Hydroeletric Project
IFC International Finance Corporation
NWEDC Nepal Water and Energy Development Company
VDC Village Development Committee

1
1 Introduction
1.1 Background
1.1.1 The Trishuli River
The Trishuli River is a trans-boundary river and is one of the eight sub-basins of the Gandaki
River basin in Central Nepal. It covers an area of 32 000 km2, which is 13% of the total
Gandaki area. The Trishuli watershed lies within the physiographic Highland and Midland
zones defined by average altitudes of ~2000 m and high valley landscapes.
The Trishuli River originates in the Tibet Autonomous Region of the People’s Republic of
China, where it is known as Bhote Koshi. The catchment area of Bhote Koshi in Tibet is
~3 170 km2 for a river length of 120 km. The ~106 km of Trishuli River within Nepal shows a
high gradient in the initial 40 km with rapids dominating the longitudinal profile but there are
no impassable falls (CIA UT-1, 2014, ESSA).
1.1.2 The Project
The proposed Upper Trishuli-1 HEP (216 MW) is a ‘Run-of –River’ type project being
developed by Nepal Water and Energy Development Company (NWEDC) Ltd. The main
project features are the headworks (including diversion weir, intake, and diversion tunnel),
desander basin, headrace tunnel (including surge tank, vertical shaft) and powerhouse,
including the tailrace tunnel. The project is located in Rasuwa District, Bagmati Zone 80 km
northeast of Kathmandu. The intake site is located at Hakubesi of Haku VDC and powerhouse
site at Mailun of Haku VDC. The catchment area at the intake site is 4 350.88 km2 and the
design discharge at Q51 is 76 m3/s. By utilizing the net head of 333.93 m, an average annual
energy of 1533.1 GWh could be produced. The total project cost is estimated to be around
US$ 382.583 Million and is expected to be completed within 5 years from the start of
construction. The location map of Upper Trishuli-1 HEP is given in Figure 1.1.

2
Figure 1.1 Location of Upper Trishuli-1 HEP, Nepal (Approved EIA Report of UT-1 HEP)
The design features of the project are shown in Table 1.1.
Table 1.1 Upper Trishuli-1 HEP design features (NWEDC)
Item Description
Catchment area at intake site 4350 km2
Design Discharge at Q51 76 m3/s
Net Head 324 m
Plant Capacity 216 MW (72 MW x 3 units)
Average Annual Energy 1 533.1 Gwh
Saleable Energy 1 456.4 Gwh
Diversion Structure Concrete Gravity Dam/Weir of height 32.0 m and overall length of 100.90 m.
Intake 2 Nos. each of 3.25 m wide and 6.5 m high
Desanding basin Underground(3 chambered) with effective length of 115 m
Headrace Tunnel 9.715 km long, 6.5 m diameter
Surge tank 292 m deep, 8.5 m diameter on top, restricted orifice type
Tailrace tunnel 178 m long, 6.5 m diameter
Penstock 3 steel lined penstock tunnels
Powerhouse Underground

3
1.2 The EFlows assessment
1.2.1 Terms of Reference
The contract agreement for preparation of Environmental Flows Management Plan (EFMP) of
UT-1 HEP between Nepal Water and Energy Development Company (NWEDC), the client
and S.A.N. Engineering Solutions Pvt. Ltd. (the consultant) was signed between the two
parties based on the following Terms of Reference.
(i) Introduction
As a part of process to ensure compliance of the Upper Trishuli-1 Hydroelectric Project (UT-
1HEP) with Nepal national regulations and the IFC’s Performance Standard 6: Biodiversity
Conservation and Sustainable Management of Living Resources, NWEDC is required to
develop environmental flow management to maintain viable populations during construction
and operations of the Upper Trishuli-1 Hydropower Project.
(ii) Objectives
In line with IFC's Performance Standard, the objective of this scope of work is to develop an
Environmental Flows Management Plan (EFMP) to maintain viable fish populations during
construction and operations of the Upper Trishuli -1 Hydroelectric Project (UT-1 HEP),
Nepal.
(iii) Approach to the study
The Consultant’s effort was streamlined to meet the objectives as outlined by the Scope of
Work.
The Hydropower Development Policy (HDP 2001) is the guiding document for EFlows
releases in the design of hydropower projects in Nepal. According to HDP, a developer is
required to release 10% of the minimum monthly average flow or the quantum stated in the
Environment Impact Assessment (EIA) Report, whichever is higher, as a minimum flow
criterion. This minimum flow, in fact, does not constitute an EFlows provision as it does not
consider the aquatic ecosystem in the study reach, nor any potential knock-on effects
downstream of that reach. With the involvement of donor agencies such as Asian
Development Bank and the World Bank Group in hydropower development in Nepal,
however, there has been a growing concern about ensuring sustainable hydropower
development and adherence to the performance standards of these donor agencies.
The Consultant will develop EFMP for UT-1 HEP to meet IFC Performance Standard 6, i.e.,
no net loss of biodiversity. That said, the timing and other limitations that define the study
necessitate a rapid approach that focuses on the mitigation of any residual impacts on
Schizothorax richardsonii with a 10% of minimum monthly average flow release in place and
a reliance on existing information, including unpublished relationships between S.
richardsonii and flow established for similar rivers in the Himalayan region. To this end, the
evaluation of flow scenarios comprising different minimum flow releases will be done used
the DRIFT Method (Brown et al. 2013), which has been successfully implemented in the
Neelum/Jhelum Basin in Pakistan-administered Kashmir.
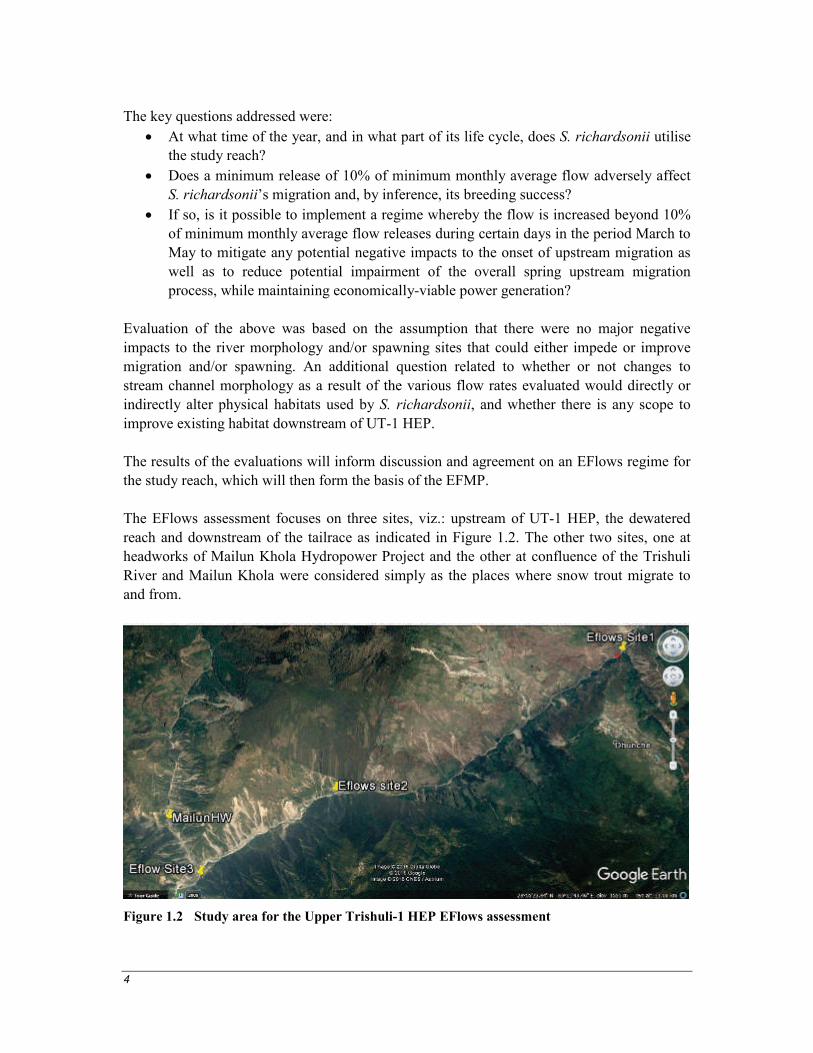
4
The key questions addressed were:
At what time of the year, and in what part of its life cycle, does S. richardsonii utilise
the study reach?
Does a minimum release of 10% of minimum monthly average flow adversely affect
S. richardsonii’s migration and, by inference, its breeding success?
If so, is it possible to implement a regime whereby the flow is increased beyond 10%
of minimum monthly average flow releases during certain days in the period March to
May to mitigate any potential negative impacts to the onset of upstream migration as
well as to reduce potential impairment of the overall spring upstream migration
process, while maintaining economically-viable power generation?
Evaluation of the above was based on the assumption that there were no major negative
impacts to the river morphology and/or spawning sites that could either impede or improve
migration and/or spawning. An additional question related to whether or not changes to
stream channel morphology as a result of the various flow rates evaluated would directly or
indirectly alter physical habitats used by S. richardsonii, and whether there is any scope to
improve existing habitat downstream of UT-1 HEP.
The results of the evaluations will inform discussion and agreement on an EFlows regime for
the study reach, which will then form the basis of the EFMP.
The EFlows assessment focuses on three sites, viz.: upstream of UT-1 HEP, the dewatered
reach and downstream of the tailrace as indicated in Figure 1.2. The other two sites, one at
headworks of Mailun Khola Hydropower Project and the other at confluence of the Trishuli
River and Mailun Khola were considered simply as the places where snow trout migrate to
and from.
Figure 1.2 Study area for the Upper Trishuli-1 HEP EFlows assessment
5
The sites marked 1, 2 and 3 are located upstream of the dam, in the dewatered section and
downstream of the powerhouse, respectively.
1.3 Limitations of the study
The level of detail achieved in this assessment is commensurate with available data and
information, budget and programme. Thus, although the process applied in this assessment is
similar to that used in more detailed EFlows assessments, it is a coarse-level assessment, with
the focus on the identification of major risks to the ecosystem associated with the Upper
Trishuli HEP using responses to flow and sediment changes developed for a different but
similar river.
The following exclusions, limitations and assumptions apply:
The study:
o focuses on S. richardsonii
o uses existing information
o excludes any hydraulic modelling or topographical survey of the study reach
Changes to stream channel morphology are evaluated qualitatively only.
Scenarios include UT-1 HEP only.
The Client provided the following:
o 20-30 years daily flow data for pre-UT-1 conditions in the study reach.
o Flow regime, including spills, with UT-1 HEP in place with a minimum monthly
average release of 10%, covering the same period as the per-UT-1 hydrological
time-series.
o Information related to sediment supply to and deposition in the UT-1 reservoir.
o Operational rules related to flushing sediments.
o The number of scenarios evaluated is limited to six, plus baseline.
o Offsets were not evaluated in terms of feasibility, effectiveness or cost, and
detailed design was not be undertaken
o Stakeholder engagement was excluded
Finally, data are always a limiting factor in environmental studies. With contemporary
understanding of how aquatic ecosystems function, it has become easier to predict what will
change and the direction of change. It is less easy to predict by how much ecosystem
components will change and how long it will take. For this reason:
all predictions should be evaluated with due cognizance of the assumptions necessitated
by the constraints of the study; and
it is better to evaluate the outcome of the scenarios relative to one another rather than as
absolute individual predictions of change.

6
2 EFlows sites
An EFlows assessment was carried out at three sites, viz.: upstream of the dam site, dewatered
river reach and downstream of the powerhouse. Due to the diversion of flow from intake,
natural flow conditions in the section of the river between the dam site and the power house
site will be impaired. This impairment is greatest in the dewatered river reach, but there will
also be effects at upstream of the dam site and downstream of the tailrace. Thus, the EFlows
study considered the three sites shown in Figure 1.2. The locations of these sites are as
follows:
i) Site 1: 28o 07' 36.40"N, 85o 17' 52.41"E Upstream of Dam site
ii) Site 2: 28o 05' 27.76"N, 85o 14' 7.87"E Dewatered Zone
iii) Site 3: 28o 04' 13.87"N, 85o 12' 28.63"E Downstream of Power House Site.
Since the EFlows sites 1 and 3 are located close to the headworks site and the powerhouse site
respectively, the length of the river that was considered for the eflows study is approximately
12 km. As mentioned in the Terms of reference for EFMP formulation, the dewatered river
reach was only considered for the eflows assessment.

7
3 Hydrology
The baseline hydrological and scenario daily time-series data were provided by NWEDC.
These are based largely on flow data obtained from the Department of Hydrology and
Meteorology (DHM) gauging station at Betrawati, located 12 km D/s of intake. The best
available long-term hydrological data were for the period 1967 to 2013, and so this was the
period on which the EFlows assessment was based.
Details of the hydrological data available for the Upper Trishuli River and the procedures
undertaken to obtain then are covered in Hydrological Analysis of Detail Design Report-II,
Civil of UT-1 HEP.
The hydrological record for the Trishuli River suggests that this is a flood-pulse system, with
four well-defined seasons (Figure 3.1). Figure 3.2 provides some examples of the year-on-
year variation in flow and flow seasons at one of the EFlows sites. The seasonal divisions
shown in these figures are those identified in DRIFT using the parameters listed in Table 3.1.
Figure 3.1 One year (1967) of the baseline hydrological record at Site 2, showing the seasonal
divisions, from left to right, into: Dry, Transitional 1, Wet, Transitional 2, and back
into Dry.
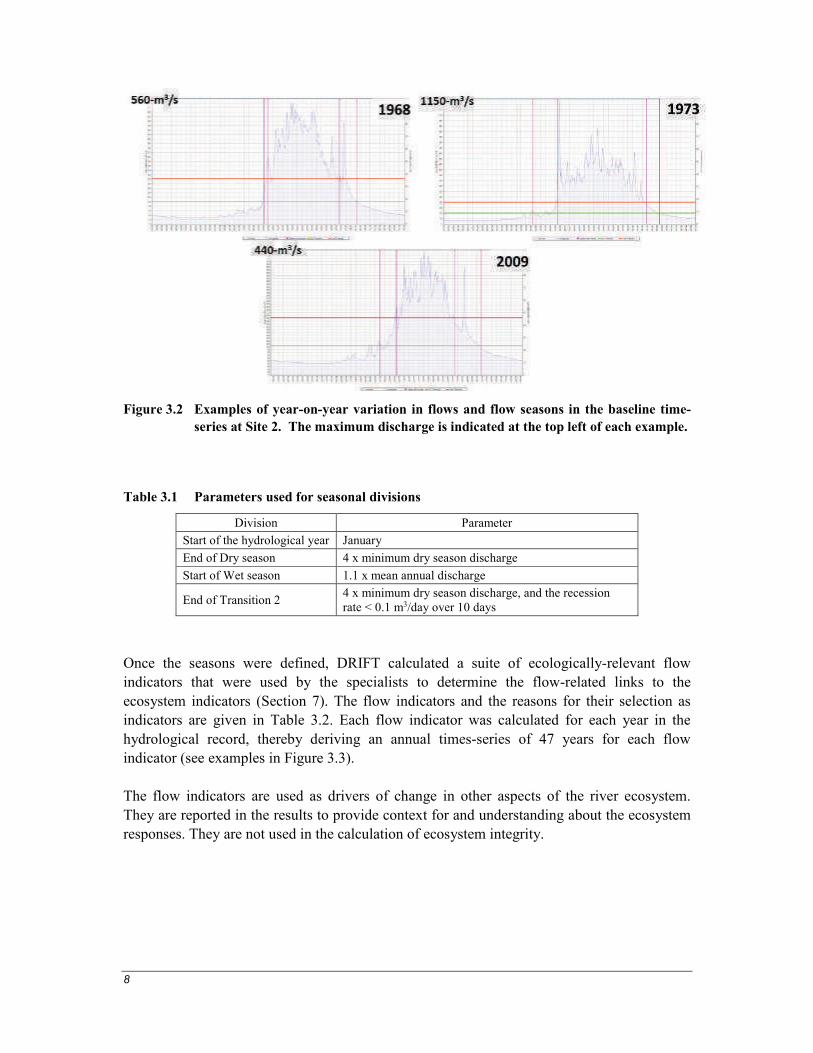
8
Figure 3.2 Examples of year-on-year variation in flows and flow seasons in the baseline time-
series at Site 2. The maximum discharge is indicated at the top left of each example.
Table 3.1 Parameters used for seasonal divisions
Division Parameter
Start of the hydrological year January
End of Dry season 4 x minimum dry season discharge
Start of Wet season 1.1 x mean annual discharge
End of Transition 2 4 x minimum dry season discharge, and the recession rate < 0.1 m3/day over 10 days
Once the seasons were defined, DRIFT calculated a suite of ecologically-relevant flow
indicators that were used by the specialists to determine the flow-related links to the
ecosystem indicators (Section 7). The flow indicators and the reasons for their selection as
indicators are given in Table 3.2. Each flow indicator was calculated for each year in the
hydrological record, thereby deriving an annual times-series of 47 years for each flow
indicator (see examples in Figure 3.3).
The flow indicators are used as drivers of change in other aspects of the river ecosystem.
They are reported in the results to provide context for and understanding about the ecosystem
responses. They are not used in the calculation of ecosystem integrity.

9
Table 3.2 Flow indicators used in the Upper Trishuli River
Indicator Reason for selection as indicators
Mean annual runoff Gives an indication of annual abstraction/addition of water, if any.
Dry season minimum 5-day discharge
Dry season minimum 5-day average flows influence available habitat area, fish movement, and winter temperatures (buffering)
Dry season onset
Onset and duration of seasons:
link with climatic factors
cues fruiting and flowering
cues migration/breeding
support life-history patterns.
Dry season duration
The dry season is typically the harshest season for aquatic life to survive. This is the time when flows are low, water quality influences potentially stronger and temperatures (either hot or cold) are most challenging. Increases in the duration of this harsh period can have significant influence on overall chances of survival.
Dry season average
daily volume
Dry periods
promote in-channel growth
support larval stages
maintain intra-annual variability.
Wet season onset
Onset and duration of seasons:
link with climatic factors
cues fruiting and flowering
cues migration/breeding
support life-history patterns.
Wet season duration Important for supporting life-stages, such as hatching and growth of young. The wet season is also when most erosion and deposition occurs due to the higher shear stress and sediment loads in the river.
Wet season flood volume
Floods:
dictate channel form
flush and deposit sediment and debris
promotes habitat diversity
support floodplains
distribute seeds
facilitate connectivity
control terrestrial encroachment.
Transition1 and Transition2 average daily volume
Dry-wet-dry transitions:
distribute sediments and nutrients flushed from the watershed
distribute seeds
support migration of adults and larvae
Transition 2 recession slope
Transition 2 recession shape refers to the speed at which the flows change from wet season flows to dry season flows. Under natural conditions this is usually a relatively gentle transition, but this can change with impoundments. If it is a very quick transition then there can be issue of bank collapse and/or stranding similar to those described for ‘within-day range in discharge’.
Flow changes in the dry and transition seasons are included as this when water resource
infrastructure has the potential to exert a large effect on water-level fluctuations. The Trishuli
Scenarios did not include consideration of peaking-power operations. Had this been
necessary then additional flow indicators linked to within-day range in discharge: Wet,
transition and dry seasons would also have been selected. Changes in water level over short
periods are important for a number of reasons:

10
the shear stress changes rapidly as flow rate changes affecting both the water surface slope
and the depth of the river. Thus conditions, for erosion but also for animals and plants,
change rapidly over this time, often to a point where they can no longer maintain their
position in the channel, resulting is wash-away.
rapid decreases flow can also lead to stranding of animals as flows recede from an area
quicker than the animals can respond.
as water levels decrease, riverbanks may not drain as quickly as the river recedes, leading
to an over pressuring within the banks that reduces bank stability.
Figure 3.3 Examples of annual time-series of a DRIFT flow indicator: average daily volume in
the dry season (showing four scenarios).

11
4 Life history considerations – Schizothorax richardsonii
Schizothorax richardsoni, which is locally known as the snow trout or Asla (together with
other Schizothorax species) is found in the rivers and streams of mountainous areas of the
Himalayas, India, Afghanistan and Nepal.
It is listed as Vulnerable in the IUCN Red Data List (www.iucnredlist.org). The justification
provided is: “Although S. richardsonii is widely distributed along the Himalayan foothills and
previous studies have indicated that it is abundantly and commonly found, recent
observations over the last 5 to 10 years indicate drastic declines in many areas of its range
due to introduction of exotics, damming and overfishing. While in some areas the declines are
more than 90%, the overall reduction is inferred to be less than 50% with similar rates
predicted in the future. The species is therefore assessed as Vulnerable. However, there is a
strong belief that if alien species introductions are carried out throughout its range, this
species may completely be displaced by exotic salmonids” (Vishwanath 2010).
S. richardsonii prefers to live among rocks and is primarily a bottom feeder, preferably near
big submerged stones. It is mainly herbivorous, feeding mainly on algal slimes, aquatic
plants and detritus, but also aquatic insect larvae encrusted on the rocks (Vishwanath 2010).
Asla has two spawning periods (March-April and October-November). It migrates from lakes
and rivers of the valley to the adjoining tributaries to find suitable places for breeding, mainly
in side streams or a side channels along the main river bed (Jhingran 1991; Welcomme 1985
and Sunder 1997).
A summary of key life history aspects of S. richardsonii is provided in Table 4.1.
Introduction of exotic salmonids, such as Rainbow Trout, in hill streams and reservoirs of the
Himalayan foothills are a serious threat to the survival of S. richardsonii. Fishing for
ornamental trade is also a threat in Nagaland and they are widely utilised as food (Vishwanath
2010).
4.1 Presence of S. richardsonii at EFlow Site 1 and 2 in winter
One of the key aspects of snow trout life history of relevance for this project is its temperature
tolerances. Some studies suggest that S. richardsonii will not be found in the upper reaches of
Himalayan rivers in the cold winter months (e.g., Shrestha 1990; Sivakumar 2008; Talwar and
Jhingran 1991) as it has a low tolerance for temperatures lower than 7-10oC (Shrestha and
Khanna 1976, http://nmcg.nic.in/BioFish.aspx). However, S. richardsonii was recorded in the
vicinity of EFlow Site 1 and 2 in this study (Kaasa, 2015), and in the EIA for the Upper
Trishuli-1 HEP (Approved EIA, Feb. 2013), in the winter at temperatures of ~7oC.

12
Table 4.1 Summary of key life history aspects of S. richardsonii
Habitat, food and temporal pattern
Juveniles Adults (non-breeding) Spawning
Information/data
References Information/data References Information/data References
Habitat and flow preferences
Description of habitat
- - Found in rivers and streams of mountainous areas of the Himalayas, India, Afghanistan and Nepal
Menon (1999); Sunder et al. (1999); Talwar and Jhingran (1991)
Clear water on gravelly/stony grounds or on fine pebbles (50-80 mm diameter)
Shrestha and Khanna (1976)
Altitude - -
In Trishuli River, snow trout abundant in the 1875 m-3125 mamsl zone and prefers rapid, pool and riffle types of habitats.
IUCN Red List of Threatened Species (Vishwanath, W.)
Substrate Stones and gravels
Raina and Petr (1999) Rocks and big submerged stones IUCN Red List of Threatened Species (Vishwanath, W.)
Developing eggs and larvae have been seen in semi-stagnant nursery beds along riverbanks interspaced with gravel and stones.
Raina and Petr (1999)
Depth <0.75 m Shrestha and Khanna
(1976) 1-3 m
http://nmcg.nic.in/BioF
ish.aspx 1-3 m
Shrestha and
Khanna (1976)
Velocity 0-2 m/s Shrestha and Khanna (1976)
2-8.4 m/s http://nmcg.nic.in/BioFish.aspx
2-8.4 m/s Shrestha and Khanna (1976)
Temperature 10-18 0C Shrestha and Khanna
(1976) 7.2-22 0C
http://nmcg.nic.in/BioF
ish.aspx 12-15 0C
Shrestha and
Khanna (1976)
Dissolved O2 6-8 mg/l http://www.fao.org/docrep/005/y3994e/y3994e0q.htm
6-8 mg/l http://www.fao.org/docrep/005/y3994e/y3994e0q.htm
10-15 mg/l Sunder (1997); Shrestha and Khanna (1976)
Food preferences Invertebrates, algae
Omnivorous and opportunist feeder. Mainly algae, fish and invertebrates
Shrestha (1990); Jhingran (1991)
n/a n/a
Additional information
Information/data References
Migration Snow Trout migrate upstream at the start of the monsoon season in March-April (gravel/pebble spawning and downstream at the end of this season in October-November for spawning
Shrestha (1990); Negi (1994); Talwar and Jhingran (1991)

13
Habitat, food and temporal pattern
Juveniles Adults (non-breeding) Spawning
Information/data
References Information/data References Information/data References
Triggers Breeding is triggered by snow melt and rise in turbidity. Fish move to breeding grounds in shallow side pools, side-channels and tributaries of the river with cobbles and gravely beds. Eggs hatch in this season, and fries and fingerlings remain in shallow waters in side channels
Jhingran (1991); Welcomme (1985); Sunder (1997)
Spawning behaviour
Snow Trout spawns when two years old, depending on food supply. Mature Asla has a change in colour during the breeding time. Mature males develop tubercles on either side of the snout, faint yellow colour of the body, and reddish colour of fins. Females spawn in natural as well as in artificial environments. S. richardsonii can spawn naturally or by stripping the wild/cultured mature female during the spawning season. It spawns in September/October and March/April.
http://www.fao.org/docrep/005/y3994e/y3994e0q.htm
Months Flow Conditions Fish Behaviour References
May/June Onset of flood
season
Snow Trout spawns in spring. By this time of the year, the fish eggs reach to its final stage of maturity provided the aquatic system provides sufficient food required for proper development of eggs. Once the eggs reach to their final stage of maturity, the fish is ready to spawn under various triggers like the snowmelt, rise in water temperature, comparatively higher turbidity level, swelling of rivers, creation of side channels etc. mainly linked with the monsoon rains and snow melt in the upper reaches of the Himalayan rivers
Negi (1994); Rafique and Qureshi (1997); Talwar
and Jhingran (1991)
October
November
Onset of winter
season
Snow Trout migrates downstream during winter as water temperatures decline in the upper reaches of the rivers, and may spawn again at this time. It is not found in the upper reaches of the rivers in the cold winter months
EF Assessment UT-1 HEP, ESSA, Nov. 2014; Shrestha (1990); Sivakumar (2008); Talwar and Jhingran (1991)

14
5 Ecosystem indicators
Ecosystem indicators are comprised of riverine components that respond to a change in river
flow (or sediment) by changing their abundance; concentration; or extent (area).
The focus of this assessment is S. richardsonii and so the ecosystem indicators selected to
capture the response to changes in water flow and longitudinal connectivity are limited to
those considered to be most influential in the life history of S. richardsonii. Thus, the
supporting ecosystem indicators focus on S. richardsonii habitat and food.
The ecosystem indicators and the reasons for selection are provided in Table 5.1.
Table 5.1 Ecosystem indicators
Discipline Indicators Reason for selection as indicators
Geo-morphology
Suspended sediment load Suspended load is important for creating and maintaining various habitats.
Exposed sand and gravel bars
Sand and gravel bars during provides habitat for invertebrates and fish.
Cobble and boulder bars provide habitat for invertebrates and fish. Exposed cobble and boulder bars
Median bed sediment size (armouring)
The average size of river bed sediment is an important habitat component for many fish species.
Area of secondary channels, back waters
Secondary channels and backwaters provide important instream habitat for many fish species. These slower velocity areas, usually with well-developed marginal vegetation, act as refugia for juvenile fish.
Algae Algae S. richardsonii feeds on algae and invertebrates
Macro- invertebrates
EPT abundance S. richardsonii feeds on algae and invertebrates
Fish Snow trout (S. richardsonii)
abundance
S. richardsonii is listed as Vulnerable in the IUCN Red Data List. It is widely distributed along the Himalayan foothills (India, Afghanistan, Pakistan, Nepal), but drastic declines have been recorded over the last 5 to years in many areas of its range due to:
introduction of alien species,
damming, and
overfishing.
Each indicator is linked with other indicators deemed to driving change. The aim is not try to
capture every conceivable link, but rather to restrict the linkages to those that are most
meaningful and can be used to predict the bulk of the likely responses to a change in the
supply of water, sediment or longitudinal connectivity.

15
6 Ecological Status
The scores and descriptions for Ecological Status categories are provided in Table 6.1.
Table 6.1 Categories for Baseline Ecological Status (after Kleynhans 1997)
Ecological category
Description of the habitat condition
A Unmodified. Still in a natural condition.
B Slightly modified. A small change in natural habitats and biota has taken place but the ecosystem functions are essentially unchanged.
C Moderately modified. Loss and change of natural habitat and biota has occurred, but the basic ecosystem functions are still predominantly unchanged.
D Largely modified. A large loss of natural habitat, biota and basic ecosystem functions has occurred.
E Seriously modified. The loss of natural habitat, biota and basic ecosystem functions is extensive.
F
Critically / Extremely modified. The system has been critically modified with an almost complete loss of natural habitat and biota. In the worst instances, basic ecosystem functions have been changed and the changes are irreversible.
6.1 Baseline Ecological Status of the EFlows sites
The Baseline Ecological Status (BES) used for the Trishuli River in this assessment is
summarised in Table 6.2.
Table 6.2 BES of the EFlows sites on the Upper Trishuli River at 2016.
Discipline 1 2 3
Geomorphology A/B A/B A/B
Algae B B B
Macronvertebrates A/B A/B A/B
Fish B B B
Overall BES B B B

16
7 Response curves
The response curves do not address any of the scenarios directly. The curves are drawn for a
range of possible changes in each linked indicator, regardless of what is expected to occur in
any of the scenarios. For this reason, some of the explanations and/or X-axes refer to
conditions that are unlikely to occur under any of the scenarios but are needed for completion
of the Response Curves. In addition, each response curve has a shape that assumes that all
other conditions (indicators) remain at baseline.
The relationships are similar across all areas, although the actual curves may differ slightly
from what is shown here. For the exact relationship used for each focus area please refer to
the DSS. The focus area used as an example is denoted in the caption.
The response curves relationships used for this assessment were not derived specifically for
the assessment for the Upper Trishuli River. They were derived for Alwan Snow Trout in
similar Himalayan river (the Neelum-Jhelum River) and used in this assessment. Links to
sediment supply were excluded from the DSS because the EFlows team was assured by the
Client that the sediment regime upstream and downstream of Upper Trishuli HEP would
remain at baseline levels. Rainbow Trout were also excluded from the assessment. This was
because there were no curves for rainbow trout for the Neelum-Jhelum, and because rainbow
trout in the study area are escapees from nearby trout farms.
The linked indicators, the response curves and the explanations of the shape of the response
curves for each of the indicators, using Site 2 as an example, are tabulated as follows:
Table 7.1 Exposed sand and gravel bars
Table 7.2 Exposed cobble and boulder bars
Table 7.3 Median bed sediment size
Table 7.4 Area of secondary channels and backwaters
Table 7.5 Algae
Table 7.6 EPT (Ephemeroptera, Plecoptera and Trichoptera)
Table 7.7 Snow trout - S. richardsonii.
Table 7.1 Exposed sand and gravel bars
Linked indicator and response curve Explanation
During the dry season when sediment levels are low, finer sediment is scoured from the active channel, leading to a slow loss of sand/gravel bars. The longer the dry season, the more erosion of bars will occur.

17
Linked indicator and response curve Explanation
Longer wet seasons mean a longer period of high flows with relatively lower sediment loads (in this river observed data suggest that the peak sediment loads generally occur early in the wet season, prior to peak discharge). Thus longer wet seasons may mean greater erosion (widening/deepening) in the main channel, causing some reduction of sand/gravel.
Larger floods are associated with higher sediment loads, and with widespread channel instability and reworking of the channel bed and banks. Large floods will thus introduce more sediment and create more sand/gravel bars during the flood season (which can be exposed as sand/gravel bars during the dry season).
Lower flows mean that more bars will be exposed.
Table 7.2 Exposed cobble and boulder bars
Linked indicator and response curve Explanation
Longer wet seasons mean a longer period of high flows with relatively lower sediment loads (in this river observed data suggest that the peak sediment loads generally occur early in the wet season, prior to peak discharge). Thus longer wet seasons may mean greater erosion (widening/deepening) in the main channel, with some potential loss of cobble bars.
Very large floods tend to redistribute sediments across the channel, and in rivers with a cobble matrix these events should enlarge existing and create additional bars. Very small floods may not overcome thresholds to redistribute bed sediments across the valley floor, allowing bars to over time be incorporated in to the bank.
Lower flows mean that more bars will be exposed
18
Table 7.3 Median bed sediment size
Linked indicator and response curve Explanation
Larger floods are associated with higher sediment loads, and with widespread channel instability and reworking of the channel bed and banks. Large floods will thus reset the channel sediments, resulting in overall finer average bed sediment conditions.
The lower the dry season discharge, the more fines that can deposited on the channel bed and thus the smaller the mean bed sediment size will become. The higher the dry season discharge, the more fines that will be removed and the coarser the (now armoured) channel bed will become.
Table 7.4 Area of secondary channels and backwaters
Linked indicator and response curve Explanation
During the dry season when sediment levels are low, the active channel bed slowly erodes, increasing capacity and leading to a slow abandonment of secondary channels. The longer the dry season, the more secondary channel abandonment will occur. This process will be exacerbated by reductions in sediment from upstream dams.
longer wet seasons mean a longer period of high flows with relatively lower sediment loads (in this river observed data suggest that the peak sediment loads generally occur early in the wet season, prior to peak discharge). Thus longer wet seasons may mean greater erosion (widening/deepening) in the main channel, causing some loss of secondary channels.
Very large floods will overwiden the channel and erode areas for secondary channels to form. Very small/failed floods may not be able to counteract channel narrowing of the low flow season.
The higher the average dry season flows, the more secondary channels will remain active during the low flow season (and thus available for instream biota).

19
Table 7.5 Algae
Linked indicator and response curve Explanation
Longer dry season - more time for algae to become established and temperatures also favourable towards the end of the dry season.
Lower discharge - calmer conditions, better for algae, to a point. At 0 cumecs the river will freeze.
Lower peak flows and warm conditions will favour algae growth. Higher turbidity and currents will adversely affect the population.
The more stable (armoured) the bed, the greater
the flows necessary to remove algae.
Table 7.6 EPT (Ephemeroptera, Plecoptera and Trichoptera)
Linked indicator and response curve Explanation
Aquatic invertebrates have life-histories that are adapted to wide variations in seasonal flows, but populations are likely to drop slightly if the low-flow period is too long. A longer period of low-flows is also likely to increase the risks of mortality as a result of high water temperature once the seasons change.
With less discharge there is less wetted area.


