Environment Mapping - UNDP-UNEP Poverty-Environment Initiative
81
Republic of Rwanda United Nations Development Programme Pilot Project on Poverty- Environment Mapping (Phase II) Poverty- Environment Indicators and Policy Options for Possible Intervention under the PRSP Final Report Prepared by: Ahmed GARADI, GIS Specialist Charles TWESIGYE – BAKWATSA, Policy Analyst June, 2005
Transcript of Environment Mapping - UNDP-UNEP Poverty-Environment Initiative

Republic of Rwanda United Nations Development Programme
Pilot Project on Poverty- Environment Mapping
(Phase II)
Poverty- Environment Indicators and Policy Options for Possible Intervention under the PRSP
Final Report
Prepared by:
Ahmed GARADI, GIS Specialist Charles TWESIGYE – BAKWATSA, Policy Analyst
June, 2005

Table of Contents
Table of Contents................................................................................................................ 2 Acronyms and Abbreviations ............................................................................................. 3 RWANDA BASIC SOCIAL AND ECONOMIC INDICATORS ..................................... 4 ACKNOWLEDGEMENTS................................................................................................ 5 EXECUTIVE SUMMARY ................................................................................................ 6 1.0 INTRODUCTION ................................................................................................. 12 1.1 Context, Objectives and Outputs .......................................................................... 12 1.2 Rationale for the Poverty- Environment Mapping Excise.................................... 13 1.3 The Concept of PEM and Recent Developments in P-E Indicators ........................... 14 1.4 Case Studies on Successful Applications of Poverty-Environment Maps.................. 16 1.5 Methodology in the PEM Phase II.............................................................................. 17 2.0 COUNTRY POVERTY- ENVIRONMENT PROFILE............................................. 19 2.1. State of the Biophysical Environment ....................................................................... 19 2.2 Socioeconomic and Demographic Characteristics...................................................... 20 2.3 Rwanda’s Poverty Characteristics .............................................................................. 24 2.4 Poverty – Environment Linkages in Rwanda ............................................................. 25 3.0 POVERTY–ENVIRONMENT INDICATORS AND THE PRSP PROCESS .......... 29 3.1. Current Policy thrusts ................................................................................................ 29 3.2 Data Availability and Monitoring of Poverty – Environment Indicators ................... 38 3.2.1 General ..................................................................................................................... 38 3.2.2 Existing Methodology for Data Collection on Indicators........................................ 38 3.2.2 Data Availability for Poverty-Environment Indicators............................................ 39 4.0 CURRENT POLICY AND INSTITUTIONAL INITIATIVES................................. 43 4.1 Analysis of the Current Policy Responses .................................................................. 43 4.2 Current Planned Policy Actions in the Energy Sector ................................................ 49 4.3 Ongoing Interventions ................................................................................................ 51 5.0 POVERTY-ENVIRONMENT ZONES AND PROPOSED POLICY OPTIONS ..... 52 5.1 Poverty – Environment Zones and Proposed Interventions........................................ 52 5.2 Proposed Policy Options............................................................................................. 53 5.3 Implementation modalities.......................................................................................... 64 6.0 CONCLUSIONS, MAJOR CHALLENGES AND THE WAY FORWARD............ 66 6.1. Summary and Conclusions ........................................................................................ 66 6.2 Major Challenges ........................................................................................................ 67 6.3 The Way Forward ....................................................................................................... 68 7.0 List of References ....................................................................................................... 70 Annexes............................................................................................................................. 72
2
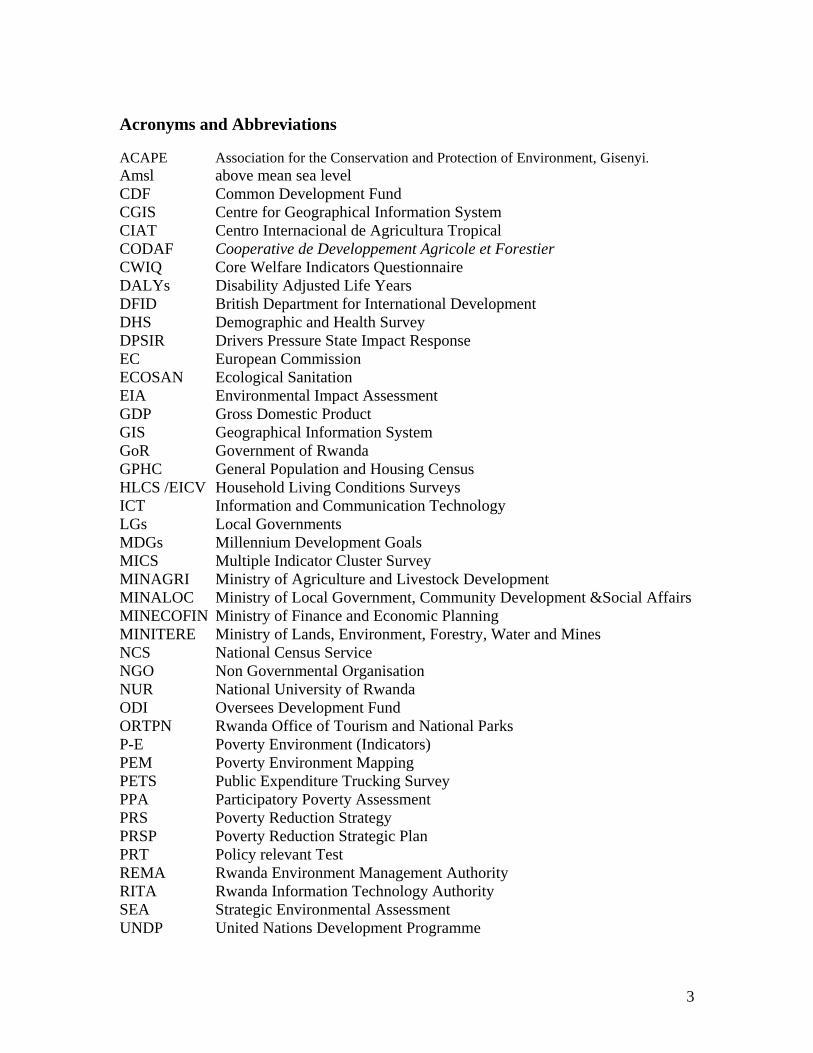
Acronyms and Abbreviations ACAPE Association for the Conservation and Protection of Environment, Gisenyi. Amsl above mean sea level CDF Common Development Fund CGIS Centre for Geographical Information System CIAT Centro Internacional de Agricultura Tropical CODAF Cooperative de Developpement Agricole et Forestier CWIQ Core Welfare Indicators Questionnaire DALYs Disability Adjusted Life Years DFID British Department for International Development DHS Demographic and Health Survey DPSIR Drivers Pressure State Impact Response EC European Commission ECOSAN Ecological Sanitation EIA Environmental Impact Assessment GDP Gross Domestic Product GIS Geographical Information System GoR Government of Rwanda GPHC General Population and Housing Census HLCS /EICV Household Living Conditions Surveys ICT Information and Communication Technology LGs Local Governments MDGs Millennium Development Goals MICS Multiple Indicator Cluster Survey MINAGRI Ministry of Agriculture and Livestock Development MINALOC Ministry of Local Government, Community Development &Social Affairs MINECOFIN Ministry of Finance and Economic Planning MINITERE Ministry of Lands, Environment, Forestry, Water and Mines NCS National Census Service NGO Non Governmental Organisation NUR National University of Rwanda ODI Oversees Development Fund ORTPN Rwanda Office of Tourism and National Parks P-E Poverty Environment (Indicators) PEM Poverty Environment Mapping PETS Public Expenditure Trucking Survey PPA Participatory Poverty Assessment PRS Poverty Reduction Strategy PRSP Poverty Reduction Strategic Plan PRT Policy relevant Test REMA Rwanda Environment Management Authority RITA Rwanda Information Technology Authority SEA Strategic Environmental Assessment UNDP United Nations Development Programme
3
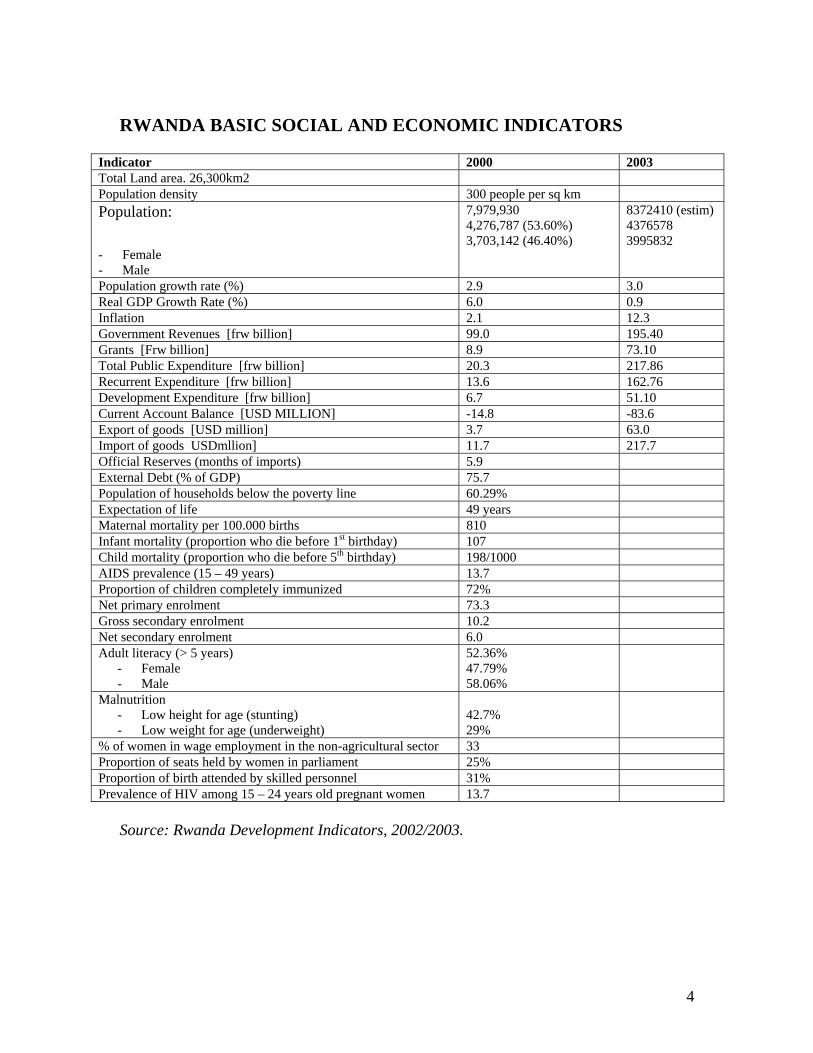
RWANDA BASIC SOCIAL AND ECONOMIC INDICATORS
Indicator 2000 2003 Total Land area. 26,300km2 Population density 300 people per sq km Population:
- Female - Male
7,979,930 4,276,787 (53.60%) 3,703,142 (46.40%)
8372410 (estim) 4376578 3995832
Population growth rate (%) 2.9 3.0 Real GDP Growth Rate (%) 6.0 0.9 Inflation 2.1 12.3 Government Revenues [frw billion] 99.0 195.40 Grants [Frw billion] 8.9 73.10 Total Public Expenditure [frw billion] 20.3 217.86 Recurrent Expenditure [frw billion] 13.6 162.76 Development Expenditure [frw billion] 6.7 51.10 Current Account Balance [USD MILLION] -14.8 -83.6 Export of goods [USD million] 3.7 63.0 Import of goods USDmllion] 11.7 217.7 Official Reserves (months of imports) 5.9 External Debt (% of GDP) 75.7 Population of households below the poverty line 60.29% Expectation of life 49 years Maternal mortality per 100.000 births 810 Infant mortality (proportion who die before 1st birthday) 107 Child mortality (proportion who die before 5th birthday) 198/1000 AIDS prevalence (15 – 49 years) 13.7 Proportion of children completely immunized 72% Net primary enrolment 73.3 Gross secondary enrolment 10.2 Net secondary enrolment 6.0 Adult literacy (> 5 years)
- Female - Male
52.36% 47.79% 58.06%
Malnutrition - Low height for age (stunting) - Low weight for age (underweight)
42.7% 29%
% of women in wage employment in the non-agricultural sector 33 Proportion of seats held by women in parliament 25% Proportion of birth attended by skilled personnel 31% Prevalence of HIV among 15 – 24 years old pregnant women 13.7
Source: Rwanda Development Indicators, 2002/2003.
4

ACKNOWLEDGEMENTS We would like to thank the UNDP for giving us the opportunity to undertake this important and intellectually interesting project. We can only hope for more opportunities in the future. In particular, Arnaud Comolet and Joseph Opio-Odongo, the Regional Environmental Policy Advisors and Laurent Rudasingwa, Programme Specialist and Head of the Livelihoods Unit in UNDP Kigali are most gratefully acknowledged for their facilitation and support. We must acknowledge that the lively discussions with Joseph Opio-Odongo were insightful and particularly enriched this final version of the report. In the same measure, we are grateful to Ernest Rwamucyo, the Director of the Strategic Planning and Poverty Monitoring (SPPMD) in MINECOFIN, for the interest he showed in the project and for the support including availing us office space and facilities in MINECOFIN. We would also like to express our sincere thanks to Maxilien Usengumuremyi of the SPPMD, MINECOFIN and Innocent Bizimana of MINITERE, who, as our Government counterparts, worked closely with us especially in analyzing policy issues, in gathering data and in making appointments during the execution of this assignment. Naphtali Nyandwi and Didier Gakuba of SPPMD provided interesting photographs depicting some of the poverty-environment situations and response interventions. Finally, we would like to express our utmost gratitude to the leadership and technical personnel in the ministries and agencies across the Rwanda Government and other agencies, who availed us valuable information without which this assignment would not have been accomplished.
5

EXECUTIVE SUMMARY Introduction
General Context and Objectives
This report presents the poverty–environment indicators and policy options for addressing poverty-environment concerns in Rwanda, and is based on the Poverty-Environment Mapping (PEM) and interface of the GIS mapping with policy analysis undertaken during December 2004 and March 2005. The assignment was part of the UNDP’s Poverty Environment Initiative (PEI) coordinated by the Sub Regional facility for Central and Eastern Africa (SURF-CEA), Nairobi and the Sustainable Livelihoods Unit of UNDP Kigali. This exercise was a follow-up to an earlier phase I commissioned to test the feasibility of PEM in Rwanda and undertaken by the GIS Centre of the National University of Rwanda.
The overall objective of this exercise was to improve poverty-environment monitoring and evaluation, through strengthening the capacity of government and civil society to monitor environmental changes and how they affect the poor; and integrating poverty-environment indicators into national poverty monitoring systems and poverty-environment policy formulation and implementation.
The Concept of Poverty–Environment Mapping and Rationale for application in Rwanda
The Poverty–Environment Mapping (PEM) concept is rooted in the global debate on poverty reduction and sustainable development especially since the Earth Summit in 1992. But the recent explorative studies of linking poverty and environment have brought more insight in appreciating how poverty and environment are interlinked, but interestingly how poor people often fall victim of environmental degradation. The current thinking underpinning the poverty-environment initiatives is two-way:
• that poor people often make decisions on limited information to exploit their environmental resources for livelihoods, and when faced with environmental disasters, they have limited options compared to the well-off who have several alternatives at their disposal; and
• that very often the poor are not the main degraders of the environment as had been widely believed, but often fall victims of environmental degradation because of their dependency on environmental resources; are vulnerable to environmental health diseases resulting from pollution; are more vulnerable to environmental disasters such as floods and lands.
The recent initiatives of the UNDP, World Bank, the British Department for International Development (DFID), European Commission, and recently UNEP in exploring the links between poverty and environment, have demonstrated the link between poverty and environment using spatial analytical techniques (GIS mapping) and inspired the process of mainstreaming environmental issues into the development process, especially in developing countries who twin challenges of eradicating poverty and ensuring sustainable environmental management. For most of these countries (e.g. Rwanda) the poverty reduction strategies (PRSs) are the main development frameworks, and are thus, the target of mainstreaming environmental issues. To mainstream environment into PRSP monitoring, however, required development of P-E indicators to monitor the changes in PE linkages and corresponding responses at policy / programme, community and household level.
6

Poverty-environment indicators are mainly categorized into: Natural resource indicators, which relate to livelihoods and dependency on natural resources; Environmental health indicators that address the vulnerability of poor people to environmental related diseases i.e. caused by pollution of the air, water and other aspects of the environment, and exposure to disease causing pathogens; Vulnerability to natural disasters, i.e. how the poor are affected by natural and man-made disasters like floods, landslides, volcanic eruptions, droughts; and sometimes Poverty – housing indicators, that monitor the housing conditions of poor people and how they affect or are affected by their poverty situation.
This pilot project has demonstrated that P-E indicators and P-E maps are critical for Rwanda’s poverty reduction monitoring, considering its high dependence on natural resources and that most poor people inhabit fragile areas (steep hills, arid areas, wetlands), where they are exposed to landslides, persistent droughts, floods and occasionally volcanic eruptions.
In this domain, the PEM, which involves thematic and spatial desegregation of poverty–environment issues and indicators, introduces the spatial dimension to poverty monitoring and helps to analyse how the poor interact with the environment (e.g. where are the poor, what is the state of the environment?..). Across many developing countries, PEM is becoming an important tool in planning and implementing poverty reduction programs. Poverty – environment maps, for instance, can help analyse and present the poverty – ecosystems relationships and improve targeting of public investments by identifying where the neediest populations are located, and in effective planning and delivery of emergency response aid programmes (e.g. epidemics, food aid, environmental disasters, etc).
Although under the UNDP Poverty-Environment Initiative (PEI), Rwanda is among the first countries to undertake PEM, poverty – environment maps have been applied elsewhere in areas related to poverty and environment. For instance, in South Africa’s KwaZulu Natal, PE maps were used to contain the cholera epidemic while in Ecuador, it was used in assessing food security. PEM is also currently being piloted in Tanzania under the PEI initiative. In all these applications, PEM has proved to be a useful tool not only for analysis and presentation of poverty-environment concerns but also as an advocacy tool to raise awareness or bring to the attention of policy makers and planners to the major poverty related environmental issues.
Tasks and Methodology
The assignment had two main tasks: GIS mapping to complete the prototype; and policy analysis and interfacing the GIS with the policy responses, to generate a directory of poverty-environment zones and suggest policy options for addressing them.
For the GIS mapping, the consultants used spatial data the National University of Rwanda Centre for GIS (NUR-CGIS), Land Cover data from MINITERE database developed under the FAO Africover project, and from discussions with various policy makers and planners in Government Ministries and other agencies. Recent population data was obtained from the National Census Service but this could not be integrated with the spatial information because of compatibility problems. In generating P-E indicators, genetic indicator sets developed in previous initiatives of the World Bank, DFID, UNDP and others, have been used and adapted to the local Rwandan situation.
Maps for different thematic issues (poverty, ecosystem, population density, etc) were overlayed to analyse the interface between poverty and environment and identify the poverty-environment hotspots. The linkages between poverty and environment were analysed in a cause-effect
7

relationship using the Driver-Pressures-State-Impact–Response (DPSIR) model, and a range of policy options identified. Simulation of the different policy scenarios was then undertaken to identify the impact of implementing such options on poverty and the environment.
The Biophysical Environment and Socioeconomic characteristics Rwanda is renowned for its hilly terrain, and was befittingly described as “a land of a thousand hills”. Its characterized by a diverse relief ranging from hilly volcanoes and mountain forest climate in the North and North West, as high as 4500 metres amsl to as low as 900 metres above mean sea level (amsl) in the East and South East. In terms of drainage, Rwanda is naturally endowed with a good drainage system, being sandwiched between the Congo and Nile basins, and this explains why most valleys are usually wet. This spatial differentiation in the natural environment over time influenced the settlement patterns and livelihood strategies among the Rwandan communities, and underscores the extent to which the changing environment has influenced the welfare and livelihoods of the poor households in Rwanda. Traditionally, the country experienced fairly stable climatic and temperature regimes which enabled 2 crop seasons. There are, however, increasing signs of prolonged drought, creating situations of food insecurity and poverty. In regard to demography, the August 2002 census put Rwanda’s population at 8.12 million of whom 52.3% were female, and 83% categorized as rural. The population is predominantly young with 67% of the people below 25 years. The population density and growth rates are among the highest in Africa (at 321 persons per sq. km and 3.1% respectively). In terms of socioeconomic development, Rwanda’s economy is predominantly agrarian, with more than 80% of the population deriving their livelihoods from agriculture. Most of the production, however, is done by smallholder farmers, who own small plots. On the whole, the Rwandan population is heavily dependant on natural resources, but the main concern is that the pressure exerted on the natural resource base is high, which presents serious challenges for poverty reduction and sustainable development. The Linkage between the PRSP and the Environment Rwanda’s economic development process is largely hinged on natural resources (agriculture, tourism,). More than 80% of the population are employed in the agricultural sector. Indeed agricultural transformation and rural development are enlisted as priority areas in the PRSP alongside human development; economic infrastructure; good governance; private sector development; and institutional capacity-building. Besides, the emerging sectors like tourism, which currently earns a significant proportion of the country’s foreign exchange, are natural resource based. Thus, there is a strong linkage between poverty, economic development and environment, and as such, integrating poverty–environment indicators into poverty monitoring activities is critical to Rwanda’s poverty reduction and sustainable development. Despite the wide recognition that sound environmental management is critical to achieving the PRSP objectives and the Millennium Development Goals (MDGs), there have been little efforts to incorporate environmental indicators into the PRSP monitoring process to-date. It is, nonetheless, observed that mechanisms are being worked out to incorporate environmental issues
8

into the next PRSP. The new policy and organic law on environment and the establishment of the Rwanda Environment Management Authority (REMA) constitute important progress towards mainstreaming environment into development processes. Data Availability for Monitoring of Poverty – Environment Indicators
This pilot project has found that the wide range of methodologies currently used for monitoring poverty indicators under the PRSP can be easily adjusted to include P-E indicators. For many indicators, data in fact exists but often is often inconsistent. Based on generic P-E indicator sets developed in previous records and the indicators currently used in PRSP monitoring, this study has developed a set of P-E indicators relevant for Rwanda (see table 2). These could be reviewed as more issues arise and as capacity for data collection and analysis is developed.
Major Poverty-Environment Concerns and Current Policy Interventions
The interface between high population density and a severely degraded and fragile ecosystem have resulted into serious challenges for poverty reduction and sustainable development in Rwanda. The most critical P-E pressures which should be addressed in the PRSP include:
(i) the expanding land for settlement and agricultural production – causing deforestation and destruction of watershed resulting in water and fuel crisis;
(ii) intensive farming – has resulted in severe and accelerated soil erosion and siltation of water bodies and eventually reduced water volume and disrupted power generation;
(iii) irrational use of land resources – land fragmentation and settlement due to customary legacies that encouraged land fragmentation and scattered settlements. These scattered housing structures have the added effect of escalating rain water runoff, which has further worsened the problem of gully erosion, more pronounced in urban areas like Kigali city.
(iv) increasing urbanization in unplanned manner, which has escalated the emergence of
slum areas and the inadequate capacity of urban local authorities to provide essential social services to the increasing population of urban poor.
The principal driver of these problems is the unprecedented population growth rates with low levels of human development and technological applications and inadequate planning capacity, amidst a declining resource base. The GoR and its development partners now recognize that the population pressure on natural resources has reached deplorable levels and environmental crises are evidently affecting critical sectors like energy, water and agriculture. Identified P-E Zones and Recommended Policy Options This study has clustered P-E zones into mainly four, and the main criteria followed related to the spatial differentiation of the ecosystem, the socioeconomic characteristics and differentiation in infrastructure development which have influenced the livelihood strategies and approaches. The matrix of the P-E zones and the P-E concerns and recommended interventions are presented in section 5.1. Proposed Policy Options and Interventions To address the poverty-environment concerns above, a number of policy options are recommended:
9
Interventions to protect the asset base of the poor: these relate to conservation of existing forests and wetlands; investing in soil erosion control; and reviewing the legal and regulatory framework to safeguard access and ownership of land, markets and other economic assets of the poor people. Such reforms would of course take into consideration the wider national interests of conservation.
Investing in areas that increase or diversify livelihood opportunities for the poor: these mainly relate to intensive, technology based agricultural production; and expanding off-farm employment opportunities so as to decongest the agricultural production given the crisis of agricultural land. Interventions proposed include, among others, providing productive skills for young people to participate in the knowledge economy and expanding services like tourism; and increasing choices of the poor.
Promoting collaborative natural resource management and co-investing with the poor: empowering local communities to participate in decision making regarding conservation and management of natural resources will promote equity and ensure sustainability. In addition, co-investing with the poor in social and economic services is important to address concerns of access and optimize their participation in the economy. Recommended areas for public-private-community partnership include: eco-tourism; urban water and sanitation services to poor areas; and solid waste management.
Promotion of infrastructure and technology: there is need to allocate public resources to appropriate technology applications in agriculture; water and sanitation; and energy, to promote environmentally sound development.
Compensate the poor for their investments in environmental conservation: this will entail developing some incentives that encourage people to invest their time, labour and resources in environmental conservation while improving livelihoods.
Improve the local planning systems to make them pro-poor: strengthening local institutions to assist to empower local communities to participate in local government decision making and making choice.
Major Challenges, Conclusions and the Way forward
Major Challenges
The PEM pilot has revealed a lot of potential options for mainstreaming environmental issues but the process faces a number of challenges:
• inadequate sectoral coordination; • inadequate human resource and institutional capacity particularly for policy analysis and
information management; • Securing sufficient and sustainable funding for regular poverty-environment monitoring
and reporting remains a serious challenge for timely and accurate information gathering and reporting.
• There is also a challenge of using information in decision making – appreciation of the need for statistical information to make decisions is low, and this makes demand for information at decision making level low.
Conclusions The PEM pilot project has demonstrated that poverty-environment mapping is critical to the PRSP process, and that it is an effective tool for integrating environmental issues and concerns into the PRSP monitoring, sectoral and decentralized plans. There is appreciation
10

that the P-E Indicators and P-E maps provide a more practical and effective approach for analyzing poverty-environment issues and that PEM is an effective advocacy tool for mobilising resources, targeting resources to the hotspots of poverty and environment. There are, however, concerns for inadequate capacity at all level which could limit the applications of PEM. A lot of information, including spatial geo-referenced data, exists but is scattered in various institutions; is often not easily disaggregated to sub-national levels and is difficult to integrate. The fact that such data is not easily accessible to many users is the cost of uncoordinated efforts, working in isolation and using different methodologies, etc. Critical decision making information such as on access to safe water; food security; and susceptibility to environmental health problems like cholera; is lacking, and these undermine rational decision making with regard to planning, priority setting and resource allocation. There is potential for cost-effective collection of data and monitoring of P-E indicators at local level if appropriate linkages are developed between the centre, the local government and grass root structures (CDCs, local environment committees, CBOs, etc). Finally, many of the policy interventions recommended are reflected in sectoral policies and ongoing projects. There is, however, need to refocus such initiatives to clearly link poverty and environment issues for more effective monitoring.
The Way forward entails the following:
There is urgent need for mechanisms to mainstream environmental indicators into the PRSP process and sectoral strategies and plans, and the prototype and the poverty-environment policy options developed under this pilot project are key instruments. Appropriate mechanisms should be put in place to coordinate initiatives, which are scattered in various institutions. In the context of the PRSP, the recently established Environmental Mainstreaming Taskforce should be supported to take up this role but active participation of the Ministry of Finance and Economic Planning; and key sector ministries such as with the portfolio of agriculture and livestock; energy, infrastructure and water, should be enlisted. There is need to harmonise data collection procedures and standardize information management protocols to ensure effective monitoring, and encourage information sharing among actors. There is need to develop capacity for policy analysis, database management including spatial information management; and monitoring of poverty-environment indicators at all levels to ensure effectiveness and efficiency. Finally, the PRSP reporting system needs to be reviewed to reflect actual progress made with quantitative indicators and the information disaggregated to analyse regional disparities.
11

1.0 INTRODUCTION
1.1 Context, Objectives and Outputs This report presents the poverty–environment indicators and policy options arising out of the Poverty-Environment Mapping (PEM) exercise phase II, which was part of the Poverty Environment Initiative (PEI) to mainstream environmental issues into Rwanda’s Poverty Reduction Strategy (PRS) process. This pilot project was commissioned by the UNDP to test the feasibility of PEM under the global PEI programme. This phase II of PEM follows an earlier Phase I mapping of poverty-environment problems undertaken by the GIS Centre of the National University of Rwanda (NUR), Butare, which produced a poverty-environment map. During phase I, the mapping exercise clustered and characterized the main poverty-environment issues in Rwanda. On the basis of the results of phase I and the overwhelmingly positive response from the Rwanda Government authorities, policy makers and planners, this phase II was designed with the overall objective of improving poverty-environment monitoring and evaluation, with the ultimate goal of:
(a) strengthening the capacity of government and civil society to monitor environmental changes and how they affect the poor; and
(b) integrating the poverty-environment indicators into national poverty
monitoring systems, as well as poverty-environment policy formulation and implementation.
Under the present phase II, the following activities have been undertaken:
(a) completed the Poverty-Environment Mapping prototype for Rwanda by collecting and validating additional information; testing the reliability of the data; and running demonstrations with selected Government officials (mainly in environment, energy, Finance and Economic Planning);
(b) analysis of the interface between the Poverty-Environment Mapping and decision making process i.e. policy responses/ interventions;
(c) in-depth analysis of the policy options to address the Poverty-Environment issues; and on this basis;
(d) prepared a directory of Poverty-Environment Policy Options.
These outputs have been produced and are reflected in chapters four and five. On the final directory of poverty-environment clusters and the corresponding appropriate policy options recommended, it is suggested that these could be subjected to further discussions with different stakeholders including civil society.
12

It was hoped that through this exercise, considerable capacity would be developed in Government (i.e. targeted policy makers and planners in MINITERE and MINECOFIN). It is the view of the consultants that some considerable capacity has been developed in poverty-environment policy analysis, and in managing the spatial information system on poverty-environment issues. Most importantly, however, the exercise has generated high appreciation, across government, of the need to mainstream environment into the poverty reduction strategy process and specifically use of poverty-environment indicators.
1.2 Rationale for the Poverty- Environment Mapping Excise The Government of Rwanda (GoR) recognizes, in the current poverty reduction strategy (PRS), that the poverty reduction goals can not be achieved without promoting sound and sustainable environmental management, and recognises the high dependency of the population on environmental resources. Integrating environmental issues into the PRSP is the main mechanism in which the GoR can demonstrate its commitment to the Millennium Development Goals (MDGs) but especially MDG 7 on ensuring environmental sustainability. Under the current PRSP, however, there is generally agreement, even at policy level, that little has so far been done to integrate environmental concerns into the sectoral strategies and programmes, despite efforts in promoting sound environmental management projects. Nonetheless, important lessons have been learnt from recent disasters, and this has generated a considerable level of commitment to mainstreaming environmental issues into the next PRSP. In this regard, the ongoing PRSP review process provides opportunity to integrate environmental indicators into the process, and as such, this poverty-environment mapping has been undertaken at an opportune moment.
The imminent environmental and related poverty challenges that the Government and people of Rwanda currently face, notably deforestation, water and energy crisis; soil erosion and declining agricultural productivity; as well land shortage and resettlement; make the mapping of Rwanda’s poverty-environment issues and concerns and integrating them into the national poverty monitoring system, more important than at any time in history. It has been argued that given the centrality of environmental resources in the livelihoods of the Rwandan people, PEM is an appropriate tool in a number of ways:
• conducting spatial analysis of the poverty-environment issues and present the analytical work in maps, which are simpler and more comprehensible to policy makers;
• allows a graphical interface of poverty-environment issues with the policy making process, so that the impact of policy responses on the PE nexus can be assessed and appropriate policy decisions made.
13

• importantly for the new environmental policy, the outcomes of the PEM i.e. poverty-environment maps would constitute important tools, first in advocacy to mobilize and ensure better resource allocation to areas where there are high negative impact of the poverty and environment interaction, and secondly for sensitization of stakeholders at all levels.
Within the framework of the PRSP, PEM is expected to enhance sectoral coordination of information generation and analysis for poverty monitoring, which is currently one of the most critical challenges in Rwanda’s PRSP process, and to facilitate mainstreaming environmental issues into the PRS process (targeting sectoral strategies, project interventions and decentralized planning processes), which are being undertaken with support from various donor interventions.
1.3 The Concept of PEM and Recent Developments in P-E Indicators
The Poverty–Environment Mapping (PEM) concept has emerged from the recent explorative studies of linking poverty and environment, mainly to appreciate how poverty impacts on the environment, and how the degraded environment in turn impacts further on the poor. The current thinking emerging out of these studies and debates is that poor people often make decisions on limited information to exploit their environmental resources for livelihoods, and when faced with environmental disasters, as is frequently the case, they have limited options which may lead to degrading their environment. This situation in turn affects their welfare and further exacerbates their poverty situations. The well-to-do, on the other hand, tend to have a range of alternatives which shape their decisions in natural resource use, but may also influence them to utilize environmental resources inefficiently, thereby degrading the environment that negatively affects the poor most. The works of the UNDP, World Bank, the British Department for International Development (DFID), European Commission, and recently UNEP in exploring the links between poverty and environment, have created a basis and approach to mainstream environmental issues into the development process and particularly the poverty reduction strategies (PRSPs). This necessitated the development of the PE indicators to monitor the changes in PE linkages and corresponding responses at policy / programme, community and household level. Various authors e.g. DFID, 2001, have categorized the poverty-environment indicators into four:
(i) Poverty – natural resource indicators: these indicators measure the
extent to which poor people depend on natural resources, and how the decline in the quality and quantity of natural resources affects the poor. ODI broadly defines a poverty- natural resource indicator as one “which changes when better management of natural resources leads to decline in poverty”.
14

The main poverty issues measured by these indicators relate to incomes; opportunities lost (e.g. impact of shortage of fuel wood or water on women’s health and time, impact on children’s education); and food security.
(ii) Poverty–environmental health indicators: these relate to vulnerability of the poor to diseases caused by pollution of the air, water and other aspects of the environment, and exposure to disease causing pathogens.
(iii) Poverty – vulnerability to natural disasters: relates to how the poor
are affected by natural and man-made disasters like floods, landslides, volcanic eruptions, droughts. These disasters affect the poor through loss of incomes/ livelihoods, as a result of displacement or destruction of property, among others.
(iv) Poverty – housing indicators: these measure the housing conditions of
the poor people and how they affect or are affected by their poverty situation. These indicators are closely related to environmental health, but for Rwanda, they are critical and discussed separately because of the housing problems and the need to monitor the impact of new housing settlement innovations such as Imidugudu (grouped settlements).
As shown in the proceeding chapters, most of these indicators are relevant for Rwanda’s poverty, but natural disasters are less frequent and not as disastrous compared to other areas such as China or South America. In this domain, the PEM, which involves thematic and spatial desegregation of poverty–environment issues and indicators, introduces the spatial dimension to poverty monitoring and helps to analyse how the poor interact with the environment (e.g. where are the poor, what is the state of the environment?..). Across many developing countries, PEM is becoming an important tool in planning and implementing poverty reduction programs. Poverty – environment maps, for instance, can help analyse and present the poverty – ecosystems relationships and improve targeting of public investments by identifying where the neediest populations are located, and in effective planning and delivery of emergency response aid programmes (e.g. epidemics, food aid, environmental disasters, etc). PEM has been tested and found to be an appropriate tool not only for analysis and presentation of poverty-environmental concerns but also as an advocacy tool to raise awareness or bring to the attention of policy makers and planners to the major environmental issues of concern related to poverty and the appropriate responses to address them. A review of country case studies in the following section 1.4 indicates that PEM can be effectively applied in addressing many poverty-environment concerns ranging from environmental health to natural disasters and water resources management.
15

1.4 Case Studies on Successful Applications of Poverty-Environment Maps A review of a number of country case studies indicate that poverty-environment maps can be effective instruments for analysis of poverty-environment linkages; planning and implementation of development programmes, but more specifically in better targeting of development activities to the poor. (a) Poverty-environmental health: In the Kwazulu Natal province, South Africa,
poverty maps were used in identifying and responding to outbreaks resulting from poor sanitation in 2001. Statistical data on poverty was combined with spatial information on the spread of the disease, access to safe water and sanitation. The poverty-environmental health maps showed where the outbreak was concentrated in poor areas, and Government authorities to target emergency response and health education campaign.
(b) Poverty- food security: In Ecuador, poverty-environment maps were used to
undertake national food security assessment of food security, to analyse the spatial and temporal patterns of access to food within Ecuador, and causes of food insecurity. Given the severity of malnutrition in Ecuador (20% of the Population were undernourished according to FAO publications in 1999), the poverty- food security maps were helpful in identifying the hotspots to target in national food security programmes.
(c) Poverty – livelihoods and asset mapping: In Kenya, the International Livestock
Research Institute (ILRI) and FAO have undertaken a pilot mapping of the assets on which poor people’s livelihoods depend i.e. Physical capital (markets, roads, water, electricity, telephones, livestock dips); Natural capital ( agricultural potential: rainfall amounts and timing, soils, water sources, communal forage land, forests); Human capital ( agricultural services, including skilled people, e.g. vets, other service providers, health facilities/services, human disease incidence and sickness rates, availability of labour); Social capital ( Information networks/groups, churches, community-based organizations, NGOs); and Financial capital (credit, livestock, off-farm income options such as mining sites, tourism). This initiative that relied on combining existing information with consultations with community members has provided information on where assets are concentrated and the level of access, and helped to determine which of the spatial indicators of livelihood assets identified (with their inputs) are the most useful. This case study has revealed that converting the information on the livelihood assets of the poor into maps can help create a clear picture of the resources available to communities and how they influence their poverty situation, and assist policy makers to monitor their utilisation and management.
(d) Other areas where poverty-environment maps have been used include Nigeria to
address nutrition and livelihoods issues; in Cambodia and Laos in natural resources management; Bangladesh and Malawi, to analyse and map food security.
16

1.5 Methodology in the PEM Phase II
This phase II of the PEM was a build-up of the phase I outcomes earlier undertaken during 2003. The 2 main tasks of GIS mapping, policy analysis and interfacing the GIS with the policy responses, were undertaken as follows:
1. GIS Mapping The GIS mapping component has generally built on the results of phase 1, focusing on updating the data sets and developing the prototype. Additional spatial data was obtained from the National University of Rwanda Centre for GIS (NUR-CGIS), and the Land Cover data from MINITERE database developed under the FAO Africover project.
Analysis of the agro-ecological zones and the interaction with socioeconomic and demographic factors has been undertaken by re-classifying the land cover types in the Africover data, into land cover types that were relevant for the main P-E issues identified. The attempt to update the CGIS spatial datasets with the recent population data from the National Census Service (NCS) was, however, not possible due to the incompatibility of the geo-referenced data from the two sources.
Additional data was obtained through discussions and interviews with selected policy officials in the main sectors relevant for the poverty-environment nexus.
2. Poverty – Environment Indicators and Policy Response Analysis
Analysis of the P-E issues and current policy responses has followed the Driver-Pressures-State-Impact–Response (DPSIR) model (see figure 1). As illustrated in figure 1 below, the DPSIR model shows mainly 3 types of indicators that must be monitored i.e. pressure indicators; state indicators and the impact indicators.
Information was mainly gathered by comprehensive review of literature, especially on documentation relating to the development and field testing of the P-E indicators. The sets of P-E Indicators developed through previous international efforts (e.g. UNDP, DFID, EC & World Bank, 2002; Shyamsundar 2002) was analysed in the context of Rwanda and more relevant and appropriate indicators developed from these generic sets. These P-E Indicators were screened against existing data and information systems within the context of PRSP, to assess availability of data and/ or feasibility of generating new datasets to monitor the identified relevant indicators whose data is currently unavailable. On the basis of available data and possibility of generating new data, a matrix of relevant P-E Indicators was prepared (see table 2). The changes in selected indicators during the PRSP period (2000 and 2003) are presented table 3.
17

The Policy analysis part has been enriched by the previous analytical work of different authors which generated information on the P-E nexus and developed generic P-E Indicators. These have been combined with the review of the GoR policy documents including the PRSP, sectoral policies and strategies, to obtain insights into the key P-E issues in Rwanda and current strategies and/ or interventions to address them. Analysis of the poverty structure and nature and spatial manifestation of environmental issues, institutional set up and related current interventions that seek to address P-E problems has also been undertaken.
3. Interfacing the GIS mapping prototype with the policy responses The GIS mapping provided information on the main poverty and environment concerns in the different provinces of Rwanda. Within the GIS environment, a number of poverty-environment factors have been combined to demonstrate the relationship. For instance, an overlay of the maps on poverty incidences, soil erosion, and population density (see map 3) showed that the P-E problems were severe in the north and north east (Ruhengeri, Byumba and Gisenyi). With respect to policy interventions, the available data allowed the consultants to generate and demonstrate two policy response scenarios i.e. reforestation (restoration of the forest ecosystem) and expansion of urbanization to resettle people into urban conglomeration and reorganize space utilization. After demonstration to the two policy officers from MINITERE and MINECOFIN with whom the consultants have been working, the prototype was installed on one of the computers in the Strategic Planning and Poverty Monitoring Directorate in MINECOFIN, specifically in the Unit of Regional Planning. 4. The policy options proposed are based on analysis of the GoR priorities and ongoing interventions. The interventions were prioritized according to the P-E concerns of the different regions. It goes without saying that where possible, the proposed actions can be incorporated into the ongoing interventions. These proposed poverty-environment zones/ clusters and the corresponding recommended intervention options have been subjected to review and prioritization by the relevant policy makers and key stakeholders, and thereafter the final directory of the main P-E issues and the appropriate policy responses has been developed (see Matrix of the Poverty – Environment Zones and Proposed Policy Options in chapter 5).
18

2.0 COUNTRY POVERTY- ENVIRONMENT PROFILE
This chapter reviews the socioeconomic and demographic characteristics of the population, highlighting the livelihood strategies and the social welfare indicators. The state of the biophysical environment and the interactions between the population and the environment are presented to explain the dependency on natural resources, and the environmental health and other risks (actual or potential) that the population and particularly the poor face as a result of the declining integrity of the natural resource base, on which their livelihoods depend.
2.1. State of the Biophysical Environment
Rwanda is characterized by a diverse relief ranging from hilly volcanoes and mountain forest climate in the North and North West, through the steep and gentle hills in the central regions and to the lowland hot and dry eastern plains. This divergent terrain ranges from as low as 900 metres above mean sea level (amsl) in the East and South East to as high as 4500 metres amsl in the volcanic ranges of the North West. The mean annual temperatures range from 16 – 17 oC in the higher altitudes, 18-21 oC in the central plateau and 20- 24 oC in the eastern and western lowlands. In terms of flora and fauna, Rwanda has a rich diversity of plant and animal species, which vary in the different ecological zones, from the alpine forest ecosystem in the north and north-west to the semi arid rangelands of the east. Rwanda is naturally endowed with a good drainage system, consisting mainly of the River Congo (the largest river in Africa) and the Nile (the World’s longest river), with a dense and fairly evenly distributed drainage network. This network of rivers, streams, lakes and marshlands have ensured that most of the valleys separating the hills are permanently wet, mainly in the central plateau. The fairly stable climatic and temperature regimes have traditionally afforded the Rwandan farming communities 2 crop seasons with fair seasonal predictability. However, over the last two decades, the country has increasingly experienced long periods of drought which tend to become cyclical and persistent. The Eastern parts of the country have been affected most. In addition, the large drainage system which kept the micro-climate constantly moist has of recent experienced frequent flooding and related disasters, particularly during heavy rainy seasons, largely due to the destruction of the natural wetlands and the watersheds by human settlements and agriculture. This spatial differentiation in the natural environment has tended to influence settlement patterns and local people’s livelihood strategies, and underscores the extent to which the changing environment has influenced and been influenced by poverty in Rwanda, as map 1 (land use) below illustrates.
19

Map 1:Major Land Use types in Rwanda
As can be observed from the map 1 above, the type of land use impacts on the environment, and for fragile ecosystems like the mountain areas of Western and Northern Rwanda (Ruhengeri, Gisenyi, Byumba, Kibuye), intensive agriculture is a serious pressure indicator of poverty-environment problems.
2.2 Socioeconomic and Demographic Characteristics
Rwanda’s current socioeconomic and demographic characteristics are explained by the recent history, mostly the events immediately before and after the 1994 genocide. Besides the loss of up to one million lives and destruction of the social and economic infrastructure, there have been internal displacements and migrations which, together
20

with the continuing influx of refugee returnees, have impacted on the settlement patterns, land cover and land use; changes in livelihood strategies, and general demographic structure. According to the National Population and Housing Census of August 2002, Rwanda has a population of 8,128,553 persons, of whom 3,879,448 (47.7%) are male and 4,249,105 (52.3%) are female, with 83% categorized as rural (NCS, 2004). With a population density of 321 persons per sq. km and an annual growth rate of 3.1%, Rwanda has one of the highest population densities in Sub-Sahara Africa. Indeed the population has nearly quadrupled in the last 4 decades from approximately 2.6 million people in 1960 (MINITERE, 2003). The major demographic characteristics that significantly impact on poverty, poverty reduction strategies and environmental management include:
predominantly young population – 67% of the population are under 25 years,
signifying a highly dependant but also sexually active population, hence a potential for population explosion;
high fertility rates, which translates into large households averaging 4.5 persons.
predominantly agrarian economy with 90% employed in agriculture, and at national level, 80% of the foreign exchange inflows from agriculture. This implies high dependency on natural resources, specifically land and ecosystems;
small land holdings (75% of households subside on 1 ha or less, of whom some 54% own 0 – 0.5 ha). This reflects a significant number of landless households and without shelter. Some 192,000 households were without shelter at the beginning of the current PRSP in 2001, out of whom only 12,000 had been provided for by the end of 2003;
largely rural population (83.1% rural and 16.9% urban) and low literacy rates, exacerbating the dependency on natural resources. However, the current rate of urbanization is high mainly due to the rural-urban migration of the poor in search of livelihood opportunities.
Although the population manifests a high degree of socio-cultural uniformity, spatial analysis of some key socioeconomic indicators reveals significant geographical differentiation, as shown in table 1 below:
21

22
Indicator Province
Pop. density
Mud & Wattle house (% HHs)
% HHs whose main water source is piped or protected well/ spring
Fuelwood as major source of cooking energy (% HHs)
% of Landless Households
Kigali city 1927 27.1 80.6 91.7 88.8 Kigali rural 284 63.3 55.7 95.0 7.8 Gitarama 400 36.1 67.6 93.7 3.4 Butare 388 71.8 80.7 93.4 5.9 Gikongoro 248 84.8 63.7 95.9 3.2 Cyangugu 321 70.3 55.6 94.1 13.0 Kibuye 268 23.6 70.6 96.6 2.7 Gisenyi 422 22.7 70.1 93.5 7.2 Ruhengeri 538 57.0 70.5 80.9 5.3 Byumba 418 75.3 72.0 80.1 2.4 Umutara 100 69.8 52.1 91.4 4.8 Kibungo 237 81.4 60.1 97.8 1.7 National av. 321 56.1 67.2 91.6 11.5
It should be noted that the slightly lower than national average dependency on fuelwood in the provinces of Ruhengeri, Byumba and Umutara is attributed more to shortage of wood rather than availability of better alternatives. This is explained by the considerably high dependency of the population in these areas on other but less efficient vegetation materials (grass, crop residues) i.e. Ruhengeri =18.2%, Byumba =19% and Umutara = 7.1%.
Table 1: Status of Selected Poverty-Environment Indicators by Province (2002)
Source: National Census Service, Feb. 2004 & MINECOFIN, Feb. 2002.
The map 2 below illustrates that in natural resource dependant areas such as most of Rwanda, population density is a major indicator of pressures on the environment.

Map 2: Population Density as a P-E Pressure Indicator.

2.3 Rwanda’s Poverty Characteristics
Rwanda has one of the highest poverty levels in Sub-Sahara Africa and the developing world with more than 60% of her population below the poverty line. On the United Nations Human Development Index (HDI) scale, Rwanda ranks the 10th poorest country in the world1. Poverty in Rwanda is characterized mainly by: lack of access to food and incomes; landlessness and lack of shelter; high unemployment levels and social vulnerability. These are compounded large household sizes (averaging 4.6 to 5.0) and high fertility rates. The high population growth rates at about 3% per annum, remains one of the most critical challenges for poverty reduction and social transformation. According to the PRSP, the poor in Rwanda are stratified according to deprivation, income and consumption levels, into several categories as indicated in box 1 below. Under the PRSP, this stratification of poverty according to severity would enable better targeting of the poorest and most vulnerable among the poor.
Box 1: Social Stratification of Rwanda’s households During the participatory poverty assessment carried out as part of the preparation of the PRSP, local communities stratified households into 6 categories, in which the poor are categorised into 4. As observed below, this poverty characterisation is based on access to natural resources and social vulnerability, which underscores the importance of natural resources to the Rwandan poor.
1. Umutindi Nyakujya (the absolute poverty): Those with no means of survival and who live on begging. The poor in is category have no material resources and lack basic needs i.e. shelter, adequate clothing and food. They have no access to medical care, and the women and children generally severely malnourished, and school attendance is out of reach of children.
2. Umutindi (the very poor): This category consists of resource poor people i.e. those with no economic assets (landless or with tiny landholdings) but they are physically capable of working on land owned by others to earn food or little income.
3. Umukene (the poor): Households have some land and housing. They derive livelihoods from the land and unskilled labour but have no savings. They have access to food but it is often inadequate with low nutritive value. They have no surplus produce to sell in the market, and as such, often have no access to health care and their children do not go to school.
4. Umukene wifashije (the resourceful poor): This group shares many of the characteristics of the umukene but, in addition, they have small ruminants and their children can go to school.
5. Umukungu (the food rich): This group has larger landholdings with adequate land to produce enough to eat and surplus for the market. They have no difficulties accessing health care.
6. Umukire (the money rich): This group has land and livestock, and often have extra incomes from off-farm employment. They have relatively good houses, often own a vehicle, and have enough money to lend and to get credit from the bank. Most of these have moved to urban areas in pursuit of better opportunities. Source PRSP, June 2002
1 UNDP Human Development Report. July 2003.

2.4 Poverty – Environment Linkages in Rwanda
The linkage between poverty and environment in Rwanda is best understood by analyzing the characteristics of poverty and the main sectors focused on poverty. From the poverty strata in box 1 and in sections 2.1 and 2.2 above, the main poverty-environment issues in Rwanda include: 1. Food security and income Rwanda’s economy is predominantly agrarian, with more than 90% of the population and about 40% of gross domestic product (GDP) depending on agriculture. Further more, the agricultural sector is characterised by smallholder subsistence production, limited use of modern agricultural technologies (farm equipment, fertilisers,), extremely small household landholdings, and low value addition. The average landholding, for instance, is about 0.5 ha, and some 52% of the population live on less than 0.2 ha, a significant proportion of whom are landless. Yet, even this land is continuously diminishing both in terms of physical size and productivity as the population increases and land degradation escalates. This indicates that the participation of resource poor people in the rural economy, which is dominated by smallholder agriculture, is still low. In terms of energy, 91.6% of the population depends on fuelwood for heating, including 60% of the urban population and as high as 97% in some provinces such as Kibungo. Some 40% of energy for commercial and industrial use is derived from wood. Natural vegetation also provides food, fibre and medicine for a considerable proportion of the rural population, and is the basis for the expanding art and crafts industry (Ubukorikori). Considering that almost 100% of rural employment is provided by natural resources, and the alternative livelihood options available for the poor are limited by, among other factors, high illiteracy levels and lack of employable skills, it goes without saying that environmental resources will, for the foreseeable future, continue to support the welfare of the majority of poor Rwandese. However, the decline in the quality and quantity of the Rwandan ecosystem characterized by, among others, loss of 65% of forest cover over the last 4 decades and increasing soil erosion, are evidently affecting the poor most through decline and loss of income; increasing incidences of chronic food insecurity; and vulnerability to floods, landslides, drought and other environmental disasters. The fuelwood energy deficit is estimated at 4 million cubic metres annually2, and this has visibly affected the poor most both in rural and urban areas.
2 See MINITERE, August 2003. National Forestry Policy for Rwanda.
25

2. Health (incidences of diseases caused by decline in environmental quality) The recent surveys (DHS, 2000 and EICV, 2001) shows that malaria, HIV/AIDS, acute respiratory infections, diarrhea and malnutrition are the main causes of morbidity and mortality in the country. Malaria is the most common cause of morbidity and mortality in the rural areas followed by diarrhea, as reported by 95% of the rural population (EICV 2001). Apart from HIV/AIDS, all other major diseases above are environment related i.e. they are associated with:
• poor hygienic conditions resulting from inadequate or inappropriate
sanitation; • access to safe water for drinking (and/ or washing). This is acute in Umutara,
Kibungo, Bugesera and Virunga areas; • lack of access to preventive measures for malaria such as bed nets, control of
vector breeding grounds, and awareness of basic hygiene practices; • low awareness about good practices in hygiene at personal, household and
community levels.
These factors are generally associated with poor households or areas where the poor live and when there are calamities e.g. cholera outbreak, the poor are the most affected.
3. Vulnerability to environmental hazards The main environmental disasters faced by the poor in Rwanda are:
• Landslides and (occasionally) volcanic eruptions: Landslides frequently occur naturally due to the steep terrain but the incidences of landslides have increased because of intensive cultivation and settlement in steep hills, as well as deforestation and watershed destruction (Ruhengeri, Byumba and Gisenyi, and parts of Gikongoro, Kibuye and Cyangugu).
• Floods: frequently occur during heavy rainy seasons affecting mainly low land areas of the Kigali Ngali, Gitarama, Butare and parts of Kigali city. The occurrence of floods has intensified in the recent past mainly due to severe destruction of the watershed which prevent runoff from hills and uncontrolled cultivation of wetlands. The other cause is the raindrops from house roof tops, which is exacerbated by unplanned scattered settlements in both rural and urban areas.
• Persistent drought caused by low precipitation, and this mostly affects the provinces of Umutara, Kibungo and the Bugesera area of Kigali Ngali province.
Poor people are the most affected by these calamities in a number of ways: they tend to inhabit marginal areas – the steep hills and swamps, which are most prone to
26
landslides and floods respectively; they live in poor often pathetic housing conditions, usually temporary structures which are easily taken away by strong winds or rains; and health and risk insurance cover in Rwanda is very low, particularly for the poor. In fact, even for the existing health schemes (Mutuelles de Sante), the coverage of the poor is low (national coverage is about 30%). As such, they are often (if not always) not compensated when such calamities occur. In addition, there are no established early warning systems and/ or emergency response mechanisms. Nationally, disaster preparedness is low. Emergency relief is usually managed on ad hoc basis and often there are no budgetary provisions either in Government or NGOs. In fact, absence of robust disaster preparedness was blamed for the destruction of lives and property in Gisenyi in 2002, when the volcanic eruptions occurred, and for the loss of crops, livestock and income by the farmers in Umutara, Kibungo and Bugesera when there was prolonged drought in the last three years.
Map 3 below illustrates the poverty-environment interactions, and can are indicative of the state of the ecosystem.
27

Map 3: An Overlay Map of Land Use/ land Cover, Poverty Incidences and Population Density Illustrating State Indicators
From map 3 above, it can be observed that the most fragile and most ecologically sensitive areas of Ruhengeri, Gisenyi have the highest population densities. This has increased pressure on the ecosystem resulting in the current state (loss of biodiversity; over-cultivation; soil erosion; declining productivity) and more poverty. In the southern parts (Gikongoro, Butare), the main poverty-environment issue is soil erosion and soil infertility, largely due to overcultivation without using scientific technologies and external inputs. In the pastoral and agri-pastoral rangelands of the East, population pressure is not as high but shortage of water (for both humans and livestock), drought and overstocking are the main concerns, often causing encroachment on the protected areas (Akagera National Park).

3.0 POVERTY–ENVIRONMENT INDICATORS AND THE PRSP PROCESS
3.1. Current Policy thrusts
Rwanda’s main medium term development strategy, the Poverty Reduction Strategy (PRS) implemented since 2001 is based on the following priority areas: Rural development and agricultural transformation; Human development; Economic infrastructure; Governance; Private sector development; and Institutional capacity-building. Within these priorities, the main programmes that address the poverty-environment issues are:
• intensive small scale agriculture and livestock development; • Labour-intensive public works; • malaria prevention through public awareness campaigns, supply of anti-
malarial drugs at subsidized prices to increase access to treatment, and provision of mosquito bed nets targeting infants and pregnant mothers;
• productive skills development to expand employment opportunities, targeting the youth;
• resettlement of the landless people in grouped settlements (Imidugudu); and • expanding rural economic infrastructure including rural electrification,
markets, roads and bridges. Rwanda’s economic development agenda is largely hinged on natural resources (agriculture, tourism,) even though the focus is on developing quality human resources and reducing agricultural based employment from current 80% to 50% by 2020. Thus, there is a strong linkage between the environment and poverty and therefore, integration of poverty–environment indicators into poverty monitoring activities is critical to sustainable poverty reduction.
It is observed, however, that while the PRSP priority programmes above seem likely to address the poverty – environment concerns, they are not adequately linked to the impact on environment, and the indicator sets currently used in monitoring the PRSP progress cannot be used to track these poverty-environment issues.
Although natural resource degradation has and continues to affect the poor most in Rwanda, their degradation can not be attributed to the poor alone. For instance, the pollution of water sources serving Kigali city is more a result of industrial and economic activities taking place in the swamps and valleys than waste disposal by the poor, yet these water bodies constitute the principal source of free water to the poor. The most critical poverty-environment pressures which should be addressed in the context of PRSP monitoring include:
29

30
(v) the expanding land for settlement and agricultural production has resulted in
massive deforestation which resulted in the current energy crisis in two ways:
(a) the destruction of the watershed due to deforestation has caused reduced rainfall and decline in the quantity and quality of ground and surface water, with the effect that the water levels of the country’s major water bodies has fallen, thereby reducing the capacity to generate hydroelectric power.
(b) severe decline in the supply of fuel wood which is a major source of energy for domestic (90% of the population) and small scale industrial activities;
(vi) intensive farming due to shortage of arable land and inappropriate agricultural
practices especially for farmers upstream (mainly in the hilly and often densely populated hilly areas) have resulted in accelerated soil erosion, which has caused siltation of water bodies (e.g. Lake Buhondo in Ruhengeri) with the effect of reduced water volume and subsequently reduced power generation capacity.
(vii) irrational use of land resources due to customary legacies that
encouraged land fragmentation and scattered settlements. These scattered housing structures have the added effect of escalating rain water runoff, which has further worsened the problem of gully erosion, more pronounced in urban areas like Kigali city.
(viii) increasing urbanization in unplanned manner, which has escalated the
emergence of slum areas and the inadequate capacity of urban local authorities to provide essential social services to the increasing population of urban poor.
The principal driver of these problems is the unprecedented population growth rates with low levels of human development and technological applications and inadequate planning capacity, amidst a declining resource base. The GoR and its development partners now recognize that the population pressure on natural resources has reached deplorable levels and environmental crises are evidently affecting critical sectors like energy, water and agriculture. There are, however, indications of appropriate response to remedy the situation as shown by recent policy initiatives and programme interventions. These suggest that the GoR is committed to taking action, within the constraints of financial, human and technological resources. The figure 1 below shows the analysis of the cause-effect relationships of the main poverty-environment issues in Rwanda, and the policy responses, using the Drivers-Pressure-State-Impact-Response (DPSIR) model. These major poverty-environment issues and indicators are further analysed in the matrix below.

Figure 1: Analysis of the P-E Indicators for Rwanda using the DPSIR model
Indicators of Drivers: Intensification of
agricultural activities; Settlements
Indicators of Pressures • Reduced area under
forest; • Reduced productivity of
arable land; • % of population
dependant on agriculture • Expansion of area under
agriculture • Proportion of poor
households; • proportion of landless
households; • size of wetlands under
agriculture;
Indicators of State: • size of forest cover (ha); • biodiversity index • quality of water Decline
in aquatic ecosystem • levels of ground water • production per ha of
arable land • % of households living
in Steep hills; • Proportion of marginal
lands cultivated
Indicators of Response: • % of population living in grouped settlements/
Imidugudu • area of degraded forest reforested; • area of non forest land planted with trees; • Area of wetlands protected • % of rural poor employed in non agricultural sectors; • proportion of household income from non agricultural
sources. • Crop production/ ha of rural poor households
Indicators of Impact: • Loss of biodiversity &
livelihoods • Soil erosion • Reduced quantity & flow &
volume of water • Time / distance to collect
building / roofing materials by poor households
• Deforestation • Ratio of annual electricity
supply to demand; • Average distance traveled (by
women & children) to collect fire wood and water;
• Proportion of household incomes spent on energy by poor urban households
• Reduced household incomes. • Persistent famine
31

Matrix of Major Poverty – Environment issues and related indicators for Rwanda This analysis is based on adaptation of the generic indicators and analytical framework developed by Shyamsundar (2002) and World Bank/UNDP/DFID/ EC (2002).
Main Issues Environmental Concerns Poverty Issues P-E Indicators Areas most affected Comments/ further discussion 1. Naturalresource management and livelihoods
Natural resources depletion due tooverdependence; inappropriate &unregulated utilization; and population pressure
• NR are major source of livelihoods for 90% of Rwandans;
• Access and secure use rights on NR (water, fuel wood, etc.)
• Inadequate capacity for sustainable utilization & mgt;
• High population density and absolute poverty incidences;
• Terrain too fragile to support current production pressures;
• Inequitable access/ use of natural resources;
• Proportion of poor who depend directly on NR for their livelihoods;
• Distribution & types of property rights/access on NR;
• Relationships betweenpopulation growth and NR exploitation;
All provinces but most acute in hilly & densely populated provinces of Ruhengeri, Gisenyi, Byumba, Butare & Kibuye,
• Inadequate & inappropriate formal & informal institutional structures at local level to manage NR.
Range of NRs: Land Water Fisheries Forest Ecosystems (wetlands, biodiversity); Mineral resources (including sand, limestone, stones); Local communities’ involvement in management of environmental resources is still low but is increasing.
1.1.Land/ soil degradation
• Erosion and reduction of soil fertility (and yields)
• Cultivation of marginal unproductive lands;
• Overgrazing • Anarchical exploitation
of mines & quarries for sand, gravel & clay.
• bush burning
• Declining yields (and household incomes);
• Increasing incidences of food poverty/ insecurity;
• Loss of revenue from agriculture;
• Large household sizes (high fertility levels);
• many poor people live in steep hillsides & other marginal areas;
• Women have limited/ no decision making power over land;
• inadequate access to scientific farming technologies
• low use of external agro-inputs (fertilizers, pesticides).
• % of the poor living in degraded areas/marginal land (e.g. eroded lands or wetlands)
• Average cultivated area (ha) of poor households;
• % of poor farming households using external agro-inputs.
o Gitarama, Gikongoro, Butare are affected mainly by over-cultivation of land
o In Byumba, Ruhengeri, Gisenyi, Cyangugu, Kibuye, gulley erosion is perpetuated bycultivation of steep hills & deforestation.
o Land degradation in Eastern regions of Umutara, Kibungo & Bugesera is mainly due to overgrazing, perpetuated by cultivation of semi-arid rangelands.
• Linked to land tenure schemes (customary & registered land ownership); population pressure (the North & Eastern provinces have the highest population density and highest concentration of poor people.
• Persistent drought has caused food insecurity in Umutara, Kibungo & Bugesera.
• Massive livestock
movements in search of water further exacerbates land degradation. Provision of adequate water for livestock & limited stocks could alleviate the situation.
32
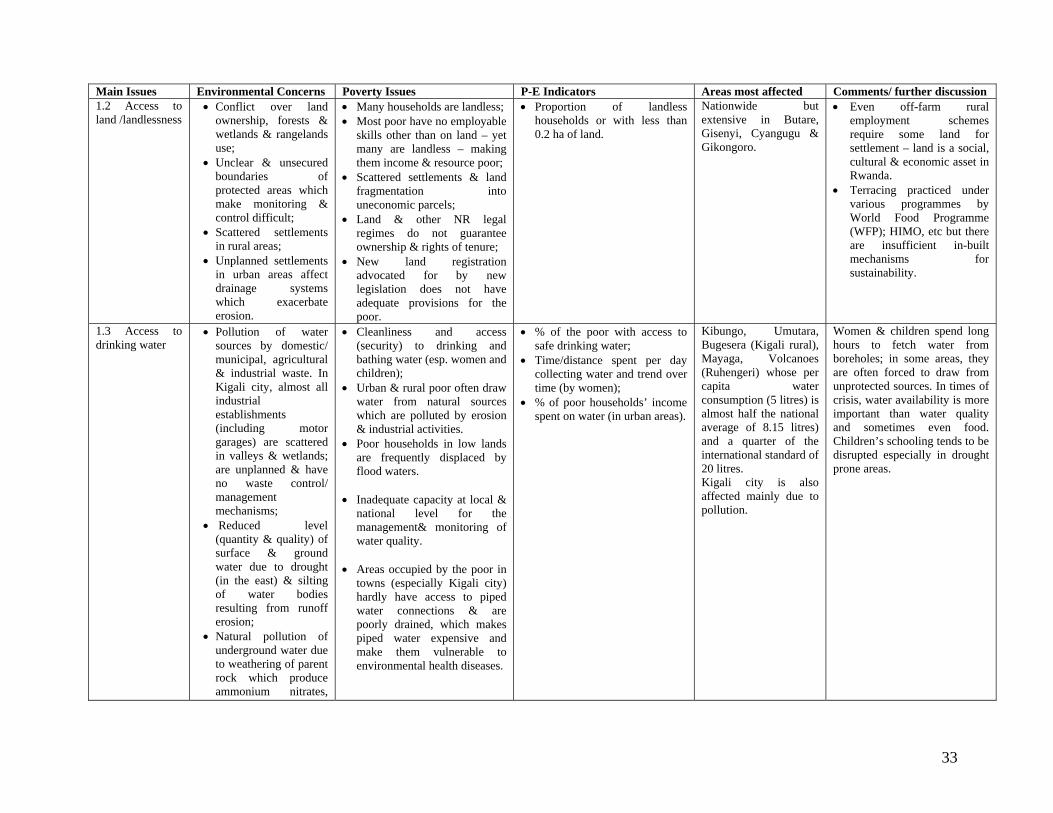
Main Issues Environmental Concerns Poverty Issues P-E Indicators Areas most affected Comments/ further discussion 1.2 Access to land /landlessness
• Conflict over land ownership, forests & wetlands & rangelands use;
• Unclear & unsecured boundaries of protected areas which make monitoring & control difficult;
• Scattered settlements in rural areas;
• Unplanned settlements in urban areas affect drainage systems which exacerbate erosion.
• Many households are landless; • Most poor have no employable
skills other than on land – yet many are landless – making them income & resource poor;
• Scattered settlements & land fragmentation into uneconomic parcels;
• Land & other NR legal regimes do not guarantee ownership & rights of tenure;
• New land registration advocated for by new legislation does not have adequate provisions for the poor.
• Proportion of landless households or with less than 0.2 ha of land.
Nationwide butextensive in Butare, Gisenyi, Cyangugu & Gikongoro.
• Even off-farm rural employment schemes require some land for settlement – land is a social, cultural & economic asset in Rwanda.
• Terracing practiced under various programmes by World Food Programme (WFP); HIMO, etc but there are insufficient in-built mechanisms for sustainability.
1.3 Access to drinking water
• Pollution of water sources by domestic/ municipal, agricultural & industrial waste. In Kigali city, almost all industrial establishments (including motor garages) are scattered in valleys & wetlands; are unplanned & have no waste control/ management mechanisms;
• Reduced level (quantity & quality) of surface & ground water due to drought (in the east) & silting of water bodies resulting from runoff erosion;
• Natural pollution of underground water due to weathering of parent rock which produce ammonium nitrates,
• Cleanliness and access (security) to drinking and bathing water (esp. women and children);
• Urban & rural poor often draw water from natural sources which are polluted by erosion & industrial activities.
• Poor households in low lands are frequently displaced by flood waters.
• Inadequate capacity at local &
national level for the management& monitoring of water quality.
• Areas occupied by the poor in
towns (especially Kigali city) hardly have access to piped water connections & are poorly drained, which makes piped water expensive and make them vulnerable to environmental health diseases.
• % of the poor with access to safe drinking water;
• Time/distance spent per day collecting water and trend over time (by women);
• % of poor households’ income spent on water (in urban areas).
Kibungo, Umutara, Bugesera (Kigali rural), Mayaga, Volcanoes (Ruhengeri) whose per capita waterconsumption (5 litres) is almost half the national average of 8.15 litres) and a quarter of the international standard of 20 litres.
Women & children spend long hours to fetch water from boreholes; in some areas, they are often forced to draw from unprotected sources. In times of crisis, water availability is more important than water quality and sometimes even food. Children’s schooling tends to be disrupted especially in drought prone areas.
Kigali city is also affected mainly due to pollution.
33

Main Issues Environmental Concerns Poverty Issues P-E Indicators Areas most affected Comments/ further discussion fluorides & other chemical pollutants.
1.4 Access to water forIrrigation
• Drought which reduces
the level of water bodies; Limited application of irrigated agriculture;
• Water management regimes – inadequate institutional structures at local levels;
• Salinisation of irrigated areas;
• Declining agriculturalproductivity;
• % of poor farmers with access to sustainable irrigation facilities (especially in areas where prolonged drought is persistent);
• Food insecurity (esp. during prolonged drought periods) Overdependence on rain-fed agriculture which is affected by weather changes;
• lack of access to meteorological information by the poor;
Umutara, Kigali Ngali/ Bugesera, Kibungo & Butare most in need & suitable for irrigated agriculture
Explore options for collaborative management of small irrigation projects with poor farmers (in cooperatives) and private sector.
1.5 Forest and wood resources
• Deforestation resulting in depletion of fuel wood resources;
• Forest ecosystemdegradation due to forest fires caused by farmers, hunters, bee keepers, gold washers, poachers;
• Access to alternative energy sources;
• Encroachment due to pressures from expansion of agriculture & settlement.
• Access to fuel-wood sources • inefficient carbonization &
cooking techniques;
• Time/distance spent per day collecting fuelwood (especially women, children)
• inefficient use of energy; • Population pressures & search
for livelihoods; • Loss of biodiversity resources
on which the poor depend (medicinal, food, fibre, animal proteins );
• Loss of employment & income opportunities from eco-tourism & other forest activities;
• Shortage & high fuelwood costs for urban poor farmers.
• % of poor using firewood and/or charcoal, dung as major source of energy;
• Average time/distance spent per day collecting fuelwood (esp. women, children) and trend over time;
• % of household income spent on fuelwood (urban poor);
• Deforestation rate in areas occupied by the poor;
• % of poor households using improved stoves or cleaner fuel;
• No. of local associations managing forests jointly with Government.
Gisenyi, Ruhengeri, Cyangugu & Gikongoro which are endowed with natural forests.
• Linked to population pressure and management methods (indicator: area of forests co-managed by local user communities);
• Ongoing initiatives (e.g. DEMP) to explore collaborative management with dependant communities & local governments;
• Whether option for rehabilitation would include resettlement of households currently in forest reserve to other public land.
• Derived indicator effect: less time available for women to draw on other livelihood assets and for children to attend school.
1.6 Ecosystems
• Encroachment onecologically fragile areas – steep hills, semi arid range lands & wetlands have been severely degraded
• Rangeland degradation results in reduced pastures for livestock;
• Pressure on protected areas – degazetted for resettlement of people
• Poaching of wild animals in protected
• loss of materials for craft making & building/ roofing materials;
• loss of wild medicine & foodstuffs encroachment of pastoral communities into semi arid protected areas;
• Number of livestock per ha of rangelands;
• Proportion of the poor living in ecologically fragile areas;
• Number of HHs extracting medicinal plants/ wild foods;
• Number of households using grass, papyruses & other ecosystem materials for roofing;
• Umutara, Kibungo (rangelands &pastoralism)
Need to identify ecologically fragile areas & establish threshold.
• Byumba, KigaliNgali, Butare,Gitarama, Gikongoro (wetlands)
Legal regime to expand farm and non-farm sources of livelihood options;
• Gisenyi, Ruhengeri, Cyangugu, Gikongoro (natural forest ecosystem)
(See also forests/deforestation)
34

Main Issues Environmental Concerns Poverty Issues P-E Indicators Areas most affected Comments/ further discussion areas;
• Unsecured/ clearprotected areas boundary demarcations.
• Overstocking of livestock in
rangelands leading to loss of pastures & low livestock productivity;
• Conversion of wetlands into farm lands led to loss of wetland resources.
• Proportion of protected areas encroached;
• Rate of regeneration of wildlife & vegetation resources of economic importance to the poor;
• Number of poor households that are dependant on game meat for proteins.
1.7 Fishing • Declining fish stocks and biodiversity;
• Silting of lakes due to erosion upstream reduces water level & destroys fish breeding grounds;
• Water hyacinth affects flora (oxygen concentration/ BOD);
• Dependency on woody biomass for fish preservation/ processing.
• Declining fish stocks • Access to fish stocks – decline
in income of poor fisher-communities;
• Lack of access to animal protein as fish would provide cheaper source than livestock which is costly.
• Declining fish stocks • Inadequate fishing grounds; • Low adoption and extension
of fish farming.
Umutara, Cyangugu, Kibuye, Gisenyi & parts of Ruhengeri
There are ongoing efforts to restock Lake Kivu but the aquatic environment is unsuitable for fish growth due to presence of methane gas. The bulk of fish production is from the lakes in Akagera National park (fishing in protected areas presents regulatory constraints).
2.0 Environmental Health related diseases/vector- borne disease
Poor Water, air, soil pollution
High morbidity rates reduces labour productivity &expenditures on Health
Proportion of the health burden and disease incidence of the poor related to environmental factors: • Water borne diseases (e.g.
diarrhea, cholera malaria) among the poor;
• Respiratory infections among the poor (indoor air pollution;
• Quality of the air (suspended particulate matter, lead, etc.);
• Vulnerability of children under 5 to disease related to environmental factors.
Nationwide butpollution affects Kigali city most.
At the country level it is possible to obtain a reasonable understanding of causal relationship between environmental conditions and health outcomes and the relative contribution of environmental conditions to health.
2.1 Sanitation • Sanitation coverage is high (85%) but the hygienic conditions are poor;
• Pollution of ground water sources due to inappropriate
• Lack of awareness due partly to insufficient coverage by public health inspectors;
• Health (water borne diseases) • Loss of productivity • Women's access to sanitation
• % of poor (or women) with access to sanitation facilities.
• Hygienic state of sanitation facilities
• Proportion of poor people sleeping under mosquito bed nets
Kigali city, Byumba, Butare, Ruhengeri,Gisenyi
Sewer connection to households in Kigali city is about 10% indicating that people rely on individual often shallow pit latrines.
35

Main Issues Environmental Concerns Poverty Issues P-E Indicators Areas most affected Comments/ further discussion sanitation facilities (pit latrines)
• Poor drainage of waste water & rain water leading to stagnant dirty water and creation of gullies that provide breedinggrounds for disease pathogens (e.g. mosquitoes)
• Poor hygiene in schools, markets & community centres used by the poor;
• Children’s access to sanitation in schools;
• Disposal of human excreta in bushes due to lack of sanitation facilities;
• Number of pupils per latrine stance in schools;
• Number of schools with safe water sources within reasonable distance;
• Adequate sanitation & hand washing facilities in markets & community centres;
• % of urban households with access to water borne toilets
• Types of toilets or latrines households/ communities have/ use.
2.2 Air pollution Air pollution due to construction & other activities; - indoor pollution from inefficient energy use/ polluting energy sources & poorly ventilated houses.
Health (water borne diseases) Loss of productivity since the poor depend on - access to adequate treatment
• % of poor affected by respiratory infections
• Proportion of poor people under health insurance scheme (Mituelles de sante)
• Mortality rate for children under five years.
Nationwide but mainly predominant in Kigali city.
3.0 Naturaldisasters
Natural disasters in Rwanda include: • Landslides • Volcanic eruptions &
Earthquakes • Floods • Bush fires • Drought
Vulnerability exacerbated by natural disasters include: • food insecurity; loss of
livestock & wildlife; • disruption of utility supplies
i.e. water & energy; • Destruction of infrastructure
like roads & markets which disrupt the economic activities of the poor.
Vulnerability exacerbated by living in vulnerable areas: • loss of lives & property • temporary displacement; • loss of income/ livelihoods
• Number of deaths from environmentally relateddisasters (actual)
• Landslides (and
occasionally) Volcanic eruptions affect Gisenyi,Ruhengeri, Byumba, Kibuye, Cyangugu, & Gikongoro.
• Number of people made homeless by environmentally related disasters (actual)
• % of the population living in vulnerable areas prone to flooding, drought, landslides, volcanic eruptions,earthquakes (potential)
• Droughts mainly
affect the relatively low altitude and dry Eastern regions of Umutara, Kigali-Ngali/ Bugesera
• Incidences of conflicts in use of natural resources (proxy)
• Frequency of environmental disasters;
• Presence of early warning systems/ plans;
• Existence of effective emergency response systems.
It is not clear to all actors what would constitute early warning/ disaster management system for each of the disaster categories. However, FAO is supporting MINAGRI to establish drought early warning systems.
• Floods affect parts
of Byumba, Kigali city & Kigali Ngali.
It would be interesting for the Civil society umbrella body to incorporate emergency relief & disaster management in their strategies & operational plans..
4.0 Housing • Environmental health – • Quality of life (environmental • Number of people living in Nationwide but Need a clear definition of
36
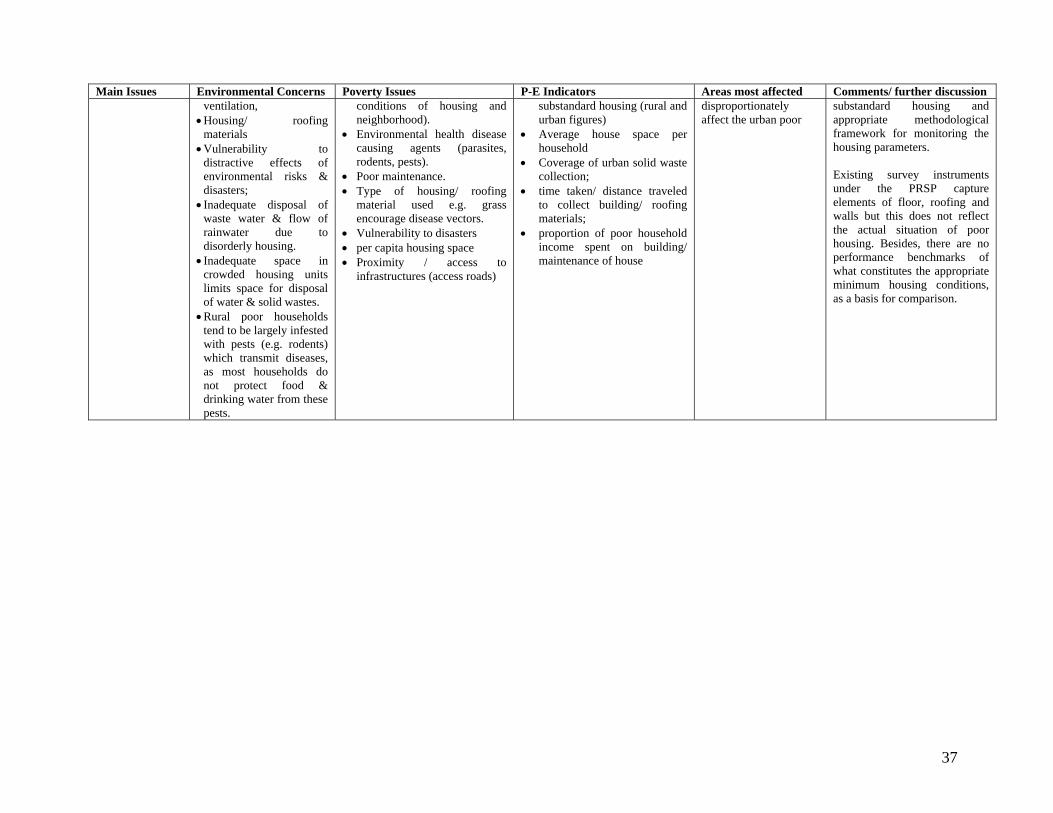
37
Environmental Concerns Poverty Issues P-E Indicators Areas most affected Comments/ further discussion ventilation,
• Housing/ roofing materials
• Vulnerability to distractive effects of environmental risks & disasters;
• Inadequate disposal of waste water & flow of rainwater due to disorderly housing.
• Inadequate space in crowded housing units limits space for disposal of water & solid wastes.
• Rural poor households tend to be largely infested with pests (e.g. rodents) which transmit diseases, as most households do not protect food & drinking water from these pests.
conditions of housing and neighborhood).
• Environmental health disease causing agents (parasites, rodents, pests).
• Poor maintenance. • Type of housing/ roofing
material used e.g. grass encourage disease vectors.
• Vulnerability to disasters • per capita housing space • Proximity / access to
infrastructures (access roads)
substandard housing (rural and urban figures)
• Average house space per household
• Coverage of urban solid waste collection;
• time taken/ distance traveled to collect building/ roofing materials;
• proportion of poor household income spent on building/ maintenance of house
disproportionately affect the urban poor
substandard housing and appropriate methodological framework for monitoring the housing parameters. Existing survey instruments under the PRSP capture elements of floor, roofing and walls but this does not reflect the actual situation of poor housing. Besides, there are no performance benchmarks of what constitutes the appropriate minimum housing conditions, as a basis for comparison.
Main Issues
3.2 Data Availability and Monitoring of Poverty – Environment Indicators
3.2.1 General One of the most important characteristics of indicators is the ease of monitoring, and this is mainly determined by availability and quality of data, the complexity and cost-effectiveness of data generation. In selecting/ developing the poverty-environment indicators, this study has considered mostly those already being monitored under the PRSP and for which data exists or can be generated within existing methodologies, resources and expertise.
3.2.2 Existing Methodology for Data Collection on Indicators Poverty monitoring in Rwanda is based on a set of tested indicators. The techniques used in generating and measuring these indicators under the PRSP include:
1. The Participatory Poverty Assessment (PPA) was undertaken to develop a
comprehensive and fairly accurate poverty profile; diagnose and stratify poverty from a social, economic, cultural and spatial dimension; and to generate and evaluate the policies proposed for addressing the identified poverty concerns. The recent PPA of 2000 enabled the poor to contribute to identifying the solutions for their poverty problems. The PPA used a combination of 3 techniques namely: national survey; community action planning (Ubudehe); and policy relevant test (PRT).
2. The Core Welfare Indicators Questionnaire (CWIQ) is used to collect data on
households’ living conditions and use of public services, and is conducted annually;
3. Demographic and Health Survey (DHS), which gathers data on women’s fertility and health and the health of their children. The most recent one was carried out in 2000;
4. The Multiple Indicator Cluster Survey (MICS) collects data on further aspects of
the education, water supply and nutrition of a subset of the households included in the DHS;
5. The Household Living Conditions Survey (EICV), which gathers a comprehensive
set of information on a large sample of households, covering consumption, income, education, health and other dimensions;
6. The Food Security Survey which gathers detailed information on crop production
from a sub-sample of households from the sample used for the EICV, and is related to surveys conducted earlier during the 1980s and 1990s;
38

39
7. The Public Expenditure Tracking Survey (PETS), which examines the flow of
funds to services in the health and education sectors.
For most of these methodologies, available data was collected around 2000-2001 during the preparation of the PRSP. However, for some indicators, however, the data has been updated in the Enquete Sur Les Indicateurs de base du Bien-etre (Quibb) during 2003 and published in March 2004.
3.2.2 Data Availability for Poverty-Environment Indicators Data availability constitutes a key criterion for selecting particular indicators to measure. If accurate up-to-date data is not available or it is not technically feasible and/ or economically not justifiable to generate such data at micro, meso or macro level, then such indicators are not useable. A lot of data exists on Rwanda, disaggregated to different levels. However, disaggregation is generally up to provincial level except for the national census for which detailed data is available even up to sector and cell levels. Table 2 below presents the status of data availability for selected P-E indicators and the feasibility of data generation within the context of the PRSP. It will be observed from the table 2 below that the relevant indicators retained are those for which data exists or the critical indicators on which data can be generated within existing PRSP monitoring system.

Table 2: Proposed Poverty-Environment Indicators and Status of Data availability P-E Category/ Issue
Poverty - Environment Indicators Data Available
Not available but generation feasible
Authoritative Sources
Comments on frequency & Institutional issues
1. Poverty-natural resource indicators 1.1 Income and Opportunity
% of rural population below the poverty line X
Level of severity of poverty (incidences of extreme poverty) X EICV Time / distance spent by HH members to collect water & fuel wood X This should be considered per province Quantity of annual HH consumption/ income that is derived from
forest products & fisheries X Could be included in HLCS (EICV)
% of irrigated area in total cultivated area by wealth/ income categories
X EICV / AgricSurvey
Should be covered in agricultural survey, despite little irrigated agriculture.
Number of poor farming households using fertilizers X Agric. Survey Only the number of cells where farmers use chemical fertilizers is captured
% of rural Households with adequate water for livestock by wealth/ income categories
X Agric. survey
Literacy levels for adults more than 15 years old X GCPH / EICV Proportion of HHs using purchased (external) inputs by quintile X EICV Number of Households with access to extension services Agric. Survey 1.2 Food Security Rural per capita cereal production X Agric Survey Not disaggregated to lower levels % of farmers who grow drought resistant crops by income/ wealth
quintiles X
Number of meals per person per day X CWIQ % of rural children under 5 that are underweight X DHS % of rural children under 5 that are stunted X DHS % of rural children under 5 that are wasted X DHS 2.0 Environment related diseases 2.1 Malaria % people sleeping under treated mosquito nets X DHS % of health facilities reporting no disruption of stock of anti-malarial
drugs (as specified by national health policy) for more than one week during the previous 3 months
X PETS
Malaria death rate among under 5 yr olds X DHS Malaria death rate / morbidity among pregnant women X DHS Number of malaria cases, severe & uncomplicated (probable &
confirmed) X DHS
% of patients with uncomplicated malaria getting correct treatment at health facility & community levels according to the national guidelines within 24 hrs of onset of symptoms
X DHS
2.2 Diarrhea Access to clean water safe water (public or private) X CWIQ Reflects average distance to water source and no clarification of safe water source
Access to sanitation facilities (public or private) X CWIQ Population with access to hygienic facilities X Hours/ day of available piped water X CWIQ Quantity of water used per capita per day X CWIQ Time taken/ distance travelled in collecting water X Disposal practices of children’s faeces X
40

P-E Category/ Issue
Poverty - Environment Indicators Data Available
Not available but generation feasible
Authoritative Sources
Comments on frequency & Institutional issues
% of child care givers and food preparers with appropriate hand washing behaviour
DHS, HLCS
E. coli / 100 ml of water consumed by residents by source X Limited institutional capacity for water quality monitoring
Persons per room of housing X HLCS (EICV) Prevalence of diarrhea X DHS 2.3 Respiratory Infections
Availability of ventilation in cooking area X Could be captured through adjustments in the HLCS instruments
Children sleeping in cooking area X HLCS % of HHs using clean fuel/ improved stoves X “ Could be included in CWIQ Prevalence of acute/ chronic respiratory infections (ARI/CRI) X DHS Prevalence of chronic lung disease (COPD) X DHS 2.4 Broad Policy indicators
Public health expenditures X PETS
Under 5 mortality rate X DHS Disability Adjusted Life Years (DALYs) X 3. Vulnerability to environmental disasters 3.1 Vulnerability to naturaldisasters
Households rendered homeless or displaced by landslides/ volcanic eruptions/ floods/ drought per year by income/ wealth quintiles
His can easily be gathered under the HLCS
Number of deaths from natural disasters by income/ wealth quintiles X % of farmers with land on slopes/ wetlands by income/ wealth
quintiles
4. Housing 4.1 Poor housing conditions
Number of people living in substandard housing (rural and urban figures)
X
Average house space per poor household X HLCS Coverage of solid waste collection (urban poor households) X Number of Households in isolated settlements X HLCS % of rural children under 5 who are wasted DHS X = Data available from existing data sets. Indicators not in italic are intermediate indicators while those in italics are impact indicators Table 3 below presents the status of selected PE indicators for 2000 and 2003, reflecting the performance of the PRSP.
41

42
Table 3: Comparative Analysis of selected poverty-environment indicators by Province between 2000 and 2003.
Level ofseverity ofpoverty (P
Incidences of food poverty (%HHs) 1/P0)
Literacy levels for Adults more than 15 yrs old
Proportion of HHs using external(purchased) agro-inputs
Proportion of HHs with protected latrines
PE Indicator Province 2000 2003 2000 2003 2000 2003 2000 2003 2000 2003Kigali city 0.261 - 20.6% - 46.7% 82.7% 5.6% - 81.7% 74.9%Kigali Ngali 0.467 - 74.0% - 42.1% 60.1% 4.3% - 35.4% 64.9%Gitarama 0.381 - 61.8% - 37.1% 61.5% 6.6% - 54.1% 67.3%Butare 0.434 - 75.5% - 40.5% 53.4% 7.0% - 56.1% 43.6%Gikongoro 0.465 - 80.2% - 49.7% 51.8% 20.9% - 51.6% 65.6%Cyangugu 0.451 - 72.0% - 41.9% 53.9% 9.0% - 64.1% 84.2%Kibuye 0.397 - 79.4% - 47.9% 56.7% 1.5% - 46.3% 58.2%Gisenyi 0.364 - 68.5% - 51.0% 56.9% 9.8% - 53.5% 62.8%Ruhengeri 0.443 - 83.7% - 45.3% 51.7% 6.3% - 62.0% 61.8%Byumba 0.417 - 65.7% - 46.1% 57.4% 6.9% - 30.3% 59.3%Umutara 0.416 - 62.2% - 39.6% 62.2% 1.7% - 35.0% 67.5%Kibungo 0.367 - 62.3% - 38.2% 58.2% 1.8% - 35.7% 41.2%National 0.421 - 67.8% - 43.7% 58.8% 6.9% - 50.4% 61.8% Source: DHS, 2000; PRSP 2001; PRSP 2001; MINECOFIN, 2002: World Bank, 2005; MINECOFIN/ QUIBB, 2004. Note, where the figures for 2003 are not indicated, the available information for 2003 was not comparable with the baseline info for 2003 largely due to the fact that most of the information for 2000 were drawn from the EICV and DHS while most if the data for 2003 was extracted from Quibb 2003/ 04 that used different parameters. It should be observed, however, that using available information to measure some indicators presents difficulties because of the lack of consistency as parameters used in 2000/2001 were adjusted in 2003. In addition, different sources provide contracting figures for some indicators, for instance coverage of sanitation facilities. For others, the data available cannot be used to measure the indicator available information in the EICV (PRSP 2002, etc) reflect walking time to water source in minutes, which is difficult to use in a situation where the most important aspect of the indicator is access to safe water.

4.0 CURRENT POLICY AND INSTITUTIONAL INITIATIVES
4.1 Analysis of the Current Policy Responses
To assess how the poverty-environment issues are integrated into the development process, major sectoral policies and strategic plans have been reviewed. In general, there are indications that the GoR is moving towards mainstreaming environmental issues into the sectoral strategies and the PRSP but the poverty-environment linkage is a new concept to Rwanda. It is noted that the environment protection programmes and sustainable development initiatives implemented by the GoR in previous years were disrupted by the war of the 1990s, and after the war, the GoR and development partners were preoccupied with emergency programmes to resettle returnees and rehabilitate the social and economic infrastructure, which activities also had a negative impact on the environment. Since 2000, however, there has been increasing appreciation at the policy level that poverty and environment are inextricably linked and any interventions in poverty reduction and economic transformation must integrate environmental management. In this regard, the GoR has instituted a number of policy measures which embrace institutional reforms, regulatory frameworks and remedial intervention projects/ programmes. The main policy thrusts with respect to the poverty-environment issues are reflected in the following strategies:
1. Vision 2020 and the PRS: Under the Vision 2020, the GoR is pursuing a strategy to reduce the current agricultural population from about 90% to about 50% by 2020, through developing critical productive skills and expanding off-farm employment opportunities. The rationale is that this would free the rural land from population pressure and enhance agricultural production. Under the current PRSP, environmental management has not been adequately reflected. However, current policy thrusts allude to putting in place environmentally sound sectoral policies and development programmes. Perhaps the most important policy decision of the GoR towards sustainable ecosystem management was the gazettement of Nyungwe Mountain natural forest into a national park (protected area) during 2000, amidst pressures of resettling the landless and stemming further encroachment on the forest. This is expected to enhance the conservation of the remaining part of the Nyungwe forest, but also introduce more sustainable utilization of its ecosystem resources (tourism, etc) and promotion of community based alternative livelihood projects around the forest, among others. 2. Land ownership, utilization and management A national land policy has been formulated and a comprehensive land reform programme is due to be implemented, geared at improving sustainable land use and management. The
43

National land Policy specifically seeks to address the problems of land shortage; land ownership and fragmentation; and related conflicts, to improve production. But the main issue of debate in the land sector, currently, is reviewing the legal and policy framework to make land an effective instrument of production and creation of real wealth (using it as collateral) and improving land transactions as an incentive for optimal market oriented investment, and sustainable utilization3.
(a) Re-organising land utilization through promotion of grouped settlements (imidugudu in rural areas and zoning of land for agricultural activities, to alleviate the pressure of rural land and avoid land wastage. The Imidugudu concept was initially helpful in resettling refugee returnees amidst scarce land resources, and based on its proven potential to address land problems, the GoR has transformed the programme into a vilagisation policy to ensure optimal and rational utilization of space. According to the Government officials interviewed, the Imidugudu concept is being pursued to help reduce the fragmentation of land into further uneconomically productive units; ameliorate the shortage of land for settling the landless; and to ease the cost of providing basic infrastructure such as water, roads, schools and other amenities to rural communities. Resettling people in grouped settlements will, however, only be successful if appropriate incentives are provided, notably, provision of social and economic infrastructures such as safe water, roads, markets and schools, and preferential support to increase production on the allocated small plots of land through agricultural extension. The other issue relates to ensuring that settlements are relatively closer to cultivated plots for individual households.
(b) Urbanisation is being encouraged through intensive skills development and expansion of various sectors such as industry and services (e.g. tourism). The GoR has adopted a strategy under the energy policy to extend the electricity grid to all urban areas to facilitate the expansion of non agricultural economic opportunities. Currently, the rate of urbanization is significantly high primarily due to rural – urban migration of mainly the poor in search of employment. Although the level of urbanization in Rwanda is still among the lowest in sub - Saharan Africa (17%), this is an issue of concern especially as it places real challenges to urban authorities which are already institutionally and financially weak. In fact, there are concerns that some urban authorities (Kigali city, Ruhengeri and Butare Municipalities) face a crisis of service provision and controlling the escalating slum areas. In Ruhengeri Municipality, the day time population is estimated at 200,000, although the official figures for residential population is around 44,000. The difference is accounted for by the thousands of poor people who stream in from the rural areas in search of employment ion the wake of increasingly landlessness and declining productivity of available cultivated land. 3. The Rural Development Strategy (RDS): under this strategy, the GoR is pursuing the following policy actions:
3 Under the current legal and policy regimes, all land is vested in the state, and land cannot be easily transferable in market transactions. This presents real disincentives for long term investments including investment in conservation such as afforestation and agro-forestry.
44

(a) Promoting the use of external agricultural inputs (fertilizers), improved seeds and
livestock breeds. It was expected that intensive use of fertilizers would be encouraged through subsidies on import duties and extension services, but farmers have complained that such subsidies and tax waivers have not been implemented, and access to external inputs remains difficult for most farmers.
(b) Expanding non-agricultural employment in the rural economy, so as to alleviate
pressure on the land; address the plight of landless people; and discourage unprecedented rural – urban migration. Currently, the major intervention in this regard is the labour intensive public works programme (HIMO) being implemented since 2003, to cover rural infrastructures (roads, bridges, terraces, etc). It is hoped that this will increase off-farm employment opportunities for the rural poor, and absorb the many unemployed youths most of whom have no land and lack the requisite skills to participate in the non agricultural sectors. With respect to environmental conservation, HIMO is playing a critical role in programmes such as soil conservation through terracing. Currently, however, there is no data on the projected number of jobs that would be created in each province over time, to assess the anticipated impact on poverty and the environment.
(c) Empowering rural poor to plan and manage social and economic projects on their
own, by providing financial support to microprojects that address the plight of the poor. The Ubudehe is a programme to encourage the poor to identify their own development needs, prioritise them and mobilize resources using a collective responsibility approach. The national programme to empower the local communities in planning and project implementation is expected to provide up to € 1,000 for each cell to finance their local projects. Other interventions include the social infrastructure project under the Local Government Ministry which identifies the poor households and provide livestock as start-up capital for income generation.
(d) Evolving a pro-poor micro-finance policy and creating enabling environment for
pro-poor micro-credit services: It has been argued that the apparent low utilization of credit facilities by the rural poor despite the presence of credit institutions is due mainly to low monetization of the rural economy (MINECOFIN, 2003). However, in-depth analysis of the policy framework and the credit conditions as well as recent evidence from the field, suggest that the problem is more to do with the generally stringent credit conditions and terms that make such credit facilities unavailable to the poor, and fear of risk (poor performance) arising from inadequate capacity to manage credit financing. For instance, to obtain a loan from Banque Populaires, a cooperative based financial institution with the largest network of rural branches, requires collateral security, yet land – often the only available asset for the rural people, is not acceptable because of the legal framework that vests all land ownership in the state.
The investments suggested above have a high possibility of increasing productivity per acre of land; encouraging optimal land utilization and conservation; and ultimately
45

sustainable food security and household incomes. However, their adoption by the poor will require a critical analysis of and integration into existing livelihood strategies pursued by the poor; as well as effective linkages between research – extension and farmers. As such, therefore, appropriate mechanisms must be devised to encourage genuine participation of local level institutions. In this regard, the role of local cooperatives and NGOs in improving agricultural production and environmental conservation based on new technologies, cannot be underestimated, as demonstrated by the case of Cooperative de Developpement Agricole et Forestier (CODAF) – Ruhengeri in box 2 and the Association for the Conservation and Protection of Environment (ACAPE), Gisenyi in box 3 below.
Box 2 below illustrates how COODAF mobilized smallholder farmers and transformed them into commercial oriented farmers using highly productive scientific technologies (quality seeds, pesticides, and fertilizers) and have promoted environmental protection through raising tree seedlings and planting trees.
Box 2: Role of local CSOs in poverty reduction and environmental management. – CODAF The Cooperatve de Developpment de la Agriculture et d’ Forestiere (CODAF) is a local farmers’ association based in Ruhengeri with membership and operations in Ruhengeri and Gisenyi provinces. CODAF has grown from a small informal organization to a large network of farmers, employing technical field officers, accountants and administrators. CODAF raises and distributes quality crop seeds and tree seedlings, and has field extension experts that monitor and follow farmers. It has planted several hectares of forest in the hilly areas of Ruhengeri and Gisenyi. CODAF works with the National Seed Certification Service (SNS), agricultural research institutes (ISAR and ISAE) and the national extension system under MINAGRI. The results have been impressive. CODAF members have better production levels than non members, while ISAR and SNS rely on them as a link to farmers in regulating seeds and monitoring the performance of new varieties. In the area of environment conservation, several hectares of forest have been planted and tree seedlings are availed to farmers and others at reasonable price, in addition to awareness raising campaigns. Through CODAF, farmers are able to market their produce at better prices, and have access to agricultural inputs such as fertilizers, farm implements and seeds at reasonable prices or on credit. CODAF also assist farmers to access loans from micro institutions and guarantee security. The CODAF experience is a perfect example of how local cooperatives (formal and informal) can play a critical role in addressing poverty - environment issues, and act as a link between decision making institutions and local communities. Institutions such as CODAF could be given incentives to reach out to the poorer communities.
Box 3 below shows how urban residents in the lake side town of Gisenyi have developed their own initiatives to clean the environment.
46

Box 3: Local Community initiatives in urban environmental protection – the experience of the Association for the Conservation and Protection of Environment (ACAPE), Gisenyi. Gisenyi town is one of the expanding urban areas where waste management is a major problem. It is even more serious considering that the town is located on the banks of the Lake Kivu and in the vicinity of active volcanoes. In the recent past, the town has experienced some of the worst impacts of the great lakes conflict – reflected in the influx of refugees. Waste generation from industrial (including breweries), commercial (mainly recreational, hotel and fishing) and domestic activities, has increased in the recent past, yet the capacity of the Municipal authorities to collect and dispose off the waste is low, largely due to financial and institutional constraints. The result has been the pollution of the Lake Kivu which is a key asset for fishing, recreational, transport and water for domestic use. In a bid to prevent pollution and conserve the environment, 8 residents of the town started an association to collect and dispose off garbage, clean the lake and its surroundings, carry out sensitization of the communities and other environmental conservation activities. Todate, the association has 40 members, and is legally recognized by the authorities. The scope and scale of activities is limited by funds and institutional capacity, but ACAPE has recently received some limited funding from the Gisenyi Municipal Council and international agencies like UNICEF and World Health Organization (WHO), after making some considerable impact on the ground. Strengthening such institutions and initiating collaborative arrangements with them could help to effectively address poverty-environment problems.
4. The Environmental protection and management policy seeks to integrate environmental impact assessment and environmental accounting practices into development projects and plans, so as to promote environmentally sound development activities. Recognizing the heavy dependence of the Rwandan economy on the natural resources and the fragility of the environment, the GoR is pursing the following initiatives:
• comprehensive legal framework: an organic law on environmental protection and
the guidelines for environmental assessment have been enacted to protect all forms of the ecosystem including wetlands, forests, water bodies, and control of pollution. At policy and projects level, the new environmental law provides for strategic environmental assessment (SEA) as a mechanism for ensuring that environmental issues and concerns are mainstreamed in all policies and plans, and that sectoral policy formulation and implementation processes take into consideration the likely impacts on environment. Environmental Impact Assessment (EIA) has been made mandatory as a tool to promote environmentally sound development projects. However, these policy and regulatory actions have yet to be operationalised and they will require considerable capacity building support.
• institutional framework for environmental management: The establishment of the
Rwanda Environment Management Authority (REMA) indicates progress towards promoting environmentally sound development, and demonstrate that there is considerable political will to pursue environmentally sustainable development.
47

There are also indications that the environmental management structures would be extended to decentralized structures.
While SEA and EIA would assist to make pro-poor environmentally sensitive national
policies and ensure that the likely impacts of development actions on the poor and the environment are predicted and appropriate compensations made, operationalisation of these concepts would require political will and commitment to environmentally sound economic decisions; transparent and accountable systems to facilitate effective compliance; as well as adequate financial and human resource capacity support to manage and sustain the regulatory and monitoring functions of relevant institutions such as REMA.
With regard to implementation of the regulatory instruments, there seems to be concerns that no adequate mechanisms are in place to protect the poor from the likely loss of livelihoods as a result of enforcing the new environment laws. And, as the case of the closed brick making ventures in the wetlands of Kigali rural province shows (see Box 4), there is need to consider alternative livelihood options to avoid the backlash of such otherwise well intended regulatory measures. It should be emphasized, in this regard, that issues relating to compensation for loss of livelihoods resulting from new forest or wetland protection laws, and mechanisms to ensure continued intergenerational access to natural resources, are fundamental to poverty reduction and sustainable development in Rwanda, and must thus be given priority in the sectoral strategies and actions.
The general observation is that most of the proposed policy actions are of the regulatory nature i.e. imposing laws and restrictions, and few policies seem to include innovations and incentives to support alternative livelihoods and environmentally sound development practices (e.g. subsidies on fertilizers, incentives for tree planting, etc have not been implemented). This, nonetheless, is not to overlook the fact that at project level, a number of initiatives are being implemented, albeit at infancy and on small scale, to address issues of energy, livelihoods and sustainable agriculture, among others.
It should be understood, however, that to protect the rights and livelihoods of the poor, there is need for legislative guarantees to continued access by the poor to the natural resources or where not practical, the poor should be compensated by way of alternative livelihood sources / opportunities.
48

Box 4: Effects of recent Wetlands legislation on rural livelihoods. Brick making is one of the expanding economic activities especially as the construction industry grows. As most constructors prefer clay bricks because of high quality, wetlands have suffered the wrath of these activities, which provide employment to thousands of unskilled often rural poor Rwandan people. However, the recent legislation on Wetlands has led to the closure of most brick kilns and banned the brick making activities in wetlands in a bid to protect the remaining stretch of this important ecosystem. One of the most affected areas is Kigali rural province where the activities are most prevalent. The recent closure of brick Kilns has led to loss of jobs for thousands of mainly unskilled youth who are currently redundant. Discussions with some of the affected people and some local authorities reveal a major concern for loss of livelihoods. There is general agreement that decision makers need to evaluate the socioeconomic impacts of such legislations and appropriate options explored before they are implemented. Failure to re-absorb these people into the economy could constitute a serious environmental crisis, as they may end up in the slums of Kigali or join illegal charcoal burning activities, which is equally bad if not worse. This example is a typical case of poverty-environment interactions, and demonstrates the need for decision actions based on wider livelihood analysis.
4.2 Current Planned Policy Actions in the Energy Sector
As pointed out in previous texts, energy and water crises are some of the main challenges currently facing the Rwandan economy. In response to the recent energy crisis, the GoR has initiated some eight policy actions to provide remedies in the short, medium and long term, viz:
(a) investing in diesel generators to provide additional power supply, as a mitigation
measure for the current crisis. The investments would include installing plant with the generation capacity of 12.5 MW in 2004, 15 MW in 2006 and a standby generator for Kigali of 10 MW by 2007;
(b) investing in gas and mini hydro-power at various feasible locations including exploring
the Lake Kivu methane gas potential; geothermal and Rusizi hydro. Initial pre-feasibility studies for the methane gas project have already been undertaken.
(c) rehabilitation of the existing grid and expanding urban connection, including installing
efficient network control systems and connecting all urban users.
(d) investing in rural electrification by extending the current grid to rural areas, and exploring the potential for mini / micro-hydro and solar energy potentials;
(e) promoting efficient utilization of fuelwood and creating alternative energy sources to
address the over-dependency on fuelwood: The project interventions considered in this regard include:
49

charcoal training and efficient kiln programmes to improve carbonization with
an expected savings of 11%; introducing more efficient technologies (energy efficient stove designs); investing in and promoting wood substitutes targeting large scale users such as
institutions, schools (biogas, peat and papyrus); and promoting reforestation and plantation development.
(f) Reforming the energy sector through legal and regulatory framework reviews and
institutional capacity building to manage a liberalized energy sector, particularly covering electricity and gas. Project interventions planned in this policy area include improving efficiency and minimizing losses through modern information management systems; modernization of installations through investments in technical audits of customers, reforming billing systems and extending vending and cash meters to rural electricity users, among others.
(g) Enhancing gas utilization: three projects are planned mainly to connect the Gisenyi
pipeline to customers; extend the pipeline to the cement factory and other industrial/ commercial establishments to replace oil; and extending the pipeline to Kigali with rural/ low pressure lines for rural gasification.
(h) Mitigating the impact of oil and petroleum products on the economy: It should be
recalled that at the height of the energy crisis in 2003, the value of petroleum imports alone were equivalent to 85% of Rwanda’s export earnings. While oil products are unlikely to be accessible to most of Rwanda’s poor in the medium term even if the costs were to reduce by half, the diversion of domestic resources to oil imports bears significant negative impacts on public investment allocations to poverty reduction activities and the rural economy generally. Petroleum is pivotal to key sectors such as transport and industry. To mitigate this crisis, the GoR is exploring the feasibility of extending the oil pipeline from Kampala (Eldoret) to Kigali; and rehabilitation and expansion of storage facilities, to increase reserves in order to cushion the country against future price increases.
While these interventions could alleviate the pressure on forest and biomass resources, and in the long run address the hydroelectricity generation crisis, the most appropriate pro-poor policy interventions that would have immediate and direct impact on the poverty-environment nexus are under policy action 5 on wood, charcoal and kiln training, and re-forestation, considering that the current dependency on fuelwood by both the poor and non-poor in Rwanda is likely to continue in the foreseeable future. But, given the spatial differentiation of the nature and scale of the impacts of deforestation and energy crisis, and considering resource limitations, the implementation of resuscitative interventions e.g. reforestation/ afforestation and soil conservation programmes need to take into consideration geographical disparities to be effective.
The other main concern with regard to the proposed energy policy actions relate to inadequate funding, as shown in table 4 below.
50

Table 4: Current Energy Policy Actions and funding Status Total Funding
need (US $) Funded (US $) Funding gap
(US$) % Funding gap (US$)
Current Crisis 24.8 5.0 19.8 79.8 Gas & hydro generation
174.2 32.5 141.7 81.3
Rehabilitation & urban connections
104.0 37.3 66.7 64.1
Rural Electrification 27.2 0 27.2 100 Wood & Charcoal 37.6 0 37.6 100 Institutional/regulatory reforms & Progress
9.7 0.8 8.9 91.8
Gas utilization 41.6 3.1 38.5 92.5 Petroleum Products 2.9 0 2.9 100 Total ( 6 yr period) 422.0 78.7 343.3 81.4 Source: MINIFRA, 2004
From the table 4 above, it can be observed that while most of the planned projects are urgent, only about 23% of the required investment funding has been secured. In fact, for the projects which are more critical to the rural poor, i.e. wood and rural electrification, no funds at all have been secured. In general, however, most of the proposed policy actions remain on paper, and even those which are funded under existing projects, there are insufficient mechanisms to monitor them in the current PRSP indicators.
4.3 Ongoing Interventions
Annex 2 presents a directory of selected programme/ project interventions that are addressing poverty – environment issues. These interventions address the P-E issues in the following domains, among others:
1. ecosystem protection, including resource assessment, valuation and conservation; 2. mainstreaming environmental conservation into the livelihood activities of the poor
at individual and household levels, as well as in community development projects; 3. strengthening institutional framework for environmental legislation and monitoring; 4. building human resource capacity for environmental policy analysis and integrating
environmental issues into sectoral and local government plans; among
Although these interventions constitute progress in addressing poverty-environment issues, there are concerns that they are not coordinated and may not realize the anticipated impacts if they are not harmonized. In fact, current interventions in environment and sustainable natural resource management reflect duplication and often conflict in approach, which need to be addressed if they are to be effective.
51

5.0 POVERTY-ENVIRONMENT ZONES AND PROPOSED POLICY OPTIONS
5.1 Poverty – Environment Zones and Proposed Interventions
From the analysis of spatial information on P-E issues, Rwanda can broadly be zoned into 4 major clusters. This is partly explained by the observation that the linkage between livelihoods and natural resources generally follows a pattern that manifests spatial differentiation in the biophysical environment from the mountain forest ecosystem in the North and North West through the gentle hills and plains of the South and Central, to the semi arid savannahs of the East. The interplay between terrain and climate with population density and livelihood strategies (livestock in the east, forestry and intensive crop farming in the west) and the differences in infrastructure development and settlement patterns, explain the poverty – environment nexus in the different areas. These have constituted the principal criterion for clustering into 4 zones and the additional one of Kigali city which is entirely an urban conglomeration. For purposes of planning interventions, a fifth category has been included to reflect critical P-E issues that cut across the country. The proposed P-E clusters are summarized in the following matrix. Matrix of the Poverty – Environment Zones and Proposed Policy Options.
Poverty-Environment Cluster/ zone
Major Poverty-Environment problems/ Issues
Proposed Policy Options/ responses
1. Ruhengeri, Gisenyi Byumba, Kibuye & parts of Cyangugu (Busozo)
Deforestation, soil erosion Land slides & volcanic
eruptions; Safe drinking water.
Reforestation (forest & ecosystem rehabilitation & collaborative forest management;
Soil conservation technologies (terraces, agro-forestry);
Allocation of land to land less & people living in/around forest reserves;
Early warning & Disaster Management system; Develop off-farm employment (including eco-
tourism) 2.Gitarama, Gikongoro, Butare, parts of Kigali Ngali
Soil erosion & land degradation;
Floods Food insecurity
Soil conservation activities (terracing, agroforestry) & land improvement through intensive use of organic fertilizers.
Afforestation. Creation of buffer zones around critical wetlands
& water bodies to protect the water bodies and control floods;
Small scale environmentally sound irrigation ; 3. Umutara, Kibungo, Bugesera
Persistent drought leading to water scarcity & lack of pastures;
Overstocking beyond the carrying capacity of rangelands;
Drought Early Warning System, including intensified use of agro-meteorological information;
Provision of water (bore holes) & for livestock (valley dams);
Develop small scale irrigation programmes; De-stocking through livestock improvement; Rationalise land use. Create buffer zone to control conflicts & diseases
resulting from wildlife-human/livestock
52

interactions; Implement dryland agro-forestry.
4. Kigali City Unemployment; Sanitation; Water pollution; Poor housing; Infrastructure
Extension of potable water & sewer connection to areas occupied by the poor;
Construct & co-manage public water & sanitation services with the organized poor;
Extension of roads & waste collection to the poor areas (slums);
Land use zoning & low cost housing schemes for the poor landholders;
Protection of poor people’s rights to land & markets through legislation;
Provide incentives to attract investors in areas/ sectors that generate jobs for the poor.
5.Generic (nationwide) • Population explosion; • Lack of land for
settlement & agricultural expansion;
• Destruction of wetlands • Energy crisis; • Indoor air pollution due to
inefficient energy sources; • Environmental health
(malaria, malnutrition);
Early warning systems Creation of buffer zones to protect wetlands &
water bodies. Expansion of non agricultural jobs. Modernise rural markets & develop marketing
information systems; Implement integrated reproductive health &
population control programme; Empower local communities to participate in
decision making thru deepening decentralization & democratization (District Councils & CDCs).
Improve social & economic infrastructure to make Imidugudu more attractive to the population;
Develop alternative energy technologies (e.g. rural electrification, energy saving stoves).
Skills development through vocational education & apprenticeship.
5.2 Proposed Policy Options In identifying the appropriate policy interventions to address the P-E concerns within the context of the PRSP, four major factors have guided the policy analysis process and recommendations on possible policy interventions:
(i) nature of the environment: the current state of Rwanda’s biophysical environment can be described as fragile, severely degraded and overstretched. Its ability to regenerate itself is at an all time low largely due to population pressures, inappropriate use and inadequate appropriate interventions.
(ii) Intensity and characteristics of poverty: as stated in the PRSP, Rwanda’s poor are
characterized by lack of economic assets (land, employment opportunities, employable skills,); illiteracy; tendency to live in marginal areas (environmental vulnerability); and eroded social capital which has aggravated social vulnerability through widowhood; orphanage; (due to genocide, HIV/AIDS and natural calamities). Social capital is central to livelihood strategies among Rwanda’s poor,
53

and hence addressing social vulnerability concerns by reviving the traditional values (Umusanzu, Umuganda, Ubudehe, etc), is a major strategy under the PRSP.
(iii) existing and/ or evolving interactions between state and non state actors
(increasing role of civil society and private sector): there is commendable progress in building state institutions for participatory governance, economic management and environmental protection, but the process of developing a strong civil society with local ownership is slow and needs to be supported. In this respect, the presence of numerous largely informal grassroots associations and cooperative groups mainly revolving around common livelihood interests and strategies is an important base for building partnerships with local communities to address the poverty and environment concerns more cost-effectively and sustainably.
(iv) spatial manifestation of poverty-environment problems: Notwithstanding the small
geographical size of Rwanda and the apparent cultural homogeneity, there are visible differences in the biophysical environment and socioeconomic characteristics which have tended to influence the different livelihood strategies that people in the different agro-ecological zones pursue. Because of the differences in resource endowment between the North, East and Southern regions of the country, the nature and extent of poverty, and the P-E issues show significant differences. As such, restorative intervention policies and programmes need to take care of these spatial differences.
Based on this analysis and building on previous research on Poverty –Environment indicators (e.g. UNDP, DFID, EC & World Bank, 2002; Shyamsundar 2001 and A. Osuntogun, 2002), a number of broad policy strategies are proposed within the framework of the PRSP. The proposed policy options are discussed in the following texts. The matrix in annex 1 summarises the proposed policy actions, and are categorized under fiscal, institutional, and legal/regulatory frameworks using the analytical framework developed by Ambler.J, 19994.
1. Protecting the asset base of poor people - focusing on conserving existing forests, wetlands, controlling erosion, and safeguarding the poor’s access to and ownership of land, markets and other economic assets. As pointed out in the PRSP, the most important assets for poor people in Rwanda are: land, forest and tree resources, rangelands, and water. However, over the years, their access, ownership, control and management have significantly declined and the downward trend is further complicated by the continuing influx of refugee returnees. Recent policy and legal reforms have also led to significant loss of access to forest/ tree resources and wetlands thereby raising concerns for livelihoods of dependant communities. Women, youth and other vulnerable groups are especially affected. It should be recalled that the natural assets available to the poor differ in the different areas and some sectors are more important for some poor communities than others. For instance,
4 John Ambler, 1999. Attaching Poverty While Improving the Environment: Practical Recommendations. Document prepared for the UNDP/ Poverty Environment Initiative.
54

Gisenyi, Ruhengeri, Gikongoro and Cyangugu have natural forests and hence have considerable number of poor people whose livelihoods depend mainly on natural forest ecosystems, while Umutara is characterized by rangelands, and livestock reared in an agro-pastoral system constitutes a major source of their livelihoods. In fact, 30% of the total livestock in Rwanda are in Umutara province, underscoring the economic importance of rangelands. Given this scenario, appropriate policy actions to protect the critical asset base of Rwanda’s poor would entail: (i) guaranteeing access to protected areas and other ecosystems critical to the poor’s livelihoods: One of the most important sources of livelihood for Rwanda’s poor, which is threatened by resource degradation, is the arts and crafts industry (Ubukorokori). This sub-sector depends mainly on wood and non wood products for raw materials often from natural forests, wetlands and other serene natural ecosystems, but is threatened by degradation which has reduced the quantity and quality of raw materials, and recent legislation which seek to outlaw their access. While it is necessary to regulate access and utilization of these resources to conserve biodiversity and protect the ecosystem, there is need to protect the access rights of the people who depend on these resources for their livelihoods, as loss of such rights would not only escalate their poverty situation but could result in further degradation. The resource dependant poor communities need to be integrated into the natural resource management regimes. But for this to happen, institutional changes are required so that relevant regulatory agencies (e.g. REMA, ORTPN, Forest authorities, local authorities) see the poor as part of the solution and not the cause of the problem, and then work with them in a collaborative and mutually beneficial manner. There is appreciation that collaborative management approaches would not only guarantee continued resource access by the dependant communities but also promote sustainable conservation. (ii) Review the legal framework relating to land ownership and management to give the poor greater control over the main asset they have. This would also provide incentives for long term investments as well as provide opportunities (e.g. collateral security) to access credit and markets from institutions like Banque Populaires. Concerns have already been voiced even in parliament in respect to the land law and it is hoped that the law would be reviewed. However, considering the critical role of land in the development process (settlement, agriculture, etc), the legal reforms relating to land need to be discussed more transparently and beyond political and intellectual confines to embrace the aspirations of all actors. (iii) Investing in nationwide soil conservation activities to rehabilitate and protect the already depleted soil resources from further degradation, and to restore the critical watersheds. 2. Promote investments that increase and/or diversify livelihood opportunities for the poor, thereby expanding their asset base –to alleviate the pressure on land and natural resources. Expanding the asset base of the poor implies increasing choices for livelihoods, which would alleviate the pressures on the increasingly narrow resource base but also creating flexible
55

market opportunities. The policy actions pursued under this strategy would entail creating alternative options and enhancing the existing resource base namely land and labour. Appropriate interventions in this regard should include:
(a) Promoting community based ecotourism activities for people living in/ around protected areas and natural ecosystems with such potential. These opportunities could be explored for Ruhengeri; Gisenyi, Cyangugu, and to a considerable extent in Gikongoro and Kibuye provinces. The target communities should, however, be organized and supported in homogenous interest groups (e.g. unemployed youth, women, widows, orphans, landless, etc) and then provided with the required training and logistical support. To effectively engage government and attract support from donors and private sector, it should be mandatory for these groups to be established as legal entities, and be assisted to manage their affairs democratically and transparently. Extreme care is, however, required to ensure that these initiatives are not hijacked by the powerful non poor at the expense of the target beneficiaries. In most provinces, women and youth are being organized into local associations with no viable support, so providing technical (including training) and financial support to existing groups would constitute an entry point for such interventions.
(b) Promoting cultural tourism – this is suitable for areas like Butare, Gitarama which
have rich depositories of Rwanda’s culture that is routed in ancient history.
(c) Promoting the adoption of farm forestry/ agroforestry technologies to enhance optimal utilization of rural land resources and improving agricultural land use. Farm forestry, based on high value, fast growing agro-forestry tree species, would enable farmers grow food, cash and tree crops/ fruit trees on their small pieces of land at the same time. Given Rwanda’s terrain, farming systems and the generally small landholdings, agro-forestry technologies would offer a number of advantages:
(i) increased and diversified outputs/ products from the land, hence the possibility
of increased household incomes; (ii) growing multipurpose tree species which offer, benefits like fodder (for
livestock) and firewood (or fruits), thereby alleviating pressure on forests; (iii) most agro-forestry trees have the vital characteristics of stabilizing the soil and
improving soil fertility. This would assist to restore the extensively degraded arable land in many areas. In designing interventions, special consideration should be given to upstream farmers as an incentive for protecting of the watersheds, and vulnerable groups such as female-headed households, those with very small land units and the extreme poor. In this regard, MINAGRI, ISAR, NGOs and other actors, would have to conduct technical suitability and field testing of technologies prior to implementation to adapt them to the specific local conditions and farmers’ needs. Already, there are programmes to support local tree nursery operators but most of these do not raise tree seedlings for agro-forestry species.
56

(d) Promoting intensive livestock production by enhancing/scaling up the current programmes for distribution of modern livestock breeds to the poor: promoting indoor livestock production systems (zero grazing) offers multiple advantages in addressing the poverty and environment concerns. Diary cows for example provide ready incomes from sale of milk and off-springs; provide proteins that are essential for fighting malnutrition and common illnesses among children, pregnant and lactating mothers; and the droppings provide organic manure for increasing/ maintaining soil fertility/ productivity. This option is highly suitable for densely populated areas, high soil degradation rates, low per capita land holding and fewer livestock, especially in the north, east and some parts of central regions.
For this to succeed, however, these interventions require considerable investments in maintenance and agricultural extension systems, for which the poor are unable without external support. It is, therefore, critical that sufficient public resources be invested into strengthening public extension services taking into consideration the ongoing decentralization process in which most service delivery responsibilities have been devolved to local governments.
(e) Promoting use of environmentally friendly agro-inputs (mainly fertilizers) to increase
production and maintain soil productivity. This could be encouraged by a combination of aggressive extension services to raise awareness among farmers, and providing subsidies to import and distribution systems. However, to protect farmers from unscrupulous exploitative tendencies of private sector, farmer groups and cooperatives could be used to ensure proper targeting of beneficiaries and to prevent diversion of support by unscrupulous intermediaries.
(f) Investing in small scale irrigation schemes: Irrigation of whatever scale, requires
considerable investments in technology, which the poor cannot afford. However, given its potential for expanding acreage under production, and improving food security through expanded production of cereals, the GoR, needs to consider co-investing in these ventures with the private sector and the poor smallholder farmers, on out-grower basis. Later, as the schemes’ benefits become visible, other private investors can be attracted, and as farmers develop the required financial and organizational capacity, ownership and management can then be transferred to farmers. Presently, irrigated rice is produced in Butare, Cyangugu, Rwamagana (Kibungo) and Umutara. There is, however, unexploited potential for irrigation in the marshlands of River Nyabarongo (Gitarama, Bugesera/Kigali-rural), River Akagera and Akanyaru which span several provinces, especially those affected by drought. This option is in line with the GoR’s policy strategy of expanding rice production as a long term measure to ensure food security and reduce dependency on imported cereals.
(g) Expanding rural off-farm employment opportunities: the present programme of labour
intensive public works (HIMO) is a suitable programme, but addresses environmental related poverty situation of only a few categories of the poor. Off-farm economic opportunities for the rural poor will be enhanced by a combination of: expanding agro-
57

processing and marketing and expanding productive skills opportunities for the rural communities targeting the many young school dropouts and school leavers.
3. Promoting collaborative natural resource management and co-investing with the poor The emerging initiatives in collaborative natural resource management such as Nyungwe forest conservation that focus on empowering the local communities to conserve natural forests, constitute a positive step towards ensuring sustainable forest management. It is hoped that the proposed arrangement would be extended to other protected areas such as Akagera National Park in which population-wildlife conflicts threaten the future of the park resources, as well as in other critical sectors such as water resources management. Some of the possible areas in which the Government could invest and manage social and economic ventures with the poor include:
(a) development and management of eco-tourism centres in/ around protected areas; (b) construction and management of urban water and sanitation facilities (toilets, water
stand taps); (c) collection and disposal of solid waste in urban areas.
As most of these ventures do not require a lot of sophisticated skills but formal organizational structures and minimum managerial capacity, the local governments can be encouraged to collaborate with the poor communities, organise them into formal legal entities and enter into joint ventures with them to manage these undertakings on reasonable mutually rewarding terms. For instance, public toilets and water stand taps in Kigali city would generate employment for some unemployed youth in addition to extending essential sanitation and safe water services the poor. Extreme care should, however, be taken to ensure that the targeted poor are not sidelined or excluded altogether, and this calls for transparency on the part of the concerned actors. In addition, it should be emphasized that for such partnerships to work there needs to be greater commitment and active participation by all actors (central and local governments, relevant non state actors and the communities). Considerable efforts would, therefore, be required to build productive and sustainable partnerships with the poor communities. In developing such partnerships, emphasis must be placed on: empowering and bringing on board, the poor as actors in identifying their problems and
seeking their own solutions, and engaging them as real partners and not mere beneficiaries of development programmes. The Ubudehe concept could be followed in this regard;
creating incentives for the poor to mobilize resources for poverty eradication and for
private sector to invest in areas and sectors that directly improve the welfare of the poor through employment, markets and other income generating opportunities. In this regard, recognizing the culture of over-dependency on the state promoted by colonialists and perpetuated by post colonial Rwandan governments, extreme patience and innovativeness
58

is needed with regard to public expenditure transfers to local levels – these resources should be used as incentives to stimulate or enhance local self initiatives and capacity building, and environmental sustainability should be an in-built criterion.
appreciating the need to transfer access to and ownership of economic and social assets to
the poor, not just as part of the process of building ownership but to promote sustainable utilization and management. There is evidence that transferring ownership of assets to poor people enhances their stewardship and sustainability.
4. Investing in and promoting infrastructure and technology development Increasing production to ensure food security and raise household incomes of the poor; reducing pollution that impacts on the health and productivity of the poor; and ensuring sustainable availability of energy, can be realistically achieved by adopting scientific technologies, but these technologies must be “home grown” or adapted to the Rwandan local environment, as this is most likely to ensure their appropriateness, acceptability and sustainability. The GoR therefore, needs to reallocate considerable public expenditure resources to the development of pro-poor technologies and extending essential infrastructures to the areas where the poor live. In the domain of technology development, the following policy actions could be undertaken: (a) achieving sustainable agricultural production
• expanding land under irrigated agriculture focusing on smallholder farmers and small scale irrigation facilities;
• enhancing use of external inputs (notably environmentally friendly fertilizers) to enhance soil fertility;
• promoting use of high value crops, livestock and tree breeds, which have the desirable characteristics of high yields/ productivity; fast growth and more resistant to pests and diseases;
(b) addressing the energy crisis through:
• increased public investment in research and extension and exploring feasibility for alternative energy sources (biogas, solar, thermal, non wood biomass); and technologies that promote efficient energy use (energy saving electrical appliances, improved charcoal stoves). Although it is unlikely that the extreme poor would afford alternatives to fuel wood in the medium term, the indirect positive impact on the poor would still be significant. Creating alternative energy sources for large scale fuelwood users (institutions, schools and industries), would greatly alleviate demand for wood fuel and hence the pressure on forests and woodlands. The GoR could explore the possibility of establishing an Endowment Fund for Scientific Technology Research to ensure sustainable funding of a nationally owned research agenda.
• rehabilitating the watersheds through reforestation/ afforestation programmes and
encouraging private tree planting especially in/ around the critical ecosystems (river banks, steep hills), to restore the water levels of power generating water bodies (e.g.
59

Lakes Ruhondo and Bulera, River Rusizi); and implementing soil conservation technologies. Appropriate institutional support to national research and development institutions (ISAR, ISAE, IRST, KIST, UNR, ) is required;
(c) promoting urbanization based on the principle that infrastructure development would stimulate economic activities, which in turn attract people to urban areas – but the poor must be empowered to participate in the urban economy, otherwise the current environmental crises faced by urban areas (particularly Kigali city) could instead escalate.
• encourage investment in appropriate (low cost, environmentally sound) technologies
for sanitation and waste management. These would embrace ecological sanitation (ECOSAN) toilets; expanding drainage channels to areas occupied by the urban poor; and providing facilities for solid waste disposal;
• invest in low cost housing for the poor. To ensure sustainability of such investments, appropriate cost recovery mechanisms can be developed so that the housing funds are revolving. The most appropriate arrangement would be a partnership with the private sector.
• extend essential social services i.e. public health centres; access roads; potable water; and public toilets and/ or central sewer connections to the areas occupied by the poor.
• explore the possibility of waste recycling – About 70% of the solid waste generated in Kigali city for instance, are organic, and if properly collected, can be converted into much the needed fertilizers for agricultural production. Feasibility studies must, however, be undertaken, and the reports used to identify and attract investors in the waste recycling ventures. A collaborative partnership between a local association and urban authorities in Kigali city, are exploring the potential of waste recycling into charcoal briquettes, with support from USAID. Whatever the outcomes, this venture should provide an important opportunity for solid waste management not only in urban areas but also in rural areas particularly in Imidugudu.
• improve local revenue collection and administration e.g. through appropriate service taxes to the rich urban dwellers, and then invest in improving the conditions of the urban poor. There are indications that these arrangements could be feasible especially in the city of Kigali and the Municipalities of Gisenyi, Butare and Ruhengeri.
For the Rwandan urbanization policy to work in favour of the poor and the environment, however, a number of strategic issues must be considered:
• there is need for capacity building support to urban local authorities to enable
them plan and develop essential infrastructures including economic opportunities targeting the poor, to address the plight of the many urban poor trapped in a vicious cycle of poor environmental conditions in the city of Kigali and surroundings;
• mechanisms to change the attitudes and perceptions of policy makers and local
government leaders about the poor - from viewing the poor as a nuisance responsible for the urban environmental problems to potentially productive people who can contribute meaningfully to the development process if they given opportunity. Unless the negative perceptions towards the poor change, there are
60

concerns that the current developments pursued by local authorities and private sector (especially in Kigali city) may worsen the situation of the poor, as these actions could lead to their further displacement to more marginal locations and deeper poverty.
5. Giving greater priority to poor areas and compensating the poor for investments they make on public goods and services. Whilst without sufficient scientific evidence, there is consensus that the current problems of floods, declining water quality and flow and persistent drought in Rwanda, are linked to deforestation and inappropriate agricultural practices by mainly upstream farmers. Recent hydroelectric power generation problems have, for instance, been blamed on the decline in water flow from Lakes Ntaruka and Bulera in Ruhengeri as a result of siltation of the water bodies. There are indications that other hydropower sources in the country i.e. River Rusizi in Cyangugu and Gihira in Gisenyi are similarly affected. Thus, there is need to specifically prioritise these areas and allocate sufficient public investment resources to actions that reverse this situation, notably in improving agricultural practices and protecting the watershed. It can be argued that providing appropriate and adequate incentives to upstream farmers (in hilly areas of Byumba, Ruhengeri, Gisenyi, Cyangugu, Kibuye) can encourage them to plant trees, utilize and manage their land and other natural resources in a manner that conserves the watershed and prevent erosion and other destructive effects that manifest downstream. This implies that the ongoing and planned new projects could be specifically tailored to target the affected communities especially in improving agricultural practices and compensating them for their labour and other efforts they put in to undertake conservation activities. In this regard, the food- for-work programmes used by the World Food Programme (WFP), Care International and other agencies for community projects in Ruhengeri and Byumba could be scaled up and extended to other parts of the country but with inbuilt mechanisms for sustainability to avoid a backlash of over-reliance on external food supplies. As this requires self initiative and mobilisation at local level, these efforts must be compensated to sustain the self motivation among the upstream dwellers, because they would, in effect, be investing private resources (labour, time, funds and land) to conserve public goods and services. In this regard, the GoR (through MINAGRI, MINITERE, MINALOC, CDF, etc) and the relevant development actors (NGOs such as Care International, Helpage, etc) need to consider integrated approaches to soil conservation in steep and densely populated areas that are critical for watershed protection such as Byumba, Ruhengeri, Gisenyi, Gikongoro and Kibuye.
61

6. Modernizing local markets while guaranteeing the rights of tenancy/ ownership by the poor The current marketing systems manifest major weaknesses in that market infrastructures are underdeveloped and communication infrastructures are inefficient or non existent, outside Kigali city and other urban areas. This situation partly explains the low prices fetched by farmers and the inability to address the food security problems. This perpetuates poverty as farmers cannot realize better prices, which in turn translates into inefficient production systems that erode the natural capital. Possible policy actions to address these concerns include:
(a) expanding productivity enhancing infrastructure i.e. electricity (through rural
electrification microprojects); rural roads, and telecommunications. Presence of such essential infrastructure for instance, will stimulate agro-processing thereby increasing value addition to agricultural products as well as reduce investment and transaction costs between farm level and market. In addition, such infrastructures will encourage development of non agricultural investments such as tourism and other service sectors, thereby diversifying and expanding the rural economy. There is evidence that cost effective, environment friendly rural electricity could reduce the poor’s dependence on depletable and unhealthy energy sources such as wood.
(b) modernizing rural markets, to improve the environment for commercial transactions
and minimize related losses, thereby increasing returns on investment for poor farmers. However, to guarantee access by the poor to the improved markets, there has to be mechanisms to restrain concerned local authorities from levying prohibitive fees, rates and rents that will lock out the poor. In addition, there is need for transparency and accountability in allocating market space and managing the local economic infrastructures so that incentives to the poor are not diverted, and that the local revenue generated is effectively invested in areas that improve the welfare of the poor. And one way to ensure this is guaranteeing representation of poor interest groups on committees managing such infrastructures, probably through affirmative action.
(c) developing market information systems to increase the marketability of rural produce
and raise bargaining power of farmers to get better prices for their produce. This would result in direct increase in household incomes, which could also act as incentive for farmers to re-invest in soil conservation technologies to ensure sustainable production. The current national Information and communication technology (ICT) programme implemented by the Rwanda Information technology Authority (RITA) offers an enabling policy environment.
In the forestry sector, restoring the capacity of Rwanda’s forests to provide energy, wood and environmental services would require the following policy interventions in the domain of market reform, planning and investment:
62

(d) increase the level of public resource allocations to forestry and ecosystem protection. Given the low level of private investments in forestry, the GoR will need to allocate sufficient budget resources to the sector to enable rehabilitation of the natural forest from the current 221,200 ha to achieve the targeted 30% of the national territory under forest cover by 2020; step up public and private investments in industrial forestry to increase wood production so as to close the huge gap between demand currently estimated at 8 million cubic metres, and the existing resource potential estimated at about 2 million cubic metres (MINAGRI/MINITERE, August 2003).
(e) Streamline markets and taxation structures especially for wood and non wood forest
products to reflect their real value including the opportunity cost of their existence or exploiting their alternative functions. This will stimulate responses in form of efficient harvesting and utilization techniques, better prices or returns to the forest dependant poor households, as well as incentives for investing in conservation (plough back) and motivation to use alternatives. Currently, no official pricing system / structure exist for non wood timber forest products in Rwanda, and their contribution to the national economy is not formally captured.
(f) provide incentives to encourage use of wood substitutes especially in the energy and
construction sectors. Already, there is increased use of metal materials instead of wood poles, and encouraging small scale metal fabricators (through preferential tax subsidies) would create a significant impact. Implementing these incentives would, however, require mechanisms to ensure that the poor are not affected, as expensive wood substitutes would obviously not be accessible to the poor.
(g) Implement fiscal incentives to encourage efficient wood production and working life
of wood products. Regulated harvesting of Government forests and provision of favourable loans for plantation development could make forestry more attractive to private investors. In addition, imposing high stumpage value on industrial wood production (timber, etc) has the potential to encourage efficient production systems (e.g. high recovery in conversion of round wood); and minimized losses in storage and use (timber treatment; better storage conditions, etc).
(h) review the licensing and concessions of saw millers, charcoal producers, miners, etc,
to control or regulate their utilization and management. The Forest authorities should, for instance, only license charcoal producers after certifying that they are using improved efficient carbonization kilns, to promote efficient charcoal production. However, the Government must first ensure that efficient kiln technologies are available to especially poor charcoal producers before such measures can be enforced.
7. Strengthening the development planning framework to enhance participation and control by the poor While this is being undertaken through CDCs under decentralization, and more relevant under Ubudehe programme, there is need to strengthen the capacity of local leadership (cell
63

and sector level CDCs) to identify and prioritise development projects, and to empower the poor to actively participate in and own the local planning process. Required actions in this respect include:
• creating enabling environment (including incentives) for emergence of grassroots civil society organizations;
• continuous sensitization programmes targeting poor communities; and • strengthening transparency and accountability at decentralized levels;
Although it is anticipated that sectoral decentralization will address institutional bottlenecks to local people’s participation in resource management; greater participation will only be possible if the following actions are considered priority, especially with regard to forestry, wildlife and tourism sectors:
deepen the current institutional mechanisms for accountability, transparency, and
representation, to effectively give power to the local people. This should be done through sensitization and more resource transfers, among others.
prioritizing capacity building of CDCs at the lowest levels to make decentralized
planning more participatory and responsive to the needs of the poor; integrate environmental management into local government development plans, and
strengthen the capacity of LGs and CSOs to monitor P-E indicators. Presently, the appreciation of the poverty-environment issues at national and decentralized levels is still low but is fast evolving, particularly with support from UNEP and UNDP. With the environment policy and an organic law on environmental management in place, and the political will to operationalise the recently established Rwanda Environment Management Authority (REMA), it is observed that the national capacity for sustainable environmental management is progressively being developed;
put in place mechanisms for enhancing local revenue generation as well as for
improved revenue sharing mechanisms and expenditure efficiency. Inbuilt strategies would, however, be required to maximize resource mobilization while promoting local participation. This should make services more relevant to the needs of the poor.
widen the current criteria for determining who are the poor in Rwanda to reflect the
nature of poverty in Rwanda which goes beyond low income levels to include such other factors as environmental vulnerability, to enable better targeting of interventions.
5.3 Implementation modalities
Mainstreaming environmental issues into the PRSP and eventually into the district development planning processes (DDPs), and integrating P-E indicators into the poverty monitoring system is noticeably urgent, and the ongoing PRSP review process presents an opportune moment. The recently established Task force for mainstreaming environment
64

into the PRSP process seems to have received support from UNDP and there are indications that the next PRSP will fully integrate environmental issues. Nonetheless, it is noted that there are practical limitations ranging from institutional and human resource capacity constraints, to budgetary inadequacies which could hinder or slow down the process. In view of these constraints and institutional limitations, therefore, it is recommended that the options suggested above could be implemented on pilot basis and then scale up depending on the outcomes and capacities already developed. The decision of which options to implement first would be based on what can be immediately implemented within the framework of national priorities, available resource envelope and present human resource capabilities, and taking into consideration the ongoing projects. However, even with the pilot based approaches, integrating P-E issues, will require high level of policy analysis skills; adoption of new technologies; and institutional capacity building. A number of ongoing interventions are already addressing some of the proposed policy actions, and hence, may not require a lot of new resources but re-orientation of existing interventions. In addition, the ongoing PRSP review presents an opportunity to incorporate them into the public expenditure structure and the poverty monitoring and evaluation framework.
65

6.0 CONCLUSIONS, MAJOR CHALLENGES AND THE WAY FORWARD
6.1. Summary and Conclusions
Since 2000, concerns for environmental conservation have increased at the central Government level and civil society interventions, even though many of these efforts are yet to move from policy and strategy to real action. The current initiatives at policy and intervention levels indicate that the GoR and development partners are now firmly focused on pursuing environmentally sound development. In this regard, the current PEM pilot project is an appropriate initiative in assisting to integrate environmental issues and concerns into the sectoral and decentralized plans and budgets, as well as poverty monitoring frameworks. Most importantly, however, the PEM will bring in the spatial analysis. There are several initiatives in addressing the P-E issues, including spatial information with GIS technologies. But these initiatives have tended to be sector specific and not recognizing the complex and integrated nature of poverty and environmental issues. Where such are generally scattered in various institutions/ ministries (e.g. there are GIS initiatives in MINAGRI, MINECOFIN, MINITERE, NUR/CGIS and MININFRA and National Census Service, etc); are uncoordinated and tend to be incompatible largely due to the fact that they are often developed under different systems and approaches, without any linkage. This has inevitably resulted in low efficacy and impact. However, with regard to P-E, the PEM provides an excellent opportunity to address the inherently critical and often overlooked poverty related environmental issues in Rwanda’s efforts of poverty reduction. Under the current PRSP monitoring, data is not disaggregated to district and lower levels, and so, it is difficult to analyse regional disparities or to assess the impact of policy actions on the welfare of the poor in particular localities. Yet this information is important to inform policy decisions on sectoral resource allocations or packaging of project interventions along regional or district needs and unique P-E problems. This is one area in which PEM will add value to the poverty monitoring process. The P-E indicators and P-E maps will also serve as advocacy tools in mobilizing and prioritizing donor interventions, especially in response to the present concerns that some provinces are more supported than others because of donor preferences. From the discussions held and the demonstration of the PEM prototype, there was general appreciation that the P-E Indicators and the interface with the policy process provide a better and more practical approach for analyzing the poverty-environment issues, and hence an effective basis for targeting and monitoring of poverty reduction interventions. However, the existing capacity problems need to be addressed and mechanisms for improved coordination of the policy process put in place. The ongoing transformation of the Statistics Department into an autonomous National Statistics Institute constitutes a major institutional reform, as the new legal framework will give it mandate and capacity to coordinate generation of statistical information.
66

One strong potential for addressing the poverty-environment issues lies in the area of decentralized planning and governance. The decentralization policy (and programme), implemented by the GoR since 2000, has focused on empowering local communities to participate in political and economic decision making, through bottom-up planning using the community development committees (CDCs). It is the view of the consultant that the CDC structures present a good entry point for mainstreaming poverty-environment issues, especially if these are well linked with the local environment committees created at cell, sector and district levels by the new policy and legal framework for environmental management. There is potential to collect data and monitor P-E indicators at local level more cost-effectively if appropriate linkages are developed between the centre, the local government and grass root structures (CDCs, local environment committees, CBOs, etc). An interesting observation relates to the potential social capital and the current efforts of the GoR to rebuild it. There is general agreement among policy makers and analysts that re-building and strengthening local formal and informal networks, institutions and traditional values could help to empower local communities to influence decisions on their welfare, particularly regarding their livelihoods, access and use of natural resources. What would be needed is to simplify the P-E indicators and integrate them into the existing social structures at local level, targeting the numerous local associations and cooperatives. A lot of information, including spatial geo-referenced data, exists but is scattered in various institutions and often not disaggregated to sub-national levels beyond the province. Such data is in some cases contradictory and often incompatible and not easy to integrate or compare, due to differences in data collection and analysis methodology, parameters, purpose and information systems, yet information on certain critical issues is vital for effective decision making (e.g. access to safe water; food security; and vulnerability to natural disasters.). Finally, a number of policy options proposed are reflected in various sectoral policy statements and some are already being implemented under ongoing projects, especially in areas of governance (decentralization, civil service reforms) and expanding economic opportunities of the rural poor (HIMO, construction of modern markets, water for production, and sustainable livelihoods around mountain forests, among others). What is urgently needed is to consolidate and refocus such initiatives and interventions to clearly link poverty and environment issues for more effective monitoring.
6.2 Major Challenges
The PEM pilot has revealed a lot of potential options for mainstreaming environmental issues into the development process but also brought out a number of challenges:
(a) There is inadequate sectoral coordination, whereby different institutions and sectors initiate and implement their programmes and policies with little or no consideration of others. This makes it even more complicated to appreciate inter-sectoral issues and monitor P-E indicators.
67

(b) Institutional and human resource capacity for policy analysis is lacking especially in
the public sector and even more difficult with the PEM. Morever, analysis of the annual PRS progress reports suggests little availability or appreciation of quantitative data, as most reports reflect little on indicators. Obtaining accurate baseline information for realistic monitoring of PE indicator, therefore call for a comprehensive environmental profiling up to the district and lower levels.
(c) Perhaps the most critical challenge is to coordinate and harmonise donor
interventions. There are many interventions being implemented in various aspects of poverty and environment, but these are designed and implemented separately. In the circumstances, it is difficult to track the impact of such programmes, but this situation also has the additional disadvantage of overstretching the already limited capacities in central and local government institutions/ agencies.
(d) Ensuring sustainable funding for resource monitoring and reporting remains a
serious challenge. At present, the Rwandan Water authorities are unable to carry out regular monitoring of ground and surface water resources for the quality and quantity changes due to lack of funding, inadequate human resources and logistical capacity. Likewise, the boundaries of state forests and wildlife protected areas are not clear to many resource managers because the corresponding sectoral budget allocations are too meager to support these activities. Without reliable information on the changes in the quality and quantity of the resources and their utilization, it is difficult to plan and undertake appropriate protection and management measures, yet this is the basis for sustainable resource management.
6.3 The Way Forward
The way forward for the PEM programme is for the key stakeholders to discuss and agree on the implementation of proposed policy options in view of the GoR priorities and the ongoing interventions. The Environment mainstreaming Taskforce established recently could take on the task of mobilizing stakeholders to discuss these options. It is also recommended that the prototype developed should be operationalised by collection of additional and more accurate data, and be used to analyse intervention scenarios. Beyond this pilot project, the following actions are recommended to mainstream and monitor the P-E Indicators into the PRSP: 1. The immediate concern, also expressed by the senior policy officials during consultations, is for the GoR, UNDP and other partners to put in place mechanisms to incorporate the P-E indicators (and the GIS-policy analysis component) into the PRSP process, and sustain the programme beyond the current project period. The best option that exists is to consolidate and/ or harmonise with related ongoing initiatives (see annex 2). It is worth noting also that UNDP has expressed willingness to provide more support to
68

operationalise the programme, and UNEP is exploring areas for providing support in poverty-environment monitoring. 2. The GoR should put in place appropriate mechanisms to coordinate the data/ information generation and management process, and to encourage collaboration and sharing of information. Such mechanisms should include:
institutional arrangements – it is hoped that the ongoing restructuring of the Statistics
Department into an autonomous National Statistical Institute, would create an appropriate institutional framework for harmonizing information generation and utilization.
regulatory mechanisms that encourage information sharing but also safeguard against misuse or abuse of data/ information. In this respect, information protocols could be formulated that compel information users to acknowledge sources, to check authenticity, etc.
establishment of central databases for both spatial and thematic data, from which information needs for poverty-environment monitoring can be addressed/, to have uniform datasets and facilitate comparable analyses.
3. Poverty – Environment analysis and the monitoring of P-E Indicators requires complex analytical techniques and expertise, first to explore, comprehend and appreciate the P-E linkages, use appropriate indicators to evaluate the impact of policy interventions on the welfare of the poor, and then monitor the impacts resulting from or associated with the policy interventions. Such capacity is lacking but slowly evolving in Rwanda, but there is need for capacity building in advanced policy analysis and database management at sectoral and decentralized levels including the GIS capability. It must be emphasized that considering the cross-sectoral nature of the P-E issues (e.g. linking deforestation to environmental health), institutional collaboration in policy analysis needs to go beyond the current cluster approach revolving around Sectorwide approaches (SWAps). MINECOFIN is best placed, both in terms of mandate and institutional capacity to undertake this coordination responsibility. Finally, there is need to review the current PRSP progress reporting framework, to make it a real poverty monitoring instrument. At the moment, it is difficult to measure progress of the poverty indicators with the current progress reporting formats, where no statistical indicators can be tracked against previous periods or with the baseline information, and disaggregated to sub-national levels to track regional disparities.
69
7.0 List of References 1.Ambler, J. 1999. Attaching Poverty While Improving the Environment: Towards Win-Win Policy Options. 2. CIAT/ World Bank. August 1999. Conceptual Framework to Develop and Use Water Indicators. Rural Sustainability indicators: Outlook for Central America. 3. DFID. 2001. Poverty and the Environment: What the Poor Say. DFID Environment Policy Department Issues Paper No.1, London. 4. DFID, EC, UNDP and World Bank (2002). Linking Poverty Reduction and Environmental Management: Policy Challenges and Opportunities. Washington, DC. 5. Inwent. 2003. Statistics for Environmental Policy. Munich Centre for Economic, Environmental and Social Statistics. Germany. 6 Hyde William, F., B. Belcher, and J. Xu (eds.) 2003. China’s Forests. Global Lessons from Market Reforms. Centre for International Forestry Research (CIFOR). Indonesia. 7. Kanjee.N. and P. Dobie. 2003. Environment in National Human Development Reports: Guidance Notes and Good Practices. 8. MINECOFIN, August 2003. Rwanda Development Indicators 9. MINECOFIN, March 2004. Enquete Sur Les Indicateurs De Base Du Bien-Entre Quibb – 2003. Rapport D’ Analyse Des Resultats. Republic du Rwanda. 10. MECOFIN, 2002. Integrated Household Living Conditions Survey (2000-2001). Final Report, Kigali. 11. MINECOFIN, 2002. A Profile of Poverty in Rwanda. 12. MINECOFIN, June 2004. Poverty Reduction Monitoring. Progress Report 13. MININFRA, 2004. Sectoral Strategy for the Ministry of Infrastructures. June 2004. 14. MINITERE, October 2004. Sectoral Policy on Water and Sanitation. Republic of Rwanda. 15. MINITERE, 2004. National Land Policy for Rwanda. 16. MINITERE, 2003. National Environment Protection and Management Policy for Rwanda. 17. MINITERE, 2003. National Forest Policy. Draft. August 2003. 18. MINITERE, June 2004. Integrated Management of Critical Ecosystems. Project Implementation Manual.
70

19. MINITERE, 2004. Rwanda – Investment Opportunities in the Energy Sector: Presentation by the Minister of State for Energy and Communications. Adam Smith International. 20. MINITERE, 2004. Sectoral Policy on Energy. 21. MINITERE, 2004. Rwanda Energy Sector Investment Needs. Overview of the Investment Environment and Summary Investment Programme to meet Policy Needs. 22. MINITERE, 2004. Decentralisation and Environment management Project. Capacity Building for Sustainable Management of Environment and Natural Resources at the District and Community Levels. Inception Report. Kigali, August 2004. 23. NCS, Feb. 2004. Census 2002 in Brief. Third Census of Population and Housing of Rwanda. 24. NUR/ UNDP. Sept. 2003. Pilot Study on the Poverty – Environment Mapping for Rwanda. Phase 1. 25. Osuntogun Adeniyi, 2002. Applied Poverty – Environment Indicators. The Case of Nigeria. A Report Submitted to the Environment Department, World Bank Washington DC. 26. Pillai. P, 2001. Poverty, Environment and Sustainable Development. A Thematic Bibliography. 27. Reed D and D. Tharakan. October 2004. Developing and Applying Poverty Environment Indicators. Worldwide Fund for Nature (WWF). Washington DC. 28. Shyamsundar.P. 2002. Poverty Environment Indicators. Environmental Economics Series Paper No. 84. The World Bank. 29. UNDP (2002). Poverty and Environment Initiative. Partinerships to Fight Poverty and Sustain the Environment. A Global Capacity Development Network on Poverty and Environment. Linking Participatory Research, Dialogue and Action. New York. 30. World Bank/ UNDP/DFID/ European Commission, 2002. Exploring the Links: Poverty-Environment Nexus. August 2002.
71

Annexes Annex 1: Summary Matrix of proposed Policy Options Annex 2: Selected Ongoing projects / Initiatives to address P-E Issues Annex 3: List of Persons Consulted
72

Annex 1: Summary Matrix of Proposed Policy Options The policy options proposed in the following matrix reflect adaptation of the options suggested by Ambler, J. (1999) and World Bank/ DFID/ European Commission (2002) to the Rwandan local situation. Strategy 1: Protecting the current asset base of the poor (conserving forests and wetlands, protecting rights to land, markets and other resources). Policy action Fiscal Institutional Legal/Regulatory 1.1 Protect the poor’s access to resources: the most important assets for the poor in Rwanda are: land, water, trees, pastures, fishing grounds, wild game, small quarries, marshlands, etc. However, the current population & other pressures, threaten their continued access to these resources, and are vulnerable to strict regulation and appropriation by Government. In urban areas, the main focus is to protect the rights to land and market grounds that are threatened by new developments and related legal framework.
Review public expenditure allocations to provide adequate funds to environmental monitoring & capacity building (REMA, MINITERE, District Environment Committees);
Provide, through RIPA, subsidies for private enterprises that invest in greening activities;
Earmark some funds for local CBOs, cultural groups & cooperatives to enhance participatory planning & project implementation at community level.
Establish a National Environment Fund to provide independent & sustainable funding for regular State of Environment reporting & water resource monitoring;
Earmark funds to implement the national cadastral system proposed in the land policy.
Strengthen the capacity of community based organizations/ institutions in advocacy, oversight & monitoring;
Strengthen mechanisms for information flow to & feedback from communities to enforcement/ regulatory agencies (e.g. REMA, Rwanda Bureau of Standards,)
Develop public participation forums to enrich the policy & planning process with a diversity of ideas.
Strengthen existing traditional dispute resolution mechanisms at local level to address land & natural resource conflicts.
Review customary laws on property ownership to incorporate the rights of women & children, and entrench local use/ access/ ownership rights especially in water, land, trees; raise public awareness about these legal provisions.
Encourage land registration Make provisions for legal
recognition of local forest & water resource user groups & support them to make formal resource use/ management arrangements (.e. internal rules, procedures & penalties).
Legislate for mandatory participation/ representation of local formal & informal groups/ cooperatives on natural resource related planning committees.
Institute penalties for violation of the rights of the poor – especially in water, pastures, land and trees,
Review the Ombudsman’s law to include resource rights of the poor.
1.2 Protect the environment upon which the poor depend, from further degradation & pollution. Pollution of the air, water & soils is mainly caused by industrial effluents, agricultural runoff & burning, improper waste disposal & natural pollution of ground water resources.
Adequate budget provision for resource quality monitoring units (i.e. water, forests/ ecosystem, wetlands).
Reallocate budget to ensure monitoring and prosecution of violations
Institute user-fees for the non-poor for natural resources and public services
Develop Public-private-community partnerships for monitoring of environmentally sensitive & fragile areas.
Develop and promote code of ethics and standards for industry & commerce
Revitalise & strengthen traditional approaches to dispute resolution especially with regard to land/ NR conflicts.
Operationalise pollution laws & their enforcement
Limit access of commercial enterprises to fragile lands (e.g., steep hillsides, wetlands/ marshlands, etc.)
Limit arbitrary discretion of government regulators
1.3 Reform the existing insurance systems and emergency programs
Provide appropriate incentives (e.g. subsidies) to encourage private sector investments in pro-poor
Establish & strengthen Emergency Response Units in relevant public agencies (MININFRA,
Develop means test criteria to determine eligibility for emergency relief
73

to cover mitigation of the poor against losses from disasters such as drought, flood, landslides, or volcanic eruptions, which may force the poor in to even more marginal and/or fragile lands.
insurance schemes; Provide partial funding for
compensating the poor from premiums.
PRIMATURE, MINALOC, MINAGRI, MINITERE, REMA, Police), to ensure prompt response to emergency needs including resource mobilization & coordination.
Institute transparent processes to prevent corruption.
Strategy 2: Expanding the asset base of the Poor Policy action Fiscal Institutional Legal/Regulatory 2.1 Transfer resource ownership to the poor. The immediate action would be to: - distribute land to the thousands of poor landless people. - review the land policy to give ownership rights to landholders & grazing rights to landless pastoralists in the rangelands. - lease degraded and/ or unplanted forest land to forest communities to plant and manage (under collaborative management regimes. - create alternative employment options for the poor.
Increase budget resources for community mobilisation efforts.
Provide cash incentives for environmental enhancement especially tree planting on steep hills.
Provide commercial credit guarantees for private resource management groups.
Provide adequate funds for auditing and monitoring at sectoral & decentralized levels.
Improve communications mechanisms with govt. agencies
Develop performance standards & monitoring procedures, provide adequate facilitation to regulatory agencies to enable them adequately assess impact of community management actions;
Reorient credit institutions (e.g. Banques Populaires, micro-finance institutions) toward poor groups to assist them after turnover.
Control level of costs/benefits under control of gov’t officials
Provide legal status for self-governing user/ management groups;
Make management contracts with local groups for improvements on forests, ecosystem, land & water resources;
Establish penalties for failure to meet management and maintenance standards
2.2 Transfer assets to poor individuals & households, i.e. implement appropriate land, forest & wildlife reforms to give priority to policy actions that increase access rights to public land. - Compensate the returnees who lost their land by allocating them land and/ or empowering them to participate in non agricultural employment.
Compensate owners for land expropriation
Provide credit for the poor to purchase distributed land
Make adequate budgetary provision for regular cadastral surveys and resource inventories.
Review the current land taxation system for farmers on redistributed land
Strengthen credit & other rural support institutions to help the poor best utilize their land resources.
Strengthen extension and monitoring systems for smallholder farmers
Formulate & enforce land use regulations based on land capabilities.
Develop and/or enforce laws related to violation of land use/ management regulations
Expand access rights on State land (e.g., rental, lease, harvest rights) for poor families – targeting those living in/ around protected areas, river banks & critical ecosystems.
74

Strategy 3: Promoting collaborative management of natural resources and co-investing with the Poor Policy action Fiscal Institutional Legal/Regulatory
3.1 Co-manage natural resources (in cases with multiple, conflicting stakeholders, or when the technical or monitoring requirements of managing the resource are very high—as when the resource is spread over large areas or across boundaries or where pollution or depletion monitoring require sophisticated techniques).
Institute mechanisms for revenue sharing from natural resources (e.g. protected areas, water permits) with local communities;
Divest management of commercial entities to local private actors, and reallocate the bulk of Government budget from management to monitoring, supervision & capacity building support functions.
Involve local people in decision-making through mobilization & empowerment actions.
Give the poor greater control over output and more responsibility for protecting natural resources on which they depend.
Streamline revenue sharing between central & local Governments;
Enhance accountability of stakeholder institutions.
Revise laws to empower local user groups (fisher-folk, forest users, …)
Develop accountability regulations for relevant govt. agencies
Develop & publicise revenue sharing rules.
Develop performance indicators and link them to access rights & management obligations;
3.2 Co-invest with the poor to improve resources they already own: modernize & expand markets to improve returns to the farmers; support local cooperatives to invest in agro-processing & marketing to enhance value addition; invest in small scale irrigation systems with local smallholder farmers. - Incorporate appropriate technology research in national investment strategy.
Earmark & allocate funding to poor areas and for technologies that benefit the poor
Use external resources to enhance local resource mobilization
Invest public resources in research to improve appropriate technologies.
Facilitate the poor’s access to technology.
Maintain poor people’s rights and responsibility to manage the resources
Strengthen local resource user groups
Strengthen the participatory planning processes to ensure effective participation of the poor.
Develop regulations for co-funding between the poor and the State/ private sector.
Enable contracting with local, sometimes non-formal groups;
Develop transparent budgeting and financial procedures for joint resource management schemes.
Strategy 4: Promoting Infrastructure and Technology Development including innovative research and extension. Policy action Fiscal Institutional Legal/Regulatory 4.1 Improve rural infrastructure to benefit the poor, especially where the poor are isolated or underserved.
Redirect public investments towards common rural infrastructure (markets, roads, bridges, ICT services & electricity)
Encourage private investment in public services (transport, agro-processing & telecommunications).
Involve local people in planning
Establish local maintenance systems
Strengthen local rights to prevent appropriation by new entrants
Improve information about opportunities in other areas
Revise govt. funding regulations to better respond to poor areas and groups.
4.2 Improve environmental conditions
Provide incentives for Electrogaz to extend
Strengthen capacity of urban local authorities to
Review & enforce byelaws &
75
where the poor live, especially in urban areas where substandard housing and poor quality surrounding environment are major factors affecting the health of the poor.
potable water supply; services to urban poor areas;
Improve delivery mechanisms for water, sanitation services, and energy
Provide adequate funds for environmental monitoring.
Extend housing support to the urban poor through credit schemes (motivate institutions like Caisse Sociale du Rwanda to participate).
provide water, sanitation & public health services to the poor;
Facilitate emergence of formal community organizations;
regulations on sanitation & minimum environmental standards for municipalities & towns.
Promote rights of tenure for the poor;
Create enabling environment for public-private partnerships in service delivery to the poor.
4.3 Develop affordable, environmentally sound technology for the poor (i.e. water harvesting; energy saving stoves/ facilities; institutional biogas technologies; ecological sanitation; etc).
Provide incentives for encouraging appropriate technology generation & extension;
Provide tax breaks on pro-poor, pro-environment technology businesses e.g. water harvesting equipment; low cost rural & renewable energy technologies
Provide incentives to encourage private sector investments in environmentally sound, pro-poor-power generation technology options.
Increase funding for scientific & social research related to the poor & the resources on which they depend ;
Provide incentives for private sector to develop environmentally sound technologies and products that address the needs of the poor
Strengthen policy analysis capacity for poverty-environment relations, and promoting evidence based decision making i.e. incorporate research findings into policy decision processes.
Strengthen cooperatives & other local institutions to ensure aggressive marketing of local produce from the poor.
Develop new pricing schemes, such as flat rate/low cost billing for water and energy
Promote collaboration between scientific research & local organizations to reduce costs, increase effectiveness & relevance of outcomes;
Support research & global initiatives that promote pro-poor , environmentally sound technology development
Develop partnerships with relevant regional & global bodies.
Enact appropriate legislation regarding tax breaks for environmentally sound, pro-poor technology development
Support intellectual property rights for technologies and knowledge the poor already control
Strategy 5: Prioritize Poor Areas and Compensate the Poor for the investments they make to improve or conserve public goods/ services. Policies/Instruments Fiscal Institutional Legal/Regulatory 5.1 Prioritize investments in strategic areas, especially where pockets of extreme poverty persist, or where large concentrations of the poor live (in cases where poor roads, water
invest public resources in neglected areas to make them more productive;
Invest in the natural resources on which the poor heavily depend i.e. forests, water, wetlands &soils;
Promote change to reverse bias against small producers, indigenous populations, and subsistence-oriented groups
Prioritize certain investments in poor areas
Strengthen conflict of interest laws and regulatory mechanisms
Subsidies local groups
76

supply & rural communications constrain service delivery).
Invest in improving poor urban environments (e.g. green belts maintenance)
& limit competition with outsiders to facilitate emergence of local institutions.
5.2 Compensate poor people for resource improvements they make, especially where those who would benefit from the improvements are other groups (downstream populations, the general public)
Compensate the poor, especially upstream farmers, for watershed improvements and management that reduces erosion in reservoirs.
Provide incentives for farmers to control agricultural burning.
Develop system of payments from those who benefit from to those who carry out resource management, e.g. in watersheds
Develop / enhance monitoring systems for compliance with new standards;
Institute transparent processes to prevent corruption
Develop new standards for pollution, erosion control & wetland utilization;
Develop mechanisms for downstream resource users (low land dwellers) to bargain with upstream farmers (in hilly areas & forest communities) over management of resources.
5.3 Increase direct employment opportunities, including off-farm jobs, for the rural poor and food-for-work on environmental improvement activities and resource stewardship subsidies – Government could use CDF resources in a way to catalyze the mobilization of local resources.
Employ the poor to protect and manage key natural resources
Extend & sustain food-for-work programs that also enhance the environmental assets of the poor (construction & maintenance of terraces, rural access roads,…)
Recover costs in terms of taxes on the increased production resulting from environmental improvements.
Provide incentives to private sector agencies that create employment for the natural resource dependant poor people.
Involve the beneficiaries, who will rely on the resources in the long-term, in identification & design of interventions;
Strengthen supervisory mechanisms;
Develop revenue sharing systems in which a large percentage of local taxes are reinvested in local programs
Public-private-community collaborative systems for joint investment.
Strategy 6: Improving markets and development planning frameworks to enhance participation and control by the poor Policy actions Fiscal Institutional Legal/Regulatory 6.1 Address market deficiencies to empower the poor to make informed decisions, have access to and control over markets & marketing systems, so as to improve valuation and pricing of their goods & services on market price.
Improve transport & communication links to the poor.
Speedy privatization of state enterprises that are subsidized yet compete with poor groups in trade & commercial service delivery (cooperatives);
Liberalise service delivery to increase efficient provision of environment-related utilities (e.g., water, power, distribution of improved seeds), and to reduce costs and expand coverage.
Increase public investments in modernizing rural markets; facilitate the poor to transform from traditional systems to modern ones.
Develop better & efficient for both market information systems for both products and jobs targeting the poor;
Facilitate control of produce marketing & value addition by local cooperatives;
Empower local groups (e.g. cooperatives, associations) to participate
Review the criteria & guidelines for allocating public resources under the PRSP to incorporate poverty-environment issues;
Eliminate regulatory barriers faced by the poor in selling their products.
Empower Local Governments to develop local environmental standards & byelaws to minimize overexploitation of
77

in resource monitoring; Create incentives for the
development of public-private partnerships in investing with the poor.
resources including land, in response to new market opportunities.
6.2 Popularise the decentralization policy among national and local stakeholders, particularly about participatory consultative decision making involving the poor.
Increase budgets for Local Government development planning process (DDPs) so as to make it more participatory & inclusive of the needs of the poor.
Strengthen monitoring & evaluation systems for rural planning including civil society operations
Subsidize high initial costs/fees (e.g. for water, energy) or create easy installment payment plans
Remove/reduce import duties for efficient technology (e.g. Solar systems)
Institute coordination & collaboration arrangements between environmental regulatory agencies (e.g. REMA, ORTPN, RURA) and macroeconomic management institutions (BNR, Statistics, RRA) to improve strategic planning;
Strengthen the CDC structure to enhance bottom up planning;
Enhance democratization to make the political process more responsive to the needs & voices of the poor;
Encourage mechanisms that utilize civil society (NGOs, faith based organisations, etc) as intermediaries.
Popularise decentralization laws & regulations.
6.3 Privatise Electrogaz & create incentives to attract private investment in water, electricity & other public utilities. Provide subsidies to offset the high costs of investing in areas occupied by the poor.
Charge market rates for water, energy & set prices to reflect social & environmental externalities;
Remove utility subsidies for non poor users & improve revenue collection systems;
Provide subsidies to offset high initial costs/ fees for connecting water, energy & communications to poor households;
Provide reasonable payment plans for ensure access by the poor;
Reduce import duties for efficient technologies (e.g. solar systems).
Speedy privatization of Electrogaz & licensing other operators to ensure competitiveness & efficiency;
Develop better mechanisms for monitoring performance of fiscal policies & instruments to ensure better targeting of the poor.
Strengthen CDF operations to develop capacity of LGs in formulation & implementation of pro-poor projects.
Strengthen penalties for diversion of subsidies to the non-poor.
Empower investment promotion agencies to devolve pro-poor strategies.
78

Annex 2: Ongoing interventions/ Initiatives to address Poverty – Environment Concerns Programme/ Project Implementing
Agency/ period Objectives & Activities P-E policy issues being addressed Geographical
scope 1. Decentralisation & Environmental Management Project (DEMP)
MINITERE 2004-2007
Integrating environmental issues into the development process & promoting sustainable livelihoods, within the decentralization setup.
- strengthening pro-poor environmentally friendly planning at central & decentralized levels; - strengthening national (REMA, MINITERE)& districts’ capacity for environmental legislation & monitoring; - support to sustainable livelihoods –this will develop strategic partnerships between public-private-civil society organizations, and establish a District Environmental Innovation Fund to ensure sustainable financing of identified relevant projects.
Ruhengeri, Cyangugu, Gisenyi, Kibuye, Gikongoro
2.Community Development and Environmental Management Project
MINALOC 2005-2008
Strengthening the capacity of local authorities and communities to plan and implement development programmes while conserving the environment.
Byumba
3. HIMO MINALOC Promoting environmentally sound rural development while providing employment opportunities to the rural poor.
Creating non-farm job/ income opportunities for the rural poor to reduce the pressure on land
Nationwide
4.Land cover Mapping Project
MINITERE Establishing the land cover & land use status of the country; digital maps have been produced to varying scales/ resolutions.
Generating spatial information on the types & productivity status of soils & land resources as a basis for improved planning & hazard risk management.
nationwide
5.PAIGER MINITERE Institutional strengthening of MINITERE, REMA & decentralized units in environmental management
Institutional capacity for planning & environmental monitoring
6. National Biosafety Framework
MINITERE Strengthening the nationalcapacity to comply with
- putting in place policy, laws & institutional structures for safe use, transfer & generation of
Nationwide
79

80
me/ Project Implementing Agency/ period
Objectives & Activities P-E policy issues being addressed Geographical scope
Program
provisions of the Cartagena protocol on Biosafety
biotechnology, to mitigate against related health & environmental risks
7. Integrated Management of Critical Ecosystems (IMCE)
MINITERE/ GEF/World Bank
Support to policy formulation & community planning; institutional & human resource capacity building to develop a critical mass of in the management of critical ecosystems.
Assessing ecosystem resources of critical importance to the population; conserving wetlands & other ecosystems of economic and ecological values.
Nation-wide
8. PDRCIU MINALOC Improve livelihood opportunities for the rural poor targeting those in “new communities”.
Expanding rural social & production infrastructure – provision of water sources for livestock; construction of rural roads; enhancing agricultural extension & institutional strengthening of decentralized entities for participatory community development planning & service delivery. The project has provided funding for some district projects.
Umutara Province
9.PADEP MINALOC2002- 2005
Strengthening the capacity of local governments & communities in decentralized governance and community development.
Support to participatory community development planning & provision of rural infrastructures e.g. markets & bridges.
Ruhengeri
10.Ubudehe MINECOFIN/ MINALOC/ CDF
To promote local community planning based on traditional values of working together. The project will provide up to € 1000 to each cell to finance the identified projects.
Empowering the poor to participate in community planning, and identify and prioritise their poverty needs. It is, however, not clear how environmental
issues are included as part of the criteria for selecting priority projects. This presents opportunity to
mainstream environmental issues into community development plans
Nationwide

Annex 3: List of Persons Met/ Consulted (Not exhaustive list) No. Name Title Organization 1 Rwamucyo Ernest Director/ Strategic Planning & Poverty Monitoring MINECOFIN 2 Dr. Mukankomeje Rose Director General REMA 3 Maxi. Usengumuremyi Coordinator/ partnerships & Resource Mobilisation MINECOFIN 4 Bizimana Innocent Director of Planning MINITERE 5 Dr. Nizeyimana J.M.V Director/ Planning MINISANTE 6 Gafishi Ngango Phillipe Director/ Statistics Dept MINECOFIN 7 GAKWANDI Frodualol Head of the Energy Unit MININFRA 8 Uwimana Suzanne Division Chief / Environmental Inspection &
Monitoring/ CBD Focal Point MINITERE
9 Kabalisa V. DePaul Division Chief/ Water Resource Monitoring 10 Michell Edwin Project Manager/ DEMP MINITERE/UNDP 11 Michèle Schilling Director/ GIS Centre NUR-Butare 12 MUTIJIMA Prosper Chef de Service des Opérations Techniques NCS/ MINECOFIN 13 Vincent de Boer Technical Advisor/ Strategic Planning & Poverty
Monitoring MINECOFIN
14 Rwasana Jean 15 Straton Director/ Social Affairs MINALOC 16 Rurangwa B. Eugène, Responsable du Service Technique MINITERE 17 Rwakunda Alain GIS/ ICT Expert MINITERE 18 Tim Sumner Environmental Policy Advisor DFID
81