ENV/EPOC/GSP(2010)21 Working Party on Global and ...
81
Unclassified ENV/EPOC/GSP(2010)21 Organisation de Coopération et de Développement Économiques Organisation for Economic Co-operation and Development 05-Oct-2010 ___________________________________________________________________________________________ English - Or. English ENVIRONMENT DIRECTORATE ENVIRONMENT POLICY COMMITTEE Working Party on Global and Structural Policies COHERENCE BETWEEN WATER AND ENERGY POLICIES This document has been prepared by Carey W. King, Ashlynn S. Stillwell, Kelly M. Twomey, and Michael E. Webber from the University of Texas at Austin. It will serve as a background document for the report on Improving Policy Coherence for Better Water Management that is one of the intermediate output results under the OECD Horizontal Water Programme. After this country review, the Secretariat intends to release the revised version of this document as an OECD Environment Working Paper. ACTION REQUIRED: Delegates for the Working Party on Global and Structural Policies are invited to provide written comments by 26th October. For more information, please contact: Roberto Martín-Hurtado, [email protected], tel. +33(0)145241427 JT03289495 Document complet disponible sur OLIS dans son format d'origine Complete document available on OLIS in its original format ENV/EPOC/GSP(2010)21 Unclassified English - Or. English
Transcript of ENV/EPOC/GSP(2010)21 Working Party on Global and ...
Unclassified ENV/EPOC/GSP(2010)21 Organisation de Coopération et de Développement Économiques Organisation for Economic Co-operation and Development 05-Oct-2010 ___________________________________________________________________________________________
English - Or. English ENVIRONMENT DIRECTORATE ENVIRONMENT POLICY COMMITTEE
Working Party on Global and Structural Policies
COHERENCE BETWEEN WATER AND ENERGY POLICIES
This document has been prepared by Carey W. King, Ashlynn S. Stillwell, Kelly M. Twomey, and Michael E. Webber from the University of Texas at Austin. It will serve as a background document for the report on Improving Policy Coherence for Better Water Management that is one of the intermediate output results under the OECD Horizontal Water Programme. After this country review, the Secretariat intends to release the revised version of this document as an OECD Environment Working Paper. ACTION REQUIRED: Delegates for the Working Party on Global and Structural Policies are invited to provide written comments by 26th October.
For more information, please contact: Roberto Martín-Hurtado, [email protected], tel. +33(0)145241427
JT03289495
Document complet disponible sur OLIS dans son format d'origine Complete document available on OLIS in its original format
EN
V/E
POC
/GSP(2010)21
Unclassified
English - O
r. English

ENV/EPOC/GSP(2010)21
2
TABLE OF CONTENTS
ACRONYMS ............................................................................................................................................ 5
EXECUTIVE SUMMARY ........................................................................................................................ 9
INTRODUCTION ................................................................................................................................... 11
Timeline of energy water-nexus attention worldwide ............................................................................ 12 Terminology ........................................................................................................................................ 14
CHAPTER 1 LINKS BETWEEN ENERGY, WATER, AND THE ENVIRONMENT ....................... 15
1.1 Water resource impacts from electricity production .................................................................... 15 1.1.1 Thermoelectric power plant cooling ...................................................................................... 15 1.1.2 Hydropower water demands ................................................................................................. 19 1.1.3 Renewable electricity water demands ................................................................................... 20
1.2 Water resource impacts on electricity generation ........................................................................ 21 1.2.1 Droughts and heat waves ...................................................................................................... 21 1.2.2 Climate change impacts ........................................................................................................ 21
1.3 Water resource impacts from liquid fuels production .................................................................. 22 1.3.1 Water demand for liquid fuels ............................................................................................... 22 1.3.2 Water pollution from liquid fuel production .......................................................................... 23
1.4 Impacts of water treatment, distribution, and use on energy demand ........................................... 25 1.4.1 Energy requirements for fresh water treatment ...................................................................... 25 1.4.2 Energy requirements for wastewater treatment ...................................................................... 26
CHAPTER 2 INSTITUTIONAL REFORMS FOR ENHANCING COHERENCE BETWEEN WATER AND ENERGY POLICIES ....................................................................................................... 28
2.1 Policies and technologies relevant to the energy-water nexus ..................................................... 28 2.1.1 Description of policy objectives ............................................................................................ 28 2.1.2 Description of policy choices ................................................................................................ 29
2.1.1.1 Low-flow fixtures: ........................................................................................................ 33 2.1.1.2 Energy-efficient appliances: .......................................................................................... 33 2.1.1.3 Distributed rainwater collection (potable and non-potable uses): ................................... 33 2.1.1.4 Solar hot water heating: ................................................................................................ 34 2.1.1.5 Geothermal heat pump: ................................................................................................. 34 2.1.1.6 Electricity peak shifting: ............................................................................................... 35 2.1.1.7 Electricity peak shaving: ............................................................................................... 35 2.1.1.8 Groundwater pumping: ................................................................................................. 35 2.1.1.9 Wind power, solar photovoltaic (PV) panels, and concentrated solar power (CSP, non-steam cycle): ................................................................................................................................. 36 2.1.1.10 Combined heat and power (CHP): ................................................................................. 37 2.1.1.11 Wet-cooled power plants: ............................................................................................. 37 2.1.1.12 Dry-cooled power plants: .............................................................................................. 37 2.1.1.13 Concentrated solar power (CSP, steam cycle):............................................................... 38

ENV/EPOC/GSP(2010)21
3
2.1.1.14 Hydraulic fracturing: ..................................................................................................... 38 2.1.1.15 Hydropower: ................................................................................................................. 38 2.1.1.16 Desalination: ................................................................................................................. 39 2.1.1.17 Carbon capture and storage (CCS) (wet-cooled): ........................................................... 39 2.1.1.18 Biofuels (Brazilian sugar cane (São Paulo) and US corn grain (Midwest) ethanol): ....... 40 2.1.1.19 Municipal waste to energy: ........................................................................................... 41 2.1.1.20 Greywater and reclaimed water use: .............................................................................. 41 2.1.1.21 Inter-basin water transfer: ............................................................................................. 42
2.2 Classification of common institutional gaps hindering energy-water policy coordination ............ 42 2.3 Existing coordination mechanisms aimed at bridging institutional gaps ...................................... 43
2.3.1 Successes for bridging institutional gaps ............................................................................... 43 2.3.2 Facilitating energy and water coordination amongst agencies ................................................ 43 2.3.3 Scientific coordination .......................................................................................................... 44
2.4 Extent that mechanisms are able to bridge institutional gaps ....................................................... 45 2.4.1 Water and energy: availability, trade, and pricing ................................................................. 45 2.4.2 Policy mechanisms to manage the agricultural-energy-water nexus ....................................... 47
CHAPTER 3 CASE STUDIES OF WATER AND ENERGY POLICY COHERENCE/INCOHERENCE ............................................................................................................. 49
3.1 United States: scarce water resources in the west and policy mismatches .................................... 51 3.1.1 Policy framework ................................................................................................................. 51 3.1.2 Allocation of roles and decisions .......................................................................................... 52 3.1.3 Capacity and Funding Resources .......................................................................................... 53 3.1.4 Information Challenges ........................................................................................................ 54 3.1.5 Time Frame and Strategic Planning ...................................................................................... 55 3.1.6 Moving Forward ................................................................................................................... 55
3.2 Canada: water for unconventional petroleum oil sands ............................................................... 56 3.3 Australia: water scarcity forces leadership on conservation ........................................................ 58 3.4 France: Nuclear power to the core, but high temperatures mean low output ................................ 60 3.5 Brazil: water resources enable a global leader in bioenergy, but new challenges await ................ 62 3.6 India: renewable water for hydropower allows depletion of fossil aquifer ................................... 64 3.7 Israel: location, location, location needs technology, technology, technology ............................. 65 3.8 Singapore: old water to NEWater .............................................................................................. 66 3.9 Additional examples of coordination of energy-water policy amongst countries ......................... 67
CHAPTER 4 MAIN MESSAGES AND EMERGING ISSUES .......................................................... 68
4.1 Summary of key findings ........................................................................................................... 68 4.2 Information gaps and emerging issues ........................................................................................ 68
REFERENCES ........................................................................................................................................ 70
ENV/EPOC/GSP(2010)21
4
LIST OF TABLES
Table 1. Water withdrawals and consumption vary widely across thermoelectric cooling technology depending on electricity generation technologya (Twomey and Stillwell, 2009). ................................... 17 Table 2. Water Consumption for Electricity Generation by Fuel Source and Generation Technology (Twomey and Stillwell, 2009) .............................................................................................................. 18 Table 3. The energy requirements for water treatment increase as source water quality degrades, shown here for US national average values (Goldstein and Smith, 2002; Klein et al., 2005). ................. 25 Table 4. US national average values of energy for wastewater treatment increase as effluent quality increases (Goldstein and Smith, 2002). ................................................................................................. 26 Table 5. Various technologies impact water and energy policy objectives in different ways ............ 32 Table 6. Sample costs data for water treatment equipment show increases in cost for more sophisticated treatment technologies. .................................................................................................... 46
FIGURES
Figure 1. Sample costs data for water treatment equipment show increases in cost for more sophisticated treatment technologies. .................................................................................................... 48

ENV/EPOC/GSP(2010)21
5
ACRONYMS
ABS Australian Bureau of Statistics
ACES American Clean Energy and Security Act of 2009
ANAM Autoridad Nacional del Ambiente
ANU Australian National University
AP Associated Press
ASEP Autoridad Nacional de los Servicios Públicos
AWEA American Wind Energy Association
AWR Australian Water Resource Report
AWWARF American Water Works Association Research Foundation
CASLC California State Lands Commission
CCS Carbon Capture and Storage
CEC California Energy Commission
CFE Comisión Federal de Electricidad
CHP Combined Heat and Power
CIEAU Centre d'information sur l'eau
CO2 Carbon Dioxide
CO2e Carbon Dioxide Equivalents
CONAGUA Comisión Nacional del Agua
COST European Cooperation in Science and Technology
CPUC California Public Utility Commission
CRS Congressional Research Service

ENV/EPOC/GSP(2010)21
6
CSP Concentrating Solar Power
CTOOH El Comité Técnico de Operación de Obras Hidráulicas
CWA Clean Water Act
DOD US Department of Defense
DOE US Department of Energy
DOI US Department of Interior
EIA US Energy Information Administration
EJ Exajoule
EPA US Environmental Protection Agency
ET Evapotranspiration
FAO Food and Agriculture Organization
gal Gallon
GAO US Government Accountability Office
GDP Gross Domestic Product
GHG Greenhouse Gas
GL Gigaliter
GW Ground Water
H2O Water
IEA International Energy Agency
IEC Israel Electric Corporation
IGCC Integrated Gasification Combined-Cycle.
IIUNAM Instituto de Ingeniería, Universidad Nacional Autónoma de México
IMTA Instituto Mexicano de Tecnología del Agua
IPCC Intergovernmental Panel on Climate Change
km kilometer
L liter

ENV/EPOC/GSP(2010)21
7
m meter
MAAP Ministère de l’Alimentation de l’Agriculture et de la Pêche
MEEDDM Ministère de l’Ècologie, de Ènergie, du Dèveloppement durable et de la Mer
MEWR Ministry of the Environment and Water Resources
ML Million liters
MWh Megawatt Hours
NAS National Academy of Sciences
NETL National Energy Technology Laboratory
NGCC Natural Gas Combined-Cycle.
NGER National Greenhouse and Energy Reporting Act
NOAA National Oceanic and Atmospheric Administration
NRC Nuclear Regulatory Commission
NRDC Natural Resources Defense Council
NREL National Renewable Energy Laboratory
NWC National Water Commission
OECD Organisation for Economic Co-operation and Development
PAC Polycyclic Aromatic Compounds
PR Public Relations
PUB Public Utilities Board of the Singapore Government
PV Photovoltaic
R&D Research and Design
RFS Renewable Fuel Standard
SDAGE Schéma directeur d'aménagement et de gestion des eaux
SW Surface Water
TAMU Texas A&M University
TDS Total Dissolved Solids

ENV/EPOC/GSP(2010)21
8
TWDB Texas Water Development Board
TWh Terawatt Hours
UK United Kingdom
UNEP United Nations Environment Programme
UNESA Asociación Española de la Industria Eléctrica
US United States
USD United States Dollars
USDA United States Department of Agriculture
USGS United States Geological Survey
WFD Water Framework Directive
WIRADA Water Information Research and Development Alliance
WNA Australian National Water Initiative
WNA World Nuclear Association
yr year

ENV/EPOC/GSP(2010)21
9
EXECUTIVE SUMMARY
Energy and water are inextricably linked by natural laws and geography. Correspondingly, energy and water policies should work within the physical and spatial relationships of the water-energy nexus. Unfortunately, integrated policymaking happens infrequently. In an era of limited global energy and water resources, technologies and policies that focus too much on one resource can have inadvertent negative effects on the other resource. For example, alternative fresh water supplies often increase local water availability at the expense of additional regional energy consumption. Similarly, water-intensive steps in the energy supply chain help provide reliable electric power and transportation fuels but often deplete water quantity and degrade water quality. These and other tradeoffs present challenges for energy and water policymakers.
As global energy and water resource management changes, so does the context in which energy and water policies are formulated. Consequently, many current policymaking processes are highly disaggregated and exacerbate pressures on energy and water resources. Some countries have created integrated and cohesive energy-water policies in various levels of government, but these policies are not the norm. Instead, many current policies increase energy security while decreasing water security, and vice versa. As a result, energy and water policies could benefit from integrated and coherent improvements.
Some countries and regions have managed energy and water resources effectively in context of scarcity. Israel and Hawaii (United States) have mandated solar hot water heaters that use solar radiation to heat water for domestic use. Singapore has prioritized water reuse as an additional water supply. California, United States, and the European Union have promoted aggressive water conservation in different instances, which saves both water and energy resources. These and other combinations of technologies and policies create mutually beneficial solutions while addressing some of the tradeoffs associated with the energy-water nexus.
Conversely, some polices exhibit less coherent energy and water interactions, where policies for one resource undermine the availability or security of the other. Globally, there are widespread trends towards more energy-intensive water and more water-intensive energy. In response to population pressure and other ecological priorities, water and energy supplies can be depleted, creating a demand for alternative supplies. Alternative water supplies, such as long-haul transfer and desalination, provide a drought-resistant, reliable supply of water, but these alternative water supplies require substantially more energy per volume of water for treatment and transport. Similarly, dry cooling of thermoelectric power plants reduces cooling water requirements of electric power generation, but introduces an additional energy loss into the power plant system. Production of unconventional fossil fuels and biofuels can increase domestic energy supplies of liquid transportation fuels, yet development of these energy resources can increase water consumption and degrade local water quality. For biofuels in particular, the implications for water use and pollution are highly site specific. Understanding these energy-intensive water supplies and water-intensive energy supplies is crucial for future resource planning.
Several information gaps and issues emerge from analyzing the energy-water nexus in a policy context. There is the lack of suitable data and information that can inform policy creation and deliberation: water consumption at power plants, energy consumption for irrigation and pumping, energy

ENV/EPOC/GSP(2010)21
10
consumption for water treatment, etc. These data gaps exist not only within countries, but also across boundaries. In a global context, a lack of transboundary data can exacerbate problems related to international issues such as climate change. Even on the local level, adequate energy and water data can inform energy and water decisions to increase energy security and prevent depletion of water resources. In short, data are needed to guide action for energy-water policy coherence.
Opportunities exist to address tradeoffs between energy and water. For example, policies that promote the mutual benefits of energy and water conservation can help increase security of both resources in the context of scarcity. New research and development concerning low-water biofuel feedstocks and low-energy desalination processes, for example, can help meet the pressures of growing populations and new ecological priorities. Coordination of information gathering both horizontally and vertically within governments creates reliable and consistent data. Such opportunities increase the resiliency of both the energy and water sectors.
Implementation of integrated, coherent energy-water policies will help countries optimize the management and consumption of energy and water resources. Such an integrated approach is possible through development and implementation of suitable technologies and policies that consider both the energy and water use consequences of decisions.

ENV/EPOC/GSP(2010)21
11
INTRODUCTION
1. The nexus of water and energy is important and pervasive. At the same time, constraints in energy and water resources are forcing difficult policy choices. Humans are depleting fossil energy resources and consuming or degrading water supplies faster than alternatives are coming online. There are also renewable energy and water resources that do not deplete over time, but have limited flows that restrict their use temporally or geographically. As countries confront water resource constraints, their arsenal of policy options has typically included energy-intensive solutions such as long-haul transfer and desalination. The corollary is also true: many countries address energy constraints with water-intensive options such as steam-cycle power plants or biofuels. However, this approach, whereby water planners assume they have all the energy they need and energy planners assume they have all the water they need, is not likely to work effectively moving forward. In order to optimize the consumption, conversion, transfer and use of precious water and energy resources, governments would benefit from implementing policies that enable coherence between these two commodities. By contrast, countries that deploy incoherent policies might find themselves with severe scarcity of one resource or the other, or both.
2. Water is a critical aspect of meeting future energy demands. Estimates for a global peak in conventional oil production vary from five years ago to a few decades in the future, and almost every alternative to crude oil as a source of liquid fuels for transportation withdraws and consumes more water while often exacerbating challenges to water quality. For example, biofuel production converts native and existing pasture and agricultural lands for feedstock agriculture - creating political and social pressures to avoid impacting wildlife and food for fuel. Countries that promote biofuels production are caught between displacing food crops on productive lands, often requiring little to no irrigation, and irrigating lesser-productive lands. Even biofuel feedstocks watered by natural precipitation impact local environments and climate via water runoff and evapotranspiration changes that affect local and regional hydrology. A carbon-constrained world also encourages capturing the carbon dioxide from coal and natural gas power plants for sequestration underground. This carbon capturing process requires cooling in addition to extra energy from the power plant itself, thus lowering both its net electricity production and water-cooling efficiency. Efforts to reduce water consumption at power plants are accompanied by the tradeoff of increased costs and lower power efficiency. New shale gas resources are produced by injecting millions of liters of high pressure water underground, per well, to break apart low permeability formations, releasing natural gas otherwise inaccessible. However, while the water per well appears high, the amount of energy in the shale gas production is also high such that relatively little water is required per cubic meter of gas that is ultimately produced. Water quality issues for shale gas production also persist, so it is essential to properly handle the water during the entire shale gas production cycle to garner acceptability of the process. Similarly, water quality risks exist for conventional fossil fuels and biofuels. Other fossil fuel alternatives include unconventional petroleum sources such as those from oil shale, tar sands and heavy oils, all of which have greater impacts on water than conventional petroleum.
3. In addition to energy sources that require more water than today’s conventional supplies, new sources of freshwater require vastly more primary energy. From desalination to long-haul transfers, making and conveying potable water from these sources takes energy to heat the water, remove dangerous microbes, force the untreated water through membranes and filters, and then move it to the point of end use. Growing populations and depleting water supplies are pushing many countries to the boundaries of

ENV/EPOC/GSP(2010)21
12
technologies for providing new freshwater supplies, only to find that their constrained water situation only exacerbates their energy constraints.
4. This report lays out some of the challenges, gives examples of mixes of technologies and policies that can meet political objectives relevant to the energy-water nexus, identifies gaps that inhibit future policy development, and discusses key findings. While this report is intended to serve the global community, much of the quantified information and illustrative examples are based on data and policy actions from within the United States (US), but additional short case studies of other countries exemplify the scope of challenges and solutions to the energy-water nexus. The US serves as context for a longer case study because 1) its continental breadth includes a range of energy and water issues that suitably capture most of the challenges witnessed worldwide (for example, water abundance varies dramatically from the desert southwest to the wet northeast, and energy resources have significant geographic variability), and 2) the energy and water data for the US are in greater abundance and more accessible than for most other regions and countries in the world. This report is not exhaustive for any one country that is discussed; rather each case study is included to illustrate a different aspect of the global energy-water nexus.
5. Chapter 1 discusses the technical and environmental issues linking water and energy in electricity generation, liquid fuels production, freshwater treatment, and wastewater treatment. Chapter 2 discusses technologies in the context of their energy-water tradeoffs while introducing policies that impact the energy-water nexus in different ways. Some policies and technologies present solutions that achieve policy objectives such as water and energy security, while some do the opposite. Due to technical constraints, it is not possible for all policy actions to fall into a “win-win” category where all policy objectives advance by incorporating a technology or policy. Chapter 2 continues with a discussion of some institutional reforms that could help future water and energy policy to be more coherent, robust, and sustainable in the future. Chapter 3 presents the country case studies to discuss existing situations and strategies employed by selected countries that reveal some significant progress has occurred in the recent past, yet challenges remain. Chapter 4 concludes the report with the emerging issues and information gaps in the energy-water nexus.
Timeline of energy water-nexus attention worldwide
6. Despite the close interaction of energy and water since the dawn of the industrial revolution (for example with steam-driven engines, large-scale waterworks, and so forth) and an abundance of literature and scientific research about both energy and water separately, until recently there had been relatively little attention about the intersection of these two commodities. Unfortunately, this lack of attention can be problematic because a constraint with one can become a constraint in the other. Thus, there is a cross-sectoral vulnerability that has not been adequately addressed by most policy institutions.
7. A scientific paper published in Science in 1978 (Harte and El-Gasseir, 1978) was one of the first systematic and rigorous examinations of this relationship. That work was followed after a long gap by some thought-leading work on the topic by Dr. Peter Gleick in the early 1990s (Gleick, 1994). After another long gap in time , the pace and intensity of scientific analysis and policy attention quickened dramatically starting with the publication of “Energy Down the Drain” in 2004 (Natural Resources Defense Council, 2004). This report, a joint publication by the National Resources Defense Council and the Pacific Institute, examined the energy embedded in California’s water system. That such groundbreaking work would originate from the American west is not surprising given the strained water resources in that region of the world.
8. Afterwards, the energy-water nexus grew as a topic of central concern. The California Energy Commission issued a series of studies on the topic of integrated energy and water policy in 2005 and

ENV/EPOC/GSP(2010)21
13
onwards (Klein et al., 2005). Senator Domenici (New Mexico) called for the US Department of Energy to coordinate an effort among the various national energy labs to examine the energy-water nexus, which yielded a widely-cited energy-water nexus report to Congress and a website (http://www.sandia.gov/energy-water/) as a centralized location for information (DOE, 2006).
9. Since that time, there has been an uptick in the number of scientific, scholarly and popular articles have been written, popularizing the topic all over the world. Outlets included traditional scientific journals, as well as popular outlets such as Scientific American, Earth Magazine, and leading newspapers such as the New York Times, Daily Telegraph, etc. Many books, with dramatic titles such as “Peak Water,” “Unquenchable,” and “When the Rivers Run Dry,” brought attention to the topic and conveyed a tone of seriousness and crisis. At the same time, many conferences, symposia, and workshops have been organized by international scientific organizations (American Association for the Advancement of Science, American Society of Mechanical Engineers, Groundwater Protection Council, and European Cooperation in Science and Technology, to name a few) dedicated to this topic.
10. The US Government Accountability Office, Department of Energy, and National Academies have produced water-energy nexus reports for legislative and executive audiences outlining the major issues (DOE, 2006; GAO, 2009b,c; Schnoor et al., 2008). The focus on the energy-water nexus over the last several years has culminated into verbiage included in pending energy and climate bills in the US Congress and calls for further study of the energy-water nexus, including water use for energy and energy consumption for brackish groundwater desalination (Abrams and Hall, 2009; GAO, 2009a,b,d; Salibya et al., 2009). The American Clean Energy Leadership Act of 2009 calls for studies and assessments on integration within the energy-water nexus (Bingaman, 2010). In addition, the American Clean Energy and Security Act of 2009 calls for changes to the energy mix with implications for water use. Consequently, despite a dearth of concrete action, the legislative attention to energy-water issues with an eye towards coherent integration is increasing in the US.
11. The European Cooperation in Science and Technology (COST), funded via the European Science Foundation through a European Commission contract, has been working through the Australian National University (ANU) over the last two years to provide a global context for policy decisions within the water-energy nexus. Case studies highlighting issues from around the world have been put into policy context and have been organized for journal publication and presented to European authoritative bodies at the 7th ANQUE's International Congress in 2010: “Integral Water Cycle: Present and Future.”
12. Work within the national laboratories of the US is investigating the planning of electrical transmission lines in the Western US that will connect renewable energy solar and wind resources, and the authors of this report are also involved. Brazil’s newly formed Bioethanol Science and Technology Laboratory in Campinas, São Paulo is aiming to focus initial research on energy and greenhouse gas balances as well as the water quantity and quality impacts of expanded sugar cane agriculture.
13. In parallel to these governmental steps, there are many non-governmental organizations, including the Energy Foundation, Kresge Foundation, Environmental Defense Fund, Union of Concerned Scientists, United Nations, and OECD that are tuning in to the topic. While significant challenges remain, as outlined in this report, the recent attention is an optimistic sign that progress towards integrated energy-water policymaking will be made.

ENV/EPOC/GSP(2010)21
14
Terminology
14. This report uses the terms water withdrawal and water consumption to describe water use. However, this terminology is not consistently used across countries. Here, water withdrawal refers to the volume of water removed from a water source; this water is not lost, but it cannot be allocated to other users before discharge. Consumption, on the other hand, refers to the volume of water lost via evaporation, transportation, or any other means by which water is not returned to its native source in liquid form. Since consumption is a subset of withdrawal, it is less than or equal to withdrawal, by definition.

ENV/EPOC/GSP(2010)21
15
CHAPTER 1
LINKS BETWEEN ENERGY, WATER, AND THE ENVIRONMENT
1.1 Water resource impacts from electricity production
15. Thermoelectric generation requires water to mine, process, and convert primary fuels into electricity, and these operations impact and depend upon local water resources. For thermoelectric power plants to operate reliably they usually require consistent and sufficient access to a significant amount of cooling water. If water access becomes severely constrained due to drought or allocations to other water users, then power generation can be curtailed. In addition, heat waves inhibit the ability for thermoelectric power plants to get the cooling they need, which can force them to draw down on their power output. Thus, an environmental restriction in water supply can directly cause a restriction in electricity supply. Unfortunately, droughts and heat waves, which put strains on water supplies, often occur at the hottest times of the year when electricity for air-conditioning is at the highest demand. These tensions are further complicated by population growth, which increases the number of people who have water and power demands, and economic growth, which increases the amount of energy and power that each person demands.
16. The increasing demands and environmental protections upon finite flows of accessible freshwater have induced technological changes in power plant cooling. Power plants constructed over 50 years ago almost exclusively used open-loop cooling designs that withdraw water at high flow rates and return the heated water back to the environment. Water was perceived as abundant, and environmental regulations were practically nonexistent. During the 1960s and 1970s environmental concerns about water increased. These concerns led to increased pressure on the claims that existed for most water in the large rivers and reservoirs. Thus, new power plants were forced to innovate new designs that withdraw less water, leading to the widespread implementation cooling towers for many new power plants. The closed-loop designs employed by cooling towers serve many environmental interests by greatly reducing the entrainment of aquatic wildlife in intake structures and preventing the artificial heating of aquatic environments (see below for more details about power plant cooling). One drawback, however, is that even though cooling towers withdraw less water than open-loop cooling, they consume more. As human population and energy demands continue to grow, the power industry might be forced further down the path of implementing cooling designs that use even less water, such as dry cooling systems that withdraw and consume less than 10% of the water of wet-cooled systems. However, dry cooling systems have higher capital costs and reduce overall efficiency of the plant, which increases costs and emissions per unit of electricity that is generated.
1.1.1 Thermoelectric power plant cooling
17. In the United States (US), the thermoelectric power sector withdraws 49% of all water and 41% of freshwater (more than any other sector), but only consumes 3% of freshwater (Kenny et al., 2009; Solley et al., 1998). The withdrawal for power generation is the highest for all sectors. Other industrialized countries have similar proportions of water withdrawal and consumption for power generation, and these proportions relate to the physical process of the steam cycle. Typically, thermoelectric power plants generate electricity by burning or reacting fuel to provide heat to a high-

ENV/EPOC/GSP(2010)21
16
pressure boiler in which steam is generated from treated freshwater. The superheated steam turns a turbine connected to an electric generator producing electricity. Water then cools the steam, condensing it into boiler feed water so the steam cycle can begin again.
18. Two broad categories of wet cooling technologies describe the condensing of steam at thermoelectric plants: open-loop cooling or closed-loop cooling. Open-loop cooling (also referred to as once-through cooling) withdraws large volumes of water from a source (typically a lake, river, or ocean) that are passed through the tubes of a condenser to cool steam discharged from the turbine. The water, warmed from heat transferred from the steam, is discharged into the water body from whence it was withdrawn. Closed-loop cooling systems (also referred to as wet-recirculating cooling) reuse a significant fraction of water, but evaporate more than open-loop systems. Closed-loop cooling often involves a cooling tower in which water flows over pipes that contain the process steam, thereby removing the heat and condensing the steam. Much of the cooling water evaporates, but the non-evaporated water is collected for use again (i.e. in a closed loop). A manmade cooling reservoir often substitutes for a cooling tower in wet recirculating systems. In these systems, the power plant waste heat is dissipated by discharging the recirculating cooling water into the cooling reservoir where the heat transfer to the environment takes place via multiple physical processes (conduction, convection, radiation).
19. Forty-three percent of US thermoelectric power plants are large power facilities with generation capacity >100 MW. Of these large power plants, 42% and 15% use wet recirculating cooling towers and cooling ponds, respectively (NETL, 2008). The remaining 43% of large power plants at >100 MW capacity use once-through cooling, and only 1% use dry-cooling, discussed below1. Once-through cooling systems operate as often as closed-loop, but once-through designs are being phased out for new plant sites in the US due to ecosystem impacts, regulations and water availability limitations (CASLC, 2006; Sweet, 2010). These once-through systems can harm marine ecosystems when aquatic life get trapped in intake structures and disturbed by the higher water temperatures of the discharge (Tchobanoglous and Schroeder, 1987). In response to environmental impacts upon marine life when using open-loop cooling systems, the California State Lands Commission proposed a moratorium on construction of new power plants with open-loop cooling systems (CASLC, 2006). As California is often at the forefront of environmental regulation, this moratorium could be enacted and replicated nationally and globally. The important concern in context of the water-energy nexus is that a moratorium on open-loop cooling clashes with some governmental bodies pushing power plants to coasts (where open-loop cooling is practically necessary) to avoid the use of continental freshwater sources. Thus, environmental concerns about oceanic wildlife are in direct conflict with environmental concerns about inland freshwater supply.
20. More water-efficient cooling technologies exist; however, these systems have drawbacks. Power plants with dry-cooling towers consume and withdraw little water (< 10% that of those with wet-cooling towers), but have associated energy and cost penalties. The increased physical infrastructure to create the necessarily larger cooling surfaces increases capital costs versus wet-cooling towers. Furthermore, a power plant with dry cooling can experience a 1% loss in efficiency for each 1°F increase of the condenser making power generation more limited by ambient air temperatures as compared to wet-cooling systems (Kutscher et al., 2006). Hybrid wet-dry cooling systems provide a compromise between wet and dry cooling systems, having both closed-loop wet and dry cooling towers. Thus, hybrid wet-dry cooling systems can have low water consumption for much of the year by operating primarily in dry mode, but have the flexibility to operate more efficiently in wet mode during the most critical and hot times of the year. Unfortunately, water resources are typically at their lowest availability during these peak demand times. Although dry and hybrid cooling systems are proven technology, low water prices and legacy water rights for power generators usually prevent them from being economically-competitive designs. However, in water-constrained regions where water simply isn’t available for cooling, dry- 1 Percentages add to greater than 100% due to rounding.

ENV/EPOC/GSP(2010)21
17
cooling is often the only alternative, in which case the up-front capital costs and parasitic efficiency loads are justifiable.
21. Table 1 provides a range of water requirements for each type of thermoelectric cooling system. Process heat for steam generation can be supplied by many fuels and resources including coal, fuel oil, natural gas, fissile material, solar radiation, biomass, combustible waste, and geothermal energy. Thus, large differences in water use exist, even within specific cooling technologies, due to power plant design, fuel, efficiency, and operating conditions (Twomey and Stillwell, 2009). Table 2 provides a summary of water consumption by electricity generation technology for wet and dry cooling technologies. The water withdrawal of power plants can vary considerably from below 300 L/MWh to over 3,000 L/MWh, even among similar types of generation with similar cooling technologies.
Table 1. Water withdrawals and consumption vary widely across thermoelectric cooling technology depending on electricity generation technologya (Twomey and Stillwell, 2009).
Withdrawal (L MWh-1)
Consumption (L MWh-1)
Cooling Technology Low High Low High Open-loop cooling 28,000 230,000 380 1,100 Closed-loop cooling towerb 870 4,200 680 3,500 Hybrid wet-dry coolingc <380 4,200 190 3,500 Dry cooling 0 0 0 0 aData presented are at the point of cooling; they do not include water at the point of manufacturing. bRange includes NGCC cycle at low end and nuclear at high end. cRange includes near full dry operation at low end and near full wet operation at high-end.

ENV/EPOC/GSP(2010)21
18
Table 2. Water Consumption for Electricity Generation by Fuel Source and Generation Technology (Twomey and Stillwell, 2009)
Electricity Generation Technology
Water for Fuel Production Wet Coolinga Dry Coolingb
Water for Non-Cooling Aspects of Power Generation
(L/MWh) (L/MWh) (L/MWh) (L/MWh) Geothermal 0 5,300 0 Not available
Enhanced Geothermal
Not available, potentially significantc
5,300 0 Not available
CSP – Solar Trough 0 2,900-3,500 0 300d
CSP – Solar Tower 0 2,800 0 340d
Nuclear 170-570 1,500-2,700 Unlikely technology choicee
110f
Coal 19-280 1,100-1,800 0 110f
Biomass – Irrigated Highly variable, depending on geographyg
1,100-1,800 0 110f
Biomass – Non-Irrigated
0h 1,100-1,800 0 110f
Natural Gas Combined-Cycle
42 760 0 26-38f
Coal IGCCi 170-570 760 0 530 f
Hydroelectric 0 -- -- 0 for no allocation of evaporation; up to 17,000 for full allocation of evaporationl
PV 0 -- -- 19j
Wind 0 -- -- 3.8k
a. Using wet cooling as closed-loop cooling tower or cooling reservoir. b. Using dry cooling as air-cooled condenser. c. Limited data are available since technology is not available at commercial scale. d. (DOE, 2009a) e. Safety concerns and cost make dry cooling for nuclear power plants an unlikely choice. f. Source references did not specify whether values are for withdrawal or consumption. g. Water consumption for irrigated biomass fuel production was not reported. Reported withdrawal for dedicated energy crops is greater than 130,000 gal/MWh, but is highly variable. (Larson et al., 2007) h. Non-irrigated biomass is rain-fed; CRS did not estimate the water consumed through plant evapotranspiration. i. IGCC: Integrated Gasification Combined-Cycle. j. (Leitner, 2002) k. AWEA estimate, based on data obtained by AWEA available at http://www.awea.org/faq/water.html. l. See the section below for a fuller discussion of hydroelectric power

ENV/EPOC/GSP(2010)21
19
1.1.2 Hydropower water demands
22. Hydropower is a power generation technology that provides important sources of electricity without the use of steam boilers (EIA, 2009b). Hydroelectricity provides the largest share of non-thermoelectric generation, accounting for 15% of worldwide generation. The water use implications of hydroelectric power differ significantly from thermoelectric generation since it does not withdraw or consume water for cooling. Instead, hydroelectric facilities use the force of gravity to pass water through turbines to generate electricity. Although hydropower does not require water for cooling like thermal generation, it is often considered a highly water consumptive technology due to the large volumes of water evaporated from the surface of reservoirs behind dams. Because natural river flows lose water to evaporation, only the additional water evaporated from a reservoir due to the increased surface area produced by the existence of the dam in comparison to the free-flowing river is considered in consumption statistics (Torcellini et al., 2003). In some cases, this increased evaporation is several times larger than the evaporation associated with thermal power plant cooling. However, the increased evaporation from the additional surface area of the reservoirs varies significantly globally based on climatic conditions. And, because reservoirs often have multiple purposes (e.g. recreation, navigation, flood control, water supply) in addition to hydropower, attributing all reservoir evaporation to power production is often dubious.
23. Just as with thermoelectric power plants, hydropower facilities are not immune from inducing temperature impacts on the environment. The entire aquatic environment around a dam is changed from the pre-dam condition causing temperature changes above and below the dam. Aside from a long length of the river that is subsumed, the species that live in the free flowing river must migrate away from or adapt to the now stagnant lake that varies in temperature from warm to cold from the top to the bottom of the water column. Because the water flowing through the turbines comes from the bottom of the reservoir, it exits at a lower temperature than the temperatures for which the native river species are adapted. Thus, native river species not only must migrate upstream of the dam to reach normal conditions, they must also move downstream until the temperature stabilizes.
24. Although electricity at hydropower facilities is produced with almost no greenhouse gas (GHG) emissions at the point of generation, some contend that they release notable amounts of methane (Whittington, 2007), and their environmental and water quality impacts can be significant. In particular, greenhouse gas emissions are associated with the anaerobic decomposition of organic matter that is submerged during the creation of reservoirs and from the embedded energy in the construction of the dam. So while dams do not generate greenhouse gas emissions from the process of power generation, the construction of the dams and reservoirs do create greenhouse gas emissions. Because conventional hydropower development through dam building often significantly alters river ecosystems, the new construction of large dams is contentious in most OECD countries. Therefore, efforts to identify opportunities for increasing hydropower generation have focused on smaller-scale opportunities (“small hydro”) or improved efficiency and expansion of hydropower at existing facilities through uprating processes. However, hydroelectricity development is expanding in many areas of the world; 157 GW of additional hydroelectric capacity was planned in 2008 worldwide, over 80% of which was planned in Asia (Sternberg, 2010). Three Gorges Dam in China, the largest hydroelectric dam in the world, is expected to reach a generating capacity of 22 GW when it reaches completion in 2011 (Sternberg, 2010). Large-scale hydropower capacity additions are also underway in India, Iran, Turkey, and Brazil.

ENV/EPOC/GSP(2010)21
20
1.1.3 Renewable electricity water demands
25. The water use implications of non-hydropower renewable electricity generation vary tremendously across technologies. Distributed renewable electricity technologies, such as wind turbines and solar photovoltaic (PV) panels, do not use thermoelectric processes and have minimal water requirements for electricity generation. These systems require small volumes of water for cleaning, but otherwise use no water directly for generation, though water is used in manufacturing equipment for these systems. Other types of renewable technologies such as the most common concentrating solar power (CSP) designs, enhanced geothermal, and biomass powered-plants use conventional thermoelectric processes to convert heat into electricity raising the same water use concerns as thermoelectric power plants using traditional fuels.
26. Many solar developers favor CSP over PV because CSP systems readily achieve utility-scale and easily couple to thermal storage technologies and natural gas turbines that allow facilities to more consistently produce electricity during the day and into the night hours (DOE, 2009b). This coupling characteristic has facilitated the entrance of commercial-scale CSP facilities onto the electricity grid. The first large-scale CSP plant with thermal storage began operations in Granada, Spain, in November 2008: a 50 MW plant with seven hours of thermal storage (DOE, 2009a). Another large CSP installment (280 MW) with energy storage is being developed in the Southwestern US by Arizona Public Service (APS, 2010). CSP plants operate at lower operating temperatures than fossil and nuclear powered plants, and as a consequence, their steam cycles are less efficient, so more cooling water is needed per unit of electricity generated. Furthermore, areas that provide the best solar resources for CSP are typically dry and hot, which limits large scale use of wet cooling because of water resource scarcity. Although dry cooling can be coupled to CSP, doing so introduces parasitic efficiency losses, particularly on hot days. Nonetheless, some CSP companies have committed to dry cooling to avoid the political, availability, and environmental barriers because of concerns over water issues. These new systems demonstrate the feasibility of dry-cooling for large-scale systems and might be indicators of a new trend in electricity.
27. Geothermal power plants utilize naturally-occurring convective hydrothermal sources inside hot rock to create steam and generate electricity. However, the majority of the global geothermal resource is dry hot rock that does not contain adequate water to recover the embedded thermal energy that is necessary to run steam-powered turbines. Enhanced geothermal systems exploit the dry hot rock by injecting large volumes of water into fractured rock. Thus, an external water supply is necessary to use this worldwide geothermal resource. The injected water absorbs the geothermal heat and is pumped to the surface to power the steam cycle. The same water volume is then injected back into the rock to form a closed loop system.
28. Electricity generation from combustion of renewable biomass requires similar cooling water use as coal- and nuclear-fueled thermoelectric facilities (Twomey and Stillwell, 2009). Volumes of water allocated for non-combustion purposes vary widely depending on what type of feedstock is used, where it is harvested, and whether or not it requires irrigation. Some biomass sources, such as forest trimmings and pulp and paper industry waste, use only natural precipitation for biomass growth. In contrast, dedicated energy crops and crop residues often come from irrigated lands with large volumes of human-applied water in addition to natural precipitation. However, these dedicated energy crops and residues are also targeted for liquid transportation fuel production, so it is not obvious how to allocate the water requirements (see additional discussion of the water requirements for biomass below).

ENV/EPOC/GSP(2010)21
21
1.2 Water resource impacts on electricity generation
1.2.1 Droughts and heat waves
29. Water shortages and heat waves have already had detrimental impacts on electricity reliability, especially in drought-prone and water-scarce regions of the world. Periods of drought increase the risk of electricity supply interruptions from generators that require water for operations. Unfortunately, water supplies are often most constrained during the summer months when ambient temperatures are highest, which is also when electricity demand is greatest in many regions. Drought severe enough to limit water use by electricity generators that need the water can force facilities to reduce generation or shut down. Heat waves can also affect power plants because higher temperatures limit the cooling effectiveness of the water source, and can push power plants up against environmental limits (specifically, thermal pollution limits for water that is returned from the power plant).
30. The 2003 heat wave that hit Europe caused many of France’s nuclear reactors to run at reduced capacity. This severe reduction in electricity generating capacity (as nuclear energy supplies nearly 80% of France’s electricity demand) occurred at a time when electricity demand was at its highest due to increased demands for air-conditioning and refrigeration in response to the higher ambient temperatures. Also, on August 16, 2007, a nuclear reactor at the Browns Ferry Nuclear Power Plant in Alabama shut down for one day because cooling water discharge exceeded temperature regulations that protect the environment and wildlife, and for the same reason, that plant has operated at reduced output in 2010 (Flessner, 2010). Other plants sited near Raleigh, NC, and Charlotte, NC, have come close to mandatory shut downs. In total, 24 of the United States’ 104 nuclear reactors are sited in drought-prone regions (AP, 2008; Hightower and Pierce, 2008). Similar episodes have happened with nuclear reactors in other countries.
31. Hydropower has also been compromised due to water shortages associated with dry climate and drought in many regions of the world. Reductions in streamflow limit the amount of hydropower that can be produced and can potentially cause a loss of generation altogether if reservoir levels fall below the turbine intake structures. Lower streamflows in the Southwestern US have reduced the reservoir levels at hydropower facilities (e.g., Lake Mead at Hoover Dam), which have consequently reduced generation. In the Colorado River Basin, every 1% decrease in streamflow reduces hydropower generation by 3% (NOAA, 2009). Even in regions that are not characteristically dry, changes in streamflow have reduced water storage in reservoirs, and consequently, water availability for hydroelectric facilities throughout the year. For example, in the Northwestern region of the United States, climate change and its effect on variability in the region’s hydrology has raised concerns about the future hydropower generation from existing facilities (Barnett, 2009). See United States case study for a graphic on US hydropower.
1.2.2 Climate change impacts
32. Climate change models suggest that the Southwestern region of the US will get warmer and drier, placing increasing strain on water supplies. Seasonal runoff from mountains in the Southwestern US is also likely to become less dependable as increasing temperatures continue to shift the quantity, timing, and duration of snowpack melt (NOAA, 2009). Projections of earlier snow melt, less snowpack, and more frequent and severe drought conditions indicate that water supply issues will likely be exacerbated in the future, increasing competition between municipal, environmental, agricultural, and electricity sector demands. Storing early season water is often difficult for multi-purpose reservoirs in the region since the strategy conflicts with the need for storage space to be available in case of floodwaters. This pattern is likely to be repeated in many places globally.

ENV/EPOC/GSP(2010)21
22
33. While water supply constraints have already affected electricity generation at existing power facilities, they have also limited the development of new water-intensive generation in very dry regions (Feeley III et al., 2008). Water scarcity has reduced the expansion of new thermoelectric capacity in the Southwestern United States, which currently generates the majority of its electricity from water-cooled coal power plants (with the exception of California). Three proposals for wet-cooled thermoelectric plants in Arizona have been denied state water permits to build due to water availability constraints (Ottoson and Stenstrom, 2003). Sempra Energy of Nevada has halted the development of new coal power plants because of concerns over local water resources, and some concentrating solar power developers have committed to dry cooling to avoid water resource conflicts in the Southwestern US (Feeley III et al., 2008). Water scarcity has also raised concerns in siting new power plants in the inland regions of the Northwest, which are relatively dry and susceptible to extended droughts (NOAA, 2009). From 2006 to 2008, the state of Idaho instituted a moratorium prohibiting the construction of new coal-fired power plants because of water supply and environmental concerns (Feeley III et al., 2008). Despite their economic and efficiency drawbacks, dry cooling systems are becoming increasingly utilized at Southwestern power plants as an alternative to abandoning facility proposals because of water constraints (Ottoson and Stenstrom, 2003). More than 50 dry cooled power plants, in states such as Nevada, New Mexico, California, and Texas, are now in operation (Ottoson and Stenstrom, 2003). These challenges (i.e. water scarcity inhibiting the construction of new power plants) and solutions (i.e. dry cooling or different generation technologies) are also common and applicable in many other parts of the world.
1.3 Water resource impacts from liquid fuels production
1.3.1 Water demand for liquid fuels
34. The processing and refining step of both petroleum and unconventional petroleum (e.g. oil sands) tend to consume similar quantities of water in the range of 1-3 L H2O per L of fuel product (Gleick, 1994). For corn-starch based ethanol, the water consumption is slightly higher at 3-6 L H2O per L of product (Keeny and Muller, 2006; King and Webber, 2008; Wu et al., 2009), and for sugar cane ethanol in Brazil, higher still at 12-24 L water per L ethanol2. Thus, while the water per liter of fuel might not seem high, the size of biorefineries necessitates the consumption of hundreds of millions of liters per year for a single point source location, creating potentially significant local impacts (Keeny and Muller, 2006). Freshwater consumption for biofuels during the agricultural phase of the life cycle is important to consider and has been raised as a major concern (Berndes, 2008; GAO, 2009b; Gerbens-Leenes et al., 2009; Schnoor et al., 2008). Whereas the oil and gas industry often injects large quantities of water into hydrocarbon reservoirs to stimulate production during secondary recovery, this water is often saline and not drawn from fresh surface or groundwater. Thus, water demands for upstream oil and gas production often do not raise the same concerns as biofuels related to water quantity, but they can have similar or worse water quality concerns (see Canada case study below). For example, because US shale gas production via fracturing is occurring in some urban areas and relatively close to some freshwater aquifers, concerns have arisen regarding competition for water quantity during production and concern for water quality during disposal of fracturing fluid water (Soeder and Kappel, 2009).
35. The water demand for irrigated biofuels is very high compared to conventional transportation fuel sources. For irrigated US corn in 2003, the average irrigation withdrawal equated to 780 liters H2O/L ethanol translating to an average of 82 L H2O per km traveled (from 15–260 L H2O/km depending upon which state the corn is grown) when weighted as E85 and a vehicle operating at 6-7 km/L of fuel (King and Webber, 2008; USDA, 1999,2004). Water consumption for 2003 US irrigated corn grain was 3-146 L H2O/km (average 66 L H2O/km) (King and Webber, 2008). On a per km driven basis, water consumption for irrigated corn-based ethanol in the US is up to 100 times greater than water consumption 2 Based upon biorefinery consumption of 1-2 m3 water per tonne of sugar cane and 85 L of sugar cane per tonne.

ENV/EPOC/GSP(2010)21
23
from non-irrigated corn-based ethanol. For irrigated US soybeans, the average irrigation withdrawal was 510 L H2O/L biodiesel translating to an average of 35 L H2O/km (King and Webber, 2008; USDA, 1999,2004). Average water consumption for irrigated soybeans in the US was 28 L H2O/km. Thus, the water intensity of biofuels is highly dependent on regional differences. For example, a 2009 study by Chiu et al. estimated that the US state-wide differences in irrigation water embodied in bioethanol from corn in the US ranged from 5 to 2,138 L H2O/L ethanol (Chiu et al., 2009).
36. Both irrigated and non-irrigated biofuel feedstocks need significant amounts of water for evapotranspiration (ET) during photosynthesis. This ET from natural water is sometimes included in analyses of water consumption, and often termed the green water footprint (Gerbens-Leenes et al., 2009). Thus, there are still water concerns for biofuels that are not irrigated, and the change in ET from a previous land use to biofuel feedstock agriculture must be considered for water resources management. It is intuitive to believe that, from a water consumption standpoint, biofuel production in water rich regions is more sustainable than those areas that require irrigation to grow biofuel feedstocks. For example, the vast majority of biofuels produced in Brazil are rain-fed, decreasing the human-appropriated water requirements for ethanol production (Lapolaa et al., 2009; Martines-Filho et al., 2006). Thus, the natural environment provides an important ecosystem service of distributing appropriate water quantities that can also have detrimental water quality impacts from distribution of excess nutrients from agricultural runoff, as discussed in the next section. Second and third generation biofuels, such as lignocellulosic harvest and forest residues as well as dedicated lignocellulosic crops, present opportunities to decouple irrigation from biofuels and significantly reduce water demand for feedstocks, but the feedstocks still consume water via ET of precipitation (Gerbens-Leenes et al., 2009; King and Webber, 2008; Lapolaa et al., 2009; Parris, 2010). Thus, biomass agriculture and biofuels production need to be well-integrated into a broader water resource management perspective.
1.3.2 Water pollution from liquid fuel production
37. During the life cycle of liquid fuels production, whether from fossil fuels or biomass, the environment can be harmed through spills and other chemical pollution. Some memorable instances of oil negatively affecting aquatic environments were the 1989 Exxon Valdez oil spill when 42,000 m3 (11 million gallons) of oil were spilled in Prince William Sound, Alaska, US (Graham, 2003), and the Amoco Cadiz breaking in two off the coast of Brittany, France in 1978, spilling 255,000 m3 (67 million gallons). The explosion and subsequent oil spill by BP-operated Deepwater Horizon drilling rig on April 20, 2010 in the Gulf of Mexico is a recent reminder of low probability yet high impact risks of petroleum exploration in aquatic environments. (Deepwater Horizon Unified Command, 2010; DOI, 2010).
38. The development of unconventional fossil fuels also raises water quality concerns that are not always well understood. For instance, recovering shale gas produces brines during the hydraulic fracturing process, which require post-treatment or disposal. In the Marcellus Shale region, the majority of injected water used to extract shale gas must be recovered and treated in wastewater treatment plants, which can be very expensive and possibly require new technology to filter new contaminants. In the Barnett Shale, located in Texas, contaminated water is often re-injected into the ground as a means of disposal. However, while the deep geologic features are amenable for waste injection for the Barnett region, the injection in regions with poor geology for hazardous fluid disposal access and containment raises concerns regarding drinking water contamination. Thus, the reinjection of produced water has not been widely adopted in other regions such as the Marcellus Shale (Soeder and Kappel, 2009). New research also shows that production of Canadian oil sands has contributed to significant increases in concentrations of polycyclic aromatic compounds (PAC) through airborne deposition onto the snowpack and dissolution in the Athabasca River in Canada (Kelly et al., 2009) (see Canada case study below).

ENV/EPOC/GSP(2010)21
24
39. While the water quality consequences regarding the oil, natural gas, coal, and uranium industries are relatively well regulated in developed countries, those associated with non-traditional forms of transportation fuel are not as well controlled. Fossil fuel mines are point source polluters, whereas agricultural operations are classified as nonpoint source water polluters. In the US and many countries, point source discharges are regulated (e.g. under the Clean Water Act (CWA) in the US). Under the CWA, any entity that discharges pollutants (excluding individual homes) into surface water must obtain a permit to pollute - effectively placing a limit on discharge to a water body (EPA, 2009). Since coal and uranium mining operations, and oil and natural gas operations fall within the CWA’s definition of point sources, the water quality impacts associated with traditional fossil fuel sources are relatively straight-forward to regulate. Quantifying the water quality impacts of the agricultural portion of the biofuel life cycle presents new challenges since most agricultural producers fall under the classification of “nonpoint source” polluters (EPA, 2009).
40. Unlike point source pollution, which enters surface water sources by direct conveyance or manmade ditches, nonpoint source pollutants are transferred into water bodies by means of rainfall or snowmelt that flow over and through the ground as runoff, collecting manmade pollutants as it moves. Since pollutants transferred to water bodies via contaminated runoff or percolation through the ground cannot be attributed to discrete sources, this type of water pollution is much more difficult to regulate. Consequently, even though the relationship between nutrient loading to surface and groundwater and upstream agricultural activity in the US is widely accepted, pollution from agricultural sources is largely unregulated.
41. Increased production of biofuels in the United States has increased water pollution marked by increases in nitrogen and phosphorus agricultural chemical concentrations and hypoxia in surface waters draining from farmland, namely the Mississippi River basin, and groundwater near farmland (Alexander et al., 2008; de Fraiture et al., 2008; de Paula Gomesa and de Araújo, 2009; Donner, 2003; Donner and Kucharik, 2008; Mitsch et al., 2001; Morgan and Dale, 2007; Rabalais et al., 2002; Twomey et al., 2010). This increase in nutrient loading from crop production has contributed to the growth of the large hypoxic area referred to as the “dead zone” of the Gulf of Mexico which is currently the second largest hypoxic zone in the world after the Baltic sea (Alexander et al., 2008; Owen, 2010),
42. Although all fertilized crop production can cause nutrient leaching, because corn is particularly inefficient, using only 40-60% that is delivered to its roots, it is especially linked to leaching (Simpson et al., 2008). Cellulosic feedstocks from perennials such as switchgrass and woody materials can be used to produce ethanol with less water quality impacts than row crops due to the reduced need for agricultural chemical inputs and reduced soil erosion (Eisentraut, 2010; McLaughlin and Walsh, 1997; Pimentel and Patzek, 2005; Simpson et al., 2008). In addition to their anticipated high net energy, high geographic distribution, resistance to drought, and high carbon sequestration, perennials provide important services in terms of soil management, flood management, and nutrient uptake, which in turn have many positive water quality attributes. For these ecological reasons as well as from social and political pressures to disassociate water and food from energy production, many companies and research institutions focus upon non-irrigated biofuel feedstocks and life cycles that can contribute to better soil and water quality. However, to date, technological and economical limitations make it uneconomical to produce fuels from cellulosic feedstocks at a large scale (Eisentraut, 2010; Simpson et al., 2008), in spite of the US Renewable Fuels Standard mandate to produce cellulosic advanced biofuels (EPA, 2010b).
43. Thus, as countries shift from conventional fossil fuel production towards unconventional fossil fuels and biofuels, the nature, extent and location of the water use and water pollution will be different. Consequently, the existing regulatory frameworks for protecting water quality might need to be updated and revised.

ENV/EPOC/GSP(2010)21
25
1.4 Impacts of water treatment, distribution, and use on energy demand
1.4.1 Energy requirements for fresh water treatment
44. Collection, conveyance, treatment, distribution, and heating of water for public water supplies consume large quantities of energy usually in the forms of electricity and natural gas. This energy consumption for water varies with distance to the water source, existing water quality, water treatment standards, distribution system terrain, and end-use of water.
45. Moving water requires energy, except in locations where geographic terrain allows for gravity-fed systems. Pumping water long distances, uphill, or from deep aquifers usually requires more energy for water collection than use of local surface water sources for drinking water. Use of groundwater for drinking water requires energy for well pumping, which increases with depth to the water table: pumping from a depth of 37 m requires 0.14 kWh/m3 while pumping from 122 m requires 0.53 kWh/m3 (Natural Resources Defense Council, 2004).
46. After source water is collected, water in industrialized countries is typically treated to achieve minimum health standards. Though only a small portion of the water leaving a water treatment plant typically ends up being used for drinking, all water produced by drinking water treatment plants is generally required to meet pertinent government drinking water standards. Thus, much embedded energy is wasted by irrigating lawns and operating toilets using high quality drinking water. Standard water treatment employs physical and chemical treatment processes to remove contaminants. Depending on the water source, groundwater treatment can require little more than chemical disinfection due to the natural filtration characteristics of soil. In general, energy consumption for water treatment increases as the source water quality degrades, as shown in Table 3.
Table 3. The energy requirements for water treatment increase as source water quality degrades, shown here for US national average values (Goldstein and Smith, 2002; Klein et al., 2005).
Water Source Energy for Water Treatment*(kWh/million L)
Groundwater 58 Surface Water 160 Brackish Groundwater 1,000-2,600Seawater 2,600-4,400
*Does not include raw water collection and conveyance or treated water distribution and heating.
47. Use of alternative water sources can dramatically increase energy consumption for drinking water treatment. As shown in Table 3, desalination of brackish groundwater or seawater can increase energy for water treatment by a factor of 6 to 27 over use of local surface water supplies (2004; Goldstein and Smith, 2002; King et al., 2008b; Klein et al., 2005; Stillwell et al., 2009). While different processes exist to separate dissolved solids (salts) from seawater and brackish water, most commercial-scale desalination facilities use reverse osmosis membrane treatment or thermal separation technologies (Van der Bruggen and Vandecasteele, 2002). Desalination requires large amounts of energy to overcome osmotic pressure during reverse osmosis or to alter water temperature and pressure during thermal desalination. Despite these large energy consumption consequences, various municipalities worldwide turn to desalination after drought or other circumstances have strained existing water supplies (see Australia and Israel case studies).
48. In areas of the Middle East, waste heat from thermoelectric power plants, including concentrating solar power plants, is used for thermal desalination of seawater to produce a reliable drinking water supply (Cardona et al., 2007; Trieb and Muller-Steinhagen, 2008). In such co-located desalination facilities and power plants, steam leaving the power plant’s steam generator preheats

ENV/EPOC/GSP(2010)21
26
seawater in a heat exchanger upstream of the thermal desalination process. The net result is coupled benefits: the fuel consumed in the thermoelectric power plant produces electricity and contributes to desalinating the seawater, making a more efficient use of energy.
49. After source water has been treated to acceptable health standards, the treated water is then distributed to residential, commercial, and industrial users. In the United States pumping treated water in distribution systems is an energy-intensive step that typically represents 85% - approximately 28 billion kWh (Goldstein and Smith, 2002) - of the total energy consumed during the water process (i.e., collection, conveyance, treatment, and distribution) (Goldstein and Smith, 2002). Additionally, aging water distribution infrastructure increases the energy required to deliver drinking water because of losses that arise from leaks and friction on the distribution pipe walls.
50. Recent estimates show the use of hot water in the US residential and commercial sectors consumes substantial amounts of energy – estimated at 4 exajoules, or 4% of US total primary energy consumption (EIA, 2010). In the United States, an average of 35% of the volume of water delivered to residential customers is used indoors; outdoor uses constitute 58%, with leaks at 6% and unknown losses at 1% (AWWARF, 1999). Of average US indoor water uses, over half of those uses generally require heated water (AWWARF, 1999). This allocation is not unusual for OECD countries. Due to the large energy requirements for water heating and expensive energy resources, Israeli and Hawaiian laws now require builders to install solar hot water heaters on newly constructed homes; as a result, 90% of Israeli households use solar hot water heaters (Climate Institute, 2010; Grossman, 2007). These increases in solar hot water heater use reduce the consumption of grid electricity or natural gas, thus reducing the impact of water heating on primary energy demand and power plant cooling water.
1.4.2 Energy requirements for wastewater treatment
51. Following water use by residential, commercial, and industrial customers, adequate sanitation of wastewater is required to protect human health and the surrounding environment. Wastewater treatment requires more energy than conventional surface water or groundwater treatment since wastewater facilities employ physical, biological, and chemical treatment operations that process both solid and liquid waste (see Table 4). The quality of the treated wastewater effluent increases with more sophisticated wastewater treatment technologies. While wastewater operations such as aeration and solids-handling consume a large portion of the total process energy (Burton, 1996), research shows that large wastewater treatment plants in the United States could greatly reduce primary energy consumption by recovering energy from anaerobic digestion and biosolids incineration processes (Stillwell et al., 2010).
Table 4. US national average values of energy for wastewater treatment increase as effluent quality increases (Goldstein and Smith, 2002).
Wastewater Technology Energy for Wastewater Treatment (kWh/million L)
Trickling Filter 250 Activated Sludge 340 Advanced Treatment without Nitrification 400 Advanced Treatment with Nitrification 500
52. Another alternative fresh water “source” that has been discussed in a policy context is water reuse. After wastewater has been sufficiently treated, the effluent water can be further treated for direct or indirect reuse of water. For water reuse as a drinking water supply, energy-intensive membrane treatment is usually required after advanced wastewater treatment operations to ensure removal of disease-causing agents and other contaminants. In some countries, such as the United States, non-potable

ENV/EPOC/GSP(2010)21
27
reuse is preferred over direct or indirect potable reuse due to adverse public perception. On the other hand, Singapore uses direct potable reuse with advanced membrane treatment to produce NEWater that exceeds existing health standards (see Singapore case study) (PUB, 2010) .
53. Wastewater management itself affects aquatic ecosystems and the surrounding environment, and reducing the impacts requires more energy for distribution, dispersal, and removal of contaminants. Depending on the level of treatment, wastewater effluent disposal can increase nutrient loading in receiving streams, contributing to unwanted algae blooms. Large-scale seawater desalination plants produce concentrated salt waste streams, which are usually disposed via return to the ocean or gulf water source; concentrate disposal for inland brackish groundwater facilities requires evaporation ponds, deep well injection, or drying to form solid waste. Studies of seawater desalination waste show that disposal of concentrated salts can negatively affect aquatic life through localized increases in salinity (Lattemann and Hopner, 2008). The removal of particulates and contaminants from water supplies necessitates the disposal of those contaminants, thus increasing energy demands even further.

ENV/EPOC/GSP(2010)21
28
CHAPTER 2 INSTITUTIONAL REFORMS FOR ENHANCING COHERENCE BETWEEN WATER
AND ENERGY POLICIES
2.1 Policies and technologies relevant to the energy-water nexus
54. This section provides a qualitative description of policy objectives and the technologies and policy options that help achieve the objectives that have relevance to the energy-water nexus. Within the context and constraints of each region of the world, the best technologies and policies for each region are likely to be different. And, just as energy and water are intimately coupled, so too are policies and technologies that affect the energy-water nexus. Thus, while some technologies leverage policy changes, some policies encourage or need technology to be effective.
55. Table 5 summarizes the textual descriptions of technology and policy that follow. For each of these policy and technology options, economic factors are not considered. That is, the impact of these policies or technologies on water or energy prices and demand are not represented. For example, desalination is a technology that, if pursued as a part of policy for providing potable water supply, is intended to increase the secure supply of freshwater for higher consumption, typically at a higher price required to pay for infrastructure and energy consumption. In reality, because the energy and monetary costs of desalinated water are higher than conventional surface and groundwater supplies, higher prices for water desalinated water might deter increased consumption per capita while aggregate consumption may go up or down. Thus, the discussion in this section does not consider indirect economic effects involving supply and demand feedbacks from pursuing the listed policies and technologies.
2.1.1 Description of policy objectives
56. Nations have different policy objectives related to energy, water and carbon. Some of the most relevant and universal objectives for the energy-water nexus are listed here and used as an organizing framework for this discussion (and organized by appropriateness for different technologies in Table 5).
57. Water security relates to efforts that increase freshwater supply, reduce freshwater consumption for the same level of service (efficiency), or conserve freshwater consumption in aggregate (conservation).
58. Energy security 3 relates to efforts that increase energy supply, reduce energy consumption for the same level of service (efficiency), or conserve energy consumption in aggregate (conservation).
59. Increased water quality relates to efforts to mitigate impacts from human activity that alter the ambient natural aquatic environment due to, but not limited to release of total dissolved solids, unnaturally warm or cold water, dissolved gases, and dissolved nutrients.
3 As used here, energy security does not address concerns of wealth transfer or supply chain reliability from trade of
energy resources between countries.

ENV/EPOC/GSP(2010)21
29
60. Carbon management relates to efforts that reduce or avoid anthropogenic greenhouse gas (GHG) emissions in aggregate or sequester carbon from the atmosphere. To assess impacts of carbon management from increased energy consumption, the following sections assume energy comes from a typical OECD fossil energy mix of 85%. Thus, the default assumption is that higher energy consumption equates to higher GHG emissions.
61. Renewable energy relates to efforts that generate more energy from solar (sunlight, wind, waves, biomass), gravitational (tides and falling water), and geothermal resources.
2.1.2 Description of policy choices
62. A variety of policy options are available for countries to pursue their policy objectives discussed above. While the discussion in this section and the information organized in Table 5 focuses on different technological solutions and the policies that enable their widespread adoption, it is important to note that behavioral changes are also an important piece of the policy discussion. In particular, even technologies that are cost-effective to implement (e.g. they pay for themselves within a reasonable timeframe) and for which there is policy support often do not get implemented because of behavioral, cultural, or financial hurdles (Committee on America's Energy Future et al., 2009; NAS, 2010). According to a recent landmark study by the U.S. National Academy of Sciences, some of the barriers that remain—even for technological solutions that are cost-effective—include the following (NAS, 2010):
• Potentially high up-front costs
• Alternative uses for investment capital that appear more attractive
• Volatility in energy prices (which creates uncertainty in payback times)
• Lack of information to consumers about relative performance and costs of alternatives
• Marginal energy costs are often a small part of an individual’s or family’s budget (especially true for the United States)
• Substantial investments in time and effort might be necessary to find/study relevant information
• Purchasers focus on up-front costs, NOT lifecycle costs
• Risk aversion—new products are unfamiliar
63. In addition, there are important structural gaps, whereby the people or institutions that make the investment decisions for energy- or water-efficient technologies are different than the people or institutions that benefit. Two classic examples of this conundrum are: 1) landlords pay for the capital for buildings (including appliances, windows, insulation, heating/cooling systems, etc.), while tenants pay the energy and water bills, and 2) homebuilders select the capital stock, but homeowners pay the energy and water bills.
64. According to the same National Academy of Sciences study noted above, there are examples of successful policies and programs, including (NAS, 2010):
• Efficiency standards for vehicles and appliances

ENV/EPOC/GSP(2010)21
30
• Regulatory reforms for the adoption of large-scale systems (for example, combined heat and power)
• Product labeling and promotion
• Building energy codes
65. It is important to note that there are also cultural pressures that impact decision-making. For example, for a variety of historical and cultural reasons, Australians are typically much more water-conscious than Americans, and Europeans are typically much more energy-conscious than Americans. These cultural attitudes manifest themselves in individual decisions to conserve energy and water, even when policies or economic arguments do not require or justify those actions. Despite the importance of cultural forces, the discussion in this section focuses on policies that can overcome these barriers to help bring forth new technologies, as opposed to bringing forth new behaviors or attitudes. Some typical policy choices for the energy-water nexus are considered here (and organized by appropriateness for different technologies in Table 5), based on traditional policies that are available and including the effective policies listed above.
66. Product labeling includes the dissemination of water and energy consumption information on consumer products. Labels on products inform consumers how the product compares to those of competitors and alternative technologies.
67. Public relations (PR) campaigns encompass targeted educational and outreach activities (e.g. public service announcements) that inform consumers or persons who can take direct action upon learning about a topic of interest. PR campaigns include informing the public about the science, economics, or government involvement regarding water and energy issues.
68. Data gathering involves data collected on wider scales of cities and countries that can be used to create statistics for policy decisions and track whether policy decisions produce intended outcomes.
69. Mandates and regulations encompass government laws and rules that consumers and businesses must follow to avoid civil and/or criminal penalties. Water or energy quotas and allocations are included in this category, as are building codes, efficiency standards, and so forth.
70. Right-pricing and full-cost recovery describe policies ensuring that energy and water tariffs (or charges) are sufficient to cover the full supply costs of energy and water (including the operation and maintenance costs and the capital costs for renewing and extending the energy or water system), and ultimately opportunity costs (scarcity value) and externality costs (economic and environmental) (OECD, 2010d). Included in this definition are concepts such as ecological zoning and carbon pricing as means to incorporate externalities.
71. Government subsidies encompass targeted monetary incentives given by the government to specific projects, categories of projects, or industrial sectors.
72. Financing as a policy includes options that enable private businesses and consumers to spread the capital costs of technology over time rather than paying 100% up-front. Examples include traditional loans as well as Property-Assessed Clean Energy financing where capital costs of renewable energy and energy efficiency projects are blended into the property owner’s annual taxes (NREL, 2010).
73. Public works projects encompass public capital projects funded entirely by the government via bonds or other public financing instruments.

ENV/EPOC/GSP(2010)21
31
74. Table 5 illustrates a sample list of technologies that are relevant to the energy-water nexus. These various technologies impact water and energy policy objectives in different ways. For each listed technology (left column), a relationship to policy objectives is given as follows: an up arrow (↑) indicates that the technology helps to achieve the policy objective, a down arrow (↓) indicates that the technology hinders achievement of the policy objective, a level arrow (↔) indicates that the technology has choices and tradeoffs that make its effect upon the policy objective site-specific or unclear, and dashes (--) indicate that the technology has no appreciable impact on the policy objective. In situations where a technology can be used for widely varying purposes (e.g. hydraulic fracturing, which can be used for accessing natural gas and geothermal resources), multiple arrows indicate the outcome can be different depending upon the application. The ● symbol indicates policy choices that can be effective in affecting increased or decreased use of a technology, and the ○ symbol indicates policy choices that are only moderately effective. The effectiveness of a particular policy in promoting a technological solution is independent of whether that solution produces good or bad outcomes for the policy objectives. In other words, it is possible to craft a policy that is effective at creating a negative outcome for any one policy objective.
75. The technologies in Table 5 are listed in an approximate order of increasing scale (top to bottom) of the decision-making body. For example, the installation of low-flow fixtures in a home is a decision and act that a personal consumer can make, but approving and allocating funds for desalination plant or transfer of water across water basins typically requires governmental coordination and investment. Similarly, the policy options are ordered according to an approximate scale of capital investment required. Again, installing low-flow fixtures is a very small investment that directly reaches only the person using the fixture while desalination facilities serve many people and require large capital and energy investments.
76. Several technologies from Table 5, show a “win-win” scenario in terms of reaching both energy and water security: low-flow fixtures, energy-efficient appliances, rainwater collection for non-potable uses, solar hot water heating, geothermal heat pumps, electricity peak shaving as a demand response method, solar PV and wind power, combined heat and power, hydropower, and converting municipal waste to energy. Other technologies have various tradeoffs: biofuels development, groundwater pumping, electricity peak shifting for demand management, carbon capture and storage, greywater reuse for potable purposes, and inter-basin water transfer. The rest of the listed technologies have mixed benefits for energy and water security. We list the impacts on the additional policy objectives of carbon management, renewable energy, and water quality as those that have more indirect relationships with obtaining water and energy security from a quantitative standpoint. The technologic impacts on these other three objectives are quite varied.
77. Notably, two policies—namely right-pricing and mandates—are deemed “effective” or “moderately-effective” for a wide range of technologies. These two policy approaches represent different forms of policy intervention: 1) mandates tend to be more direct and command-and-control oriented (e.g. requiring homebuilders to install solar hot water heaters), whereas 2) right-pricing approaches are indirect and market-oriented (e.g. allowing prices for energy to increase with the intent that they would cause homebuilders to install solar hot water heaters). That these policy categories can both be widely-effective despite their very different approaches is important to keep in mind for policymakers. Furthermore, they are not mutually exclusive. That is, both approaches can be used simultaneously.
78. Table 5 also shows that the technologies that require large-scale capital investment and affect many people tend to fall in the jurisdiction of governments. Conversely, lower capital cost items are more controlled by individual consumers and the companies selling the products. The government can generally use efficiency mandates and product labeling standards to facilitate the adoption of lower-cost consumer goods and appliances.

ENV/EPOC/GSP(2010)21
32
Table 5. Various technologies impact water and energy policy objectives in different ways
Water Security
Energy Security
Water Quality
Carbon Mgmt.
Renewable Energy
Product Labeling
PR Campaign
Data Gathering
Mandate/ Regulation
Right Pricing
Subsidy FinancingPublic Works
Low-flow fixtures ↑ ↑ -- ↑ -- ○ ○ ● ○ ●Energy-efficient appliances ↑ ↑ -- ↑ -- ○ ○ ● ○ ●Distributed rainwater collection (non-potable uses)
↑ ↑ ↑ ↑ -- ○ ● ○ ●Distributed rainwater collection (potable uses)
↑ ↓ ↑ ↓ -- ● ● ● ○Solar hot water heating ↑ ↑ ↑ ↑ ↑ ○ ○ ● ● ● ○Geothermal heat pumps ↑ ↑ ↔ to ↑ ↑ ↑ ○ ○ ● ● ● ○Electricity peak shifting ↔ ↔ ↔ ↔ ↔ ○ ● ● ○Electricity peak shaving ↑ ↑ ↑ ↑ -- ○ ● ● ○Groundwater pumping ↔ ↓ -- ↓ -- ○ ● ● ● ● ○Solar photovoltaic ↑ ↑ -- ↑ ↑ ● ● ● ● ○*Wind power ↑ ↑ -- ↑ ↑ ● ● ● ● ○*Combined Heat and Power ↑ ↑ -- ↑ ↔ ● ○ ● ○ ○*Wet-cooled power plants ↓ ↑ ↔ -- -- ○ ○*Dry-cooled power plants ↑ ↓ -- ↔ -- ○ ● ● ○*Concentrating Solar power (steam cycle)
↓ ↑ -- ↑ ↑ ● ● ● ● ○*Hydraulic fracturing (for natural gas from shale or enhanced geothermal)
↓ ↑ ↔ ↔ ↑ and ↓ ● ○
Hydropower ↑ ↑ ↓ ↑ ↑ ● ○ ● ●Desalination ↑ ↓ ↓ ↓ ↔ ● ● ● ●Carbon Capture and Storage ↓ ↔ ↔ ↑ ↓ ● ● ● ● ● ○US Corn Ethanol (Midwest) ↔ ↔ ↓ ↔ ↑ ● ● ● ●Brazilian (State of Sao Paulo) sugar cane ethanol
↔ ↑ ↔ ↑ ↑ ● ● ● ●Municipal waste to energy ↑ ↑ -- ↑ ↑ ● ● ●Greywater and reclaimed water use
↑ ↔ -- -- -- ● ● ○ ●Inter-basin water transfer ↔ ↓ -- ↓ -- ● ● ●○* Because many cities and regions have electric grids operated by government-owned utilities, electric generation infrastructure projects are public works projects.
not likely effective ○ somewhat effective ● effective
→ Increasing scale of capital investment and citizen reach →
Technologies
Policy Objectives Policy Choices that can influence use of Technologies
Consumer/Residential →
Business/Comm
ercial → G
overnment

ENV/EPOC/GSP(2010)21
33
2.1.1.1 Low-flow fixtures:
79. Policy Objectives: Toilets that require less water per flush subsequently reduce water consumption, the volume of wastewater requiring treatment, and the embodied energy consumed for water and wastewater distribution, especially when potable water is used. Low-flow shower-heads promote water conservation for similar length showers, and because showers involve the use of hot water, they reduce the need for primary and secondary energy resources required to heat the water. Subsequently, less energy is required for both pre-treatment of clean water and post-treatment of the wastewater after showering. The lower energy consumption in the supply chain reduces the need for the water associated with production and conversion of the energy resources, including power plant cooling, as well as GHG emissions associated with fossil energy production.
80. Policy Choices: Because low-flow fixtures are low-cost consumer items, effective policies can give away the items or inform consumers of the low cost and environmental benefits to induce change. It is also effective to label products for water efficiency as a method of educating the consumer to distinguish between products. Governments may also mandate use of low-flow fixtures in new construction. Full-cost recovery pricing of water, wastewater, and energy provides proper feedback to the consumer regarding use of fresh and hot water for non-potable home needs.
2.1.1.2 Energy-efficient appliances:
81. Policy Objectives: Appliances, such as clothes washers and dryers, dishwashers, and televisions that require less energy require less embodied water in the energy. The lower energy consumption in the supply chain reduces the need for the water associated with production and conversion of the energy resources, including power plant cooling, as well as GHG emissions associated with fossil energy production.
82. Policy Choices: Appliances are items for which consumers normally budget or purchase outright. Thus, product labeling and PR campaigns can provide information for proper purchase selections. Additionally, governments often set standards for energy efficiency of appliances such that manufacturers have clear targets. For products that go beyond efficiency standards, the government can provide rebates to consumers to adopt new and efficient technologies. The correct pricing of energy is very critical in allowing the consumer to make the proper choice in purchasing appliances that consume considerable energy over their lifetime.
2.1.1.3 Distributed rainwater collection (potable and non-potable uses):
83. Policy Objectives: By collecting runoff rainwater from residential and commercial building roofs, water is captured in a relatively pure form but water treatment is required to make it potable. For non-potable uses, such as irrigation, rainwater collection aids energy security by avoiding energy consumption for distributing water with a centralized system. In treating distributed water to potable standards, smaller treatment systems, such as ultraviolet technologies that kill pathogens, require more energy per liter than municipal scale water treatment. Additionally, the energy consumption for running the individual water pumps at each building is more than that from a centralized municipal system (Beal et al., 2008), thus decreasing energy security. Water consumption is indirectly decreased by the use of decentralized systems because users tend to conserve more when they know the location of their water supply, and a rainwater collection tank makes this source readily apparent. The carbon emissions associated with the extra energy consumed to treat distributed rainwater hinders carbon management. In some regions of the world, particularly dense cities with a high percentage of impervious ground cover, stormwater runoff can overwhelm wastewater treatment facilities causing overflows of sewage into local waterways that hinders water quality. By collecting and absorbing rainwater (e.g. on green roofs) on

ENV/EPOC/GSP(2010)21
34
many buildings and homes, the surge of the stormwater is mitigated and delayed to keep the existing water treatment facilities below maximum capacity.
84. Policy Choices: Rainwater collection can be relatively cheap when not using the water for potable uses, and the extra capital investment to treat the water to drinking quality can be helped by subsidies and financing mechanisms (e.g. those that include the costs into mortgage payments). In some cases, zoning policies and water rights laws can actually prevent home and building owners from legally collecting water that falls on their property. Thus, water rights laws and regulations can heavily influence the integration of rainwater collection. Public relations campaigns can inform home and building owners of the benefits and subsidies (i.e. free rain barrels from the government) of using rainwater collection for irrigation and stormwater runoff prevention.
2.1.1.4 Solar hot water heating:
85. Policy Objectives: The direct use of renewable solar energy to heat water enhances energy security by minimizing the need for primary energy (e.g. fossil fuels, biomass) and secondary energy (electricity) while also enhancing water security and quality by reducing the water requirements for mining of fuels and cooling of thermoelectric power plants. The elimination of the need for grid-based electricity eliminates GHG emissions associated with fossil-fueled power plants.
86. Policy Choices: Governments can mandate the use of solar hot water systems on residential (e.g. Israel, Hawaii) or commercial construction. Subsidies also help promote retrofitting of solar hot water systems on existing buildings and homes to offset the up-front capital cost. A public relations campaign can inform citizens that this is often the most cost-effective technology for incorporating renewable energy into their home, and over time saves money by eliminating the need for heating fuels. Proper labeling of all hot water heaters enables consumers to effectively compare solar hot water systems to those powered by electricity, natural gas, or other fuels. Because solar hot water systems are applicable for retrofitting existing homes and businesses, some financing assistance can help overcome the up-front capital expense of integrating the system into the existing home plumbing.
2.1.1.5 Geothermal heat pump:
87. Policy Objectives: Geothermal heat pumps use the relatively constant temperature of the shallow earth to regulate room temperature in both cold and hot climates. This technology lessens the need for primary energy (e.g. natural gas, heating oil, biomass, and fuels burned for thermoelectric power) for heating and cooling to enhance energy security. This use of the carbon-free energy from the earth helps carbon management, and geothermal heat is normally considered a renewable energy resource. Water security increases as well because of reduced water requirements for mining of fuels, cooling of thermoelectric power plants, and hydropower operation. The working heat transfer fluid of closed-loop designs stays within the system, thus no external water is required, and water quality is not affected for properly functioning systems. However, open-loop systems exchange water with underground aquifers and present opportunities for thermal water degradation if not designed properly. Thus, proper design and use of geothermal heat pumps can prevent hindering water quality.
88. Policy Choices: Geothermal heat pump systems are applicable for residential and commercial heating and cooling, thus subsidies and financing can help incent the up-front investment in new construction. Furthermore, other subsidies and financing mechanisms can help deter the cost of retrofitting existing buildings. Public relations campaigns and product labeling help educate and inform consumers and businesses of the costs and benefits of installing geothermal heat pump systems. Right pricing of both water and energy helps provide the proper market signals for this effective but capital-intensive technology.

ENV/EPOC/GSP(2010)21
35
2.1.1.6 Electricity peak shifting:
89. Policy Objectives: Electricity peak shifting describes the coordinated and scheduled operation of electric devices and processes at times of low demand when their operation at peak demand is not crucial. Example processes that need not operate at peak hours of the day are refrigeration, pool pumping, and water treatment. Energy storage systems also fall under the category of peak shifting. For example, air-conditioning systems can use nighttime electricity to create ice that can be used later for cooling buildings during hot days. This shift in electricity demand prevents the need to run high-powered air conditioning systems during peak times of the day, helping energy security by relieving stress on the electric grid. However, more aggregate energy is consumed in the storage-based peak shifting cycle, thus creating an energy security tradeoff. The full water and energy benefits from shifting electricity demand are not generalizable across regions as they depend on the characteristics of the local electricity grid. That is to say, electric generating plants that operate in the day versus night can have various characteristics regarding water consumption and quality, renewability, GHG emissions. For example, in many regions wind turbines produce more electricity at night than during the day, and shifting load to night hours can help integrate that low-carbon and low-water consuming renewable technology. Additionally, the least energy efficient power plants are usually the last to serve demand, and peak shifting reduces the need to use the least efficient plants.
90. Policy Choices: The institution of time-of-use pricing, where consumers are exposed to low prices during low demand, and high prices during high demand, is an effective policy for demand management of electricity to shift consumption from times of high demand to those of lower demand. Public relations campaigns help inform consumers and businesses of the economic benefits of peak shifting. In order to determine the effectiveness of peak shifting, it is crucial to gather sufficient data to describe the relationships and correlations among policies, time-of-use pricing (e.g. the market), and the actual timing of electricity consumption. Subsidies can help consumers integrate infrastructure, such as smart grid devices and electronics that facilitate automated shifting of electricity demand.
2.1.1.7 Electricity peak shaving:
91. Policy Objectives: Electricity peak shaving differs from peak shifting in that it describes absolute reductions in electricity demand at peak electric load, without shifting that demand to other times of the day. An example of a peak shaving technology is the cycling of air conditioners during summer afternoons to prevent them from operating simultaneously while allowing them to run at sufficient duration to cool effectively. Reducing demand for electricity at peak consumption times of the day and year, such as during summer afternoons and evenings when cooling loads are the highest, can reduce the water and fuel requirements at power plants during the times when the cooling systems, both wet and dry, are least energy efficient and water evaporation from cooling is at the highest rates (L/kWh) of the year. The lower need for cooling water results in less warm cooling water discharge into the environment. Peak shaving enhances energy security by consuming less fuel while keeping system load below the capacity of the electric grid.
92. Policy Choices: The same policies that promote electricity peak shifting generally help promote peak shaving behavior. Some inexpensive subsidies can be effective (e.g. free thermostats to households from a utility to control the cycling of air conditioners).
2.1.1.8 Groundwater pumping:
93. Policy Objectives: Irrigation of crops using water pumped from aquifers has enabled tremendous gains in agricultural production by providing a secure medium-term supply. However, pumping groundwater faster than it is recharged turns the aquifer into a quasi-fossil resource that is not

ENV/EPOC/GSP(2010)21
36
renewable and decreases long-term water security. Thus, ground water pumping can increase or decrease water security depending upon the rate of pumping relative to recharge. Overdrawing an aquifer lowers the water table, which means more energy is required to pump that groundwater to the surface and a reduction in energy security and more GHG emissions from fossil power plants.
94. Policy Choices: In parts of the world, groundwater ownership and use is governed by the Rule of Capture, based on English common law. Under this rule, a landowner has the right to pump water beneath his or her property without regard for effects on neighboring wells (TAMU, 2010). Consequently, groundwater can be used with potentially less cost and legal approval (water rights) than surface water. Some question whether the Rule of Capture, which was originally used to determine the ownership of game animals, is appropriate for groundwater, especially in context of groundwater feeding surface water bodies (2009b).
95. When groundwater is used for agricultural irrigation, the introduction of subsidies leads to increases in groundwater extraction. For example, irrigated agriculture in France and Spain has increased in response to subsidies for irrigation equipment and guarantees of low water prices (Baldock et al., 2000). Research models show that subsidies for water-efficient irrigation equipment, such as drip irrigation, are unlikely – contrary to popular belief – to reduce water use on a river basin level because optimal agricultural water application leads to higher crop yield and higher water consumption via evapotranspiration (ET) (Ward and Pulido-Velazquez, 2008). Higher ET coupled with zero return flows and decreased aquifer recharge lead to less water available for the entire basin (Ward and Pulido-Velazquez, 2008). Approaches to mitigating groundwater depletion include rules that prohibit expansion of groundwater pumping, such as the laws in place in most provinces in The Netherlands (Baldock et al., 2000). Proper scientific data collection and dissemination on groundwater levels are crucial for groundwater resource management, and some studies have shown that informing citizens of their water supply can influence their behavior.
2.1.1.9 Wind power, solar photovoltaic (PV) panels, and concentrated solar power (CSP, non-steam cycle):
96. Policy Objectives: Behind hydropower, wind power is often the most cost-effective renewable energy technology within good resource areas. By providing locally-derived energy without consuming water during operations (aside from some blade washing), wind power enhances water and energy security without directly emitting GHG. While more expensive, solar PV and concentrated solar power (CSP) systems that avoid use of steam cycles (e.g. Stirling engines) have the same GHG, water, and renewable energy benefits as wind power.
97. Policy Choices: Globally, wind and solar power have benefitted from subsidies such as feed-in tariffs and the production tax credit in the United States. Renewable Portfolio Standards that mandate a certain target installed capacity or percentage of total generation that must come from renewable energy technologies also provide medium to long-term certainty for investments in these capital-intensive systems whose benefits include the low operating costs. Because of this capital intensity, financing mechanisms such as Property Assessed Clean Energy financing (NREL, 2010) help reach residential consumers by spreading the costs of solar PV installation over time via property tax assessments. Wind and solar PV also stand to benefit by incorporating externalities such as water consumption and GHG emissions into markets and prices. Time of use pricing policies that expose consumers to higher costs during peak demand times (e.g. midday in summer) help provide more value to solar technologies because their generation profile is somewhat matched with summer demand. Resource data gathered in renewable energy resource assessments help facilitate government and business planning to effectively develop projects in the most effective locations.

ENV/EPOC/GSP(2010)21
37
2.1.1.10 Combined heat and power (CHP):
98. Policy Objectives: The use of ‘waste heat’ from thermal power plants and distributed energy generation systems for district heating and cooling makes more complete use of the fuel source to enhance energy security. Because less fuels are required for the delivered services of electricity, heating, or cooling (using techniques such as absorption chilling), less water is required for mining of those fuels and GHG emissions from fossil fuels are minimized per unit of energy delivered. CHP systems can use biomass or fossil fuels.
99. Policy Choices: While CHP technologies are readily available, policies are often necessary to incentivize the whole systems thinking required to minimize energy consumption for the infrastructure projects large enough to take advantage of CHP. CHP systems can include district heating and cooling such that public works projects can enable distribution of energy in the form of hot or cool water. Subsidies can induce commercial and industrial facilities to make CHP investment when the opportunity costs seem too high compared to making other investments for producing more products. Relative to a corporation, governments may have more incentive to pursue strategies that lower importation of fuels, and thus mandates may be a policy for forcing industrial facilities to incorporate CHP. Because energy costs generally already include full-cost accounting into their prices, right pricing should not heavily influence the use of CHP except in the event that new externalities are included into energy prices.
2.1.1.11 Wet-cooled power plants:
100. Policy Objectives: Because wet-cooled power plants depend upon access to a reliable supply of water, they reduce water security. But because wet-cooled power plants are more efficient than dry-cooled, they enhance energy security. Water quality can be affected by the discharge of hot water into aquatic environments (e.g. using once-through or open-loop designs) such that wildlife is detrimentally impacted, but wet cooling towers prevent any appreciable thermal issues.
101. Policy Choices: Wet-cooling systems are common practice for the electric generation industry. Thus, there is little policy incentive needed to affect their usage. However, some governments may wish to regulate or mandate that a certain type of wet-cooled design be used over another (e.g. cooling towers versus once-through).
2.1.1.12 Dry-cooled power plants:
102. Policy Objectives: The use of dry cooling systems on steam-driven thermoelectric power plants (e.g. coal, natural gas, nuclear, steam-based concentrating solar power (CSP)) reduces water consumption by up to 90% to enhance water security. However, dry cooling also reduces the efficiency of converting fuel into electricity such that additional fuel is required for the same net electric generation. Dry-cooling can both help and deter the objective of carbon management and reduction depending upon the application. For applications such as CSP in desert environments, dry cooling towers can enable the use of zero GHG-emitting CSP where water may be completely unavailable. In cases of using dry cooling on fossil power plants, the drop in plant efficiency increases GHG emissions per output and induces prices to increase.
103. Policy Choices: Mandates for use of dry cooling as ‘best available technology’ or in regions where water scarcity is high can dictate its uses on power plants. The incorporation of externalities by zoning or pricing based upon water availability can influence the use of dry cooling as full-cost accounting, or right-pricing of water. Thus, correct market signals exist for when water is too expensive to be used for power plant cooling. Because dry cooling towers are large capital expenditures, financing mechanisms can better enable their use, especially for retrofit applications.

ENV/EPOC/GSP(2010)21
38
2.1.1.13 Concentrated solar power (CSP, steam cycle):
104. Policy Objectives: Concentrated solar power systems, such as mirror-troughs and power towers, have the same GHG, energy, and renewable energy benefits as wind and solar PV, but the steam-cycle requires cooling historically provided by water. Thus, water security is compromised by steam-based CSP even though dry cooling systems enable functionality with very low water consumption. Because steam-based CSP systems are based upon thermal energy, they have the advantage of relatively easy integration with thermal storage technologies and traditional fossil fuel (e.g. natural gas combustion turbines) systems.
105. Policy Choices: Steam-based CSP systems benefit from the same policy choices mentioned previously for wind, solar PV, and other CSP designs. Because CSP systems are most effective in desert regions with ample direct sunlight but low water availability, it is important that policies coordinate CSP development with cooling strategies and technologies.
2.1.1.14 Hydraulic fracturing:
106. Policy Objectives: Hydraulic fracturing is the process of pressurizing water in either vertical or horizontal wells for the purpose of breaking apart rock in the subsurface while keeping the fissures propped open. This fracturing technique is commonly used for accessing low permeability shale layers to extract natural gas as well as to create flow paths for water to absorb heat from hot dry rocks in enhanced geothermal energy systems. Thus, hydraulic fracturing can be used for fossil and renewable energy production, and carbon management is affected according to the type of energy produced. Because water is required for the fracturing process, it adds pressure to water security, especially in areas of existing water scarcity, with the beneficial tradeoff of enhanced energy production. Fracturing techniques and drilling are common practices, and the water quality risks primarily stem from surface spills from produced waters - saline water rising to the surface from the targeted geologic formations. Additionally, water treatment of produced water is necessary where there is a lack of the proper geology to safely inject the produced water into hazardous disposal wells.
107. Policy Choices: Because hydraulic fracturing is a well-established highly industrial process that is integral to some energy production techniques, the technique itself does not require subsidies and incentives for use. Every geologic reservoir is unique, and proper regulation will help enable the expansion of fracturing into new regions (e.g. those not accustomed to drilling activities) occur without harming local water resources and environments.
2.1.1.15 Hydropower:
108. Policy Objectives: Hydropower presents one of the most direct connections between water and energy as moving water directly spins turbines that, connected to electric generators, produce renewable electricity. Thus, energy security is enhanced, and oftentimes water security is enhanced by providing stored water for recreation, drinking, flood control, and irrigation behind the hydropower dam itself (see Section 1.1.2). However, water quality degrades both upstream and downstream of hydropower dams due to altering the natural flow of the river and significantly changing its temperature. Because a large volume of water is stored behind the dam, more evaporation occurs than from the normal river footprint, thus reducing fresh water inflows into bays and estuaries. Overall, hydropower is a low GHG-emitting system that helps carbon management (IPCC, 2007).
109. Policy Choices: Proper regulations and licensing procedures for hydropower dams enable due consideration of the environmental impacts of hydropower development. Proper ecological zoning and prices on GHG emissions help promote hydropower. As hydropower projects are capital intensive and

ENV/EPOC/GSP(2010)21
39
the associated dams often serve many public needs, financing and government funding are usually involved.
2.1.1.16 Desalination:
110. Policy Objectives: Desalination systems enhance water security by providing potable and irrigation water from sources of high salinity. However, this process incurs large energy costs. Water quality is also detrimentally affected by having to dispose of the highly concentrated distillate byproduct. Because of the high energy inputs required, desalination adds pressure against carbon management due to associated GHG emissions from power plants and additional use of energy for water instead of displacing fossil plants. To avoid these GHG emissions, some project developers and governments choose to match renewable energy systems with desalination, but there is no fundamental requirement for this association.
111. Policy Choices: Because a reliable water supply is such a fundamental need for a good economy and lifestyle, governments can engage in public works projects for desalination to provide this water supply. Instead of directly owning desalination systems, some governments dictate that their installation and operation by private companies be a part of overarching government strategy by mandating a certain number of systems to be installed over time (e.g. Israel). Properly pricing water supplies gives the correct signal for whether investment in desalination is warranted versus conservation and development of cheaper supplies. For regions where desalination is deemed a priority to mitigate fluctuations in water supply that occur over spans of decades, various financing mechanisms can help spread the costs over these long time frames.
2.1.1.17 Carbon capture and storage (CCS) (wet-cooled):
112. Policy Objectives: The primary policy objective for CCS technologies is to reduce GHG emissions while continuing the use of fossil fuels for electricity – increasing energy security by continuing use of coal and natural gas. However, installing carbon dioxide (CO2) scrubbers on fossil fueled power plants increases the fuel consumption for the same net power output relative to a plant without CO2 capture, thus decreasing energy efficiency and depleting fuel supplies faster at constant demand. The additional internal power requirements for operating the CO2 scrubber and compression systems use power otherwise available to the grid. Correspondingly, if the power plant uses wet cooling systems, then the water consumption per net electricity (e.g. L/kWh) will also increase because the heat load of the plant is larger relative to the electricity sent to the grid. While there is some possibility for the CO2 injected into deep saline aquifers to displace water to affect shallower fresh groundwater supplies, proper siting and design of sequestration operations can avoid detrimental impacts.
113. Policy Choices: Large-scale implementation of CCS is necessary for significantly reducing GHG emissions at current and increased levels of global energy consumption. Because there are significant costs for implementation, significant policy signals are required for CCS rollout. The most probable policies for inducing use of CCS are those that include the external GHG emissions costs into markets or tax codes. Direct subsidies can help first-movers for CCS and begin the learning process of bringing CCS from pilot and prototype scales to those of full-sized power plants. Data on the locations of high quality geologic storage locations helps both public and private entities target investments. As with any power plant scale infrastructure project, financing plays a large role with capital costs as large as those for CCS. Because some pipeline infrastructure and geologic reservoirs may be under the domain of governments or regulated private entities, public works projects could be influential in starting and continuing CCS development.

ENV/EPOC/GSP(2010)21
40
2.1.1.18 Biofuels (Brazilian sugar cane (São Paulo) and US corn grain (Midwest) ethanol):
114. The water consumption and withdrawal required for the biofuel life cycle is generally larger than for conventional fuels, and for irrigated biofuel feedstocks it is 2-3 orders of magnitude higher (10-300 L/km versus 0.2-0.5 L/km) (King and Webber, 2008). When the water consumed during crop evapotranspiration is taken into account, that quantity dominates the point source consumption compared to water consumed at biorefineries that convert feedstocks to fuels (Berndes, 2008; Gerbens-Leenes et al., 2009). Thus, it is the agricultural aspect of biofuels production that dominates the water-related impacts for both quantity and quality. Accordingly, the land management and agricultural practices impact the water footprint of crops whether they are grown for food or fuels.
115. Policy Objectives: The main policy objective of biofuels is energy security via a domestically-produced renewable alternative to petroleum. However, the true energy security benefits of existing biofuel life cycles are unclear. Brazilian sugar cane ethanol is produced with an appreciably high net energy (ratio of energy output: energy input of 8-10) and less irrigation than US corn grain-based ethanol (ratio of energy output:energy input of 0.8-1.5) (Farrell et al., 2006; Macedo et al., 2008; Pimentel et al., 2007). Also, from a direct water and energy consumption standpoint (e.g. neglecting crop use of precipitation), Brazilian sugar cane ethanol has less water consumption per energy output because of the sufficient rainfall in the South-Central region (e.g. state of São Paulo) of Brazil where the vast majority of sugar cane agriculture occurs. However, both the US and Brazil have irrigated and non-irrigated biofuel feedstocks today, and future expansion of biofuel production in both countries can increase irrigation needs as well as water consumption via additional biorefineries depending upon technology and policy developments.
116. Thus, for the two biofuel examples (ethanol from Brazilian sugar cane and US corn grain) that represent the vast majority of worldwide biofuel production, the energy and water security implications are not equal. Brazilian sugar cane ethanol likely improves energy security in Brazil without significantly hindering water security while US corn grain ethanol does not clearly enhance energy or water security while hindering water quality. With regard to the policy objective of carbon management, analyses of direct emissions from both Brazilian sugar cane ethanol and Midwestern US corn grain ethanol show reduced carbon emissions versus the petroleum life cycle (EPA, 2010a; Macedo et al., 2008). However, indirect emissions from land use change cloud the issue of GHG emissions from biofuel development because agriculture for biofuel feedstocks and food are fully intertwined. For example, farming more corn and less soy in the US presents an opportunity for more soy agriculture in Brazil; subsequently influencing pasture into new areas where stored carbon is released from clearing of forests (Fargione et al., 2008; Searchinger et al., 2009; Searchinger et al., 2008). The full implications of GHG emissions related to biofuels are complex and beyond the scope of this paper.
117. Policy Choices: Renewable liquid fuels such as ethanol and biodiesel have traditionally required subsidies and targeted government mandates to ensure that the private sector commits the large investment for enabling an alternative to petroleum. Additionally, governments have provided energy subsidies to the agricultural sector, both directly through support for diesel and electricity use, and indirectly for feedstocks to produce biofuels and bioenergy. These subsidies can increase pressure on water resources (e.g. reduced pumping costs in some countries is leading to excessive extraction of groundwater) (OECD, 2010d). Policies, such as full-cost recovery, that remove energy subsidies for providing water needed for biofuels may contribute to more sustainable water use. However, full-cost accounting of water may directly hinder the subsidies meant to promote increased production of biofuels, making the need for coordinated policy of paramount importance. To assist in carbon management objectives, the inclusion of costs from all water use and carbon emissions from the biofuel lifecycle (e.g. energy inputs, soil emissions, and carbon debt) along with structured, scientific, and repeatable accounting procedures will provide clarification to the true costs and benefits of biofuels. Resource data

ENV/EPOC/GSP(2010)21
41
gathered in renewable energy resource assessments help facilitate government and business planning to effectively develop projects in the most effective locations. As the amount of biofuel production becomes a significant fraction of total liquid fuels consumption, new distribution and delivery infrastructure (e.g. pipelines, fuel station equipment) could be necessary and involve government funding.
2.1.1.19 Municipal waste to energy:
118. Policy Objectives: By collecting methane gases from landfills and wastewater treatment plants (e.g. using anaerobic digestion), GHG emissions are reduced while a renewable combustible resource is created. Solid biomass waste can also be burned directly for heat and electricity. Additionally, the produced energy can power the wastewater treatment facilities making them self-sufficient, enhancing energy security, while they clean water for discharge into the environment.
119. Policy Choices: Landfills and wastewater treatment facilities are typically owned by municipal governments. Thus, new public works projects can incorporate the additional infrastructure required to capture energy, and retrofitting wastewater treatment plants is possible. The incorporation of an emissions mandate or price on the externality of GHG emissions will likely make waste to energy projects more cost-feasible.
2.1.1.20 Greywater and reclaimed water use:
120. Policy Objectives: Greywater characterizes water after its use in applications that do not involve human or animal excrement (e.g. water from sinks, showers, dish washers, and clothes washers; water from kitchen sinks is not consistently included due to high organic content) (Jefferson et al., 1999; Li et al., 2009; Otterpohl et al., 1999; Ottoson and Stenstrom, 2003). After minimal treatment and filtering, greywater can be used in residential and commercial applications such as irrigation and sewage systems. While greywater is reused before using the full quantity of energy required to treat it back to potable condition, decentralized treatment systems are less energy efficient than large centralized systems. Research shows that greywater treatment uses approximately twice the energy per unit of water as pumping and treating sewage in a centralized system (Beal et al., 2008). Thus distributed greywater treatment and use enhances water security by recycling water but could decrease energy security.
121. Unlike greywater, reclaimed water makes use of treated effluent from centralized wastewater treatment plants. While this reclaimed water is generally not of sufficient quality to meet potable standards, it has undergone more treatment than greywater prior to being distributed in a piped network (“purple pipe”). With high existing levels of wastewater treatment and minimal distribution, reclaimed water use can reduce energy consumption while reducing fresh water demand for applications such as cooling systems for power plants, irrigation, and city wastewater plumbing. However, reclaimed water use coupled with less efficient wastewater treatment and significant distribution requirements can require more energy than it saves compared to conventional potable surface water treatment (Stillwell and Webber, 2010).
122. Policy Choices: Because it is important to keep potable and greywater flows separate for health reasons, greywater systems are usually confined to small scale residential and commercial use. Large scale municipal systems require additional treatment of wastewater effluent to produce reclaimed water before distribution in plumbing and sewer networks. Thus, significantly large-scale reclaimed water systems usually need publicly funded projects and financing to lay piping infrastructure that connects with buildings and homes. Additionally, clear regulations and plumbing practices help enable building contractors to properly design and install water reuse systems that safely connect to any available municipal reclaimed water systems. Right pricing of water, based upon quality, can help provide

ENV/EPOC/GSP(2010)21
42
feedback to consumers and governments for making decisions about investments in greywater and reclaimed water infrastructure.
2.1.1.21 Inter-basin water transfer:
123. Policy Objectives: Inter-basin water transfer involves conveying water from one water basin by use of an engineered structure such as a pipeline and pump system, to another water basin. Because the water is typically moved to serve a demand that has outstripped its local basin supply, the total water consumption increases even though water security is only enhanced for the basin targeted for delivery. Furthermore, inter-basin transfer works against energy security due to both the required energy embodied in the infrastructure as well as the energy for operating pumps that move the water over elevation changes. The carbon emissions with increased energy consumption of the global mix of fossil fuels hinder the carbon management objective.
124. Policy Choices: Inter-basin water transfer projects primarily fall within the public interest domain of municipal, regional, and state governments. Thus, governments often directly fund such public works projects via bonds and tax increases. However, private businesses may contract with government authorities to own and/or operate water transfer projects. Incorporating externalities into the planning process can help mitigate environmental and legal issues associated with taking water from one basin to another. Examples include designation of appropriate rights-of-way and the downgrading of the seniority of water rights for that water taken from its natural basin (Texas, 1997).
2.2 Classification of common institutional gaps hindering energy-water policy coordination
125. The following is a categorized list of institutional gaps, some identified by the OECD, that commonly compromise coordination efforts within governments (Charbit and Michalun, 2009; OECD, 2009). These various gaps exist between energy and water stakeholders in countries around the world. For illustrative purposes, each of these gaps is explored in the US case study included in Chapter 3, but these gaps are generally universal.
• Policy Framework: Different political agendas, visibility concerns and power rivalries across ministries and agencies at central level as well as problems from national ministries dictating vertical approaches to cross-sectoral policies that would benefit from co-design at the local level
• Administrative roles: Unclear and overlapping roles and responsibilities among government ministries as they relate to economic, social, and physical boundaries of water and energy flows
• Capacity resources: A lack and/or asymmetry of knowledge, enforcement capacity, and infrastructural resources within all levels of government
• Funding resources: Asymmetry of revenues and distribution of resources across ministries and levels of government
• Informational challenge: Data gaps and inconsistencies between and within the levels and ministries of government
• Time frame and strategic planning: Different schedules and deadlines occur between ministries
• Evaluation: Without evaluation, governance practices cannot be assessed, but very often feasibility is limited

ENV/EPOC/GSP(2010)21
43
126. These institutional hurdles, mismatches, and data gaps between energy and water policies mean water supply decisions are often made without regard for energy consumption, such as use of seawater desalination or long-haul water transfer (Abrams and Hall, 2009). However, as discussed in the case studies, both Australia and Israel have integrated energy consumption and GHG emission impacts into desalination planning. And energy decisions, such as biofuels, are often made without regard to water impacts. Moving forward, water resources are projected to be strained by climate change, and long-term decisions might need to be made in the face of changing climate as additional GHG emissions exacerbate climate change. However, the policy formulation process is hobbled by these problems, any one of which often requires a champion to overcome. The problem of considering multiple constraints, energy and water, at the same time can be stifling. Governments can start addressing energy-water policy by addressing the informational challenge by creating well-structured and maintained databases and reporting functions. By designing policies based on these data as well as the latest scientific and engineering understanding, governments have a solid foundation for integrated policymaking.
2.3 Existing coordination mechanisms aimed at bridging institutional gaps
2.3.1 Successes for bridging institutional gaps
127. It is difficult for any specific policy or set of policies to solve all energy-water conflicts, but openness and a focus upon the mutually beneficial solutions (e.g. solar hot water heating in Table 5) that do exist present a starting point. Often, the combined scarcity and/or economic costs of both freshwater and energy must reach critical levels to enable certain policies and technologies to become successfully and widely used. The case of solar hot water heating systems being integrated into planning and building codes in Israel, China, and Hawaii (US) shows that areas with resource constraints have market incentive to use this technology, and that government policy can follow (e.g. Israel) or lead (e.g. China, Hawaii) the effort. Thus, when social and economic drivers are already presenting solutions to the energy-water nexus that save expenses while conserving energy and water resources, policy can reinforce this behavior to induce similar actions.
2.3.2 Facilitating energy and water coordination amongst agencies
128. As noted in Table 5, enhanced data collection is a valuable policy approach for many of the technologies that involve large-scale impacts. There are some policy mechanisms that can be enacted to effectively coordinate data collection both between and among different levels of government from federal to local. It is effective to require water consumption and withdrawal data to be included in federal and state forms filled out by energy production facilities. Additionally, it would be valuable for energy consumption data to be collected at major water users and producers such as desalination plants, wastewater and water treatment facilities, and irrigation pumps. The data can be reported on environmental and/or energy reporting forms. The collected data would preferably state the water body and basin from which the water is withdrawn, the quantity of water in units of volume per time, and the associated energy production (e.g. megawatt-hours, volume of liquid fuel, etc.). Data coordination from local to the federal level could avoid the reporting of conflicting data. This coordination requires good clarification on both the definitions and words used to describe water usage, the physical location within a water system at which the data are taken, and clear designation of the responsible party for data collection and verification. There is always a risk that a local agency may have incentive to misrepresent data passed to higher governing bodies, and federally administered forms that facilitate local needs can help minimize this risk.
129. When regional and federal data are collected for the same purpose, but use different units or are completed by different persons, the data can be conflicting. For example, in some states in the US, industry environmental managers or engineers who complete state-level forms for water consumption and

ENV/EPOC/GSP(2010)21
44
withdrawal at power plants do not fill out corresponding federal forms. These federal forms and state forms aim to collect the same information, but some collect water withdrawal information and some collect consumption. Furthermore, the water flow location in the power plant system often isn’t the same or is ambiguous. One way by which data collection mechanisms could better inform policy for water and energy data is to use engineering-like diagrams to indicate where in the energy system that water is being consumed and withdrawn, and where in the water system energy is being generated or consumed. Using the power plant example, if there is a reported flow of 1 GL/yr, a diagram could indicate if this flow refers to water diverted from a river into a cooling reservoir, or water withdrawn from the cooling reservoir into the plant cooling infrastructure itself. Without a meaningful diagram and/or explicit definitions, these fine distinctions are difficult to know. However, the differences can be quite large: a one-time per year transfer of 1 GL of water from a river into a cooling reservoir with no returned flow has a different water impact than a continuous withdrawal from a dedicated cooling reservoir of (1 GL/yr)/(8760 hours/yr) = 0.11 ML/day, where all of the withdrawn water is returned to the cooling reservoir, and the heat is dissipated via evaporation at the reservoir surface.
130. Integrated water resource management is often seen as a way to consider multiple interests for allocating use of water. In many cases, an integrated and scientific approach is officially-sanctioned by federal and regional governments, yet controversy still resides. The case of Canadian oil sands along the Athabasca River in Alberta presents an example where laws and policy are stated to maintain wildlife and water quality as existed before industrial operations, with scientific assessments used to objectively analyze the solution. Yet, studies used to assess water impact from mining operations are not fully open, and the policy strategy of considering multiple values of water use can easily be in conflict: wildlife versus economic development from oil sands production.
131. But, for proper integrated planning, a robust, accepted, and open set of scientifically-measured and collected data is an important input. It would be useful for these data to show the fresh and saline water requirements for energy resource mining and refining as well as the energy requirements for water collection, treatment, and distribution. If the data are not transparent in both their access and reporting methods, then it is difficult for stakeholders to engage in the policymaking process with a consistent framework. The creation of a common set of data enables the beginning of conversations regarding resource usage and reconciliation from environmental water-energy impacts.
2.3.3 Scientific coordination
132. In addition to policy integration, coordination among scientists and scientific institutions is also important. While this type of collaboration or cross-fertilization of ideas is relatively new, there are a few examples underway, three of which are listed here. The European Cooperation in Science and Technology (COST), funded via the European Science Foundation through a European Commission contract, has been working through the Australian National University (ANU) over the last two years to provide a global context based on scientific input for policy decisions within the water-energy nexus. Scientists from around the world have been brought together to examine case studies that highlight the energy-water nexus. This work has been organized for journal publication and presented to European authoritative bodies at the 7th ANQUE's International Congress in 2010: “Integral Water Cycle: Present and Future”. In addition, the water-energy nexus is also being investigated by the US national labs. The labs provide a central information website (http://www.sandia.gov/energy-water/), reports for Congress (DOE, 2006), and new research findings such as integrating water resources into the planning of electrical transmission lines in the Western US that will connect renewable energy solar and wind resources. Brazil’s newly formed Bioethanol Science and Technology Laboratory in Campinas, São Paulo is aiming to focus initial research on energy and greenhouse gas balances as well as the water quantity and quality impacts of expanded sugar cane agriculture. While scientific coordination is not enough to ensure robust

ENV/EPOC/GSP(2010)21
45
policy formulation, it can be a positive step towards that goal by creating valid methods for data reporting and environmental monitoring.
2.4 Extent that mechanisms are able to bridge institutional gaps
133. There are many questions that remain as to whether more and better data and a more integrated regulatory framework can effectively translate to better policy for both the water and energy sectors, but good resource governance often begins with good measurement and open data records. A pure free market advocate might suggest that proper pricing can reflect the scarcity and allocation of freshwater and therefore cause corrective consumption decisions, but there are no obvious patterns in the water use data that suggest water prices follow classic supply and demand principles.
2.4.1 Water and energy: availability, trade, and pricing
134. The Earth is awash in energy that is free: over 7,700 times as much solar energy is absorbed by the Earth’s surface (3,850,000 EJ/yr (Smil, 2008))4 as humans consume as primary energy in one year. The Earth is also awash in water: the oceans hold (1,338,000 km3 (Oki and Kanae, 2006)) over 175 times more than the total worldwide human footprint of 7,500 km3/yr (Hoekstra et al., 2009). While both statements are true, those energy and water resources are diffuse and low quality and therefore difficult for humans to reap. However, these resources combine to drive the global hydrological cycle by using 1,000,000 EJ to evaporate, or ‘desalinate’, 440,000 km3 of seawater each year (Oki and Kanae, 2006). But humans have proliferated in the last 200 years because of the use of highly refined freshwater and concentrated high-density fossil energy resources.
135. On a human level of globalization, energy commodities such as oil, coal, and natural gas are traded internationally. By contrast, very little water is traded internationally except for very small quantities of relatively expensive drinking water (for example, 200 billion liters of bottled water were sold in 2007 (Gleick and Cooley, 2009) amounting to < 0.01% of basic global water access requirements assuming 1000 m3/person/yr). In contrast, 4,900 billion liters of petroleum were consumed in 2007 – twenty-five times more volume than bottled water, but constituting 35% of world primary energy. While petroleum makes the globalized trade possible, the possibility of shipping all human water needs across the globe is slim, making water impacts and concerns inherently more local than energy impacts.
136. As noted in prior discussion in this report and summarized in Table 5, “right-pricing” of water and energy resources is an important approach for bringing forth many technological solutions that can achieve different policy objectives (OECD, 2010b). However, while pricing in the market is typical for producing, upgrading, and distributing energy resources, using markets for water collection in raw form (agriculture and water utilities) and distribution of water in treated form (for residential, industrial and "commercial users) is not as common. In both cases, prices are often centrally regulated, and many countries have subsidies or fixed prices, which distort the markets. In the case of subsidized pricing, the typical consequence is falsely-low prices, which affects both supply and demand. For example, water policies that set a price of water below its right level (the price that takes into account all the costs of producing water as well as relevant externalities) can lead to overproduction and overconsumption of both water and energy (thus reducing water and energy security). Pricing schemes, such as inverted block pricing (for which there is a low price for the first few thousand liters of water consumed per household each month, after which prices per additional unit increase steeply), have been implemented to reduce water consumption, and similar approaches can be used with energy.
4 EJ = exajoule = 1 x 10¹⁸ joules

ENV/EPOC/GSP(2010)21
46
137. Right-pricing also includes efforts in industrialized countries to implement “smart” meters to give customers more information about their consumption and to enable pricing that varies with time-of-use and other factors. The coupling of data collection and effective labeling of utility bills with smart meters is necessary to create a coherent policy around time-of-use pricing. While there is substantial research about behavioral responses to fluctuation in energy prices, there is less research about the behavioral economics of water prices.
138. Despite the importance of accurate pricing in energy and water markets, many disagree about the effectiveness of price as the key indicator for these security or availability of these resources, since some important parameters (e.g. ecosystem health and aquatic habitats) are not commoditized or incorporated into the price. Thus, price signals might not be in perfect alignment with societal or environmental aims. The price consumers pay for energy commodities, such as gasoline and electricity, also has a mismatch with societal aims.
139. In contrast to energy, the relative price consumers pay for water varies much more widely worldwide as a result of many variables, including gaps in water-related policies. Desalinated water in Australia has a much higher price than free irrigation water in India. But even within an OECD country, price can vary unrelated to consumption patterns and resource availability. For example, in the United States many municipalities with a water utility are authorized to charge water customers a price that recoups capital and operating costs for treatment plants and distribution systems (e.g. full-cost recovery), but not for the water itself. As a result, water customers pay a fee reflecting the cost of service, not the total cost of treated drinking water. However, recovering these capital costs are an important part of the creating sustainable energy policy (OECD, 2010b). On the other hand, US rural municipal utility districts that purchase water from a wholesaler can pass on the cost of water to the customer in addition to the cost of service. Table 6 below indicates sample capital costs for different water treatment equipment based on US cost data. These representative values show that more advanced, energy-intensive treatment technologies require more capital investment. Generally, these increases in capital cost translate to increases in consumer water prices, but this trend is not always the case. “Right-pricing” of water should include infrastructure costs.
Table 6. Sample costs data for water treatment equipment show increases in cost for more sophisticated treatment technologies.
Type of Treatment Facility Sample Capital Cost (US$)
Surface Water Treatment Plant $290 / m3 / d treatment capacity1
Groundwater Well Drilling $200-$1,000 / m depth2 (plus $8,700-$142,000 fixed cost based on production rate)
Reverse Osmosis Desalination Membranes $500-$1,000 / m3 / d treatment capacity3
1 (2009a) 2 (TWDB, 2003) 3 (Sturdivant et al., 2007; UNEP, 1997)
140. The price consumers pay for water can reflect the level of treatment required to deliver treated water or the amount of water available for use before pursuing alternative supplies. However, sometimes the opposite is true: some water-stressed areas charge lower prices than water-rich areas. For example, a recent survey of US cities shows that some areas with low water availability have some of the lowest water prices and highest water use rates (Walton, 2010). A US family of four using 0.38 m3/person/day (100 gal/person/day) would have an average monthly water bill of $34 in water-stressed Phoenix, Arizona or $73 in water-rich Seattle, Washington. Of the 30 US cities surveyed, the average monthly water bill (for the same family of four using 0.38 m3/person/day) ranges from $20 in San Antonio, Texas, to $121 in Santa Fe, New Mexico (Walton, 2010). As a result of contextual variability, water prices are an important policy tool, but can be a misleading metric of water policy coherence.

ENV/EPOC/GSP(2010)21
47
2.4.2 Policy mechanisms to manage the agricultural-energy-water nexus
141. Agriculture accounts for approximately 70% of global water use, so policy choices regarding the agriculture-energy-water nexus are especially critical in crafting sustainable resource policy (FAO, 2010). Policies aimed to intensify agricultural production have historically increased the use of energy and water resources since high market prices in tandem with governmental support for agricultural inputs tend to incentivize farmers to maximize yield and, consequently, the excessive use of water and energy (Parris, 2008; Parris, 2010).
142. Reducing or eliminating support for farm inputs such as water, diesel fuel, fertilizers, electricity, and irrigation systems incentivize farmers to increase resource efficiency, rather than to withdraw fossil resources to maximize crop yields. Although the cost of rain-fed agriculture rises with energy prices since it requires a lot of energy to transport agricultural inputs, the cost of irrigated agricultural production incurs additional cost spikes to pump water and run irrigation systems when energy prices rise (Parris, 2008; Parris, 2010). Thus, higher water and/or energy prices tend to lead to more efficient farming practices to reduce costs. Consequently, decoupling financial support for agriculture and commodity production has become a popular policy tool in many OECD countries for the past 20 years to reduce energy and water inputs for agricultural production (Parris, 2010). This approach has proven to be an effective policy mechanism to reduce energy and water allocated for agricultural practices for many countries.
143. However, increasing energy prices also promote the use of biofuels, which might actually increase agricultural activity, and thus, energy and water use. Second and third generation biofuels provide the opportunity to attenuate water use for feedstock production in comparison to first generation biofuels. However, their impacts cannot yet be realized since they are not yet produced at commercial scale. Many OECD countries support next generation biofuel research with governmental funding. Most developing countries have not had the funding necessary for such efforts and consequently, countries such as Brazil, China, India, South Africa, and Thailand have not typically included second-generation biofuels in their policy discussions, although they have incorporated biofuels blending quotas into their energy policies (Eisentraut, 2010). However, in 2010 Brazil christened a national laboratory that is focused upon both first generation and lignocellulosic biofuel development from sugar cane, as noted above.
144. The energy-water nexus in the context of food is not only limited to agriculture, but also extends to aquaculture. As demand for seafood has risen over the past several decades, aquaculture has provided more seafood and at a higher proportion relative to wild-caught. Less than 1 million tonnes of seafood came from aquaculture in the 1950s compared to almost 52 million tonnes in 2006 (FAO, 2009). When comparing aquaculture to open water fishing for wild fish, where no water is consumed during fishing, the general trend is for aquaculture to consume more of both energy and water (see Figure 1). When comparing different aquaculture systems, the energy consumption goes up as the total water taken or withdrawn from the natural environment goes down. Little primary energy consumption is associated with wild caught seafood (e.g. marine fuel) and the ecosystem service of growing the fish is 100% provided by the environment. By contrast, a closed-loop recirculating aquaculture pond must input food and treat its water effluent before recycling, and this water treatment necessitates high energy consumption to prevent hindering water quality. Thus, the water-energy impacts of aquaculture cannot be neglected and should be considered alongside agricultural policies.

ENV/EPOC/GSP(2010)21
48
Figure 1. Sample costs data for water treatment equipment show increases in cost for more sophisticated treatment technologies.
Wild Seafood

ENV/EPOC/GSP(2010)21
49
CHAPTER 3
CASE STUDIES OF WATER AND ENERGY POLICY COHERENCE/INCOHERENCE
145. This chapter includes brief case studies of water and energy policies for a few countries facing slightly different challenges or using different policy options to mitigate their challenges. These case studies are intended only to illustrate some of the range of water-energy policy coherence and incoherence; they are not intended to be an exhaustive discussion of all the different issues, nor are they meant to be the definitive analysis for each country. The US case study is examined in greater detail because 1) its continental breadth includes a range of energy and water issues that suitably capture most of the challenges witnessed worldwide (for example, water abundance varies dramatically from the desert southwest to the wet northeast, and energy resources have significant geographic variability), and 2) the energy and water data for the US are in greater abundance and more accessible than for most other regions and countries in the world.
146. The countries that are discussed include:
• United States
• Canada
• Australia
• France
• Brazil
• India
• Israel
• Singapore
147. Summaries of relevant information are also captured in the information boxes for each country.

ENV/EPOC/GSP(2010)21
50
Case Study Summary
United States: scarce water resources in the west
Over the last century the Western United States has witnessed a steady increase in population growth and associated water demand. Consequently, there is now over-allocation of water resources for all purposes, including hydropower, and increased population in water-scarce regions, yielding energy-intensive water transfers.
Canada: water for unconventional petroleum oil sands
With the world’s largest unconventional petroleum reserves and production, Canada exemplifies the challenges of managing water resources that are required to exploit lesser quality fossil resources.
Australia: water scarcity forces leadership on conservation
Australia is considered the most water-scarce inhabited continent in the world, which has made the development of a sustainable water plan a critical national policy. By contrast, the region enjoys vast energy resources that have allowed the country to have cheap and abundant energy without much regard for cogent energy policy. However, water constraints have impacted Australia’s energy choices for dealing with those constraints.
France: Nuclear power to the core, but high temperatures mean low output
French energy policy commitment to nuclear power also committed it to open-loop cooling systems that have been vulnerable to drought conditions and high temperatures. And the avoidance of irrigation for biofuels, while mitigating some social concerns, leaves another energy supply exposed to drought.
Brazil: water resources enable a global leader in bioenergy, but new challenges await
Brazil’s PROALCOOL program constitutes perhaps the most ambitious and long-term plan to pursue an alternative to petroleum. The success to date owes much to Brazil’s climate and water availability.
India: renewable water for hydropower allows depletion of fossil aquifer
As India’s population has grown and further developed technology, some energy and water resources have been exploited beyond their renewable capacity, especially groundwater resources. Substantial conflicts between energy and water management make India a descriptive example of energy and water policies that can inadvertently undermine one another.
Israel: location, location, location means technology, technology, technology
A history of employing innovative technology in a water-constrained and sun-drenched country forces Israel into both energy-conserving and energy-intensive water solutions.
Singapore: old water to NEWater
Substantial water recycling and reuse, likely motivated by necessity, has increased the security of Singapore’s water supply while also increasing energy consumption for water treatment. Coupling these water security measures with water conservation and energy efficiency leads to cohesive policies to manage both resources.
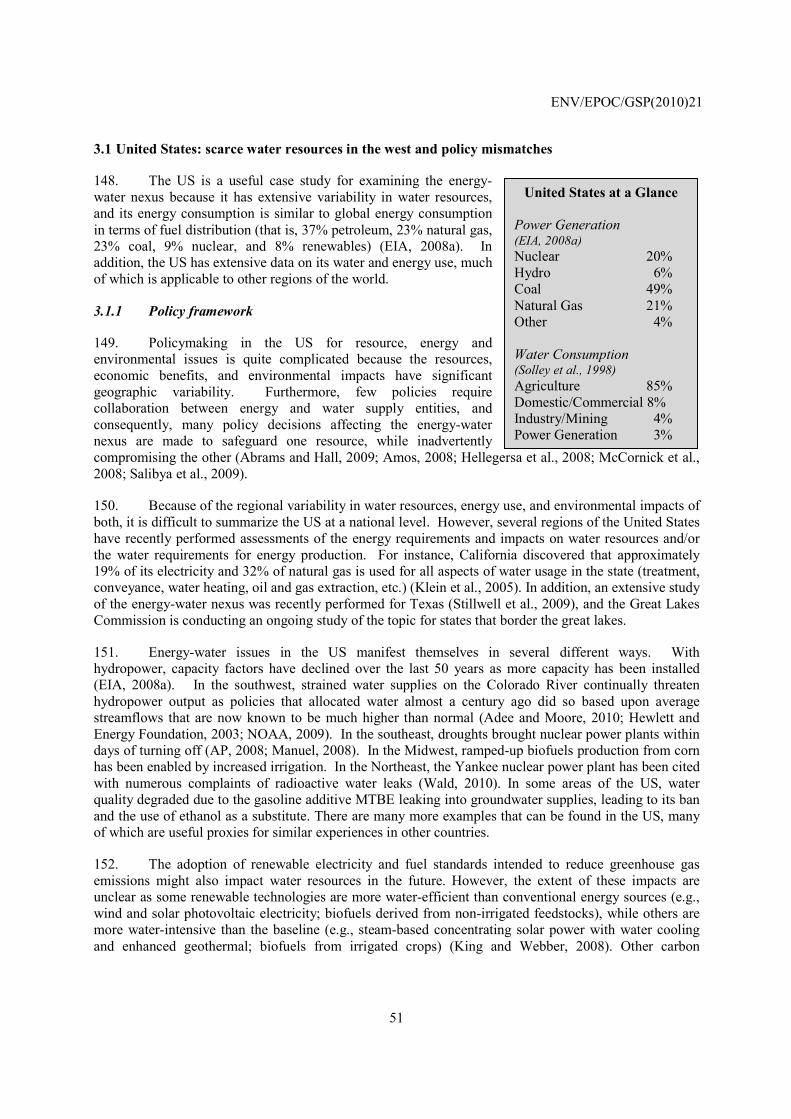
ENV/EPOC/GSP(2010)21
51
3.1 United States: scarce water resources in the west and policy mismatches
148. The US is a useful case study for examining the energy-water nexus because it has extensive variability in water resources, and its energy consumption is similar to global energy consumption in terms of fuel distribution (that is, 37% petroleum, 23% natural gas, 23% coal, 9% nuclear, and 8% renewables) (EIA, 2008a). In addition, the US has extensive data on its water and energy use, much of which is applicable to other regions of the world.
3.1.1 Policy framework
149. Policymaking in the US for resource, energy and environmental issues is quite complicated because the resources, economic benefits, and environmental impacts have significant geographic variability. Furthermore, few policies require collaboration between energy and water supply entities, and consequently, many policy decisions affecting the energy-water nexus are made to safeguard one resource, while inadvertently compromising the other (Abrams and Hall, 2009; Amos, 2008; Hellegersa et al., 2008; McCornick et al., 2008; Salibya et al., 2009).
150. Because of the regional variability in water resources, energy use, and environmental impacts of both, it is difficult to summarize the US at a national level. However, several regions of the United States have recently performed assessments of the energy requirements and impacts on water resources and/or the water requirements for energy production. For instance, California discovered that approximately 19% of its electricity and 32% of natural gas is used for all aspects of water usage in the state (treatment, conveyance, water heating, oil and gas extraction, etc.) (Klein et al., 2005). In addition, an extensive study of the energy-water nexus was recently performed for Texas (Stillwell et al., 2009), and the Great Lakes Commission is conducting an ongoing study of the topic for states that border the great lakes.
151. Energy-water issues in the US manifest themselves in several different ways. With hydropower, capacity factors have declined over the last 50 years as more capacity has been installed (EIA, 2008a). In the southwest, strained water supplies on the Colorado River continually threaten hydropower output as policies that allocated water almost a century ago did so based upon average streamflows that are now known to be much higher than normal (Adee and Moore, 2010; Hewlett and Energy Foundation, 2003; NOAA, 2009). In the southeast, droughts brought nuclear power plants within days of turning off (AP, 2008; Manuel, 2008). In the Midwest, ramped-up biofuels production from corn has been enabled by increased irrigation. In the Northeast, the Yankee nuclear power plant has been cited with numerous complaints of radioactive water leaks (Wald, 2010). In some areas of the US, water quality degraded due to the gasoline additive MTBE leaking into groundwater supplies, leading to its ban and the use of ethanol as a substitute. There are many more examples that can be found in the US, many of which are useful proxies for similar experiences in other countries.
152. The adoption of renewable electricity and fuel standards intended to reduce greenhouse gas emissions might also impact water resources in the future. However, the extent of these impacts are unclear as some renewable technologies are more water-efficient than conventional energy sources (e.g., wind and solar photovoltaic electricity; biofuels derived from non-irrigated feedstocks), while others are more water-intensive than the baseline (e.g., steam-based concentrating solar power with water cooling and enhanced geothermal; biofuels from irrigated crops) (King and Webber, 2008). Other carbon
United States at a Glance Power Generation (EIA, 2008a) Nuclear 20% Hydro 6% Coal 49% Natural Gas 21% Other 4% Water Consumption (Solley et al., 1998) Agriculture 85% Domestic/Commercial 8% Industry/Mining 4% Power Generation 3%

ENV/EPOC/GSP(2010)21
52
reduction initiatives that encourage carbon sequestration technologies increase strain on water resources (Abrams and Hall, 2009).
153. Declining water supplies, increased droughts, and population growth has also promoted the growth of desalination and long-haul water transfer for recovering potable water in water- stressed areas despite the large amounts of energy required for pumping and/or advanced contaminant removal. For example, the California Energy Commission found that approximately 6% of all California electricity consumption is needed just for domestic and irrigation water pumping (Klein et al., 2005). Much of this electricity is to pump water nearly 1,000 m over the Tehachapi mountains from the San Joaquin Valley to Southern California, and the pumps that move this water are the single largest power load in the state. Thus, the embedded energy in some of the pumped water is as high as 2,600 kWh/ML - within the lower ranges of energy requirements for desalination (Klein et al., 2005). Policies that promote the use of this energy-intensive water supply (over water conservation, local water re-use, aquifer recharge, etc.) are examples of incoherent policies that adversely impact one sector to serve another.
3.1.2 Allocation of roles and decisions
154. One key challenge in increasing the cohesion between energy and water policy decisions is that there are many federal agencies and committees that regulate or impact one or both of these resources, none of which has clear authority. Furthermore, federal energy and water policymakers are only a small piece of the puzzle; municipal, state, and tribal governments, as well as private entities, also share a large role in managing energy and water resources. Consequently, energy and water decisions have historically been made independently of each other – that is energy planners typically assume they have the water they need, and water planners assume they have the energy they need
155. In the US, there are upwards of 20 federal agencies and bureaus that are in charge of water resources; thus, many agencies overlap in responsibility for water quantity and quality (Amos, 2008; Webb and Joshua, 2009). Federal agencies with major water management interests include the Environmental Protection Agency, Army Corps of Engineers, Department of Agriculture, Department of Interior (Bureau of Land Management; US Geological Survey Bureau of Reclamation; Bureau of Ocean Energy Management, Regulation, and Enforcement), and others. That is, there is no “Department of Water.” And, the various responsibilities vary with agency: Environmental Protection Agency (EPA) focuses on water quality, Bureau of Reclamation focuses on irrigation, Army Corps of Engineers focuses on flood control and inland water navigation, Department of Agriculture focuses on water for farming, and the US Geological Survey is responsible with quantifying water resources and uses. While the EPA clearly has a mandate to address water quality issues, there is no clear mandate for any one agency to be in charge of water quantity issues.
156. Likewise, there are at least 18 different Federal agencies (under the authority of dozens of Congressional committees and subcommittees), among whom control over 150 energy-related programs and 11 income tax preferences, making it difficult to maintain cohesion across federal energy policymakers alone (GAO, 2005). The structure of the Executive Branch of the federal government has two primary agencies with significant influence in energy production--Department of Energy and Department of the Interior--though other agencies such as the Department of Agriculture, Department of Defense (DoD) also play important roles in energy policy. Increasingly, as the US researches alternative fuels to replace petroleum, the Departments of Agriculture and Defense are playing larger roles in energy research funding (e.g. because DoD is the largest fuel consumer of the US).
157. In addition, the vertical hierarchy of policymaking regarding energy and water management is dissimilar. Energy policy in the US is usually structured in a top-down fashion with powerful federal agencies (such as the Department of Energy and EPA) setting rigid standards (e.g. renewable fuels

ENV/EPOC/GSP(2010)21
53
standards). By contrast, water policy in the US is usually structured in a bottom-up fashion, with decisions driven by local water agencies and authorities, as the management of water supply is generally the responsibility of the states. Thus, local governments are forced to meet federal standards, often without sufficient input.
158. Despite the mismatch in energy and water policymaking structures and federal roles, attempts are being made to integrate the management of energy and water policy in the United States. Recent legislation proposed in the US Congress that calls for further study of the energy-water nexus, including water use for energy and energy consumption for brackish groundwater desalination (Abrams and Hall, 2009; GAO, 2009a,b,d; Salibya et al., 2009). For example, there is the American Clean Energy Leadership Act of 2009, in which Subtitle D calls for studies and assessments on integration within the energy-water nexus (Bingaman, 2010). In addition, the American Clean Energy and Security Act of 2009 (ACES) call for changes to the energy mix with implications for water use. At the state level, the 2009 Texas Legislature developed a bill that considered water part of the permitting process for power plants. Consequently, despite a dearth of concrete action, the legislative attention to energy-water issues with an eye towards coherent integration is increasing in the US. However, most of the proposed legislative studies focus upon horizontal coordination rather than vertical coordination.
3.1.3 Capacity and Funding Resources
159. Because energy and water resource management is spread across many agencies and governmental levels in the US, the funding, oversight, and regulatory mechanisms for energy and water are disaggregated. Little collaboration exists between energy and water stakeholders, and thus, roles and responsibilities regarding resource management are often unclear and redundant amongst entities, making it difficult to identify knowledge gaps and assimilate cohesive and holistic energy-water policy (Charbit and Michalun, 2009; OECD, 2009). Consequently, appropriating money across agencies for energy and water investments is contentious and unclear (Webb and Joshua, 2009). Moreover, there is controversy on where major investment should be directed, even within the agencies themselves.
160. For example, in the water sector, there is general agreement amongst most stakeholders that the United States needs direct investment in (1) fixing existing and building new infrastructure, (2) collecting more data regarding water quality and quantity, water use, and changes in resource availability, (3) integrating more amongst water planners, and (4) investing more in R&D to increase the available supply through gains in efficiency or better treatment options (Webb and Joshua, 2009). An analysis conducted in 2002 concluded that the water infrastructure gap alone will require $400 billion or more by 2019, and the operations and maintenance gap (to meet increasingly stringent treatment standards, for example) will be another $150 billion or more over the same time period (EPA, 2002). Estimates for necessary energy infrastructure investments (including electric transmission, fuel pipelines, smart grid equipment, and biorefineries) over the next decade in the US exceed $1 trillion. However, in the face of limited funds, it is not clear whether investment should focus primarily on repairing and renovating current infrastructure or on developing cheaper technological solutions to recover adequate water to meet growing population demand (Webb and Joshua, 2009). Thus, because there is no overarching strategy to set priorities for all agencies, each agency pursues its independent goals based on a series of short-term priorities.
161. Although there is investment in each of the targeted areas, efforts are largely uncoordinated and underfunded, as there is no consensus regarding which government agencies should be responsible for completing these tasks (Webb and Joshua, 2009). The Federal government of the United States has made substantial investments into drinking water and wastewater systems in the past, but there are some that believe that local, state, and private agencies should share more responsibility in managing the nation’s water infrastructure. Others believe that the Federal government should carry more fiscal responsibility in repairing current water infrastructure, as funding has stayed relatively constant or has declined since the

ENV/EPOC/GSP(2010)21
54
1970’s, despite a nearly 2 fold increase in overall federally funded R&D efforts. In addition to aging infrastructure, population increased by more than a quarter and GDP doubled during this period, increasing the stress on the US water system (Webb and Joshua, 2009)
162. Despite this stagnation in federal investment, private investment has been growing at an average rate of about 10% a year. The expansion of desalination accounts for much of this increase in private spending. Some analysts predict that the privatized water market could grow to exceed $300 billion USD, as desalination projects become increasingly common (Webb and Joshua, 2009). Others contend that the profit margin in the privatized water industry is low, which will limit its growth. Federal investment is also critical for developing high-rick technologies, which are unlikely to be pursued in privatized markets.
163. Unlike water, federal funding across energy agencies has substantially increased in the past few decades, with large increases focused on increasing energy supply (GAO, 2005). Unlike water investments, energy-related activities recover large returns to the federal and state governments by means of oil and gas profits and royalties, excise taxes on transportation fuels, property taxes, etc. Thus, as water regulation has been pushed towards municipal and state water governments, the majority of energy regulation and investments remain within the power of federal agencies (although other factors such as the location of the resource extraction also contribute to this trend).
3.1.4 Information Challenges
164. In addition to the policy and funding hurdles, there are also substantial data problems that exist, inhibiting the development of coherent, integrated policies. These data challenges exist in many forms, one of which is a lack of consistency for water terms. For example, the terms water “diversion,” “demand,” “use,” “withdrawal,” and “consumption,” all have a variety of overlapping meanings, just in the US alone. If the US cannot achieve consistent language and terminology within its own boundaries, then trans-boundary issues in areas of the world with multiple languages are likely to be even more challenging.
165. Furthermore, there is a lack of consistency in the scientific units that are used to describe water. For example, in the western US, “acre-feet” are used to describe a volume of water, but in the eastern US, “gallons” are used. Because 1 acre-foot has 325,851 gallons, mistaking the units can lead to significant errors. Additionally, flow rates are described on different time scales from seconds (e.g. “average cubic feet per second” as collected by the Department of Energy (EIA, 2009a)) to days and years (e.g. “million gallons per day” and “acre-feet per year” as reported by the US Geological Survey (Kenny et al., 2009)) all describing the same water withdrawal for power plant cooling. These different data units send confusing signals as to what time frames are important for water and energy planning and regulation.
166. There are also significant data differences between the state and federal water agency, partly because of the mix of units and the mix of terminology. Many states produce databases with water information, and the Energy Information Administration provides data on water use for the electricity sector, however these two sets of data do not uniformly agree, which can cause errors during analysis and policy formulation (King et al., 2008a). Furthermore, state and federal agencies neither always collect the same type of data (e.g. withdrawal versus consumption) nor at the same flow point in the system (e.g. at the power plant intake versus at the point of withdrawal from a river). Water managers at power plants that fill out forms for state data collection requirements don’t know that similar federal forms exist, making data validation difficult. The combination of collecting and reporting of water data for energy systems using different units, locations of interest, and agencies makes even simple concepts unintelligible.

ENV/EPOC/GSP(2010)21
55
167. While the data that exist are often error-prone with inconsistent use of terminology and units, they are also sparse. Many data sets regarding water use for energy and energy use for water are not directly measured or reported to a central agency, and thus are disparate and in many cases unreliable, which hinders decision-making. One ongoing challenge for data is that the funding resources for data collection (especially for water) have decreased in the US. As a result, some critical information is not available to policy makers. For example the US Geological Survey stopped collecting water consumption by use, state and sector. One important type of energy data not collected for water distribution is energy consumed for agricultural irrigation. The US Department of Agriculture reports irrigation costs in dollars, but not in units of electricity consumed (USDA, 2004). Thus, it is not possible to back calculate the full energy consumed to grow crops as electricity costs vary widely within and across countries, and many countries subsidize both water and electricity prices for agriculture (see India case study).
3.1.5 Time Frame and Strategic Planning
168. Another hurdle to coherent policy formulation is a mismatch in planning timeframes. Forward-looking water plans are often on the 50-60 year horizon, whereas energy plans are up to 20-30 years ahead at best. These differences are the consequence primarily in the different amounts of time it takes to build water infrastructure (it takes decades to build large-scale waterworks, whereas only years to build power plants), and how long that water infrastructure lasts (canals, dams, etc., can last hundreds of years, whereas most power plants or transmission lines last decades). Because private companies acting under market forces often dictate the location of energy infrastructure, water infrastructures are located using more public interest criteria. Thus, water planners trying to plan 50 years ahead for new power plant cooling water cannot possibly know where that demand will manifest itself.
3.1.6 Moving Forward
169. In the United States, integration of water and energy policy is immature, but there has been increasing discussion of the water-energy nexus issues over the last five years. The Department of Energy coordinated an effort among the various national energy labs that culminated in a widely-cited energy-water nexus report to Congress and a website (http://www.sandia.gov/energy-water/) to act as a centralized location for information (DOE, 2006). Furthermore, the environmental impacts due to expanded biofuels production as mandated by the Renewable Fuels Standard (RFS) have pushed the associated water usage and pollution into the spotlight of both the government and public. Even though many of the water impacts from US biofuels production relate to corn agriculture itself and crop switching, and not the act of turning corn starch into ethanol, the RFS has caused increased concern. The US Government Accountability Office, Department of Energy, and National Academies have produced water-energy nexus reports for legislative and executive audiences outlining the major issues (DOE, 2006; GAO, 2009b,c; Schnoor et al., 2008). The focus on the energy-water nexus over the last several years has culminated into verbiage included in pending energy and climate bills in the US Congress. Other examples at the federal level include information-based labeling that could be used by consumers to select water- or energy-efficient goods. The EnergyStar label is used to identify energy-efficient appliances, while the WaterSense label is used for water-efficient bathroom fixtures. In addition, Hawaiian law now requires energy-efficient hot water systems as of January 1, 2010, which many interpret as a mandate for solar water heating systems on single-family homes (Hawaii, 2010).
170. Some US state and local governments are foregoing Federal action on the issue and attempting to integrate energy and water policymaking themselves. The California Energy Commission issued a series of reports over the last five years on this topic to inform policy development aimed to improve cohesion between the state’s energy and water planners (Klein et al., 2005). And, in September 2008, the California Public Utility Commission (CPUC) adopted the California Long-Term Energy Efficiency Strategic Plan, and that plan noted that one limitation of planning was that it did not address the water-

ENV/EPOC/GSP(2010)21
56
With the world’s largest unconventional petroleum reserves and production, Canada exemplifies the challenges of managing water resources that are required to exploit lesser quality fossil resources.
energy nexus. In spring of 2010, the CPUC launched the nation's largest home energy-efficiency retrofit program with the goal to save 20% in residential energy usage. The program will include some water-efficiency measures such as low-flow shower heads, and there is increased use of innovative financing for these programs. The San Francisco program, GreenInvestSF, for example, ties financing to property taxes and allows inclusion of water conservation measures beyond those currently in the energy utility program (Exloco, 2010).
3.2 Canada: water for unconventional petroleum oil sands
171. Canada is often viewed as a water-rich country because of its large size and climate with high precipitation enable it to produce and export products with large water footprints (e.g. energy and agricultural commodities). However, due to pollution and the distribution of water resources, the Canadian government does not consider Canada to be water-rich (Environment Canada, 1987). Thus, the government opposes large-scale exports of water as well as the inter-basin transfer of water from the ecologically delicate northern regions of the country. Despite this “water-scarce” mentality, 73 GW of Canada’s 125 GW of electric generation capacity in 2007 is hydropower, operating collectively with a capacity factor between 54% and 62% over the last three decades, but with a declining trend over time. Overall, 369 TWh (60%) of Canada’s total 614 TWh of electric generation in 2008 was from hydropower (EIA), and hydropower consistently generates near 60% of Canada’s total (IEA, 2010). Additionally, Canada virtually exports some of its water resources by physically exporting hydropower electricity to the northeastern United States from the 3 GW Nalcor hydropower project on the Churchill River in Labrador (Cartledge, 2010).
172. The oil sands, or tar sands, of the Athabasca River basin of Alberta have tremendous water-energy nexus implications. The oil sands are bitumen characterized as either a heavy or very heavy oil, and they have such a viscosity that the bitumen does not readily flow under either ambient or reservoir temperature and pressures. Thus, the viscosity is decreased to make the petroleum resource flow by adding heat in the form of steam by one of two methods: to the oil sands obtained from surface mining or in-situ in deeper resources for which removing the overburden is too costly. Both methods have potential impacts upon water resource quantity and quality.
173. Oil sands processing and/or mining requires approximately 2-5 cubic meters of H2O in the form of steam per cubic meter of bitumen that is produced and presents a challenge for obtaining the water volumes needed to produce the resource (Peachey, 2005; Veil et al., 2009). For in-situ mining using the steam assisted gravity drainage recovery process, up to 90% of the injected steam is recycled, and there is increasing use of saline water (LeGrow, 2010). However, because any saline water is turned to steam, the high total dissolved solids (TDS) content must be lowered before injection, thus raising the energy requirements for desalinating that resource. Thus, the difficulty in obtaining available freshwater due to resource limitations and competition with other end-uses causes developers to employ more energy-intensive measures than they would otherwise.
Canada at a Glance Power Generation (IEA, 2010) Hydro 58% Coal 18% Nuclear 15% Natural Gas 6% Other 3% Water Consumption (NRC, 2005) Agriculture 58% Thermal-electric power 15% Municipal 9% Minerals/Metal Products 4% Other Manufacturing 10% Other 4%

ENV/EPOC/GSP(2010)21
57
174. Water quality is also an equally important concern with oil sands operations. Both airborne pollution deposited on snow and water bodies as well as the tailing ponds that hold the waste water from oil sands operations present opportunities to pollute surface and ground water. The tailing ponds are used to collect the used mining and process water that contains salts, metals, and hydrocarbons that have contaminated the water. The surface mining of the oil sands has thus far contributed to 130 km2 of tailing pond surface, or approximately 22% of the estimated 600 km2 of the total disturbed land area by March 2009 (Government of Alberta Canada, 2009). Potentially 1,400 km2 of land could be disturbed by oil sands operations by 2023 (Peachey, 2005), and approximately 20% of Athabasca oil sands can be obtained via surface mining (Veil et al., 2009). The major concerns with the tailing ponds are that seepage might transport contaminants to ground or surface water since the ponds are often very near a river or stream and the water table is relatively shallow in the region. While previous studies seem to show no appreciable contamination of surface water (Government of Alberta Canada, 2009), recent studies indicate an alternative conclusion. Specifically, dust from mines gets deposited onto snow (and subsequently spring melt water) and local streams, such that contaminants like polycyclic aromatic compounds (PAC) get transported. PACs on the Athabasca River, downstream of operations, are measured at almost twice the concentration as compared to upstream of oil sands mining areas (Kelly et al., 2009). Also, PAC concentrations above that known to harm fish embryos have been measured in close proximity to surface mining activities (Kelly et al., 2009).
175. The federal governance of water in Canada includes over 20 agencies and departments that have unique responsibilities for freshwater (Canada, 2010). These agencies must coordinate to meet the two stated goals of the Canadian Federal Water Policy: to protect and enhance the quality of the water resource, and to promote the wise and efficient management and use of water (Environment Canada, 1987). Three of the five strategies to achieve these goals are water pricing, science leadership, and integrated planning. In light of this Federal Water Policy, oil sands present a challenge for Canada. Because water rights are normally the jurisdiction of provincial and local governments, and in Alberta the rights are distributed on a first in time, first in right principle, putting a price on water is meant to guide water usage to the most valuable purposes – that could be the oil sands production. On the other hand, if the scientific evidence shows that water quality is detrimentally impacted by oil sands operations, including impairment of fish habitat, then federal laws and jurisdiction could get involved via the Fisheries Act or other environmental acts. The integrated planning efforts are supposed to judge water allocation based upon the many values, literally via pricing and qualitatively where charges are not pertinent, of water and related resources. Thus, any judgment of allocating water among wildlife, fish, and energy production will be inherently subjective and at risk of dispute by parties on either side of the argument. Canada has taken a major first step toward an integrated framework for water use for oil sands and the surrounding environment from a quantity standpoint via the Water Management Framework for the Lower Athabasca River. This framework establishes a cap on how much water can be withdrawn based upon seasonal changes in river flow (Government of Alberta Canada, 2009). However, there has yet to be a comprehensive framework for establishing procedures and levels for water quality impairment by either direct contamination of localized streams or indirect transport downstream when fish and wildlife may already be negatively impacted (Kelly et al., 2009). The structure and policy for handling the water quantity and quality issues related to oil sands development are established, however, the prioritized conflicting strategies are incoherent such that the outcome is arbitrary.

ENV/EPOC/GSP(2010)21
58
Australia is considered the most water-scarce inhabited continent in the world, which has made the development of a sustainable water plan a critical national policy. By contrast, the region enjoys vast energy resources that have allowed the country to have cheap and abundant energy without much regard for cogent energy policy. However, water constraints have impacted Australia’s energy choices for dealing with those constraints.
Australia at a Glance Power Generation (WNA, 2010) Coal 76% Natural Gas 16% Hydro 5% Oil 1% Other 2% Water Consumption (ABS, 2006) Agriculture 65% Thermal-electric power 1% Households 11% Water Supply 11% Other Manufacturing 3%
3.3 Australia: water scarcity forces leadership on conservation
176. The development of unified energy-water policy in Australia has been challenged by the mismatch between the country’s energy and water resources. This mismatch lies in the fact that Australia is one richest nations in the world in terms of its energy resources, but is considered the most water-scarce of any of the six inhabited continents. Consequently, developing water policy that protects the nation’s limited water resources has been a critical national initiative for decades, while the development of cogent energy policy has been of less concern since the country’s vast energy resources have always allowed the country to have cheap and abundant energy (ABS, 2006).
177. As a result, energy and water have historically been considered independently of each other. However, increased interest in reducing the country’s carbon emissions, which are among the highest in the world, will likely incentivize more coherent energy-water policy in the future, especially as energy-intensive technologies such as desalination become deployed to produce clean drinking water. Given the historical practice and need for long-term planning for water, Australia could become a model for integrated energy-water policy.
178. Australia, unlike many countries, promotes the use of competitive markets in its water reform efforts. Australia’s Water Act of 2007 established a water market system that supports water trade as a means of getting water to regions that need it. It requires that water entitlements be reassessed each season, that is, water rights are not granted based on seniority, as that are in countries such as the United States. Additionally, each State’s water diversions are capped to a specified quantity each year. Although this system has had economic benefits, it has also created environmental problems, which have arisen due to the over-allocation of water permits (Young, 2010).
179. Australia’s National Water Initiative (NWI), an intergovernmental agreement managed by the National Water Commission (NWC) of the Australian Government, was instituted in 2004. This initiative was implemented ten years after the country’s first plan for sustainable water resource development was initiated in 1994 (Australian Government, 2010). The NWC Commission is responsible for advising the Council of Australian Governments on developing environmentally-conscious water policy, improving pricing mechanisms, placating over-allocated water systems, improving water accounting, expanding water trade, and improving demand management for water resources (NWC, 2010). Each state and territory is required by the NWI to submit an implementation plan that is critiqued by the NWC to ensure coherence between each government’s water policy and the initiatives of the NWI. The Australian Water Resources Report (AWR), published by the National Water Commission, provides data that are pertinent to evaluating the effectiveness of the NWI by assessing the country’s water resources. It reports how much water is available in Australia, how much is stored, and the year-to-year variability in water availability across the country (Cardona et al., 2007). Many agencies contribute to the development of

ENV/EPOC/GSP(2010)21
59
the NWC’s AWR report, many of which are classified within Water Resources Observation Network alliance. Despite numerous stakeholders, water is still largely controlled by the States (Young, 2010).
180. Irrigation is the largest user of water in Australia (65% of consumption), and thus, much of Australia’s water policy framework focuses on sustainable water use in the agriculture sector rather than the energy sector. Electricity generation facilities consume only 1-2% of Australia’s total water consumption (ABS, 2006). However, drought conditions in 2007 forced thermoelectric power plants to scale back power production as low water availability hampered electricity production (Roberts, 2007). Unlike its scarce water supplies, Australia enjoys abundant energy resources. It is the world’s fourth largest exporter of coal, supplies 8% of the world’s liquefied natural gas trade, and has 40% of the world’s uranium reserves (Howard, 2004). Australia’s energy supply mix consists predominately of coal (40%), petroleum (34%), and natural gas (20%) with renewables accounting for 5% of the remaining supply of primary energy consumption (WNA, 2010).
181. Because of Australia’s vast fossil fuel resources, the country has historically enjoyed cheap energy prices. Additionally, Australia has the fourth and fifth lowest petrol and diesel taxes among OECD countries, respectively (Australian Government, 2004). For this reason, relatively little attention has been devoted to sustainable energy policy in the past. In fact, while the carbon intensity of most of the world’s developed countries has fallen since 1990 due to the increasing role of natural gas in the electricity mix, the carbon intensity of Australia’s electricity supply has risen during this period because of the increasing role of coal (OECD/IEA, 2003). Consequently, Australia currently emits the highest per capita carbon dioxide emissions of any other country in the world (Economist, 2010).
182. However, in recent years, Australia has begun to incorporate energy policy aimed to reduce the country’s carbon emissions. In 2007 the National Greenhouse and Energy Reporting Act (NGER) established a framework to account for the energy production, consumption, and greenhouse gas emissions of corporations (Australian Government, 2007). While the current economic downturn and lack of global climate agreement has tempered Australian consensus for reducing carbon emissions (Economist, 2010; UK Telegraph, 2009), the push of the last few years has had water implications in context of the water-energy nexus. In response to water shortages, Australian cities have turned to seawater desalination as a water supply. Yet public concern over embedded energy and greenhouse gas emissions led desalination facilities in Perth and Sydney to construct policy and business agreements to conceptually couple grid-connected wind farms to offset the carbon emissions of the desalination plants (Barta, 2008; SPG Media Water Technology, 2009; Tadros and Robins, 2008).
183. Despite Australia’s effort to coordinate sustainable water policy, developing coherent national water policy is difficult since Australian water resource data are currently collected by over 200 organizations, making accurate projections regarding future water availability and water use difficult (WIRADA, 2009). In efforts to streamline the aggregation of water resource data, the Water Act of 2007 grants the Bureau of Meteorology the rights to collect, hold, manage, interpret, and disseminate Australian water resource information from all water collection agencies. Additionally it provides water resource projections and conducts analysis to improve the effectiveness of water policy (Australian Government, 2009). Researchers at the Australian National University and the University of Technology Sydney have formed the Climate-Energy-Water Links project to build upon existing water resource planning by adding the energy dimension to the policies.

ENV/EPOC/GSP(2010)21
60
France at a Glance Power Generation (MEEDDM, 2010) Nuclear 78% Hydro 11% Coal 4% Natural Gas 4% Other 3% Water Consumption (CIEAU, 2010) Agriculture 68% Domestic 24% Industry 5% Power Generation 3%
French energy policy commitment to nuclear power also committed it to open-loop cooling systems that have been vulnerable to drought conditions and high temperatures. And the avoidance of irrigation for biofuels, while mitigating some social concerns, leaves another energy supply exposed to drought.
3.4 France: Nuclear power to the core, but high temperatures mean low output
184. France illustrates the interconnectedness of power generation and water supplies through its extensive use of nuclear power, which has significant water needs for cooling purposes. Additionally, various related institutions make France an interesting example of energy and water policy formulation. Electricity generation in France is dominated by nuclear power at 78% of total power generation, with hydroelectricity second at 11% (MEEDDM, 2010). French nuclear power plants mostly utilize open-loop cooling, thus requiring high water availability to support large cooling water withdrawals but only consuming small, if any, volumes of water (CIEAU, 2010).
185. A majority of the water consumption in France originates in the agriculture sector, consuming 68% of the nation’s water use; the remaining water consumption is for drinking water, industry, and power generation (CIEAU, 2010). Of the market for drinking water, private sector participation constitutes approximately 80% of drinking water services in France, illustrating potential for successful water privatization in a developed country (Reynaud, 2007).
186. Energy and water policies in France fall under the jurisdiction of many different government ministries. The main ministries executing energy and water policies include the Ministry of Ecology, Energy, Sustainable Development and Sea (Ministère de l’Ècologie, de Ènergie, du Dèveloppement durable et de la Mer), Ministry of Food, Agriculture and Fisheries (Ministère de l’Alimentation de l’Agriculture et de la Pêche), and the Ministry of Health (Ministère de la Santé et das Sports), among other ministries handling energy and water spending and management. While energy policies are generally handled on the national scale, water policies determined by the National Water Committee are implemented by the water agencies (les Agences de l'Eau) that manage water on the basin level (AE, 2010). While managing water policies based on water catchment might seem like an obvious approach, a fair number of countries worldwide use political boundaries rather than hydrologic boundaries when managing water resources. Thus, France is an exception, in a good way, with its water policies.
187. Rainfall is generally plentiful in France, yet location and seasonality of rainfall does not always coincide with the water needs of agriculture. As a result of particularly dry summers in the southern half of France, much of the agricultural production in the Mediterranean area is irrigated (MAAP, 2010). Irrigation supplements rainfall for agricultural production in areas of west and central France as well (MAAP, 2010). Policy measures support the use and expansion of irrigation in agriculture via subsidies for farmers installing irrigation equipment and guaranteed low prices for irrigation water (Baldock et al., 2000). This dependence of regional agriculture on irrigation shows that agriculture policies are highly influenced by water policies, and because irrigation requires electricity for pumping, it adds to electricity demands.
188. Biofuels production in France is confined mostly to non-irrigated feedstocks, such as sugarbeets and rapeseed (de Fraiture et al., 2008). Since these biofuels are rain-fed, there is little conflict between water, agricultural, and biofuels policies. That is, if sugarbeets or rapeseed were to be irrigated, policies

ENV/EPOC/GSP(2010)21
61
that promote additional biofuels production would undermine policies that aim to conserve water. Consciously or unconsciously, by respecting the ecological environment through sustainable water use, French energy policy for biofuels does not conflict with water policy (Water Economy, 2010).
189. However, France’s dependence on large water withdrawals for irrigation of agriculture and cooling of nuclear and other thermoelectric power plants leaves the nation vulnerable to drought conditions. Historical heat waves in 2003 left France’s rivers too hot with water levels too low to assure adequate cooling of nuclear power plants; after requesting temporary exemptions, nuclear facilities were forced to operate at reduced capacity as a result of heat and drought. A similar heat wave combined with prolonged drought could jeopardize both power generation and food production due to French agriculture’s dependence on irrigation. Thus, both energy and water resources are vulnerable to drought and heat waves.
190. In a recent OECD survey regarding the coordination of energy and water policies, France reported that in 2007, various ministries and departments were merged to form the Department of Ecology, Energy, Sustainable Development and the Sea (MEEDDM). This merger was motivated by the interdependence of issues and the need for a completely open plan as part of a policy for sustainable development. In addition, the Master Plans of Development and Water Management (SDAGE) - which represent France in the management plans required by the Water Framework Directive (WFD) – are applying the WFD coordinating hydropower operations and conservation of aquatic environments as far as possible to remove or operate dams to achieve or maintain good ecological potential (OECD, 2010c).
191. France illustrates both coherent and incoherent aspects of energy and water policy. Positive aspects of French energy and water policies include use of non-irrigated agriculture for biofuels production and water management on a river basin scale. But heavy reliance on hydropower and nuclear power facilities with open-loop cooling on rivers leaves the nation highly vulnerable to drought and other water shortages. Implementation of dry or hybrid wet-dry cooling technologies can help mitigate drought-induced problems at power plants, yet can reduce efficiency of nuclear power generation. Energy and water conservation can also lessen the effects of the feedback loop of additional power generation requiring additional water consumption, which requires more energy for treatment.

ENV/EPOC/GSP(2010)21
62
Brazil at a Glance Power Generation Hydro 81% Biomass 4% Nuclear 3% Other 11%
Brazil’s PROALCOOL program constitutes perhaps the most ambitious and long-term plan to pursue an alternative to petroleum. The success to date owes much to Brazil’s climate and water availability.
3.5 Brazil: water resources enable a global leader in bioenergy, but new challenges await
192. The energy and water resources in Brazil are intimately tied to the economic productivity of the country. In 2008 approximately 46% (15% from hydropower and 32% from biomass) of Brazil’s primary energy supply was directly dependent upon water. Approximately 10 quads of energy were consumed in 2006 in Brazil (EIA, 2008b), and of the 32% of primary energy from biomass, approximately 16% was derived from sugar cane. As of 2008, sugar cane supplied more of Brazil’s primary energy than hydropower. But, hydropower is the dominant electricity generation type in Brazil with 77 of 100 GW installed capacity generating 370 of 450 TWh in 2008 (EIA). However, Brazil is not immune to the controversies surrounding the establishment of new hydropower facilities as evidenced by the Belo Monte hydropower project (to be the third largest hydropower project in the world) on the Xingu River in the eastern Amazon basin. As an environmental concession the facility was redesigned as a run-of-river style instead of a traditional large reservoir, thus flooding only a third of the area from the original plan two decades earlier. Brazil’s challenge for balancing the water-energy nexus for hydropower will continue as Brazil’s National Energy Plan 2030 stipulates the addition of 95,000 MW of new hydro capacity by 2030 (Government of Brazil, 2008). Additionally, the energy plan calls for producing 11.4% of electricity, or 136 TWh by 2030 from burning bagasse, the fibrous part of the sugar cane not currently used for ethanol production.
193. In the 1974 Brazil reacted to the global oil crises by beginning its National Alcohol Program (PROALCOOL) to make ethanol a primary fuel for its domestic light duty vehicle fleet (Martines-Filho et al., 2006). Today, fuel sold at fuel stations comes in a minimum ethanol mix variety, at 25% ethanol, and higher mixes that can be 100% anhydrous ethanol. Over 80% of the cars produced in Brazil are now flex-fuel vehicles that can take the range of fuels mixtures from 25% ethanol/75% gasoline to 100% ethanol. This transformation of the ethanol industry in Brazil is based upon the conversion of sugar cane into ethanol primarily in the south central portion of Brazil (e.g. state of São Paulo) where the climate and rainfall are suitable for growing sugar cane. Practically no irrigation is required for sugar cane in this region of Brazil (de Paula Gomesa and de Araújo, 2009; Lapolaa et al., 2009). Although many farms in the more mature sugar cane production area of Northeast Brazil (e.g. Paraiba) require irrigation in that more arid environment, a large part of the success of PROALCOOL is due to suitable rainfed lands in the south.
194. The achievement of Brazil’s transformation away from 100% dependence upon petroleum for light duty vehicle travel required the coordination among several ministries of the federal government: the Ministries of Industry and Commerce, Agriculture, Science and Technology, Mines and Energy, Finance and Planning, and Environment. Furthermore industrial groups (sugar cane industry, fuel distributors, automobile) and consumer groups participated in the plan as the Brazilian government promoted the blending of ethanol into the fuel distribution system by a coordinated plan of subsidies that facilitated the transition. This coordination facilitated incredible growth in Brazilian sugar cane and ethanol production, from 3.5 GL in 1979 to 12 GL in 2001 to over 24 GL in 2008. The National Energy Plan 2030 calls for a large increase in domestic ethanol demand from 20.3 GL in 2008 to 52.2 GL in 2017 (Government of Brazil, 2008).

ENV/EPOC/GSP(2010)21
63
195. The recent expansion in the last decade caused growing pains for assuring soil and water sustainability, and the state and federal governments have acted to preserve water resources. The recently enacted Agroecological Zoning in São Paulo for sugar cane and ethanol production includes measures to assure that new biorefineries are limited to water withdrawal less than 1 m3/tonne of cane5 processed, versus 20 m3/tonne 20 years ago, as this has now become easily achievable due to plant technological improvements such as the internal recycling of water. Additional specifications in the Agroecological Zoning for sugar can relate to harvesting by machine instead of manual labor, and the consideration of soil and water availability in the siting of farms and to maximize yields and minimize irrigation needs. The effluent from the biorefineries is high in nutrient content, and in the past this caused major problems by eliminating much of the aquatic life in local rivers. However, today it is common practice to recycle this “vinasse” by reapplying those nutrients onto the fields. It is currently unknown if the eventual flow of these nutrients within the hydrological system will cause contamination of groundwater or surface water.
196. In order to better plan for water resources, including the implications for energy, the newly formed AgroHidro and Water Resources Research Network are means by which Brazilians hope to gain a much more thorough view of the hydrological systems in Brazil to better guide future industrial and agricultural practices. The history of a coordinated and coherent plan across multiple ministries for ethanol production provides some level of confidence that the same coherence can be translated to water resource management. Now that the scale of energy infrastructure in Brazil has grown beyond the highest quality land and water resources, a new challenge emerges for coherent policy. Only 5% (~ 9 million hectares) of Brazilian agriculture and pasture land is currently used for sugar cane, and Brazil has more available arable land for general agricultural expansion than any other country. The designation of the agroecological zones to protect water quality and quantity shows that Brazil is trying to stay ahead of the energy-water curve with regard to its biofuel policies.
5 NOTE: 1 tonne of sugar cane translates to approximately 85 L of ethanol

ENV/EPOC/GSP(2010)21
64
India at a Glance Power Generation (IEA, 2010) Coal 68% Hydro 15% Natural Gas 8% Oil 4% Nuclear 2% Other 2% Water Consumption (Guha and Gupta, 2007) Agriculture 83% Domestic 5% Industry 4% Power Generation 3%
As India’s population has grown and further developed technology, some energy and water resources have been exploited beyond their renewable capacity, especially groundwater resources. Substantial conflicts between energy and water management make India a descriptive example of energy and water policies that can inadvertently undermine one another.
3.6 India: renewable water for hydropower allows depletion of fossil aquifer
197. India is a diverse nation with large land area and energy and water resource potential. However, development of India’s energy and water resources has led to conflicts between agricultural production, domestic water supply, power generation, and, more recently, biofuels production. In order to ensure adequate food supply for India’s growing population, about 66% of total grain production depends on irrigation (accounting for 83% of total water use), usually in the form of pumped groundwater irrigation (Guha and Gupta, 2007; McCornick et al., 2008; Rodell et al., 2009). Despite the strong dependence of agriculture on irrigation, current Indian groundwater management practices have not prevented resource depletion (de Fraiture et al., 2008; Jackson et al., 2001; Lapolaa et al., 2009; Rodell et al., 2009). As a result, water tables are falling such that 114 million people might experience water shortages for irrigation and drinking water (Rodell et al., 2009).
198. India’s National Water Policy of 2002 prioritized development and management of the nation’s water resources, emphasizing integrated management, sustainable use, conservation, and creation of water information systems (Guha and Gupta, 2007). To date, however, India’s water supply has remained relatively constant and a growing population puts strain on existing supply (Guha and Gupta, 2007; McCornick et al., 2008). Despite this strain, official statistics claim 90% and 97% of the urban and rural population, respectively, has access to reliable drinking water, yet only 50% and 5% have access to sanitation (Guha and Gupta, 2007). The large percentage of the population without access to sanitation leads to conflicts between the National Water Policy and other environmental and ecological policies. Reliance on large amounts of energy for pumping water in long-haul pipelines also leads to conflicts between drinking water supplies and energy (Kumara and Kandpalb, 2007; Shaha et al., 2009).
199. Introduction of irrigated sugarcane for biofuels production exacerbates Indian energy and water policies even further. While Indian sugarcane represents large biofuels potential, irrigation of the crop exacerbates conflicts between energy, water, and agricultural policies in India (McCornick et al., 2008). Consequently, energy, water, and agricultural policies in India are highly disjointed and incongruent. As India aims to increase energy production from additional sugarcane biofuels and both hydroelectric and thermoelectric power generation, the gap between energy, water, and agricultural policies widens (de Fraiture et al., 2008; Guha and Gupta, 2007; McCornick et al., 2008). Current conflicts between reservoir water use for irrigation or hydroelectric power generation might only get worse. Ironically, more than half of the hydropower generated in India is used for groundwater pumping for irrigation (McCornick et al., 2008). Since most farmers do not have access to surface water in the reservoirs behind hydroelectric dams, the surface water is used to generate electricity to pump groundwater for irrigation. Like a dog chasing its tail that will eventually tire of running in circles, this dissipative Indian water cycle of surface water being used to generate electricity to pump groundwater might also run itself dry without coordinated action and planning. The current state of energy and water policies in India illustrates the

ENV/EPOC/GSP(2010)21
65
A history of employing innovative technology in a water-constrained and sun-drenched country forces Israel into both energy-conserving and energy-intensive water solutions.
Israel at a Glance Power Generation (2009) (IEC, 2010) Coal 65% Natural Gas 33% Oil 3% Water Consumption (2004) (OECD, 2010a) Agriculture 58% Domestic 36% Industry 6%
importance of whole systems thinking to prevent water policy decisions from exacerbating energy – and, consequently, water – resources.
3.7 Israel: location, location, location needs technology, technology, technology
200. The geographic location and natural resources within a country often dictate the focus of technologic innovation derived and deployed within a country’s borders. Israel’s semi-arid and arid environments and lack of fossil energy resources are drivers for Israeli investments at the energy-water nexus. In this context, by practical necessity, Israel is a world leader in per capita use of solar hot water heating and desalination. Looking to a future with reduced carbon emissions and less available petroleum, Israeli companies are also increasingly pursuing the technology to use their abundant sunshine for growing algae to turn into biofuels.
201. Israel has struggled with the provisioning of fresh water for municipal and agricultural purposes practically since its inception. By the 1990s a combination of drought, over pumping of groundwater, and continued population increase prompted centralized desalination planning. The Israeli Water Commission began the planning of what became the Desalination Master Plan in 1997 targeting a total capacity of 775 million m3/year (Tal and Rabbo, 2010). Israel now has the world’s largest reverse osmosis desalination plant in the world at Ashkelon (capacity of 348,000 m3/day) that produced 111 million m3 in 2008, approximately 15% of domestic demand amongst a total country demand of approximately 2,000 Mm3/yr (OECD, 2010a). The specific energy consumption for the Ashkelon facility is approximately 3.9 kWh/m3. Other major desalination plants exist at Hadera, Eilat, and Palmachim, and others in planning or construction at Ashdod and Shafdon (wastewater) (Tal and Rabbo, 2010) aim to serve approximately 50% of Israel’s municipal fresh water demand, and as of 2010 an estimated 875 m3/yr, equal to 56% of natural fresh water resources, comes from recycled effluents and desalination (OECD, 2010a). However, not yet fully realized are the solutions to handling the environmental and engineering challenges of discharging large quantities of concentrated effluents into the sea and using desalinated water for crop irrigation (OECD, 2010a).
202. Israel’s use of solar hot water heating began even before its inception as a country, and the first Prime Minister David Ben-Gurion had a solar water heater in his home (Bacher, 2000). Solar hot water use increased in usage naturally due to fuel shortages and high prices over decades, and in 1980 the Israeli government passed a law amending Article 9 of the Law for Planning and Building (1970) requiring the builder to install solar hot water systems on new residential buildings (Grossman, 2007). Today, over 90% of all Israeli homes have solar hot water systems that can provide hot water needs for 9-10 months out of the year saving 21% of domestic sector electricity consumption, or 5% of national electricity consumption (Grossman, 2007). Solar hot water heating in Israel is clearly a win-win scenario for the energy-water nexus in terms of conserving both resources.
203. Because Israel lacks an oil resource and has an abundant solar resource as well as experience in growing algae for high value nutritional supplements and cosmetic applications, Israeli companies could be poised to lead algal biofuels technology development. Several companies in Israel are working with various international partners in pursuit of deriving alternative liquid fuels. For example, Israeli-based

ENV/EPOC/GSP(2010)21
66
Singapore at a GlancePower Generation (IEA, 2010) Natural Gas 79% Oil 21% Water Consumption (Statistics Singapore, 2010) Domestic 59% Non-Domestic 41%
Substantial water recycling and reuse, likely motivated by necessity, has increased the security of Singapore’s water supply while also increasing energy consumption for water treatment. Coupling these water security measures with water conservation and energy efficiency leads to cohesive policies to manage both resources.
Seambiotic is one of the worldwide leaders in algae cultivation, producing algae on a site of 1,000 m2 that uses the CO2-containing coal plant flue gas as an input. Partnerships with US and Chinese companies poise the company to keep Israel on the forefront of algae cultivation for both consumer products and biofuels.
204. Israel reported in an OECD energy-water survey that the co-ordination between policies for water allocations and energy consumption is explicitly addressed in the Israeli Water Authority’s 2010 Master Plan for national water and wastewater management. Within the Master Plan are several measures for minimizing water-related demands on the national power supply (that account for approximately 6% of the total national electrical demand). Promoting electricity demand management, the Israeli Electricity Authority (a division of the Ministry of Infrastructure) encourages customers to minimize their demand on electricity during peak (daytime) hours by selling electricity at much higher prices during the day. The Israeli Water Authority permits water pumping and purification operators the freedom to minimize their energy demands during these peak daytime hours. In a natural response to minimize costs (and maximize profits), operators pump larger proportions of the daily water-quotas during the night hours, and store the pumped water in numerous reservoirs throughout the country. They thereby reduce energy-costs, while assisting to homogenize energy demands across the day-night cycle. The Israeli Water Authority thereby works in tandem with the Israeli Electricity Authority to limit daytime energy consumption rates (OECD, 2010c).
3.8 Singapore: old water to NEWater
205. Singapore is notable for its innovative approach to water management and security. The small Asian country of Singapore has faced many water challenges due to a large population of 4.4 million on small land area dictating that a large proportion of water needs are domestic (EcoWIN, 2010; Statistics Singapore, 2010). Consequently, supply of drinking water is dependent on constructed reservoirs and catchments, imported water from Malaysia, desalination, and recycled wastewater known as NEWater (EcoWIN, 2010). Policy decisions regarding water have also affected Singapore’s approach to energy management, making the small nation a suitable example of conservation and water reuse.
206. Desalination and production of NEWater – both substantial supplies of water in Singapore at 25% and 30% of total supply, respectively (Onn, 2005; PUB, 2010) – require advanced membrane treatment, creating a reliable yet energy-intensive drinking water supply (notably, NEWater is less energy-intensive than water from desalination). Creation of the Ministry of the Environment and Water Resources (MEWR) in July of 2002 reduced administrative barriers to development of policies and infrastructure that advance Singapore toward a sustainable and reliable drinking water supply (Chen et al., 2010).
207. Singapore’s MEWR introduced the 10-Litre Challenge in 2006, challenging citizens (who are responsible for more than half of Singapore’s total water consumption) to reduce their daily water consumption by 10 L through water conservation, labeling of water-efficient appliances, and use of dual-flush toilets (MEWR, 2010a). The 10% Challenge was also launched to decrease water consumption of

ENV/EPOC/GSP(2010)21
67
non-domestic users by 10% or more. The net effect of these proactive conservation policies has been a decrease in per capita water consumption from 172 L/person/d in 1995 to 157 L/person/d in 2007 (MEWR, 2010a). Energy efficiency policies have also improved overall energy efficiency by 15% from 1990 to 2005 (MEWR, 2010b). By implementing a dual approach of water conservation and energy efficiency, Singapore has realized the synergies of water and energy policies in practice.
3.9 Additional examples of coordination of energy-water policy amongst countries
208. UK: The Department of Energy and Climate Change has worked alongside the Department for the Environment, Food, and Rural Affairs to identify 89% of energy embodied in household water is used for hot water. The UK government is working with the Energy Saving Trust to develop policy to target hot water use as a way of mitigating emissions from energy consumed to heat household water (OECD, 2010c).
209. Spain: The National Water Council regulated by Royal Decree 1383/2009 is represented by the energy sector (Article 5.b) by the head of the Directorate General for Energy Policy and Mines, Ministry of Industry, Tourism and Commerce as well as a representative from the Spanish Association of Electrical Industry (UNESA). There are also regular meetings between the Ministry of Environment and Rural and Marine Environment and the Ministry of Industry (OECD, 2010c).
210. Mexico: The Technical Committee on Operation of Hydraulic Works (CTOOH) meets weekly to address all operational aspects of dams within Mexico, including hydroelectric power, such that water management sufficiently addresses all concerns and minimizes risks, such as flooding. CTOOH is composed of representatives from the National Water Commission (CONAGUA), Federal Electricity Commission (CFE), the Mexican Institute of Water Technology (IMTA), and the Engineering Institute of the National Autonomous University of Mexico (IIUNAM). In particular, Mexico is reviewing the possibility of using mini-hydro plants in existing water infrastructure. Initial estimates are that there are 112 feasible small projects that could be developed by the private sector for a total installed capacity of 6,600 MW and annual generation of 16,000 GWh (OECD, 2010c).
211. Portugal: The long term National Energy Strategy is jointly prepared by Ministry of Economy and MAOT, the Ministry of the Environment and Land Use Planning (OECD, 2010c).
212. Tunisia: Electricity consumed for pumping of groundwater is used to corroborate estimates of total groundwater withdrawal (OECD, 2010c).
213. Costa Rica: The National Plan of Integrated Water Resources includes hydropower development initiatives and other subsectors of drinking water and irrigation and others (OECD, 2010c).
214. Panama: In order to reduce conflicts among multiple water use stakeholders, both the Public Services Authority (ASEP) and National Environmental Authority (ANAM) work to determine water balances and availability and the developer must have final approval from ANAM (OECD, 2010c).

ENV/EPOC/GSP(2010)21
68
CHAPTER 4
MAIN MESSAGES AND EMERGING ISSUES
4.1 Summary of key findings
215. While the policy context for energy-water issues is constantly evolving, today the policymaking processes are typically highly disaggregated. There are examples in some places of integrated, coherent energy-water policies, but they are the exception, not the rule. In fact, there are many policies and technologies on hand for water that impinge on the energy system, and vice versa. While many local, regional and national governments are starting to issue beneficial policies, globally the process would benefit from significant improvement. The use of improved and more consistent terminology, units, and data for energy and water flows would beneficially begin the process of integrating water and energy policies horizontally and vertically within governments.
216. To date, countries or regions facing scarcity appear to be addressing the energy-water nexus through a variety of steps, including mandating solar hot water heaters (Hawaii, Israel), setting water reuse as a national priority (Singapore), and putting conservation up front (California, EU). Other policies, including recent support for biofuels, have very site-specific and often negative effects on the water-energy relationship. The local water and energy resources of each country play a large part in determining how any one technology will impact water and energy security objectives. As countries shift from conventional fossil fuel production towards unconventional fossil fuels and biofuels, the nature, extent and location of the water use and water pollution will be different. Consequently, the existing regulatory frameworks for protecting water quality must be updated and revised as policies press forward and scientific research reveals new findings.
217. The tie between energy-nexus policies and technologies is strong. Thus, different policy options can have either negative or positive influence on energy and water security depending upon how they relate to particular technologies. And because water and energy infrastructure lasts for decades, coordination of planning and allocation of responsibilities is needed to prevent embedding problems that will last long after policy decisions are made.
4.2 Information gaps and emerging issues
218. Among the most serious and quickly-addressable gaps for policymakers is the lack of suitable data and information that can be used to inform the policy formulation process. These data gaps exist within a country (for example the US), but also across boundaries. As resource issues gain a more prominent global role through treaties and climate change legislation, these problems might be exacerbated. In addition, emerging issues might complicate the data problems even further. For example, “water footprinting” is a term used by product manufacturers to estimate the amount of embedded water. In the same manner an “energy footprint” can describe a product. However, whether or not that embedded water in the water footprint is of concern will depend on the abundance and availability of the resources at the site of origin. And while energy commodities are regularly traded around the world, large volumes of water are not. Thus, from the standpoint of globalized trade, energy footprinting has less of a regional context than water footprinting as the world’s energy resources are traded much more than water. It is

ENV/EPOC/GSP(2010)21
69
generally easier to move energy resources or produce energy in locales where water is abundant rather than move water to where energy is abundant.
219. Among the most critical emerging issues is the trend towards more energy-intensive water and more water-intensive energy. These two trends generally result from population pressure and desire to preserve wildlife biodiversity. Populations in arid regions have grown to such sizes over the last century that the renewable and fossil water supplies are often extremely stressed. Water reuse and desalination alternatives all take more energy to purify and transport. These same water stresses are making dry cooling technologies more prevalent for thermoelectric power plants, especially for concentrated solar power in the sun-rich desert environments. Because of climate change concerns, natural gas shale is touted as an important bridge fuel supply to a low-carbon future. Energy production from natural gas shales produces much energy for the quantity of water injected for fracturing the rock (Bene et al., 2007), but the volumes of water per well can stress regional ability to transport and properly treat the water. And with coal as an abundant and relatively affordable fossil fuel, carbon capture technologies installed on fossil power plants are likely to be an important for reducing carbon emissions. These capture systems need process heat and electricity for compressing the carbon dioxide to supercritical conditions required for transport and storage underground. If the same net electricity from the carbon capture power plants is desired, then more fuel is required and hence more water for cooling. But again, dry cooling systems can be used for fossil or renewable thermoelectric systems, making it a doubly crucial technology for future focus.
220. Despite the many challenges, there are some policy opportunities at the energy-water nexus. For example, policies that promote energy conservation achieve water conservation, and vice-versa. In addition, there are some clear opportunities for governments, for example investing in R&D (e.g. to develop low-water biofuels, low-energy desalination, etc.).
221. And, there are reasons for optimism. Specifically, a variety of governments and multi-national organizations are starting to take this issue seriously. With a new push for getting firm data, and with the right multi-stakeholder engagements, policies and market innovations can be developed and implemented that achieve multiple goals of reducing energy and water conservations while making both systems more resilient and less impactful on the environment.

ENV/EPOC/GSP(2010)21
70
REFERENCES
(2004). "Energy Down the Drain: The Hidden Costs of California’s Water Supply." <http://www.nrdc.org/water/conservation/edrain/edrain.pdf>: Natural Resources Defense Council.
(2009a), "Austin's Water Treatment Plant 4: History, Finances and Next Steps." July 1, 2010: City of Austin, available at: http://www.ci.austin.tx.us/edims/document.cfm?id=129448.
(2009b), "The Edwards Aquifer Authority and the State of Texas v. Burrell Day and Joel McDaniel, No. 08-0964; see
http://www.supreme.courts.state.tx.us/ebriefs/08/08096403.pdf." Supreme Court of Texas.
Abrams, Robert and Noah Hall (2009), "Framing Water Policy in a Carbon Affected and Carbon Constrained Environment." Natural Resources Journal (Prepublication Draft).
ABS (2006). "4610.0 - Water Account, Australia, 2004-05 ", ISBN: 0 642 47942 9 ISBN: 0 642 47942 9: Australian Bureau of Statistics.
Adee, Sally and Samuel K. Moore (2010), "The Power of Water In the American Southwest, the energy problem is water." IEEE Spectrum 47 (6):30-39.
AE (2010), "Organization of water policy." April 28, 2010: Agences de l'Eau, available at: http://www.lesagencesdeleau.fr/francais/agences/parten.php.
Alexander, Richard, et al. (2008), "Differences in Phosphorus and Nitrogen Delivery to The Gulf of Mexico from the Mississippi River Basin." Environmental Science and Technology(42):822-830.
Amos, Adell Louise (2008), "The Importance of Freshwater Conservation in the Context of Energy and Climate Policy: Assessing Progress and Identifying Challenges In the Western United States." Denver Water Law Review 12(1).
AP (2008), "Drought could shut down nuclear power plants." in MSNBC: Associated Press, available at: http://www.msnbc.msn.com/id/22804065.
APS (2010), "About Solana Generating Station." May 27, 2010, available at: http://www.aps.com/main/green/Solana/About.html?source=101.
Australian Government (Prime Minister and Cabinet) (2004), "Securing Australia's Energy Future." ISBN 0 646 43547 7: Australian Government.
Australian Government (Department of Climate Change) (2007), "National Greenhouse and Energy Reporting Act " No. 175.

ENV/EPOC/GSP(2010)21
71
Australian Government (2009), "Key features of the Water Act 2007." July 7, 2010: Department of the Environment, Water, Heritage and the Arts, available at: http://www.environment.gov.au/water/australia/water-act/key-features.html.
Australian Government (2010), "Council of Australian Governments water reform." July 7, 2010, available at: http://www.environment.gov.au/water/australia/coag.html.
AWWARF (1999), "Residential Water Use Summary." January 25, 2009: AWWARF, available at: http://www.aquacraft.com/Publications/resident.htm.
Ayer, N. W. and P. H. Tyedmers (2009), "Assessing alternative aquaculture technologies: life cycle assessment of salmonid culture systems in Canada." Journal of Cleaner Production 17(3):12.
Bacher, John (2000), Petrotyranny. Toronto: Science for Peace.
Baldock, David, et al. (2000). "The Environmental Impacts of Irrigation in the European Union." Institute for European Environmental Policy, Polytechnical University of Madrid, University of Athens.
Barnett, T. P. (2009), "Impacts of a warming climate on water availability in snow-dominated regions." Nature.
Barta, Patrick (2008), "Amid Water Shortage, Australia Looks to the Sea." in Wall Street Journal, available at: http://online.wsj.com/article/SB120518234721525073.html.
Beal, Cara, et al. (2008), "Energy and water metabolism of a sustainable subdivision in southeast QLD: the little toe of the urban ecological footprint?" In Enviro 2008. Melbourne, Australia.
Bene, James, et al. (2007). "Northern Trinity/Woodbine GAM Assessment of Groundwater Use in the Northern Trinity Aquifer Due To Urban Growth and Barnett Shale Development." TWDB Contract Number: 0604830613: Report for the Texas Water Development Board, Contract Number: 0604830613.
Berndes, Goran (2008), "Future Biomass Energy Supply: The Consumptive Water Use Perspective." International Journal of Water Resources Development 24(2):235-345.
Bingaman, Jeff (2010), "S. 1462: American Clean Energy Leadership Act of 2009." March 10, available at: http://www.govtrack.us/congress/bill.xpd?bill=s111-1462.
Burton, Franklin L. (1996). "Water and Wastewater Industries: Characteristics and Energy Management Opportunities." CR-106941: Burton Environmental Engineering, Electric Power Research Institute Community Environmental Center.
Canada, Environment (2010), "Water Governance & Legislation." April 26, available at: http://www.ec.gc.ca/eau-water/default.asp?lang=En&n=E05A7F81-1.
Cardona, E., et al. (2007), "Performance evaluation of CHP hybrid seawater desalination plants." Desalination 205(1-3):1-14.
Cartledge, James (2010), "$3.8bn bid to bring Canadian hydropower to New York." February 24, 2010 in Brighter Energy, available at: http://www.brighterenergy.org/5380/news/marine-hydro/3-8bn-bid-to-bring-canadian-hydropower-to-new-york/.

ENV/EPOC/GSP(2010)21
72
CASLC (2006). "Proposed Resolution by the California State Lands Commission Regarding Once-Through Cooling in California Power Plants." California State Lands Commission.
Charbit, C. and M. Michalun (2009). "Mind the gaps: Managing Mutual Dependence in Relations among Levels of Government." OECD Working Papers on Public Governance, No. 14: © OECD.
Chen, Deh Chien, et al. (2010), "Institutional capacity and policy options for integrated urban water management: a Singapore case study." Water Policy uncorrected proof:1-16.
Chiu, Y. W., et al. (2009), "Water Embodied in Bioethanol in the United States." Environmental Science & Technology 43(8):2688-2692.
CIEAU (2010), "The water needs in France." April 28: Centre d'Information sur l'Eau, available at: http://www.cieau.com/toutpubl/sommaire/texte/6/f61.htm.
Climate Institute (2010), "Israel's Solar Industry: Reclaiming a Legacy of Success." April 26, 2010: Climate Institute, available at: http://www.climate.org/topics/international-action/israel-solar.html.
Committee on America's Energy Future, et al. (2009), America's energy future: technology and transformation. summary Edition: National Academies Press.
de Fraiture, Charlotte, et al. (2008), "Biofuels and implications for agricultural water use: blue impacts of green energy." Water Policy Supplement 1:67-81.
de Paula Gomesa, Marcos Sebastião and Maria Silvia Muylaert de Araújo (2009), "Bio-fuels production and the environmental indicators." Renewable and Sustainable Energy Reviews 13(8):2201-2204.
Deepwater Horizon Unified Command (2010), "Deepwater Horizon Response: The Official site of the Deepwater Horizon Unified Command." May 25, available at: http://www.deepwaterhorizonresponse.com.
DOE (United States Department of Energy) (2006), "Energy Demands on Water Resources: Report to Congress on the Interdependency of Energy and Water."
DOE (2009a). "Concentrating Solar Power Commercial Application Study: Reducing Water Consumption of Concentrating Solar Power Electricity Generation." DOE.
DOE (2009b), "Office of Energy Efficiency and Renewable Energy’s Concentrated Solar Power Program, Thermal Storage " July 20, 2009, available at: http://www1.eere.energy.gov/solar/thermal_storage.html.
DOI (2010), "US Department of Interior website for the Deepwater Horizon Response." May 25, available at: http://www.doi.gov/deepwaterhorizon/.
Donner, Simon (2003), "The impact of cropland cover on river nutrient levels in the Mississippi River Basin." Global Ecology & Biogeography 12:341–355.
Donner, Simon D. and Christopher J. Kucharik (2008), "Corn-based ethanol production compromises goal of reducing nitrogen export by the Mississippi River." Proceedings of the National Academy of Sciences 105(11):4513-4518.

ENV/EPOC/GSP(2010)21
73
Economist (2010), "A change in the climate: Make us greener, oh lord. But not yet " in The Economist Newspaper Limited, available at: http://www.economist.com/node/16009369.
EcoWIN (2010), "Eco-efficient water infrastructure practices in Singapore." April 29, 2010: EcoWIN, United Nations Economic and Social Commission for Asia and the Pacific, available at: http://www.ecowaterinfra.org/knowledgebox/documents/case%20study%20in%20Singapore.pdf.
EIA "International Energy Statistics." April 28, 2010, available at: http://www.eia.doe.gov/emeu/international/contents.html.
EIA (Energy Information Administration of the United States Department of Energy) (2008a), "Annual Energy Review." DOE/EIA-0384 (2008).
EIA (2008b), "International Energy Annual 2006." Energy Information Administration, United States Department of Energy.
EIA (2009a), "Energy Information Administration form 860, Annual Electric Generator Report, Part F: Cooling System Information – Design parameters." available at: http://www.eia.doe.gov/cneaf/electricity/page/eia767.html.
EIA (2009b). "Updated Annual Energy Outlook 2009 Reference Case with ARRA." Supplemental Tables: EIA.
EIA (Energy Information Administration US Department of Energy) (2010), "Annual Energy Outlook 2010 " DOE/EIA-0383(2010).
Eisentraut, Anselm (2010). "Sustainable Production of Sustainable-Generation Biofuels." OECD/EIA.
Environment Canada (Government of Canada) (1987), "Federal Water Policy."
EPA (United States Environmental Protection Agency) (2002), "The Clean Water and Drinking Water Infrastructure Gap Analysis." EPA-816-R-02-020.
EPA (2009), "Introduction to the Clean Water Act: Glossary." available at: http://www.epa.gov/watertrain/cwa/glossary.htm#ps.
EPA (United States Environmental Protection Agency Office of Transportation and Air Quality) (2010a), "EPA Lifecycle Analysis of Greenhouse Gas Emissions from Renewable Fuels." EPA-420-F-10-006.
EPA (United States Environmental Protection Agency Office of Transportation and Air Quality) (2010b), "Regulatory Announcement: EPA Finalizes Regulations for the National Renewable Fuel Standard Program for 2010 and Beyond." EPA-420-F-10-007.
Exloco (2010), "An Interview with Dian Grueneich: Making the Water-Energy Link." In Confluence.
FAO (2009), The state of world fisheries and aquaculture. Rome: Food and Agriculture Organization of the United Nations.
FAO (2010), "Review of global agricultural water use per country." August 22, 2010 in Aquastat: FAO's Information System on Water and Agriculture, available at: http://www.fao.org/nr/water/aquastat/water_use/index6.stm.

ENV/EPOC/GSP(2010)21
74
Fargione, Joseph, et al. (2008), "Land Clearing and the Biofuel Carbon Debt." Science 319:1235.
Farrell, A. E., et al. (2006), "Ethanol can contribute to energy and environmental goals." Science 311(5760):506-508.
Feeley III, Thomas J. , et al. (2008), "Water: A critical resource in the thermoelectric power industry." Energy 33.
Flessner, Dave (2010), "Hot river forces costly cutback for TVA." in ChattanoogaTimes Free Press, available at: http://www.timesfreepress.com/news/2010/aug/23/hot-river-forces-costly-cutback-tva/
GAO (2005). "National Energy Policy: Inventory of Major Federal Energy Programs and Status of Policy Recommendations." GAO-05-379 GAO-05-379: GAO.
GAO (Government Accountability Office) (2009a), "Energy-Water Nexus: Improvements to Federal Water Use Data Would Increase Understanding of Trends in Power Plant Water Use." GAO-1023.
GAO (Government Accountability Office) (2009b), "Energy-Water Nexus: Many Uncertainties Remain about National and Regional Effects of Increased Biofuel Production on Water Resources." GAO-10-1016.
GAO (2009c), "Energy and Water: Preliminary Observations on the Links between Water and Biofuels and Electricity Production." In Testimony Before the Subcommittee on Energy and Environment, Committee on Science and Technology, House of Representatives. Washington DC.
GAO (Government Accountability Office) (2009d), "Energy and Water: Preliminary Observations on the Links between Water and Biofuels and Electricity Production." GAO-09-862T.
Gerbens-Leenes, Winnie, et al. (2009), "The water footprint of bioenergy." Proceedings of the National Academy of Sciences 106(25):10219-10223.
Gleick, P. H. and H. S. Cooley (2009), "Energy implications of bottled water." Environmental Research Letters 4(014009):6.
Gleick, Peter (1994), "Water and Energy." Annual Review of Energy and the Environment 19:33.
Goldstein, R. and W. Smith (2002). "Water & Sustainability (Volume 4): U.S. Electricity Consumption for Water Supply & Treatment - The Next Half Century." 1006787: Electric Power Research Institute.
Government of Alberta Canada (2009). "Environmental Management of Alberta's Oil Sands." Government of Alberta, Canada.
Government of Brazil (2008). "National Plan on Climate Change: Executive Summary." Interministerial Committee on Climate Change. Decree No. 6263 of November 21, 2007.
Graham, Sarah (2003), "Environmental Effects of Exxon Valdez Spill Still Being Felt." in Scientific American, available at: http://www.scientificamerican.com/article.cfm?id=environmental-effects-of.
Grossman, Gershon (2007), "Renewable Energy Policies in Israel." In Handbook of Energy Efficiency and Renewable Energy, eds. Frank Kreith and D. Yogi Goswami. Boca Raton, FL: CRC Press, Taylor and Francis Group.

ENV/EPOC/GSP(2010)21
75
Guha, Mohua and Kamla Gupta (2007), "Water Resources in India: Critical Issues Related to Availability and Sustainable Use." IASSI Quarterly 25(3):85-97.
Harte, John and Mohamed El-Gasseir (1978), "Energy and Water." Science 199(February 10):623-634.
Hawaii (2010), "Hawaii Revised Statutes Chapter 196 (Energy Resources), Section 6.5: Solar water heater system required for new single-family residential construction." August 20, available at: http://capitol.hawaii.gov/hrscurrent/Vol03_Ch0121-0200D/HRS0196/HRS_0196-0006_0005.htm.
Hellegersa, Petra, et al. (2008), "Interactions between water, energy, food and environment: evolving perspectives and policy issues." Water Policy 10(S1):1-10.
Hewlett and Energy Foundation (2003). "The Last Straw: Water Use by Power Plants in the Arid West."
Hightower, Mike and Suzanne A. Pierce (2008), "The energy challenge." Nature 452(7185):pp. 285-286.
Hoekstra, Arjen Y., et al. (2009), Water Footprint Manual - State of the Art 2009: Water Footprint Network.
Howard, John (2004). "Securing Australia's Energy Future." Australian Government.
IEA (2010), "International Energy Agency webpage for Member Countries." July 7, available at: http://www.iea.org/country/index.asp.
IEC (2010). "The Israel Electric Corporation Ltd.: Investor Update Presentation." Israel Electric Corporation, Ltd.
IPCC (2007), "Climate change 2007: Mitigation. Contribution of Workding group III to the Fourth Assessment Report of the Intergovernmental Panel on Climate Change." eds. B Metz, et al. Cambridge, United Kingdom and New York, NY, USA: Cambridge University Press.
Jackson, Robert B., et al. (2001), "Water in a Changing World." Ecological Applications 11(4):1027-1045.
Jefferson, B., et al. (1999), "Technologies for domestic wastewater recycling." Urban Water 1(4):285-292.
Keeny, D. and M. Muller (2006). "Water use by ethanol plants: potential challenges." The Institute for Agriculture and Trade Policy.
Kelly, Erin N., et al. (2009), "Oil sands development contributes polycyclic aromatic compounds to the Athabasca River and its tributaries." Proceedings of the National Academy of Sciences 106(2):22346-22351.
Kenny, J.F., et al. (2009). "Estimated use of water in the United States in 2005." Circular 1344 Circular 1344: U.S. Geological Survey.
King, C. W. and M. E. Webber (2008), "Water Intensity of Transportation." Environmental Science & Technology 42(21):7866-7872.

ENV/EPOC/GSP(2010)21
76
King, Carey W., et al. (2008a). "Water Demand Projections for Power Generation in Texas." Report prepared for the Texas Water Development Board contract No. 0704830756.
King, Carey W., et al. (2008b), "Thirst for energy." Nature Geoscience 1(5):283-286.
Klein, Gary, et al. (2005). "California's Water - Energy Relationship, Report CEC-700-2005-011-SF." CEC-700-2005-011-SF: California Energy Commission.
Kumara, Atul and Tara C. Kandpalb (2007), "Renewable energy technologies for irrigation water pumping in India: A preliminary attempt towards potential estimation " Energy 32(5):861-870.
Kutscher, Chuck , et al. (2006), "Hybrid Wet/Dry Cooling for Power Plants." In Parabolic Trough Technology Workshop. Incline Village, NV: NREL.
Lapolaa, David M., et al. (2009), "Modeling the land requirements and potential productivity of sugarcane and jatropha in Brazil and India using the LPJmL dynamic global vegetation model." Biomass and Bioenergy 33(8):1087-1095.
Larson, Dana , et al. (2007), "California's Energy-Water Nexus: Water Use in Electricity Generation." Southwest Hydrology.
Lattemann, Sabine and Thomas Hopner (2008), "Environmental impact and impact assessment of seawater desalination." Desalination 220(1-3):1-15.
LeGrow, John (2010), "SAGD Water and Natural Gas Use per Conoco Phillips." ed. Carey King.
Leitner, Arnold ed (2002), Fuel from the Sky: Solar Power’s Potential for Western Energy Supply. Boulder, CO: NREL.
Li, Fangyue, et al. (2009), "Review of the technological approaches for grey water treatment and reuses." Science of the Total Environment 407(11):3439-3449.
MAAP (2010), "Water Control." April 28, 2010: Ministère de l’Alimentation de l’Agriculture et de la Pêche, available at: http://agriculture.gouv.fr/sections/thematiques/environnement/maitrise-de-l-eau.
Macedo, I. C., et al. (2008), "Green house gases emissions in the production and use of ethanol from sugarcane in Brazil: The 2005/2006 averages and a prediction for 2020." Biomass & Bioenergy 32(7):582-595.
Manuel, John (2008), "Drought in the southeast: lessons for water management." Environmental Health Perspectives 116(4):A168-A171.
Martines-Filho, Joao , et al. (2006), "Bioenergy and the Rise of Sugarcane-Based Ethanol in Brazil." Choices: The magazine of food, farm, and resource issues 21(2).
McCornick, Peter G., et al. (2008), "Water–food–energy–environment synergies and tradeoffs: major issues and case studies." Water Policy 10(S1):23-36.
McLaughlin, S.B. and M.E. Walsh (1997), "Evaluating Environmental Consequences of Producing Herbaceous Crops for Bioenergy." Biomass and Bioenergy 14(4):317-324.

ENV/EPOC/GSP(2010)21
77
MEEDDM (2010), "Electricity production." April 28, 2010: Ministère de l’Ècologie, de Ènergie, du Dèveloppement durable et de la Mer, available at: http://www.developpement-durable.gouv.fr/La-production-d-electricite.html.
MEWR (2010a), "Policies: Conserve, Value and Enjoy." April 29, 2010: Singapore Government Ministry of the Environment and Water Resources, available at: http://app.mewr.gov.sg/web/Contents/Contents.aspx?ContId=961.
MEWR (2010b), "Policies: Energy/Climate Change." April 29, 2010: Singapore Government Ministry of the Environment and Water Resources, available at: http://app.mewr.gov.sg/web/Contents/Contents.aspx?ContId=73.
Mitsch, William J., et al. (2001), "Reducing Nitrogen Loading to the Gulf of Mexico from the Mississippi River Basin: Strategies to Counter a Persistent Ecological Problem." BioScience 51(5):373-388.
Morgan, M. Granger and Virginia Dale (2007). "Hypoxia in the Northern Gulf of Mexico: An Update by the EPA Science Advisory Board." EPA-SAB-08-003: U.S. Environmental Protection Agency Science Advisory Board.
NAS (2010), Real prospects for energy efficiency in the United States: National Academies Press.
Natural Resources Defense Council (2004). "Energy Down the Drain: The Hidden Costs of California’s Water Supply." <http://www.nrdc.org/water/conservation/edrain/edrain.pdf>: Natural Resources Defense Council.
NETL (2008). "Estimating Freshwater Needs to Meet Future Thermoelectric Generation Requirements." DOE/NETL-400/2008/1339.
NOAA (National Oceanic and Atmospheric Administration) (2009), "Global Climate Change Impacts in the United States."
NREL (2010). "Property-Assessed Clean Energy (PACE) Financing of Renewables and Efficiency, Fact Sheet Series on Financing Renewable Energy Projects, report NREL/BR-6A2-47097." NREL/BR-6A2-47097: National Renewable Energy Laboratory.
NWC (2010), "National Water Initiative objectives." July 7, 2010: National Water Commision of Australian Government,, available at: http://www.nwc.gov.au/www/html/672-objectives-key-elements.asp.
OECD (2009). "Policy Brief: Bridging the gaps between levels of government." © OECD.
OECD (2010a), "Chapter 3: The Environmental Performance of Agriculture." In OECD Review of Agricultural Policies: Israel 2010, ed. OECD: OECD.
OECD (2010b), Pricing Water Resources and Water and Sanitation Services.
OECD (2010c), "Results of the OECD Survey on Water Governance (2009-2010)." ed. Aziza Akhmouch. Paris, France: OECD.
OECD (2010d), Sustainable Management of Water Resources in Agriculture.

ENV/EPOC/GSP(2010)21
78
OECD/IEA (2003). "From oil crisis to climate challenge: Understanding CO2 emissions trends in IEA countries." International Energy Agency.
Oki, Taikan and Shinjiro Kanae (2006), "Global Hydrological Cycles and World Water Resources " Science 313(5790):1068-1072.
Onn, Lee Poh (2005). "Water Management Issues in Singapore." Institute of Southeast Asian Studies, available at: http://www.khmerstudies.org/events/Water/Lee%20Nov%202005.pdf.
Otterpohl, Ralf, et al. (1999), "Source Control in Urban Sanitation and Waste Management: Ten Systems with Reuse of Resources." Water Science and Technology 39(5):153-160.
Ottoson, Jakob and Thor Axel Stenstrom (2003), "Faecal contamination of greywater and associated microbiological risks." Water Research 37(3):645-655.
Owen, James (2010), "World's Largest Dead Zone Suffocating Sea " in National Geographic News, available March 25, 2010 at.
Parris, Kevin (2008). "Implication of Higher Energy Price for Water Use in Agricultural (Unpublished)." OECD.
Parris, Kevin (2010). "Sustainable Management of Water Resources in Agriculture." ISBN 978-92-64-08357-8 ISBN 978-92-64-08357-8: OECD.
Peachey, Bruce (2005). "Strategic Needs for Energy Related Water Use Technologies: Water and the EnergyINet." New Paradigm Engineering, Ltd.
Pimentel, D., et al. (2007), "Ethanol production: Energy, economic, and environmental losses." In Reviews of Environmental Contamination and Toxicology, Vol 189. New York: Springer.
Pimentel, David and Tad W. Patzek (2005), "Ethanol Production Using Corn, Switchgrass, and Wood; Biodiesel Production Using Soybean and Sunflower." Natural Resources Research 14(1).
PUB (2010), "NEWater: The 3rd National Tap." April 20, 2010: Public Utilities Board of the Singapore Government,, available at: http://www.pub.gov.sg/water/Pages/NEWater.aspx.
Rabalais, Nancy N., et al. (2002), "Beyond Science into Policy: Gulf of Mexico Hypoxia and the Mississippi River." BioScience 52(2):129-142.
Reynaud, Arnaud (2007). "Social policies and private sector participation in water supply - the case of France." United Nations Research Institute for Social Development.
Roberts, Greg (2007), "Blackouts on way as power plants dry up." in The Australian (http://www.theaustralian.com.au/news/blackouts-on-way-as-power-plants-dry-up/story-e6frg6oo-1111113123985), available at: http://www.theaustralian.com.au/news/blackouts-on-way-as-power-plants-dry-up/story-e6frg6oo-1111113123985
Rodell, Matthew, et al. (2009), "Satellite-based estimates of groundwater depletion in India." Nature 460(7258):999-1002.
Salibya, El , et al. (2009), "Desalination plants in Australia, review and facts." Desalination 247(1):1-14.

ENV/EPOC/GSP(2010)21
79
Schnoor, Jerald L., et al. (2008). "Water Implications of Biofuels Production in the United States." National Research Council of the National Academies.
Searchinger, Timothy D., et al. (2009), "Fixing a Critical Climate Accounting Error." Science 326(5952):527-528.
Searchinger, Timothy D., et al. (2008), "Use of U.S. Croplands for Biofuels Increases Greenhouse Gases Through Emissions from Land-Use Change." Science 319:1238.
Shaha, Tushaar, et al. (2009), "Is Irrigation Water Free? A Reality Check in the Indo-Gangetic Basin " World Development 37(2):422-434.
Simpson, Thomas W., et al. (2008), "The New Gold Rush: Fueling Ethanol Production while Protecting Water Quality." J Environ Qual 37(2):318-324.
Smil, Vaclav (2008), Energy in Nature and Society: General Energetics of Complex Systems. Cambridge, Mass.: The MIT Press.
Soeder, Daniel J. and William M. Kappel (2009). "Water Resources and Natural Gas Production from the Marcellus Shale." USGS.
Solley, Wayne B., et al. (1998). "Estimated Use of Water in the United States in 1995." Circular 1200: US Geological Survey.
SPG Media Water Technology (2009), "Perth Seawater Desalination Plant, Seawater Reverse Osmosis (SWRO), Kwinana, Australia." March 11, 2009: SPG Media Water Technology, available at: http://www.water-technology.net/projects/perth/.
Statistics Singapore (2010), "Yearbook of Statistics Singapore, 2009 " June 30, 2010, available at: http://www.singstat.gov.sg/pubn/reference/yos09/statsT-miscellaneous.pdf.
Sternberg, R. (2010), "Hydropower’s future, the environment, and global electricity systems." Renewable and Sustainable Energy Reviews 14:713–723.
Stillwell, Ashlynn S., et al. (2010), "Energy Recovery from Wastewater Treatment Plants in the United States: A Case Study of the Energy-Water Nexus." Sustainability 2(4):945-962.
Stillwell, Ashlynn S., et al. (2009). "Energy-Water Nexus in Texas." University of Texas at Austin, Environmental Defense Fund.
Stillwell, Ashlynn S. and Michael E. Webber (2010), "Water Conservation and Reuse: A Case Study of the Energy-Water Nexus in Texas." In World Environmental and Water Resources Congress. Providence, RI.
Sturdivant, Allen W., et al. (2007), "Economic Costs of Desalination in South Texas: A Case Study." Journal of Contemporary Water Research & Education(137):21-39.
Sweet, Cassandra (2010), "California Rules Restrict Power Plants' Marine Water Use " in Wallstreet Journal: Dow Jones & Company, Inc., available at: http://online.wsj.com/article/NA_WSJ_PUB:SB10001424052748703961104575226041502104432.html.

ENV/EPOC/GSP(2010)21
80
Tadros, Edmund and Brian Robins (2008), "Wind farm vow to power desalination." In The Sydney Morning Herald. Sydney, Australia.
Tal, Alon and Abed Rabbo (eds.) (2010), Water Wisdom: Preparing the Groundwork for Cooperative and Sustainable Water Management in the Middle East: Rutgers University Press.
TAMU (2010), "Texas Water Law." August 19: Texas A&M AgriLIFE, available at: http://texaswater.tamu.edu/waterlaw.texas.htm.
Tchobanoglous, George and Edward D. Schroeder (1987), Water Quality: Characteristics, Modeling, Modification. Reading, MA: Addison Wesley Longman.
Texas, State of (1997), "Senate Bill 1 (accessed August 20, 2010 at http://www.capitol.state.tx.us/tlodocs/75R/billtext/html/SB00001F.htm)." ed. 75th Legislature of the State of Texas.
Torcellini, P. , et al. (2003). "Consumptive Water Use for U.S. Power Production." NREL/TP-550-33905: NREL.
Trieb, Franz and Muller-Steinhagen (2008), "Concentrating solar power for seawater desalination in the Middle East and North Africa." Desalination 220(1-2):165-183.
TWDB (2003). "Brackish Groundwater Manual for Texas Regional Water Planning Groups." Texas Water Development Board, LBG-Guyton Associates.
Twomey, Kelly M., et al. (2010), "The unintended energy impacts of increased nitrate contamination from biofuels production." Journal of Environmental Monitoring 12(1):218-224.
Twomey, Kelly and Ashlynn Stillwell (2009). "Electricity Generation: Water Resource Challenges and Opportunities." CRS.
UK Telegraph (2009), "Australia's carbon emissions trading scheme falls victim to recession " in telegraph.co.uk, available at: http://www.telegraph.co.uk/finance/financetopics/recession/5270933/Australias-carbon-emissions-trading-scheme-falls-victim-to-recession.html.
UNEP (1997). "Source Book of Alternative Technologies for Freshwater Augmentation in Latin America and the Caribbean." United Nations Environmental Programme International Environmental Technology Centre.
USDA (National Agriculture Statistics Service United States Department of Agriculture) (1999), "1997 Census of Agriculture: Farm and Ranch Irrigation Survey (1998), Volume 3, Special Studies, Part 1." AC97-SP-1.
USDA (National Agriculture Statistics Service United States Department of Agriculture) (2004), "2002 Census of Agriculture: Farm and Ranch Irrigation Survey (2003), Volume 3, Special Studies, Part 1." AC-02-SS-1.
Van der Bruggen, Bart and Carlo Vandecasteele (2002), "Distillation vs. membrane filtration: overview of process evolutions in seawater." Desalination 143(3):207-218.
Veil, J.A. , et al. (2009), "Water Issues Relating to Heavy Oil Production." Society of Petroleum Engineers.

ENV/EPOC/GSP(2010)21
81
Wald, Matthew (2010), "Vermont Senate Votes to Close Nuclear Plant." A14 in New York Times, available at: http://www.nytimes.com/2010/02/25/us/25nuke.html?_r=1&pagewanted=1.
Walton, Brett (2010), "The Price of Water: A Comparison of Water Rates, Usage in 30 U.S. Cities." July 1, 2010: Circle of Blue Water News, available at: http://www.circleofblue.org/waternews/2010/world/the-price-of-water-a-comparison-of-water-rates-usage-in-30-u-s-cities/.
Ward, Frank A. and Manuel Pulido-Velazquez (2008), "Water conservation in irrigation can increase water use." Proceedings of the National Academy of Sciences 105(47):18215-18220.
Water Economy (2010), "Water management in France." April 28, 2010: Water Economy, available at: http://www.waternunc.com/gb/ageau2gb.htm.
Webb, Erik K. and Johnson Joshua (2009), "Federal Engagement in Water Resource Technology Development: Current Programs and the Future." Journal of Contemporary: Water Research and Education 143.
Whittington, Ruth (2007), "Hydro and the CDM: The role of hydroelectricity in meeting Kyoto obligations " Refocus 9(1):54-59.
WIRADA (2009). "Water Information Research and Development Alliance." CISIRO.
WNA (2010). "Australia's Electricity." World Nuclear Association.
Wu, M., et al. (2009), "Water Consumption in the Production of Ethanol and Petroleum Gasoline." Environmental Management.
Young, Michael (2010). "Environmental Effectiveness and Economic Efficiency of Water Use in Agriculture: The Experience of and Lessons from the Australian Water Reform Programme." OECD.