Envecon 2010: Applied Environmental Economics Conference
29
1 Envecon 2010: Applied Environmental Economics Conference Hydrological modelling of water allocation, ecosystem services and poverty alleviation in the Pongola Floodplain, South Africa By B. Lankford (1), C. Pringle (2), C. Dickens (2), F. Lewis (2), M. Mander (3), V.Chhotray (1), M. Goulden (2), Z. Nxele (1) and L. Quayle (1). 1). School of International Development, University of East Anglia, 2). Institute of Natural Resources, South Africa 3). Eco-Futures South Africa. Contact [email protected] Abstract The Pongola River Ecosystem Services for Poverty Alleviation (PRESPA) project was a joint study undertaken by the Institute of Natural Resources (South Africa) and the University of East Anglia (United Kingdom). PRESPA, a NERC-funded one-year project, quantified the economic benefits accruing to different livelihood sectors underpinned by the water resources of the Pongola Floodplain, South Africa. The Pongola Floodplain system is recognised for its diverse economy and ecology which is supported by flood events that used to be naturally occurring but are now artificially managed following the completion of the Pongalapoort Dam in 1972. PRESPA modelled provisioning services provided by river eco-hydrology to determine how these might be purposively managed to alleviate poverty. PRESPA built an Excel model to quantify the economic value of the available water of the river hydrograph (blue water) to various sectors that consume water, and then determined the fraction of that value accruing to the poorest individuals and communities within each of the sectors. This model allowed the exploration of three development scenarios of the floodplain to explore trade-offs and outcomes of 1) a status quo, ‘unstructured’ economy; b) the move to a structured ‘single sector’ agricultural economy that dominates the floodplain use of water; and 3) a move to a structured diverse (balanced) economy where water and land is used to provide ecosystem services that underpin the on-going use of natural resources to support livelihoods. This model gives decision-makers a measure of where water is best used in terms of poverty alleviation, and how the Pongola Floodplain has changed in this respect over time. In summary, poor households on the Floodplain currently have a diversity of income and food sources, making them less vulnerable to economic and climate shocks. Current trends indicate household economies are increasingly moving towards intensive agriculture which can deliver relatively higher returns per hectare but with greater costs and risks. The risks of climate shocks is one particular example; an extreme flood down the river (greater than 150 cumecs) will damage agricultural infrastructure that has encroaches onto the floodplain and becomes accustomed to the cessation of managed flood events. In such an event, reduced resilience by the community to respond to floods may place higher costs on external government agencies. Thus increasing agricultural development is likely to increase incomes to households, but lead to both higher costs and greater vulnerability in the face of climate variability, which as the hydrological record shows, must be an expected characteristic of this part of Southern Africa. Introduction - ecosystem services and poverty concepts The well-being of present and future generations depends on access to and the availability of ecosystem services. The Millennium Ecosystem Assessment (MEA, 2005) have crystallized thinking on the concept of ecosystem services in order to gauge the state of the world’s ecosystems in
Transcript of Envecon 2010: Applied Environmental Economics Conference

1
Envecon 2010: Applied Environmental Economics Conference Hydrological modelling of water allocation, ecosystem services and poverty alleviation in the Pongola Floodplain, South Africa
By B. Lankford (1), C. Pringle (2), C. Dickens (2), F. Lewis (2), M. Mander (3), V.Chhotray (1), M. Goulden (2), Z. Nxele (1) and L. Quayle (1). 1). School of International Development, University of East Anglia, 2). Institute of Natural Resources, South Africa 3). Eco-Futures South Africa. Contact [email protected] Abstract
The Pongola River Ecosystem Services for Poverty Alleviation (PRESPA) project was a joint study undertaken by the Institute of Natural Resources (South Africa) and the University of East Anglia (United Kingdom). PRESPA, a NERC-funded one-year project, quantified the economic benefits accruing to different livelihood sectors underpinned by the water resources of the Pongola Floodplain, South Africa. The Pongola Floodplain system is recognised for its diverse economy and ecology which is supported by flood events that used to be naturally occurring but are now artificially managed following the completion of the Pongalapoort Dam in 1972. PRESPA modelled provisioning services provided by river eco-hydrology to determine how these might be purposively managed to alleviate poverty. PRESPA built an Excel model to quantify the economic value of the available water of the river hydrograph (blue water) to various sectors that consume water, and then determined the fraction of that value accruing to the poorest individuals and communities within each of the sectors. This model allowed the exploration of three development scenarios of the floodplain to explore trade-offs and outcomes of 1) a status quo, ‘unstructured’ economy; b) the move to a structured ‘single sector’ agricultural economy that dominates the floodplain use of water; and 3) a move to a structured diverse (balanced) economy where water and land is used to provide ecosystem services that underpin the on-going use of natural resources to support livelihoods. This model gives decision-makers a measure of where water is best used in terms of poverty alleviation, and how the Pongola Floodplain has changed in this respect over time. In summary, poor households on the Floodplain currently have a diversity of income and food sources, making them less vulnerable to economic and climate shocks. Current trends indicate household economies are increasingly moving towards intensive agriculture which can deliver relatively higher returns per hectare but with greater costs and risks. The risks of climate shocks is one particular example; an extreme flood down the river (greater than 150 cumecs) will damage agricultural infrastructure that has encroaches onto the floodplain and becomes accustomed to the cessation of managed flood events. In such an event, reduced resilience by the community to respond to floods may place higher costs on external government agencies. Thus increasing agricultural development is likely to increase incomes to households, but lead to both higher costs and greater vulnerability in the face of climate variability, which as the hydrological record shows, must be an expected characteristic of this part of Southern Africa. Introduction - ecosystem services and poverty concepts The well-being of present and future generations depends on access to and the availability of ecosystem services. The Millennium Ecosystem Assessment (MEA, 2005) have crystallized thinking on the concept of ecosystem services in order to gauge the state of the world’s ecosystems in

2
relation to humankind at the turn of the millennium, and by so doing took stock of where we are as a species and how things look for the future. One of the important contributions of the MEA Report has been to re-define the concept of ecosystem services in a way that is useful and intelligible. “Ecosystem services are the benefits people obtain from ecosystems. These include provisioning services such as food, water, timber, and fibre; regulating services that affect climate, floods, disease, wastes, and water quality; cultural services that provide recreational, aesthetic, and spiritual benefits; and supporting services such as soil formation, photosynthesis, and nutrient cycling” (Figure 1). Ecosystems provide not only the basic materials including food, that society needs to survive, but they also foster less obvious measures such as health, good social relations, security, well-being and the freedom to decide on our own lives.
Figure 1. Linkages between ecosystem services and human well-being (Millennium Ecosystem Assessment, 2005)
In order to achieve social and economic development goals, ecosystem users and managers often make trade-offs between the available services (Rodriguez, 2005), particularly as the use of resources has begun to outstrip their supply. Managers thus need to make decisions between different services, whether to reap benefits now or retain them for future use and how to meet the needs of both ecosystems and society (Bohensky et al., 2004). A trade-off occurs when the provision of one ecosystem service increases at the expense of another. In our research while we are mostly concerned with trade-offs between provisioning services afforded by water, we should recognise this is within a broader societal preferences for provisioning services, followed by regulating, cultural and supporting services (Rodriguez, 2006). This hierarchical system of preference is linked to the short term needs of individuals and communities and has consequent impacts on human well-being. Decisions regarding trade-offs are complicated by the perceived value of ecosystem services by different stakeholder groups. For example an upstream industry may value a river system as a conduit to carry away waste while downstream users enjoy the same system for recreational purposes (Bohensky et al., 2004). Furthermore, supporting and regulatory services are often ignored by policy makers as they depend on slowly changing factors which are difficult to quantify and monitor. The lack of attention afforded to regulatory and supporting services may result in a lack of

3
resilience and render socio-ecological systems more vulnerable to environmental change. Identifying trade-offs enables decision-makers to understand the consequences of favouring one ecosystem service over another which is essential if ecosystems services are to be managed to maximise human well-being (Rodriquez, 2005). Case study – the Pongola river ecosystem The Pongola River, with a catchment of 7000 km2, descends steeply from its source at 2200 metres above mean sea level and passes through a narrow gorge in between the Lebombo and Ubombo mountain ranges, where the Poongolapoort Dam is now situated. Below the Dam the river flows into a floodplain through which it takes a meandering course due to the gentle slope of the land (1:3000, Breen et al., 1998; Heeg & Breen, 1994) with numerous pans which are dependent upon the periodic flooding and inundation by the river (Heeg & Breen, 1982). The floodplain extends for approximately 50 km in length varying in width between 0.8 and 4.8 km (see Figure 2) to the confluence of the Pongola and Usutu Rivers, on the border with Mozambique.
Figure 2. Map of the Pongola River study site
For the purposes of the study, we identified eight sectors/users (Figure 3); Urban water use in the main town of Jozini; tourism around the dam; Mkuze sugarcane farms (private sector farming); Makhathini smallholder irrigation system with mixed cropping; the potential implementation of an agricultural project around sugarcane (given here the title ‘agric cash masterplan’; mixed cropping on the floodplain via informal agriculture; natural resources and fishing; and livestock/cattle-keeping. The latter four are on the floodplain.

4
Figure 3. Schematic of Pongola floodplain showing eight users (including the dam)
The floodplain is located in a warm to hot, humid subtropical climatic region (Schulze, 1965) with most rainfall falling in the summer months (January to March) and a drier winter period (June to August). Climatic data from the Makhathini Agricultural Research Station, adjacent to the floodplain, show a variation in mean monthly temperature from 16.6 ˚C in June to 26.8 ˚C in January, for the period 1966 to 1975. Jaganyi et al. (2008) analysed rainfall data for the area downstream of the Pongolapoort Dam for the period 1962-2004 and calculated a mean annual rainfall of 690 mm (with a maximum of 1341 mm and a minimum of 376.3). Heeg & Breen (1982) used a 47 year data set of river flow measurements upstream of the Dam location to estimate the median annual river flow prior to the dam as 1025 million m3 with the flow in 50% of the years likely to be between 690 million m3/yr and 1360 million m3/yr. Pitman and Weiss (1979) estimated the mean annual runoff in the Pongola floodplain to have been 1070 million m3 from the mid and upper catchment (Jaganyi et al., 2008). The majority of the flow (70%) was expected during November to March. Since the building of the Pongolapoort dam between 1963 and 1976 the hydrology of the flood plain has been controlled by releases from the dam. These have varied over time according to changing management of the dam. Jaganyi et al. (2008) showed that flows downstream of the dam have reduced in overall volume, changed with respect to the timing of periods of high and low flow and become more stable than natural flows (i.e. less peaks, a more constant flow and then sudden stop to the flow). Streamflows from the mid and upper Pongola catchment into the dam have also altered since the dam was built. Jaganyi et al. (2008) suggest that upstream developments, such as the Bivane Dam built in 1995 and the Impala irrigation scheme, have been responsible for reduced flows into the dam. The floodplain system is located in the extremely poor Umkhanyakude District and stretches into southern Mozambique. There is a 53% unemployment rate in the South African portion, compared

5
to a 37% national average, and there are few employment opportunities. Forty-eight percent of households engage in field crop farming and more than half the households in the district lack clean water and sanitation facilities (Pschorn-Strauss, 2005). There is a high incidence of disease: the District is known for having the highest incidence of malaria in the country, there are cholera outbreaks from time to time and more than 30% of the population is infected with HIV (DPLG, 2005). The majority (upward of 80%) of the people are also infected with Schistosomiasis parasites. These poverty levels are also illustrated by the very high dependence by households on social welfare grants from the State, with approximately 64% of the households depending on social grants for 50% or more of the household income (PRESPA Household Survey); 34% households receive state pensions; 92% households receive child support grants, and; 12% households receive other welfare grants (e.g. disability, illness). As many as 42% of the households have to rely on unsafe water sources for meeting domestic water needs, which has severe heath implications. Up to 25% of the people have never accessed education services and therefore are severely disadvantaged in terms of access to information. According to Heeg & Breen (1994) “the Pongolo floodplain, as a natural ecosystem, is unique in the Republic of South Africa. Its biota, which includes tropical and other rare species, is adapted to changing floodplain water levels. Productivity of the whole system depends upon the annual summer floods.” (See also McCartney et al, 2003). Prior to the building of the Poongolapoort Dam between 1963 and 1973 the natural flooding regime governed many of the characteristics of the floodplain including the presence of the floodplain pans and the biodiverse ecosystems and the patterns of land use of the communities living adjacent to the floodplain. The Thonga people, who have made the floodplain their home, have been cultivating the enriched soils that were exposed once flood waters had receded and harvesting fish, reeds and other floodplain resources for thousands of years (Heeg & Breen, 1994). People living on the floodplain have over the years have reported enormous changes to the ecosystem services due to the upstream construction of the Pongolapoort Dam (Heeg & Breen, 1982; Jaganyi et al., 2008). The needs of agricultural production have been key drivers in the timing and management of flood releases. The resultant changes in the natural flooding regime appear to have had a consequent impact on the various provisioning, regulatory, supporting and cultural services previously available to downstream communities. Changes in these services are evident in the examples given in Table 1. Table 1. Examples of changes in ecosystem services on the Pongola Floodplain
Supporting
Acacia xanthophloea is disappearing from the Pongola system below the Pongolapoort Dam as a result of mis-timed floods (Furness, 1978). The direct loss of annual silt and nutrient replenishment as a result of the Dam is believed to have contributed to loss of fertility of previously productive floodplain soils.
Regulating
Although the availability of water is now regulated by the Dam, this has had a consequent impact on the ability of the system to control disease. Lack of water supply to the floodplain following the construction of the dam lead to an outbreak of Typhoid in the local community (Hirji et al., 2002).
Provisioning
The spawning of several species of fish is entirely dependent on flooding of the system. Changes in the timing of floods as a result of the dam coupled with over-fishing, has resulted in a decrease in fish stocks and consequent loss of this food resource.
Cultural
Traditional practices such as communal fishing drives, which are important community building activities, have decreased as a result of changes in the timing of floods and reduction in flows which have, together with over-fishing, resulted in a deterioration of fish stocks.
The construction of the dam itself was a step towards supporting the agricultural potential of the adjacent Makhathini Flats. During the depression of the 1930’s, a government irrigation settlement,

6
comprising 159 plots and a total area of 6189 ha (today the town of Pongola), was established. Water for irrigation was supplied via canal or direct extraction from the river. A sugar mill was constructed in 1954. By 1955, plans were well underway for the construction of the Pongolapoort Dam. The primary purpose of the dam was to control floods and provide an assured supply of water for irrigation to approximately 40 000 ha of land adjacent to the floodplain (Breen et al., 1998). It was also intended that white farmers would open up the frontiers with Mozambique and Swaziland. Today only about 3000 ha of irrigation has been created – and mostly for black farmers (van Vuuren, 2009). Subsistence agriculture, and increasingly crops grown for sale, have remained an important use of the floodplain. Abstractions of water from the river downstream of the dam and from the floodplain pans using engine pumps for the purposes of localised irrigation are likely to have increased in recent years, although these are unmetered so it is not possible to estimate the volume of water used (Jaganyi et al., 2008). Concerted and innovative research (by Charles Breen and Jan Heeg at the University of Natal in the 1970s) led to the recognition that floodplain ecosystems services were significant, and indeed of ‘greater economic and social benefit than if the water were used to grow sugarcane under irrigation’ (van Vuuren, 2009). This produced the initial impetus for regulating dam releases in a manner that would simulate the natural flow regime with the aim of preserving the integrity of the floodplain ecosystem. Yet between 1973 and 1987 the Department of Water Affairs (DWA) (formerly the Department of Water Affairs and Forestry) operated the dam without any consultation of stakeholders. In the late 1970s the Co-operative Scientific Programme funded social, ecological and hydrological scientists to undertake a study to gain insight into the social-ecological relationships of the Pongola system. The scientists proposed a flood regime aimed at maintaining ecological services but having a minimal effect on the irrigation potential. In an effort to meet both the requirements of local users and Mozambique, winter flows were set at around 2 m3/s (van Vuuren, 2009). Periodic increases in flows (approximately 80 m3/s) were proposed for early summer (November to January) to flush out saline water in the majority of the pans and also replenish water for use by people and livestock at the end of the dry winter. A second larger release (600-800 m3/s) was suggested for February which would provide the trigger for fish migration and breeding and increase plant growth as the water receded thereby providing grazing in the winter months (van Vuuren, 2009).
Methodology Scenarios for the future of the Pongola floodplain At the heart of our approach to explore trade-offs between different sectors is the categorisation of input variables into three diverse scenarios. These possibilities rendered the different options for future management rather stark and in this way served to focus the mind towards making decisions regarding resources and people. Scenario for an Unstructured Diversified Economy This is the scenario where a governance vacuum allows conditions to deteriorate and where there is no system to coordinate diverse and often conflicting needs and ambitions of local users, favouring particularly the rural elite who hold more power and influence. Low governance levels on the floodplain could mean a variety of things, but certainly poor and unreasonable regulation of the releases from the upstream dam would be a major feature. The probable elimination of the main summer flood and the short durations of flooding (floods would be seen as a problem), would mean that there would be a general decline in the productivity of the floodplain with a depletion of the fertility of the soil and consequent loss of resource quality. Furthermore, utilization of floodplain

7
resources and the spatial distribution of settlements and agriculture on the floodplain would also contribute to degradation of the floodplain if not regulated. Unnatural and poorly controlled flood management would translate into stress on secondary producers. For example, it is probable that the pans would not be properly flushed and maintained, resulting in marked changes to the habitat in particular the water quality which would be inclined to become saline due to groundwater intrusions. The inhabitants in the pans would reflect this change, and could either become dominated by salt tolerant species or, if the water remained fresh enough, dominated by hardier species. As a result of the harsh and unnatural conditions, coupled with unregulated harvesting, diversity of most plants and animals would diminish and a few hardy species would become dominant e.g. water lilies would cover the surface of the pans. Particularly hard hit would be the diverse fish populations, where conditions would be unfavourable for breeding and success. Probably only a few hardy species such as Clarias and Tilapia would thrive. Scenario for a Structured Diversified Economy This scenario includes a combination of agricultural development on and off the floodplain, while maintaining and conserving the floodplain ecosystem and the attendant ecosystem services. There would be a mixture of the traditional and subsistence way of life together with patches of commercial agriculture using the most productive land. A well constituted and cooperative governance system would be applied to ensure the balance between the diverse land and resource use activities on and off the floodplain remain in balance. This scenario is likely to see coordinated and controlled releases of water from the Dam that are sympathetic to the widest and greatest benefits to be had on the downstream floodplain. With a managed flow regime the ecosystem could be expected to change from its natural condition, but in ways that would continue to support a full suite of ecosystem services. The flooding regime would be required to sustain the ecosystem in a number of ways, for example, by filling the pans, and flushing to remove the saline water from the pans. If this is achieved, then the vegetation, which is the primary producer of the productivity on the floodplain, would be maintained both on the land and also within the pans themselves. Fish diversity and populations would be maintained not only through provision of good breeding conditions on the floodplain but also by provision of high water quality that would sustain a diversity of species. Flooding duration would be just sufficient to recharge the soil with water and to foster nutrient recycling as terrestrial vegetation decomposes into the water. Receding water levels would be slow enough to sustain the Cynodon lawns on the banks of the pans thus sustaining this important grazing resource. Sedge communities in the swampy areas would be maintained, providing an important ecosystem with associated benefits. Scenario for a Structured Single Sector Economy In this scenario a single sector, most likely formal agriculture, completely dominates the economy and thus the developments on the floodplain. Water releases are completely controlled so as to eliminate flooding, so the floodplain is essentially converted to a terrestrial agricultural zone (similar to the lower Mfolozi River) with drains to remove any excess water and berms to prevent flooding. Cultivation would use up all available land including the location of the pans which would be drained. Governance would naturally be strong and effective, but would respond only to the single sector, ignoring the wishes of others who are not part of it. The river flow would be managed to ensure that the chosen agricultural venture was supported. Inevitably this would mean severe limitation of flooding of the floodplain or of flooding at times of the year which are inappropriate for the ecosystem. This would allow implementation of agricultural development without regard for other impacts on the floodplain, leading to change and eventual disappearance of the floodplain ecosystem (Heeg & Breen, 1994). Agricultural development

8
could take place over the entire floodplain with wetlands and pans considered prime agricultural ground because of their accumulated nutrients. Biodiversity would change to mirror that on the surrounding landscape, although for a few years the remaining impacts of the flood history would continue to be felt e.g. the accumulated nutrients. Some pans may survive in a reduced state, probably those fed by rain and groundwater. The water in these may become saline due to groundwater intrusion, resulting in a change of functionality and a reduced value for subsistence use. The river channel would cease to interact with the floodplain and water would be confined to the channel. Flows would be highly regulated and even if some level of variability were introduced into the flow pattern, there would be significant changes to the instream ecosystem. Annual flooding would be limited by the upstream dam which would become increasingly important as a flood attenuation structure. Flooding intensities would thus be decreased, possibly eliminated, in favour of continuous baseflow which would be elevated in order to discharge the accumulated water from the Dam (unless this was used for off-floodplain irrigation).
Economic analysis The economic analysis assessed both floodplain use values and the upstream dam use values in order to make an estimate of the value of the economic activity associated with the Pongola floodplain and water. Only direct use values were assessed and regulatory services such as soil fertility and waste assimilation were not valued. The methods used to determine these estimates are discussed in the section below. The value of agriculture associated with abstraction from the Pongolapoort Dam The Senekal Boerdery, comprising of several farms in the Mkuze area, is the largest sugarcane farm in the region and in fact South Africa, with approximately 3500 hectares under cane. These farms are reliant on water extracted from the Pongolapoort Dam for irrigation and are potentially one the biggest users of water from the dam with a water license for 32.6 million m3 per annum. To determine the economic value of water abstracted from the dam and used for large scale sugarcane farming, the total income generated, costs per tonne, costs per hectare and gross margin was estimated. The total income and gross margin per hectare was estimated using the total number of hectares under cane and the total yield per annum to determine the average yield per hectare per annum. These figures were supplied by Dreyer Senekal, a senior manager of the Senekal Boerdery. A 2007-2008 survey of the Pongola Mill was then used to determine the gross return per tonne of cane and average total and variable costs per tonne of cane. These figures were supplied by the South African Cane Growers Association and adjusted for 2008-2009. Although the Senekal farms supply the Felixton Mill, the gross return and total and variable fixed costs from the Pongola Mill were used for two reasons:
• The survey of the Felixton Mill undertaken in 2007-2008 did not include the Senekal farms. Given the scale of operation at the Senekal farms, the figures for the Felixton Mill would have been significantly affected.
• The farms which were included in the survey of the Felixton Mill were predominantly dryland, while the majority of sugarcane at the Senekal farms is under irrigation. In comparison, the farms included in the survey of the Pongola Mill are almost all under irrigation and therefore more closely resemble the Senekal farms in production and associated costs.
The difference between the gross return and average fixed and variable costs per ton of cane (i.e. gross margin) was multiplied by the average yield per hectare to estimate the gross margin per hectare per annum. The average volume of water used for irrigation per hectare was also supplied by Dreyer Senekal. The gross margin per hectare was then divided by the average volume of water

9
used for irrigation per hectare (m3) to estimate the economic value of water used for large scale sugarcane farming in the Jozini area.
Dam Enterprises - Tourism There are a number of hotels, lodges, and bed and breakfasts, in the area surrounding Pongolapoort Dam which benefit or derive value from activities offered at the Dam. This includes activities such as tiger-fishing, boat cruises, game drives and birding. To determine the value of these tourism-related enterprises, 27 establishments offering accommodation in and around the towns of Jozini, Mkuze, and Pongola were surveyed. It was assumed that establishments outside of these selected areas would derive little or no value from the Dam because of the distance (greater than 50 km) and other attractions offered in the region, such as Mkuze and Hluhluwe-Imfolosi Game Reserves, iSimangaliso Wetland Park, and Sodwana Bay etc. Information on each of these establishments was derived from their websites and a through a telephone survey. For each of the establishments surveyed, the total number of beds was multiplied by the average price per bed (mean of highest and lowest cost per bed) to calculate the maximum potential annual income. The potential annual income per establishment was then multiplied by an average occupancy rate derived from the surveys to determine the total annual income per establishment, assuming an average 52.6% occupancy rate. A generally accepted market standard is that an establishment would aim to break even at 10% lower than current occupancy. Using this standard, an average running cost per establishment was calculated. The estimated running costs were then subtracted from the total annual income to determine the gross margin per establishment (i.e. returns minus costs). Based on distance from and activities offered to guests at Pongolapoort Dam, a dependency ratio was determined for each establishment. For example, a house boat on Pongolapoort Dam would be 100% dependent on the Dam, whereas a game lodge in Mkuze would be less than 20% dependent. The gross margin per establishment was then multiplied by the estimated dependency ratio to calculate the annual gross margin derived for each establishment from Pongolapoort Dam. This figure was then divided by the total number of beds in each establishment to calculate the average annual gross margin per bed. An average of the annual gross margin per bed for each establishment was then derived. Jozini Town – Residential, commercial and industrial The town of Jozini sources its water from the Pongolapoort Dam. The uMkhanyakude District Municipality holds the water use licence for extraction from Pongolapoort Dam and is responsible for supplying water to Jozini. To determine the economic value of water for residential, commercial, and industrial uses within the town of Jozini, the total annual volume of water abstracted by the Jozini used was used as a basis for valuations. This information was supplied by one of the water technicians for the uMkhanyakude District Municipality. No exact figures could be provided as the majority of water connections within the town are either illegal or not on record. The breakdown of the total annual water use per sector was estimated. These estimates were again provided by one of the water technicians for the uMkhanyakude District Municipality as there are little or no records of what water in Jozini is used for. It was estimated that 90% of water use is for residential purposes and the remaining 10% for commercial uses. There are no industrial activities in Jozini requiring water and agricultural activities do not source their water from the Town’s supply. In order to calculate the economic value of water supplied to the town of Jozini, the total annual volume of water used for residential and commercial purposes in Jozini were multiplied by

10
estimations on the return from water use derived from an average of a suite of South African estimates (in Blignaut & Mander, 2007). The costs of water use were assumed to be zero, given that most of the water is supplied for free. Makhathini Flats - Agriculture The Makhathini Flats forms part of the Makhathini irrigation scheme, which was established for small scale and emerging farmers on the floodplains of the Pongola River. This scheme extracts its water directly from the Pongola River. Information was initially sought from the local extension office of the Department of Agriculture, Environmental Affairs, and Rural Development in Jozini. They identified a wide range of crops being grown in the Makhathini Flats area. The main crops in terms of area cultivated are cotton, sugarcane, and maize. However, no clear estimates of area could be obtained from this source. For each of these three crops, the total area cultivated, average yield per hectare, average cost per hectare, and returns per hectare were estimated. The total area cultivated for each crop, the average yield per hectare and returns per hectare from vegetables, cotton and maize were estimated using estimates from Rene Ford’s knowledge of the Makhathini Flats. These figures have been adjusted for 2009-2010. There is also a small irrigation scheme on the lower Pongola, called the Ndumo irrigation scheme with 400 hectares cultivated. Pongola floodplain – Agriculture There are many households on the Pongola floodplain involved in small-scale, mainly subsistence agriculture, which are reliant on the water from the Pongola River for irrigation and soil moisture. Nutrients and sediments are carried down in flood events to replenish the soil fertility. These households derive value from agriculture either directly through sales (on local market and / or to neighbours), or indirectly through household consumption. Data obtained from a household survey conducted as part of PRESPA was used to identify which crops are being grown, the average area cultivated, the average yield per hectare, and average returns per hectare. The returns per hectare included household consumption as this is a forgone cost of purchasing the same product(s) on the local market. Since all the crops are sold on the local market, the value derived from household consumption can be calculated by simply multiplying the market price of each crop by the respective quantity consumed by the household. Labour provided by members of the household is an opportunity cost and can be seen as the cost of production. Therefore, production costs were estimated for each crop by multiplying the labour hours required for each respective crop by the minimum wage rate. The only available information for labour inputs for this area was for a cane growers survey that was conducted. This figure was used as a baseline for other crops grown by the subsistence farmers. Pongola floodplain – Natural resources In addition to agriculture, many of the households on the Pongola floodplain also collect or harvest natural resources, such as fish, water-lilies, umhlanga (reeds), thatching-grass, ibhuma (craft sedge), and figs, as part of their rural livelihood strategy. These households derive value from these natural resources either directly, through sales (on local market and / or to neighbours), but predominantly indirectly through the own use by the household. Data obtained from the PRESPA household survey was used to identify which resources were being collected by households, the average quantity collected per household, and the average return to households. The value gained from own use by the household was included in the average return as it is the forgone cost of purchasing the product(s) on the local market. The value derived from household consumption can be calculated by multiplying the market price of each natural resource by the

11
respective quantity consumed by the household. Those resources that are sold on the local market have a market price which can be used to calculate the own use value. However, since no markets exist for water-lilies and figs, the market prices of amadumbi (a locally cultivated root crop) and apples respectively were used as proxies (as they provide the equivalent nutritional benefit). The only cost incurred to the household is the opportunity cost of time involved in travel and harvest. Consequently, the cost was calculated by multiplying the number of hours involved in travel and harvest of each resource, by the minimum wage rate per hour. The time used was an estimate based on the likely proximity and effort required to extract or harvest the product. The gross margin was then calculated as total income minus costs. Pongola floodplain – Cattle A number of households (estimated 30%) on the Pongola floodplain also keep livestock, especially cattle. These cattle, given the rural and traditional nature of the area, provide a range of goods and services to the household, such as draught, milk, manure etc. This multiple use system may have potentially higher returns than is expected given the low rates of off-take and conventional wisdom around livestock production and carrying capacity in communal areas. The higher returns to livestock production when compared to some types of commercial stock production are not only a result of multiple goods and services from livestock, but also due to lower input costs under communal systems. The income from the goods and services that cattle provide, and costs of cattle products for households on the Pongola floodplain, were derived from research undertaken by Shackleton et al. (2005) on the direct-use value of livestock to rural livelihoods in the Sand River catchment of South Africa. The returns and margins were estimated by up-scaling the values per household survey data by the estimated floodplain population, and the total area of the floodplain.
Hydrology and water allocation model In addressing ecosystems services and poverty alleviation, PRESPA modelled provisioning services provided by river eco-hydrology to determine how these are currently apportioned between the major water use sectors, and to subsequently explore how such apportionments might be purposively managed to alleviate poverty. PRESPA quantified the economic value of the available water of the river hydrograph (blue water) to various sectors that consume water, and then determined the fraction of that value accruing to the poorest individuals and communities within each of the sectors. However, it should be noted that the model utilised averaged annual flow rates and averaged income revenue figures and therefore does not explain how water might have differing marginal values as a result of drought. (Under these circumstances water allocation would be prioritised for critical needs such as in Jozini town and other villages). Water supply The first step determined the total annual supply available to the Pongolapoort Dam which is approximately 1000 million m3/yr on average. Figure 4 and Table 2 present the range in flows for the natural river regime recorded upstream prior to entry into the dam. Effect of supply on flooding While for some of the water use sectors, the benefits gained stem from the consumption of water, those on the floodplain arise through the area inundated by flood events. Thus to determine benefits from areas flooded and wetted for agriculture, natural resources and fish, and cattle, the project modelled pan filling at different river flows, from 14 to 350 m3/s. Areas inundated from pan filling were taken from previous surveys conducted by Heeg & Breen (1982).

12
Figure 4. Annual hydrograph of the Pongola River before construction of the Dam Table 2. Range in flows for natural river regime recorded upstream and prior to entry into the dam
Period Flow m3/s
Flow million m3 Period
Flow m3/s
Flow million m3
Oct 1 18.0 15.5 Apr 1 42.4 36.7
Oct 2 22.6 19.5 Apr 2 36.6 31.6
Oct 3 28.6 24.7 Apr 3 32.3 27.9
Nov 1 34.7 30.0 May 1 28.1 24.3
Nov2 40.7 35.2 May 2 23.9 20.6
Nov 3 46.6 40.3 May 3 20.0 17.3
Dec 1 52.5 45.4 Jun 1 16.1 13.9
Dec 2 58.5 50.5 Jun 2 12.2 10.5
Dec 3 57.4 49.6 Jun 3 13.3 11.5
Jan 1 56.3 48.6 Jul 1 14.5 12.5
Jan 2 55.2 47.7 Jul 2 15.7 13.5
Jan 3 61.5 53.1 Jul 3 13.2 11.4
Feb 1 67.8 58.6 Aug 1 10.8 9.3
Feb 2 74.1 64.0 Aug 2 8.4 7.2
Feb 3 67.4 58.3 Aug 3 8.5 7.3
Mar 1 60.8 52.5 Sep 1 8.6 7.5
Mar 2 54.1 46.7 Sep 2 8.8 7.6
Mar 3 48.3 41.7 Sep 3 13.4 11.5
1064

13
Two relationships were found to fit the data, split at 142 m3/s (Figure 5). In addition, residual pool and accelerator functions were used to generate areas wetted and exposed as a result of pond shrinkage between flood events and area expansion post floods. The residual pool was selected as 25% of the pan area, and the accelerator function was 160% creating further moist and wetted area via groundwater seepage and supplementary pumping of irrigation to support mixed agriculture, natural resources, cropping and cattle.
Figure 5. Relationship between discharge volume and area flooded.
Determining water demands The model ignores grassland and forest evaporation (green water) upstream of the Pongolapoort Dam and downstream of South African border in Mozambique. To determine outcomes of different options, the project built an excel spreadsheet to capture within each sector the amounts of water diverted and/or consumed (Table 3) and the economic returns to water for the total sector and the poorest in that sector. There are four sectors where the calculation of water demand and consumption is straightforward (urban, Mkuze, Makhathini and cash crops) utilising concepts of water withdrawal and consumption depending on the sector. The other use sectors require a brief explanation:
• It is important to note that PRESPA took the decision to ascribe the annual net evaporative loss from the Pongolapoort Dam to the tourism sector that has settled around it, rather than apportioning this to all sectors. This was done in order to reflect the critical wish by major tourist companies that the dam is treated as a recreational lake, despite the fact that its level fluctuates as a regulating reservoir.
• The consumptive use of water for the ecological floodplain sectors (covering three sectors i.e. mixed crops, natural resources/fish and cattle) from the evaporation and non-returned seepage was established. This gives a much lower volume of water requirement from in-stream water use as a function of water flooding to inundate land the bulk of which then passes to Mozambique.
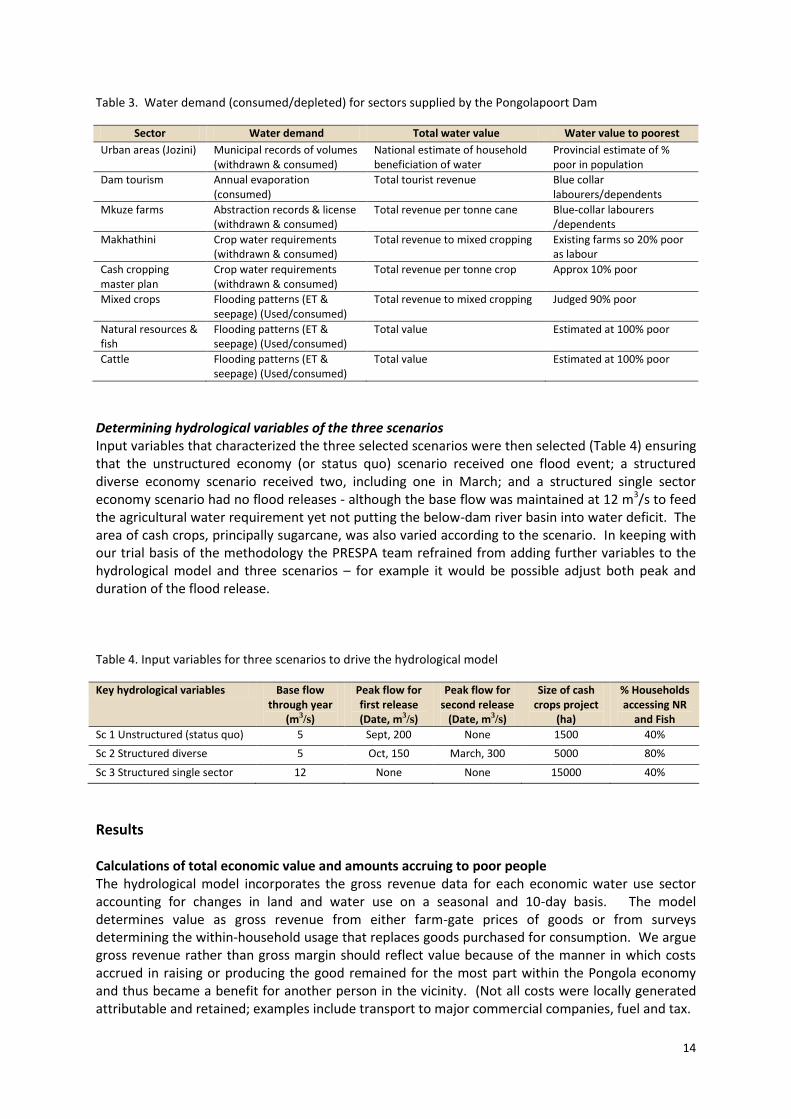
14
Table 3. Water demand (consumed/depleted) for sectors supplied by the Pongolapoort Dam
Sector Water demand Total water value Water value to poorest
Urban areas (Jozini) Municipal records of volumes (withdrawn & consumed)
National estimate of household beneficiation of water
Provincial estimate of % poor in population
Dam tourism Annual evaporation (consumed)
Total tourist revenue Blue collar labourers/dependents
Mkuze farms Abstraction records & license (withdrawn & consumed)
Total revenue per tonne cane Blue-collar labourers /dependents
Makhathini Crop water requirements (withdrawn & consumed)
Total revenue to mixed cropping Existing farms so 20% poor as labour
Cash cropping master plan
Crop water requirements (withdrawn & consumed)
Total revenue per tonne crop Approx 10% poor
Mixed crops Flooding patterns (ET & seepage) (Used/consumed)
Total revenue to mixed cropping Judged 90% poor
Natural resources & fish
Flooding patterns (ET & seepage) (Used/consumed)
Total value Estimated at 100% poor
Cattle Flooding patterns (ET & seepage) (Used/consumed)
Total value Estimated at 100% poor
Determining hydrological variables of the three scenarios Input variables that characterized the three selected scenarios were then selected (Table 4) ensuring that the unstructured economy (or status quo) scenario received one flood event; a structured diverse economy scenario received two, including one in March; and a structured single sector economy scenario had no flood releases - although the base flow was maintained at 12 m3/s to feed the agricultural water requirement yet not putting the below-dam river basin into water deficit. The area of cash crops, principally sugarcane, was also varied according to the scenario. In keeping with our trial basis of the methodology the PRESPA team refrained from adding further variables to the hydrological model and three scenarios – for example it would be possible adjust both peak and duration of the flood release. Table 4. Input variables for three scenarios to drive the hydrological model
Key hydrological variables Base flow through year
(m3/s)
Peak flow for first release (Date, m3/s)
Peak flow for second release
(Date, m3/s)
Size of cash crops project
(ha)
% Households accessing NR
and Fish
Sc 1 Unstructured (status quo) 5 Sept, 200 None 1500 40%
Sc 2 Structured diverse 5 Oct, 150 March, 300 5000 80%
Sc 3 Structured single sector 12 None None 15000 40%
Results Calculations of total economic value and amounts accruing to poor people The hydrological model incorporates the gross revenue data for each economic water use sector accounting for changes in land and water use on a seasonal and 10-day basis. The model determines value as gross revenue from either farm-gate prices of goods or from surveys determining the within-household usage that replaces goods purchased for consumption. We argue gross revenue rather than gross margin should reflect value because of the manner in which costs accrued in raising or producing the good remained for the most part within the Pongola economy and thus became a benefit for another person in the vicinity. (Not all costs were locally generated attributable and retained; examples include transport to major commercial companies, fuel and tax.

15
Tables 5 and 6 provide the results of the economic valuation for the three scenarios. Table 5 provides the total value of the three scenarios, and contrasts this to the value of that ascribed to poor people working in those sectors and then four of the sectors on the floodplain. The results show that a considerable diversion of water to a large sugarcane project on the floodplain (the defining feature of a single sector investment) would result in a doubling of economic activity and approximately a doubling of economic provisioning for poor people. Table 6 gives the values for four sectors below the Pongolapoort Dam on the floodplain, giving an indication of how water supports livelihoods in different sectors. The dramatic increase in revenues in Scenario 3 is a reflection of large economic impact that a sugarcane project would have within the area – although also depressing the economic value of other floodplain activities of mixed agriculture, natural resources and fish, and cattle-keeping. Table 5. Total and poverty-related economic value for water depletion
Scenario Total value Rand/year
Poverty value Rand/year
Floodplain poverty Rand/year
Sc 1 Unstructured R224,156,279 R31,130,064 R13,524,234
Sc 2 Strct diverse R294,885,298 R40,428,654 R22,822,824
Sc 3 Strct single sect R478,877,603 R49,862,248 R32,256,418
Table 6. Revenue value to the poorest in four sectors below the Dam
Scenario Cash project Rand/year
Mixed agric Rand/year
NR & fish Rand/year
Cattle Total
Sc 1 Unstructured R2,367,123 R4,850,419 R 1,238,343 R5,068,348 R13,524,234
Sc 2 Strct diverse R7,890,411 R6,687,277 R 1,751,605 R 6,493,531 R22,822,824
Sc 3 Strct single sect 23,671,233 R3,324,226 R 386,981 R4,873,978 R32,256,418
Figure 6. Graph of total and poverty-related economic value for water depletion (Table 5)
-
100,000,000
200,000,000
300,000,000
400,000,000
500,000,000
600,000,000
Sc 1 Unstructured Sc 2 Strct diverse Sc 3 Strct single sect
Ran
d/y
ear
Total value Poverty value

16
Figure 7. Graph of value of four sectors under three scenarios (Table 6)
As discussed earlier, while the economic benefits of a sugarcane project in Scenario 3 are without question (although scale and distribution of benefits to poor people have been estimated), PRESPA is unable to accurately model the long-term consequences for the ecology of the floodplain as a result of large amounts of water reserved for an expansion of formal irrigation, and the resulting diminishing resource base for rural subsistence livelihoods.
Distribution of economic value within each scenario This section presents the results in both tabular and graphic form of the distribution of value accruing to each water-use sector within each of the three scenarios. Results of scenario 1: Unstructured Table 8 gives the total value and value to the poorest for Scenario 1 where an ad hoc growth of today’s unstructured economy is envisaged. These show dramatic differences in both total gross revenue and in the distribution of that income to poor people living on the floodplain. Thus the formal commercial operations of the dam tourism, Mkuze and Makhathini sugarcane-based farming, plus presence of a cash cropping irrigation system on the floodplain all generate sums in excess of 25 million rand per year. All other sectors generate about a fifth of less of this; between 1 and 5 million rand/year. Also noticeable is that the revenues to the poorest people within the eight water-use sectors are more or less within the same order of magnitude; between 1 to 7.5 million rand/year. This distribution is a reflection of a number of factors depending on the sector in question. For the commercial sectors, poor people have low-task, low-skill jobs that are either not well paid or are seasonal in nature. For the rural subsistence sectors it is the total, or high proportion thereof, revenue that flows to the poor, but the former is small to start with.
-
5,000,000
10,000,000
15,000,000
20,000,000
25,000,000
Cash project Mixed agric NR & fish Cattle
Ran
d/y
ear
Sc 1 Unstructured Sc 2 Strct diverse Sc 3 Strct single sect

17
Table 8. Value accruing to each sector (Rand/year) Scenario 1: unstructured
Sector Total
Rand/year Poorest
Rand/year Percent to poorest
%
Urban R4,095,300 R3,276,240 80%
Dam tourism R44,837,000 R3,591,000 8%
Mkuze farms R97,468,000 R3,248,000 3%
Makhathini R37,452,952 R7,490,590 20%
Cash master R28,606,981 R2,367,123 8%
Mixed floodplain R5,389,355 R4,850,419 90%
NR & fish R1,238,343 R1,238,343 100%
Cattle R5,068,348 R5,068,348 100%
Total R224,156,279 R31,130,064 14%
Figure 8. Value accruing to each sector, total and poorest Scenario 1: Unstructured (Rand/year)
Results of scenario 2: Structured diversified The results of the second scenario where the economy of the floodplain is balanced between maintaining a flow of water to the floodplain (providing two major floods at different times of the year) for natural-resource based livelihoods and water for an irrigation system of 5000 ha. By comparing with Scenario 1, it is possible to detect the considerable increase in gross revenue to ‘cash master’ plus a slight increase in revenues to the other floodplain activities as a result of the ‘two floods’ that define Scenario 2.
- 20,000,000 40,000,000 60,000,000 80,000,000 100,000,000
Urban
Dam tourism
Mkuze farms
Makhathini
Cash master
Mixed floodplain
NR & fish
Cattle
Economic value by gross value to primary beneficiaries
Poorest
Total

18
Table 9. Value accruing to each sector (Rand/year) Scenario 2: structured diversified
Sector Total
Rand/year Poorest
Rand/year Percent to poorest
%
Urban R4,095,300 R3,276,240 80%
Dam tourism R44,837,000 R3,591,000 8%
Mkuze farms R97,468,000 R3,248,000 3%
Makhathini R37,452,952 R7,490,590 20%
Cash master R95,356,603 R7,890,411 8%
Mixed floodplain R7,430,308 R6,687,277 90%
NR & fish R1,751,605 R1,751,605 100%
Cattle R6,493,531 R6,493,531 100%
Total R 294,885,298 R40,428,654 14%
Figure 9. Value accruing to each sector, total and poorest Scenario 2: Structured diversified (Rand/year)
Results of scenario 3: Structured single sector In this sector, the lack of managed floods to generate flood-dependent production diminishes the scale of associated livelihoods – instead giving rise to a far greater economic boost from the 15 000 ha cash master plan where the water is allocated. Nevertheless, there remain some floodplain-related activities because in this scenario a maintenance flow of 12 million m3/s is provided down the river for minor pan filling and abstraction by small irrigation pumps. Table 10 and Figure 10 present the economic values calculated for this scenario, including the total value and that which is ascribed to the poorest. Notable is the considerable increase in the total value under the cash crop master plan project and its resulting impact on incomes to the poorest via employment and possible farm ownership.
- 20,000,000 40,000,000 60,000,000 80,000,000 100,000,000
Urban
Dam tourism
Mkuze farms
Makhathini
Cash master
Mixed floodplain
NR & fish
Cattle
Economic value by gross value to primary beneficiaries
Poorest
Total

19
Table 10. Results of scenario 3: structured single sector
Sector Total
Rand/year Poorest
Rand/year Percent to poorest
%
Urban R4,095,300 R3,276,240 80%
Dam tourism R44,837,000 R3,591,000 8%
Mkuze farms R97,468,000 R3,248,000 3%
Makhathini R37,452,952 R7,490,590 20%
Cash master R286,069,808 R23,671,233 8%
Mixed floodplain R3,693,584 R3,324,226 90%
NR & fish R386,981 R386,981 100%
Cattle R4,873,978 R4,873,978 100%
Total R478,877,603 R49,862,248 10%
Figure 10. Value accruing to each sector, total and poorest (Rand/year) Scenario 3: single sector
Water use by sector Employing a hydrographic regime method, water consumption patterns for each of the eight water use sectors are provided in Figures 11 to 13. The following observations apply to these results:
• It has proved difficult to draw both the water supply regime and the water demand curves within the same graph – although the choice of graph here presents what seems to be a good choice giving logarithmic axes where required and the use of two Y-axes, the left hand for the demand curves and the right hand Y-axis for the supply curve.
• The supply curve is not the hydrograph of the river prior to entry into the Pongolapoort Dam, but instead it gives the release pattern subject to decisions regarding the management of floods.
- 50,000,000 100,000,000 150,000,000 200,000,000 250,000,000 300,000,000
Urban
Dam tourism
Mkuze farms
Makhathini
Cash master
Mixed floodplain
NR & fish
Cattle
Economic value by gross value to primary beneficiaries
Poorest
Total

20
Figure 11. Hydrographic regime analysis of water consumption in Scenario 1
Figure 12 clearly shows the two flood peaks in October and March of each year, the defining feature of Scenario 2 which attempts to provide water for commercial activities and for ecosystem functioning. Figure 13 (without log axes) shows a much lower and more steady release flow of 12 million m3/s and the enhanced depletion of water by the ‘cash master plan’ set at 15 000 ha. Table 11 provides the water consumption by sector for the three selected scenarios. This shows that volumetrically most (approximately 65%) water is passed to Mozambique during the main flood period. However moving from the unstructured to diversified to single sector scenarios more water is diverted to (and depleted from) the ‘Cash-Master Plan’ where the area under sugarcane is progressively increased. This leads to less water for the floodplain as smaller floods are generated. It is worth reiterating that the ‘surplus’ volume that passes down to Mozambique provides important water provision functions to generate the areas flooded on the floodplain, and that for natural resources, fish, mixed agriculture and cattle the net amount depleted is from evaporation and non-returned seepage. This considerable difference in water requirement (nearly an order of 100) provides evidence for a discussion around whether the ecosystem benefits of flooding could be generated by the specific control of flows on the wetland via the introduction of further infrastructure to control and place water where required (see discussion below).
1
10
100
1
10
100
Oct
1
Oct
2
Oct
3
No
v 1
No
v2
No
v 3
Dec
1
Dec
2
Dec
3
Jan
1
Jan
2
Jan
3
Feb
1
Feb
2
Feb
3
Mar
1
Mar
2
Mar
3
Ap
r 1
Ap
r 2
Ap
r 3
May
1
May
2
May
3
Jun
1
Jun
2
Jun
3
Jul 1
Jul 2
Jul 3
Au
g 1
Au
g 2
Au
g 3
Sep
1
Sep
2
Sep
3
Riv
er
flo
w a
nd
de
ple
tio
n (
m3/s
)
Urban Dam tourism Mkuze farms Makhathini Cash master
Mixed floodplain NR & fish Cattle Mozambique Release

21
Figure 12. Hydrographic regime analysis of water consumption in Scenario 2
Figure 13. Hydrographic regime analysis of water consumption in Scenario 3 (not log scale)
1
10
100
1000
1
10
100
1000
Oct
1
Oct
2
Oct
3
No
v 1
No
v2
No
v 3
Dec
1
Dec
2
Dec
3
Jan
1
Jan
2
Jan
3
Feb
1
Feb
2
Feb
3
Mar
1
Mar
2
Mar
3
Ap
r 1
Ap
r 2
Ap
r 3
May
1
May
2
May
3
Jun
1
Jun
2
Jun
3
Jul 1
Jul 2
Jul 3
Au
g 1
Au
g 2
Au
g 3
Sep
1
Sep
2
Sep
3
Riv
er
flo
w a
nd
se
cto
r d
ep
leti
on
(m
3 /s)
Urban Dam tourism Mkuze farms Makhathini Cash master
Mixed floodplain NR & fish Cattle Mozambique Release
0
10
20
30
40
50
60
70
80
90
100
1
11
21
31
41
51
61
71
81
91
Oct
1
Oct
2
Oct
3
No
v 1
No
v2
No
v 3
Dec
1
Dec
2
Dec
3
Jan
1
Jan
2
Jan
3
Feb
1
Feb
2
Feb
3
Mar
1
Mar
2
Mar
3
Ap
r 1
Ap
r 2
Ap
r 3
May
1
May
2
May
3
Jun
1
Jun
2
Jun
3
Jul 1
Jul 2
Jul 3
Au
g 1
Au
g 2
Au
g 3
Sep
1
Sep
2
Sep
3
Riv
er
flo
w a
nd
se
cto
r d
ep
leti
on
(m
3/s
)
Urban Dam tourism Mkuze farms Makhathini Cash master
Mixed floodplain NR & fish Cattle Mozambique Release

22
Table 11. Depletion of water per sector for three scenarios (million m
3)
Sector Sc1
Unstructured
Percent Sc 2
Strct diverse
Percent Sc 3
Strct single sect
Percent
Urban 1.6 0% 1.6 0% 1.6 0%
Dam tourism 256.2 24% 256.3 24% 256.3 24%
Mkuze farms 41.4 4% 41.4 4% 41.4 4%
Makhathini 51.4 5% 43.1 4% 51.4 5%
Cash master 26.9 3% 89.7 8% 269.1 25%
Mixed floodplain 6.5 1% 8.6 1% 5.7 1%
NR & fish 7.2 1% 6.2 1% 4.5 0%
Cattle 7.9 1% 4.2 0% 5.0 0%
Surplus 665.0 62% 613.1 58% 429.2 40%
1064.2 100% 1064.2 100% 1064.2 100%
The value of water The economic value of water depletion for each sector can be calculated by division of the gross revenue by the volume of water consumed giving the results in Table 12 in Rands per cubic metre. The highest values are generated in the urban and Mkuze sugarcane sectors. The value of water for mixed floodplain agriculture, natural resources, fish and cattle is much lower because of the combined effects of both greater volumes of water used in creating the floods that sustain those uses and the lower monetary value of the goods produced. Similarly tourism supported by the evaporation from the lake (an assumption that can be questioned) provides a low value per cubic metre. In some instances these fall within observations noted elsewhere for irrigated produce and urban benefits (Kadigi et al 2005). Table 12. Value of water in each sector, plus average, in Rands and in Dollars per cubic metre
Sector Sc 1
Unstructured Sc 2 Strct diverse
Sc 3 Strct single sect
Average Average US$/m
3
Urban 2.55 2.55 2.55 2.55 0.338
Dam tourism 0.15 0.15 0.15 0.15 0.020
Mkuze 2.81 2.81 2.81 2.81 0.372
Makhathini 0.95 0.95 0.95 0.95 0.126
Agric cash masterplan 1.23 1.23 1.23 1.23 0.162
Mixed floodplain 0.85 0.91 0.57 0.78 0.103
NR & fish 0.17 0.17 0.08 0.14 0.018
Cattle 1.49 1.77 1.87 1.71 0.226
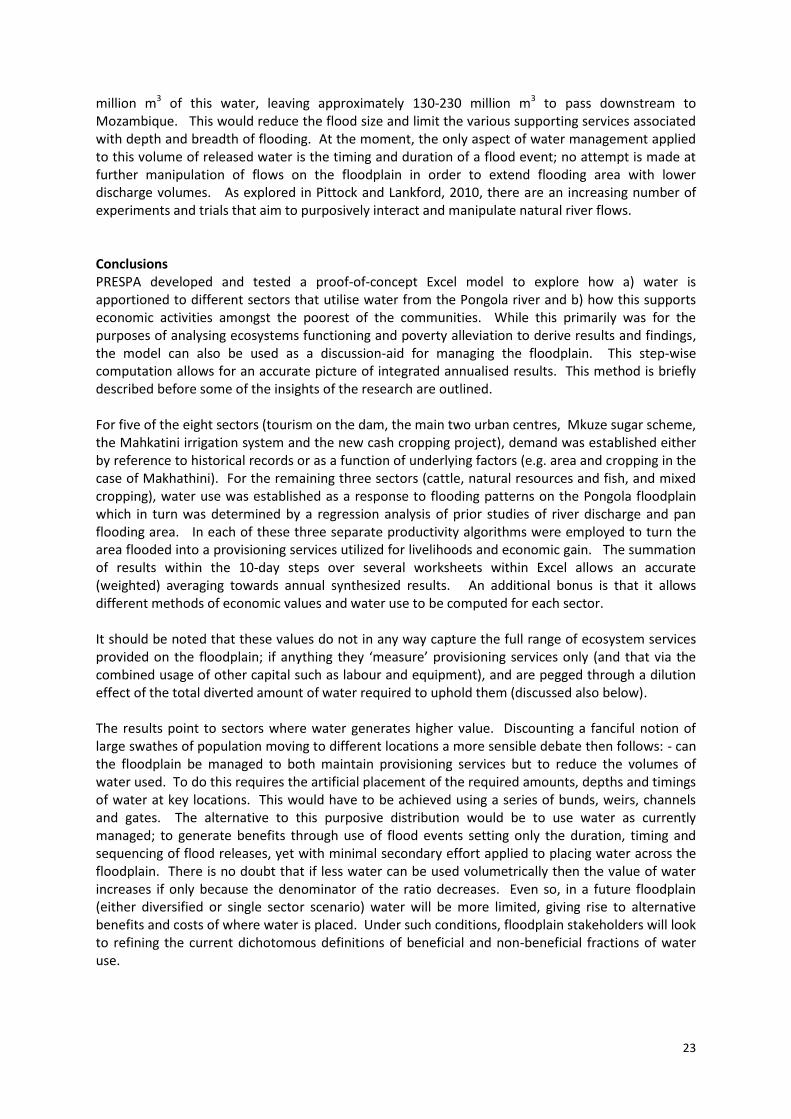
Purposive management of floodplain water for poverty alleviation Based on the analysis the purposive management of floodwaters to derive or maximize provisioning and cultural services for poverty alleviation (or to balance services that generate economic output with those that regulate and support an underlying ecology) can be debated. Although PRESPA results are highly preliminary, it would appear that some 400-500 million m3 is passed through the floodplain in order to support 650 ha of mixed cropping, 1000 ha of ponds and approximately 10,000 cattle. While alternative calls on that water have not yet emerged, there is the likelihood that in the structured single sector scenario a major irrigation system of 10-15,000 ha would require some 270
23
million m3 of this water, leaving approximately 130-230 million m3 to pass downstream to Mozambique. This would reduce the flood size and limit the various supporting services associated with depth and breadth of flooding. At the moment, the only aspect of water management applied to this volume of released water is the timing and duration of a flood event; no attempt is made at further manipulation of flows on the floodplain in order to extend flooding area with lower discharge volumes. As explored in Pittock and Lankford, 2010, there are an increasing number of experiments and trials that aim to purposively interact and manipulate natural river flows. Conclusions PRESPA developed and tested a proof-of-concept Excel model to explore how a) water is apportioned to different sectors that utilise water from the Pongola river and b) how this supports economic activities amongst the poorest of the communities. While this primarily was for the purposes of analysing ecosystems functioning and poverty alleviation to derive results and findings, the model can also be used as a discussion-aid for managing the floodplain. This step-wise computation allows for an accurate picture of integrated annualised results. This method is briefly described before some of the insights of the research are outlined. For five of the eight sectors (tourism on the dam, the main two urban centres, Mkuze sugar scheme, the Mahkatini irrigation system and the new cash cropping project), demand was established either by reference to historical records or as a function of underlying factors (e.g. area and cropping in the case of Makhathini). For the remaining three sectors (cattle, natural resources and fish, and mixed cropping), water use was established as a response to flooding patterns on the Pongola floodplain which in turn was determined by a regression analysis of prior studies of river discharge and pan flooding area. In each of these three separate productivity algorithms were employed to turn the area flooded into a provisioning services utilized for livelihoods and economic gain. The summation of results within the 10-day steps over several worksheets within Excel allows an accurate (weighted) averaging towards annual synthesized results. An additional bonus is that it allows different methods of economic values and water use to be computed for each sector. It should be noted that these values do not in any way capture the full range of ecosystem services provided on the floodplain; if anything they ‘measure’ provisioning services only (and that via the combined usage of other capital such as labour and equipment), and are pegged through a dilution effect of the total diverted amount of water required to uphold them (discussed also below). The results point to sectors where water generates higher value. Discounting a fanciful notion of large swathes of population moving to different locations a more sensible debate then follows: - can the floodplain be managed to both maintain provisioning services but to reduce the volumes of water used. To do this requires the artificial placement of the required amounts, depths and timings of water at key locations. This would have to be achieved using a series of bunds, weirs, channels and gates. The alternative to this purposive distribution would be to use water as currently managed; to generate benefits through use of flood events setting only the duration, timing and sequencing of flood releases, yet with minimal secondary effort applied to placing water across the floodplain. There is no doubt that if less water can be used volumetrically then the value of water increases if only because the denominator of the ratio decreases. Even so, in a future floodplain (either diversified or single sector scenario) water will be more limited, giving rise to alternative benefits and costs of where water is placed. Under such conditions, floodplain stakeholders will look to refining the current dichotomous definitions of beneficial and non-beneficial fractions of water use.

24
Altered flow regimes as a result of the construction of the Pongolapoort Dam coupled with anthropogenic impacts, have had a significant effect on the functioning of the downstream ecosystems and the associated supply of ecosystem services. Our study illustrated trade-offs between ecosystem services in the region. In the Pongola region, the decision to convert large portions of the floodplain to cultivated land and to alter flooding regimes to support food and cash crops has come at the expense of other less tangible ecosystem services. Results from the PRESPA study suggest that overall there has been a downward trend in almost all ecosystem services since 1955. Most importantly, all regulating and supporting services considered in the study (which underpin all other services) have shown a decline. This decline suggests that while cultivation of food and cash crops may render reasonable yields in the short term, it is unlikely to be sustainable in the longer-term without the application of fertilizers and pesticides. The decisions made by stakeholders and managers regarding trade-offs illustrate the perceived value of ecosystem services by different stakeholder groups particularly in respect of provisioning services. In the short term the single sector economy (i.e. agriculture), either structured or unstructured, may appear to address the challenges of poverty alleviation by creating tangible benefits through the provisioning services. However in the long term it could compromise the overall functioning of the ecosystem and the generation of cultural, regulating and supporting services, which holistically support the livelihoods of the poor. Consideration of alternative management scenarios suggests that without effective management interventions the decline in ecosystem services on the floodplain is likely to continue into the future. Careful consideration needs to be given to the type of economy and associated institutional arrangements which are necessary to ensure the continued supply of important ecosystem services on which the well-being of current and future generations depend. In a structured diversified economy approach it is envisaged that trade-offs are carefully balanced and managed in an equitable manner. The effective governance system ensures that the voices of the poorest and most vulnerable members of the community are still heard and their needs considered. In addition, there is a careful balance between the maintenance of benefits from provisioning services with those from regulating, supporting and cultural services. Where trade-offs need to be made (e.g. no cultivation of commercial crops such as sugarcane on the floodplain), alternatives are implemented (e.g. development of irrigation schemes off the floodplain) to establish a win-win situation and maximize the potential of the area as a whole, not just harness the potential of the floodplain. The PRESPA study identified the lack of structured and effective governance to be a key threat to ecosystem services in the region. In addition, the management of flood releases to support a single sector economy again illustrates a trade-off to enhance a particular provisioning service at the expense of the less tangible regulating and supporting services. The lack of attention afforded to regulating and supporting services may result in a lack of resilience and render the socio-ecological system on the Pongola floodplain more vulnerable to environmental change or extreme events such as droughts and flooding. References Blignaut, B.J. & Mander, M. (2007). Benefits of the Drakensberg: Developing the range of incentives
for improved management. Development Bank of Southern Africa, Department of Water Affairs and Forestry, Department of Environment Affairs and Tourism, Ezemvelo KZN Wildlife, Pietermaritzburg.
25
Bohensky, E., Reyers, B., van Jaarsveld, A., & Fabricius, C., eds. (2004) Ecosystem services in the Gariep Basin. A contribution to the Millenium Ecosystem Assessment., pp 163. Sun Press, Stellenbosch.
Breen, C.M., Dent, M.C., & Mander, M. (1998). The Pongolo river floodplain and its people: past, present and future Rep. No. Occasional paper OP186. Institute of Natural Resoures, Pietermaritzburg.
Heeg, J. & Breen, C.M. (1982). Man and the Pongola floodplain - a report of the Committee for Inland Water Ecosystems National Programme for Environmental Sciences, Rep. No. Report number 56. CSIR, Pretoria.
Heeg, J. & Breen, C.M. (1994). Resolution of conflicting values on the Pongolo river floodplain (South Africa). In Wetlands and shallow continental water bodies (eds B. Patten, S. Jorgenson & S. Dumont), Vol. 2, pp. 303-359. SBP Publishing, The Hague, Netherlands.
Jaganyi, J., Salagae, M., & Matiwane, N. (2008). Integrating floodplain livelihoods into a diverse rural economy by enhancing co-operative management: a case study of the Pongolo floodplain system, South Africa. , Rep. No. WRC Report No 1299/1/08. Water Research Commission, Pretoria.
Jozini Local Municipality (2008). Jozini Local Municipality (2008/2009) Integrated Development Plan Review. Jozini Local Municipality, Jozini, South Africa.
Kadigi, R.M.J., Mdoe, N.S., Lankford, B.A., & Morardet, S. (2005) The value of water for irrigated paddy and hydropower generation in the Great Ruaha, Tanzania. In Proceedings of the East Africa Integrated River Basin Management Conference (eds B.A. Lankford & H.F. Mahoo), pp. 265-278, Sokoine University of Agriculture, Morogoro, Tanzania.
McCartney, M., Jugani, J., & Mkhize, S. (2003). Comprehensive Options Assessment: The Pongolo Case Study. In Workshop on Comprehensive Options Assessment for Dams (22-24 September), pp. 35-39, Geneva, Switzerland.
Millennium Ecosystem Assessment (2005). Ecosystems and human well-being: Wetlands and water synthesis. World Resources Institute, Washington, D.C.
Pittock, J. & Lankford, B.A. (2010) Environmental water requirements: demand management in an era of water scarcity. Journal of Integrative Environmental Sciences, 7, 1-19.
Pschorn-Strauss, E. (2005) Bt cotton in South Africa. Seedling, 13-24. Rodríguez, J.P., Beard, T.D.J., Bennett, E.M., Cumming, G.S., Cork, S., Agard, J., Dobson, A.P., &
Peterson, G.D. (2006) Trade-offs across space, time, and ecosystem services. Ecology and society, 11, 28.
Rodríguez, J.P., T. D. Beard, J., Agard, J., Bennett, E., Cork, S., Cumming, G., Deane, D., Dobson, A.P., Lodge, D.M., Mutale, M., Nelson, G.C., Peterson, G.D., & Ribeiro., T. (2005). Interactions among ecosystem services. In Ecosystems and human well-being: scenarios. Volume 2. Findings of the Scenarios Working Group (eds S.R. Carpenter, P.L. Pingali, E.M. Bennett & M.B. Zurek). Island Press, Washinton, D.C.
van Vuuren, L. (2009) Pongolapoort Dam: Development steeped in controversy. Water Wheel, 23-27. Acknowledgements: The capacity building project ‘Ecosystem Services for Poverty Alleviation’ was funded by the Natural Environment Research Council. The results shown here do not reflect the views of NERC, ESRC, DFID, UEA or INR, and are solely the responsibility of the authors. We thank the Mashabane, Tembe, Nyawo, Mathenjwa and Siqakatha Traditional Authorities for supporting the study and allowing the PRESPA Team to work in their respective areas. We thank Jabulani Tembe without whose help the community consultation and investigation would not have been possible. The help of the enumerators Dumisani Simelane, Nontobeko Ndlovu, Lindani Ndlovu, Moses Masinga, Thokozani Phoseka, Vusi Mpotshane who conducted the household survey is also gratefully acknowledged, as well as all the cooperation of the households who participated in the survey and the focus group meetings.
26
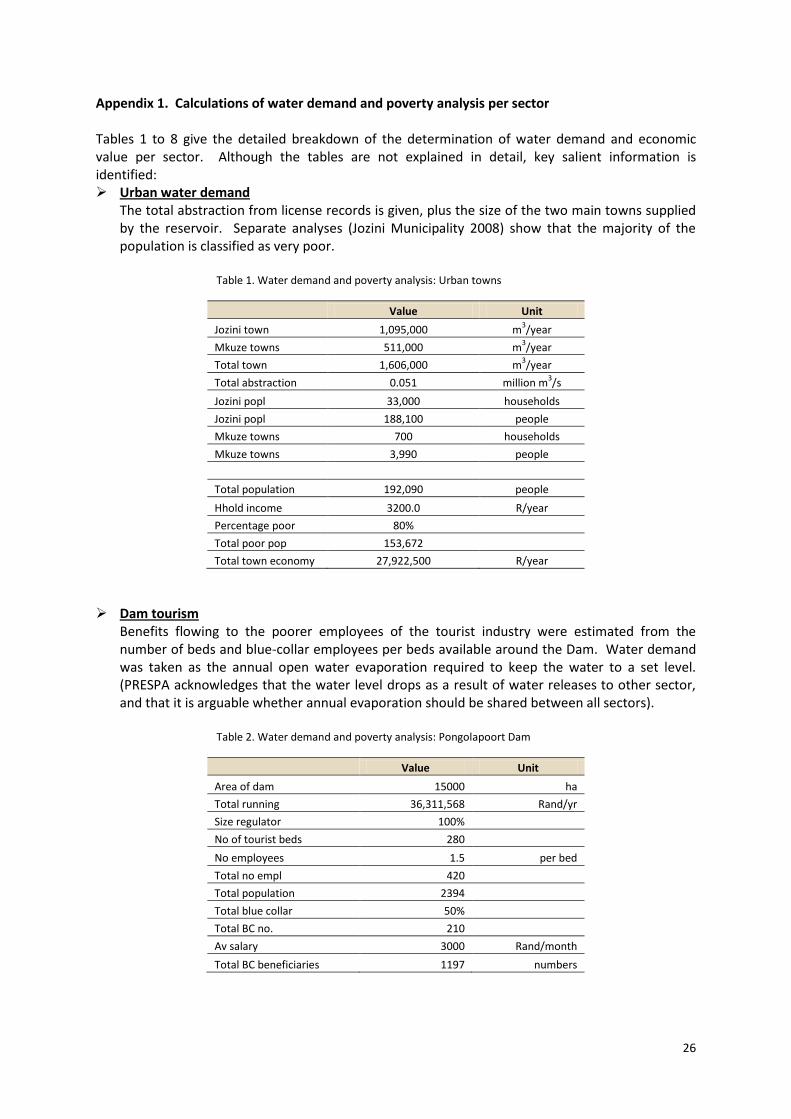
Appendix 1. Calculations of water demand and poverty analysis per sector Tables 1 to 8 give the detailed breakdown of the determination of water demand and economic value per sector. Although the tables are not explained in detail, key salient information is identified: Urban water demand
The total abstraction from license records is given, plus the size of the two main towns supplied by the reservoir. Separate analyses (Jozini Municipality 2008) show that the majority of the population is classified as very poor.
Table 1. Water demand and poverty analysis: Urban towns
Value Unit
Jozini town 1,095,000 m3/year
Mkuze towns 511,000 m3/year
Total town 1,606,000 m3/year
Total abstraction 0.051 million m3/s
Jozini popl 33,000 households
Jozini popl 188,100 people
Mkuze towns 700 households
Mkuze towns 3,990 people
Total population 192,090 people
Hhold income 3200.0 R/year
Percentage poor 80% Total poor pop 153,672 Total town economy 27,922,500 R/year
Dam tourism
Benefits flowing to the poorer employees of the tourist industry were estimated from the number of beds and blue-collar employees per beds available around the Dam. Water demand was taken as the annual open water evaporation required to keep the water to a set level. (PRESPA acknowledges that the water level drops as a result of water releases to other sector, and that it is arguable whether annual evaporation should be shared between all sectors).
Table 2. Water demand and poverty analysis: Pongolapoort Dam
Value Unit
Area of dam 15000 ha
Total running 36,311,568 Rand/yr
Size regulator 100%
No of tourist beds 280
No employees 1.5 per bed
Total no empl 420
Total population 2394
Total blue collar 50%
Total BC no. 210
Av salary 3000 Rand/month
Total BC beneficiaries 1197 numbers

27
Mkuze sugar estates The total water demand for Mkuze was determined from the annual abstraction license of 14 million m3. Total value was calculated from the production of sugarcane at current prices, while the fraction of value flowing to blue-collar workers water determined from the number of labourers on the payroll.
Table 3. Water demand and poverty analysis: Mkuze irrigation
Value Unit
Area 3,500 ha
Effective irrig efficiency 90% %
Abstraction m3 14,000,000
Additional m3 3,600,000 emerging fs
Total m3 17,600,000
License m3 32,000,000
Depth app 5,029 m3/ha
Depth app 503 mm
Total employees 1,000
Total beneficiaries 5700
Total blue collar 580
Total BC beneficiaries 3306
BC salary /month 2000 rand/mo
Makhathini irrigation
Demand was calculated from first principles in the spreadsheet using crop factors that reflected standard sugarcane cultivation under perennial cropping. The project determined that most of the black farmer-owners were not ‘poor’ but that they employed labourers that constituted 20% of their total number. Total values were determine from the income of sugarcane on an average plot size of approximately 8 hectares.
Table 4. Water demand and poverty analysis: Makhathini irrigation
Value Unit
Total area 3,000 ha
Effective irrig efficiency 65.0 %
Farmers 380 number
Additional labour 76 number
Percentage poor 20%
Total working 456 number
Average farm size 7.9 ha
Mixed crop revenue
R/year

28
Floodplain mixed vegetable agriculture
Table 5. Water demand and poverty analysis: Floodplain mixed vegetable agriculture
Value Unit
Percentage poor 90%
Seasons per year 3
Total irrigated area 6174 ha
Total productive area 18522 ha
Irrig efficiency 50% %
Farmers 11225
Farm size 0.55 ha
Total population 63983
Total poor pop 57584
Gross income/ha 2250 R/ha
Gross income/ha/year** 6750 R/ha
% wetted land mixed 54%
** This is high because three seasons per year
Masterplan cash agriculture
This sector is programmed by adjusting the total area set under different future development scenarios. The command area is incorporated into a basic perennial cropping system to determine the water demand for the project. The area cropped also establishes the number of farmer-owners and the number of blue-collar labourers then hired. Because it is believed both types of livelihoods will be drawn from poor people in the area, these two are pooled into an employment generation figure of 0.5 persons per hectare. The average salary is then taken as first approximation of the value of this development to poverty in the area.
Table 6. Water demand and poverty analysis: Masterplan cash agriculture
Value Unit
Selected area 1500 ha
Employment generation 0.5 person/ha
Monthly income generation 3200 R/month/pp
Total employed 750
Total beneficiaries 4275
Percentage poor 100%
Poor employed 750
Poor beneficiaries 4275
Effective irrig efficiency 65 %
Recalculated percentage poor 8%
Natural resources & fish
Natural resources and fish are grouped together as both are dependent on the flooding patterns of the pans in the floodplain, and both are accessed by rural families in similar ways. PRESPA determine that 80% of all (11225) households in the area were partially dependent on these resources for income and consumption, and that the income was approximately R 463 /year.

29
Table 7. Water demand and poverty analysis: Natural resources & fish
Value Unit
Percentage poor 100%
Total hholds accessing 11225
Total population 63983
Poor hholds NR/fish 11225
Total poor pop 63983
Income from NR + fish 463 R/year
Percent accessing NR & fish 80%
Cattle
PRESPA distinguished cattle from other natural resources in the area because of the patterns of access and income. PRESPA determined that 100% of households had cattle and that income was approximately R500/year. A number of corrections were employed to find an appropriate livestock density in the floodplain and adjusted for cattle that are grazed outside the area.
Table 8. Water demand and poverty analysis: Cattle
Value Unit
Percentage poor 100%
Total hholds accessing 11225
Total population 63983
Poor hholds cattle 11225
Total poor pop 63983
Income from cattle 534 R/year
Carrying capacity correction 180%
50%
% cattle outside flooded plain 25%