Entrepreneurial Activity and Economic Growth growth theory had no mechanism to explain either...
42
The research program of the Center for Economic Studies (CES) produces a wide range of theoretical and empirical economic analyses that serve to improve the statistical programs of the U.S. Bureau of the Census. Many of these analyses take the form of CES research papers. The papers are intended to make the results of CES research available to economists and other interested parties in order to encourage discussion and obtain suggestions for revision before publication. The papers are unofficial and have not undergone the review accorded official Census Bureau publications. The opinions and conclusions expressed in the papers are those of the authors and do not necessarily represent those of the U.S. Bureau of the Census. Republication in whole or part must be cleared with the authors. ENDOGENOUS GROWTH AND ENTREPRENEURIAL ACTIVITY IN CITIES by Zoltan J. Acs * University of Baltimore and Catherine Armington U.S. Bureau of the Census CES 03-02 January, 2003 All papers are screened to ensure that they do not disclose confidential information. Persons who wish to obtain a copy of the paper, submit comments about the paper, or obtain general information about the series should contact Sang V. Nguyen, Editor, Discussion Papers , Center for Economic Studies, Washington Plaza II, Room 206, Bureau of the Census, Washington, D.C. 20233-6300, (301-457-1882) or INTERNET address [email protected] .
Transcript of Entrepreneurial Activity and Economic Growth growth theory had no mechanism to explain either...
The research program of the Center for Economic Studies (CES) produces a wide range of theoretical and empirical economic analyses that serve to improve the statistical programs of the U.S. Bureau of the Census. Many of these analyses take the form of CES research papers. The papers are intended to make the results of CES research available to economists and other interested parties in order to encourage discussion and obtain suggestions for revision before publication. The papers are unofficial and have not undergone the review accorded official Census Bureau publications. The opinions and conclusions expressed in the papers are those of the authors and do not necessarily represent those of the U.S. Bureau of the Census. Republication in whole or part must be cleared with the authors.
ENDOGENOUS GROWTH AND ENTREPRENEURIAL ACTIVITY IN CITIES
by
Zoltan J. Acs * University of Baltimore
and
Catherine Armington U.S. Bureau of the Census
CES 03-02 January, 2003
All papers are screened to ensure that they do not disclose confidential information. Persons who wish to obtain a copy of the paper, submit comments about the paper, or obtain general information about the series should contact Sang V. Nguyen, Editor, Discussion Papers, Center for Economic Studies, Washington Plaza II, Room 206, Bureau of the Census, Washington, D.C. 20233-6300, (301-457-1882) or INTERNET address [email protected].
Abstract Recent theories of economic growth have stressed the role of externalities in generating growth. Using data from the Census Bureau that tracks all employers in the whole U.S. private sector economy, we examine the impact of these externalities, as measured by entrepreneurial activity, on employment growth in Local Market Areas. We find that differences in levels of entrepreneurial activity, diversity among geographically proximate industries, and the extent of human capital are positively associated with variation in growth rates, but the manufacturing sector appears to be an exception. JEL Classification: O40, R11, M13, C8 * This research was initiated and supported by the Kauffman Center for Entrepreneurial Leadership at the Ewing Marion Kauffman Foundation, at the first step of a larger project to analyze the causes of regional differences in new firm formation rates in the United States. The research was carried out at the Center for Economic Studies (CES), U. S. Bureau of the Census Washington D. C. under the title, “U. S. Geographical Diversity in Business Entry Rates.” Research results and conclusions expressed are those of the authors and do not necessarily indicate concurrence by the Bureau of the Census or the Center for Economic Studies. We would like to thank Andre van Stel, Philip Cooke David Storey, David B. Audretsch, Attila Varga, Paul Reynolds, Olav Sorenson and seminar participants at the University of Maryland at College Park, The Ohio State University, the School of Advanced Studies, Pisa, Italy, The 2002 Babson Entrepreneurship Research Conference, and the 2003 American Economic Association Meetings for valuable comments. All errors and omissions are our responsibility.

1. INTRODUCTION What is the relationship between economic growth and entrepreneurial activity—the process of
creating a new business with employees (Reynolds et al, 2002)? This question is motivated by
two further questions. First, what are the conditions, including economic, cultural and personal,
that prompt the founding of new organizations? Second, what are the important economic and
social outcomes of entrepreneurial activity? Little research has directly explored the outcomes
of entrepreneurial activity (Schoonhoven and Romanelli, 2001).
Neoclassical growth theory had no mechanism to explain either technological change or
entrepreneurial activity (Solow, 1956). Because scale economies operate at the plant level, in the
traditional Solow model economic growth relied on capital investment in larger plants.
However, capital accumulation can explain only a small amount of the variation in economic
growth across regions (Ciccone and Hall, 1996). Recent theories of economic growth view
externalities, as opposed to scale economies, as the primary engine of growth (Romer, 1986).
Because externalities operate at the level of individual agents, the role of entrepreneurs, and the
new organizations they create, may be important for growth. An important source of externalities
is knowledge spillovers. The higher the levels of knowledge, and the more interaction between
people, the greater the spillovers (Jovanovic and Rob, 1989). This concept of spillovers solves
the technical problem in economic theory of reconciling increasing returns (which are generally
needed to generate endogenous growth) with competitive markets. This suggests that if the
domestic economy is endogenously growing, and if we believe in competitive markets, then it
almost follows that knowledge spillovers feature in the economic landscape. When economists
began looking for knowledge spillovers, cities presented the clearest examples of economic
regions subject to local spillover benefits (Lucas, 1988).

For analysis of endogenous growth, cities and their broader integrated economic areas
provide much more suitable units than states or nations. The local economic areas centered on
primary cities tend to function as open economies, with a tremendous internal mobility of capital,
labor and ideas. These city-based economic areas are much more homogeneous units than those
defined by the political boundaries of states, and they frequently cross state boundaries. National
boundaries that bar factor mobility and national policies that encourage industrial diversification
eliminate the gains from factor mobility. They also aggregate factors across such wide and
diverse areas that much of the local variation may be obliterated. These forces complicate
analysis with cross-national samples. Cities allow us to look at units of economic growth
without these concerns (Glaser, Scheinkman and Shleifer, 1995).
Glaeser et al (1992), Feldman and Audretsch (1999) and Acs, FitzRoy and Smith (2002)
examined the role of externalities associated with knowledge spillovers as an engine of regional
economic growth. They tested a model of knowledge externalities and found that local
competition and industrial variety, rather than regional specialization and monopoly encouraged
employment growth, technological change and economic development. Their evidence
suggested that knowledge spillovers might occur predominately between, rather than within,
industries, consistent with the theories of Jacobs (1969). While Romer (1990) assumes that
knowledge spillovers are constant over time, and externalities operate within industries and
affect both mature and young industries alike, the empirical and theoretical literature suggests
that knowledge spillovers are more important in the early stages of the industry life cycle, when
young firms flourish (Utterback, 1994). The early 1990s were a period of intense technological
change in semiconductors, computers and communications equipment and software—The
Information Age (Jorgenson, 2001) – and these resulted in substantial product and process

changes in many other sectors.
If knowledge spillovers are more important in the early stages of the industry life cycle
and competition is more important than monopoly, the mechanics by which local competition is
achieved should receive more attention. While there is general agreement amongst researchers
that competition has a positive effect on later growth, the explanation of this fact is less clear
(Glaeser, 2000). One potential interpretation is that competition foments intellectual growth.
Alternatively, cities that are endogenously growing may have higher levels of entrepreneurial
activity. Organization ecology supports the latter, suggesting that typically entrepreneurs enter
the local economy through a new organization that involves some degree of local knowledge
spillovers and benefits from local network externalities (Hannan and Freeman, 1989). i
The purpose of this paper is to examine empirically the question, “What is the
relationship between knowledge externalities and future economic growth in a regional
economy?” We do this in the context of a modified endogenous growth model with a particular
emphasis on entrepreneurial activity and its role in promoting knowledge spillovers, thereby
leading to economic growth. We expand on prior research in several ways. First, our approach
is more comprehensive, including data for the whole private sector economy of the U.S., rather
than just selected industries or regions. Second, our unit of analysis is not just cities, but entire
local economic areas, which generally include a metropolitan area and the surrounding rural area
from which it draws both employees and consumers. Third, we focus on the early stage of the
product life cycle, when competition is fiercer and technology is more fluid, measuring
knowledge spillovers by new firm formation (Jovanovic, 2001).ii
We test the hypothesis that increased entrepreneurial activity in the early part of the
decade leads to higher subsequent growth rates of local economies. The next section of the

paper further examines some of the theories explaining variation in growth rates across local
economies. Section three discusses the data for Labor Market Areas, and measurement of the
employment growth rate. Section four examines the aggregate data showing the contribution of
new firms to economic growth. Section five presents the regression model and empirical results.
The conclusions are in the final section. We find that higher levels of entrepreneurial activity are
strongly positively associated with higher growth rates, even after controlling for regional
differences in agglomeration effects and human capital in all sectors of the economy except
manufacturing.
2. WHY DO LOCAL GROWTH RATES VARY?
The growth of cities and regions has many facets, and we focus on continuing the search for
understanding of why some areas persistently show much higher growth than others. We will
build on three theories that have been found to have an important impact on regional growth.
First, several papers in the last decade have confirmed the connection between the initial level of
human capital in an area and the more rapid growth of that area (Rauch, 1993, Glaeser et al,
1995), demonstrating the link between human capital and employment growth. Second,
knowledge spillovers may occur between firms in the same or different industries, fueling the
debate on the contributions to growth of specialization versus diversity. Romer (1986) posits
that knowledge accumulated and innovations produced by one firm tend to help other similar
firms’ technologies, or improvement of products, processes, or marketing, without appropriate
compensation. Jacobs (1969) work stresses knowledge spillovers across industries. She posits
that the crucial externality in local economic areas is cross-fertilization of ideas across different
lines of business. Third, several theories, including those of Porter (1990) and Jacobs (1969),

suggest that local competition, rather than local monopoly, promotes economic growth.
While Jacobs and Porter both assume that competition leads to economic growth, the
mechanism by which competition operates and opportunities are explored is left unexplained. In
other words, the dynamic process by which local competition is achieved remains a black box.
Porter views local competition as accelerating both imitation and improvements on the original
innovator’s idea. This has two divergent effects. Although such competition reduces the returns
to the innovator, it also increases pressure to innovate in order to remain competitive. Porter
believes that the second effect is by far the more important. Porter’s model focuses on a set of
factor conditions that include demand conditions, presence of related and supporting industries,
and firm strategy, structure and rivalry. Regions are most likely to succeed in industries or
industry segments where the “diamond,” a term used to refer to these determinants of the
system, is most favorable. The “diamond” describes a naturally reinforcing system in which
new business startups are one of the essential components of rivalry and competition.
Therefore, the Porter model suggests that intense rivalry results from entrepreneurial
activity creating new competitors. This is a process linking knowledge spillovers to growth, and
entrepreneurial activity may be the vital ingredient in this process by which externalities generate
economic growth, both within and across sectors. No matter how richly endowed an economic
environment is with intellectual, social, human, and financial resources, some person has to
organize these resources to pursue market opportunities (Baumol, 1993). Firms create output
(and jobs as a by-product), and entrepreneurs create firms. Framing the challenge this way sheds
light on new firm birth and the entrepreneurs that start them, providing a new focus for
addressing an old question—where does growth come from in local economies (Wennekers and
Thurik, 1999; Hart, 2002).

Strictly speaking, the concept of entrepreneurship operates at the individual level. While
requiring skills and other resources, essentially entrepreneurship has to do with people’s
behavior. Entrepreneurial action, or the pursuit of opportunity, takes us from the individual to
the firm level. A new business organization, in which the entrepreneur has a controlling interest
and strictly protected property rights, provides a vehicle transforming personal skills and
ambitions into actions. Underlying the start-up of each new organization is an entrepreneur who
acquired the knowledge to recognize and pursue a good business opportunity (Lazear, 2002).
Where do such opportunities come from? They come from the information and
knowledge that accumulates in every local economy, and particularly in urban aggregations of
economic and social activity. One of the key features of an urban economy is the partitioning of
knowledge among individuals. Even if the total stock of knowledge were freely available,
spatially and temporally unbounded, knowledge about the existence of any particular information
would still be limited (Hayek, 1945). Because of asymmetric information, knowledge is not
uniformly at everyone’s disposal, and no two individuals share the identical scope of knowledge
or information about the economy. Thus, only a few people may know about a new invention, a
particular scarcity, or resources lying fallow. Such knowledge is typically idiosyncratic because
it is acquired through each individual’s own channels, including jobs, social relationships, and
daily life. It is this specific knowledge, frequently obtained through knowledge spillovers, that
may lead to profit–making opportunity.
However, many more opportunities are recognized than are actively pursued. Bringing
new products and services into existence usually involves considerable risk. By definition,
entrepreneurship requires making investments today without assurance of what the returns will
be tomorrow. Despite the absence of current markets for future goods and services, and in spite

of the moral hazard when dealing with investors, suppliers, and customer markets for future
goods and services, the fact is that many individuals do succeed in creating new businesses. The
ability to overcome these barriers to entry varies among individuals, and such skill is not evenly
distributed across economic areas. According to Geroski, (1995, p. 431), “…the effect of entry
may actually be more profound than just correcting displacement from static equilibria, since
entry may also stimulate the growth and development of markets.” The market dynamics
associated with entry are not, it appears, so much those associated with changes in the size of the
population of firms or products in the market as they are those associated with changes in the
population characteristics of firms or products. At least in some, if not most, cases entry
represents agents of change in the market.
Thus, we propose a model where local economic growth is dependent on the various
information externalities present in the regional knowledge base—the set of technical and non-
technical information inputs, knowledge, and capabilities about new technologies and processes.
We estimate a model that explains differences in regional employment growth rates as a function
of the regional levels of entrepreneurial activity, agglomeration effects, and human capital, while
controlling for firm size:
(1) economic growth srt+1 = ƒ (entrepreneurial activity srt,
agglomeration effects srt, human capital rt)
where s stands for industrial sector, r stands for regions and t stands for time.
3. MEASUREMENT OF EMPLOYMENT GROWTH RATE IN REGIONS

Data and Measurement Units
This study uses a fairly new database that the Bureau of the Census has constructed for study of
birth, survival, and growth in different types of establishments. The Longitudinal Establishment
and Enterprise Microdata (LEEM) has multiple years of annual data for every U.S. private sector
(non-farm) business with employees. This analysis is based on a LEEM file that tracked
employment, payroll, and firm affiliation and (employment) size for the more than eleven
million establishments that had employees at some time during 1989 through 1996.
This LEEM file was constructed by the Bureau of the Census from its Statistics of U.S.
Business (SUSB) files,iii which were developed from the annual files of microdata underlying the
aggregate data in Census’ County Business Patterns. These annual data were linked together
using the Longitudinal Pointer File associated with the SUSB, which facilitates tracking
establishments over time, even when they change ownership and identification numbers.
The basic unit of the LEEM data is a business establishment (location or plant). An
establishment is a single physical location where business is conducted or where services or
industrial operations are performed. The microdata include the year each establishment first had
payroll expenses, and describe each establishment for each year of its existence, in terms of its
March employment, annual payroll, location (state, county, and metropolitan area), and primary
industry. Additional data for each establishment and year identify the firm to which the
establishment belongs, and the total employment of that firm.
A firm (or enterprise or company) is the largest aggregation (across all industries) of
business legal entities under common ownership or control. Establishments are owned by legal
entities, which are typically corporations, partnerships, or sole proprietorships. Most firms are
composed of only a single legal entity that operates a single establishment—their establishment

data and firm data are identical, and they are referred to as “single-unit” establishments or firms.
Only 4 percent of firms have more than one establishment, and they and their establishments are
both described as multi-location or multi-unit.
The LEEM data cover all U.S. private sector businesses with employees, with the
exception of those in agricultural production, railroads, and private households. This is the same
universe that is covered in Census’ annual County Business Patterns publications, but for this
project the establishments with positive payroll during a year and no employment in March of
that year are not counted as active.iv
The geographic unit of analysis used for this study is travel-to-work or Labor Market
Areas (LMA’s). These are aggregations of all the 3,141 countiesv in the U.S. into 394
geographical regions that each contain a high proportion of the locale’s residential-work
commutes, as defined for 1990 by Tolbert and Sizer (1996) for the Department of Agriculture.
Many of the 394 LMA’s cut across state boundaries, to better represent the functioning of local
economic areas. (States themselves are too broad to function as integrated economic areas, and
their borders frequently cut through highly integrated areas.) Some relatively isolated smaller
Commuting Zones have been grouped with adjacent areas so that all LMA’s had a minimum
population of 100,000. Despite considerable differences across LMA’s in terms of area,
population density, and total population, most of them are quite similar in their economic
structures. Their percentage of workers in different economic sectors shows little variation for
transportation, communications, wholesale and retail trade, consumer services, health, education,
social services and government employees, which together account for 56 to 60 percent of all
workers in each LMA (Reynolds, 1999). For a discussion of alternative units of observation see
Glaeser (2000).vi

We distinguish six broad industry sectors for this study, to facilitate analysis of different
industries’ sensitivities to factors affecting their growth, and to better control for aggregation
effects in regions with different shares of weak industries -- manufacturing, agriculture, and
mining sectors. This expands both the scope and the industrial detail beyond that of previous
studies, most of which were limited to manufacturing. Industry codes are based on the most
recently reported 4-digit SIC code for each establishment, except for new multi-unit firms the
SIC of their primary location is used. Most new firms are single location firms. There are very
few new multi-unit firms, and for most of them the industry classification of their primary
location is the same as that of their secondary locations. We use the most recently reported SIC
code, rather than the first reported SIC, because the precision and accuracy of the codes tends to
increase over time.vii
Sector Standard Industrial Classifications
Distributive 4000-5199 (transportation, communication, public utilities, and wholesale trade)
Manufacturing 2000-3999 Business services 7300-7399 and 8700-8799 (incl. engineering,
accounting, research, and management services)
Extractive 0700-1499 (agricultural services and mining) Retail Trade 5200-5999 Local market 1500-1799 and 6000-8999 excl. Business services
(construction, consumer and financial services)
These six broad sectors distinguish industries that might differ in their sensitivity to local
market conditions. For instance, local consumer services and construction are more dependent
on local regional demand than manufacturing and distributive services are, while manufacturing

and distributive services may have greater dependence on the supply of semi- and unskilled
labor. Growth in extractive industries is limited by the local supply of natural resources and
arable land.
Variation in Growth of Local Economic Areas
Employment in an area tends to keep pace with the growth of population in that area, ceteris
parebus, so it is useful to examine both the rate of increase in employment, and how it differs
from the rate of increase in population. It is not clear whether the growing economy is attracting
the increasing population, or the growing population is simply causing the economy to expand to
keep up with local demand and supply. Table 1 focuses on the LMA’s whose employment
growth rates from 1991 to 1996 were among the highest or lowest in the country. Further, the
last column shows the extent to which each of these area’s employment growth exceeded its
population growth rate. For the LMA growth rate comparisons in Tables 1 and 2, rates of
change of both employment and population are expressed as the five-year change divided by the
1991 level.
There is considerable variation in regional growth rates during this period. Employment
change ranged from a low of –5.9% for the LMA containing Hilo HI, to a high of 47.1% for St.
George UT. The highest excess of employment growth over population growth was the 35.2%
in Kankakee IL, followed by Laurel MS with 30.9%. There were also many cases where
employment change did not appear to be closely related to population change. About fifty
LMAs had lower growth in employment than in population in the first half of the nineties. The
poor employment growth of the Hilo LMA, cited above, was accompanied by population growth
of 9.7%, so that its relative employment growth was –15.7% over the 5-year period. Note that

two of the 10 LMA’s with the highest employment growth had relatively low population growth,
while only three of the 10 LMA’s with the highest rates of employment loss also had population
losses.
Table 2 shows the five-year growth rates for the ten largest and smallest LMAs, based on
their total employment in 1991. Employment growth rates appear to be substantially higher in
the smallest LMAs, averaging 19.6%, compared to the 3.9% average of the largest LMAs. In the
largest LMA’s employment growth just barely kept up with population growth, so their five-year
relative employment growth was a mere 0.6 percent. The population growth rates of the largest
and smallest LMAs were quite similar, so even after controlling for population growth, the
smallest LMAs had significantly higher relative employment growth.
4. CONTRIBUTION OF NEW FIRMS TO ECONOMIC GROWTH
What is the relative contribution of new firms to economic growth, in terms of new jobs?viii It is
evident from Table 3 that new firm start-ups play a far more important role in the economy than
has previously been recognized. For the economy as a whole, over the five-year period of the
early nineties, employment in 1996 of establishments that started up after 1991 accounted for
26.3% of the mean employment over that period. The growth from expanding establishments
that existed in 1991 was only 17.7% (including high and low growth), and this increase was
offset by the loss of 13.5% of their employment from shrinking establishments, and another
20.5% loss from the deaths of some of those 1991 establishments.
In the traditional growth model, the entry of new large plants played a predominant role,
while in the new growth theory the focus has shifted from scale economies to externalities. We
find support for this when we distinguish growth by the type of business—organized in single-

unit vs multi-unit firms. The employment growth rate from new single-unit firms/establishments
is much greater than that from new branch plants/locations, 31.3% vs 22.6%. This same 9%
difference is maintained between the net employment growth rates for single-unit firms versus
establishments in multi-location firms, 15.1% vs 6.5%. These differences strongly suggest that
the role of externalities leading to new firms and plants is greater than that of scale economies as
a driving factor behind growth.
Each of the six sectors had similar patterns of gross employment change rates, with the
notable exception of the very high rates of increase in business services employment from both
births (43.6%) and expansions (25.2%, including both high and low expansion rates). The
exceptionally low rate of increase from births in manufacturing (13.3%) supports Geroski’s
(1995) earlier analysis that new firm births do not appear to play an important role in
manufacturing.
These data also allow us to evaluate the frequent claim that the majority of new jobs are
created by a relatively small number of rapidly growing establishments (Bhide, 2000). If this
assessment were limited to gross job growth from expansion of existing establishments, then it is
true that a small number of high-growth establishments created more jobs than the much larger
number of low-growth establishments – increases of 8.9% from high versus 8.8% from low.
Only about four percent of establishments had high average growth rates (at least 15 percent per
year for five years). However, the total employment growth from the expansion of existing
establishments was much less than that from the birth of new establishments, except for the
manufacturing sector. And the rates of job loss from the population of existing establishments
greatly exceeded their gains from expansions. These patterns are also consistent across sectors
and firm types.

In order to gain further insight into the contribution of new organizations to economic
growth we have distinguished the employment and growth of all establishments that are single-
unit firms from those that are owned by multi-unit firms (whose secondary establishments are
commonly called plants or branches), and then separated these into age groups, according to the
age of each establishment. Figure A shows the distribution of total U. S. private non-farm
employment in 1995 by the age of establishments, for those in single-unit firms and in multi-unit
firms. This figure shows a number of interesting characteristics of U.S. businesses. First, new
establishments that are less than two years old account for only 3 percent of total employment,
and those that are new firms (single-unit establishments) account for just 1 percent of
employment, or a third of the total. However, in the subsequent two years the balance between
new firms and new multi-unit locations changes, so that establishments under four years old of
each type account for 7 percent of total employment. Obviously, both de nove firms and new
secondary-location establishments contribute new employment opportunities.ix
At the other extreme, note that establishments that are at least ten years old account for
60 percent of total employment -- most people are employed in older establishments. Contrary
to a popular image of insecure jobs in obsolete production facilities, the typical older
establishment offers jobs with good prospects for continued employment. Note also that the
majority (36% vs 24%) of employment in these older establishments is in those belonging to
multi-unit firms. Because many successful single-unit firms expand by starting up secondary
locations, this dominance by multi-unit firms is to be expected for older businesses.
Figure B shows 1995-1996 net job growth distributed by the age and type of
establishments. The class of establishments that were less than two years old accounts for all net
job growth. Establishments in all other age classes lost employment on average, whether they

were single-unit firms or multi-unit locations. Among the older age classes, the share of losses
by firm type was roughly proportional to their share of employment, with the exception of the
oldest group. A disproportionately large share of losses was incurred by establishments over 18
years old that belong to multi-unit firms. This is consistent with the trend of the last two decades
of the twentieth century of a shift towards both smaller plants and less large firms.
According to Haltiwanger and Krizan (1999, p. 94) “…for employment growth, it looks
as if the more important factor is age and not size. Put differently, most small establishments are
new and young establishments. Thus, the role of small business in job creation may simply
reflect the role of births and in turn young establishments….One clear pattern that emerges is
that net job creation rates decline with plant age.”x It is clear from Figures A and B that new
firms play an important role in economic growth. In other words, although most people work in
older establishments, growth comes primarily from new establishments and organizations.
5. EMPIRICAL MODEL
Variables and Estimation Issues
From the above discussion it should be clear that the major hypotheses concerning the regional
variation in the employment growth rates are related to dynamic externalities, and one way to
capture the extent of these spillovers is to examine how the employment growth rates vary across
regions. The literature suggests that higher employment growth rates should be associated with
increased entrepreneurial activity, increased industry diversity and higher levels of human
capital. The detailed definitions of these explanatory (independent or exogenous) variables
follow.
The flow of entrepreneurial activity is measured as the new firm birth rate, including both

new single unit firms (establishments, or locations) with less than 500 employees, and the
primary locations of new multi-unit firms with less than 500 employees firm-wide (Armington
and Acs, 2002).xi Firm birth rates are calculated for each of the 394 LMAs, for each industry
sector and for the total private sector (all-industry). The number of new firms in each LMA
would tend to be proportional to the size of the LMA, so these numbers are standardized by
dividing by the size of the local labor force (in thousands) in the central year. Labor force is
preferred to population or employment as a size indicator, because it is a better measure of the
number of potential entrepreneurs. Thus the birth rates represent the number of new firms per
thousand of labor force in each LMA. The average birth rates for the period from 1991 to 1996
were calculated from the average of the number of births in 1992, 1993, 1995, and 1996xii,
divided by the labor force in 1993 in thousands. This labor market approach has a particular
appeal, in that it is based on the theory of entrepreneurial choice. That is, each new business is
started by someone in the local economy who has chosen entrepreneurship over employment in
an existing firm. The entrepreneur starting a new business is assumed to live in the same LMA
as the new firm, and to have benefited from spillovers within that region. Higher rates of
entrepreneurial activity are expected to be associated with higher employment growth in the
same region. This approach has the added property that there is a clear lower bound of 0.00 (for
no new businesses), and a theoretical upper bound of 1.00, which would represent the extreme
case where every worker within a region started a new business during a year.
There are two important qualifications to be noted concerning the firm birth rate. The
first has to do with the timing of the recognition of the new firm. While firms enter the regional
economy on a continuous basis, the LEEM file annually reports only the first quarter
employment of each establishment and firm, representing their employees during their March 15

pay-period each year. If an establishment hires its first employee after March, we do not count
the new firm as active until the following year. Therefore, the new firms that we count have had
employees for an average of six months by the time the LEEM file records their ‘first’
employment (Acs and Armington, 1998). Second, the birth rate greatly under-represents the
level of entrepreneurial activity because it only measures the activity that actually succeeds in
starting a business with employees during a March pay-period. The average time between an
enterpreneur’s decision to create a new organization and the initial operation of the business has
been found to be about two years (Reynolds et al, 2002). Therefore, much of the entrepreneurial
activity has taken place two to three years earlier than the first appearance of the firm’s
employment in the LEEM file. Furthermore, some portion of the new firms with employees
close before their first March, so their formation never gets counted in our data.
Our second measure of entrepreneurial activity measures the share of business owners in
the area. This is less of a measure of entrepreneurship and more a measure of the local
dominance of small business. Proprietors are members of the labor force who are also business
owners. In addition to those who own firms with employees, this measure includes the self-
employed who have no employees. The share of proprietors is defined for each LMA as the
number of proprietors in 1991 divided by the 1991 labor force. This share averaged 20.5 percent
nationally, and varied from a low of 9.9 percent to a high of 44.8 percent across LMA’s.
Entrepreneurs tend to concentrate geographically in part because of the social
environment, and because of the way the latter influences individuals’ decisions. The existing
stock of proprietors could be important to stimulating economic growth for at least two reasons.
First, these individuals have experience with starting new firms and they may share details of
that experience with others. Second, they also provide a demonstration effect. Many well-

established psychological theories contribute to explaining how evidence of greater frequency of
successful entrepreneurial activity would increase the propensity of attempted entry into
entrepreneurship. Specifically, when making decisions, individuals tend to follow socials cues
and are influenced by what others have chosen, especially when facing ambiguous situations.
The share of proprietors should be positively related to the growth of local economies
(Bresnahan et al, 2001).
We include two measures of agglomeration effects that characterized local economies.
Many studies have attempted to measure industry specialization within an economic area with a
simple measure of establishment density per square mile of the area, but this may be more
indicative of the extent of physical crowding of businesses, which is related to the probable
relative costs of doing business there. Therefore, we measure specialization as the industry
intensity -- the number of establishments in each industry and region in 1991 divided by the
region’s 1991 population. After standardizing by the national average, this measure is almost
identical to the specialization measure used by Glaeser et al (1992). Industry intensity should be
positively related to employment growth if specialization is important for regional growth. A
negative relationship would suggest that the competitive effects of specialization are stronger
than its contribution to knowledge spillovers.
To control for the vast differences in the physical density of economic activity we use
establishment density, defined as the number of establishments per square mile in that industry in
1991. If firms in cities or other areas with high concentrations of businesses benefit from the
closeness of other businesses in the same sector, then higher establishment densities should be
positively related to employment growth. Since the regression analysis uses each area’s relative
levels of establishment density in each industry, rather than absolute levels, there is no need to

correct for differences in national industry presence or demand. Establishment density should be
positively related to local growth rates if agglomerations drive demand or increase network
externalities (Ciccone and Hall, 1996).
We include two measures of human capital that have been found to have a positive
impact on regional growth in previous studies (Simon and Nardinelli, 2002). The first is the
share of adults with at least a high school degree, with adults defined as persons 25 years or
older. Those adults without high school degrees are the principal supply of unskilled and semi-
skilled labor for work in manufacturing branch plants and retail or unskilled service
establishments. Higher shares of high school graduates indicate a generally higher level of
human capital in the area. In 1990 73.0 percent of adults had at least a high school degree,
nationally.
The second measure of educational attainment is the share of college graduates, defined
as the number of adults with college degrees in 1990, divided by the total number of adults. This
is a proxy measure of both the technical skills needed in the economy, and the skills needed to
start and build a business. In 1990 an average of 15.9 percent of the adult population had a
college degree. Naturally, the number of college degree holders is included in the number of
high school degree holders, so these two measures will suffer from collinearity, and we will test
them separately. We expect that employment growth will be positively related to higher average
levels of education, at both the high school and the college level (Glaeser et al, 1995).
To control for differences in the size distribution of businesses in each industry and
region, we include average local establishment size, measured for each industry sector and
economic area by dividing the number of local employees in 1991 by the number of local
establishments in 1991 in each sector. Mean establishment sizes vary nationally from 11

employees for the local market sector up to 55 for manufacturing. Again, while these numbers
are presented raw in Table 4, for the regressions we convert these levels to relative levels, by
dividing all area numbers by the corresponding industry mean and standard deviation for the U.
S., so that their scale will be the same for all industries. Regions that are dominated by large
branch plants or firms are likely to be less competitive than those with many smaller
establishments. The spatial division of labor within multi-site enterprises has resulted in some
areas being dominated by externally owned branch plants performing routine assembly and
production services, or by large-scale retail outlets.
All variables are used in the regressions in their standardized form, so that the national
mean is subtracted from each, and the resulting relative rate is divided by its standard deviation
across all LMAs. Thus, each standardized variable measures how the area differs from the
national average, in terms of the standard deviation of that variable. Standardizing their
distribution over LMA’s so that each has a mean of zero and a standard deviation of 1 allows us
to make direct comparisons of the estimated standardized beta coefficients for different industry
sectors in Table 5. Each coefficient can then be interpreted as the share of the independent
variable’s standard deviation that is reflected in the local deviation of the employment change
rate from average rates.
Of course, some of these variables may in fact be endogenous or correlated with other
variables. Share of regional population with high school degrees is highly correlated with the
share holding college degrees. Certainly, the average size of establishments is smaller when the
share of proprietors is higher, as confirmed by their simple correlation of –0.63. Both the
industry intensity and the establishment density are partially the effect of firm startups in the
past, as well as contributing factors during the period under study. We will control for some of

these econometrically by separately estimating a birth equation and then including the predicted
value of births in the employment growth equation. For others we estimate alternative models
with subsets of these variables.
The counts of firm births and numbers of establishments and employees were tabulated
by LMA, industry sector, and year from the LEEM file at the U.S. Bureau of the Census, Center
for Economic Studies in suburban Washington DC. All other variables were tabulated from
county-level data collected (often from other agencies) on a cd called ‘USA Counties 1998’ by
the U.S. Census Bureau. Table 4 presents summary statistics for all variables. A data appendix
with additional detail is available from the authors.
Empirical Results
We estimate a regression model where the dependent variable is (compounded) average annual
employment growth rates over the 5-year period of the early nineties. This is measured as the
fifth root of the ratio of 1996 employment to 1991 employment in each LMA and sector: The
annual average growth rate of each local economic area is defined as:
(2) Average annual employment growth rate srt+1 = (empl srt+1 / empl srt) ** .2 .
For all industries together the local growth rates varied from 0.988 (or –1.2% annual average
change) to 1.080 (or 8.0% annual average change). The equations are estimated for 394 LMAs
for all industries together, as well as for each of our six industry sectors separately.
There are three important results in the estimated model of local growth differences
presented in Table 5. First, the coefficient on the firm birth rate, which serves as a proxy for
entrepreneurial activity is positive, large, and statistically significant, as hypothesized. This

supports the theory of Porter (1990), that the firm birth rate is an important determinant of
regional employment growth and that growth is higher in areas with greater competition and
lower barriers to entry.
These results are robust for five of our six industry sectors, with the exception of
manufacturing, where it was insignificant. This exception explains the prior findings of
industrial organization economists that entry is not important for employment growth in
manufacturing (e.g. Geroski, 1995). Much of the research in industrial organization, labor
economics and regional science has been limited to analysis of data from the manufacturing
sector, and these results have been frequently generalized to the whole economy. It appears that
those generalizations from the behavior of manufacturing firms are not always valid, but may be
valid for other industries dominated by large plants.
Our findings of positive relationships between firm birth and local economic growth rate
differences are inconsistent with Fritsch (1997) who found no relationship between firm birth
and employment growth in Germany, but they are consistent with Reynolds (1999), who found a
similar relationship. Certain aspects of our results are consistent with Audretsch and Fritsch
(2002), and with Glaeser et al (1992), who found the impact of competition on growth stronger
outside of manufacturing than in manufacturing. xiii
The coefficient on the share of proprietors is positive and statistically significant
suggesting that the greater the share of proprietors in a region the higher the growth rate.
However, this relationship did not hold up for most of the industrial sectors, probably because
sector-specific data were not available for share of proprietors. The coefficient for the share of
proprietors is only about one quarter of that for entrepreneurial activity, suggesting that it is not
so much the accumulated stock of entrepreneurial activity but the flow that is important for

economic growth. This result also suggests that it is younger age and not smaller size per se that
is more important for promoting growth and productivity.
Second, the negative and statistically significant coefficient on industry intensity suggests
that greater geographic specialization (or less industrial diversity) lead to less growth, rather than
greater growth. These results are again robust for all industries sectors with the exception of
manufacturing, where the coefficient is positive but not significant. This suggests that
specialization does not generally lead to higher levels of technological externalities or other
knowledge spillovers that promote growth in the same industry sector. This is consistent with
the findings of Glaeser et al (1992), Feldman and Audretsch (1999) and Acs, FitzRoy and Smith
(2002).
The negative and statistically significant coefficients on establishment density suggest
that when other factors are the same, employment growth will be greater in regions that have less
physical crowding in their industry. Thus, when measured by the number of establishments per
square mile, the agglomeration effect on growth seems to be negative for Labor Market Areas.
This is in contrast with the findings of Glaeser et al (1992) and Ciccone and Hall (1996), who
used growth in other industries in each area as an indication of the size of the agglomeration
effect, and found a positive relationship with growth. Indeed, it contrasts with much of the
theoretical literature on agglomerations (Krugman, 1991). Perhaps these older studies’ inability
to adequately measure the impact of differences in the level of competition resulted in the
agglomeration variables serving as proxies for competition instead.
Third, the greater the proportion of the area’s adults with a high school degree, the higher
the growth rates. However, after all of the other exogenous variables are taken into account, the
additional impact of higher proportions of college graduates was negative but insignificant.

These results suggest that a broad basically educated labor force may contribute more to growth
than the presence of relatively large numbers of college graduates. These results are consistent
with Glaeser et al (1995) and Simon and Nardinelli (2002). These human capital variables were
weaker and inconsistent for the various industry sectors. When the all-industry regression was
run without the college graduate measure, the results were virtually unchanged (see Table 6).
Both of these human capital variables were dropped and this had no substantial impact on the
estimated parameters for the remaining variables either. Therefore, the results are robust with
respect to the inclusion or exclusion of the human capital variables.xiv
The alternative model formulations shown in Table 6 also allow a little closer
examination of the association between firm birth rates and growth. While birth seems to be the
best available measure of the relative levels of competition (low barriers to entry) within
industries and areas, it also involves some new employment in the new firms, adding directly to
the growth of the region. In prior work we found that local rates of new firm birth were strongly
related to many of these same characteristics of local economic areas (Armington and Acs,
2002). The local firm birth rate could be substantially predicted as a function of local industry
intensity and establishment density, average establishment size, share of proprietors, local
income and population growth, unemployment rate, and both high school and college
educational attainment shares. By substituting into equation D both the predicted firm birth rates
and the unexplained (or residual) component of the actual firm birth rates, in place of the actual
firm birth rates, the explanatory power of the regression increases while the qualitative results
are unchanged.
The coefficient on the predicted firm birth rate is very similar to that on the actual firm
birth rate. We can see that even the unexplained portion of the firm birthxv has a significant

positive relationship to local area growth rate variation, indicating that other local characteristics
(missing variables in the birth rate model) that lead to higher firm birth rates also lead to higher
growth rates, although the coefficient on this is small.
Because establishment size and the share of proprietors are negatively correlated we also
estimated equation E, without the establishment size variable. The results are again robust with
respect to this specification of the model. Finally, in equation F we estimate equation A without
the firm birth rate. The results are unequivocal -- without the new firm birth rate the equation
loses most of its explanatory power and most of the other coefficients become insignificant.
Regional growth rate variation is closely associated with the regional variation in new firm start-
up rates.
6. CONCLUSIONS
Recent theories of economic growth view local externalities as opposed to scale economies as
the primary engine in generating growth in cities and their closely integrated surrounding
counties (Labor Market Areas). While scale economies operate at the plant level externalities
operate at the level of the firm, primarily through entrepreneurial activity. We examined the
impact of these externalities on regional employment growth from an entrepreneurial perspective
by examining the relationship of local economic growth to local entrepreneurial activity. Since
higher rates of entrepreneurial activity in an industry sector and region imply lower barriers to
birth and greater local competition, this analysis can also be interpreted as an investigation of the
impact of local competition on local economic growth. Using data on 394 local economic areas
and six industrial sectors, covering the entire (non-farm) private sector economy of the U.S., we
found that higher rates of entrepreneurial activity were strongly associated with faster growth of

local economies.
Industrial specialization has a negative effect on local employment growth, after
controlling for birth rates, agglomeration effects, and differences in educational attainment.
These results are consistent with the theories of Porter that stress the role of business formation
in promoting rivalry and competition. Many of the most interesting explanations for the
connection between growth and initial human capital levels across countries and cities have
focused on productive externalities generated by schooling. The relatively weak relationship
between schooling and growth for LMAs suggests that the primary impact of such human capital
differences is on new firm formation rates, which impact substantially on local growth rates.
This provides some evidence of an important mechanism by which local educational attainment
affects the rate of economic expansion.
Our analysis also suggests that new organizations play an important role in taking
advantage of knowledge externalities within a region, and that entrepreneurship may be the
vehicle by which these spillovers contribute to economic growth (Hannan and Freeman, 1989).
Specifically we find that new firms are more important than the stock of firms in a region, but
the manufacturing sector appears to be an exception. This is consistent with prior research on
manufacturing. These results, while preliminary, suggest that theories of growth should study
entrepreneurship to better understand how knowledge spillovers operate. Further, an extension
of this analysis to include the rates of formation of new secondary locations of multi-unit firms
would help to distinguish the role of local entrepreneurial activity from the impact of expansion
of existing firms into other locations.
REFERENCES
Acs, Z.J. and C. Armington, 1998, ”Longitudinal Establishment and Enterprise Microdata (LEEM) Documentation”, Washington DC: Center for Economic Studies, U. S. Bureau of the Census, CES 98-9. Acs, Z. J., 2002, Innovation and the Growth of Cities, Cheltenham: Edward Elgar. Acs, Z.J., F. FitzRoy and I. Smith, 2002, “High Technology Employment, and R&D in Cities: Heterogeneity vs. Specialization”, Annals of Regional Science, 36(1), 269-371. Armington, C. and Z.J. Acs, 2002, “The Determinants of Regional Variation in New Firm Formation”, Regional Studies, 36(1), 33-45. Audretsch D. and M. Fritsch, 2002, “Growth Regimes over Time and Space,” Regional Studies, 36, 113-124 Bartik, T.J., 1989, “Small Business Start-ups in the U. S.: Estimates of the Effects of Characteristics of States,” Southern Economic Journal, 55, 1004-18. Baumol, W.J., 1993, Entrepreneurship, Management, and the Structure of Payoffs, Cambridge: MIT Press. Bhide, A., 2000, The Origin and Evolution of New Businesses, New York: Oxford University Press. Bresnahan, T., A. Gambardella and A. Saxenian, 2001, “ ‘Old Economy’ Inputs for ‘New Economy’ Outcomes: Cluster Formation in the New Silicon Valleys,” Industrial and Corporate Change, 10(4), 835-860. Carree, M and .L. Klomp, 1996, “Small Business and Job Creation: A comment,“ Small Business Economics, 8(4), 317-322. Ciccone, C. and R.E. Hall, 1996, “Productivity and the Density of Economic Activity,” American Economic Review, 86(1), 54-70. Davis, S.J., Haltiwanger and S. Schuh, 1996, Job Creation and Job Destruction, Cambridge, MA: The MIT Press. Feldman, M.P., and D.B. Audretsch, 1999, “Innovation in Cities: Science-Based Diversity, Specialization and Localized Competition,” European Economic Review 43, 409-429. Fritsch, M., 1997, “New Firms and Regional Employment Change”, Small Business Economics 9(5), 437-447. Geroski, P., 1995, “What do We Know About Entry?” International Journal of Industrial

Organization 13(4), 421-441. Glaeser, E.L., H.D. Kallal, J.A. Scheinkman and A. Shleifer, 1992, “Growth in Cities”, Journal of Political Economy 100(6), 1126-1152. Glaeser, E.L., J.A. Scheinkman and A. Shleifer, 1995, “Economic Growth in a Cross-section of Cities”, Journal of Monetary Economics 36, 117-143. Glaeser, E.L., 2000, “The New Economics of Urban and Regional Growth” in G.L. Clark, M.P. Feldman, and M.S. Gertler The Oxford Handbook of Economic Geography, New York: Oxford University Press, 83-98. Haltiwanger, J., and C.J. Krizan, 1999, “Small Business and Job Creation in the United States: The Role of New and Young Business,” in Z. J. Acs, ed., Are Small Firms Important? Boston: Kluwer Academic Publishers, 52-79. Hannan, M. T. and J. Freeman, 1989, Organizational Ecology, Cambridge: Harvard University Press. Hart, D., 2002, The Emergence of Entrepreneurship Policy: Governance, Start-Ups, and Growth in the Knowledge Economy, New York: Cambridge University Press, in press. Hayek, F., 1945, “The Use of Knowledge in Society”, American Economic Review 35, 519-530. Jacobs, J., 1969, The Economy of Cities, New York: Vintage. Jorgenson, Dale, W., 2001, “Information Technology and the U. S. Economy,” The American Economic Review 91(1), 1-32. Jovanovic, Boyan, 2001, “New Technology and the Small Firm,” Small Business Economics, 16(1), 53-55. Jovanovic, B. and R. Rob, 1989, ‘The Growth and Diffusion of Knowledge’, Review of Economic Studies 56, 569-582. Kirchhoff, B., and P.G. Greene, 1998, “Understanding the Theoretical and Empirical Content of Critiques of U. S. Job Creation Research, Small Business Economics, 10(2), 153-159. Krugman, P., 1991, “Increasing Returns and Economic Geography”, Journal of Political Economy 99, 483-99. Lazear, E.P., (2002) “Entrepreneurship”, National Bureau of Economic Research, Cambridge, MA, August 2002, Working Paper 9106. Lucas, R.E., Jr., 1988, “On the Mechanisms of Economic Development”, Journal of Monetary Economics 22, 3-42.

Porter, M.E., 1990, The Competitive Advantage of Nations, New York: The Free Press. Rauch, J.E., 1993, “Productivity Gains from Geographic Concentration of Human Capital: Evidence form the Cities”, Journal of Urban Economics 34, 380-400. Reynolds, P.D., 1999, “Creative Destruction”, in Acs, Carlsson and Karlsson, eds., Entrepreneurship, Small & Medium-sized Enterprises and the Macroeconomy, Cambridge: Cambridge University Press, pp. 97-136. Reynolds, P.D., W.D. Bygrave, E. Autio, M. Hay, 2002, Global Entrepreneurship Monitor, London: London Business School. Romer, P., 1990, “Endogenous Technological Change”, Journal of Political Economy 98, S71-S102. Romer, P., 1986, “Increasing Returns and Long Run Growth”, Journal of Political Economy 94, 1002-1037. Schoonhoven, C.B. and E. Romanelli, 2001, The Entrepreneurship Dynamic, Stanford: Stanford University Press. Schumpeter, J.A., 1942, Capitalism, Socialism and Democracy, New York: Harper and Row. Simon, C.J. and C. Nardinelli, 2002, “Human Capital and the Rise of American Cities,” 1900-1990, Regional Science and Urban Economics, 32, 59-96. Solow, R.M., 1956, “A Contribution to the Theory of Economic Growth”, Quarterly Journal of Economics 94, 614-623. Tolbert, C.M. and M. Sizer, 1996, U.S. Commuting Zones and Labor Market Areas: a 1990 Update, Rural Economy Division, Economic Research Service, U.S. Department of Agriculture. Utterback, J.M., 1994, Mastering the Dynamics of Innovation, Cambridge, Harvard Business School Press. Wennekers, S. and R. Thurik, 1999, “Linking Entrepreneurship and Economic Growth”, Small Business Economics 13(1), 27-55.

Figure A: Distributions of 1995 Employment by Age and Type of Establishment
1%
6% 6% 6% 6% 5%
13%
2%
8%6%
7% 10%
19%
5%
0
0.05
0.1
0.15
0.2
0.25
0.3
0.35
0-1 years 2-3 years 4-6 years 7-9 years 10-13 yrs 14-18 yrs 19 or older
Years of age in 1996
Per c
ent o
f tot
al 1
995
empl
oym
ent (
100.
3 m
il)
multi-unit locationssingle unit firms

Figure B: 1995-96 Net Job Growth Distribution by Age and Type of Establishment
150%
-15% -15% -12% -12% -10% -18%
143%
-7%-19%
-14% -15% -20%
-36%
-75%
-50%
-25%
0%
25%
50%
75%
100%
125%
150%
175%
200%
225%
250%
275%
300%
0-1 years 2-3 years 4-6 years 7-9 years 10-13 yrs 14-18 yrs 19 or olderYears of Age in 1996
Per c
ent o
f tot
al n
et jo
b gr
owth
(1.8
7 m
il)
multi-unit locationssingle unit firms

Table 1: Five Year Growth Rates from 1991 to 1996 by Labor Market Area
LMA 1991 Empl Empl.gr'th Popul.gr'th empgr-popgr
Highest empl.growth359 St. George UT 34,400 47.1% 24.0% 23.0%298 Monett MO 27,362 39.9% 18.6% 21.4%312 Austin TX 321,222 38.8% 18.5% 20.3%242 Kankakee IL 41,609 38.8% 3.6% 35.2%360 Provo UT 87,500 37.2% 18.1% 19.1%379 Las Vegas NV 391,494 35.9% 28.1% 7.8%284 Colorado Springs CO 138,892 35.8% 18.9% 16.9%352 Grand Junction CO 45,682 34.5% 15.0% 19.5%354 Flagstaff AZ 60,529 34.4% 18.5% 15.9%28 Laurel MS 24,645 32.9% 2.0% 30.9%
Lowest empl.growth177 Syracuse NY 401,336 -1.5% -2.0% 0.5%383 Los Angeles CA 5,639,265 -1.6% 3.9% -5.5%208 Springfield MA 241,400 -2.0% -1.4% -0.6%187 Sunbury PA 60,697 -2.5% 3.0% -5.6%371 Bakersfield CA 138,692 -3.1% 8.5% -11.6%183 Watertown NY 60,656 -3.5% 1.3% -4.8%179 Binghamton NY 103,907 -3.6% -3.4% -0.1%347 Honolulu HI 400,509 -3.8% 4.3% -8.1%193 Poughkeepsie NY 238,525 -5.8% 1.6% -7.4%356 Hilo HI 41,089 -5.9% 9.7% -15.7%
* Empgr-Popgr represents the rate at which employment increased in excess of the overall growth rate of the population.
Source: 1989-1996 LEEM File, U. S. Bureau of the Census. by Armington and Acs for Kauffman Foundation for Entrepreneurial Leadership.
for LMA's with Highest and Lowest Employment Growth Rates(growth measured as 5-year change divided by 1991 level)

1991 Empl. Empl.gr'th Popul.gr'th Empgr-Popgr*Largest LMA's
383 Los Angeles CA 5,639,265 -1.6% 3.9% -5.5%194 New York NY 4,290,264 0.6% 1.1% -0.5%243 Chicago IL 3,302,354 7.0% 4.5% 2.5%113 ArlngtnWashBalt VA 2,639,292 7.4% 3.8% 3.6%196 Newark NJ 2,359,911 3.1% 2.4% 0.7%197 Phladelphia PA 2,154,296 2.5% 0.4% 2.0%205 Boston MA 2,143,471 7.1% 1.9% 5.1%116 Detroit MI 1,921,754 13.0% 3.6% 9.4%378 San Francisco CA 1,772,575 3.1% 3.6% -0.5%320 Houston TX 1,567,212 8.2% 9.8% -1.5%
average of 10 largest 3.9% 3.3% 0.6%
Smallest LMA's
77 Lake City FL 27,522 15.1% 11.7% 3.4%298 Monett MO 27,362 39.9% 18.6% 21.4%158 Athens OH 26,508 10.7% 3.2% 7.6%337 Ardmore OK 26,068 16.4% 3.5% 12.9%258 Blytheville AR 25,229 19.9% -5.8% 25.7%283 North Platte NE 24,722 15.9% 1.5% 14.4%28 Laurel MS 24,645 32.9% 2.0% 30.9%327 Brownwood TX 23,711 19.6% 5.4% 14.2%324 Big Spring TX 21,698 10.7% 1.9% 8.8%245 FortLeonardWood MO 19,895 11.9% -1.0% 12.9%
average of 10 smallest 19.6% 4.4% 15.2%
* Empgr-Popgr represents the rate at which employment increased in excess of the overall growth rate of the population.
Source: 1989-1996 LEEM File, U. S. Bureau of the Census. by Armington and Acs for Kauffman Foundation for Entrepreneurial Leadership.
Table 2: Five Year Growth Rates for 1991-1996 by Labor Market Area for Largest and Smallest LMA's(growth measured as five-year change divided by 1991 level)

Table 3: Establishment employment and 1991-96 net and gross job flows, by firm type, and by industry sector
Establ. Class1991 1996 net birth high* low shrink death
All 92,265,576 102,149,281 10.2% 26.3% 8.9% 8.8% -13.5% -20.5%
Firm type Single unit 38,532,294 44,811,609 15.1% 31.3% 9.8% 10.3% -11.1% -25.3% Multi-unit 53,731,429 57,324,994 6.5% 22.6% 8.3% 7.7% -15.3% -16.9%
Industry SectorBus. services 7,780,445 10,385,762 28.7% 43.6% 7.4% 17.8% -14.6% -25.5%Distribution 11,887,375 12,719,155 6.8% 23.4% 9.4% 10.5% -14.8% -21.7%Extractive 1,269,551 1,237,600 -2.5% 24.5% 8.6% 10.7% -18.5% -27.9%Local market 33,434,183 37,773,144 12.2% 25.8% 9.4% 8.5% -12.8% -18.7%Manufactures 18,450,502 18,556,546 0.6% 13.3% 9.4% 7.6% -14.2% -15.5%Retail trade 19,443,520 21,477,074 9.9% 33.3% 8.0% 5.4% -12.3% -24.4%
All growth rates are based on the mean of 1991 and 1996 employment for the class of establishments.Size classified in 1991, except new establishments classified in 1996; type = multi if multi-unit in either year.*High-growth establishments expanded by an average of at least 15% per year (adding at least 5 empl.).
Source: 1989-96 LEEM file, U.S. Bureau of the Census. by Armington and Acs for Kauffman Foundation for Entrepreneurial Leadership.
91-96 empl. change as % of mean employment Employment expansion
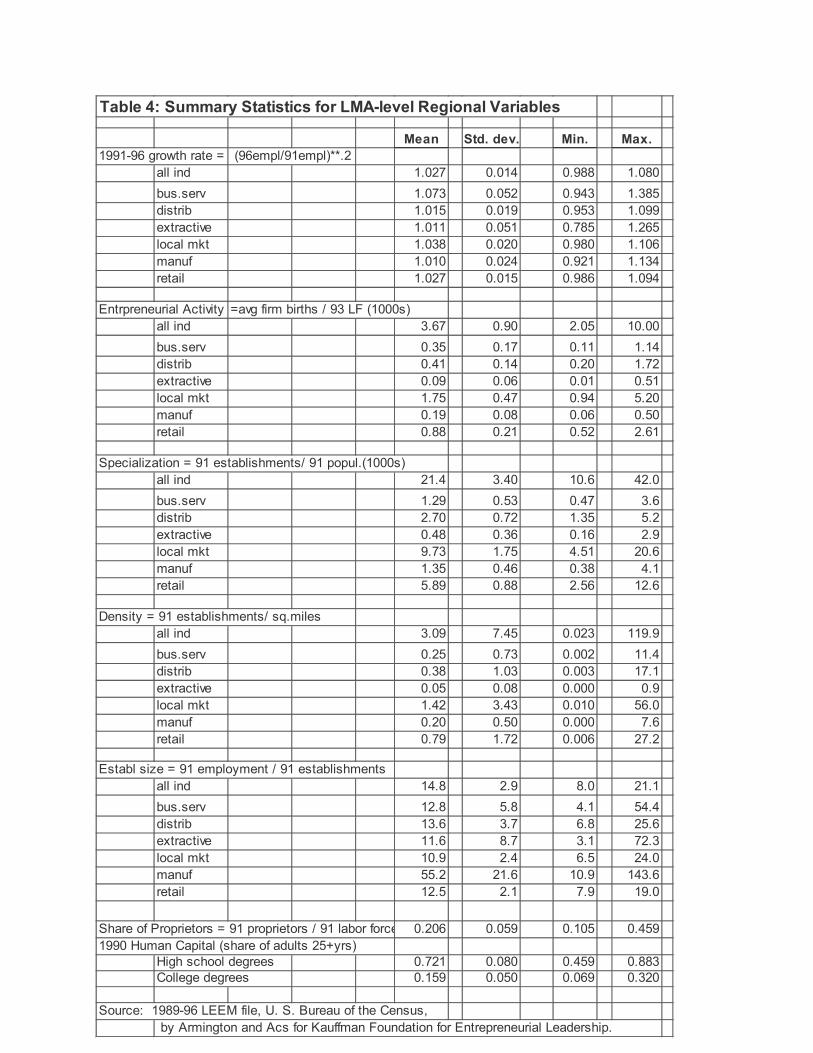
Table 4: Summary Statistics for LMA-level Regional Variables
Mean Std. dev. Min. Max.1991-96 growth rate = (96empl/91empl)**.2
all ind 1.027 0.014 0.988 1.080bus.serv 1.073 0.052 0.943 1.385distrib 1.015 0.019 0.953 1.099extractive 1.011 0.051 0.785 1.265local mkt 1.038 0.020 0.980 1.106manuf 1.010 0.024 0.921 1.134retail 1.027 0.015 0.986 1.094
Entrpreneurial Activity =avg firm births / 93 LF (1000s)all ind 3.67 0.90 2.05 10.00bus.serv 0.35 0.17 0.11 1.14distrib 0.41 0.14 0.20 1.72extractive 0.09 0.06 0.01 0.51local mkt 1.75 0.47 0.94 5.20manuf 0.19 0.08 0.06 0.50retail 0.88 0.21 0.52 2.61
Specialization = 91 establishments/ 91 popul.(1000s)all ind 21.4 3.40 10.6 42.0bus.serv 1.29 0.53 0.47 3.6distrib 2.70 0.72 1.35 5.2extractive 0.48 0.36 0.16 2.9local mkt 9.73 1.75 4.51 20.6manuf 1.35 0.46 0.38 4.1retail 5.89 0.88 2.56 12.6
Density = 91 establishments/ sq.milesall ind 3.09 7.45 0.023 119.9bus.serv 0.25 0.73 0.002 11.4distrib 0.38 1.03 0.003 17.1extractive 0.05 0.08 0.000 0.9local mkt 1.42 3.43 0.010 56.0manuf 0.20 0.50 0.000 7.6retail 0.79 1.72 0.006 27.2
Establ size = 91 employment / 91 establishmentsall ind 14.8 2.9 8.0 21.1bus.serv 12.8 5.8 4.1 54.4distrib 13.6 3.7 6.8 25.6extractive 11.6 8.7 3.1 72.3local mkt 10.9 2.4 6.5 24.0manuf 55.2 21.6 10.9 143.6retail 12.5 2.1 7.9 19.0
Share of Proprietors = 91 proprietors / 91 labor force 0.206 0.059 0.105 0.4591990 Human Capital (share of adults 25+yrs)
High school degrees 0.721 0.080 0.459 0.883College degrees 0.159 0.050 0.069 0.320
Source: 1989-96 LEEM file, U. S. Bureau of the Census, by Armington and Acs for Kauffman Foundation for Entrepreneurial Leadership.

Table 5: Analysis of Factors Associated with Differences in Employment GrowthRates in LMA's by Industry Sectors(estimated standardized beta coefficients, with t-ratios below, bold if significant at 0.05 level)
1991-96 empl change rate All ind. Bus.serv. Distribut. Extract. ocal mkt. Manuf. Retail
R sqrd 0.33 0.10 0.13 0.31 0.44 0.14 0.25
Observations 394 394 394 394 394 394 394
Entrepreneurial activity 0.62 0.57 0.41 0.42 0.54 -0.04 0.54 avg ann 91-96 births / 93LF 11.3 4.96 6.86 5.19 11.3 -0.59 8.98
Share of proprietors 0.16 -0.14 0.01 0.01 0.03 0.21 0.02 91 proprietors / labor force 2.81 -2.54 0.10 0.09 0.61 3.79 0.34
Specialization -0.30 -0.57 -0.28 -0.53 -0.50 0.14 -0.34 91 ind establ / population -4.78 -3.97 -4.10 -6.30 -8.40 1.92 -5.19
Density -0.22 -0.05 -0.11 -0.14 -0.13 -0.15 -0.23 91 ind. estab /sq mile -4.61 -0.91 -1.97 -2.84 -2.91 -2.75 -4.78
Human Capital 0.14 0.12 0.16 0.03 -0.08 0.06 -0.04 90 h-s degr./adults (25+) 2.02 1.61 2.06 0.40 -1.23 0.87 -0.56
Human Capital -0.11 -0.03 0.06 0.13 0.10 -0.15 0.02 90 college degr./adults -1.66 -0.34 0.73 1.87 1.51 -2.02 0.22
Establ size 0.20 -0.17 -0.07 -0.41 -0.25 -0.09 0.07 91 ind. empl / ind. establ 3.26 -3.02 -1.03 -9.30 -4.55 -1.61 0.96

for All Industries
1991-96 empl change rate A B C D E F
R sqrd 0.31 0.31 0.30 0.35 0.29 0.08
Observations 394 394 394 394 394 394
Entrepreneurial activity 0.62 0.59 0.59 0.56 avg ann 91-96 births / 93LF 11.3 11.40 11.3 10.7
Share of proprietors 0.16 0.18 0.18 0.07 0.16 91 proprietors / labor force 2.81 3.04 3.14 1.45 2.31
Specialization -0.30 -0.30 -0.26 -0.35 -0.31 -0.05 91 establ / population -4.78 -4.82 -4.87 -6.43 -5.01 -0.71
Density -0.22 -0.24 -0.23 -0.23 -0.20 -0.22 91 estab /sq mile -4.61 -5.13 -5.10 -5.16 -4.25 -4.16
Human Capital 0.14 0.07 0.14 -0.05 90 hs degr. /adults (25+) 2.02 1.25 2.11 -0.65
Human Capital -0.11 -0.06 0.14 90 college degr./adults -1.66 -0.91 1.87
Establ size 0.20 0.17 0.19 0.15 -0.04 91 empl / establ 3.26 2.95 3.35 3.11 -0.56
Predicted firm birth rate* 0.72 95-6 avg annual births / LF 12.5
Unexplained birth rate* 0.12 Actual-predicted 95-6 birth 2.91
* based on estimate of average of 95 and 96 firm births per 1000 of local labor force, as a function of establishment size, industry intensity, growth in personal income and in population, share of proprietors, unemployment rate, share of adults with high school degrees, and college degrees. The unexplained variation is primarily associated with less easily quantified economic, social, and geographic factors that are not correlated with these other factors.
Table 6: Alternative Models of LMA Employment Growth Rates
(estimated standardized beta coefficients, with t-ratios below, bold if significant at 0.05 level)

i Broad local differences in entrepreneurial activity have historically contributed to variation in regional growth rates. For example, between 1960 and 1983 the number of corporations and partnerships in the United States more than doubled (from 2.0 million to 4.5 million), but this growth was not at all evenly distributed geographically. The regional differences in business formation rates, in turn, reflect regional differences in a number of other local economic factors, such as rates of return on investment, productivity, unit labor costs and levels of competition (Acs, 2002). ii According to Boyan Jovanovic we are entering the era of the young firm. The average age of all companies in the stock market is shrinking. The younger firm will thus resume a role that, in its importance, is greater than it has been at any time in the last seventy years or so. iii The SUSB data and their Longitudinal Pointer File were constructed by Census under contract to the Office of Advocacy of the U.S. Small Business Administration. For documentation of the SUSB files, see Acs and Armington (1998). iv The LEEM data does not include new firm startups without employees (i.e. the self-employed). The self- employed should be included as new firm startups but the data does not allow for this. v Businesses that report operating statewide (county = 999) have been placed into the largest LMA in each state. vi Labor Market Areas divide the entire U.S. into areas within which labor is very mobile, so that the LMA functionally is an integrated region for both demand and supply. While in many cases LMAs are similar to Metropolitan Statistical Areas (PMSA, CMSA), they include the hinterlands of each metropolitan area, and also distinguish economic areas within the non-metropolitan parts of the country. Counties or census tracts are frequently very interdependent with adjacent units that are parts of the same economic region. LMAs cover the whole country and do not focus solely on cities. vii There is a small number (10,000 to 16,000) of new firms each year for which no industry code is ever available. Most of these are small and short-lived. These have been added to the Local market category, which is, by far, the largest of our sectors. viii While the primary contributions of new firms are probably in the area of facilitating innovation and increasing productivity (see Schumpeter’s ‘creative destruction’ discussions, 1942), this study is limited to analyzing their impact on local employment, as a proxy for local growth. ix A long tradition of studies of the determinants of new plant entry (secondary location) has focused on tax rates, transportation costs and scale economies at the plant level (Bartik, 1989). In this study we will not examine the impact of multi-unit establishments since we are focusing on the entrepreneurial behavior of individuals who create new firms with employees. x During the past twenty- five years, there has been a significant research agenda examining the relationship between on job creation and firm size. This literature suggested that size is an important variable and that there was an inverse relationship between firm size and job creation (Kirchhoff, 1998). However, several studies have concluded that the earlier claims of job creation by small firms was overstated and that there was in fact no relationship between job creation and firm size, after controlling for age (Davis Haltiwanger and Schuh, 1996). While these findings are not without their critics (Carree and Klomp, 1996, among others) firms of all size do appear to create jobs. xi When the new primary location of a multi-unit firm has less than a third of the total employment of the firm, it is not counted as a birth. Such relatively small new headquarters establishments are usually created to manage a new firm created as the result of a merger or joint venture, involving the restructuring of older firms. xii The number of firm births by LMA and sector in 1994 was not easily available, but had been shown consistent with the previous and subsequent years for more aggregated annual birth data. xiii It is worthwhile to stress that by using startup rates, you measure a different kind of competition than Glaeser el al (1992). That is, you mainly measure competition between and/or induced by new firm startups and by doing so, you do not take account of the theoretical possibility of strong competition between incumbent firms, without regard to startups. xiv In an earlier paper (Armington and Acs, 2002), we regressed agglomeration effects on the firm birth rate. The results were positive, suggesting that greater density leads to more new firm formation. This suggests that higher density leads to greater creativity and spillovers (Lucas, 1989). However, it appears that growth is promoted by lower density.

xv The unexplained portion represents the impact of a variety of less easily quantified economic and social factors that were omitted from the prediction model, plus stochastic variation. Thus the unexplained portion is strictly orthogonal to all of the other exogenous variables in the growth model.