Entrepreneur characteristics, competitive strategy, firm ...
227
ENTREPRENEUR CHARACTERISTICS, COMPETITIVE STRATEGY, FIRM LEVEL INSTITUTIONS AND PERFORMANCE OF SMALL AND MEDIUM ENTERPRISES OF NON-TIMBER FOREST PRODUCTS IN KENYA BY LINUS CHESOLI WEKESA A THESIS SUBMITTED IN PARTIAL FULFILLMENT OF THE REQUIREMENTS FOR THE AWARD OF THE DEGREE OF DOCTOR OF PHILOSOPHY IN BUSINESS ADMINISTRATION, SCHOOL OF BUSINESS, UNIVERSITY OF NAIROBI NOVEMBER 2015
Transcript of Entrepreneur characteristics, competitive strategy, firm ...

ENTREPRENEUR CHARACTERISTICS, COMPETITIVE STRATEGY,
FIRM LEVEL INSTITUTIONS AND PERFORMANCE OF SMALL AND
MEDIUM ENTERPRISES OF NON-TIMBER FOREST PRODUCTS IN
KENYA
BY
LINUS CHESOLI WEKESA
A THESIS SUBMITTED IN PARTIAL FULFILLMENT OF THE
REQUIREMENTS FOR THE AWARD OF THE DEGREE OF DOCTOR OF
PHILOSOPHY IN BUSINESS ADMINISTRATION, SCHOOL OF BUSINESS,
UNIVERSITY OF NAIROBI
NOVEMBER 2015

ii
DECLARATION
I, Linus Chesoli Wekesa hereby declare that this PhD thesis is my original work and has not been
presented to any other college, university, institution of learning or research for any academic
award such as certificate, diploma or degree.
Signed…………………………………………….…………..Date ……………………..
LINUS CHESOLI WEKESA
REG. NO. D80/60246/2010
SUPERVISORS’ APPROVAL
This thesis was developed with our guidance and has been submitted with our approval as the
appointed university supervisors.
Signed………………………………………………..……….Date………………………
DR JACKSON K. MAALU, PHD
DEPARTMENT OF BUSINESS ADMINISTRATION
SCHOOL OF BUSINESS, UNIVERSITY OF NAIROBI
Signed………………………………………….………….... Date …………………..….
DR JAMES M. GATHUNGU, PHD, CPS (K)
DEPARTMENT OF BUSINESS ADMINISTRATION
SCHOOL OF BUSINESS, UNIVERSITY OF NAIROBI
Signed……………………………………………………... Date…………………………
PROF GITURO WAINAINA, PHD
DEPARTMENT OF MANAGEMENT SCIENCE
SCHOOL OF BUSINESS, UNIVERSITY OF NAIROBI

iii
COPY RIGHT
Copyright © 2015 by University of Nairobi. All rights reserved. No part of this research thesis
may be reproduced or transmitted in any form or by any means, electronic, electrostatic,
magnetic tape or mechanical, including photocopying or recording, on any information storage
and retrieval system, without prior permission in writing from the University of Nairobi, or
author on that behalf, except for short extracts in fair dealing, critical scholarly review or
discourse with acknowledgement. For information, contact Linus Chesoli Wekesa at the
following address.
P.O Box 5009 – 00200
NAIROBI
KENYA
Mobile: +254 721 385 833
Email: [email protected]

iv
DEDICATION
This thesis is dedicated to my son Joe Karanja, daughters Glory Tenderloyn Wekesa and
Joylinda Naomi, and my dear wife Enid Gatumu who have always demonstrated unconditional
love and support. May you all share the joy of hard work and aim to achieve excellence and
honour in your endeavours.
To my father, Peter Misigo and my mother Elika Naliaka, thanks for putting emphasis on
education and encouraging me to be focused.

v
ACKNOWLEDGEMENTS
I acknowledge God‟s providence for giving me strength and opportunity to undertake and complete
this Doctoral programme study. The finalization of this thesis was possible with the assistance of
many people whose input is deeply appreciated. First and foremost, I am greatly indebted to my
supervisors Dr. Jackson Maalu, Dr. James Gathungu and Prof Gituro Wainaina for their
stimulating criticisms, helpful suggestions, guidance, patience, encouragement and careful
scrutiny of the work. I highly appreciate the inputs offered at different stages of this thesis work
by the academic staff from the School of Business, University of Nairobi. I highly appreciate my
Doctoral programme instructors including Prof Peter Kobonyo, Prof Isaac Mbeche, Prof Francis
Kibera, Prof David Nzele Nzomo, Prof Tabitha Kiriti-Ng‟ang‟a and Prof Madara Ogot who
instilled in me the skills of research and entrepreneurship development. I appreciate all the
members of the Board of Examiners in my final oral defense led by the Dean, Prof Josiah Aduda
as the chairman for their critical view of my work and guidance on areas of improvement, and
recommending the award of PhD. I acknowledge the inputs of the departmental, open and
committee stage fora for the inputs at the proposal development stage.
I acknowledge the financial and material support provided by my employer, Kenya Forestry
Research Institute (KEFRI) to undertake studies that have yielded into this final PhD thesis. I
appreciate the support and keen interest in the programme by the Director of KEFRI, Dr. Ben
E.N. Chikamai. I acknowledge the tireless efforts of Dr. Gabriel Muturi and Dr. Joshua
Cheboiwo for ensuring timely availability of the financial support.
I highly appreciate the contribution of my fellow researchers and colleagues at KEFRI and the
Ministry of Agriculture, Livestock Development and Fisheries including Musingo Titus Mbuvi,

vi
Leila Ndalilo, Omar Ibrahim, Leley Nereoh, Zablon Musumba, Leila Ahmed and Stanslus
Kituku for the support and encouragement. To my long term friend Prof George Chemining‟wa,
thank you for the encouragement and scholarly advice.
To my wife Enid and children Joe, Glory and Joy, I highly appreciate your support, patience, and
time sacrificed to make this a reality. My parents, brothers and sisters are highly acknowledged
for their prayers and peaceful environment that prevailed. All brethren who encouraged and
prayed with me are highly appreciated. To those owners/managers of firms that offered
information, you are great and may your ventures prosper. My deep appreciations go to Abigail
Kisali of KEFRI Coast for secretarial services and typesetting the document. Finally, I
acknowledge the great support, and typesetting and printing of the thesis copies by Wangui
Ngethe of Ventura Copy and Print Bureau, Nairobi.

vii
TABLE OF CONTENTS
DECLARATION........................................................................................................................... ii
COPY RIGHT .............................................................................................................................. iii
DEDICATION.............................................................................................................................. iv
ACKNOWLEDGEMENTS ......................................................................................................... v
LIST OF TABLES ...................................................................................................................... xii
LIST OF FIGURES ................................................................................................................... xiv
ABSTRACT ................................................................................................................................. xv
ABBREVIATIONS AND ACRONYMS .................................................................................. xvi
CHAPTER ONE: INTRODUCTION ......................................................................................... 1
1.1 Background of the Study ....................................................................................................... 1
1.1.1 Entrepreneur Characteristics ....................................................................................... 3
1.1.2 Competitive Strategy ................................................................................................... 5
1.1.3 Firm Level Institutions ................................................................................................ 7
1.1.4 Firm Performance ........................................................................................................ 9
1.1.5 Small and Medium Enterprises in Kenya .................................................................. 10
1.1.6 Non-Timber Forest Products in Kenya ..................................................................... 12
1.2 Research Problem ................................................................................................................ 14
1.3 Research Objectives ............................................................................................................. 17
1.4 Value of the Study ............................................................................................................... 17
1.5 Summary .............................................................................................................................. 19
CHAPTER TWO: LITERATURE REVIEW .......................................................................... 20
2.1 Introduction .......................................................................................................................... 20
2.2 Theoretical Foundations of the Study .................................................................................. 20
2.2.1 Institutional Theory ................................................................................................... 21
2.2.2 Resource Based View ................................................................................................ 23
2.2.3 Theories Relating to Entrepreneur Characteristics .................................................... 25

viii
2.3 Empirical Evidence of the Inter-relationships Between Entrepreneur Characteristics,
Strategy, Institutions and Performance ................................................................................ 27
2.3.1 Characteristics of Entrepreneur and Firm Performance ............................................ 28
2.3.2 Entrepreneur Characteristics and Competitive Strategy ........................................... 31
2.3.3 Competitive Strategy and Firm Performance ............................................................ 33
2.3.4 Firm Level Institutions and Firm Performance ......................................................... 36
2.3.5 Joint Effect of Entrepreneur Characteristics and Competitive Strategy on Firm
Performance ............................................................................................................... 38
2.4 Summary of Empirical Studies and Knowledge Gaps in the Entrepreneurship to
Performance Relationships .................................................................................................. 40
2.5 Conceptual Framework ........................................................................................................ 43
2.6 Hypotheses for Testing ........................................................................................................ 45
CHAPTER THREE: RESEARCH METHODOLOGY ......................................................... 49
3.1 Introduction .......................................................................................................................... 49
3.2 Philosophical Foundation of the Study ................................................................................ 49
3.3 Research Design .................................................................................................................. 50
3.4 Population of the Study........................................................................................................ 51
3.5 Sampling Design .................................................................................................................. 51
3.6 Data Collection .................................................................................................................... 55
3.7 Validity and Reliability Tests .............................................................................................. 57
3.7.1 Validity Test .............................................................................................................. 57
3.7.2 Reliability Test .......................................................................................................... 58
3.8 Operationalization of Variables ........................................................................................... 59
3.9 Test for Linearity, Normality, Multicollinearity and Homoscedasticity ............................. 62
3.9.1 Test for Linearity ....................................................................................................... 62
3.9.2 Test for Normality ..................................................................................................... 63
3.9.3 Test for Multicollinearity .......................................................................................... 66
3.9.4 Test for Homoscedasticity ......................................................................................... 67
3.10 Data Analysis ....................................................................................................................... 68
3.10.1 Descriptive Statistics ................................................................................................. 68
3.10.2 Inferential Statistical Procedures ............................................................................... 69

ix
CHAPTER FOUR: DATA ANALYSIS AND FINDINGS...................................................... 75
4.1 Introduction .......................................................................................................................... 75
4.2 Descriptive Statistics............................................................................................................ 75
4.2.1 Years in Operation ..................................................................................................... 76
4.2.2 Nature of Products Handled ...................................................................................... 77
4.2.3 Size of the Firms ........................................................................................................ 78
4.2.4 Legal Status ............................................................................................................... 80
4.3 Entrepreneur Characteristics ................................................................................................ 81
4.3.1 Age of the Entrepreneur ............................................................................................ 82
4.3.2 Gender of the Entrepreneur ....................................................................................... 82
4.3.3 Education of the Entrepreneur ................................................................................... 83
4.3.4 Managerial Skills of the Entrepreneur ....................................................................... 84
4.3.5 Industry Experience of the Entrepreneur ................................................................... 85
4.3.6 Social Skills of the Entrepreneur ............................................................................... 85
4.4 Competitive Strategy Drivers .............................................................................................. 86
4.4.1 Uniqueness Drivers ................................................................................................... 88
4.4.2 Focus Drivers ............................................................................................................ 89
4.4.3 Cost Drivers ............................................................................................................... 90
4.5 Firm Level Institutions......................................................................................................... 91
4.5.1 Resource Based Firm Level Institutions ................................................................... 91
4.5.2 Administrative Based Firm Level Institutions .......................................................... 92
4.6 Firm Performance ................................................................................................................ 93
4.6.1 Profit Growth ............................................................................................................. 94
4.6.2 Sales Growth ............................................................................................................. 95
4.6.3 Market Share ............................................................................................................. 96
4.6.4 Client Satisfaction ..................................................................................................... 98
4.6.5 Efficiency of the Firm ............................................................................................... 99
4.6.6 Performance Index .................................................................................................... 99
4.7 Test of Hypotheses............................................................................................................. 101
4.7.1 Relationship Between Entrepreneur Characteristics and Firm Performance .......... 101
4.7.2 Relationship Between Entrepreneur Characteristics and Competitive Strategy ..... 105

x
4.7.3 Relationship Between Competitive Strategy and Firm Performance ...................... 108
4.7.4 Firm Level Institutions on Relationship Between Competitive Strategy
and Firm Performance ............................................................................................. 111
4.7.5 Joint Effect of Entrepreneur Characteristics and Competitive Strategy on
Firm Performance .................................................................................................... 116
4.8 Summary of Findings......................................................................................................... 120
CHAPTER FIVE: DISCUSSION OF RESULTS .................................................................. 123
5.1 Introduction ........................................................................................................................ 123
5.2 Key Results and Discussion ............................................................................................... 123
5.2.1 Entrepreneur Characteristics and Firm Performance .............................................. 124
5.2.2 Entrepreneur Characteristics and Competitive Strategy ......................................... 129
5.2.3 Competitive Strategy and Firm Performance .......................................................... 133
5.2.4 Firm Level Institutions on Relationship Between Competitive Strategy
and Firm Performance ............................................................................................. 136
5.2.5 Joint Effect of Entrepreneur Characteristics and Competitive Strategy on
Firm Performance .................................................................................................... 138
5.3 Summary of the Discussion of Results ............................................................................. 142
CHAPTER SIX: SUMMARY, CONCLUSIONS AND RECOMMENDATIONS ............. 143
6.1 Introduction ........................................................................................................................ 143
6.2 Summary of the Study Findings ........................................................................................ 143
6.2.1 Entrepreneur Characteristics and Firm Performance .............................................. 144
6.2.2 Entrepreneur Characteristics and Competitive Strategy ......................................... 144
6.2.3 Competitive Strategy and Firm Performance .......................................................... 145
6.2.4 Firm Level Institutions, Competitive Strategy and Firm Performance ................... 146
6.2.5 Joint Effect of Entrepreneur Characteristics, Competitive Strategy and Firm
Performance ............................................................................................................. 146
6.3 Conclusions of the Study ................................................................................................... 147
6.4 Recommendations of the Study .........................................................................................151
6.5 Implications of the Research Findings............................................................................... 152
6.5.1 Theoretical Implications .......................................................................................... 152

xi
6.5.2 Managerial Implications .......................................................................................... 153
6.5.3 Policy Implications .................................................................................................. 155
6.6 Limitations of the Study .................................................................................................... 156
6.7 Suggested Areas for Further Research............................................................................... 157
REFERENCES .......................................................................................................................... 158
APPENDICES ........................................................................................................................... 180
Appendix I: Letter of Introduction for Data Collection ................................................... 180
Appendix II: Letter of Request for Permission to Collect Data........................................ 181
Appendix III: Questionnaire for Small and Medium Enterprises in the
Non-timber Forest Products Sub-sector ...................................................... 182
Appendix IV: Population of Small and Medium Enterprises in the Non-timber
Forest Products Sub-sector in Kenya .......................................................... 188
Appendix V: Map of Kenya Showing Nine Counties where Data was Collected..............189
Appendix VI: Non-Timber Forest Products Firms and Entrepreneurs Interviewed...........190
Appendix VII: Scatter Plots for Dependent and Independent Variables ........................... 197
Appendix VIII: Normal Distribution Graphs for Study Dependent Variables .................. 200
Appendix IX: Correlation Matrix for Performance Metrics .............................................. 204
Appendix X: Regression of Entrepreneur Characteristics and Firm Performance ............ 205
Appendix XI: Regression of Competitive Strategy and Firm Performance ...................... 207
Appendix XII: Regression of Firm Institutions, Competitive Strategy and Performance . 208
Appendix XIII: Regression of Joint Effect of Entrepreneur Characteristics and
Competitive Strategy on Performance ........................................................ 210

xii
LIST OF TABLES
Table 2.1: Summary of Empirical Studies and Knowledge Gaps……………………….41
Table 3.1: Study Population and Sampling Units……………………………………….54
Table 3.2: Reliability of Study Instruments…………………………………………......58
Table 3.3: Summary of Operationalization of Study Variables…………………………60
Table 3.4: Test of Normality…………………………………………………………….64
Table 3.5: Shapiro-Wilk Statistics……………………………………………………….65
Table 3.6: Collinearity Statistics…………………………………………………….......66
Table 3.7: Test of Homogeneity of Variables………………………………………........67
Table 3.8: Summary of Data Required, Questions and Analysis Technique……………71
Table 3.9: Analytical Models for Hypotheses Testing…………….……….....................74
Table 4.1: Years in Operation ………………………………………………………......76
Table 4.2: Nature of Products Handled ….....………………………………..……………...77
Table 4.3: Number of Products Handled………………………………………..……....78
Table 4.4: Size of Firms……….………………………………………………..………..79
Table 4.5: Legal Status ..……………………………………..………………………….80
Table 4.6: Age of Entrepreneurs ………………………………………………….….....82
Table 4.7: Gender of Entrepreneurs…………………..……….…………………………83
Table 4.8: Education of Entrepreneurs………………………………………………......83
Table 4.9: Managerial Skills of Entrepreneurs.…………….……………………………84
Table 4.10: Industry Experience of Entrepreneurs .….………………………………….85
Table 4.11: Social Skills of Entrepreneurs.………………………………..…………….86
Table 4.12: Implementation of Uniqueness Drivers.…………..…………….…………..88
Table 4.13: Implementation of Focus Drivers….………….……………………..….…. 89
Table 4.14: Implementation of Cost Drivers….………………………….………..….…90
Table 4.15: Resource Based Firm Level Institutions.……………….…………………..92
Table 4.16: Administrative Based Firm Level Institutions ………….…………….…....93
Table 4.17: Profit Growth …………………………………………….…….……….…..95
Table 4.18: Sales Growth …………..……………………………..….…..……….….....96
Table 4.19: Market Share Growth ………………………………………….…...............97
Table 4.20: Client Satisfaction …………………………………………………………..98

xiii
Table 4.21: Efficiency of the Firm..…………………………………………...………....99
Table 4.22: Performance Index ..……………………...…………………………...…...100
Table 4.23: Entrepreneur Characteristics and Firm Performance ………………..…....103
Table 4.24: Entrepreneur Characteristics and Competitive Strategy …………………..106
Table 4.25: Competitive Strategy and Firm Performance.……………………..………109
Table 4.26: Firm Level Institutions and Relationship Between Competitive
Strategy and Firm Performance ……...………...……………………….....113
Table 4.27: Joint Effect of Entrepreneur Characteristics and Competitive
Strategy on Firm Performance…………………………………………......118
Table 6.1: Summary of the Test of Hypotheses……..…………………………….........150

xiv
LIST OF FIGURES
Figure 2.1: Conceptual Model ………..............................................................................44

xv
ABSTRACT
Evidence is emerging that the dominant link between entrepreneur characteristics and firm
performance is influenced by several other factors. There are indications of a link between
entrepreneur characteristics, competitive strategy and firm level institutions to create and
enhance competitive advantage and overall firm performance. However, available empirical
evidence supporting such multi-dimensional interaction is minimal and inconclusive since most
studies have concentrated on the individual and isolated effects of various factors on firm
performance. Based on the gaps and unresolved issues in previous studies, this study addressed
the main question: what is the influence of competitive strategy and firm level institutions on the
relationship between entrepreneur characteristics and performance? Hinged on the institutional
theory, resource based view and theories relating to entrepreneur characteristics, the study
addressed the key question by targeting firms in the non-timber forest products sub-sector that
have often received less focus by studies aimed at establishing performance determinants. The
study was conducted as a cross-sectional survey covering 314 small and medium enterprises in
nine counties, Kenya. The Pearson correlation coefficients, coefficient of determination, F
statistic, and the t-value and their significance levels were used in presenting the fit of the models
and the relationships between variables. It was observed that firm performance was significantly
affected by entrepreneur characteristics of age, managerial skills, industry experience and social
skills. In addition, there was significant link of entrepreneur characteristics of age, gender,
education, managerial skills, and social skills with competitive strategy. On the other hand, the
three competitive strategy drivers of uniqueness, focus and cost exhibited significant relationship
with firm performance. There was a significant moderating effect of firm level institutions in the
relationship between competitive strategy and firm performance. Equally, there was partial
mediating effect by competitive strategy of the relationship between entrepreneur characteristics
and performance. All the null hypotheses were rejected and the objectives achieved. It was thus
concluded that a multi-dimensional link existed with entrepreneur characteristics, competitive
strategy, firm level institutions and firm performance as the linkages. The relationship between
entrepreneur characteristics and firm performance depended on competitive strategy and firm
level institutions indicating that firms require resources, appropriate strategy choices and firm
level institutional framework, and owners/managers with appropriate personal characteristics to
enhance their competitiveness and performance. This study conceptualized with mediating and
moderating effects on the relationship between entrepreneur characteristics and performance
shade light on the theoretical argument that entrepreneurial dynamics are shaped by resources as
well as institutional systems and structures put in place at firm level. It was necessary, therefore,
that firms match their strategic decisions with characteristics of owners/managers, and the
internal institutional framework to enhance their competitiveness and performance. The
observation that firms run by relatively young and skilled entrepreneurs had high levels of
application of competitive strategy and better performance calls for policy measures to
encourage the many well trained but unemployed young people to engage in businesses. Equally,
training programmes including incubation to equip the practitioners with necessary theoretical
and practical capacities to enhance application of competitive strategy, and manifestation of firm
level institutions were necessary.

xvi
ABBREVIATIONS AND ACRONYMS
AfDB African Development Bank
BPO Business Process Outsourcing
CATI Computer Assisted Telephone Interviewing
EU European Union
FAO Food and Agriculture Organization
GDP Gross Domestic Product
GOK Government of Kenya
ICT Information and Communication Technology
ILO International Labour Organization
KEBS Kenya Bureau of Standards
KEFRI Kenya Forestry Research Institute
KFS Kenya Forest Service
NTFPs Non-Timber Forest Products
RBV Resource Based View
R&D Research and Development
SMEs Small and Medium Enterprises
SPSS Statistical Package for Social Sciences
UNDP United Nations Development Programme
US $ United States of America Dollar

1
CHAPTER ONE
INTRODUCTION
1.1 Background of the Study
The debate on factors influencing performance of Small and Medium Enterprises (SMEs)
is inconclusive. Past studies (Kristiansen et al., 2003; Gaebler, 2007; Westerberg &
Wincent, 2008; Islam et al., 2011) have demonstrated entrepreneur characteristics to be
dominant determinants of firm performance. The characteristics of an entrepreneur which
are often grouped as demographic factors, individual background, personal traits, and
entrepreneur orientation and readiness play an important role in performance of SMEs.
However, there is emerging evidence that the strength of the relationship between
entrepreneur characteristics and firm performance depends on other factors.
Some studies (Gómez, 2006; Rauf, 2007; Yuan-Yao et al., 2009; Bruton et al., 2010)
indicate a link between entrepreneur characteristics, strategy and institutions to enhance
firm performance. There is evidence that entrepreneur characteristics determine strategy
choice as an intermediate output in enhancing performance (Phan & Butler, 2003; Yuan-
Yao et al., 2009). Sandberg and Hofer (1987) observed that firm performance is a
function of the entrepreneur characteristics, structure of the industry being entered, and
the strategy applied. There are claims that the possible relationships in the entrepreneur –
strategy - performance nexus are re-enforced by the effect of institutions. At the internal
organizational level, firm level institutions often categorized as resource based and
administrative based institutions come into play to influence the relationship (Peng et al.,

2
2008; Machuki et al., 2012). However, the variables playing significant roles between the
entrepreneur characteristics and firm performance are not clear (Sidik, 2012).
Although various theories of entrepreneurship exist, the arguments that a business is a
social activity (Byers, 1997), and that its performance is dependent on internal capacities
(Yuan-Yao et al., 2009) and operational framework (Bruton et al., 2010) anchor this
study on institutional theory and Resource Based View (RBV). The institutional theory
inquires into how institutional elements are created, adopted, and adapted to shape social
behaviour and enhance performance. The RBV, on the other hand bases on availability of
resources and capabilities for securing competitive advantage. The impact of resources
and capabilities on performance is governed by unique bundle of resources which are
crucial in generating sustained competitive advantage (Yuan-Yao et al., 2009). The
integration of the two theories enhances the understanding of the processes of resource
identification and combination making their theoretical underpinnings together with
theories elucidating entrepreneur characteristics provide a strong platform for anchoring
this study.
The Non-timber Forest Products (NTFPs) derived from forests and trees outside forests
for example fruits, aloe, herbs, essential oils, resins and honey are increasingly being
commercialized in Kenya. They are broadly referred to as a sub-sector under the
agribusiness sector that encompasses products with origin from agricultural resources.
The NTFPs are labelled green businesses because they play an important dual purpose of
income generation and environmental conservation. The NTFPs have a significant global
market share generating US $115.5 to US$117 billion annually (Shanley et al., 2008).

3
Despite the role played by the NTFPs sub-sector in income generation and environmental
conservation, level of entrepreneurship development within the sub-sector in Kenya is in
nascent stages. Most of the formed firms are poorly organized and are characterized with
high failure rates. Aragón-Sánchez and Sánchez-Marín (2005) observed that such SMEs
are faced with challenges of frequent and uncertain changes, and low levels of
competitiveness calling for the need to find strategies that allow them to achieve better
performance. Studies drawing on the theoretical underpinnings of the institutional theory,
RBV and theories elucidating entrepreneurial characteristics show that internal resources
and organizational infrastructure influence business competitiveness and performance
(Hall, 1993). Modelling the relationship of entrepreneurship to performance requires fit
of environment, structure and strategy (Lumpkin & Dess, 1996; Muthuvelayutham &
Jeyakodeeswari, 2014). Therefore, this study explored the interaction of entrepreneur
characteristics, competitive strategy and firm level institutions in creating and enhancing
competitiveness and performance of firms in the NTFPs sub-sector.
1.1.1 Entrepreneur Characteristics
The entrepreneur characteristics describe the personality traits of an entrepreneur who
logically plays a founding and dominant role in development of a business (Gómez,
2006). The initiation of a business requires certain aspects to be in place. These aspects
which are interdependent include an opportunity focus, a business plan, resource
acquisition and deployment, an appropriate structure and a motivated team, and a founder
or lead entrepreneur (Rwigema & Venter, 2004). All these aspects are dependent on a
founder or lead entrepreneur (Rwigema & Venter, 2004). The business, therefore, rests
on the shoulders of an entrepreneur who orchestrates three interdependent variables
4
namely opportunity, resources and a team. The entrepreneur acquires and combines both
tangible and intangible resources into a business organization and drives it into fruition
(Gómez, 2006). Consequently, the formed business reflects character and behaviour of
the entrepreneur whose vision and actions are central to its success and/or failure.
Different professions view the entrepreneur from a slightly different perspective; some
studies consider entrepreneur and manager as one and the same, while others make a
distinction between the two based on the motive, status, risk bearing, rewards,
innovations and qualifications (Hisrich et al., 2008; Širec & Močnik, 2010). The
entrepreneur is business owner and plays strategic role of developing a vision, mission
and strategies but a manager is a servant playing both strategic and tactical role turning
the vision into action (Hisrich et al., 2008). Despite theoretical difference between the
two, studies suggest that owners do not differ significantly from managers in the above
distinguishing elements (Low & Macmillan, 1988; Shane et al., 2003); neither Babb and
Babb (1992) nor Palich and Bagby (1995) found significant differences between the two
in terms of risk-taking propensity. Thus, this study considered the owner and manager
equally as the entrepreneur; in cases whereby it was not possible to have the owner, then
the manager was considered.
Characteristics of an entrepreneur which play an important role in determining firm
performance may be categorized as demographic factors, individual background/
characteristics, personal traits, and entrepreneur orientation and readiness (Islam et al.,
2011). Demographic factors include age, gender, income level, marital status and
religion. Individual characteristics influencing SME performance include experience,

5
education, managerial know-how and social skills of the owner/manager (Islam et al.,
2011). Personality traits influencing firm performance include self-confidence,
perseverance, desire to be boss and will to succeed (Gaebler, 2007; Islam et al., 2011).
Entrepreneurial orientation consists of autonomy, innovativeness, risk taking,
proactiveness, and competitive aggressiveness while entrepreneurial readiness refers to
belief in own self to perform a given task (Kristiansen et al., 2003; Islam et al., 2011).
The research on entrepreneur characteristics determining firm performance commenced
as early as the 1950s (Byers, 1997). Successive research on the entrepreneur
characteristics conducted in the 1980s and 1990s identified individual demographic,
individual background and personal traits that affect the chances that a person will
become an entrepreneur and be successful at the task (Timmons, 1994; Islam et al.,
2011). Although studies have been overwhelming over the effect of entrepreneur
characteristics on firm performance, some studies have found little evidence of the effect
of demographic and social background of the founder on firm performance (Byers, 1997).
Equally, observation that implementation of strategies reflect characters of entrepreneurs
raises debate whether the relationship between entrepreneur characteristics and firm
performance is indeed direct (Analoui & Karami, 2003; Shigang, 2010).
1.1.2 Competitive Strategy
Various studies have defined strategy differently; strategy, however, may be described as
a deliberate set of actions to achieve competitive advantage (O‟Regan & Ghobadian,
2005). It is the determination of long-term objectives, adoption of courses of action and
allocation of resources required for achieving the objectives (Chandler & Hanks, 1994).

6
The kinds of strategies include corporate strategy and competitive strategy. Whereas
corporate strategy defines markets and businesses in which a company will operate,
competitive or business strategy defines the basis on which a business will compete.
Competitive strategy which is of interest in this study hinges on the firm‟s capabilities,
strengths, and weaknesses in relation to market characteristics and the corresponding
capabilities, strengths, and weaknesses of its competitors. It is often referred to as the
firm‟s competitive “game plan” or a pattern of decisions that are selected and
implemented to achieve a sustainable competitive advantage (Grant, 1991).
Several types of strategies emanating from different types of strategy theories commonly
referred to as strategy typologies exist. However, the two extensively applied typologies
are those described by Miles and Snow (1978) and Porter (1980). The Miles and Snow's
typology developed and introduced four strategic types of organizations: defenders,
analyzers, prospectors, and reactors. The Porter's generic strategies on the other hand
advanced three generic strategies that a business can adopt; differentiation, focus and cost
leadership.
The Miles and Snow's typology does not make a clear distinction between strategic and
organizational choices making its use of little relevance in studies involving strategic
choices. However, the Porter generic strategy framework has strong theoretical
underpinnings and provides a simple business strategy concept that incorporates a few
critical dimensions; efficiency, differentiation and scale/scope (Hambrick, 1983; White
1986). In addition, studies have found that Porter‟s typology is a generic competitive strategy

7
model that can be used by smaller firms (Chaganti et al., 1989). Shigang (2010) observed
Porter‟s framework to be the dominant tool in analyzing strategies of firms. Therefore,
Porter's three generic strategies are better suited for application in the analysis of
competitiveness and performance of the targeted SMEs by this study.
The business environment is rapidly changing posing great challenges to firms as they
struggle to survive and prosper. Dynamic environments are characterized by
unpredictable and rapid change, which increases uncertainty for individuals and firms
operating within them (Dess & Beard, 1984; Ensley et al., 2006). In such state, firms
have to consistently use strategies of various types and levels to become more
competitive and profitable (Tsai & Yen, 2008). Consequently research has focused on
strategies to help determine its effect on firm performance. Shigang (2010) observed that
the entrepreneur‟s personal goals and traits have a significant impact on the enterprise‟s
strategy. An entrepreneur is the firm‟s main strategist and decision maker who develops
the vision, mission and strategies, and implements them (Analoui & Karami, 2003).
Strategic decisions reflect entrepreneur‟s subjective orientations and attitudes (Shigang,
2010). These developments inform an emerging line of thinking to be investigated that
strategy plays a mediating role in the entrepreneurship to performance relationship.
1.1.3 Firm Level Institutions
Although defined differently by various studies, North (1990) refers to institutions as
rules of the game in a society or humanly devised formal (rules) and informal (codes of
behaviour) constraints that shape human interaction. Institutions are defined as durable

8
social structures, made up of symbolic elements, social activities, and material resources
with rules, norms, and beliefs as central ingredients (Scott, 2004; Aguilera, 2006).
Institutions have far reaching effects on productive entrepreneurship, that is institutions
largely determine how and where entrepreneurial talent and effort is channeled and the
extent to which it is supplied (Henrekson, 2007). The institutional forces influencing the
entrepreneurial process are characterized into two; firm level institutions and external
institutions (Bruton et al., 2010). The firm level institutions are the firm-specific
attributes in a firm‟s internal environment and define the context in which strategic
decisions are made and implemented (Fuduric, 2008; Bruton et al., 2010). The firm level
institutions may be categorized into two dimensions as administrative based firm level
institutions, and resource based firm level institutions. The administrative based firm
level institutions include structure, management style, internal controls, systems, and
procedures, while resource based ones include financial resources, skills and
competencies, knowledge base, culture, and human resources (Powell & DiMaggio,
1991; Bruton et al., 2010; Machuki et al., 2012).
Firm level institutions are considered as determinants of performance through their
contribution to the firm competitive advantage. The importance of institutions derives
from the fact that economic actions are embedded in social contexts (Granovetter, 1985;
Atieno, 2009). Institutional environment creates conditions that entrepreneurs must
navigate and that policy makers can address (North, 1990; Meyer & Rowan, 1991). Thus,
this study investigated whether institutional environment at the firm level has a bearing
on the competitiveness and performance of the SMEs in the NTFPs.

9
1.1.4 Firm Performance
A variety of definitions and variables are used to define and measure firm performance
(Murphy et al., 1996). However, firm performance may be defined as the company‟s
ability to achieve its objectives in terms of customer satisfaction, market share, revenues
and profits (Guimaraes & Armstrong, 1998; Laitinen, 2002). Specifically, it is the firm‟s
capability to produce the targeted output satisfying the needs of the interest groups and is
often referred to as its success or failure (Guimaraes & Armstrong, 1998). Penrose (1959)
defines performance as a measure of how well a firm achieves its goals.
Firm performance is measured in terms of either financial or non-financial metrics
(Venkatraman & Ramanujam, 1986; Pushpakumari & Watanabe, 2009). Financial
metrics also known as objective measures use outcome based financial indicators that
reflect fulfillment of firm‟s economic goals and include sales growth, profitability, and
earning per share. On the other hand, non-financial metrics also known as subjective
measures assess broader, non-financial dimensions of performance and include market
share, new product introduction and product quality (Venkatraman & Ramanujam, 1986).
Gupta and Govindarajan (1984) validated various performance metrics including sales
growth, market share, operating profits, return on investments and new product
development; sales growth, market share and product development were observed as the
best measures. However, many studies prefer subjective metrics due to difficulties in
obtaining objective financial data (Zulkiffli & Perera, 2011). Quite often especially with
SMEs, the availed objective data to the researcher fails to fully represent firms‟ actual
performance as managers are tempted to manipulate it to avoid taxes (Dess & Robinson,

10
1984; Sapienza et al., 1988). Although subjective metrics are effective with SMEs and
show high positive correlations with objective measures, the equivalence assumptions
between the two are debated (Song et al., 2005; Zulkiffli & Perera, 2011). Consequently,
this study adopted both objective metrics including profitability and sales growth, and
subjective including market share, efficiency and customer satisfaction to measure firm
performance. These measures were then applied in computing a performance index;
performance index is a management tool that allows multiple sets of information to be
compiled into an overall measure and provides a comprehensive view of the business to
guide measurement of performance (Tan & Smyrnios, 2011).
Achievement of better performance requires efficient and effective use of organizational
resources to gain sustainable competitive advantage (Rauf, 2007). Essentially, enhanced
performance requires an entrepreneur to make strategic choices and ensure that the
chosen strategy is effectively implemented. Such implementation requires that the
strategy is operationalized and appropriately institutionalized (Machuki et al., 2012).
Logically, individual, organizational and environmental dimensions combine to provide a
prediction of strategy and firm performance (Peng et al., 2008; Islam et al., 2011). This
logical thinking supports existence of a link between entrepreneur characteristics,
competitive strategy, institutions and firm performance that needs further investigation.
1.1.5 Small and Medium Enterprises in Kenya
The SMEs are a heterogeneous group and no agreed definition exists. While some have
applied number of employees, others have applied business type and paid up capital to
define SMEs. The small business administration of the US government defines a small

11
business as one with less than 500 employees. The European Union (EU) defines SME as
an enterprise which employs fewer than 250 persons with an annual turnover not
exceeding 50 million euros, and/or an annual balance sheet total not exceeding 43 million
euros. The World Bank, United Nations Development Programme (UNDP) and African
Development Bank (AfDB) peg employees at an upper limit of 300, 200 and 50,
respectively (Gibson et. al., 2008). Definitions used to describe SMEs in Kenya are both
qualitative and quantitative (International Labour Organization [ILO], 2008). McCormick
(2001) described very small enterprises as having six or fewer workers and small
enterprises as those having 7 to 10 workers. However, the definition by Government of
Kenya (GoK) which is adopted by this study depicts SMEs as having less than 100
employees with very small enterprises having less than 10 employees, small enterprises
having between 10 and 49 employees, and medium between 50 and 99 employees (GoK,
2008; Bowen et al., 2009).
The SMEs which operate in all sectors of the economy make up a significant part of the
Kenyan economy (GoK, 2008). In 2011, the SMEs employed close to 80 percent of
Kenya‟s total workforce estimated at seven million persons and contributed 20 percent to
Gross Domestic Product ([GDP] [African Economic Outlook, 2012]). The SMEs are in
trade (64 percent), services (15 percent), manufacturing (13.4 percent) and others (8
percent) that include the SMEs in agribusiness sector dealing with products derived from
agricultural practices including NTFPs.
The challenge faced by the GoK and most governments in the developing world is the
high rate of unemployment, closure of big companies which results in job losses and

12
decreasing standards of living. The rate of poverty in such economies is high and people
do not have enough disposable income to purchase the basic necessities. The answer to
all these challenges is the promotion and development of SMEs (Steinhoff & Burgess,
1993; Rwigema & Venter, 2004). The SMEs have been identified by the Western
economies as a significant strategy of job and wealth creation (Namusonge, 2014). New
firm formation and the activities of SMEs help drive job creation and economic growth
through accelerating innovation and promoting the full use of human, financial and other
resources. The types of SMEs that exist in developing countries include newly
established, established but not growing, established but growing slowly, and graduands
to a larger size (Liedholm & Mead, 1999). Of great interest to this study, are the reasons
for the varied states of the SMEs in Kenya with particular focus to the performance
determinants associated with the entrepreneurial activity of NTFPs ventures. The SMEs
dealing with NTFPs in Kenya have not received much research focus. Essentially, more
investigations for creating an understanding of the dynamics of these firms are necessary
not only for the development of support policies and programmes for SMEs, but also for
the growth of the economy as a whole.
1.1.6 Non-Timber Forest Products in Kenya
The NTFPs are described as biological resources of plant and animal origin other than
wood derived from forests, other wooded lands and trees outside forests and are used as
either food, fibres, medicinal, cosmetic, income generation and/or cultural purposes
(Food and Agriculture Organization [FAO], 1995; Marshall et al., 2006; Ahenkan &
Boon, 2011). The synonyms for the NTFPs applied by studies include Alternative Forest
Products (AFPs), Minor Forest Products (MFPs), Non-Wood Forest Benefits (NWFBs),

13
Non-Wood Goods and Benefits (NWGBs), Non-Wood Goods and Services (NWGSs),
Special Forest Products (SFPs), and Secondary Forest Products (SFPs) (Dlamini, 2013).
The recent past has witnessed increased focus on the NTFPs for poverty reduction and
bio-diversity conservation (FAO, 1995; Neumann & Hirsch, 2000; Marshall et al., 2006).
Such products contribute significantly to the livelihoods (Marshall et al., 2006); generate
additional employment and income (Ahenkan & Boon, 2011); offer opportunities for
enterprises (Subedi, 2003); and are more beneficial to forests than logging (Marshall et
al., 2006). The NTFPs support various businesses that are currently diversifying the
economy and enhancing conservation. The tradable NTFPs targeted by SMEs include
fruits, nuts, herbs, flowers, plant dyes, essential oils, woodcrafts, resins, honey, seeds,
basketry from reeds, medicinal products and carbon stocks.
The SMEs utilizing the NTFPs have the potential to achieve dual conservation and
development goals by increasing the value of forest resources to local communities thus
qualifying them as green businesses. The contribution of the SMEs in NTFPs sub-sector
is more significant to resource poor people and particularly women and youth by acting
as outlets for their products. In Kenya, three quarters of the poor live in rural areas, where
a nearby forest is the only available source of livelihood (Mbuvi & Boon, 2008). This
presents potential for commercial development by such rural populace. In this view,
NTFP development becomes a 'stepping-stone' to broader socio-economic development
for the rural poor. The other positive element for commercialization of NTFPs lies in its
conservation potential. If NTFP-based development is successful, people may choose to
diversify, and conserve the resource.

14
Despite the potential of NTFPs, their contribution has often not been properly quantified
and reflected well in the national accounts for Kenya. Few studies have examined use of
NTFPs from a livelihoods perspective or computed their contribution to total household
income (Shackleton et al., 2007). In addition, level of entrepreneurship with NTFPs is
still in nascent stages with most firms being informal and uncompetitive. However, on a
larger scale it has been estimated that over two-thirds of Africa‟s 600 million people rely
on forest products, either for subsistence or for cash income (CIFOR, 2005; Kaimowitz,
2003; Sunderlin et al., 2005). At global level, NFTPs generate US $115.5 to US$117
billion annually (Shanley et al., 2008). There is, therefore, need for increased focus by
studies on firms dealing with NTFPs to enhance their visibility as green businesses.
1.2 Research Problem
The relationship between entrepreneur characteristics and firm performance as indicated
in the literature is still outstanding. A study by Sandberg and Hofer (1987) rejected the
argument that firm performance is based solely on characteristics of the entrepreneur; and
supported instead the claim that it depends not only on characteristics of the entrepreneur,
but also on structure of industry entered and the strategy of the venture involved.
Lumpkin and Dess (1996) suggest that finding a direct relationship between variables in
the entrepreneur characteristics and firm performance relationship would not provide
wholesome understanding without introduction of a mediator or a moderator variable or
both. Based on the foregoing, there is increasing appreciation that at the firm level, the
strength of the relationship between entrepreneur characteristics and firm performance
depends on organizational dimensions including strategy and firm level institutions. This
points towards an interactive process of entrepreneur characteristics, strategy and firm

15
level institutions in creating and enhancing venture competitiveness and performance.
However, available literature concentrate on the individual and isolated effects of various
factors on firm performance (Baum et al., 2001). Thus, there is inadequate evidence
supporting a multi-dimensional relationship that integrates strategy and institutions in the
entrepreneur characteristics to firm performance relationship and present it as an
interactive process of internal organizational dimensions in the recognition and
exploitation of business opportunities.
Among the various businesses in the country, SMEs in NTFPs sub-sector are emerging as
green businesses with dual potential in development and conservation. Such firms are
possible mediators of economic to environmental relations by helping diversify the
economy, and hedge communities and economy against negative impacts of climate
change (Shanley et al., 2008). They support most rural communities especially in dry
areas where livelihood options are limiting by acting as market outlets for the NFTPs
collected (FAO, 1995; Mbuvi and Boon 2008). Despite vast potential of such firms, they
are poorly organized with most of them remaining informal and uncompetitive. Distinctly
less focus has been placed by studies on firms dealing with NTFPs resulting in most of
them operating without the benefit of homegrown solutions for improved competitiveness
and performance. Studies conducted on such firms elsewhere (Schreckenberg et al., 2006;
Dubey, 2008) show that strengthening of internal capacities would enhance their
competitiveness and performance. Such internal capacities include resources, and
knowledge, skills and experience of the entrepreneur who is key in firm performance
(Zoysa and Herath 2007; Islam et al. 2011). However, studies done have not clearly
demonstrated how to integrate these internal factors including entrepreneur

16
characteristics, strategy and institutions to enhance competitiveness and firm performance
of firms dealing with NTFPs.
The research on firm performance conducted in Kenya (Kibas & K‟Aol, 2004; Atieno,
2009; Bowen et al., 2009; Oroko, 2009; Litondo, 2010; Mbogo, 2010; Namusonge, 2014)
have concentrated on exploring factors of business success and growth in the clothing
and textile, manufacturing, services, trading, Business Process Outsourcing (BPO), and
Information and Communication Technology (ICT) sectors. Equally, studies by Wanjohi
and Mugure (2008), Waema et al. (2009) and Bowen et al. (2009) looked at the effect of
business environment especially institutions on firm performance. The studies focused on
performance of SMEs by applying correlations and regression analysis hence enhancing
their relevance to this study. However, most of these studies looked at various
determinants as individual and isolated causes of firm performance thus, inadequately
informing the relationship between entrepreneur characteristics and firm performance.
Studies elsewhere (Peng et al., 2008; Širec & Močnik, 2010) show that key distinguishing
feature of successful SMEs is a balanced alignment of entrepreneurs‟ personalities and
behaviour with their business decisions, and environment.
From the foregoing, interactions of internal factors including entrepreneurial
characteristics, strategy and firm level institutions in enhancing competitiveness and
performance of SMEs in NTFPs sub-sector are not well understood. It is not clear how
personality of the entrepreneur interacts with strategic decisions made, existing resources
and administrative infrastructure put in place by the firm in enhancing competitiveness
and performance. Based on the gaps and unresolved issues in the past studies, this study

17
examined the interactive process of internal resources and infrastructure on performance
of SMEs in the NTFPs sub-sector by addressing the main question: what is the influence
of competitive strategy and firm level institutions on the relationship between
entrepreneur characteristics and performance of SMEs in the NTFPs sub-sector?
1.3 Research Objectives
The general objective of this study was to determine the influence of competitive strategy
and firm level institutions on the relationship between entrepreneur characteristics and
performance of SMEs in the NTFPs sub-sector in Kenya. The specific objectives were to:
i. Determine the relationship between entrepreneur characteristics and performance
of SMEs in NTFPs sub-sector
ii. Establish the relationship between entrepreneur characteristics and competitive
strategy of SMEs in NTFPs sub-sector
iii. Determine the relationship between competitive strategy and performance of
SMEs in NTFPs sub-sector
iv. Establish the effect of firm level institutions on the relationship between
competitive strategy and performance of SMEs in NTFPs sub-sector
v. Determine the joint effect of entrepreneur characteristics and competitive strategy
on performance of SMEs in NTFPs sub-sector
1.4 Value of the Study
The findings of the study make a significant contribution to theory, practice and policy.
By reviewing the influence of strategy and institutions on the relationship between
entrepreneur characteristics and performance of SMEs, the findings significantly

18
contribute to existing theory by either supporting or disapproving the assumptions
advanced on entrepreneurship that entrepreneurial dynamics are shaped by the internal
resources and capacities as well as the institutional dimensions. Empirical evidence
generated to approve or disapprove the assumptions would act as a pool of knowledge for
academia interested with entrepreneurial phenomena.
In practice, the study findings would inform the private and public institutions in their
decision making while identifying and exploiting business opportunities in the NTFPs
sub-sector. The NTFPs have high potential for income generation and environmental
conservation and thus, the findings of the study demonstrating how to enhance
competitiveness and firm performance would motivate public and private institutions to
invest in the sub-sector. Equally, the findings and recommendations isolate out areas for
support by public institutions interested in entrepreneurship development. Additionally,
the study presents areas for further research to be targeted by institutions doing research.
Lastly, the information generated would be useful to policy makers initiating policies and
legislation aimed at helping revamp SMEs. The findings would assist policy makers to
understand entrepreneurial dynamics within the NTFPs sub-sector in order to come up
with viable policies and development programs. The concomitant outcome of the efforts
would be invigorated SMEs which act as market outlets for non-timber forest resources
collected by rural communities especially the disadvantaged groups and help diversify
the economy sustainably. Such SMEs would be a key source of employment, food,
medicine, income and conservation efforts. This would ultimately contribute to achieving
the country‟s Vision 2030 and hedge communities against vulgarities of climate change.

19
1.5 Summary
The first chapter of this study presents the introduction elucidating a concise background
of the research area. It details the conceptual arguments as well as the contextual issues of
the study. A brief on the theoretical underpinnings of the study is also highlighted. A
statement of the problem, research objectives and value of the study are also discussed.
As a basis, the conceptual arguments elucidate the variables and relationships in the
entrepreneurship to performance nexus. Emerging evidence show that strength of
relationship between entrepreneur characteristics and performance depends on other
factors including internal organizational attributes. Studies done point to an integrated
interactive link between a multiplicity of factors to create and increase competitive
advantage and overall performance goals. From the conceptual arguments advanced, it
was clear that the strength of relationship between entrepreneur characteristics and
performance depends on other factors. Unfortunately, available studies concentrated on
individual and isolated effects of various factors of firm performance thus failing to
present a comprehensive interactive process of internal organizational dimensions in
recognition and exploitation of business opportunities. Therefore, the chapter presents the
conceptual arguments by reviewing the factors impacting on the relationship including
competitive strategy and firm level institutions. Definitions of the variables by various
studies and their interactions in the entrepreneurship to firm performance relationships
were presented and discussed. Equally, the contextual issues elucidating the nature and
importance of firms dealing with NTFPs were presented.

20
CHAPTER TWO
LITERATURE REVIEW
2.1 Introduction
This chapter presents the literature review starting from theoretical foundation of
entrepreneurship including institutional theory, RBV and theories elucidating
entrepreneur characteristics. How this study is anchored on these theories is presented.
Empirical studies for the relationships in the entrepreneurship to performance nexus are
also presented. Existing conceptual arguments of how entrepreneur characteristics,
competitive strategy and institutions impact on performance of SMEs are presented and
possible issues for addressing by this study and corresponding hypotheses stated. A
summary of research gaps as well as a conceptual framework depicting the influence of
strategy and institutions in the entrepreneur characteristics and firm performance
interaction are presented. Finally, the hypotheses for testing by this study are presented
and clearly linked to specific variables.
2.2 Theoretical Foundations of the Study
Entrepreneurship has attracted attention of persons in varied disciplines, including
economics, management, psychology, sociology, and anthropology (Gladwin et al.,
1989). This has resulted in different theories of entrepreneurship; economic theory, RBV,
institutional theory, opportunity-based theory, sociological, psychological,
entrepreneurship innovation theory, motivation theory/acquired needs theory, and the
Kakinada experiment on motivating factors for entrepreneur.

21
This study was based on the argument that a business is a social activity and that its
performance depends on the internal capacities and the environment. The internal
capacities include the resources and capabilities that are critical in influencing
competitiveness and performance. On the other hand, the internal environment include
structures and systems put in place by the firm. The internal environment of a firm is
crucial to its performance (Chew et al., 2004; Chadamoyo & Dumbu, 2012). Based on
this premise, this study was anchored on institutional theory, RBV and theories relating
to the entrepreneur characteristics as basis for theoretical reasoning behind
competitiveness and performance of the SMEs in NTFPs sub-sector. The target theories
play complementary and synergistic roles in guiding entrepreneurial decisions.
2.2.1 Institutional Theory
Institutional theory provides a theoretical lens used to study the adoption and diffusion of
organizational forms and practices (Peng, 2006; Bruton et al., 2010). It explains how
organizational structures and individual behaviour are influenced by cultural, political
and social forces surrounding them (Fogarty, 1996). Zucker (1987) points out that
organizations are affected by normative pressures arising from external sources and the
organization itself. Thus, an organizational structure is seen as a reflection of rationalized
institutional rules (Meyer & Rowan, 1991) or shared knowledge of belief systems (Scott,
2007). It attends to social structure considering the processes by which structures,
including schemas, rules, norms, and routines become established as authoritative
guidelines for social behavior (Scott, 2004). The theory inquires into how these elements
are created, diffused, adopted, and adapted over space and time and how they fall into
decline and disuse. The focus is attainment of stability and order in social life.

22
Institutional theory helps in understanding determinants of human resource management
policies and practices with impact on performance of the individual or organization
(Wright & McMahan, 1992). The theory indicates that an organization that develops
relations with institutions and follow institutional prescriptions can survive easily, have a
greater stability, allowing a better access to resources (Oliver, 1995). This is based on an
understanding that institutional environment is socially constructed, that is institutional
environment can shape individual behaviour and can also be shaped by individuals acting
within the environment (Berger & Luckmann, 1967).
Institutional theory has undergone metamorphosis resulting in two schools of thought;
old and new institutional theories. The old institutional theory is concerned with the
understanding of what constitutes values, how organizations adapt or change their culture
and structure to socially accepted values, and how such values become weak and de-
institutionalized (Selznick, 1957). The old theory suggests that to institutionalize norms
and values in organizations, those who hold power, such as entrepreneurs or managers,
must be able to motivate and drive members of an organization to follow their behaviour.
This old theory has often been advanced as sociology/organizational branch. On the other
hand, the new institutional theory advanced as economic/political branch is based on the
reasoning that organizational practices are influenced by institutional environments and
internal institutions, that is structure, conduct and performance of an organization depend
on the characteristics of the environment in which the organization‟s activities take place
and internal institutions (Zucker 1987; DiMaggio & Powell, 1983; Meyer & Scott, 1983).
Institutional environments include social, political and economic environments, while
internal institutions include the objectives, structure and culture of the organization.

23
This study was thus, anchored on the new institutional theory with the presumption that
internal institutions including the resource based and administrative based ones affect
firm performance. This study advanced that manifestation of the resource based
institutions including financial resources, skills and competencies, knowledge base,
culture, and human resources, and the administrative based institutions including
structure, management style, internal controls, systems, and procedures influence
competitiveness and performance of the firm. Studies (Hwang & Powell, 2005; Bruton et
al., 2010) show that institutional environment affects rate and size of new firm creation
by defining and limiting entrepreneurial opportunities. Inadequate institutional
development complicates new venture development while a more developed institutional
environment with overly restrictive regulation hampers firm creation and performance
(de Soto, 2000; Baumol et al., 2009). Entrepreneurs may be discouraged from starting
firms if there are no formal institutional structures, or if they are forced to comply with
too many rules and procedural requirements that are costly to fulfil (de Soto, 2000).
2.2.2 Resource Based View
The resource based view (RBV) argues that sustained competitive advantage is generated
by the unique bundle of resources at the core of the firm (Barney, 1991; Conner &
Prahalad, 1996). The theory describes how entrepreneurs build businesses from the
resources and capabilities available (Dollinger, 1999). Implicit in the RBV is the
centrality of the venture‟s capabilities in explaining the firm‟s performance. Resources
are important antecedents to products and ultimately to performance (Wernerfelt, 1984).
Firms can achieve sustainable competitive advantage from resources such as strategic
planning (Michalisin et al., 1997), management skills (Castanias & Helft, 1991), tacit

24
knowledge (Polanyi, 1966), capital, and employment of skilled personnel (Wernerfelt,
1984). The assets and resource owned by firms may explain the differences in their
performance (Barney, 1991; Peteraf, 1993). Resources may be tangible or intangible and
are harnessed into strengths and weaknesses by companies and in so doing lead to
competitive advantage. The RBV continues to be refined and empirically tested
(Bharadwaj, 2000; Hadjimanolis, 2000; Medcof, 2000).
The RBV holds that the coordination of human effort and ability to obtain, effectively
employ and efficiently maintain valuable tangible and intangible resources serves as the
foundation of the company‟s strategy and hence, its basis for achieving a competitive
advantage (Echols, 2000). Its objective is identifying how to sustain a competitive
advantage (Barney, 1989, 1991). The basic tenets of the RBV state that a firm can obtain
a sustainable competitive advantage by having strategically relevant resources and
capabilities that are specific (Helfat, 1994), durable (Mahoney & Pandian, 1992),
intangible, valuable, rare, and unable to be either imitated or substituted (Barney, 1991),
and/or are untradable and immobile (Dierickx & Cool, 1989).
The key to the RBV is its ability to explain sustainable competitive advantage at the firm
level (Echols, 2000). Conner (1991) argued that each firm is a unique combination of
inputs under the RBV. So, when strategically relevant factors exist in such a way that
they are imperfectly tradable and enable heterogeneity to exist across firms, and ex post
limits to competition are present along with ex ante limits, the firm can enjoy sustained
above-normal returns (Peteraf, 1993). The economic rents resulting from these socially
complex and “costly-to-copy attributes of the firm” serve as fundamental drivers of

25
performance (Conner, 1991). Given that RBV addresses resources and capabilities of a
firm as key to its performance, it was found to be a suitable theory to be used in this
study. This study advanced that sustainable competitive advantage could be achieved by
availability of strategically relevant resources and capabilities embedded in entrepreneurs
and employees inform of knowledge, skills and experience, and strategic planning.
2.2.3 Theories Relating to Entrepreneur Characteristics
A number of theories that advance entrepreneurship and explicate entrepreneur
characteristics fall in different categories and include economic, psychological,
opportunity-based and sociological/anthropological. These theories add to the
understanding of traits and behaviour of an entrepreneur who plays a dominant role in
firm performance. Thus, the study drew on such understanding of the entrepreneur while
reviewing the entrepreneur characteristics as a factor under consideration.
Economic theory postulates that entrepreneurs are motivated by profit in their
commercial activities (Kirzner, 1982). The theory sees entrepreneurs as individuals in the
economy who are alert to discover and exploit profit opportunities in any given
environment (Kirzner, 1982). Economic view indicates that entrepreneurs are motivated
by profit in their commercial activities. They are out for monetary gain in whatever
strategy they undertake. Cantillon developed one of the earliest theories of
entrepreneurship that viewed an entrepreneur as a risk taker who buys at a certain price to
sell at an uncertain price and in the process he/she either makes a profit or a loss (Hisrich
et al., 2008). This was widened by Marshall (1949) and Say (1971) to include bearing of
risks, planning, supervising, organizing, and factors of production ownership.

26
Schumpeter (1942) looks at an entrepreneur as a prime mover of economic development
and initiates the development by being innovative by carrying out new combinations in
the factors of production. Knight (1971) notes that the entrepreneur is the one who bears
the responsibility and consequences of making decisions under conditions of uncertainty.
Drucker (1985), on the other hand defines an entrepreneur as an individual who searches
for change, responds to it, and exploits it when an opportunity is available.
Psychological theory strives to understand the mindset of entrepreneurs from either
internal or external viewpoints of an individual (Kapp, 2003). It advances that
psychological factors like attitude, perception and value system play a very important
role in mindset of an entrepreneur. Various psychological theories have been applied to
explain entrepreneurship and the most important psychological theory on
entrepreneurship is the David McClelland‟s theory on need for achievement (Alam &
Hossan, 2003). The McClelland theory pays attention to personal traits, motives and
incentives of an individual and concludes that entrepreneurs have a strong need for
achievement (McLelland & Winter, 1971). Equally, the locus of control theories
conclude that an entrepreneur will probably have strong internal locus of control, that is
an entrepreneur believes in his or her capabilities to commence and complete jobs
through his or her own actions (Amit & Schoemaker, 1993). Risk taking theory
advanced by Cantillon and Stuart advocates for entrepreneurship as a mentality to take
moderate or calculated risk (Alam & Hossan, 2003). Other psychological theories
include creativity or innovation theory that highlights creativity or innovativeness, and
power motivation theory that emphasizes on personal power or self-interest as
determinants of entrepreneurship.

27
The socio-cultural theory attempts to explain whether some cultures or some social
groups are more conducive to entrepreneurial behaviour than others (Kubeczko &
Rametseinerm, 2002). The concept of culture of entrepreneurship is anchored on
observations by social scientists that an entrepreneur is a product of the socio–cultural
milieu (Shivani et al., 2006). According to socio-cultural theory, factors that contribute to
the supply of entrepreneurs are an inheritance of entrepreneurial tradition, family
position, social status, education background and level of education (Kubeczko &
Rametseinerm, 2002). Social networks are also important in entrepreneurial action and
behaviour (Dubini & Aldrich, 1991; Greve & Salaff, 2003).
2.3 Empirical Evidence of the Inter-relationships Between Entrepreneur
Characteristics, Strategy, Institutions and Performance
Much scientific inquiry has been carried out on the subject of performance of SMEs with
mixed results. Both internal and external factors have been found to impact on firm
performance. The factors that have received much scientific focus include, inter alia,
entrepreneur characteristics, competitive strategy and firm level institutions.
Studies demonstrate different relationships between various factors and firm
performance. Emerging evidence indicate that individual capacities and organizational
dimensions including competitive strategy and firm level institutions combine to provide
firm competitiveness and performance. However, much scientific focus has been of
narrow perspective concentrating on individual relationships rather than their interactions
in a multi-dimensional way in the entrepreneurship to performance relationships.
28
2.3.1 Characteristics of Entrepreneur and Firm Performance
The link between entrepreneur characteristics and firm performance has received a lot of
focus by studies. Studies (Kristiansen et al., 2003; Westerberg & Wincent, 2008; Islam et
al., 2011; Moorthy et al., 2012; Sarwoko et al., 2013) show that characteristics of an
entrepreneur which include demographic factors, individual background, personal traits,
entrepreneur orientation, and entrepreneur readiness play an important role in
performance of SMEs. Research by Kristiansen et al. (2003) show that demographic
factors such as age and gender, and individual background including education and
previous work experience, have an impact on firm performance. Westerberg and Wincent
(2008) observed that the entrepreneur characteristics of external experience and self-
efficacy strongly influence firm performance. Islam et al. (2011) observed that
demographic and individual characteristics of the owner/manager influence firm
performance. Moorthy et al. (2012) found out that an effective entrepreneurship with
skills and experiences will lead to a higher innovation as well as competitiveness in
business performance. Sarwoko et al. (2013) observed that entrepreneurial characteristics
have a significant influence on business performance.
Studies conducted in Kenya and in other developing countries on the entrepreneur
characteristics and firm performance interaction compare positively with other topologies
in the developed world. Kibas and K‟Aol (2004) examined entrepreneurial
characteristics, factors that influence growth, and the problems and challenges facing
entrepreneurs. Kibas and K‟Aol used case study approach in collecting data using
observations and face-to-face interviews. The population of the study comprised of all
successful indigenous entrepreneurs who had operated their business for over five years

29
and had shown tremendous growth, innovation and creativity. Snowballing was the main
sampling technique coupled with purposive approach. It was observed by Kibas and
K‟Aol that most Kenyan entrepreneurs exhibit typical characteristics of other
entrepreneurs elsewhere and were rated strong on drive and energy levels, setting
challenging but realistic goals, commitment, risk taking, and persistent problem solving.
However, Kibas and K‟Aol were narrow in focus concentrating on psychological
characteristics and did not systematically investigate the effect of entrepreneur
characteristics on business growth, thus failing to sufficiently inform on the relationship.
Bowen et al. (2009) in their study on management of business challenges among SMEs in
Nairobi assessed factors for business success. Bowen et al. employed stratified random
sampling to collect data from 198 businesses using interviews and questionnaires. The
data was analyzed descriptively and presented in figures, tables and percentages. Bowen
et al. found out that relevant training or education is positively related to business
success. However, the study did not provide conclusive results on the effect of education on
performance. The sample size and analytical procedures applied were limiting hence making
the findings by Bowen et al. to be inconclusive.
The relationship between entrepreneur personality attributes and growth was examined
by Oroko (2009) using a sample of artisans involved in manufacturing metallic products
in Nairobi, Kenya. Applying factor analysis and descriptive analysis, Oroko observed that
personality attribute influence growth. The seven personality attributes measured
included desire to be boss, risk taking, service to commercial customers, level of
optimism, desire to succeed, innovativeness, and opportunity recognition. Oroko further

30
observed that desire to be boss, risk taking, service to customers, desire to succeed, and
innovativeness had high influence on growth. The study was limited to personality traits
and failed to investigate influence of other entrepreneur characteristics on growth.
Other studies done elsewhere in developing economies including Gaebler (2007), Urban
et al. (2008), Islam et al. (2011), Moorthy et al. (2012), and Sarwoko et al. (2013) related
various entrepreneur characteristics with firm performance. A study by Temtine and
Pansiri (2004) observed critical success factors affecting development of SMEs in
Botswana to include human resources development, organizational development,
managerial background, managerial leadership and competitive strategy. Urban et al.
(2008) in a study in South Africa attempted to understand the effects of business
knowledge and work experience on entrepreneurial success. Urban et al. observed that
business knowledge and work experience are positively associated with entrepreneurial
success. Islam et al. (2011) examined effect of characteristics of entrepreneur on the
business success of SMEs in Bangladesh. Islam et al. administered a questionnaire on the
owners and employees of small firms and analyzed data using Statistical Package for
Social Sciences (SPSS). Islam et al. observed that characteristics of entrepreneur
significantly influenced business success of SMEs.
Despite overwhelming empirical evidence for the link between entrepreneur
characteristics and performance, there is neglect of the agro-based SMEs resulting in
inadequate concepts and theories to support such proposition (GoK, 2008; Dlamini,
2013). Distinctly less focus is placed on the SMEs dealing with timber and non-timber
forest products. Limited literature is available on the relationship between entrepreneur

31
characteristics and performance in the NTFPs sub-sector. Available information include
studies in Mexico and Bolivia by Center for International Forestry Research (CIFOR) on
commercialization of NTFPs (Marshall et al. (eds), 2006; Schreckenberg et al., 2006).
Schreckenberg et al. identified provision of grants or subsidies, conducive legislative and
policy environment, access to better communications infrastructure and higher education
levels as some of the factors that would enhance entrepreneurship in NTFPs sub-sector.
Unfortunately, the studies failed to put focus on the individual relationship of
entrepreneur characteristics to firm performance. Questions, therefore, abound whether a
theoretical framework for entrepreneurship decision in the NTFPs sub-sector outlined
with an emphasis on role of key entrepreneur characteristics in influencing firm
performance is sustainable, calling for more investigations on key characteristics
including age, education, experience and skills. Hence, the following hypothesis was
formulated for testing:
H1: There is no significant relationship between entrepreneur characteristics and
performance of SMEs
2.3.2 Entrepreneur Characteristics and Competitive Strategy
The entrepreneur characteristics by virtue of their impact on the organization, determine
strategic choice, which is revealed in the realized strategy, with a resultant impact on firm
performance (Phan & Butler, 2003). The business start-up process requires an
opportunity focus, plan, resources, appropriate institutional framework, motivated team,
and a lead entrepreneur (Rwigema & Venter, 2004; Gómez, 2006). All these aspects are
dependent on characteristics of the lead entrepreneur who orchestrates opportunity,
resources and an appropriate team. Opportunity exploitation is crucial and requires a

32
strategy that communicates the manner in which resources, opportunity, and
entrepreneurial team will be harnessed.
Empirical evidence demonstrates the effect of the entrepreneur characteristics on
strategy. Initial studies (Wells, 1974) have shown that the entrepreneur abilities and those
of the entrepreneurial team that include their background, previous experience and level
of commitment are decisive in the strategic decision making process. Tyebjee and Bruno
(1984) affirmed the size of the investment, the cash out potential, the geographic location
and the product differentiation as most influential for the strategic choice. Recent studies
have refined and created greater understanding of the linkage between entrepreneur
characteristics and competitive strategy. Phan and Butler (2003) focused on how attitudes
affect entrepreneur‟s strategy selection at the organizational level using a sample of 60
wineries, still operated by their founding entrepreneurs. Phan and Butler observed that the
relationship between entrepreneur characteristics and competitive strategy is direct in
SMEs because such firms have not developed bureaucratic blockage that managerial
personalities from organizational processes experience. Shrader and Siegel (2007)
assessed the role of human capital in the growth and development of new technology-
based ventures, based on longitudinal data from 198 high-tech ventures. Shrader and
Siegel observed that characteristics such as job tenure, age, education, or functional
expertise are conjectured to be determinants of strategy and performance because they
influence decision making.
Despite pointing to a direct link between characteristics of the entrepreneur and strategy,
the studies failed to systematically analyze the relationship. Equally, some observations

33
indicate otherwise. Mintzberg (1978) observed the relationship between managerial
characteristics and strategic action as indirect and hidden. Pelham (2000) and Kemp and
Verhoeven (2002) did not find a clear relationship between entrepreneurial orientation
and strategy. Of concern is that the extent of scholarly investigation of the relationship
between entrepreneur characteristics and competitive strategy is limited, especially in
Kenya. Hence, the following hypothesis was formulated and tested by this study:
H2: There is no significant relationship between entrepreneur characteristics and
competitive strategy of SMEs
2.3.3 Competitive Strategy and Firm Performance
There is evidence among some studies that strategy impacts on firm performance. Studies
(Gibcus & Kemp, 2003; Peng et al., 2008) established that strategies pursued by firms
have a direct and strong influence on their performance. It is argued out that firms with a
clear and consistent strategy out-perform firms without such strategy (Gibcus & Kemp,
2003). Generally, strategy is claimed to be positively related with the performance or
success of a firm.
To be able to establish a link between competitive strategy and performance, Porter
(1991) defined three sets of conditions that would result in a consistent strategy and
eventually good firm performance to include development and implementation of an
internally consistent set of goals and functional policies that collectively define a firm‟s
position in the market; aligning firm‟s strengths and weakness with the external
(industry) opportunities and threats; and creation and exploitation of the firm‟s distinctive
competences. Porter (1980) observed that entrepreneurial type activities are linked much

34
more closely with differentiation strategies than with low-cost leadership strategies. Such
observation was strengthened by other studies (Pelham, 1999; Gibcus & Kemp, 2003).
Pelham (1999) argued that an emphasis on a differentiation strategy would have greater
impact on the performance rather than an emphasis on a low-cost strategy for SMEs.
Observations have demonstrated that the type of strategy applied makes a difference to
performance. Bowen et al. (2009) in their study on management of business challenges
among SMEs in Nairobi, assessed strategies they employed to overcome the challenges.
Bowen et al. employed stratified random sampling to collect data from 198 firms using a
questionnaire and the data obtained was analyzed descriptively. The findings indicated
that SMEs had the following strategies to overcome challenges: fair pricing, discounts
and special offers, offering a variety of services and products, superior customer service
and continuously improving quality of service delivery. Based on the findings, Bowen et
al. concluded that business success is a consequence of embracing a mix of strategies.
Oyedijo and Akewusola (2012) investigated the relationship between organizational
strategy and firm performance in Nigeria. Data was obtained from 34 paint
manufacturing SMEs and was analyzed using regression and correlation analyses. The
study observed that SMEs compete in different ways, thus allowing for their
classification as prospectors, analyzers, defenders and reactors. These results brought
additional fresh evidence to dismiss the speculation that Miles and Snows typology is a
sequential stage of strategy development in which defender strategies are linked to small
firms and prospector strategies to larger firms. The overall evidence by Oyedijo and
Akewusola was that organizational strategy plays an important role in explaining relative

35
success or failure of firms and that entrepreneurs can make a significant difference to the
performance of their organizations through the type of strategies that they employ.
Despite most studies demonstrating a link between strategy and firm performance, other
studies (Campbell-Hunt, 2000; Pelham, 2000; Spanous & Lioukas, 2001; Kemp &
Verhoeven, 2002) did not find a clear relationship between the two. Campbell-Hunt
(2000) analyzed several studies on strategy and performance and observed that consistent
generic strategy does not out-perform a mixed (or stuck-in-the-middle) strategy. Pelham
(1999) observed that an emphasis on a low-cost strategy has lower impact on the
performance than an emphasis on a growth/differentiation strategy. Spanous and Lioukas
(2001), Pelham (2000) and Kemp and Verhoeven (2002) did not find a clear relationship
between strategy and performance. Kemp and Verhoeven (2002) studied the relationship
between the growth of a fast growing firm, the consistency of the selected generic
strategy, the consistency of the resource bundles and the fit between the selected strategy
and resources. The findings by Kemp and Verhoeven showed that strategy did not seem
to influence growth.
Some studies have found weak relationships between strategy and performance. Teach
and Schwartz (2000) state that strategy and performance are at best weakly related.
Similarly, studies (Kemp & Verhoeven, 2002) suggest no relationship between strategy
and performance. From the foregoing, it is still not clear how strategy impacts on
performance. However, managers of the firms have to ensure that they have the right
strategy in order to be competitive and perform. Thus, this study formulated the
following hypothesis for testing:

36
H3: There is no significant relationship between competitive strategy and performance of
SMEs
2.3.4 Firm Level Institutions and Firm Performance
Evidence on how institutions affect firm performance is divided. However the
propositions by North (1990) that institutions are crucial determinants of the efficiency of
markets and by Baumol (1990) that institutional setup influence supply of entrepreneurial
effort, have increasingly received empirical support. There is wide acknowledgement that
entrepreneurs are both constrained and enabled by the institutions in their environment
(Bruton & Ahlstrom, 2003; Scott, 2007). The institutional environment defines and limits
entrepreneurial opportunities consequently affecting the rate and size of new venture
creation (Hwang & Powell, 2005; Bruton et al., 2010). Henrekson (2007) advanced that
institutions have far reaching effects on productive entrepreneurship, that is institutions
largely determine how and where entrepreneurial talent and effort is channeled and the
extent to which it is supplied. Indeed, there is increasing appreciation that institutions
play an important role in affecting firm performance than just playing a role of
background conditions (Peng et al., 2008). Ingram and Silverman (2002) summed up this
idiomatically that institutions directly determine what arrows a firm has in its quiver as it
struggles to formulate and implement strategy and to create competitive advantage.
Formal and informal institutions significantly shape the strategy and performance of
firms in emerging economies (Filatotchev et al., 2005; Peng et al., 2008).
Institutions exert a powerful influence not only on entrepreneurial entry rates, but also on
the resulting trajectories of entrepreneurial initiatives (Bruton et al., 2010). The potent

37
impact of institutions is unlocking entrepreneurship in a country (Aldrich & Waldinger,
1990). Ahlstrom et al. (2003) added that institutions can promulgate unproductive
behavior in the form of detrimental institutional entrepreneurship. Institutions help to
determine the process of gaining cognitive and moral legitimacy, which is critical for
entrepreneurial organizations to overcome the liabilities of newness (Stinchcombe, 1965)
and to increase their survival prospects (Ahlstrom & Bruton, 2001; Freeman et al., 1983).
Entrepreneurial organizations and their members need to behave in a desirable or
appropriate manner within a socially constructed system or face sanctions for deviating
from the accepted norms (Schein, 2009; Suchman, 1995).
This study is anchored on the new institutional theory and focuses on firm-level
institutions as the context in which decisions are made and implemented at the business
organization level. These firm-level institutions that include resource based and
administrative based institutions have been demonstrated by studies to impact on firm
performance. The support for the influence of resource based firm level institutions on
the relationship between competitive strategy and firm performance is offered by various
studies (Peng, 2006; Peng et al., 2008; Machuki et al., 2012). Peng (2006) observed that
strategic choices were the outcome of dynamic interaction between institutions and
organizations. Peng et al. (2008) noted that strategic choices were not only driven by
industry conditions and firm capabilities, but were also a reflection of the formal and
informal constraints of a particular institutional framework that managers confront.
Mahler (2009) and Machuki et al. (2012) observed internal or firm level institutions to
influence the relationship between competitive strategy and performance. Administrative
based firm level institutions have been demonstrated by studies (Certified Practising

38
Accountants Australia [CPA], 2007; Machuki et al., 2012) to influence the relationship
between competitive strategy and performance. The CPA (2007) lists the types of
controls used to ensure accurate and reliable financial controls within an organization.
These include internal control structures and procedures. Machuki et al. (2012) observed
that the identified strategy would require alignment with the internal factors of the
organization which defines the context in which decisions are made and implemented.
Although there is emerging consensus on the importance of institutions in influencing
firm performance its literature is ambiguous (Sachs, 2003). Empirical evidence on impact
of institutions in determining performance of SMEs is inconclusive. Equally, some
findings have been either not significant or concentrated on large corporations. The
results by Machuki et al. (2012) were statistically not significant and the observations
made were on large corporations instead of SMEs. Thus, the argument for the influence
of firm level institutions especially the moderating effect in the entrepreneurship to
performance relationships of SMEs needs empirical support. Therefore, this study
formulated the following hypothesis for testing:
H4: There is no significant moderating effect of firm level institutions on the relationship
between competitive strategy and performance of SMEs
2.3.5 Joint Effect of Entrepreneur Characteristics and Competitive Strategy on
Firm Performance
Studies have proposed existence of a joint effect of entrepreneur characteristics and
competitive strategy on firm performance. Phan and Butler (2003) and Yuan-Yao et al.
(2009) indicated a joint effect with entrepreneur characteristics determining strategy

39
choice as an intermediate output in enhancing performance. Sidik (2012) revealed that
although a positive relationship existed between entrepreneur traits and firm performance
there were intervening/mediation variables between the two constructs.
Edelman et al. (2002) established the mediating effect of firm strategies in the
relationship between human and organizational resources, and firm performance using
structural equation analysis. Edelman et al. observed that strategy played a mediating role
suggesting that neither resources alone, nor strategies alone determine performance. The
findings by Edelman et al. supported the suggestion by Venkataraman and Camillus
(1984) that an internal fit between resources and strategies would lead to improved
performance. Nooteboom (1994) observed that the success or failure of the business is
not adequately determined by personal characteristics of the entrepreneurs but by these
characteristics while interacting with contingency factors from the context in which the
business operates with the strategies.
Despite existence of evidence for joint effect and support for the mediating effect of
competitive strategy in the entrepreneur characteristics and firm performance
relationship, some studies have indicated otherwise. Other studies have indicated the
relationship either as not clear or inconclusive (Pelham, 2000; Kemp & Verhoeven, 2002;
Sidik, 2012). Mintzberg (1978) in the study on patterns in strategy formulation noted that
the relationship between characteristics of owners/managers and strategic action was
indirect and hidden. These varying observations create doubt whether entrepreneur
characteristics and competitive strategy jointly affect firm performance. Therefore, the
study formulated and tested the following hypothesis:

40
H5: The combined effect of entrepreneur characteristics and competitive strategy on
performance of SMEs is not significantly different from their individual effects
2.4 Summary of Empirical Studies and Knowledge Gaps in the Entrepreneurship
to Performance Relationships
Firm performance has received much focus by studies exploring entrepreneurship
development. A direct relationship between entrepreneur characteristics and performance
has been confirmed by various studies. However, debatable issues have emerged whether
the relationship between entrepreneur characteristics and performance is direct. Some
studies have suggested congruence or fit of environment, structure, and strategy in order
to effectively model the entrepreneurship to performance relationship (Miller, 1988;
Lumpkin & Dess, 1996; Muthuvelayutham & Jeyakodeeswari, 2014). Lumpkin and Dess
(1996) state that direct modeling without introduction of other variables fails to provide
wholesome understanding of the relationship of entrepreneurship to performance.
Reviews of available studies indicate existence of knowledge gaps in the understanding
of relationship of entrepreneurship to performance. The empirical evidence presented in
most studies was pegged on individual relationships rather than their interactions in a
multi-dimensional way as suggested by Lumpkin and Dess (1996). Studies explored
individual interactions of performance with various factors but little evidence was
presented on their multi-dimensional integration with performance pointing to clear
knowledge gaps that require to be addressed as presented in Table 2.1.

41
Table 2.1: Summary of Empirical Studies and Knowledge Gaps
Researcher Objectives/Focus Methodology Findings Knowledge Gap Current Study Focus
Namusonge
(2014)
Linking
competencies with
strategies
Performed descriptive
statistics and analysis of
variance (ANOVA)
A firm‟s competencies
important in achieving
competitive strategies
Did not link other
characteristics with
strategies
Aims to link
demographic and
individual traits with
strategies
Gupta and
Muita
(2013)
Study interactions
between operations
strategy and
entrepreneurial
traits, performance
and job satisfaction
Performed regression
analysis on data collected
from 1200 SMEs through
non-experimental design
Strategy significantly
moderated relationship
between entrepreneurial
personality and performance
Did not consider
effect of other
internal factors like
firm level
institutions on
performance
Study will test
influence of firm level
institutions on
entrepreneurial to
performance
relationship
Sarwoko et
al. (2013)
Test influence of
entrepreneurial
characteristics
and competencies
on performance
Performed
Structural Equation
Modelling on data
collected from 147
entrepreneurs
Entrepreneurial characteristics
have a significant influence
on business performance
Did not consider
the demographic
factors of the
owners of SMEs
Test entrepreneurial
characteristics based on
age and gender
differences
Moorthy et
al. (2012)
Factors affecting
performance of
SMEs
Performed descriptive
statistic, correlation and
multiple linear regression
analysis on 209 datasets
Skills and experiences will
lead to higher innovation
and competitiveness in
business performance
Did not cover
demographic and
individual
background traits
on performance
Study effect of
demographic and
individual background
characteristics
Islam et al.
(2011)
Entrepreneur
characteristics
effect on success
Performed multiple
regression analysis on
data from 89 SMEs
Entrepreneur characteristics
have significant effect on
Success of SMEs
Did not explore
into NTFPs firms
Will cover firms in
NTFPs sub-sector
Maalu
(2010)
Determine nature of
business succession
strategies and their
influence on
performance
Performed descriptive and
inferential statistics
Mixed findings on moderating
effect of family and firm
institutions on relationship
between succession and firm
performance
Did not distill firm
institutions into
different categories
to explore their
moderating effect
Distills firm level
institutions into
resource-based and
administrative-based to
study moderating effect

42
Table 2.1 Cont...
Commander
and
Nikolosk
(2010)
Analyze the
impact of
institutions on
performance
Performed both
correlations and
regression analyzes
Little evidence of a robust
link between widely used
measures of institutions and
performance
Failed to study effect
of individual
institution attributes
on performance
Will distill
institutions and
analyze influence on
performance
Oroko
(2009)
Examine
personality
attributes on
growth
Performed descriptive
statistics and correlations
on data collected from 354
firms
Personality attributes highly
influencing growth
Limited to
personality attributes
Key entrepreneur
characteristics
studied
Bowen et al.
(2009)
Understand how
SMEs manage
challenges
Performed descriptive
statistics on data collected
from 194 businesses
Business success is a
consequence of embracing a
mix of strategies
Did not study impact
of strategy on
performance
Study effect of
strategy on
performance
Atieno
(2009)
Explore effect of
networks/linkages
on performance
Performed descriptive
statistics and correlations
on data collected from 322
firms
MSEs have different forms
of networks and linkages
which impact on firm
performance
Did not cover effect
of all institutional
factors on
performance
Study role of
institutions on firm
performance
Peng et al.
(2008)
Shed light on the
institutional
theory
Prescriptive literature
review on institutional
theory
Institutional theory and RBV
shed significant light on
„„what drives strategy and
performance”
Review did not
cover issues related
to SMEs in NTFPs
Study anchored on
RBV and
institutional theory
Klaus et al.
(2008)
Investigate
impact of
institutions on
business
strategies
Performed correlations
and regression on data
collected from 336 firms
Institutions directly
influence strategies with
moderation of different types
of resources
Institutional factors
explaining variations
in strategies
uncaptured
Study effect of
institutions on
strategy and
performance
Source: Researcher, 2014

43
From Table 2.1, it was clear that most of the studies had concentrated on the individual
relationships of the various factors with performance. Equally, focus on the SMEs in the
NTFPs was low. Thus, this study targeted the knowledge gaps including limited
information or inconsistent evidence on the entrepreneurship to performance relationship.
From the evidence presented by studies (Oroko, 2009; Islam et al., 2011; Moorthy et al.,
2012) it was clear that the entrepreneur plays a critical role in firm performance. The
entrepreneur is the firm‟s main strategist as well as the decision maker; the entrepreneur
develops and implements the strategies. Thus, firm performance reflects traits of the
entrepreneur as well as strategies and the environment providing a basis for a linkage
between entrepreneur traits, competitive strategy, firm institutions and firm performance.
2.5 Conceptual Framework
From the theoretical perspectives and conceptual arguments, it could be deduced that
once a business opportunity is visualized, the entrepreneur uses available resources and
competencies including finance, and skills to develop and implement the strategy.
Equally, the entrepreneur may be influenced by the internal institutional dimensions in
strategy development and implementation (Peng et al., 2008; Machuki et al., 2012). This
logical thinking envisages a process whereby the entrepreneur and institutional
dimensions provide a prediction of competitive strategy and firm performance.
Based on the foregoing, this study aimed at examining empirically the relationships and
impacts between entrepreneur characteristics, competitive strategy, firm level institutions
and firm performance. It was conceptualized that entrepreneur characteristics could affect

44
firm performance directly or through mediation effects of competitive strategy. Equally,
competitive strategy could affect firm performance directly or was influenced by the
moderating effect of firm level institutions. Figure 2.1 presents this conceptual model,
which formed the road map for this study.
Figure 2.1: Conceptual Model
Moderating Variable
H4 H4 H2
H3
H5 H5
H1
Independent Variable Intervening Variable Dependent Variable
Source: Researcher, 2014
Figure 2.1 highlights the influence of competitive strategy and firm level institutions on the
entrepreneur characteristics and performance relationship of the SMEs. In the conceptual
model, competitive strategy provided a causal link as an intervening or mediating
variable between entrepreneur characteristics and firm performance. The causal effect of
competitive strategy on performance was moderated by firm level institutions. In this
study, the six traits which demonstrate the dynamism and competence of an entrepreneur
as the lead person in meeting the tasks and challenges of initiating and running a business
were used; age, gender, education, managerial know-how, industry experience and social
Competitive strategy
Uniqueness drivers
Focus drivers
Cost drivers
Firm level institutions
Administrative Based Firm level
institutions
Resource Based Firm level institutions
Firm performance
Financials
Profit growth
Sales growth
Non-financials
Market share
Client
satisfaction
Efficiency
Entrepreneur characteristics
Age
Gender
Education
Managerial know-how
Industry experience
Social skills

45
skills. It was postulated that the entrepreneur pursues Porter‟s generic strategies including
differentiation, focus and cost leadership while mobilizing resources, and manifests
internal institutions to drive the firm to fruition. Studies (Namusonge, 2014) show that
Porter‟s generic strategies are appropriate for SMEs.
The realized outcome of implementation process was captured by multi item measures
including market share, client satisfaction, sales growth, efficiency and profit growth. The
SMEs are complex and their entrepreneurs may be more interested in survival rather than
growth and expansion. Some studies on SMEs show a preference for non-financial
measures due to difficulties in obtaining objective financial data as managers may
manipulate data to avoid personal or corporate taxes (Zulkiffli & Perera, 2011). Given
complexity of SMEs with diverse goals, this study used both financials and non-
financials which were then applied in computing performance index for use in analysis.
The use of various measures helped capture complexity of the target SMEs and offer
better prediction of their performance.
2.6 Hypotheses for Testing
This study sought to address the effects of competitive strategy and firm level institutions
on entrepreneur characteristics to firm performance relationship. Five research objectives
were formulated, namely; to determine relationship between entrepreneur characteristics
and firm performance; establish relationship between entrepreneur characteristics and
competitive strategy; determine relationship between competitive strategy and firm
performance; establish effect of firm level institutions on relationship between
competitive strategy and firm performance; and determine joint effect of entrepreneur

46
characteristics and competitive strategy on firm performance. Based on these research
objectives, five hypotheses corresponding to each research objective were formulated and
stated as follows:
H1: There is no significant relationship between entrepreneur characteristics and
performance of SMEs
H2: There is no significant relationship between entrepreneur characteristics and
competitive strategy of SMEs
H3: There is no significant relationship between competitive strategy and performance of
SMEs
H4: There is no significant moderating effect of firm level institutions on the relationship
between competitive strategy and performance of SMEs
H5: The combined effect of entrepreneur characteristics and competitive strategy on
performance of SMEs is not significantly different from their individual effects
This study conceptualized that; entrepreneur characteristics influence firm performance;
entrepreneur characteristics affect competitive strategy; competitive strategy affects firm
performance; firm level institutions moderate the relationship between competitive
strategy and firm performance; and competitive strategy mediate the relationship between
entrepreneur characteristics and firm performance. Thus the hypotheses were stated in
negative or null state to be against these expected relationships between the variables.
This study tested the null hypotheses (H0) against alternative hypotheses (HA);
King‟oriah, (2004) states that the alternative hypothesis is the alternative set of facts that
are accepted (or proven to be true) if the null hypothesis is rejected (proven not to be

47
true). Based on the foregoing, null hypotheses (H0) and alternative hypotheses (HA) tested
by this study were stated as:
Objective one: Determine the relationship between entrepreneur characteristics and
performance of SMEs in NTFPs sub-sector
(H0): There is no significant relationship between entrepreneur characteristics and
performance of SMEs
(HA): There is significant relationship between entrepreneur characteristics and
performance of SMEs
Objective two: Establish the relationship between entrepreneur characteristics and
competitive strategy of SMEs in NTFPs sub-sector
(H0): There is no significant relationship between entrepreneur characteristics and
competitive strategy of SMEs
(HA): There is significant relationship between entrepreneur characteristics and
competitive strategy of SMEs
Objective three: Determine relationship between competitive strategy and
performance of SMEs in NTFPs sub-sector
(H0): There is no significant relationship between competitive strategy and performance
of SMEs
(HA): There is significant relationship between competitive strategy and performance of
SMEs

48
Objective four: Establish effect of firm level institutions on the relationship between
competitive strategy and performance of SMEs in NTFPs sub-sector
(H0): There is no significant moderating effect of firm level institutions on the
relationship between competitive strategy and performance of SMEs
(HA): There is significant moderating effect of firm level institutions on the relationship
between competitive strategy and performance of SMEs
Objective five: Determine joint effect of entrepreneur characteristics and
competitive strategy on performance of SMEs in NTFPs sub-sector
(H0): Combined effect of entrepreneur characteristics and competitive strategy on
performance of SMEs not different from individual effects
(HA): Combined effect of entrepreneur characteristics and competitive strategy on
performance of SMEs different from individual effects

49
CHAPTER THREE
RESEARCH METHODOLOGY
3.1 Introduction
This chapter presents methodology that was applied during the research study. It presents
the logical positivism which was adopted as the philosophy for the study. In addition, the
survey research design and a merged list of SMEs in NTFPs sub-sector from Kenya
Bureau of Standards (KEBS), KEFRI, Kenya Forest Service (KFS) and counties as
population for investigation is presented. The selection of study sample units using
appropriate sampling techniques is given. The chapter also elucidates how descriptive
and inferential statistics were applied as well as operationalization of variables and how
study objectives were achieved. Test of key assumptions to ensure appropriateness of the
data for analysis is also presented.
3.2 Philosophical Foundation of the Study
Positivism and phenomenology exist as the two philosophical approaches forming the
foundation of knowledge upon which assumptions and predispositions of a study are
based. Whereas positivism takes quantitative approach, phenomenological approach is
mainly qualitative (Cooper & Schindler, 2003). Positivistic approach presupposes that
knowledge naturally exist based on real facts, objectivity, neutrality, measurement and
validity of results. Positivism is predicated on observations and experiments based on
existing theory that can be expressed numerically. Positivism, thus derives a quantitative
perspective which holds that there is an objective reality that can be expressed
numerically, with explanatory and predictive power (Furrer et al., 2007). Positivism
50
argues for use of the most logical, dominant, or relevant framework (Pfeffer, 1994).
Phenomenology, on the other hand argues that knowledge is based on experience from an
individual‟s perspective and is subjective to focusing on immediate experience, personal
knowledge and individual interpretations (Saunders et al., 2007). It starts from basis of
coexistence and compatibility of alternative frameworks (Grandori, 2001).
This study was guided by the positivistic paradigm. It involved an investigation of
theoretical bases in the configuration of firm performance and its determinants. It aimed
to objectively and in unbiased manner collect data for testing empirical re-affirmations of
theory. Performance was explained as an outcome of configurations of firm resources and
institutions as defined in the conceptual framework. Enough representative samples were
selected for generalizing results and it was only positivism that could guide this
investigation.
3.3 Research Design
The study was conducted as a cross-sectional survey of SMEs in NTFPs sub-sector in
Kenya. Such surveys if properly conducted provide quick and accurate means of
assessing information (Zikmund, 2000). Surveys help quantify social phenomena and
offer opportunities to establish whether significant associations among variables exist at
one point in time.
Applying this research design, the study had the opportunity to establish the relationships
between entrepreneur characteristics, competitive strategy, firm level institutions and
firm performance of SMEs in the sub-sector. Since a cross-sectional survey affords

51
opportunity to capture a population‟s characteristics and test hypothesis quantitatively
and qualitatively, the control of the variables to sort out the existence and magnitude of
their causal effects was not necessary. Analytical models were used to establish
relationship between variables.
3.4 Population of the Study
The target population of study was all the SMEs dealing with NTFPs in Kenya and
included processors, transporters and traders. However, a comprehensive list of such
SMEs was non-existent making it difficult to accurately state their numbers and spread.
References were made to the databases maintained by KEBS, KEFRI, KFS and counties.
Apart from databases kept by KEBS, listings of businesses by the other three were
inadequate in numbers and categorization. Most of the NTFPs are used either as food,
medicine or cosmetic requiring certification and standardization by KEBS, thus making
its database a reliable source of SME data categorized using number of employees.
To enhance completeness of list of SMEs, databases from KEBS, KEFRI, KFS and
counties as per April 2013 were merged to form the population of 1,712 (Appendix IV).
The listings showed that most of the SMEs in the sub-sector were based in the counties of
Nairobi (27 percent), Mombasa (12 percent) and drylands counties (average 3 percent).
Target SMEs in the rest of the counties were below 3 percent of the total population.
3.5 Sampling Design
The number of SMEs in NTFPs sub-sector in the country was finite. Equally, the SMEs
were specialized along various products they dealt with. Therefore, appropriate sample

52
size calculation technique was applied in establishing the sample size while stratified
random sampling procedure was used to select the desired sample population in each
stratum. The study used the number of employees to determine the size of the firm.
3.5.1 Sample Size Determination
A representative sample for the study was selected from a finite population of SMEs in
the sub-sector. The sample size was computed in two stages using equations 3.1 and 3.2.
The first stage involved computing sample size without considering finite population
correction factor using equation 3.1.
n0 = Z2
p (1- p) (3.1)
d2
n0 = (1.96)2 (0.50) (0.50) = 384
(0.050)2
where:
n0 = sample size without considering finite population correction factor
Z = degree of confidence at 95 percent confidence level
p = proportion in population having measured characteristics chosen at 50 percent
(Israel, 1992).
d = level of statistical significance at 5 percent.
The second stage involved computation of the desired sample size (n) considering the
correction factor for finite population (N) by using equation 3.2; this resulted to a study
sample size of 314 SMEs.

53
n0 N
n = (3.2)
n0 + (N - 1)
384 x 1,712
n = = 314
384 + (1,712 – 1)
The sample size of 314 was formed, which was 18 percent of the target population in the
country. Studies demonstrate that a sample size of between 300 (good size) and 500 (very
good size) is reasonable for a study of this nature (Tabachnick & Fidell, 2007). The
sample size of 314 fell between the limits of 300 and 500.
3.5.2 Sampling Technique
Stratified random sampling was applied to establish homogenous sampling units. Among
the various counties, Nairobi, Mombasa, Kilifi, Kwale, Kajiado, Garissa, Kitui, Machakos and
Makueni represented 64 percent of the target SMEs population and were, thus selected as study
sites. These counties were spread in most parts of the country and represented its
diversity (Appendix V). Equally, these counties were either of urban set-up or located
within the drylands where the NTFPs and their SMEs were highly concentrated. The
SMEs in the nine counties were segregated into three mutually exclusive strata/categories
based on similarities in sources and use of key products they deal with as shown in Table
3.1.

54
Table 3.1: Study Population and Sampling Units
County Type Stratum/Category
Fruit Products Medicinal Products Bee Products Total
Nairobi Population 220 101 149 470
Sample 63 29 43 135
Kajiado
Population
30 14 44
Sample 0 9 4 13
Garissa
Population
25 22 47
Sample 0 7 6 13
Kitui
Population 28 31 29 88
Sample 8 9 8 25
Machakos
Population 17 13 15 45
Sample 5 4 4 13
Makueni
Population 11 15 30 56
Sample 3 4 9 16
Mombasa Population 73 99 39 211
Sample 21 28 11 61
Kilifi Population 23 36 19 78
Sample 7 10 5 22
Kwale Population 12 29 15 56
Sample 3 8 4 16
Source: Researcher, 2014
The three strata were the fruit products, medicinal and bee products; fruit products were
fruit related products and included edible fruits, seed oils, seeds and nuts; medicinal were
those with medicinal and cosmetic values and included herbs, aloe, resins and essential
oils and finally, bee products included honey, wax, royal jelly and propolis. Sample units
were established proportionately by multiplying the sample size with a fraction of SMEs
in each stratum as their number to the total population in sampled counties. The SMEs in
each stratum were numbered sequentially and random numbers used to select SMEs to
55
interview owners/managers. However, in cases where an oversized firm with over 100
employees or a wrongly categorized one was selected, then it was replaced with the next
SME on the list.
3.6 Data Collection
A questionnaire with open and closed format questions was used in data collection
(Appendix III). Most questions developed were multiple choice requiring ticking the
appropriate answer. The questionnaire as a tool for collecting data offers opportunities for
vast coverage, speed, cost-effectiveness and versatility (Pushpakumari & Watanabe,
2009). Target respondents were SME owners/entrepreneurs, however in cases where it
was not possible to interview the owner/entrepreneur either due to unavailability or
literacy concerns, managers as custodians of information were interviewed.
Data collection commenced after a pilot study was conducted in Taita Taveta County to
refine the questionnaire which had five major parts. The unit for data collection was the
business firm dealing with the NTFPs. The first part dealt with bio-data for profiling the
respondent business firms. The second part included questions related to the entrepreneur
characteristics. The third part contained listed questions on business strategies with 29
operational strategic activities and respondents were asked to rate undertaking levels
using a five-point Likert scale. The fourth part dealt with firm level institutions and had
17 questions with respondents required to rate extent to which each institutional issue
was applicable using a five-point Likert scale. Finally, firm performance measured in
terms of various performance metrics required respondents to rate their trends over last
five years (2009 to 2013) on a five-point Likert scale.

56
The study targeted to interview 314 SMEs in the NTFPs sub-sector in Kenya. The
exercise was carried out by a team of enumerators who made prior appointments mostly
through telephone calls requesting the owners or senior managers of the respondent
SMEs for the interview that lasted for about a half an hour. The questions were straight
forward and close ended making it easier for respondents in making choices that
appropriately reflected their perceptions.
Questionnaires from 283 SMEs out of the 314 SMEs in the NTFPs sub-sector had
satisfactory answers indicating 90 percent response rate. Following data cleaning process,
277 questionnaires, that is 88 percent were found usable and adopted in this study for
further analysis. At county level, the response rate was the highest (100 percent) in
Garissa, Kilifi, Kitui, Kwale and Makueni Counties and least in Nairobi (81 percent).
Respondents in Nairobi were skeptical and not willing to participate in the interviews.
The busy schedule and fears that disclosures on performance of business would elicit tax
payment penalties could have been some of the reasons for unwillingness of some target
SMEs to be interviewed.
From similar studies in the developing economies, Adegbite et al. (2006) administered
100 questionnaires and found 76 percent usable. Hsiu-Jung (2008) used online surveys
and door-to-door interviews and had a response rate of 30 percent. Širec and Močnik
(2010) carried out interviews through the Computer Assisted Telephone Interviewing
(CATI) method and had a response rate of 11.4 percent. This meant that the response rate
attained in this study was adequate and satisfied the criterions of validity requirements.

57
3.7 Validity and Reliability Tests
The nature of data collection that involved respondent SMEs indicating their performance
meant that many variables of interest could have been rated poorly leading to
measurement errors. Such unreliable measurements may cause relationships to be under-
estimated increasing the risk of committing type II error during data analysis stage.
Over-estimation of variables would occur if the covariates are not reliably measured
when performing multiple linear regression analysis. Therefore, to minimize occurrence
of measurement errors, the study exercised prudence to ensure that the measurement
items and interviews yielded accurate and adequate data.
The questionnaire which was the main data collection instrument was tested for validity
and reliability. Validity concerns with whether data is precise, inclusive, or met particular
criteria. Reliability, on the other hand was established through computation of Chronbach
alpha coefficient for each construct.
3.7.1 Validity Test
The validity of the questionnaire was achieved at four levels including review of
literature, consultations with subject matter specialists, specification of scales of
measurements and analysis, and piloting to validate data with real research content.
Extensive review of available conceptual and empirical literature was conducted to
establish concepts, constructs and interlinkages in the framework of firm performance.
The information was applied in the grouping of measurement items under specific
variables applied in the analyses. Opinions and guidance was sort from professors and
researchers in agribusiness field over the conceptual, contextual and analytical

58
procedures to apply. A pilot survey covering 10 SMEs within the NTFPs sub-sector in
Taita Taveta County was thereafter undertaken and responses analyzed using descriptive
statistics and multiple linear regression resulting in statistics and relationships as
conceptualized at proposal development stage.
The questionnaires were administered by trained enumerators recruited from fresh
university graduates and KEFRI technicians versed with administration of questionnaires.
After recruitment, the enumerators were taken through a one-day training to enable them
familiarize and understand the content of the questionnaires. The training also involved
taking them through the basic interviewing skills. The enumerators then offered guidance
to respondents during the rating process and this ensured that data was measured validly.
3.7.2 Reliability Test
Reliability was established through computation of Chronbach alpha coefficient for each
construct. Cronbach‟s alpha indicates extent to which a set of items can be treated as
measuring a single latent variable. The coefficient ranges from 0 to 1; the higher the
coefficient the more reliable the scale. This study used a cut-off point coefficient of 0.7
and items with higher values were used in analysis. The results are shown in Table 3.2.
Table 3.2: Reliability of Study Instruments
Category Cronbach's
Alpha
Cronbach's Alpha Based
on Standardized Items
Number of
Measured Items
Entrepreneur characteristics 0.761 0.836 6
Competitive strategy 0.900 0.899 11
Firm level institutions 0.945 0.946 17
Firm performance 0.822 0.837 24
Source: Field Data, 2014

59
The Cronbach‟s alpha values ranged from 0.761 (entrepreneur characteristics category) to
0.945 (firm level institutions category). These Cronbach's alpha values were above the
cut-off coefficient of 0.7 defined for the study. This indicated that the items were
accurately measured and had adequate levels of internal consistency.
3.8 Operationalization of Variables
This study had four types of variables independent, intervening, moderating and
dependent. The study variables were operationalized as depicted in the conceptual
framework to facilitate reduction of abstract notions of constructs into observable
characteristics that are measurable. This involved definition of constructs or variables so
that they could be measured or expressed quantitatively. In order to obtain reliable and
valid measures included in the questionnaire, validated indicators from previous studies
and multi item measures were used to cover multidimensionality of variables.
Entrepreneur characteristics construct were operationalized with application of various
demographic and background factors which were captured as either binary data measured
with nominal scale, ordinal measured by ordinal scale or real-valued data measured by a
ratio scale. Competitive strategy, on the other hand, was operationalized through rating
the degree of extent to which each strategic activity was undertaken on a Likert scale and
was captured using an interval measure. Equally, indicators for operationalizing
institutions were Likert type data and were measured using an interval scale. Indicators
for operationalizing performance construct were captured as trends in performance
indicator over the years and were measured using interval scale. The summary of
operationalization of study variables is presented in Table 3.3.

60
Table 3.3: Summary of Operationalization of Study Variables
Variable Nature of
Variable
Indicators/Measures Rating Measure Measurement
at Scale
Measurement
at Analysis
Questionnaire
Item
SME organizational
data and general
information
Background
information
Mixed Mixed Ordinal Descriptive Part I: Q1 to
Q6
Entrepreneur
characteristics
Independent Age (AGE)
Gender (GE)
Education (EE)
Managerial know-how (MK)
Industry experience (IE)
Social skills (SK)
Entrepreneur
characteristics index (EC)
Mixed Ratio
Nominal
Ordinal
Ordinal
Ordinal
Nominal
Ratio
Inferential
analysis
Part II: Q7 to
Q12
Competitive strategy Mediating/
Intervening
Differentiation (DD)
Focus (FF)
Cost leadership (CL)
Competitive strategy index (CS)
Five point Likert
type scale
Interval
Interval
Interval
Ratio
Inferential
analysis
Part III: Q13

61
Variable Nature of
Variable
Indicators/Measures Rating Measure Measurement
at Scale
Measurement
at Analysis
Questionnaire
Item
Firm level institutions Moderating Financial resources (FR)
Skills and competencies (SC)
Knowledge base (KB)
Culture (CC)
Human resources (HR)
Organizational Structure (OS)
Management style (MSS)
Internal controls (IC)
Systems (SS)
Procedures (PR)
Firm level institutions index
(FLI)
Interaction term (ITT)
Five point Likert
type scale
Interval
Interval
Interval
Interval
Interval
Interval
Interval
Interval
Interval
Interval
Interval
Interval
Inferential
analysis
Part IV: Q14
to Q15
Firm performance
Dependent Market share (MS)
Client satisfaction (CS)
Efficiency (EF)
Profit growth (PG)
Sales growth (SG)
Performance index (FPi)
Mixed Interval
Interval
Interval
Ratio
Ratio
Ratio
Inferential
analysis
Part V: Q16
to Q21
Source: Researcher, 2014

62
3.9 Test for Linearity, Normality, Multicollinearity and Homoscedasticity
The study performed tests of various assumptions to ensure appropriateness of the data
collected for analysis. Correlations and multiple linear regression were used to test the
relationships between variables. Such analytical techniques require the collected data to
meet specific characteristics in order to reduce biasness, and enhance accuracy in the
interpretation of results and making conclusions of the research study. Pedhazur and
Schmelkin (1991) noted that violations of assumptions lead to serious biases in the results
and conclusions.
The data collected was, therefore, subjected to tests for linearity, normality of the
distribution, multicollinearity and homoscedasticity using SPSS, to check if it met the
conditions of the assumptions. The study applied the graphical and numerical methods in
testing the assumptions, and the test results helped to indicate the suitability of the data.
3.9.1 Test for Linearity
The study tested for the assumption of linear relationship between the dependent and
independent variables. Multiple linear regression analysis which requires an assumption
of linearity of data, that is, the data was sampled from a population that relates the
independent and dependent variables in a linear fashion was performed. Osborne and
Waters (2002) observed that the chance of non-linear relationships is high in the social
sciences, thus it is essential to test for linearity. Linearity directly relates to the bias of the
results of the whole analysis (Keith, 2006). It defines the dependent variable as a linear
function of the independent variables (Darlington, 1968). Multiple regression can,

63
therefore, accurately estimate the relationship between dependent and independent
variables when the relationship is linear in nature (Osborne & Waters, 2002).
Scatterplots were derived using SPSS to test linearity between dependent and
independent variables (Appendix VII). The scatterplots for firm performance (dependent)
and entrepreneur characteristics, competitive strategy and firm institutions (independent)
had pattern of dots and fitted lines that sloped diagonally from lower left to upper right
suggesting positive linear relationship between the variables. The observation of
existence of linearity with the data of this study implied that statistical methods like linear
regression requiring an assumption of linearity of data could be applied in data analysis.
3.9.2 Test for Normality
Tests were conducted to establish normality and this was crucial to ensure normality
assumption was not violated at analysis stage. The observation of non-normality of data
is common in studies of this nature. Micceri (1989) indicates that normality is rare in
social studies prompting the usage of non-parametric tests. However, Zimmerman
(1998) points out that non-parametric tests can suffer as much, or more, than parametric
tests when normality assumptions are violated, confirming the importance of normality in
all statistical analyses, not just for parametric analyses. Additionally, the statistical power
of non-parametric tests are lower than those of parametric except on a few occasions
(Hodges & Lehmann, 1956; Tanizaki, 1997; Freidlin & Gastwirth, 2000).
Normality of data could be established using graphical or numerical methods. Park
(2008) observes that neither the numericals nor graphics individually provide conclusive

64
information about normality. Thus, the study established normality of the data for each
dependent variable both numerically and graphically. Descriptive statistics were
performed to derive the means, median, standard deviations, skewness and kurtosis for
describing normality of the data. A normally distributed random variable should have
skewness and kurtosis near zero, with mean closer to median (Park, 2008). The
descriptive statistics for establishing normality of the data are shown in Table 3.4.
Table 3.4: Test of Normality
Variable Test Mean Median Standard Deviation Skewness Kurtosis
Unique drivers Statistic 0.5568 0.5643 0.14536 -0.318 -1.058
Std. Error 0.01005 0.168 0.335
Focus drivers Statistic 0.4950 0.5119 0.11481 -0.122 -0.792
Std. Error 0.00794 0.168 0.335
Cost drivers Statistic 0.5248 0.5441 0.10935 -0.250 -0.518
Std. Error 0.00756 0.168 0.335
Performance Statistic 2.4545 2.3688 0.8363 0.447 -0.153
Std. Error 0.05588 0.163 0.324
Source: Field Data, 2014
The data obtained for the variables was normal (see Table 3.4); the mean and median
values were close to each other with low levels of standard errors. The skewness values
(between -0.318 and 0.447) and the kurtosis (between -1.058 and 0.335) for the variables
were closer to the ideal 0.00.
The Shapiro-Wilk W which is the ratio of the best estimator of the variance to the usual
corrected sum of squares estimator of the variance was applied to supplement the
descriptive statistics by testing the null hypothesis that the data is normally distributed
against the alternative hypothesis that the data is not normally distributed. When the p-
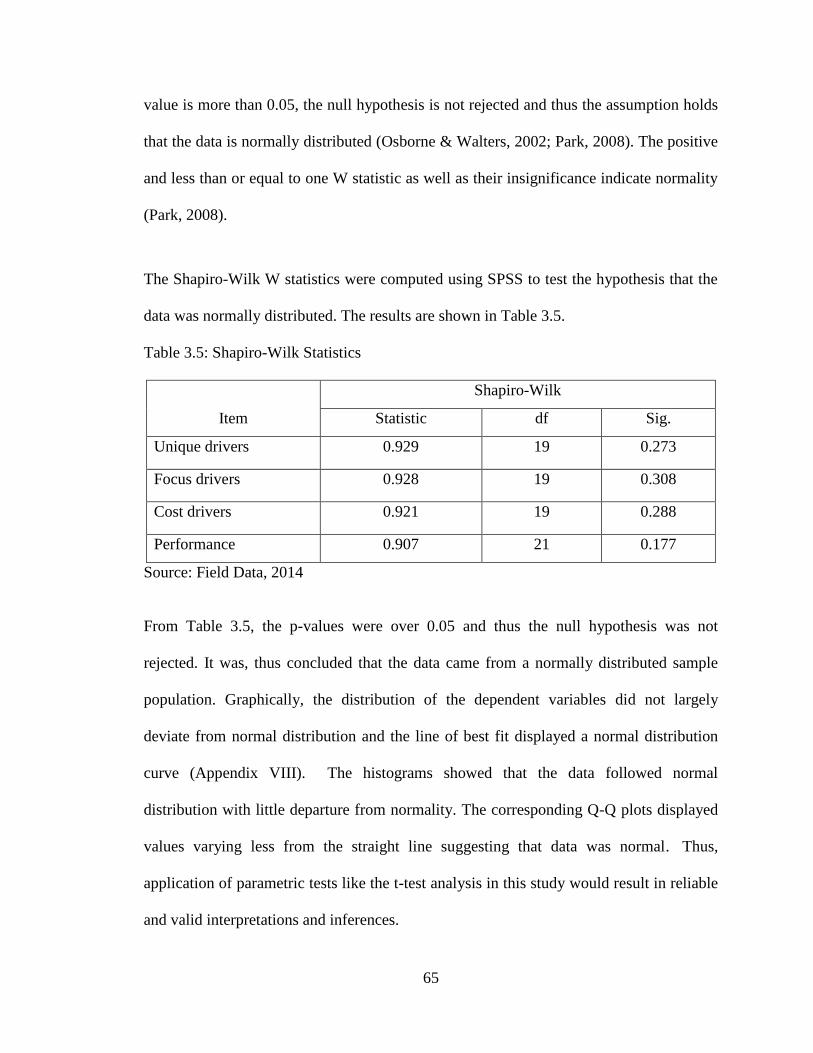
65
value is more than 0.05, the null hypothesis is not rejected and thus the assumption holds
that the data is normally distributed (Osborne & Walters, 2002; Park, 2008). The positive
and less than or equal to one W statistic as well as their insignificance indicate normality
(Park, 2008).
The Shapiro-Wilk W statistics were computed using SPSS to test the hypothesis that the
data was normally distributed. The results are shown in Table 3.5.
Table 3.5: Shapiro-Wilk Statistics
Item
Shapiro-Wilk
Statistic df Sig.
Unique drivers 0.929 19 0.273
Focus drivers 0.928 19 0.308
Cost drivers 0.921 19 0.288
Performance 0.907 21 0.177
Source: Field Data, 2014
From Table 3.5, the p-values were over 0.05 and thus the null hypothesis was not
rejected. It was, thus concluded that the data came from a normally distributed sample
population. Graphically, the distribution of the dependent variables did not largely
deviate from normal distribution and the line of best fit displayed a normal distribution
curve (Appendix VIII). The histograms showed that the data followed normal
distribution with little departure from normality. The corresponding Q-Q plots displayed
values varying less from the straight line suggesting that data was normal. Thus,
application of parametric tests like the t-test analysis in this study would result in reliable
and valid interpretations and inferences.

66
3.9.3 Test for Multicollinearity
Multicollinearity is the unacceptable high level of correlation among the independent
variables making it hard to separate the effects of the individual independent variables.
Under this condition, assessment of the relative strength of the independent variables and
their joint effect are unreliable. Thus, analysis was conducted for test of multicollinearity.
The test for multicollinearity was performed using Condition Index (CI), Variance
Inflation Factors (VIF) and tolerance. Small values for tolerance and large VIF values
show the presence of multicollinearity (Keith, 2006). The acceptance range of CI < 30,
VIF < 5, and tolerance > 0.2 was applied in the test for multicollinearity. Table 3.6 shows
the collinearity statistics derived by performing regression analysis of performance
(dependent) and the independent variables.
Table 3.6: Collinearity Statistics
Model Collinearity Statistics
Condition Index Tolerance VIF
(Constant) 1.000
Age .749 1.336 3.744
Gender .971 1.030 4.575
Education .583 1.715 5.476
Managerial skills .644 1.552 7.244
Industry experience .771 1.297 7.948
Social skills .774 1.293 12.089
Uniqueness drivers .458 2.183 13.048
Focus drivers .611 1.637 13.314
Cost drivers .477 2.094 15.568
Resource based institutions .374 2.672 20.188
Administrative based institutions .387 2.583 25.639
Source: Field Data, 2014

67
The results showed high tolerance, and low VIF and CI values. The CI, VIF and tolerance
fell within the acceptance range (CI < 30, VIF < 5 and tolerance > 0.2) pointing to lack of
multicollinearity problem, that is independent variables were not correlated with each
other. This implied that this study could apply linear or generalized linear models with a
substantial degree of accuracy.
3.9.4 Test for Homoscedasticity
The assumption of homoscedasticity assumes that the variance around the regression line
is the same for all values of the independent variables, that is the dependent variable
exhibits similar amounts of variance across the range of values for an independent
variable. The violation of homoscedasticity (heteroscedasticity) is present when the size
of the error term differs across values of an independent variable. Slight
heteroscedasticity has little effect on significance tests but marked heteroscedasticity
weakens and distorts the analysis thus increasing possibility of committing Type I error
(Tabachnick & Fidell, 2007). Thus, the study tested homoscedasticity by use of Levene‟s
t test of homogeneity of variance. If the Levene statistic is significant at p<0.05 level of
significance, the null hypothesis that the levels have equal variances is rejected. Table 3.7
shows the results.
Table 3.7: Test of Homogeneity of Variables
Variable Levene Statistic df1 df2 Sig.
Unique drivers 2.112 5 266 .064
Focus drivers 1.809 5 267 .111
Cost drivers 1.536 5 267 .179
Performance 1.372 5 262 .235
Source: Field Data, 2014

68
The findings showed that the Levene‟s statistics for all variables were not significant
leading to not rejecting the null hypothesis that there was no significant variations
between the levels (see Table 3.7). Thus, it was possible to apply multiple linear
regression analysis without fear of committing type I error.
3.10 Data Analysis
Data analysis by this study was mostly quantitative in nature. However, qualitative
analysis was undertaken to organize raw data collected to address the research objectives.
Qualitative analysis consisted of cleaning, summarizing and organizing the data into
meaningful patterns and themes. Mugenda and Mugenda (2003) opine that data obtained
from the field in raw form is difficult to interpret unless it is cleaned, coded and analyzed.
The quantitative analysis consisted of both descriptive and inferential statistical
procedures. The descriptive statistics and inferential analyses were applied in analyzing
the data collected in order to meet the study objectives. Analysis of the data was
performed using SPSS.
3.10.1 Descriptive Statistics
The descriptive statistics were performed to provide useful insights to the data collected.
Harper et al. (1977) indicated that descriptive statistics are used to describe the basic features
of data into simple summaries in a study. Thus, the descriptive statistics provide concise
profiles of the respondent firms, and the four variables used in the analyses to achieve
objectives.

69
The descriptive statistics generated including the frequency counts and percentages were
used in profiling the respondent SMEs as well as the patterns of distribution of each study
variable. To determine normality and suitability of the data for regression analysis the
skewness and kurtosis were computed.
3.10.2 Inferential Statistical Procedures
The inferential statistical analyzes were performed to provide useful insights to the data
that could not be captured by the descriptive statistics. According to Harper et al. (1977),
inferential statistics are used to make inferences about the population. Therefore, this
study performed inferential statistical tests to understand the relationships between
various variables and to test the null hypotheses. Inferential analysis involved performing
correlation and regression analyzes. Prior to undertaking the inferential analysis, tests
were performed on the data collected to establish its suitability for the inferential
statistical procedures.
Inferential statistical analysis involved analysis of the quantitative data obtained from the
survey in relation to the research objectives and hypotheses. Correlation analysis was
performed to indicate association between entrepreneur characteristics and competitive
strategy while multiple linear regression analyzes were performed to establish the
relationships and effects between independent and dependent variables as per the stated
hypotheses. The entrepreneur characteristics and competitive strategy were regressed as
independent variables with firm performance as dependent variable.

70
Multiple linear regressions were performed to explore the mediation and moderation
effects of competitive strategies and firm level institutions, respectively on the relation
between entrepreneur characteristics and firm performance. Three regression models
were applied to establish existence of mediation relationship; regressing entrepreneur
characteristics with firm performance (model 1); regressing competitive strategy with
firm performance (model 2); and regressing entrepreneur characteristics and competitive
strategy with firm performance (model 3). The relationship was deemed to exist if the
regression coefficient of competitive strategy was significant while the coefficients of
entrepreneur characteristics differed when competitive strategy was included in the
regression and when not. Competitive strategy was deemed to completely mediate the
relationship if entrepreneur characteristics no longer predicted performance when both
the two variables were used in the model. Equally, competitive strategy was deemed to
partially mediate the relationship if entrepreneur characteristics had a smaller coefficient
when used together with competitive strategy to predict performance. Finally,
competitive strategy was deemed not to mediate the relationship if the coefficient of
entrepreneur characteristics remained same before and after competitive strategy was
used to predict performance.
The moderation effect was established by regressing performance (dependent) against
competitive strategy, firm level institutions and the interaction term (derived as product
of competitive strategy and firm level institutions) as independent variables (Frazier et
al., 2004). The analytical technique, type of data/information required and what questions
in the questionnaire applied for each objective and corresponding hypothesis are
presented in Table 3.8.

71
Table 3.8: Summary of Data Required, Questions and Analysis Technique
Objective Hypothesis Data/Information Required Questions Analysis Technique
Determine effect of
entrepreneur
characteristics on
performance of
SMEs
H1: There is no
significant relationship
between entrepreneur
characteristics and
performance of SMEs
Entrepreneur‟s age, gender, education,
managerial know-how, experience, skills,
motivation, market share, profits, annual
sales, products developed, number of
employees, and performance indicators
7, 8, 9, 10, 11,
12, 16, 17, 18,
19, 20, 21
Descriptive statistics
Correlation analysis
Regression analysis
Establish effect of
entrepreneur
characteristics on
competitive strategy
of SMEs
H2: There is no
significant relationship
between entrepreneur
characteristics and
competitive strategy of
SMEs
Entrepreneur‟s age, gender, education,
managerial know-how, experience, skills,
motivation, product differentiation, focus
and cost recovery/limiting
7, 8, 9, 10, 11,
12, 13
Descriptive statistics
Correlation analysis
Determine the
influence of
competitive strategy
on performance of
SMEs
H3: There is no
significant relationship
between competitive
strategy and
performance of SMEs
Product differentiation, focus, cost
recovery, market share, profits, annual
sales, products developed, number of
employees
13, 16, 17, 18,
19, 20, 21
Descriptive statistics
Correlation analysis
Regression analysis

72
Table 3.8 Cont...
Establish the effect of
firm level institutions
on the relationship
between competitive
strategy and
performance of SMEs
H4: There is no significant
moderating effect of firm
level institutions on the
relationship between
competitive strategy and
performance of SMEs
Level of emphasis on financial
resources, skills, knowledge base,
motivated and loyal staff, firm structure,
management style, internal controls,
systems, procedures, product
differentiation, focus, cost recovery,
market share, profits, sales, and
efficiency
14, 15, 16, 17,
18, 19, 20,
21
Descriptive statistics
Correlation analysis
Regression analysis
Determine joint effect
of entrepreneur
characteristics and
competitive strategy
on performance of
SMEs
H5: Combined effect of
entrepreneur characteristics
and strategy on
performance of SMEs is
not significantly different
from their individual
effects
Entrepreneur‟s age, gender, education,
managerial know-how, experience,
skills, product differentiation, focus,
cost recovery, market share, profits,
annual sales, products developed,
number of employees, and performance
indicators
7, 8, 9, 10, 11,
12, 13, 16, 17,
18, 19, 20, 21
Correlation analysis
Regression analysis
Source: Researcher, 2014

73
In testing hypothesis H1 and achieving objective one, regression analysis was performed
with firm performance (dependent) and entrepreneur characteristics (independent) using
the following model (equation 3.3) as abbreviated in Table 3.3 and Ɛ1 as error term:
FP1 = β01 + β11 AGE + β12 GE + β13 EE + β14 MK + β5 IE + β16 SK + Ɛ1 (3.3)
Testing hypothesis H2 and achieving objective two was by performing correlation
analysis. In testing hypothesis H3 and achieving objective three, regression analysis using
following model (equation 3.4) as abbreviated in Table 3.3 and Ɛ3 as error term was done:
FP3 = β03 + β31 DD + β32 FF + β33 CL+ Ɛ 3 (3.4)
In testing hypothesis H4 and achieving objective four, regression analysis was performed
with performance (dependent), and competitive strategy, firm level institutions and
interaction term as independent variables using the following model (equation 3.5) as
abbreviated in Table 3.3 and Ɛ4 as error term:
FP4 = β04 + β41 CS + β42 FLI + β43 ITT + Ɛ4 (3.5)
Testing H5 and achieving objective five was by performing regression analysis using the
following model (equation 3.6) as abbreviated in Table 3.3 and Ɛ5 as error term:
FP5 = β 05 + β51 EC + β52 CS + Ɛ5 (3.6)
The hypotheses, objectives and research analytical models are summarized in Table 3.9.

74
Table 3.9: Analytical Models for Hypotheses Testing
Hypothesis Statement Analytical Model
Expected Results
Test Condition Significance
level
H1: There is no relationship between entrepreneur
characteristics and performance of SMEs
FP1 = β01 + β11 AGE + β12 GE + β13 EE +
β14 MK + β5 IE + β16 SK + 1 β11 - 16 ≠ 0 p ≤ 0.05
H2: There is no relationship between entrepreneur
characteristics and competitive strategy of
SMEs
C= corr (DD, FF, CL and AGE, GE, EE,
MK, IE, SK) r ≠ 0 p ≤ 0.05
H3: There is no relationship between competitive
strategy and performance of SMEs FP3 = β03 + β31 DD + β32 FF + β33 CL + 3 β31-33 ≠ 0 p ≤ 0.05
H4: There is no influence of firm level institutions
on relationship between competitive strategy
and performance of SMEs
FP4 = β04 + β41 CS + β42 FLI + β43 ITT + 4 Β41-43 ≠ 0 p ≤ 0.05
H5: Combined effect of entrepreneur characteristics
and strategy on performance of SMEs is not
different from their individual effects
FP5 = β05 + β51 EC + β52 CS + 5 β51-52 ≠ 0 p ≤ 0.05
Source: Researcher, 2014

75
CHAPTER FOUR
DATA ANALYSIS AND FINDINGS
4.1 Introduction
This chapter presents the analysis with descriptive and inferential statistics and the
interpretation of the findings. The descriptive statistics provide profiles of firms in the
NTFPs sub-sector which formed population of this study including their years of
operation, type of products they dealt with, and their size and legal status. Descriptive
statistics of the four variables including the distribution of the respondent firms by these
variables are also presented. This chapter further presents inferential statistics; inferential
statistical tests involving correlation and regression analyzes were performed to establish
the relationships between various variables and to test the null hypotheses.
4.2 Descriptive Statistics
This section presents descriptive statistics providing concise profiles of 277 firms (88
percent of the total sample size) that satisfactorily filled the questionnaire. The profiling
using frequency distribution of the scores covered the years of operation, nature of
products handled, size, and legal status of the respondent firms. This study used
frequency distribution to be able to display the data sets in a fairly concise manner and
offer an at-a-glance reference into their distribution.
Profiling of the respondent firms was aimed at providing an understanding of their unique
features as units for studying the causal relationships among the variables in the
entrepreneurship to firm performance nexus. Theoretical perspectives and conceptual
arguments presented in this study show that firm performance is influenced by a number

76
of variables including individual, organizational, and environmental factors. Therefore,
the profiling provided an understanding of firms in the NTFPs sub-sector as units of this
study, that is units of data collection and analysis.
4.2.1 Years in Operation
In this section, firms were profiled based on their years in operation. Studies demonstrate
that years of operation influence the firm value. Years in operation indicate experience
possessed by the firm. Older well developed firms have better experience and out-
perform newer firms. Years in operation indicate firm experience and have a positive
impact on performance (Kipesha, 2013). Equally, years in operation are a significant
determinant of capital structure of a firm as it enhances creditworthiness (Shehu, 2011).
The researcher thus, performed descriptive statistics to derive frequency counts and
percentages for profiling the firms in relation to their years of operation. The years in
operation were captured as the age category reflecting period of time in running the
business. Table 4.1 shows the profile of respondent firms by years in operation.
Table 4.1: Years in Operation
Operation by the Firm (Years) Frequency Percent
0 to 10 163 58.9
11 to 20 77 27.8
Over 20 37 13.4
Total 277 100.00
Source: Field Data, 2014
Majority of firms (58.9 percent) were in operation for 10 years and below. The least (13.4
percent) were the firms that had been in operation for over 20 years. This implied that, on
average firms in the NTFPs sub-sector were relatively new in operation with majority

77
being in existence for not more than five years; shorter durations resulted in lower levels
of experience, operation capacity and creditworthiness negatively affecting performance.
4.2.2 Nature of Products Handled
The NTFPs are wide and diverse ranging from food products to non-food products
including medicinal and essential oils. Nature of the NTFPs has an impact on
performance of the business. Studies have demonstrated that firms handling food related
products tend to out-perform those dealing with non-food items. Studies (Nils & von der
Fehr, 1995; Adegbite et al., 2006) have shown that food processing and distribution
businesses are the majority and contribute significantly to satisfying the basic needs in
most African countries. Equally, highly diversified firms have higher resilience levels
and post better performance unlike those that are not. Bowen et al. (2009) observed that
selling a variety of differentiated products and services helps business perform well.
The researcher, thus performed descriptive statistics to profile the firms based on nature of
products dealt with. Table 4.2 shows the frequencies of NTFPs handled by the firms.
Table 4.2: Nature of Products Handled
Type of Product Frequency Counts Percent
Fruit products 142 51.3
Medicinal 64 23.1
Bee products 62 22.4
Others 9 3.2
Total 277 100.0
Source: Field Data, 2014
Most of firms handled fruit products (51.3 percent). The firms (3.2 percent) also indicated
handling other NTFPs including butterflies, basketry and plant dyes. The fruit products

78
form part of the food products and it was not surprising that most of the firms handled
such products. Thus, the firms in the NTFPs sub-sector on average dealt with food related
products; food related products tended to have higher demand enabling firms to achieve
better performance.
The number of NTFPs handled by the firms was varied. The number of products handled
impacts on firm performance as handling many products helps hedge a firm against
uncertainties in market demand and pricing (Bowen et al., 2009). Thus, in this section
respondent firms were profiled based on number of products handled. Table 4.3 shows
the descriptive statistics of the number of NTFPs handled by the firms.
Table 4.3: Number of Products Handled
Number of Products Frequency Percent
One 101 36.5
Two 60 21.7
Three 42 15.2
More than three 74 26.7
Total 277 100.10
Source: Field Data, 2014
The firms handling only one product formed 36.5 percent of the sample size (see Table
4.3). However, the firms handling more than one product formed over 60 percent. This
implied that, on average firms in NTFPs sub-sector were highly diversified;
diversification cushions firms against uncertainties in demand for products and pricing.
4.2.3 Size of the Firms
The size of the firm is one of the key determinants of firm performance; the firm size has
shown to have an impact on performance due to the advantages and disadvantages faced

79
by the firms with a particular level of performance. According to Chandler (1962), large
firms can operate at low costs due to scale and scope of economies advantages. In
addition, due to their size of operations, large firms have the advantage of getting access
to credit finance for investment, possess a larger pool of qualified human capital and have
a greater chance for strategic diversification compared to small firms (Yang & Chen,
2009). Large firms also have superior capabilities in product development and marketing
making them have better perform (Teece, 1986). Size of enterprise reflects how large it is
in employment terms (Islam et al., 2011). McMahon (2001) found that firm size is
significantly linked to better performance. According to Ramsay et al. (2005), firm size
allows for incremental advantages by enabling a firm to raise barriers of entry to potential
entrants as well as gain leverage on economies of scale to attain productivity. Thus, in
this section firm size was evaluated to elucidate how they exploited advantages of size.
Descriptive statistics were performed to establish size distribution of the firms. Firm size
was measured by the number of employees as applied by the GoK to categorize firms.
Table 4.4 shows the size distribution of respondent firms.
Table 4.4: Size of the Firms
Size (Employees) Categorization Frequency Percent
Less than 10 Very small 177 64
10 to 49 Small 81 29
50 to 99 Medium 19 7
Total 277 100
Source: Field Data, 2014
There was an inverse relationship between the number and size of the firms. The highest
percentage (64 percent) of the firms had less than 10 employees. On the other hand, the

80
least percentage (6.9 percent) of the firms had 50 to 99 employees. This implied that, on
average firms in the NTFPs sub-sector were very small according to the categorization by
the GoK depicting firms with less than 10 employees as very small enterprises.
4.2.4 Legal Status
Legal status of a firm has an impact on its performance. Stiglitz and Weiss (1981) stated
that limited liability businesses have a greater incentive to pursue risky projects and,
therefore, expect higher profits and growth rates than other firms. Harhoff et al. (1998) in
their study of German firms found that firms with limited liability have above average
growth rates. Freedman and Godwin (1994) in their study of small businesses in the
United Kingdom found that the prime benefit of corporate status was limited liability.
Based on the foregoing, descriptive statistics were performed to establish legal status of
the firms. The legal status was measured as categorical data with respondents selecting
appropriate choices to depict their legal status. Table 4.5 shows the distribution of the
firms based on their legal status.
Table 4.5: Legal Status
Legal Status Frequency Percent
Sole proprietorship 143 51.6
Partnership 53 19.1
Limited company 45 16.2
Cooperative society/self-help group 36 13.0
Total 277 100.0
Source: Field Data, 2014
Most of the respondent firms (51.6 percent) were operated as sole proprietorship ventures
(see Table 4.5). The least number of firms (13 percent) were operated as cooperatives.

81
This demonstrated that, on average firms in the NTFPs sub-sector were operated as sole
proprietorships. The process of incorporating partnerships and limited companies is
lengthy and costly process in Kenya hence the highest percentages of the firms in the
NTFPs sub-sector were operated as sole proprietorships.
4.3 Entrepreneur Characteristics
Studies sometime consider entrepreneur and manager to be one and the same; however, a
distinction has been made between the two based on the motive, status, risk bearing,
rewards, innovations and qualifications. An entrepreneur is business owner and plays
strategic role involving focusing on the future and developing a vision, but a manager is a
servant playing both strategic and tactical role turning the vision into action. Thus, this
study drew a distinction between the two and aimed to interview owners as entrepreneurs.
However, in cases whereby it was not possible to have the owner, then the manager
operating the business was interviewed. Of the 277 entrepreneurs interviewed, 68 percent
were owners operating their firms both as chairmen (13 percent) or directors (55 percent),
29 percent were managers and a paltry three percent listed others were senior supervisory
staff well-versed with the firm and directly involved in decision-making (Appendix VI).
The characteristics of entrepreneur are many and diverse but this study considered age,
gender, education, managerial skills, industry experience and social skills; they depict
knowledge, talents, skills, abilities, experience, intelligence, and training advanced under
RBV as some of the resources and capabilities necessary for achieving competitive
advantage. In this section, therefore, frequency tables were used to show patterns of
distribution of the firms by these six entrepreneur characteristics.

82
4.3.1 Age of the Entrepreneur
The age was conceptualized as one of the entrepreneur characteristics affecting firm
performance. Observations showed that age of the entrepreneurs was varied among the
firms. In this section, therefore, descriptive statistics were performed to profile the firms
by age of entrepreneurs. Age was measured as the entrepreneur‟s number of years from
date of birth. Table 4.6 shows the profile of the firms by age of the entrepreneur.
Table 4.6: Age of Entrepreneurs
Age Frequency Percent
Below 30 36 13.0
30 to 49 175 63.2
50 and above 66 23.8
Total 277 100.0
Source: Field Data, 2014
The majority of the firms (63.2 percent) had entrepreneurs in the age bracket of 30 to 49
years. The least percent of the firms had entrepreneurs in the age bracket of below 30
years (13 percent). Therefore, the findings show that on average, majority of
entrepreneurs owning/operating firms in the NTFPs sub-sector were young adults as per
the classification in Erickson (1956) that a young adult is in the age range of 20 to 40
years, whereas a person in middle adulthood stage is in the age range of 40 to 64 years.
4.3.2 Gender of the Entrepreneur
The gender was conceptualized as one of the entrepreneur characteristics affecting firm
performance. Observations showed that gender of the entrepreneurs was varied among
the firms. In this section, therefore, descriptive statistics were performed to profile the
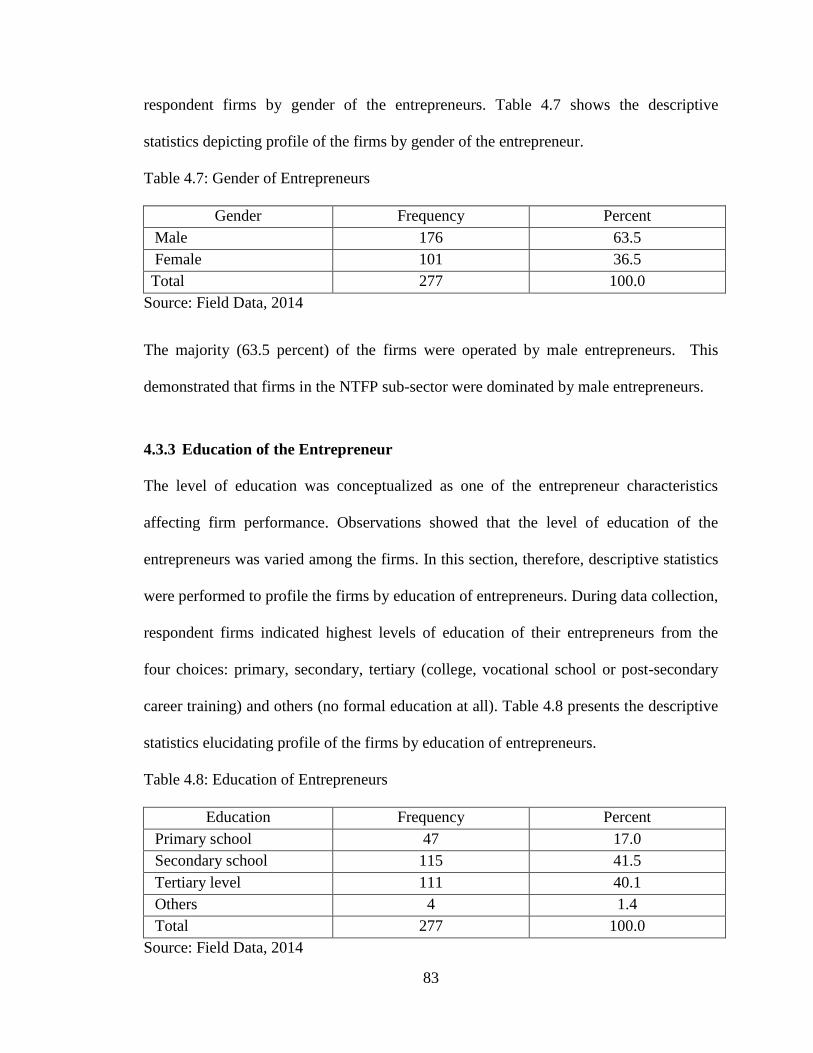
83
respondent firms by gender of the entrepreneurs. Table 4.7 shows the descriptive
statistics depicting profile of the firms by gender of the entrepreneur.
Table 4.7: Gender of Entrepreneurs
Gender Frequency Percent
Male 176 63.5
Female 101 36.5
Total 277 100.0
Source: Field Data, 2014
The majority (63.5 percent) of the firms were operated by male entrepreneurs. This
demonstrated that firms in the NTFP sub-sector were dominated by male entrepreneurs.
4.3.3 Education of the Entrepreneur
The level of education was conceptualized as one of the entrepreneur characteristics
affecting firm performance. Observations showed that the level of education of the
entrepreneurs was varied among the firms. In this section, therefore, descriptive statistics
were performed to profile the firms by education of entrepreneurs. During data collection,
respondent firms indicated highest levels of education of their entrepreneurs from the
four choices: primary, secondary, tertiary (college, vocational school or post-secondary
career training) and others (no formal education at all). Table 4.8 presents the descriptive
statistics elucidating profile of the firms by education of entrepreneurs.
Table 4.8: Education of Entrepreneurs
Education Frequency Percent
Primary school 47 17.0
Secondary school 115 41.5
Tertiary level 111 40.1
Others 4 1.4
Total 277 100.0
Source: Field Data, 2014

84
Majority of the firms had entrepreneurs with secondary (41.5 percent) and tertiary (40.1
percent) levels of education. The firms that indicated others (four percent) had
entrepreneurs who were mostly uneducated. This implied that, on average firms in the
NTFPs sub-sector were owned/operated by entrepreneurs with high levels of education.
4.3.4 Managerial Skills of the Entrepreneur
The managerial skills variable was conceptualized as one of the entrepreneur
characteristics affecting firm performance. However, managerial skills of the
entrepreneur were varied among the firms. In this section, therefore, the respondent firms
were profiled by the managerial skills of their entrepreneurs. Respondent firms indicated
whether their owners/operators had attended managerial training. Managerial skills unlike
experience require specialized training to equip one with necessary theoretical and
practical managerial capacity; entrepreneurs with managerial skills were those that had
attended managerial courses. Table 4.9 shows profile of the firms by managerial skills of
their entrepreneurs.
Table 4.9: Managerial Skills of Entrepreneurs
Managerial Skills Frequency Percent
Attended managerial training 122 44.0
Not attended any managerial training 155 56.0
Total 277 100.0
Source: Field Data, 2014
The majority of the firms (56 percent) had entrepreneurs who had not attended any
training to enhance their managerial know-how. This implied that, on average firms in
the NTFPs sub-sector were owned/operated by entrepreneurs with no requisite

85
managerial skills, that is majority of entrepreneurs had not attended necessary trainings
for enhancing their managerial skills in running businesses.
4.3.5 Industry Experience of the Entrepreneur
Industry experience was conceptualized as one of the entrepreneur characteristics
affecting firm performance. However, industry experience of the entrepreneurs was
varied among the firms. In this section, therefore, the firms were profiled by the industry
experience of the entrepreneurs using descriptive statistics. Respondent firms indicated
industry experience of their entrepreneurs as the years involved in managerial position or
in running the business. Table 4.10 shows the frequencies elucidating profile of
respondent firms by industry experience possessed by their entrepreneurs.
Table 4.10: Industry Experience of Entrepreneurs
Industry Experience Frequency Percent
0 to10 years 202 72.9
11 to 20 years 46 16.6
Over 20 years 29 10.5
Total 277 100.0
Source: Field Data, 2014
The majority of the respondent SMEs (72.9 percent) had upto 10 years of experience in
running businesses. This implied that, on average firms in the NTFPs sub-sector were
owned/operated by entrepreneurs with relatively lower levels of industry experience.
4.3.6 Social Skills of the Entrepreneur
This study conceptualized social skills as one of the entrepreneur characteristics affecting
firm performance. However, observations showed that social skills of the entrepreneurs

86
were varied among the firms. In this section, therefore the firms were profiled by the
social skills of the entrepreneurs using descriptive statistics. Respondent firms indicated
whether their entrepreneurs subscribed to social groups/clubs. Social skills unlike
managerial skills demonstrate social capital acquired through interactions in collective
action; entrepreneurs with social skills were those that were subscribed to groups/clubs.
Table 4.11 shows profile of the firms by entrepreneurs‟ social skills.
Table 4.11: Social Skills of Entrepreneurs
Social Skills Frequency Percent
Belonging to social groups 113 40.8
Not subscribed to any group 164 59.2
Total 277 100.0
Source: Field Data, 2014
Majority of the firms (59.2 percent) had entrepreneurs who had not subscribed to any
group. This implied that, on average firms in the NTFPs sub-sector were owned/operated
by entrepreneurs without necessary social skills.
4.4 Competitive Strategy Drivers
Competitive strategy is described as a pattern of decisions that are selected and
implemented to achieve sustainable competitive advantage. Studies have made varying
observations over the effect of competitive strategy on performance. While some studies
have advanced a mediation role, others have discounted this observation. Thus, this study
conceptualized competitive strategy as one of the variables that impacts on the
entrepreneurship to firm performance relationship. Since this study was looking at the
competitive strategy applied by the SMEs, it was felt that Porter‟s generic strategy matrix
was appropriate. Studies have observed that Porter‟s generic competitive strategy model

87
is appropriate for smaller firms (Chaganti et al., 1989; Namusonge, 2014). Porter‟s
generic strategy matrix have also been studied, validated, and applied in many studies on
the small firms (Aaker, 1998; Chaganti et al., 1989; Dess & Davis, 1984).
Porter (1980) proposed differentiation, cost leadership and focus or niche strategy as the
three basic competitive strategy choices. The various activities implemented to achieve
competitive strategy are termed drivers; uniqueness drivers for differentiation, cost
drivers for cost leadership and focus drivers for focus or niche strategy. Namusonge
(2014) points out that during the last several years, definitions of Porter‟s generic
strategies have been refined to identify combinations of strategy types and subtypes
within the three areas. In most cases, the focus strategy is treated as not stand-alone but is
combined with the other two strategies; Porter (1980) subdivided the focus strategy into
two parts: "differentiation focus"" and cost focus” since companies that follow a focus
strategy should provide either a differentiated product or service to the segment or a low
cost product or service for the chosen segment. However, focus is appropriate strategy for
small-sized firms especially for those aiming to avoid competition with big ones ((Dess
& Davis, 1982, 1984; Covin et al., 1990; Robinson & Pearce, 1991). Based on the
foregoing, focus was considered as a stand-alone strategy in this study.
In this section, therefore, descriptive statistics were performed to profile respondent firms
by competitive strategy drivers implemented using frequency tables. Respondent firms
were requested to indicate their extent of implementation of the three competitive
strategy drivers in enhancing their competitiveness and performance using a five point
Likert scale: to a great extent, high extent, moderately, small extent and not at all.

88
4.4.1 Uniqueness Drivers
The uniqueness drivers are a deliberate choice of activities implemented for achieving
differentiation, that is deliver unique mix of value to counter competitor‟s actual or
predicted moves (Ologunde & Agboola, 2012). Firms often implement various
uniqueness drivers to achieve competitive advantage. In this section, therefore descriptive
statistics were applied to show the extent of implementation of uniqueness drivers by
respondent firms to enhance their competitiveness. The firms indicated the extent of
implementation of the uniqueness drivers in enhancing their competitiveness using a five
point Likert scale. The descriptive statistics derived are shown in Table 4.12.
Table 4.12: Implementation of Uniqueness Drivers
Response Frequency Percent
To a great extent 56 20.2
High extent 73 26.4
Moderately 66 23.8
Small extent 56 20.2
Not at all 26 9.4
Total 277 100.0
Source: Field Data, 2014
Majority of SMEs (26.4 percent) indicated implementing uniqueness drivers to a high
extent. Few SMEs (9.4 percent) indicated not implementing uniqueness drivers at all.
This implied that, on average firms in the NTFPs sub-sector to a high extent implemented
uniqueness drivers to counter competition by packaging and branding their products, and
applying pricing strategy.

89
4.4.2 Focus Drivers
The focus drivers are some of the strategies implemented by firms to enhance their
competitiveness. Focus drivers reflect decisions to offer particular products or services in
particular markets (Ologunde & Agboola, 2012). Firms often implement various focus
drivers to achieve competitive advantage. Thus, in this section descriptive statistics were
used to show the extent of implementation of different focus drivers by the firms to
enhance their competitiveness. The firms indicated extent of implementation of focus
drivers using a five point Likert scale. The descriptive statistics derived are shown in
Table 4.13.
Table 4.13: Implementation of Focus Drivers
Response Frequency Percent
To a great extent 47 17.0
High extent 115 41.5
Moderately 94 33.9
Small extent 19 6.9
Not at all 2 0.7
Total 277 100.0
Source: Field Data, 2014
The majority of the firms (41.5 percent) indicated implementing focus drivers to a high
extent. A few firms (0.7 percent) indicated not implementing at all. The findings,
therefore, show that on average the firms in the NTFPs sub-sector implemented focus
drivers to high extent by learning and adhering to customer needs, trying out new ways of
service delivery, quickly responding to market changes and being consistent in their
market strategy selection.
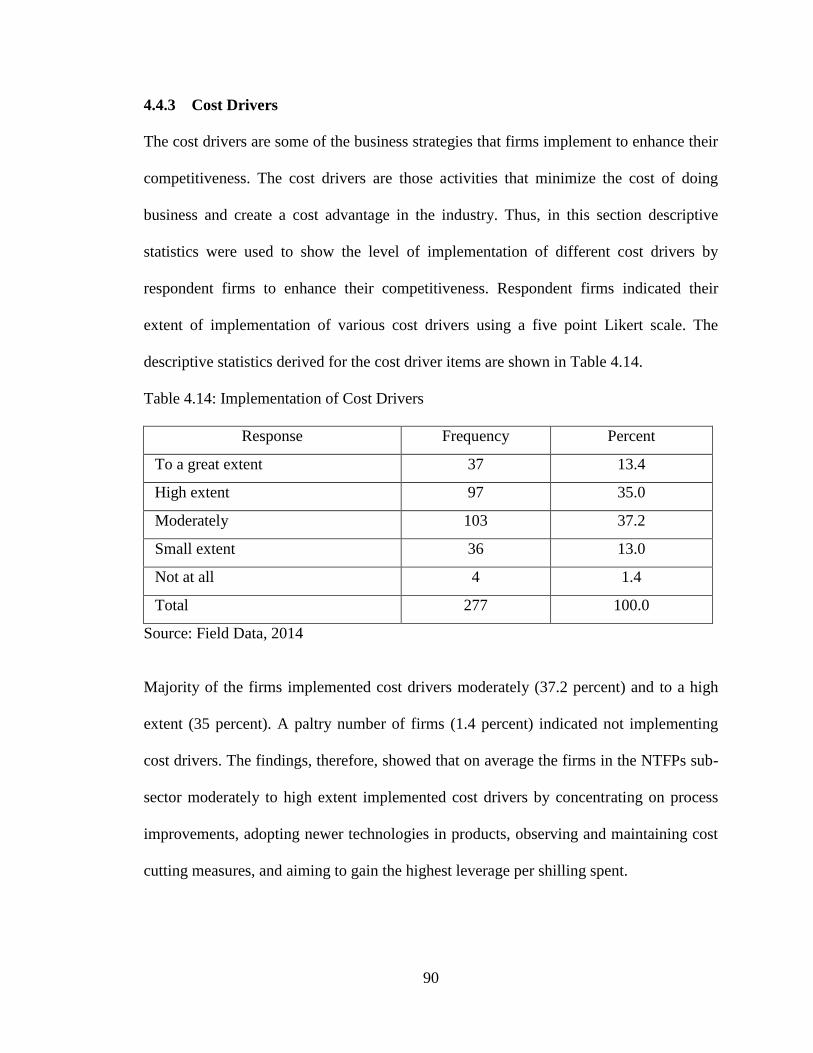
90
4.4.3 Cost Drivers
The cost drivers are some of the business strategies that firms implement to enhance their
competitiveness. The cost drivers are those activities that minimize the cost of doing
business and create a cost advantage in the industry. Thus, in this section descriptive
statistics were used to show the level of implementation of different cost drivers by
respondent firms to enhance their competitiveness. Respondent firms indicated their
extent of implementation of various cost drivers using a five point Likert scale. The
descriptive statistics derived for the cost driver items are shown in Table 4.14.
Table 4.14: Implementation of Cost Drivers
Response Frequency Percent
To a great extent 37 13.4
High extent 97 35.0
Moderately 103 37.2
Small extent 36 13.0
Not at all 4 1.4
Total 277 100.0
Source: Field Data, 2014
Majority of the firms implemented cost drivers moderately (37.2 percent) and to a high
extent (35 percent). A paltry number of firms (1.4 percent) indicated not implementing
cost drivers. The findings, therefore, showed that on average the firms in the NTFPs sub-
sector moderately to high extent implemented cost drivers by concentrating on process
improvements, adopting newer technologies in products, observing and maintaining cost
cutting measures, and aiming to gain the highest leverage per shilling spent.

91
4.5 Firm Level Institutions
Firm level institutions are the firm-specific attributes in a firm‟s internal environment that
define and limit recognition and exploitation of entrepreneurial opportunity. Economic
actions take place in a social context (Grannovetter, 1985); institutions manifested within
a firm will determine how and where entrepreneurial talent and effort is channeled.
However, it is not clear how institutional components hold in the small business sector
(Kimuyu, 1999). The literature on the importance of institutions in influencing firm
performance is either ambiguous (Sachs, 2003) or emanates from analysis of large
corporations (Machuki et al., 2012). This study, therefore, conceptualized firm level
institutions as one of the variables in testing the entrepreneurship to performance
relationships.
Various studies including Bruton et al. (2010) and Machuki et al. (2012) have classified
firm level institutions into two; resource based and administrative based firm level
institutions. Manifestation of these firm level institutions varies among firms. Thus, in
this section, frequency tables were used to show the manifestation levels of firm level
institutions in the respondent firms.
4.5.1 Resource Based Firm Level Institutions
The resource based firm level institutions are those that pertain to resource base of the
firm and include financial resources, skills and competencies, knowledge base, culture,
and human resources. Firms often manifest various resource based firm level institutions
to achieve competitive advantage and performance. Thus, in this section descriptive
statistics were used to show the level of manifestation of various resource based firm
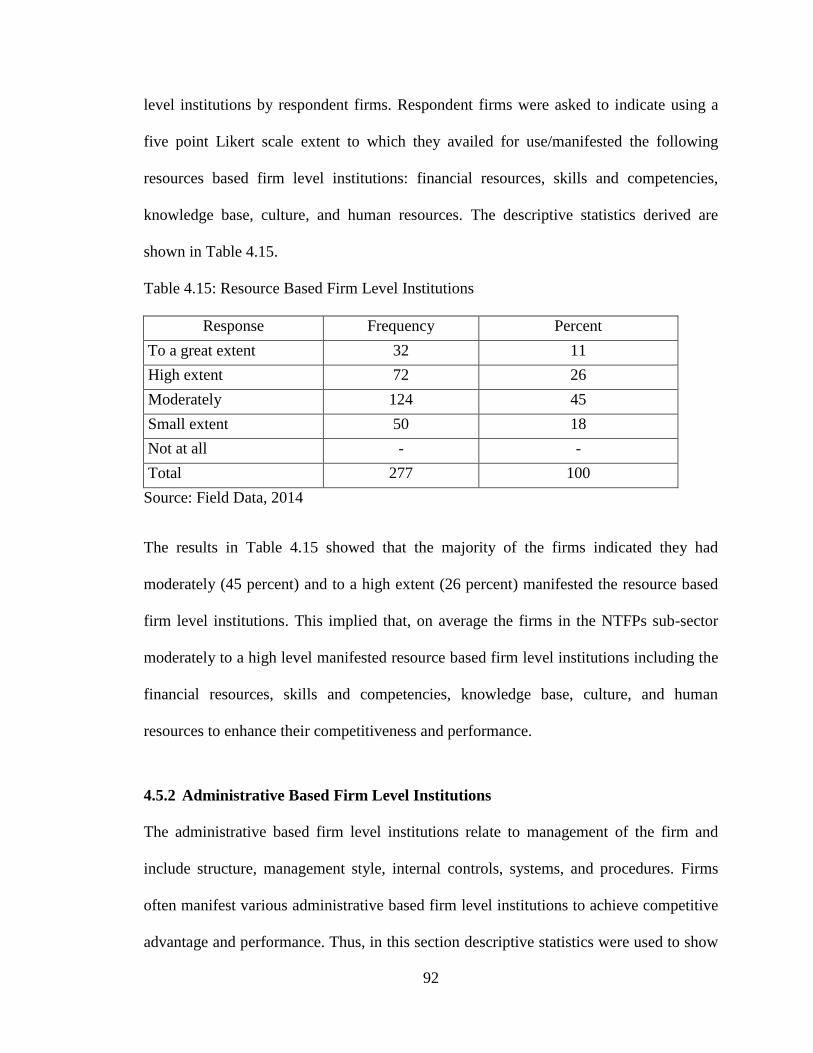
92
level institutions by respondent firms. Respondent firms were asked to indicate using a
five point Likert scale extent to which they availed for use/manifested the following
resources based firm level institutions: financial resources, skills and competencies,
knowledge base, culture, and human resources. The descriptive statistics derived are
shown in Table 4.15.
Table 4.15: Resource Based Firm Level Institutions
Response Frequency Percent
To a great extent 32 11
High extent 72 26
Moderately 124 45
Small extent 50 18
Not at all - -
Total 277 100
Source: Field Data, 2014
The results in Table 4.15 showed that the majority of the firms indicated they had
moderately (45 percent) and to a high extent (26 percent) manifested the resource based
firm level institutions. This implied that, on average the firms in the NTFPs sub-sector
moderately to a high level manifested resource based firm level institutions including the
financial resources, skills and competencies, knowledge base, culture, and human
resources to enhance their competitiveness and performance.
4.5.2 Administrative Based Firm Level Institutions
The administrative based firm level institutions relate to management of the firm and
include structure, management style, internal controls, systems, and procedures. Firms
often manifest various administrative based firm level institutions to achieve competitive
advantage and performance. Thus, in this section descriptive statistics were used to show

93
the level of manifestation of various administrative based firm level institutions by
respondent firms. Respondent firms indicated using a five point Likert scale extent to
which they availed for use/manifested the following administrative based firm level
institutions: structure, management style, internal controls, systems, and procedures. The
descriptive statistics derived are shown in Table 4.16.
Table 4.16: Administrative Based Firm Level Institutions
Response Frequency Percent
To a great extent 21 8
High extent 100 36
Moderately 113 41
Small extent 40 15
Not at all 2 1
Total 277 100
Source: Field Data, 2014
The results in Table 4.16 showed that the majority of the firms indicated they had
moderately (41 percent) and to a high extent (36 percent) manifested the administrative
based firm level institutions. This implied that, on average the firms in the NTFPs sub-
sector moderately to a high level manifested administrative based firm level institutions
including structure, management style, internal controls, systems, and procedures to
enhance their competitiveness and performance.
4.6 Firm Performance
Firm performance is the venture‟s capability to achieve its objectives. This study
conceptualized firm performance as a dependent variable in the entrepreneurship to
performance relationships. Studies (Islam et al., 2011; Zulkiffli & Perera, 2011) have
opined that performance is complex and is captured well by a combination of both

94
financial and non-financial measures. Thus, this study used profit and sales growth as
financial metrics, and market share, client satisfaction and efficiency as non-financial
measures.
This section, therefore, presents descriptive statistics of the various performance metrics
elucidating the distribution patterns of the respondent firms. Frequencies were computed
using descriptive analysis to summarize performance against competition rating by
respondent firms. All the metrics were then collapsed into a performance index applied
when testing the relationships.
4.6.1 Profit Growth
Profit growth is applied by studies as one of the objective metric for firm performance.
The annual profit growth rates were used by this study; average annual profit growth rate
refers to the average increase in profits for a firm over a year‟s period. Respondent firms
indicated their annual net profits over a five year period from 2009 to 2013 and the
average annual profit growth rates were computed in this study using the following
formula:
Annual profit growth rate = (Π in 2013/Π in 2009)1/n
– 1 (4.1)
Where Π is the annual net profit and n is the number of years. The derived annual profit
growth rates were then computed as percentages, categorized and coded as: more than
50% (1), 1% to 50% (2), no growth or 0 (3), -1% to -50% (4) and less than -50% (5).
Descriptive statistics were then derived to show how the firms rated their performance

95
using annual profit growth rates. The descriptive statistics derived are shown in Table
4.17.
Table 4.17: Profit Growth
Annual Profit Growth Rate Frequency Percent
More than 50% 28 10.1
1% to 50% 133 48.0
0 52 18.8
-1% to -50% 50 18.1
Less than -50% 14 5.1
Total 277 100.0
Source: Field Data, 2014
The results in Table 4.17 showed that the majority of the firms (48 percent) indicated
achieving annual profit growth rates between one and 50 percent. A sizeable number of
firms (18.8 percent) had zero annual profit growth rates. On the other hand, 23.2 percent
of the total respondent firms had negative annual profit growth rates. This implied that,
on average firms in NTFPs sub-sector achieved positive annual profit growth rates of
upto 50 percent.
4.6.2 Sales Growth
Sales growth is one of the objective metric applied by studies as measure of firm
performance. The annual sales growth rates were used by the study; average annual sales
growth rate refers to the average increase in sales for a firm over a year‟s period.
Respondent firms indicated their annual sales over a five year period (n) from 2009 to
2013 and the average annual sales growth rates were computed in this study using the
following formula:

96
Annual sales growth rate = (Annual sales in 2013/Annual sales in 2009)1/n
– 1 (4.2)
The derived annual sales growth rates were then computed as percentages, categorized
and coded as: more than 50% (1), 1% to 50% (2), no growth or 0 (3), -1% to -50% (4)
and less than -50% (5). Descriptive statistics were derived to show how the firms rated
their performance using annual sales growth rates. The descriptive statistics derived are
shown in Table 4.18.
Table 4.18: Sales Growth
Annual Sales Growth Rate Frequency Percent
More than 50% 31 11.2
1% to 50% 126 45.5
0 65 23.5
-1% to -50% 46 16.6
Less than -50% 9 3.2
Total 277 100.0
Source: Field Data, 2014
The results in Table 4.18 showed that the majority of the firms (45.5 percent) achieved
annual sales growth rates between one and 50 percent. This was followed by those firms
(23.5 percent) that achieved zero annual sales growth rates. In total, 19.8 percent of the
respondent firms had negative annual sales growth rates. This implied that, on average
firms in NTFPs sub-sector achieved positive annual sales growth rates of upto 50 percent.
4.6.3 Market Share
Market share has often been applied by studies as one of the non-financial metric for firm
performance. Market share concern the size of the market that is under control of a
business organization. Respondent firms were requested to indicate the average

97
percentage market share they command for their products over a five year period (n) from
2009 to 2013. Computations were then undertaken to derive the annual market share
growth rates over the last five years using the following formula:
Market share growth rate = (Market share in 2013/Market share in 2009)1/n
– 1 (4.3)
The derived annual market share growth rates were then computed as percentages,
categorized and coded as: more than 50% (1), 1% to 50% (2), no growth or 0 (3), -1% to
-50% (4) and less than -50% (5). Descriptive statistics were derived to show how the
firms rated their performance using annual market share growth rates. The descriptive
statistics derived are shown in Table 4.18.
Table 4.19: Market Share Growth
Annual Market Share Growth Rate Frequency Percent
More than 50% 52 18.8
1% to 50% 108 39.0
0 47 17.0
-1% to -50% 53 19.1
Less than -50% 17 6.1
Total 277 100.0
Source: Field Data, 2014
The results in Table 4.19 showed that majority of the firms (39 percent) indicated having
annual market share growth rates between one and 50 percent. A sizeable number of
firms (18.8 percent) had annual market share growth rates of more than 50 percent. In
total, 25.2 percent of respondent firms had negative annual market share growth rates.
This implied that, on average firms in NTFPs sub-sector achieved positive annual market
share growth rates of upto 50 percent.

98
4.6.4 Client Satisfaction
Client satisfaction is one of the non-financial metric for firm performance. Client
satisfaction concerns how well customer needs are met, so that clients can recommend
the business to others. Thus, the respondent SMEs were asked to indicate whether their
clients were satisfied with goods/services they offered using a five point Likert scale. The
descriptive statistics were then used to show the level of client satisfaction by
goods/services offered by the respondent firms. The descriptive statistics derived for the
client satisfaction are shown in Table 4.20.
Table 4.20: Client Satisfaction
Response Frequency Percent
Strongly agree 89 32.1
Agree 153 55.2
Indifferent 22 7.9
Disagree 9 3.2
Strongly disagree 4 1.4
Total 277 100.0
Source: Field Data, 2014
From Table 4.20, majority of the firms (55.2 percent) agreed that their clients were
satisfied with the goods/services offered. A paltry four firms (1.4 percent) strongly
disagreed that their clients were satisfied with the goods/services offered. This implied
that, on average firms in the NTFPs sub-sector had clients who felt satisfied with
goods/services offered.

99
4.6.5 Efficiency of the Firm
Efficiency is one of the non-financial metric for firm performance. Efficiency concerns
cost saving mechanisms effected by the firm. Thus, the respondent SMEs were asked to
indicate whether the processes of service delivery were efficient using a five point Likert
scale. The descriptive statistics were then used to show the level of efficiency by the
respondent firms. The descriptive statistics derived for efficiency are shown in Table
4.21.
Table 4.21: Efficiency of the Firm
Response Frequency Percent
Strongly agree 58 20.9
Agree 120 43.3
Indifferent 77 27.8
Disagree 19 6.9
Strongly disagree 3 1.1
Total 277 100.0
Source: Field Data, 2014
From Table 4.21, the majority of the firms (43.3 percent) agreed that their processes of
service delivery were efficient. A paltry three firms (1.1 percent) strongly disagreed that
their processes of service delivery were efficient. This implied that, on average firms in
NTFPs sub-sector were efficient in their processes of service delivery.
4.6.6 Performance Index
A performance index was computed by this study as the dependent variable in testing
entrepreneurship to performance relationships. Firm performance was initially measured
as annual sales growth, annual profit growth, annual market share growth, client
satisfaction and efficiency. The computed annual sales growth rate, annual profit growth

100
rate and annual market share growth rates were then coded as: 1 (more than 50%), 2 (1%
to 50%), 3 (0), 4 (-1% to -50%) and 5 (less than -50%) and applied together with
performance metrics of client satisfaction and efficiency in the computation of
performance index following factor analysis which showed that they were correlated
(Appendix IX). Performance index was computed as the mean value of the sales growth,
profit growth, market share growth, client satisfaction and efficiency. Studies (Hashim,
2000; Chelliah et al., 2010) show that the index is a better way to measure performance.
Descriptive statistics were then applied to rate on a five point Likert scale whether firm
performance computed as an index was better than competition. The descriptive statistics
derived for performance index are shown in Table 4.22.
Table 4.22: Performance Index
Rating Frequency Percent
Strongly agree 37 13.4
Agree 138 49.8
Indifferent 73 26.4
Disagree 26 9.4
Strongly disagree 3 1.1
Total 277 100.0
Source: Field Data, 2014
From Table 4.22, majority of the firms (49.8 percent) rated their performance as better
than competition. A paltry 29 firms (10.5 percent) either disagreed (9.4 percent) or
strongly disagreed (1.1 percent) that their performance was better than competition. This
implied that, on average firms in the NTFPs sub-sector rated their performance as better
than competition.

101
4.7 Test of Hypotheses
This section presents the results of hypothesis testing using inferential statistical analyzes,
and the interpretations of relationships in the entrepreneurship to performance nexus as
per the research objectives. How entrepreneur characteristics, competitive strategy and
firm level institutions interact to affect firm performance of the respondent firms was
tested using correlation and multiple linear regression; the results summarized in tabular
form were interpreted. All the statistical tests were done at 95 percent confidence level,
that is at five percent significance level (p ≤ 0.05). All the five hypotheses (H1 to H5) for
testing were stated negatively indicating absence of a relationship; the theoretical
perspectives and conceptual arguments presented in this study pointed to existence of
relationships between variables of study justifying negative state of the null hypotheses.
4.7.1 Relationship Between Entrepreneur Characteristics and Firm Performance
Hypothesis, H1
The first objective of this study was to determine the relationship between entrepreneur
characteristics and firm performance. It involved establishing the relationship between
the six entrepreneur characteristics of age, gender, education, managerial know-how,
industry experience and social skills as independent variables and firm performance as
dependent variable. To achieve this objective, the following hypothesis was tested:
Hypothesis H1: There is no significant relationship between entrepreneur
characteristics and performance of SMEs
The scatterplot (see Appendix VII) of firm performance with entrepreneur characteristics
derived by this study suggested linear relationship between the variables. Thus, multiple

102
linear regression analysis was performed to establish and test the hypothesis for the
existence of relationships between the six entrepreneur characteristics and firm
performance using the following model as abbreviated in Table 3.3 and Ɛ1 as error term:
FP1 = β01 + β11 AGE + β12 GE + β13 EE + β14 MK + β15 IE + β16 SK + Ɛ1 (4.4)
Firm performance was inputted in the model as performance index. The index was
computed as the mean value of the performance metrics applied during data collection:
sales growth, profit growth, market share growth, client satisfaction and efficiency.
Performance of SMEs is often complex and is well captured by an index that combines
both financial and non-financial metrics (Chelliah et al., 2010; Zulkiffli & Perera, 2011).
The six entrepreneur characteristics of age, gender, education, managerial know-how,
industry experience and social skills were fitted in the model as individual variables. The
firms indicated entrepreneur‟s age as number of years from date of birth. Equally, gender,
education, managerial skills, industry experience and social skills were indicated as sex
category, highest level of education attained, managerial skills course attendance, years
running a business and subscription to social clubs or groups, respectively.
This study tested the null hypothesis, that there is no significant relationship between
entrepreneur characteristics and performance against the alternative hypothesis, that there
is a significant relationship between entrepreneur characteristics and performance. Since
it was not possible from conceptual issues to state whether effect of entrepreneur
characteristics on firm performance is a positive one or negative one, then null hypothesis
was tested against two-tailed alternative hypothesis at 95 percent confidence level (α =
0.05). The results of multiple regression analysis are shown in Table 4.23.

103
Table 4.23: Entrepreneur Characteristics and Firm Performance
Model Summary
Model R R Square Adjusted R
Square
Std. Error of the
Estimate
.469 .220 .202 .78280
ANOVA
Model Sum of Squares df Mean Square F Sig.
Regression 37.226 5 7.445 12.150 .000
Residual 131.746 272 .613
Total 168.972 277
Coefficients
Model B Std. Error Beta t-value p-value
(Constant) 1.799 .266 6.755 .000
Age -.094 .047 -.130 -1.991 .048
Education .064 .069 .057 .931 .353
Managerial skills .395 .111 .224 3.551 .000
Industry experience .133 .059 .150 2.274 .024
Social skills .549 .112 .307 4.893 .000
Analysis (N=277) Note: p ≤ 0.05
Source: Field Data, 2014
From Table 4.23 and table in Appendix X, the coefficient of determination (R2) of the
five entrepreneur characteristics (independent) on the firm performance as dependent
variable was 0.220. The adjusted R2 value was 0.202 and closer to R
2 value implying that
20.2 percent of variance in firm performance in the population was explained by the
model. The analysis used age, education, managerial skills, industry experience and
social skills leaving out gender whose inclusion resulted in reduced adjusted R2 value
indicating overfitting of the model (see Appendix X).
The F statistic (12.150) for the model was statistically significant at five percent
significance level (p ≤ 0.05) and, therefore, the overall model was significant. Thus, the
null hypothesis that there is no significant relationship between entrepreneur

104
characteristics and firm performance was rejected in favour of alternative hypothesis, that
there is a significant relationship between entrepreneur characteristics and performance.
The calculated t-values for the estimated coefficients of age (1.991), managerial skills
(3.551), industry experience (2.274) and social skills (4.893) were significant at five
percent significance level (p ≤ 0.05). Thus, firm performance was significantly affected
by entrepreneur characteristics of age, managerial skills, industry experience and social
skills. Based on these regression analysis results, the model fitted with performance as
dependent and entrepreneur characteristics as independent was specified as:
FP = 1.799 - 0.094 AGE + 0.395 MK + 0.133 IE + 0.549 SK (4.5)
(0.000) (0.048) (0.000) (0.024) (0.000)
Based on the regression equation 4.5, the intercept was 1.799, implying that firm
performance would be 1.799 when all the independent variables were zero. Also, a unit
increase in age (that is, increasing age of the entrepreneur) would bring about a decrease
of 0.094 in firm performance, ceteris paribus. Similarly, an increase in managerial and
social skills, and industry experience by one unit each, that is changing to entrepreneurs
with managerial and social skills, and industry experience would result in an increase in
firm performance by 0.395, 0.549 and 0.133, respectively, ceteris paribus.
The results showed a significant effect of entrepreneur characteristics on firm
performance resulting in the rejection of the null hypothesis, that there is no relationship
between entrepreneur characteristics and firm performance. Thus these results achieved
the first objective of this study that was aimed at determining the relationship between
entrepreneur characteristics and firm performance.

105
4.7.2 Relationship Between Entrepreneur Characteristics and Competitive Strategy
Hypothesis, H2
The second objective of this study involved establishing the relationship between
entrepreneur characteristics and competitive strategy of SMEs in NTFPs sub-sector. This
involved establishing a link between the six entrepreneur characteristics of age, gender,
education, managerial know-how, industry experience and social skills, and the three
competitive strategy drivers of uniqueness, focus and cost. To achieve this objective, the
following hypothesis was tested:
Hypothesis H2: There is no significant relationship between entrepreneur
characteristics and competitive strategy of SMEs
Correlation analysis was performed to compute the Pearson correlation coefficients to
determine and test the hypothesis for the existence of a link between individual
entrepreneur characteristics (age, gender, education, managerial skills, industry
experience and social skills) and competitive strategy drivers (uniqueness, focus and
cost). Competitive strategy drivers applied in the analysis were computed as mean values
of the items used to establish extent to which strategy was implemented to enhance
competitiveness using a five point Likert scale: 1 = to a great extent, 2 = high extent, 3 =
moderately, 4 = small extent and 5 = not at all. On the other hand, the six entrepreneur
characteristics of age, gender, education, managerial know-how, industry experience and
social skills applied in the correlation analysis were inputted as individual variables.
The level of significance of each variable was presented to enable hypothesis testing. The
null hypothesis was stated to capture theorized relationship between variables, that there

106
is no significant relationship between entrepreneur characteristics and competitive
strategy. The null hypothesis was then tested against the alternative hypothesis, that there
is a significant relationship between entrepreneur characteristics and competitive strategy.
It was not possible from conceptual issues to state whether link between entrepreneur
characteristics and competitive strategy is positive or negative, thus the null hypothesis
was tested against two-tailed alternative hypothesis at 95 percent confidence level (α =
0.05). The correlations results are shown in Table 4.24.
Table 4.24: Entrepreneur Characteristics and Competitive Strategy
Competitive Strategy Entrepreneur Characteristics
Uniqueness Drivers
Focus Drivers
Cost Drivers
Age Pearson Correlation -.289
** -.060 -.103
Sig. (2-tailed) .000 .321 .087 N 277 277 277
Gender
Pearson Correlation .168**
.123* .060
Sig. (2-tailed) .005 .041 .316
N 277 277 277
Education
Pearson Correlation .121* .033 .018
Sig. (2-tailed) .044 .590 .760 N 277 277 277
Managerial skills Pearson Correlation .313
** .204
** .273
**
Sig. (2-tailed) .000 .001 .000 N 277 277 277
Industry experience Pearson Correlation .143
* .015 .024
Sig. (2-tailed) .017 .807 .695
N 277 277 277
Social skills
Pearson Correlation .287**
.280**
.197**
Sig. (2-tailed) .000 .000 .001 N 277 277 277
* Significant at 0.05 level (2-tailed); ** Significant at 0.01 level (2-tailed)
Source: Field Data, 2014
The results in Table 4.24 show that the coefficients of all the parameters ranged from
very weak to average (0.018 to 0.313). All the six entrepreneur characteristics with
uniqueness drivers had coefficients that were statistically significant at 0.01 and 0.05
levels of significance. However, managerial and social skills were the only traits that had

107
coefficients that were statistically significant across the three drivers. Focus driver was
statistically significant with gender (p = 0.05), managerial skills (p = 0.01) and social
skills (p = 0.01). On the other hand, cost driver was statistically significant with
managerial skills (p = 0.01) and social skills (p = 0.01). Based on this outcome, the null
hypothesis was rejected in favour of the alternative hypothesis, that there is a significant
relationship between entrepreneur characteristics and competitive strategy.
The negative coefficients of age with the three competitive strategy drivers indicated a
negative relationship whereas a positive correlation between gender, education,
managerial skills, industry experience and social skills with the three competitive strategy
drivers indicated a positive relationship. This implied that firms run by relatively young,
well-educated, experienced and skilled male entrepreneurs had high levels of application
of uniqueness drivers. One explanation for this state may be that application of
uniqueness drivers requires higher degree of risk-taking behaviors, which in turn need
skills and experience. The youth are generally fearless, positive and have ability to
rebound, explaining the significant negative relationship between age and uniqueness
drivers. Equally, significance of skills with focus and cost drivers affirms the critical role
played by competencies in the formulation and implementation of competitive strategies.
The results showed a significant link between entrepreneur characteristics and
competitive strategy drivers resulting in the rejection of the null hypothesis, that there is
no significant relationship between entrepreneur characteristics and competitive strategy.
Thus these results achieved the second objective of this study aimed at establishing the
relationship between entrepreneur characteristics and competitive strategy of SMEs.

108
4.7.3 Relationship Between Competitive Strategy and Firm Performance
Hypothesis, H3
The third objective of this study involved determining the relationship between
competitive strategy and performance of SMEs in NTFPs sub-sector. This involved
establishing a relationship between the three competitive strategy drivers of uniqueness,
focus and cost as independent variables, and firm performance as dependent variable. To
achieve this objective, the following hypothesis was tested:
Hypothesis H3: There is no significant relationship between competitive strategy
and performance of SMEs
The scatterplot (see Appendix VII) of firm performance with competitive strategy drivers
derived by this study suggested positive linear relationship between the variables. Thus,
multiple linear regression analysis was performed to establish and test the hypothesis for
the existence of relationships between competitive strategy drivers of uniqueness, focus
and cost as independent variables, and firm performance as dependent variable using the
following model as abbreviated in Table 3.3 and Ɛ3 as error term:
FP3 = β03 + β31 DD + β32 FF + β33 CL + Ɛ3 (4.6)
Firm performance was inputted in the model as an index computed as mean value of sales
growth rate, profit growth rate, market share growth rate, client satisfaction and
efficiency. On the other hand, competitive strategy drivers of uniqueness, focus and cost
were inputted as mean values of the items used to measure their application using a five
point Likert scale: 1= to a great extent, 2 = high extent, 3 = moderately, 4 = small extent
and 5 = not at all.

109
This study tested the null hypothesis that there is no significant relationship between
competitive strategy and performance against alternative hypothesis that there is
significant relationship between competitive strategy and performance. It was not
possible from conceptual issues to state whether competitive strategy to firm performance
relationship is positive or negative, thus null hypothesis was tested against two-tailed
alternative hypothesis at 95 percent confidence level (α = 0.05). The results of multiple
regression analysis are shown in Table 4.25 and Appendix XI.
Table 4.25: Competitive Strategy and Firm Performance
Model Summary
Model R R Square Adjusted R
Square
Std. Error of the
Estimate
.560 .313 .306 .65680
ANOVA
Model Sum of Squares Df Mean Square F Sig.
Regression 51.776 3 17.259 40.008 .000
Residual 113.454 274 .431
Total 165.231 277
Coefficients
Model B Std. Error Beta t-value p-value
(Constant) .626 .129 4.831 .000
uniqueness drivers .104 .042 .166 2.457 .015
focus drivers .288 .059 .319 4.885 .000
cost drivers .145 .057 .172 2.540 .012
Analysis (N=277) Note: p ≤ 0.05
Source: Field Data, 2014
The coefficient of determination (R2) value for the three competitive strategy drivers
(independent variables) on firm performance (dependent variable) was 0.313 (see Table
4.25). The adjusted R2 value was 0.306 and closer to closer to R
2 value implying that 30.6
percent of variance in firm performance in the population was explained by the model.
The analysis involved use of uniqueness, focus and cost drivers whose inclusion in the

110
model resulted in improved adjusted R2 value indicating well-fitting of the model for the
number of data points.
The F statistic (40.008) for the model was statistically significant at five percent
significance level. The F statistic was significant at p-value = 0.000, demonstrating that
the overall model was significant. Thus, the null hypothesis was rejected in favour of the
alternative hypothesis that there was a significant relationship between competitive
strategy and firm performance. It was, thus observed that competitive strategy had
significant effect on the firm performance.
The calculated t-ratios for the estimated coefficients of uniqueness drivers (2.457), focus
drivers (4.885) and cost drivers (2.540) were significant at five percent significance level.
Based on the foregoing results of regression analysis, the model fitted with performance
as dependent and competitive strategy drivers as independent variables was specified as:
FP = 0.626 + 0.104 DD + 0.288 FF + 0.145 CL (4.7)
(0.000) (0.015) (0.000) (0.012)
From the foregoing regression equation, the intercept and coefficients for the three
competitive strategies were positive and statistically significant. Firm performance would
be 0.626 when all the independent variables were zero. Also, a unit increase in the factor
of uniqueness drivers, that is, increasing application of uniqueness drivers by a unit
would result in increased performance by 0.104, ceteris paribus. Similarly, increasing the
factor of focus drivers by one unit, that is, increasing the level of application of focus
drivers by a unit would increase performance by 0.288, ceteris paribus, and an increase of

111
the factor of cost drivers by one unit, that is, raising level of cost drivers would increase
performance of SMEs by 0.145, ceteris paribus.
The results showed a significant relationship between competitive strategy and firm
performance resulting in the rejection of the null hypothesis formulated to test the
relationship, that there is no significant relationship between competitive strategy and
performance of SMEs. Thus these results achieved the third objective of this study aimed
at establishing the relationship between competitive strategy and firm performance.
4.7.4 Firm Level Institutions on Relationship Between Competitive Strategy and
Firm Performance
Hypothesis, H4
The fourth objective of this study involved establishing the influence of firm level
institutions on the relationship between competitive strategy and performance of SMEs in
NTFPs sub-sector. This involved establishing whether firm level institutions moderated
the relationship between competitive strategy and firm performance. To achieve this
objective, the following hypothesis was tested:
Hypothesis H4: There is no significant moderating effect of firm level institutions on
the relationship between competitive strategy and performance of SMEs
Regression analysis was performed to test existence of moderating effect that required
meeting three conditions, that; there exists a significant relationship between the predictor
and the dependent variable before testing for moderating effect; strength between the
predictor and dependent variable reduces/alters after introducing the moderating variable;

112
and the interaction term (product of predictor and moderator) has a significant
relationship with dependent variable (Baron & Kenny, 1986; Edwards & Lambert, 2007).
The scatterplots (see Appendix VII) of firm performance with competitive strategy
drivers and firm level institutions derived by this study suggested linear relationships
between the variables. Thus to meet the three conditions demonstrating existence of
moderating effect, this study performed multiple linear regression using three models
with linear relationships of firm performance (dependent), competitive strategy
(predictor), firm level institutions (moderator) and the interaction term. Model 4.8 was
aimed at showing existence of a relationship between the predictor (competitive strategy)
and dependent (performance). Model 4.9 was aimed at showing how the moderator (firm
level institutions) reduced/altered strength between predictor (competitive strategy) and
dependent (performance). Model 4.10 was aimed at showing effect of the interaction
term. The three models as abbreviated in Table 3.3 and Ɛ1 as error term are elucidated
hereunder.
FP41 = β 041 + β411 CS + (4.8)
FP42 = β 042 + β412 CS + β422 FLI + (4.9)
FP43 = β 043 + β413 CS + β423 FLI + β433 ITT + (4.10)
The firm performance was inputted as performance index (mean value of sales growth
rate, profit growth rate, market share growth rate, client satisfaction and efficiency) while
the competitive strategy was inputted as mean value of the uniqueness, focus and cost
drivers. The firm level institutions was inputted as mean value of the various items used
to measure the level of manifestation of resource based and administrative based firm
level institutions using a five point Likert scale: 1 = to a great extent 2 = high extent 3 =

113
moderately 4 = small extent 5 = not at all. The interaction term was computed as a
product of competitive strategy and firm level institutions.
The results were summarized in a tabular form depicting coefficients, t-ratios and
significance levels. In addition, the correlation coefficients, F statistic and collinearity
statistics were presented. The level of significance of each measured parameter was
presented to enable testing of hypothesis. The null hypothesis, that there is no significant
moderating effect of firm level institutions on relationship between competitive strategy
and performance was tested against the alternative hypothesis, that there is significant
moderating effect of firm level institutions on relationship between competitive strategy
and performance. It was not possible from conceptual issues to state whether the effect of
firm level institutions on the relationship is positive one negative, thus null hypothesis
was tested against two-tailed alternative hypothesis at 95 percent confidence level (α =
0.05). The regression results are shown in Table 4.26 and Appendix XII.
Table 4.26: Firm Level Institutions and Relationship Between Competitive Strategy and
Firm Performance
Item Model 4.8 Model 4.9 Model 4.10
B t-ratio B t-ratio B t-ratio
Constant 1.235 13.034** .953 6.521** 1.281 6.624**
Competitive strategy .127 8.424** .072 3.794** .044 2.062*
Firm level institutions - .202 2.967* .075 .893
Interaction term - - .001 2.552*
R2 0.211 0.211 0.233
Adjusted R2 0.208 0.204 0.222
F 70.956** 30.549** 23.027**
N 277 277 277
Asterisks of ** and * indicate significance at 1 and 5 significance levels, respectively
Source: Field Data, 2014
114
The three regression models had varied R2 and adjusted R
2 values (see Table 4.26).
Model 4.8 involving regression of firm performance with competitive strategy had R2 and
adjusted R2
values of 0.211 and 0.208, respectively. Model 4.9 involving regression of
firm performance with competitive strategy and firm level institutions had R2 and
adjusted R2 values of 0.211 and 0.204, respectively. Model 4.10 involving regression of
firm performance with competitive strategy, firm level institutions and interaction term
had R2 of 0.233 and adjusted R
2 of 0.222.
Essentially, the adjusted R2
reduced with introduction of firm level institutions and
increased with inclusion of interaction term in the regression model. The reduction in the
adjusted R2 value with the introduction of firm level institutions in the model of firm
performance with competitive strategy indicated overfitting of the model for the number
of data points. However, increased adjusted R2 value with inclusion of interaction term in
the model indicated well-fitting of the model for the number of data points. The adjusted
R2 value in model 4.10 was 0.222 and closer to R
2 value implying that 22.2 percent of
variance in firm performance in the population was explained by the model.
The F statistics for the three models were statistically significant at five percent
significance level. The F statistics were significant at p-value = 0.000 and 0.05,
demonstrating that the models were highly significant. From model 4.8, the calculated t-
ratio for the estimated coefficients of competitive strategy (8.424) was significant at one
percent significance level. The coefficient of competitive strategy was 0.127. However,
the introduction of firm level institutions (moderating variable) in model 4.9 resulted in
reduction of calculated t-ratio (3.794) and coefficient (0. 072) of competitive strategy

115
although it was still significant at one percent significance level. The introduction of
interaction term in model 4.10 resulted in further reduction of calculated t-ratio (2.062)
and coefficient (0.044) of competitive strategy which was significant at five percent
significance level. The calculated t-ratio for estimated coefficient of interaction term
(2.552) was significant at five percent significance level whereas the t-ratio for estimated
coefficient of firm level institutions (0.893) was not significant at five percent
significance level (p = 0. 373).
Based on the foregoing results of regression analysis, the three conditions demonstrating
existence of moderating effect were met, that; a significant relationship existed between
competitive strategy (predictor) and performance (dependent) before testing for a
moderating effect; strength between competitive strategy (predictor) and performance
(dependent) reduced with inclusion of firm level institutions (moderator) in the model;
and the interaction term had a significant relationship with dependent variable. Thus, the
null hypothesis was rejected in favour of the alternative hypothesis that there was a
significant moderating effect of firm level institutions on relationship between
competitive strategy and firm performance. It was, therefore, observed that firm level
institutions including resource based and administrative based firm level institutions
significantly influenced as moderators the relationship between competitive strategy and
performance of firms in the NTFPs sub-sector. The implication was that although the
relationship between competitive strategy and firm performance was true generally, it
was nevertheless contingent that improved performance was visible with only firms that
had manifested firm level institutions to implement competitive strategy.

116
From the regression results, the following regression equation was specified.
FP = 1.281 + 0.044 CS + 0.001 ITT (4.11)
(0.000) (0.005) (0.005)
The intercept was 1.281, implying that performance would be 1.281 when all the
independent variables were zero. Increase in interaction term (product of strategy and
firm level institutions) by one unit, that is, raising level of the moderation of institutions
by one unit would increase firm performance by 0.001, ceteris paribus.
The results showed a significant moderating effect of firm level institutions on the
relationship between competitive strategy and firm performance resulting in the rejection
of the null hypothesis, that that there is no significant moderating effect of firm level
institutions on relationship between competitive strategy and performance. Thus these
results achieved the fourth objective of this study aimed at establishing the effect of firm
level institutions on the relationship between competitive strategy and firm performance.
4.7.5 Joint Effect of Entrepreneur Characteristics and Competitive Strategy on
Firm Performance
Hypothesis, H5
The fifth objective of this study involved determining the joint effect of entrepreneur
characteristics and competitive strategy on performance of SMEs in NTFPs sub-sector.
This concerned determining whether the joint effect and individual effects of
entrepreneur characteristics and competitive strategy on performance were different. This
was aimed at establishing whether an intervening/mediating influence of competitive

117
strategy existed in the relationship between entrepreneur characteristics and firm
performance. To achieve this objective, the following hypothesis was tested:
Hypothesis H5: Combined effect of entrepreneur characteristics and competitive
strategy on performance is not significantly different from their individual effects
In this sub-section, regression analysis was performed to test the individual and joint
effects of entrepreneur characteristics and competitive strategy on firm performance. The
scatterplots (see Appendix VII) of firm performance with entrepreneur characteristics and
competitive strategy derived by this study suggested linear relationships between the
variables. Thus, multiple linear regression analysis was performed to test the individual
and joint effects using the following three models with linear relationships of the
variables as abbreviated in Table 3.3 and Ɛi as error term: model 4.12, model 4.13 and
model 4.14.
FP5 = β 05 + β51 EC + Ɛ5 (4.12)
FP6 = β 06 + β52 CS + Ɛ6 (4.13)
FP7 = β 07 + β53 EC + β54 CS + Ɛ7 (4.14)
The firm performance, entrepreneur characteristics and competitive strategy were applied
in the analysis as mean values of their individual sub-variables. The null hypothesis, that
the combined effect of entrepreneur characteristics and competitive strategy on firm
performance is not significantly different from their individual effects was tested against
the alternative hypothesis, that the combined effect of entrepreneur characteristics and
competitive strategy on firm performance is significantly different from their individual
effects. It was not possible from theoretical and conceptual issues to state whether the
relationships between entrepreneur characteristics, competitive strategy and firm

118
performance were positive ones or negative ones, thus null hypothesis was tested against
two-tailed alternative hypothesis at 95 percent confidence level (α = 0.05). The results for
multiple regression analysis using the three models are shown in Table 4.27 and
Appendix XIII.
Table 4.27: Joint Effect of Entrepreneur Characteristics and Competitive Strategy on
Firm Performance
Item Model 4.12 Model 4.13 Model 4.14
Β t-ratio β t-ratio β t-ratio
Constant 1.894 9.025** 1.193 7.773** 1.168 5.750**
Entrepreneur characteristics .371 2.665* -.054 -.414
Competitive strategy .168 8.552** .180 8.442**
R2
.131 .242 .267
Adjusted R2 .127 .239 .261
F 7.100* 73.142** 39.981**
N 277 277 277
Asterisks of ** and * indicate significance at 1 and 5 significance levels, respectively
Source: Field Data, 2014
The regression analysis results in Table 4.27 show that the R2 and adjusted R
2 values for
the three models were different. The R2 values (0.131 for model 4.12 and 0.242 for model
4.13) for the individual effects were lower than the R2 value (0.267) for the joint effect of
entrepreneur characteristics and competitive strategy on firm performance. The adjusted
R2 values were closer to the R
2 values and increased with subsequent fitting of variables
indicating well-fitting of the models for the number of data points.
The F statistic for the three models were significant at five (model 4.12) and one percent
significance (models 4.13 and 4.14) levels demonstrating that the models were
significant. The F values (7.100 for model 4.12 and 73.142 for model 4.13) for the
individual effects were different from those for the joint effect of entrepreneur

119
characteristics and competitive strategy on firm performance (F = 39.981). The
significance of the calculated t-ratios of the variables was varied; in model 4.12, the
calculated t-ratio for entrepreneur characteristics (2.665) was significant at α = 0.05. In
model 4.13, the calculated t-ratio for competitive strategy (8.552) was significant at α =
0.01. However, in model 4.14, calculated t-ratio for entrepreneur characteristics (0.414)
was not significant while that for competitive strategy (8.442) was significant at α = 0.01.
From model 4.14 bearing joint effect, the intercept and coefficient for competitive
strategy were statistically significant; the coefficient for entrepreneurship characteristics
was insignificant. The effect of entrepreneur characteristics on firm performance was
insignificant and not directly affecting firm performance jointly with competitive
strategy, that is competitive strategy mediated the entrepreneur characteristics to
performance relationship. Thus, the following regression equation was specified.
FP = 1.168 + 0.180 CS (4.15)
(.000) (.000)
Based on the regression results, the intercept was 1.168 implying that firm performance
would be 1.168 when all the independent variables were zero. Similarly, when
competitive strategy increases by one unit, that is, increasing application of competitive
strategy by one unit, firm performance would increase by 0.180, ceteris paribus.
The results showed that the joint effect of entrepreneur characteristics and competitive
strategy on firm performance was statistically different from their individual effects
resulting in the rejection of the null hypothesis, that the combined effect of entrepreneur
characteristics and competitive strategy on performance of SMEs is not significantly

120
different from their individual effects. Thus these results achieved the fifth objective of
this study aimed at determining the joint effect of entrepreneur characteristics and
competitive strategy on performance of SMEs in NTFPs sub-sector, and ultimately the
mediating effect of competitive strategy on the relationship between entrepreneur
characteristics and firm performance.
4.8 Summary of Findings
This chapter presented the analysis of the firm characteristics and the four study variables
using descriptive statistics. Equally, the chapter presented the results of inferential
statistical analysis in testing of hypotheses and presenting relationships in the
entrepreneurship to performance nexus.
The firm characterization showed that, on average firms in the NTFPs sub-sector were
relatively new in operation with the majority being in existence for not more than five
years. Equally, firms in the NTFPs sub-sector were highly diversified dealing mostly with
varied food related products as processors and/or distributors. The NTFPs sub-sector was
characterized by very small firms with less than 10 employees and operated as sole
proprietorships.
The descriptive statistics of the study variables demonstrated that most of the firms were
operated by entrepreneurs who were young male adults of upto 40 years with secondary
to tertiary levels of education. However, the majority of the firms were operated by
entrepreneurs with low levels of requisite skills and industry experience. It was also
observed that the firms implemented the competitive strategy drivers of uniqueness, focus

121
and cost to high extent. In addition, most of the firms moderately to a high level
manifested the firm level institutions to enhance their competitiveness and performance.
Performance was measured in terms of the annual sales growth, annual profit growth,
annual market share growth, client satisfaction and efficiency which were applied to
compute the performance index as their mean value for hypothesis testing and the
relationships between variables. Although the annual sales growth, annual profit growth,
annual market share growth, client satisfaction and efficiency yielded varying levels of
performance, factor analysis demonstrated that the outcomes were correlated allowing
computation of the index.
The entrepreneur characteristics exhibited strong relationship with firm performance.
Firm performance was significantly affected by entrepreneur characteristics of age,
managerial skills, industry experience and social skills. In addition, the entrepreneur
characteristics of age, gender, education, managerial skills, industry experience and social
skills significantly affected competitive strategy. The competitive strategy driver of
uniqueness exhibited significant relationship with age, gender, education, managerial
skills, industry experience and social skills. However, the focus and cost drivers exhibited
significant relationship with only managerial skills and social skills.
Firm performance was significantly affected by competitive strategy drivers of
uniqueness, focus and cost. There was a significant moderating effect of firm level
institutions in the relationship between competitive strategy and firm performance; firm
performance was significantly affected by competitive strategy and the interaction term
as product of competitive strategy and firm level institutions. The combined effect of
122
entrepreneur characteristics and competitive strategy was inconsistent with their
individual effects on firm performance demonstrating existence of mediating effect in the
relationship between entrepreneur characteristics, competitive strategy and performance.
There was empirical evidence to reject all the null hypotheses in favour of alternative
hypotheses implying that there were significant relationships between entrepreneur
characteristics, competitive strategy, firm level institutions and firm performance. There
was empirical evidence for the significant relationship between entrepreneur
characteristics and firm performance; significant link between entrepreneur
characteristics and competitive strategy drivers; significant relationship between
competitive strategy and firm performance; significant moderating effect of firm level
institutions on relationship between competitive strategy and firm performance; and
significant mediating effect of competitive strategy on the entrepreneur characteristics
and firm performance relationship. Thus, all the five objectives of this study were fully
achieved.

123
CHAPTER FIVE
DISCUSSION OF RESULTS
5.1 Introduction
This chapter presents the discussion of the results of this study aimed at establishing the
relationships in the entrepreneurship to performance nexus as per the research objectives.
The results are discussed to show whether they were in support of previous studies done
to assess relationships in the entrepreneurship to firm performance nexus. The chapter
discusses whether they approve or disapprove the conceptual issues advanced in this
study. Whether the findings agreed with the assumptions advanced by various theories
that formed the foundation of this study is also discussed. In addition, the chapter brings
out the implications of the study to theory and practice.
5.2 Key Results and Discussion
The general objective of this study was to determine the influence of competitive strategy
and firm level institutions on the relationship between entrepreneur characteristics and
performance of SMEs in the NTFPs sub-sector in Kenya. To achieve this general
objective, five objectives were specified and corresponding hypotheses tested. The five
null hypotheses tested were stated negatively to reflect absence of the expected
relationships between variables.
It was observed that the entrepreneur characteristics of age, managerial skills, industry
experience and social skills significantly influenced firm performance; the hypothesis
(H1) was rejected and objective one of this study achieved. Equally, the entrepreneur
characteristics of age, gender, education, managerial skills, industry experience and social

124
skills significantly affected competitive strategy resulting in rejection of the hypothesis
(H2) and achievement of objective two of this study. Competitive strategy drivers of
uniqueness, focus and cost significantly affected firm performance; the hypothesis (H3)
was rejected and objective three of this study achieved. It was also realized that there
was a significant moderating effect of firm level institutions on the relationship between
competitive strategy and firm performance resulting in rejection of the hypothesis (H4)
and achievement of objective four of this study. The combined effect of entrepreneur
characteristics and competitive strategy on performance of SMEs was significantly
different from their individual effects resulting in rejection of the hypothesis (H5) and
achievement of objective five of this study.
5.2.1 Entrepreneur Characteristics and Firm Performance
H1 – Objective One
To achieve objective one of this study, hypothesis H1 was tested, that there is no
significant relationship between entrepreneur characteristics and performance of SMEs.
The aim of the first objective was to establish the relationship between entrepreneur
characteristics and firm performance. Although it has become increasingly clear that
entrepreneur characteristics impact on performance of the firm, the conceptual issues
presented in this study showed mixed results on the causal effects and magnitude of the
different entrepreneur characteristics on firm performance. Byers (1997) opined that
although the support by studies was overwhelming over the effect of entrepreneur
characteristics on firm performance, some studies found little evidence of the effect of the
entrepreneur demographic and social background on firm performance; specifically, the

125
effects of age, gender, education, experience and skills on firm performance were varied
in various studies. Indeed the results by Analoui and Karami (2003) and Shigang (2010)
raised debate whether the relationship between entrepreneur characteristics and firm
performance is indeed direct. However, Kristiansen et al. (2003) showed that
demographic factors such as age and gender, and individual background including
education and previous work experience affect firm performance. Thus, hypothesis H1
was formulated for testing, that there is no significant relationship between entrepreneur
characteristics and firm performance.
In this study, therefore, the researcher sought to extent the frontiers of knowledge
regarding how entrepreneur characteristics affected firm performance. Specifically, the
effect of age, gender, education, managerial skills, industry experience and social skills
on firm performance was investigated. The study relied on the RBV and theories relating
to entrepreneur characteristics to expound on how entrepreneur characteristics affect firm
performance. The targeted entrepreneur characteristics depict knowledge, talents, skills,
abilities, experience, intelligence, and training advanced under RBV as some of the
resources and capabilities necessary for achieving competitive advantage (Wernerfelt,
1984; Barney, 1991; Castanias & Helft, 1991; Conner & Prahalad, 1996). The theories
relating to entrepreneur characteristics explicate various traits that contribute to supply of
entrepreneurs including education background, skills and experience (Kubeczko &
Rametseinerm, 2002; Greve & Salaff, 2003).
The major findings of this study were that firm performance was significantly affected by
entrepreneur characteristics of age, managerial skills, industry experience and social

126
skills. Whereas the relationship between age and firm performance was negative, that
between managerial skills, industry experience and social skills and firm performance
was positive. Results achieved objective one but did not support hypothesis H1, that there
is no significant relationship between entrepreneur characteristics and firm performance.
The results of a significant relationship between entrepreneur characteristics and
performance were similar with other studies. Kibas and K‟Aol (2004) in their study
aimed at investigating and profiling cases of successful Kenyan entrepreneurs opined that
most Kenyan entrepreneurs exhibit typical characteristics of other entrepreneurs
elsewhere. Bowen et al. (2009) in their study on management of business challenges
among SMEs in Nairobi observed that training or education was positively related to
business success. Islam et al. (2011) in a study in Bangladesh observed that
entrepreneur‟s age, education, managerial know-how, industry experience and social
skills influence firm performance.
The negative relationship between firm performance and age indicated that SMEs
operated by young adult entrepreneurs had better performance than competition. This
finding supported the results by other studies that business firms operated by young
entrepreneurs have better performance. Amran (2011) in a study on Malaysian public
listed family businesses observed that young entrepreneurs performed better than mature
ones as they changed and grabbed opportunities faster thus, increasing firm performance.
Carlsson and Karlsson (1970) noted that mature entrepreneurs tended to be more risk
averse than younger ones, thus negatively impacting on firm performance.

127
The positive relationship between firm performance, and managerial skills and industry
experience showed that training and experience are crucial in the venture performance.
Fielden et al. (2000) in a study on micro and small business start-up in North-West
England reported that skills and experience are very crucial to enterprise survival while
experience from previous job, and on the job experience are key factors in enterprise
duration, growth and survival. Martin and Staines (2008) indicate that managerial skills
assist managers to solve issues that are directly relevant to the current, fast shifting
business environment. Mfinanga (2008) in a study on paratransit situation in Dar es
Salaam observed that managerial skills are important in running any business. Although
the influence of education on performance in this study was not significant, the better
performance by poorly educated entrepreneurs could have been due to the compensating
effect of experience and managerial trainings they had received. Gomide et al. (2004)
suggests a link between sales turnover and business training. According to Khayesi
(2009), the objective of training is to help owners of SMEs improve their skills.
The strong influence of social skills on performance lies in the advantages associated
with collective actions through membership to clubs. Economic and social networks are
very useful in assembling the resources needed for starting and managing manufacturing
industries (Burnett, 2000). Bowen et al. (2009) in their study on management of business
challenges among SMEs in Nairobi observed that memberships to social as well as
professional clubs provide necessary networks that bring beneficial effects such as
information and experience sharing, technical know-how and bargaining power to
entrepreneurs running SMEs. Kamalakumati and Sathiyakala (2013) in their study on
impact of entrepreneurial characteristics on the organizational development of the small

128
business entrepreneurs observed that small businesses could strengthen their social
networks by forming clubs to get connected with large scale businesses.
The findings of this study showed that age, managerial skills, industry experience and
social skills explained only about 20 percent of variance in firm performance. However,
studies have pointed out that low R-squared values are not always bad, and are even
expected in studies of this nature. Odundo (2012) points out that such level is acceptable
given that the study only focused on a few variables rather than modelling for
performance indicators in general. Adegbite et al. (2006) in their study on impact of
entrepreneurial characteristics on firm performance in Nigeria observed that the 10
personal entrepreneurial characteristics applied in regression analysis could only explain
19.7 percent of variation in the sales turnover. Hsiu-Jung (2008) in a study on effects of
entrepreneurship and interpersonal network on firm performance in Taiwan observed that
innovativeness, pro-activeness, autonomy, risk-taking, and competitive aggressiveness
explained 38.6 percent variance in performance. Islam et al. (2011) in a study on business
success in Bangladesh obtained the R2 of 0.213. Equally, Kamalakumati and Sathiyakala
(2013) observed that competent entrepreneur characteristics of achievement, planning
and power explained 33.1 percent variation in firm performance.
The findings of this study affirm the observations in literature that the entrepreneur
characteristics have significant effect on firm performance. Equally, the findings support
the RBV and theories relating to entrepreneurship that skills and experience are important
in enhancing firm performance. The assumption by the RBV that a firm can obtain
sustainable competitive advantage by having strategically relevant resources and

129
capabilities that are embedded in the entrepreneurs and employees inform of skills and
tacit knowledge (Polanyi, 1966; Wernerfelt, 1984: Castanias & Helft, 1991) is strongly
supported by the findings of this study. Equally, the findings also support the
advancement by the socio-cultural and other theories explaining entrepreneur
characteristics that skills, experience and social networks are important in entrepreneurial
action and behaviour (Dubini & Aldrich, 1991; Greve & Salaff, 2003). The findings of
this study, therefore, provide evidence that age, skills and experience matter; there was
need for the firms to enhance their capacities by adopting employment policies that target
young staff that have requisite skills and experience. Most businesses in the NTFP sub-
sector were small and were operated with entrepreneurs without necessary skills. Thus, a
robust employment policy to attract the many unemployed young skilled people in Kenya
would rejuvenate their performance.
5.2.2 Entrepreneur Characteristics and Competitive Strategy
H2 – Objective Two
To achieve objective two of this study, hypothesis H2 was tested, that there is no
significant relationship between entrepreneur characteristics and competitive strategy of
SMEs.
The second objective of this study aimed at establishing the relationship between
entrepreneur characteristics and competitive strategy which was observed in the
conceptual arguments as debatable. Whereas some studies have indicated a direct link
between entrepreneur characteristics and competitive strategy, others have observed the
relationship to be indirect and hidden (Mintzberg, 1978) or not clear (Pelham, 2000;

130
Kemp & Verhoeven, 2002). Thus, hypothesis H2 was formulated for testing, that there is
no significant relationship between entrepreneur characteristics and competitive strategy.
This study, therefore, sought to explore the relationship between entrepreneur
characteristics and competitive strategy of the firms. It was conceptualized in this study
that the entrepreneur provides a prediction of competitive strategy and firm performance;
entrepreneur characteristics could affect firm performance directly or through mediation
effects of competitive strategy. Essentially, the link between entrepreneur characteristics
of age, gender, education, managerial skills, industry experience and social skills, and
competitive strategy drivers of uniqueness, focus and cost was investigated by
performing correlation analysis. This study relied on the RBV to expound on how the
targeted entrepreneur characteristics affect implementation of strategy drivers in creating
and enhancing competitiveness of the firm. The entrepreneur characteristics of education,
managerial skills, industry experience and social skills are depicted under the RBV as the
knowledge, talents, skills, abilities, experience, intelligence, and training necessary for
achieving competitive advantage (Wernerfelt, 1984; Barney, 1991; Castanias & Helft,
1991; Conner & Prahalad, 1996).
The major findings of this study were that the entrepreneur characteristics had a
significant link with the competitive strategy drivers. Whereas the relationship between
age and competitive strategy drivers was negative, that of gender, education, managerial
skills, industry experience and social skills with the three competitive strategy drivers
was positive demonstrating that firms operated by young, well-educated and skilled male
entrepreneurs had highest levels of application of competitive strategy drivers. Results
131
achieved objective two but did not support hypothesis H2, that is no significant
relationship between entrepreneur characteristics and competitive strategy of SMEs.
The findings corresponded with findings by various studies (Peyrefille et al., 2002;
Namusonge, 2014) that an entrepreneur‟s competence, role and commitment are critical
to the successful formulation and implementation of strategies. Verhees and Meulenberg
(2004) in their study on market orientation, innovativeness, product innovation, and
performance in small firms observed that the owner's innovativeness permeates all
variables in the model and had a positive influence on market orientation, innovation, and
performance. However, the insignificant link of experience with focus and cost drivers
contradicted the finding of a strong fit between strategy and team experience obtained by
Shrader and Siegel (2007) in high-tech entrepreneurial ventures.
The negative coefficients of age with the three competitive strategy drivers indicated that
the firms operated by young entrepreneurs demonstrated high levels of implementation of
competitive strategy drivers. This finding was similar to the results by various studies that
firms operated by young entrepreneurs demonstrate high levels of implementation of
competitive strategy drivers. Carlsson and Karlsson (1970) in their study on age, cohorts
and the generation of generations noted that mature people tend to be more risk averse
than younger people, thus negatively impacting on the implementation of competitive
strategy drivers. Shrader and Siegel (2007) in their study aimed at assessing the
relationship between human capital and firm performance observed that firms operated
by young entrepreneurs demonstrate high levels of strategy implementation.

132
The positive coefficients of gender, education, managerial skills, industry experience and
social skills with competitive strategy drivers pointed to an indication that gender,
education, skills and experience drive competitive strategy implementation. The findings
showing that male entrepreneurs implemented competitive strategies better than women
corresponded with findings by various studies. Cooper et al. (1994), Cliffe (1998) and
Amran (2011) observed that male operated firms were competitive and had better
performance. However, the finding contradicted other studies like, Woldie et al. (2008)
who observed in their study on firms in Nigeria that both men and women had the ability
to run business achieving similar competitiveness and performance levels. The skills and
experience reflecting the level of competencies were opined by Hamel and Prahalad
(1996) as strategically aligned with the business strategies. Peyrefille et al. (2002)
observed that competencies play critical roles in the formulation and implementation of
strategies. Bowen et al. (2009) observed that relevant training or education is positively
related to business success. Namusonge (2014) emphasized importance of a firm‟s
competencies in achieving competitive strategies; sustainable competitive advantages are
likely to result if firms increase their competencies on a continuous basis.
The findings of this study affirm the observations that the entrepreneur characteristics and
competitive strategy are significantly linked. This observation support the RBV that
skills and experience are important in implementation of competitive strategy to create
and enhance competitiveness. The RBV postulation that a firm can obtain sustainable
competitive advantage by having strategically relevant resources and capabilities that are
embedded in the entrepreneurs and employees inform of skills and tacit knowledge

133
(Wernerfelt, 1984; Barney, 1991; Castanias & Helft, 1991; Conner & Prahalad, 1996) is
strongly supported by the findings of objective two of this study.
The findings of this study, therefore, provide evidence that age, education, gender, skills
and experience matter in competitive strategy choice and implementation. Unfortunately,
the findings showed that a substantial number of the SMEs (about 25 percent) were
operated by older entrepreneurs aged 50 years and above, and about 60 percent had
entrepreneurs with no education at all (1.4 percent) or had primary (17 percent) and
secondary (41.5 percent) levels of education. Equally, most entrepreneurs did not have
requisite managerial (56 percent) and social skills (59.2 percent). Thus, most of these
firms were operated with little benefit of competitive strategy implementation. Thus, it
was important that the firms recruit the unemployed but highly educated, skilled and
young graduates to help in enhancing their competitiveness through competitive strategy
choice and implementation.
5.2.3 Competitive Strategy and Firm Performance
H3 – Objective Three
To achieve objective three of this study, hypothesis H3 was tested, that there is no
significant relationship between competitive strategy and performance of SMEs.
Objective three of this study was aimed at determining the relationship between
competitive strategy and firm performance. Existence of a relationship between
competitive strategy and firm performance is debatable as per the conceptual issues
presented by this study. Some studies have pointed to a positive relationship between
134
competitive strategy and firm performance. Gibcus and Kemp (2003) observed that
strategies pursued have a direct and strong influence on firm performance. Gibcus and
Kemp (2003) opined that firms with a clear and consistent strategy out-perform those
without. Consequently, entrepreneurs often aim to ensure that right strategy choices are
made and implemented. However, some studies have observed either a weak link (Teach
& Schwartz, 2000) or no relationship between strategy and firm performance (Kemp &
Verhoeven, 2002). Thus, hypothesis H3 was formulated for testing, that there is no
significant relationship between competitive strategy and performance of SMEs.
In this study, therefore, the researcher sought to extent the frontiers of knowledge
regarding how competitive strategy impacts on firm performance. This study relied on
the RBV to expound on how competitive strategy affects firm performance. The RBV
states that a firm can obtain a sustainable competitive advantage by having strategically
relevant resources and capabilities that are valuable, specific, rare and unable to be either
imitated or substituted (Barney, 1991). Such resources and capabilities include strategic
planning (Michalisin et al., 1997).
The major findings of this study were that firm performance was significantly affected by
competitive strategy drivers of uniqueness, focus and cost. The relationship was positive
and direct. Results achieved objective three but did not support hypothesis H3, that there
is no significant relationship between competitive strategy and performance of SMEs.
The findings corresponded with results of previous studies. Pushpakumari and Watanabe
(2009) in a study investigating whether strategies improve performance of SMEs in Japan

135
and Sri Lanka observed that firm performance varied with the choice of strategy
orientation that owner-managers adopted. Shigang (2010) in a study investigating
competitive strategy and business environment of small enterprises in China showed that
differentiation and cost strategies had significant positive relationship with overall
performance. Pelham (2000) observed that an emphasis on a low-cost strategy had lower
impact on performance than an emphasis on a growth/differentiation strategy. However,
this study observed that the three strategy drivers of uniqueness, focus and cost
significantly affected firm performance.
The findings showed that about 30 percent of the variance in firm performance was
explained by the three competitive strategy drivers of uniqueness, focus and cost. The R2
value was average and consistent with observations in other studies. Lerner and Almor
(2002) regressed growth and strategic volume and reported adjusted R2 of 0.21. The
adjusted R2 reported by Sadler-Smitb et al. (2003) was 0.12. Shrader and Siegel (2007)
obtained a strong fit between strategy and team experience as a key determinant of the
long-term performance.
The findings of this study affirm the observations that the competitive strategy has a
significant effect on firm performance. The findings support the RBV that strategic
planning is one of the strategically relevant resources that enable firms obtain sustainable
competitive advantage. This finding, therefore, provide evidence that strategic planning
and implementation matter; there was need for the firms to enhance their competitiveness
and performance by enhancing their strategic planning and implementation through, inter
alia, targeted staff recruitment policies and staff development.

136
5.2.4 Firm Level Institutions on Relationship Between Competitive Strategy and
Firm Performance
H4 – Objective Four
To achieve objective four of this study, hypothesis H4 was tested, that there is no
significant moderating effect of firm level institutions on the relationship between
competitive strategy and performance of SMEs.
The aim of the fourth objective was to establish the moderating effect of firm level
institutions on the relationship between competitive strategy and performance. The effect
of firm level institutions which were categorized as resource based and administrative
based firm level institutions on the entrepreneurship and firm performance relationship is
debatable in literature. While some studies have advanced the moderation effect, others
have discounted it. Equally, most of the evidence on the effect of firm level institutions is
from large corporations. Mahler (2009) and Machuki et al. (2012) observed firm level
institutions to influence the relationship between competitive strategy and performance.
The study by Machuki et al. (2012) concentrated on large corporations leaving out SMEs
and the findings were mostly statistically not significant. However, Lindley and Walker
(1993) opined that moderation effect may reduce or enhance the direction of the
relationship between predictor variables and dependent variable, or it may even change
its direction altogether from positive to negative or vice versa. Therefore, hypothesis H4
was formulated for testing, that there is no moderating effect of firm level institutions on
the relationship between competitive strategy and performance of SMEs.

137
This study, therefore, sought to extent the frontiers of knowledge regarding how firm
level institutions moderate the relationship between competitive strategy and
performance. The study relied on the institutional theory to expound on how firm level
institutions influence the relationship between competitive strategy and performance. The
institutional theory proposition is that entrepreneurs are both constrained and enabled by
the institutions in their environment; internal institutions including the resource based and
administrative based ones affect firm performance (Bruton & Ahlstrom, 2003; Scott,
2004; Bruton et al., 2010).
The major findings of this study were that firm level institutions affected the relationship
between competitive strategy and firm performance. The conditions for moderating effect
were made demonstrating that firm level institutions moderated the relationship between
competitive strategy and firm performance. Results achieved objective four but did not
support hypothesis H4, that there is no moderating effect of firm level institutions on the
relationship between competitive strategy and performance of SMEs.
The indication of a significant moderating effect of firm level institutions concurred with
findings of past studies. Various studies (CPA, 2007; Peng et al., 2008; Mahler, 2009;
Machuki et al., 2012) observed that firm level institutions influence the relationship
between competitive strategy and performance. A study by CPA (2007) on internal
controls for small business in Australia demonstrated that administrative based firm level
institutions including internal control structures and procedures influence the relationship
between competitive strategy and performance. Peng et al. (2008) in a perspective article
on institution-based view of international business strategy of emerging economies

138
opined that institutions drive firm strategy and performance. Machuki et al. (2012) in a
study on firm-level institutions and performance of publicly quoted companies in Kenya
offer support for the influence of skills and competencies, knowledge base, culture and
resources categorized as resource based firm level institutions, and internal control
structures and procedures classified as administrative based firm level institutions to
influence the relationship between competitive strategy and performance.
The findings of this study affirm the observations that the firm level institutions have
significant moderating effect on competitive strategy and firm performance relationship.
Equally, the findings support the institutional theory that institutional dimensions
including the resource based and administrative based ones affect firm performance
(Bruton & Ahlstrom, 2003; Scott, 2004; Bruton et al., 2010). The findings of this study,
therefore, provide evidence that improved performance was visible with only firms that
had manifested firm level institutions to implement competitive strategy; there was need
for firms to enhance their capacities through appropriate staff recruitment policies and
staff development to enhance manifestation of the right firm level institutions.
5.2.5 Joint Effect of Entrepreneur Characteristics and Competitive Strategy on
Firm Performance
H5 – Objective Five
To achieve objective five of this study, hypothesis H5 was tested, that combined effect of
entrepreneur characteristics and competitive strategy on performance of SMEs is not
different from their individual effects.
139
Objective five of this study was to determine the joint effect of entrepreneur
characteristics and competitive strategy on firm performance. Empirical evidence on the
joint effect of entrepreneur characteristics and competitive strategy on firm performance
is debatable. Studies have indicated the relationship as either direct (Phan & Butler,
2003), inconclusive (Sidik, 2012) or being indirect and hidden (Mintzberg, 1978). In this
study, therefore, the test results for joint effect were compared with the individual effects
in providing a better understanding of the relative role of entrepreneur characteristics and
competitive strategy in accounting for differences in performance. If mediating effect
existed in the relationship, simultaneous use of entrepreneur characteristics and
competitive strategy to predict performance would result in reduced and/or insignificant
relationship between entrepreneur characteristics and firm performance (Baron & Kenny,
1986; Mallinckrodt et al., 2006). On the other hand, if the effects were additive, then the
relationships were direct (Phan & Butler, 2003). Thus, hypothesis H5 was formulated for
testing, that the combined effect of entrepreneur characteristics and competitive strategy
on performance of SMEs is not significantly different from their individual effects.
In this study, the researcher sought to extent the frontiers of knowledge regarding how
entrepreneur characteristics and competitive strategy jointly affected firm performance.
The study relied on the RBV and theories relating to entrepreneur characteristics to
expound on how entrepreneur characteristics and competitive strategy jointly affect firm
performance. The RBV advances that a firm can obtain a sustainable competitive
advantage by having strategically relevant resources and capabilities (Barney, 1991). The
entrepreneur characteristics targeted by this study depicted the knowledge, talents, skills,
abilities, experience, intelligence, and training advanced under RBV as some of relevant

140
resources and capabilities for enhancing competitiveness (Wernerfelt, 1984; Barney,
1991; Castanias & Helft, 1991; Conner & Prahalad, 1996). The theories relating to
entrepreneur characteristics expound on the characteristics that contribute to supply of
entrepreneurs (Kubeczko & Rametseinerm, 2002; Greve & Salaff, 2003).
The major findings of this study were that the combined effect of entrepreneur
characteristics and competitive strategy was inconsistent with their individual effects on
performance; competitive strategy significantly mediated the relationship between
entrepreneur characteristics and firm performance. The analysis of joint effect of
entrepreneur characteristics and competitive strategy on firm performance met the three
conditions for existence of mediating effect as specified by Baron and Kenny (1986),
that: a significant relationship between entrepreneur characteristics (predictor) and
performance (dependent) existed before testing for a mediating effect; relationship
between entrepreneur characteristics (predictor) and performance (dependent) became
non-significant after introducing competitive strategy (mediator); and entrepreneur
characteristics (predictor) influence competitive strategy as it influences performance
(dependent). The effect of entrepreneur characteristics was reduced but not eliminated
completely when competitive strategy was introduced indicating partial mediation.
Perfect mediation requires the beta coefficient for predictor to be decreased to zero
(Baron & Kenny, 1986). Results achieved objective five but did not support hypothesis
H5, that the combined effect of entrepreneur characteristics and competitive strategy on
performance of SMEs is not significantly different from their individual effects.

141
The findings of this study were in support of previous studies done to assess mediation of
entrepreneurship to firm performance relationship. Mintzberg (1978) in the study on
patterns in strategy formulation noted that the relationship between entrepreneur
characteristics and strategic action is indirect and hidden. The study by Venkataraman
and Camillus (1984) exploring the concept of “fit” in strategic management posits that an
internal fit between resources and strategies would lead to improved performance.
Edelman et al. (2002) in their study on role of strategy on firm performance observed a
mediating role of strategy in the relationship between human and organizational
resources and firm performance demonstrating that neither resources alone, nor strategies
alone determine performance. Oyedijo and Akewusola (2012) in a study on competitive
strategy orientations of small and medium business owners and their performance
impacts in Nigeria observed that firm strategy is a key determinant of firm performance.
The findings of this study affirm the results in literature that competitive strategy
significantly mediates the relationship between entrepreneur characteristics and firm
performance. Equally, the findings support the RBV and theories relating to
entrepreneurship that skills and experience are important in enhancing firm performance.
The assumption by the RBV that a firm can obtain sustainable competitive advantage by
having strategically relevant resources and capabilities is strongly supported by the
findings of this study. Equally, the findings also support the advancement by the socio-
cultural theory as one of the theories explaining entrepreneur characteristics that skills,
experience and social networks are important in entrepreneurial action and behaviour
(Dubini & Aldrich, 1991; Greve & Salaff, 2003). The findings of this study, thus provide
evidence that competitive strategy matter in firm performance; actions and behaviour of

142
entrepreneurs in enhancing performance of their firms are dependent on the competitive
strategy chosen and implemented. Thus, there was need for the firms to enhance their
capabilities to implement strategy for enhancing competitiveness and performance.
5.3 Summary of the Discussion of Results
This chapter presented the discussion of key results of this study in establishing
relationships in the entrepreneurship to performance nexus as per the research objectives.
An elaborate justification was offered based on conceptual issues for each relationship
and corresponding hypothesis tested. In addition, key results by this study as per each
research objective were presented and a discussion offered clearly elucidating how they
were in agreement with results by other studies. In the chapter, it was indicated clearly
whether each research objective was achieved and respective hypothesis rejected or
accepted. How the findings of this study extended the frontiers of knowledge was also
presented by discussing whether the key findings agreed with the assumptions advanced
by various theories that formed the foundation of this study. The chapter also highlighted
the implications of this study to theory and practice.
All the five research objectives by this study were achieved with the results indicating
significant relationships between entrepreneur characteristics and firm performance,
entrepreneur characteristics and competitive strategy, competitive strategy and firm
performance, moderation by firm level institutions on relationship between strategy and
performance, and combined effect of entrepreneur characteristics and competitive
strategy on performance achieved but did not support the corresponding hypotheses H1 to
H5. The key findings were consistent with results in previous studies on the relationships.

143
CHAPTER SIX
SUMMARY, CONCLUSIONS AND RECOMMENDATIONS
6.1 Introduction
This chapter presents summary of the study findings, conclusions and recommendations.
In addition, the theoretical, managerial, policy and research implications are presented.
The main objective of this study was creating the understanding of the multi-dimensional
nature of firm performance by evaluating the relationships of entrepreneur characteristics,
competitive strategy, firm level institutions and performance. Thus, this chapter presents
a summary of the findings on the multi-dimensionality of firm performance with a clear
indication of the relationships between factors. The implications of this study in terms of
contribution to theory, policy, research and private players are presented.
6.2 Summary of the Study Findings
The integration and interactions of internal organizational factors including entrepreneur
characteristics, strategy and institutions to enhance competitiveness and performance of
firms in NTFPs were not well understood. It was not clear how the traits that present the
entrepreneur as a resource interact with strategy choices made, and institutional
dimensions put in place by the firm in enhancing its competitiveness and performance.
The main purpose of this study, therefore, was to determine the influence of competitive
strategy and firm level institutions on the relationship between entrepreneur
characteristics and firm performance. Literature review done revealed that no other study
had been conceptualized with same framework and similar alignment of variables for
firms in the NTFPs sub-sector in Kenya.

144
The study was conducted as a cross-sectional survey covering 314 SMEs in the NTFPs
sub-sector in nine counties with 88 percent response rate. Before the analyses to achieve
the study objectives, data was organized, cleaned and tested for violation of key
assumptions. The Pearson correlation coefficients, coefficient of determination (R2), F
statistic, and the t-test and their significance levels were applied in presenting the fit of
the models and the relationships between variables.
6.2.1 Entrepreneur Characteristics and Firm Performance
The entrepreneur characteristics exhibited strong relationship with firm performance.
Firm performance was significantly influenced by entrepreneur characteristics of age,
managerial skills, industry experience and social skills. Thus, it was observed that firms
operated by young and experienced owners/managers with high managerial know-how
and social skills performed better than competition.
The first research objective by this study was achieved with the results indicating
significant relationship between entrepreneur characteristics and firm performance. The
overall significance led to the rejection of the null hypothesis, H1 in favour of the
alternative hypothesis, that there is a relationship between entrepreneur characteristics of
age, managerial skills, industry experience and social skills, and performance of firms in
the NTFPs sub-sector. The findings were in support of results made in previous studies.
6.2.2 Entrepreneur Characteristics and Competitive Strategy
The entrepreneur characteristics had a significant link with the competitive strategy
drivers; however the focus and cost drivers exhibited significant relationship with only

145
managerial skills and social skills. It was, thus observed that entrepreneur characteristics
had significant effect on competitive strategy of firms in the NTFPs sub-sector. The firms
operated by young and well educated male entrepreneurs with high managerial know-
how and social skills demonstrated high levels of application of competitive strategy.
The second research objective by this study was achieved with the results indicating
significant relationship between entrepreneur characteristics and competitive strategy.
The overall significance led to the rejection of the null hypothesis, H2 in favour of the
alternative hypothesis, that there is a significant relationship between entrepreneur
characteristics and competitive strategy.
6.2.3 Competitive Strategy and Firm Performance
The competitive strategy drivers exhibited strong relationship with firm performance.
There was a positive relationship between the three competitive strategy drivers of
uniqueness, focus and cost and firm performance. Firm performance was significantly
affected by competitive strategy drivers of uniqueness, focus and cost.
The third research objective by this study was achieved with the results indicating
significant relationship between competitive strategy and firm performance. The high
coefficient of determination values and the significance of the F statistic demonstrated fit
of the model and let to rejection of the null hypothesis, H3 in favour of the alternative
hypothesis, that there is a relationship between competitive strategies and firm
performance. It was, therefore, observed that competitive strategy had significant effect
on firm performance.

146
6.2.4 Firm Level Institutions, Competitive Strategy and Firm Performance
Firm level institutions affected the relationship between competitive strategy and firm
performance. The conditions for moderating effect were made demonstrating that firm
level institutions categorized as resource based and administrative based firm level
institutions moderated the relationship between competitive strategy and performance of
firms in the NTFPs sub-sector.
The fourth research objective by this study was achieved with the results indicating
significant moderating effect of firm level institutions on the relationship between
competitive strategy and performance. The overall significance led to rejection of the null
hypothesis, H4 in favour of alternative hypothesis, that there is moderating effect of firm
level institutions on the relationship between competitive strategy and firm performance.
6.2.5 Joint Effect of Entrepreneur Characteristics, Competitive Strategy and Firm
Performance
The combined effect of entrepreneur characteristics and competitive strategy was
inconsistent with their individual effects on firm performance. The inconsistence of the
combined effect and individual effects of entrepreneur characteristics and competitive
strategy on firm performance demonstrated existence of mediating effect.
The fifth research objective by this study was achieved with the results indicating
significant difference between the combined and individual effects of entrepreneur
characteristics and competitive strategy on firm performance. The overall significance led
to the rejection of the null hypothesis, H4 in favour of the alternative hypothesis, that the

147
combined effect of entrepreneur characteristics and competitive strategy on firm
performance was significantly different from their individual effects. The conditions
defined for the mediating effect were made demonstrating that competitive strategy
mediated the entrepreneur characteristics and performance relationship.
6.3 Conclusions of the Study
The general objective of this study was to determine the influence of competitive strategy
and firm level institutions on the relationship between entrepreneur characteristics and
performance of firms in the NTFPs sub-sector in Kenya. The assessment of firm
performance was complex as the target SMEs pursued diverse objectives including
profitability and continued existence. This complicated the measurement of firm
performance but the application of both financial and non-financial performance metrics
made it possible for the exercise to be undertaken. Chong (2008) observing that
performance measurement is complex and a major challenge for researchers called for
use or integration of various measurement dimensions. This study too asserts that the
complex and often difficult to capture performance of SMEs could be measured by use of
both financial and non-financial metrics and then integrated into an index.
The entrepreneur characteristics had a strong and direct effect on the performance of
firms in the NTFPs sub-sector. Thus, it was concluded that entrepreneur characteristics
and performance of firms in the NTFPs sub-sector were empirically related. Entrepreneur
characteristics of age, managerial skills, industry experience and social skills affected
firm performance; firms operated by young and experienced owners/managers with high
managerial know-how and social skills performed better than competition. This view that

148
entrepreneur characteristics and firm performance of SMEs in the NTFPs sub-sector were
empirically related was consistent with positions by various studies. O‟Farrell and
Hitchens (1988) and Erikson (2002) concluded that the characteristics of the entrepreneur
are central to the determinants of SME performance. Islam et al (2011) concluded that
entrepreneur characteristics have significant effect on business success of SMEs.
The entrepreneur characteristics of age, gender, education, managerial skills, industry
experience and social skills had significant link with competitive strategy. Entrepreneur
characteristics affected choice and application of competitive strategy in enhancing
competitiveness of the firm. It was, therefore, concluded that a link existed between
entrepreneur characteristics and competitive strategy; firms run by relatively young, well-
educated and skilled male entrepreneurs had high levels of application of competitive
strategies. This conclusion compares favourably to perspectives by other studies. Phan
and Butler (2003) demonstrated that the relationship between entrepreneur characteristics
and competitive strategy is direct. Similarly, Shrader and Siegel (2007) concluded that
entrepreneur characteristics were determinants of strategy and performance.
The competitive strategy drivers of uniqueness, focus and cost had significant effect on
firm performance. This led to the conclusion that a direct relationship existed between
competitive strategy and firm performance; competitive strategy drivers application led to
improved firm performance. A similar position was taken by Gibcus and Kemp (2003)
and Peng et al. (2008) that strategies have a direct and strong influence on performance.

149
Firm level institutions significantly influenced the relationship between competitive
strategy and performance of firms in the NTFPs sub-sector. The indicators for firm level
institutions including resource based and administrative based firm level institutions had
strong association with competitive strategy and firm performance. The causal effect of
competitive strategy on firm performance was moderated by firm level institutions. It
was, thus concluded that firm level institutions enhanced the relationship between
competitive strategy and firm performance by acting as a moderator; although the
relationship between competitive strategy and firm performance was true, it was
nevertheless dependent on firm level institutions. This perspective of institutions playing
a moderating role finds support in literature. Peng et al. (2008) demonstrated that
institutions play an important role in affecting firm performance than just playing a role
of background conditions. Mahler (2009) study concluded that internal institutions
influence the relationship between competitive strategy and performance.
The competitive strategy influenced the relationship between entrepreneur characteristics
and firm performance. The competitive strategy provided a causal link between
entrepreneur characteristics and firm performance. It was thus, concluded that the
relationship between entrepreneur characteristics and firm performance was not direct but
required mediating effect of competitive strategy. The overall conclusion is that the
relationship between entrepreneur characteristics and firm performance is not direct but
dependent on competitive strategy and firm level institutions that play mediating and
moderating roles in the relationship, respectively. A multi-dimensional link existed with
entrepreneur characteristics, competitive strategy, firm level institutions and firm
performance as the linkages; firms required resources, appropriate strategy choices and

150
firm level institutional framework, and owners/managers with appropriate personal
characteristics to enhance their competitiveness and firm performance.
A summary of research objectives, hypotheses, findings and conclusion is presented in
Table 6.1.
Table 6.1: Summary of the objectives, hypotheses, findings and conclusion
Objective Hypothesis Findings Conclusion
Determine
relationship between
entrepreneur
characteristics and
firm performance
There is no significant
relationship between
entrepreneur
characteristics and firm
performance
Firm performance
significantly affected by
entrepreneur characteristics of
age, managerial skills,
experience and social skills
H1 rejected
Establish the
relationship between
entrepreneur
characteristics and
competitive strategy
There is no significant
relationship between
entrepreneur
characteristics and
competitive strategy
Competitive strategy
significantly related with
entrepreneur characteristics of
age, gender, education,
managerial skills, industry
experience and social skills
H2 rejected
Determine
relationship between
competitive strategy
and performance
There is no significant
relationship between
competitive strategy and
performance
Performance significantly
affected by competitive
strategy drivers of
uniqueness, focus and cost
H3 rejected
Establish effect of
firm level
institutions on
relationship between
competitive strategy
and performance
There is no significant
moderating effect of
firm level institutions on
relationship between
strategy and
performance
Significant moderation effect
of firm level institutions on
the relationship between
strategy and firm performance
H4 rejected
Determine joint
effect of
entrepreneur
characteristics and
competitive strategy
on performance
Combined effect of
entrepreneur
characteristics and
strategy on performance
is not significantly
different from their
individual effects
Combined effect of
entrepreneur characteristics
and competitive strategy was
inconsistent with their
individual effects on
performance confirming
mediation effect
H5 rejected
Source: Researcher, 2015

151
From the summary of the results presented in Table 6.1, all the relationships were
significant resulting in the rejection of all the five null hypotheses, H1 to H5. This
indicated existence of significant relationships between entrepreneur characteristics and
firm performance, entrepreneur characteristics and competitive strategy, competitive
strategy and firm performance, moderation by firm level institutions on relationship
between strategy and performance, and mediating effect of competitive strategy on the
relationship between entrepreneur characteristics and firm performance. Thus all the five
research objectives were achieved.
6.4 Recommendations of the Study
This study demonstrated that although a direct relationship exist between entrepreneur
characteristics and performance, implementation of strategy and manifestation of
institutions led to enhanced competitiveness and improved performance. Therefore, for
the firms in the NTFPs sub-sector and similar ones to enhance the implementation of
strategies and manifestation of the right firm level institutions, it is recommended that
they aim to have staff with right skills and experience. It is important that the firms too
offer training programmes to their entrepreneurs and staff to help equip them with
requisite skills.
The observation by this study that the firms in NTFPs sub-sector run by relatively young,
well trained and experienced entrepreneurs performed better than competition calls for
the firms to have employment policies that target these trained but unemployed young
people to be part of their operational teams. Thus, it is recommended that the firms put in
place measures that encourage these well trained young people to join them. Kenya has

152
many well trained but unemployed young people that should be targeted by these firms to
enhance their competitiveness and performance.
6.5 Implications of the Research Findings
This study was anchored on the institutional theory, RBV and theories relating to
entrepreneur characteristics. The preceding data analysis and discussion on the findings
by this study thus, pointed at theoretical, managerial and policy implications. These
implications focus on scholarly contribution and contribution to managers, policy makers
and other industry players.
6.5.1 Theoretical Implications
This study was centred on the institutional theory, RBV and theories of entrepreneurship
to ground the arguments and conceptualization of the relationships. This study was based
on the general argument that entrepreneurial decisions and implementation are hampered
or enhanced by the resources and capabilities possessed, and the internal institutional
framework put in place. This general assumption finds support from the findings and
conclusions of this study that firms with owners/managers with requisite qualities,
resources, strategy and internal environment including systems, structures, and good
working procedures and culture were competitive and performed better than competition.
Specifically, this study enriches the institutional theory by adding some insights that
firms required resources and administrative systems that form the internal institutional
milieu to drive through the strategy choices to achieve competitiveness and performance.
With regard to RBV, this study provides support for the argument that a firm can obtain

153
sustainable competitive advantage by having strategically relevant resources and
capabilities that are embedded in the owners/managers and employees inform of skills
and tacit knowledge. The findings on the entrepreneur characteristics indicating the signs
and magnitude of the influence help enrich the theories of entrepreneurship that; SMEs
with better performance than competition were associated with entrepreneurs who were
young, well-experienced, and skilled in management and social capital.
This study conceptualized existence of a multi-dimensional link with entrepreneur
characteristics (independent), competitive strategy (mediating), firm level institutions
(moderating) and firm performance (dependent) as linkages. The results confirmed the
existence of a statistically significant relationship between the four variables. This
observation adds to the existing literature by unearthing mediating effect of competitive
strategy on the relationship between entrepreneur characteristics and firm performance,
and the moderating effect of firm level institutions on the relationship between
competitive strategy and firm performance. The results indicate that the relationship
between entrepreneur characteristics and firm performance is significant but is depended
on competitive strategy. Equally, the relationship between competitive strategy and firm
performance is significant but can be enhanced by manifesting firm level institutions.
6.5.2 Managerial Implications
The entrepreneurs are key drivers in the performance of their businesses. Thus, to
enhance firm competitiveness and performance it was observed that owners should adopt
managerial principles that ensure those entrusted with running their businesses have the
right personal characteristics including age, skills and industry experience. The

154
recruitment policies and procedures should be focused towards targeting managers who
are young, skilled and with industry experience.
To enhance competitiveness and performance of the SMEs, the entrepreneur should put
emphasis on having staff with required skills and an institutional framework to be able to
make right strategy choices and implement them to either deliver unique mix of value to
counter competitor‟s actual or predicted strategy; offer particular products or services in
particular markets; and/or minimize costs of doing business and create a cost advantage.
This would help the firms create and promote brands of NTFPs and expand in specific
segments like superstores and high end hotels where loyalty would be cultivated.
Enrollment and participation in societies or associations/clubs or professional bodies
encompassing practitioners in the industry for a networking and build-up of social skills
is necessary. Such organizations serve the interests of its members and are used to
bargain for better terms with other bodies and the government. There is need to
encourage entrepreneurs and staff of their firms to participate in social interaction settings
and team building activities to enhance their social skills.
Managerial skills are key in optimal business management through strategic planning,
resource mobilization and implementation. Therefore, entrepreneurs must upgrade their
skills in order to enhance competitiveness and performance of the businesses. Specialized
training programmes in entrepreneurship should be organized to equip potential and
existing entrepreneurs with necessary theoretical and practical skills in business
management. Enrolments of start-ups in incubation programmes would be critical.

155
6.5.3 Policy Implications
In the last three decades, Kenya developed legal and regulatory framework, and
programmes to enhance the spirit of entrepreneurship in the country. The notable
achievements include, inter alia, the Sessional Paper No 2 of 2005: Development of
Micro and Small Enterprises for Wealth and Employment Creation for Poverty
Reduction; the Micro and Small Enterprises Bill 2011 (MSME Bill 2011); and the Vision
2030 which recommends the development of SME Parks and calls for more research and
development in encouraging their innovation. Thus, the country is now moving toward
institutionalizing SMEs in its policy and statutory instruments and is experiencing a
growing awareness of the importance of developing entrepreneurship and small business
management for sustained economic growth, rapid employment generation and poverty
eradication (GoK, 2013; World Bank, 2014).
Despite the strides made to enhance entrepreneurship in Kenya, this study demonstrated
that the firms operated by older entrepreneurs were largely uncompetitive because of low
levels of application of competitive strategy; older entrepreneurs in Kenya were
managing their firms without the benefit of the application of competitive strategies.
Policy makers should, therefore, be made aware that the SMEs run by relatively young,
well-trained and skilled entrepreneurs had high levels of application of competitive
strategies calling for policy measures to encourage the many well trained young people
but with high unemployment to engage in businesses. Equally, observation by this study
that firms were managed by entrepreneurs with no requisite skills calls for training
programmes including incubation to equip the practitioners with necessary theoretical
and practical capacities to enhance application of strategies, and manifestation of firm

156
institutions for improved competitiveness and performance. The County Governments
and agencies like KFS and KEFRI that are involved in natural resource management
should be encouraged to build up databases of firms in the NTFPs sub-sector to enhance
their focus and contributions to the economies.
6.6 Limitations of the Study
The findings, discussions, conclusions, and implications of this research study are bound
by some limitations. It is imperative, therefore, that some caution is exercised when
interpreting parts of this study. The research study involved data collection, analysis and
write-up. Essentially, distortion of views or measurement errors would have emerged
especially where it involved capturing perceptions. Equally, the cross-sectional nature as
well as reliance on views of the entrepreneurs who were interviewed singly could lead to
risk of common method variance. However, the reliability tests done indicated that such
errors were minimal. The authenticity of views expressed could have been compromised
limiting the validity of study data although Cronbach‟s alpha value was high.
This study was limited to the SMEs in the NTFPs sub-sector. This is a small portion of
the economy with a comparatively small number of SMEs. The sub-sector was constraint
with data on the number and state of the SMEs. Equally, the SMEs in the sub-sector were
limited to dealing with few products and the sizes for most of them were small.
Essentially, the representation in the medium group was comparatively low. Equally, the
study was limited to the Kenyan situation and did not consider impacts of globalization or
regional integration dynamics on the performance of targeted firms. This, therefore, calls
for caution while generalizing the data and results for business firms.

157
6.7 Suggested Areas for Further Research
Based on the research findings, focus and limitations of the study, further research is
necessary for detailed evaluation of the effect of firm level institutions on the relationship
between entrepreneur characteristics and firm performance as well as extending similar
studies to other sectors of the economy. The study was only limited to only few
entrepreneur characteristics that explained about 22 percent of the variation in firm
performance. Thus, there is need too to increase scope of entrepreneur characteristics and
assess their effect on firm performance.
A cross-sectional design capturing perceptions of owners/managers of respondent SMEs
at a point in time was applied by the study. Such an approach was cost-effective, time
saving and helpful in predicting relationships among variables. However, such an
approach was constraint in the provision of causal relationships among the variables in
the entrepreneurship to firm performance relationship. It was not possible to make
inferences about the dynamics and the nature of the causal relationships in the
entrepreneur – strategy – institutions - performance nexus. However, a longitudinal study
captures well the dynamism state and causal effects and is necessary.
This study made suggestions for future research to be done. While some of the
suggestions were consequences of the research findings of this study, suggestions given
were taken up as complementary research to be conducted. However, further research
should be conducted to create more insights into the entrepreneurship and firm
performance relationship. The study findings pointed out a multi-dimensional interaction
with the entrepreneur characteristics as independent, competitive strategy as mediator,
and firm level institutions as moderator. However, options still exist for other
combinations of the variables. This would give a much broader theoretical basis for the
study of entrepreneurship to firm performance relationship, and enhance understanding of
competitiveness and performance of SMEs. This would also increase the likelihood of
making a significant contribution to the existing pool of knowledge on the subject.
158
REFERENCES
Aaker, D. A. (1998). Developing business strategies. New York: John Wiley and Sons.
Adegbite, S. A., Ilori, M. O., Irefin, I. A., Abereijo, I. O., & Aderemi, H. O. S. (2006).
Evaluation of the impact of entrepreneurial characteristics on the performance of
small scale manufacturing industries in Nigeria. Journal of Asia Entrepreneurship
and Sustainability, 3(1)
African Economic Outlook. (2012). Kenya 2012. AfDB, OECD, UNDP, UNECA.
Retrieved from http://www.africaneconomicoutlook.org/fileadmin/uploads/aeo/
Aguilera, R. V. (2006). Institutions and organizational socialization: integrating
employees in cross−border mergers and acquisitions. In David A. Griffith, S.
Tamer Cavusgil, G. Tomas M. Hult and Arie Y. Lewin (Eds.), Emerging
Research Frontiers in International Business Studies, Volume 2
Ahenkan, A., & Boon, E. (2011). Non-timber forest products: Clearing the confusion in
semantics. Journal of Human Ecology, 33(1), 1-9
Ahlstrom, D., & Bruton, G. D. (2001). Learning from successful local private firms in
China: Establishing legitimacy. Academy of Management Executive, 15(4), 72–83
Ahlstrom, D., Young, M. N., Nair, A., & Law, P. (2003). Managing the institutional
environment: Challenges for foreign firms in post-WTO China. SAM Advanced
Management Journal, 68, 41–49
Alam, J., & Hossan, M. A. (2003). Linking between franchising networks for
entrepreneurship and economic development: Looking for a new model. Paper
presented at the EMNet-Conference on "Economics and Management of
Franchising Networks" Vienna, Austria, June 26–28, 2003
Alan S., & Gary J. (2011). Perception, attribution, and judgment of others.
Organizational Behaviour: Understanding and Managing Life at Work, Vol. 7
Aldrich, H., & Waldinger, R. (1990). Ethnicity and entrepreneurship. Annual Review of
Sociology, 16, 113-135
Aldwin, C. M. (1994). Stress, coping, and development: An integrative perspective. New
York: Guilford Publishers
Amit, R., & Schoemaker, P. J. H. (1993). Strategic assets and organizational rent.
Strategic Management Journal, 14, 33-46

159
Amran, N. A. (2011). The effect of owner‟s gender and age to firm performance: A
review on Malaysian public listed family businesses. Journal of Global Business
and Economics, 2(1), 104 – 116
Analoui, F., & Karami, A. (2003). Strategic management in small and medium sized
industries. UK: Thomson Learning
Aragón-Sánchez, A., & Sánchez-Marín, G. (2005). Strategic orientation, management
characteristics, and performance: A study of Spanish SMEs. Journal of Small
Business Management, 43(3), 287–308
Atieno, R. (2009). Institutional arrangements and performance of micro and small-scale
clothing enterprises in Kenya. IDS, University of Nairobi. CSAE conference 22-
24 March 2009
Babb, E. M. & Babb, S. V. (1992). Psychological traits of rural entrepreneurs. Journal of
Socio-Economics, 21, 353–362
Barney, J. (1991). Firm resources and sustained competitive advantage. Journal of
Management, 17(1), 99-120
Baron, R. M., & Kenny, D. A. (1986). The moderator-mediator variable distinction in
social psychological research: Conceptual, strategic, and statistical considerations.
Journal of Personality and Social Psychology, 51, 1173–1182
Barreto, H. (1989). The entrepreneur in microeconomic theory. London: Routledge
Publishers
Baum, J. R., Locke E. A., & Smith K. G. (2001). A multi-dimensional model of venture
growth. Accessed from http://www.aom.pace.edu/amj/April2001/Baum.pdf on
17th April 2013.
Baumol, W. J., Litan, R. E., & Schramm, C. J. (2009). Good capitalism, bad capitalism,
and the economics of growth and prosperity. New Haven, CT: Yale University
Press
Benison, M. (2007). Internal control guide, office of the comptroller, quality assurance
bureau. Retrieved from http://www.mass.gov/Aosc/docs/business_functions on
20th Sept 2012
Berger, P. L., & Luckman, T. (1967). The social construction of reality. New York:
Doubleday Publishers

160
Bharadwaj, A. (2000). A resource-based perspective on information technology
capability of and firm performance: An empirical investigation. MIS Quarterly,
24(1), 169-196
Blanchflower, D. G. (2007). Entrepreneurship in the United States (Working Paper
October 2007). Dartmouth College: Author
Bowen, M., Morara, M., & Mureithi, S. (2009). Management of business challenges
among small and micro enterprises in Nairobi. KCA Journal of Business
Management, 2(1)
Bruton, G. D., & Ahlstrom, D. (2003). An institutional view of China‟s venture capital
industry: Explaining the differences between China and the West. Journal of
Business Venturing, 18(2), 233–260
Bruton, G. D., Ahlstrom, D., & Li, H. (2010). Institutional theory and entrepreneurship:
Where are we now and where do we need to move in the future. Baylor: Baylor
University Press
Bruyat, C., & Julien. P. A. (2000). Defining the field of research in entrepreneurship.
Journal of Business Venturing, 16, 165-80
Burnett, D. (2000). Hunting for heffalumps: The supply of entrepreneurship and
economic development. History of Entrepreneurship Theory, 1-3
Byers, T. (1997). Characteristics of the entrepreneur: Social creatures, not solo heroes.
The handbook of technology management, Richard C. Dorf (Edition), CRC Press
LLC, Boca Raton, FL, 33431
Campbell-Hunt, C. (2000). What have we learned about generic competitive strategy? A
meta-analysis. Strategic Management Journal, 21, 127–154
Carlsson, G., & Karlsson, K. (1970). Age, cohorts and the generation of generations.
American Sociological Review, 35(4), 710-718
Castanias, R., & Helfat, C. (1991). Managerial resources and rents. Journal of
Management, 17, 155-171
Chadamoyo, P., & Dumbu, E. (2012). Competitive strategy and business environment
influencing performance of small and medium enterprises in the manufacturing
sector: The case study of manufacturing firms in Mucheke light industry.
European Journal of Business and Management, 4(10)
Chaganti, R. S., Chaganti, R., & Mahajan, V. (1989). Profitable strategies under different
types of competition. Entrepreneurship Theory and Practice, 13(3), 21-35

161
Chandler, A. (1962). Strategy and structure: Chapters in the history of industrial
enterprise. Cambridge, MA: MIT Press
Chandler, G., & Hanks, S. H. (1994). Market attractiveness, resource-based capabilities,
venture strategies and venture performance. Journal of Small Business
Management 12(1), 27-35
Chelliah, S., Sulaiman, M., & Yusoff, Y. M. (2010). Internationalization and
performance: Small and medium enterprises in Malaysia. International Journal of
Business and Management, 5(6), 27-37
Chew, D. A. S., Yan, S. & Cheah, C. Y. J. (2004). Creating and sustaining
competitiveness of small and medium-sized construction enterprises in China.
Proceedings of International Symposium on Globalization and Construction, 17-
19 November, 2004, pp.25-34
Chong, H, G. (2008). Measuring performance of small-and-medium sized enterprises:
The grounded theory approach. Journal of Business and Public Affairs, 2(1), 1-10
CIFOR. (2005). Contributing to African development through forests strategy for
engagement in sub-Saharan Africa. Bogor, Indonesia: Center for International
Forestry
Cliffe, S. (1998). Family business: Facing up to succession. Harvard Business Review,
May-June, 16-17
Cohen, J. (1978). Partial products are interactions; partialed powers are curve
components. Psychological Bulletin, 85, 858–866
Commander, S., & Nikoloski, Z. (2010). Institutions and economic performance: What
can be explained? Paper presented at the conference “Enforcement, Evasion and
Informality: Theory and Practice: In Honour of Katherine Terrell” that was held at
the University of Michigan on 4-6 June, 2010
Conner, K. R. (1991). A historical comparison of resource-based theory and five schools
of thought within industrial organization economics: Do we have a new theory of
the firm? Journal of Management, 17(1), 121-154
Conner, K. R., & Prahalad, C. (1996). A resource-based theory of the firm: Knowledge
versus opportunism. Organization Science, 7(5), 477-501
Cooper, A. C., Gimeno-Garcon, E. J., & Woo, C. Y. (1994). Initial human and financial
capital predictors of new venture performance. Journal of Business Venturing, 9,
371–95

162
Cooper, A. C., Markman, G. D., & Niss, G. (2000). The evolution of the field of
entrepreneurship. In G.D. Meyer & K.A. Heppard (Eds.), Entrepreneurship as
strategy. Competing on the entrepreneurial edge, 115-133. Thousand Oaks: Sage
Cooper, D. R., & Schindler, P. S. (2003). Business research methods (8th eds). New
Delhi: Tata McGraw-Hill Publishing Limited
Covin, J. G., Slevin, D. P., & Covin, T. J. (1990). Content and performance of growth-
seeking strategies: A comparison of small firms in high and low technology
industries. Journal of Business Venturing, 5(6), 391-412
Covin, J. G., & Slevin, D. P. (1997). High growth transitions: Theoretical perspectives
and suggested directions. In D. L. Sexton & R. W. Smilor (Eds.),
Entrepreneurship 2000 (pp. 99-126). Chicago, Upstart Publishing
CPA Australia (Certified Practising Accountants, Australia). (2007). Internal controls for
small business 2008 update. Retrieved from
http://www.mcgladrey.com/ResourceCenter/Articles
Darlington, R. (1968). Multiple regression in psychological research and practice.
Psychological Bulletin, 69(3), 161-182
Dess, G. G. & Beard, D. (1984). Dimensions of organizational task environments.
Administrative Science Quarterly, 29(1), 52 – 73
Dess, G. G., & Davis, P. S. (1982). An empirical examination of Porter's (1980) generic
strategies. Academy of Management Proceedings, 7-11
Dess, G. G., & Davis, P. S. (1984). Porter's (1980) generic strategies as determinants of
strategic group membership and organizational performance. Academy of
Management Journal, 27(3), 467-488
Dess, G. G. & Robinson, J. R. B. (1984). Measuring organizational performance in the
absence of objective measures: The case of the privately-held firm and
conglomerate business unit. Strategic Management Journal (pre-1986), 5(3), 265-
273.
De Soto H. (2000). The mystery of capital: Why capitalism triumphs in the west and fails
everywhere else. New York: Basic Books
Dierickx, I., & Cool, K. (1989). Asset stock accumulation and sustainability of
competitive advantage. Management Science, 35(12), 1504-1514

163
DiMaggio, P. J., & Powell, W. W. (1983). The iron cage revisited: Institutional
isomorphism and collective rationality in organizational fields. American
Sociological Review, 48, 147–160
Dlamini, C. S. (2013). A protocol for community-based forest enterprises: The case of
non-timber forest products. Journal of Horticulture and Forestry, 5(1), 1-12
Dollinger, M. J. (1999). Entrepreneurship strategies and resources. Upper Saddle River:
NJ, Prentice Hall
Drucker, P. (1985). Innovation and entrepreneurship: Practice and principles. New
York: Harper and Row
Dubey, P. (2008). Investment in small-scale forestry enterprises: A strategic perspective
for India. Small-Scale Forestry, 7(2), 117-138
Dubini, P., & Aldrich, H. E. (1991). Personal and extended networks are central to
entrepreneurial process. Journal of Business Venturing, 6, 305-15
Echols, A. E. (2000). Extending the resource-based view to explain venture capital firm
networks’ contributions to IPO performance: A study of human-based factors
(PhD thesis). Virginia Polytechnic Institute and State University
Edelman, L. F., Brush, C. G. & Manolova, T. (2002). The mediating role of strategy on
small firm performance (Working Paper #2004-03). Prepared for submission:
Journal of Business Venturing, April 2002
Edwards, J. R. & Lambert, L. S. (2007) Methods for integrating moderation and
mediation: A general analytical framework using moderated path analysis.
Psychological Methods, 12, 1-22
Ensley, M. D., Pearce, C. L. & Hmieleski, K. M. (2006). The moderating effect of
environmental dynamism on the relationship between entrepreneur leadership
behaviour and new venture performance. Journal of Business Venturing, 21, 243 -
263.
Erikson T. (2002). Entrepreneurial capital: The emerging venture's most important asset
and competitive advantage. Journal of Business Venturing, 17, 275-290
Filatotchev, I., Piesse, J. & Yung-Chih, L. (2005). Corporate governance and performance
in publicly listed, family-controlled firms: Evidence from Taiwan. Asia Pacific
Journal of Management, 22, 257–83

164
Food and Agriculture Organization (FAO) of the United Nations. (1995). Non-wood
forest products for rural income and sustainable forestry. Non-wood Forest
Products, 7
Fielden, T. L. (2000). Barriers encountered during micro and small business start-up in
North-West England. Journal of Small Business and Enterprise Development,
7(4)
Fogarty, T. (1996). Sponsored academic positions by large public accounting firms: an
investigation of quid pro quo. Advances in Public Interest Accounting, 6,133-162
Frazier, P. A., Tix, A. P., & Barron, K. E. (2004). Testing moderator and mediator effects
in counseling psychology. Journal of Counseling Psychology, 51(1), 115-134
Freedman, J., & Godwin, M. (1994). Incorporating the micro business: Perceptions and
misperceptions in finance and the small firm. Eds A. Hudges and D Storey 232 –
283. London: Rutledge
Freeman, J., Carroll, G. R., & Hannan, M. T. (1983). The liability of newness: Age-
dependence in organizational death rates. American Sociological Review, 48,
692–710
Freidlin, B., & Gastwirth, J. L. (2000). Should the median test be retired from general
use? American Statistician, 54, 161-164
Fuduric, N. (2008). Individuals and opportunities: A resource-based and institutional
view of entrepreneurship. Luzern, Switzerland: Aalborg University
Furrer, R., Sain S. R., Nychka D., & Meehl, G. A. (2007). Multivariate bayesian analysis
of atmosphere-ocean general circulation models. Environmental Ecology
Statistics, 14, 249 - 266
Gaebler Ventures on Resources for Entrepreneurs. (2007). For entrepreneurs: The
entrepreneurial personality. Retrieved Feb 25, 2011 from
http:/www.gaebler.com/Entrepreneurial – Personality.htm
Gibcus, P., & Kemp, R. G. M. (2003). Strategy and small firm performance. Research
report financed by the Netherlands Ministry of Economic Affairs
Gibson, T., & Van der Vaart, H. J. (2008): “Defining SMEs: A less imperfect way of
defining small and medium enterprises in developing countries. Retrieved from
http://www.brook.edu/press/books/transformingthedevelopmentlandscape.htm
165
Gladwin, C., Long, B., Babb, E., Beaulieu, L., Moseley, A., Mulkey, D., & Zimet, D.
(1989). Rural entrepreneurship: One key to rural revitalization. American
Agriculture Economics Association, December, 1308-1314
GoK (Government of Kenya). (2008). Baseline survey report on SMEs competitiveness
project. Improving Business Environment Component. July, 2008
GoK (Government of Kenya). (2013). Economic survey. Nairobi Kenya: Government
Printers
Gómez, L. (2006). The process and problems of business start-ups. Pensamiento and
Gestión, 22. Universidad del Norte, 232-255
Gomide, A., Leite S., & Rebelo, J. (2004). Public transport and urban poverty: A
synthetic index of adequate service (Working Paper). Washington DC: World
Bank Urban Transport Program.
Grandori, A. (2001). Neither hierarchy nor identity: Knowledge governance mechanisms
and the theory of the firm. Journal of Management and Governance, 5(3-4), 381-
399
Granovetter, M. (1985). Economic action and social structure: The problem of embededness.
American Journal of Sociology, 91(3), 481-510
Grant, R. M. (1991). The resource based theory of competitive advantage: Implications
for strategy formulation. California Management Review, 33(3), 114-135
Gray, K., Cooley W., & Lutabingwa, J. (1995). Small-scale manufacturing in Kenya:
Characteristics, problems and sources of finance. Jackson: Jackson State
University Press
Greve, A., & Salaff, J. W. (2003). Social networks and entrepreneurship.
Entrepreneurship Theory and Practice, 28(1), 1-22
Guimaraes, T., & Armstrong, C. (1998). Empirically testing impact of change
management effectiveness on company performance. European Journal of
Innovation Management, 1(2), 74 – 82
Gupta, A., & Muita, S. A. (2013). Relationship between entrepreneurial personality,
performance, job satisfaction and operations strategy: An empirical examination.
International Journal of Business and Management; 8(2), 86 – 95
Gupta, A. K., & Govindarajan, V. (1984). Business unit strategy, managerial
characteristics, and business unit effectiveness at strategy implementation.
Academy of Management Journal, 27(1), 25 – 41

166
Hadjimanolis, A. (2000). A resource-based view of innovativeness in small firms.
Technology Analysis and Strategic Management, 12(2), 263-281
Hall, R. (1993). A framework linking intangible resources and capabilities to sustainable
competitive advantage. Strategic Management Journal, 14, 607–618
Hambrick, D. C. (1983). Some tests of the effectiveness and functional attributes of miles
and snows strategic types. Academy of Management Journal, 26(1), 526
Hamel, G., & Prahalad, C., K. (1996). Strategy as a stretch and leverage. Harvard
Business Review, 71, 75-85
Harhoff, D., Stahl, K., & Woywode, M. (1998), „Legal form, growth and exit of western
German firms: Empirical results for manufacturing, construction, trade and
service industries. Journal of Industrial Economics, 46(4), 453-488
Harper, B., Ralph, W., & Stanley, S. (1977). Marketing research: Text and cases.
Homewood: Richard D. Irwin
Hashim, M. K. (2000). Business strategy and performance in Malaysian SMEs: A recent
survey. Malaysian Management Review, 1-10
Helfat, C. E. (1994). Firm-specificity in corporate applied rand. Organization Science,
5(2), 173-1994
Henrekson M. (2007). Entrepreneurship and institutions. Paper presented at the
conference. Entrepreneurship: Law, Culture, and the Labor Market, Chicago,
March 23–24, 2007
Herron, L. A., & Robinson, R. B. Jr. (1993). A structural model of the effects of
entrepreneurial characteristics on venture performance. Journal of Business
Venturing, 8, 281-294
Hisrich, R. D., Peters, M. P., & Shepherd D. A. (2008). Entrepreneurship, 9th
ed. New
York: McGraw Hill
Hodges, J., & Lehmann, E. L. (1956). The efficiency of some nonparametric competitors
of the t-test. Annals of Mathematical Statistics, 27, 324-335
Hsiu-Jung, C. (2008). A Study on the effects of entrepreneurship and interpersonal
network on the business performance of bed-and-breakfast inn operators in
Taiwan. The Journal of Human Resource and Adult Learning, 4(1)

167
Hwang, H., & Powell, W. (2005). Institutions and entrepreneurship. In S.A. Alvarez, R.
Agarwal, and O. Sorenson (Eds.). Handbook of entrepreneurship research,
Disciplinary perspectives, 201–232
ILO (International Labour Organization). (2008). Women entrepreneurs in Kenya:
Factors affecting women entrepreneurs in micro and small enterprises in Kenya.
(Preliminary report). Programme on boosting employment through small
enterprise development, job creation and enterprise development department,
skills and employability department, ILO Regional Office for Africa - Geneva
Ingram, P. & Silverman, B. (2002). Introduction. In Ingram P, Silverman B (eds.), The
new institutionalism
Islam, A., Khan, M. A., Obaidullah, A. Z. M, & Alam, M. S. (2011). Effect of
entrepreneur and firm characteristics on the business success of small and
medium enterprises in Bangladesh. International Journal of Business and
Management, 6(3), 289 – 299
Israel, G. D. (1992). Determining sample size. Program evaluation and organizational
development, IFAS, University of Florida. PEOD-6. November 1992
Kaimowitz, D. (2003). Not by bread alone…forests and rural livelihoods in sub-Saharan
Africa. In: Oksanen, T., Pajari, B. and Tuomasjukka, T. (eds.) Forests in poverty
reduction strategies: capturing the potential (pp. 45-63). EFI Proceedings No 47.
European Forest Institute: Joensuu, Finland
Kamalakumati, K., & Sathiyakala, J. (2013). Impact of entrepreneurial characteristics on
the organizational development of the small business entrepreneurs. Industrial
Engineering Letters, 3(6). Online at www.iiste.org
Kamanga, P., Vedeld, P. & Sjaastad, E. (2009). Forest incomes and rural livelihoods in
ChiradzuluDistrict, Malawi. Ecological Economics, 68 (3), 613-624
Kapp, V. Y. (2003). A psychological model of entrepreneurial behavior. Journal of the
Academy of Business and Economics, 2, 2-12
Kariuki, P. M., Awino, Z. B., & Ogutu, M. (2011). Effect of firm level factors, firm
strategy, business environment on firm performance. University of Nairobi
Keith, T. (2006). Multiple regression and beyond. Boston: Allyn & Bacon
Kemp, R., & Verhoeven, W. (2002). Growth patterns of medium-sized, fast-growing
firms. Scales Research Reports, EIM Business and Policy Research H200111,
EIM Business and Policy Research

168
Kenya Bureau of Standards (KEBS). (2013). Small and medium enterprises in Kenya.
Electronic Database by April 2013
Khayesi, J. N. O. (2009). Structural social capital and the cost of raising resources for
entrepreneurs. The moderating role of shared identity (summary). Frontiers of
Entrepreneurship Research, 2(7)
Kibas, P. B., & K‟Aol, G. O. (2004). The Kenyan entrepreneur: Typologies and
characteristics. Accessed on 17th
March 2013 from
http://sbaer.uca.edu/research/icsb/2004/paper51.pdf
Kimuyu, P. (1999). Institutional relevant to commerce and industry: Moral norms, social
capital, business systems and the state of the law. Institute of Policy Analysis and
Research, Nairobi
King‟oriah, G. K. (2004). Fundamental of applied statistics. Nairobi: The Jomo
Kenyatta Foundation
Kipesha, E. F. (2013). Impact of size and age on firm performance: Evidence from
microfinance institutions in Tanzania. Research Journal of Finance and
Accounting, 4(5), 105-115
Kirzner, I. M. (1982). Uncertainty, discovery, and human action. In Method, Process and
Austrian Economics, D. C. Heath
Klaus, E., Meyer, K. E., Estrin, S., Bhaumik, S., & Peng, M. W. (2008). Institutions,
resources, and entry strategies in emerging economies. Strategic Management
Journal
Knight, F. H. (1971). Risk, uncertainty and profit. Chicago: University of Chicago Press,
1971 (reprint of 1921 Houghton Mifflin edition), Chapter IX "Enterprise and
Profit"
Kraus, S. & Kauranen, I. (2009). Strategic management and entrepreneurship: Friends or
foes? International Journal of Business Science and Applied Management, 4(1),
37-50
Kristiansen, S., Furuholt, B., & Wahid, F. (2003). Internet cafe entrepreneurs: Pioneers in
information dissemination. International Journal of Entrepreneurship and
Innovation, 4(4), 251-263
Kubeczko, K., & Rametseiner, E. (2002). Innovation and entrepreneurship. A new topic
for forest related research? IFSPE – Discussion Paper Institute for forest sector
policy and economics. University of Agricultural Sciences, Vienna

169
Kuratiko, D. F., & Hodgetts, R. M. 2004. Entrepreneurship: Theory, process, practice.
Australia, Thomson South-Western
Laitinen, E. K. (2002). A dynamic performance measurement system: Evidence from
small Finnish technology companies. Scandinavian Journal of Management, 18,
No.1, 65-99
Lerner, M., & Almor, T. (2002). Relationships among strategic capabilities and the
performance of women-owned small ventures. Journal of Small Business
Management, 40(2), 109-125
Liedholm, C., & Mead D. C. (1999). Small enterprises and economic development.
London, Routledge
Lindley, P., & Walker, S. N. (1993). Theoretical and methodological differentiation of
moderation and mediation. Nursing Research, 42, 276–279
Litondo, K. (2010). Mobile phones and e-commerce in micro and small enterprises: An
empirical investigation of entrepreneurship in Nairobi (Unpublished Ph.D.
Thesis). University of Nairobi, Nairobi
Low, M. & MacMillan, I. (1988). Entrepreneurship: Past research and future challenges.
Journal of Management, 14, 139–161
Lumpkin, G. T., & Dess, G. G. (1996). Clarifying the entrepreneurial orientation
construct and linking it to performance. The Academy of Management Review,
21(1), 135-172
Maalu, J. K. (2010). Succession strategy and performance of small and medium family
businesses in Nairobi, Kenya. (Unpublished Ph.D. Thesis), University of Nairobi,
Nairobi
Machuki, V., Aosa, E., & Letting, N. (2012). Firm-level institutions and performance of
publicly quoted companies in Kenya. International Journal of Humanities &
Social Science, 2 (21), 298-312
Mahler, J. G. (2009). Institutional explanations of organizational learning. Department
of Public and International Affairs. George Mason University, Fairfax, VA
Mahoney, J. T., & Pandian, J. R. (1992). The resource-based view within the
conversation of strategic management. Strategic Management Journal, 13, 363-
380

170
Mallinckrodt, B., Abraham, W., T., Wei, M., & Russell, D. W. (2006). Advances in
testing the statistical significance of mediation effects. Journal of Counseling
Psychology, 53(3), 372–378
Marshall E., Schreckenberg, K., & Newton, A. C. (eds) (2006). Commercialization of
non-timber forest products: Factors influencing success. Lessons learned from
Mexico and Bolivia and policy implications for decision-makers
Marshall, A. (1949 [1920]), Principles of economics. London: Macmillan, 8th ed
Martin, G., & Staines, H. (2008). Managerial competencies in small firm. A scoping
study. Burundi: Acts Press
Mazzarol, T., Volery, T., Doss, N., & Thein, V. (1999). Factors influencing small
business start-ups. International Journal of Entrepreneurial Behavior and
Research, 5(2), 48-63
Mbogo, M. (2010). The impact of mobile payments on the success and growth of micro-
business: The case of M-Pesa in Kenya. The Journal of Language, Technology
and Entrepreneurship in Africa, 2(1), 182 – 203
McCormick, D. (2001). Gender in small enterprise in Kenya: An institutional analysis. In
p.c. Samanta & R.K. Sen (eds), Realizing African development. Kolkata India:
CIADS in collaboration with IIDS, 309-330
McLelland, D. C. & Winter, D. G. (1971). Motivating economic achievement. New York:
The Free Press
McMahon, R. G. P. (1998). Stages models of SME growth reconsidered. The Flinders
University of South Australia School of Commerce Research Paper Series 98-5.
Downloaded from http://www.Ssn.flinders.edu.au/commerce/researchpapers98-
5htm on 30 August, 2004
McMahon, R. G. P. (2001). Growth and performance of manufacturing SMEs: The
influence of financial management characteristics. International Small Business
Journal, 19(3), 10-28
Medcof, J. (2000). The resource-based view and transnational technological strategy.
Journal of High Technology Management Research, 11(1), 59-74
Meyer, J. W., & Rowan, B. (1991). Institutionalized organizations: Formal structure as
myth and ceremony. In W.W. Powell & P.J. DiMaggio (Eds.). The new
institutionalism in organizational analysis, 41–62. Chicago, University of
Chicago Press

171
Meyer, J. W., & Scott, W. R. (1983). Centralization and the legitimacy problems of local
government. In J.W. Meyer & W.R. Scott (Eds.), Organizational environments:
Ritual and rationality, 192–215, Beverly Hills, CA, Sage Publications
Mfinanga, D. (2008). Paratransit situation in Dar es Salaam city. Presented at the ACET.
Project 4 and 5 paratransit Research Tea Meeting, 9th June 2008, Nairobi
Micceri, T. (1989). The unicorn, the normal curve, and other improbable creatures.
Psychological Bulletin, 105, 156-166
Michalisin, M., Smith, R., & Kline, D. (1997). In search of strategic assets. International
Journal of Organizational Analysis, 5, 360-387
Miles, R. E., & Snow, C. C. (1978). Organization strategy, structure and process. New
York: McGraw-Hill.
Miller, D. (1988). Relating Porter's business strategies to environment and structure:
Analysis and performance implications. Academy of Management Journal, 31,
280-308
Miller, N. J., Besser, T. L., Gaskill, L. R., & Sapp, S. G. (2003). Community and
managerial predictors of performance in small rural US retail and service firms.
Journal of Retailing and Consumer Services, 10(4), 215 – 230
Mintzberg, H. (1978). Patterns in strategy formulation. Management Science, 24, 934 –
948
Mugenda, O. & Mugenda, A. (2003). Research methods: Quantitative & qualitative
approaches. Nairobi: Acts Press.
Murphy, G. D., Trailer, J. W., & Hill, R. C. (1996). Measuring performance in
entrepreneurship research. Journal of Business Research, 36, 15–23
Muthuvelayutham, C., & Jeyakodeeswari, R. (2014). The moderating effect of
environmental factors and firm‟s age on strategic orientations and performance of
Indian women entrepreneurs. International Journal of Scientific Research and
Management, 2(5), 876-900
Namusonge, G. (1998). Determinants of growth oriented small and medium enterprises
in Nairobi, Kenya. (Unpublished Ph.D. Thesis). Jomo Kenyatta University of
Agriculture and Technology
Namusonge, M. J. (2014). Linking competencies with strategies: The case of small and
medium- sized exporting firms in Kenya. International Journal of Social Sciences
and Entrepreneurship, 1 (11), 418-439.

172
Neumann, R. P., & Hirsch, E. (2000). Commercialization of non-timber forest products:
Review and analysis of research. Bogor, Indonesia: CIFOR
Nils, H., & von der Fehr, M. (1995). The African entrepreneur: Evidence of
entrepreneurial activity and firm formation in Zambia (Working Papers
1995/06/30). The World Bank
Nooteboom, B. (1994). Innovation and diffusion in small firms: theory and evidence.
Small Business Economics, 6(5), 327 – 347
North, D. C. (1990). Institutions, institutional change and economic performance. New
York: Cambridge University Press
Odundo, E. O. (2012). Environmental context, implementation of strategic plans and
performance of state corporations in Kenya. (Unpublished Ph.D. Thesis),
University of Nairobi, Nairobi
O'Farrell, P. N. & Hitchens, D. M. W. N. (1988). Alternative theories of small-firm
growth: A critical review. Environment and Planning, 20(2), 1365-1383
Oliver, C. (1995). The antecedents of deinstitutionalization. Organization Studies, 13,
563–588
Ologunde, A. O., & Agboola, A. A. (2012). Business strategy as a measure of
organizational performance. International Journal of Business and Management,
7(1), 241- 253
O‟Regan, N., & Ghobadian, A. (2005). Strategic planning: A comparison of high and low
manufacturing firms. Technovation, 25(10), 1107–1117
Oroko, H. (2009). Entrepreneurial personality, experiences and patronage factors
influencing growth of micro-enterprises manufacturing metallic products at
Kamukunji in Nairobi. (Unpublished Ph.D. Thesis). Kenyatta University, Nairobi
Osborne, J., & Waters, E. (2002). Four assumptions of multiple regression that
researchers should always test. Practical Assessment, Research & Evaluation,
8(2)
Oyedijo, A. (2012). Competitive strategy orientations of small and medium business
owners and their performance impacts: The case of paint manufacturing SMEs in
south-western Nigeria. Journal of Asian Business Strategy, 2(1), 1-8
Oyedijo, A., & Akewusola, R. O. (2012).Organizational strategy and firm performance in
Nigeria. Journal of Research in International Business and Management, 2(6),
170-178

173
Palich, L. E. & Bagby, D. R. (1995). Using cognitive theory to explain entrepreneurial
risk-taking: Challenging conventional wisdom. Journal of Business Venturing, 10,
425–438
Park, H. M. (2008). Univariate analysis and normality test using SAS, Stata, and SPSS
(Working Paper). The University Information Technology Services (UITS)
Center for Statistical and Mathematical Computing, Indiana University.
http://www.indiana.edu/~statmath/ stat/all/
Pedhazur, E. J., & Schmelkin L. P. (1991). Measurement, design, and analysis. Hillsdale,
NJ: Lawrence Erlbaum Associates
Pelham, A. M. (1999). Influence of environment, strategy, and market orientation on
performance in small manufacturing firms. Journal of Business Research, 45, 33–
46
Pelham, A. M. (2000). Market orientation and other potential influences on performance
in small and medium-sized firms, Journal of Small Business Management, 38 (1),
48-67
Peng, M. W., Wang, D.Y., & Jiang Y. (2008). An institution-based view of international
business strategy: a focus on emerging economies. Journal of Int. Business
Studies 39, 920–936
Peng, M. W. (2006). How entrepreneurs create wealth in transition economies. In H. Li
(Ed.)
Penrose, E. T. (1959). The theory of the growth of the firm. New York: Wiley
Peteraf, M. A. (1993). The cornerstones of competitive advantage: A resource-based
view. Strategic Management Journal, 14, 179-191
Peyrefille, J., Fadil. P. A., & Thomas, A. S. (2002). The influence of managerial
experience on large firm internationalization. International Journal of
Management, 19(3), 495-502
Pfeffer, J. (1994). Competitive advantage through people. Boston: Harvard Business
School Press
Phan, P. H., & Butler, J. E. (2003). Entrepreneurs‟ attitudes, strategy choices, and firm
performance. Journal of business and entrepreneurship, 15(1)
Polanyi, M. (1966). The tacit dimension. Peter Smith: Gloucester, MA

174
Porter, M. E. (1980). Competitive strategy: Techniques for analyzing Industries and
competitors. New York: Free Press
Porter, M. E. (1991). Towards a dynamic theory of strategy. Strategic Management
Journal, 12, 95-117
Postma, T. & Hermes, N. (2002). Institutions, corporate governance and corporate
governance institutions: The case of Estonia. Paper presented at the workshop
getting ready for a larger EU, Groningen, June 20-21, 2002
Powell, W. W., & DiMaggio, P. J. (1991). The new institutionalism in organizational
analysis. Chicago: University of Chicago Press
Pushpakumari, M. D., & Watanabe, T. (2009). Do strategies improve SMEs
performance? An empirical analysis of Japan and Sri Lanka. Meijo Asian
Research Journal, 1(1)
Rahab, S. (2012). Innovativeness model of small and medium enterprises based on
market orientation and learning orientation: Testing moderating effect of business
operation mode. Procedia Economics and Finance, 4(2012), 97–109. Available
online at www.sciencedirect.com
Ramsay, B., Ong, D., & Yeung, M. (2005). Firm size, ownership and performance in the
Malaysian palm oil industry. Asian Academic of Management Journal of
Accounting and Finance, 1, 81-104
Rauf, M. A. (2007). HRM sophistication and SME performance in Lahore, Pakistan,
(Published Ph.D. Thesis). University of Twente
Reynolds, P. D., Hay, M., Bygrave, W. D., Camp, S. M., & Autio, E. (2000). Global
entrepreneurship monitor 2000 executive report: Babson College, Kauffman
Center for Entrepreneurial Leadership, and London Business School
Robinson, R. B., & Pearce, J. A. (1991). The structure of generic strategies and their
impact on business unit performance. Proceedings of the Academy of
Management, 3-11
Rwigema, H., & Venter, R. (2004). Advanced entrepreneurship. Cape Town: Oxford
University Press Southern Africa
Sachs, J. D. (2003). Institutions don’t rule: Direct effects of geography on per capita
income (Working Paper 9490). National Bureau of Economic Research.
Massachusetts Avenue Cambridge, MA 02138. Retrieved from
http://www.nber.org/papers/w9490

175
Sadler-Smitb, E., Hampson, Y., Cbaston, I., & Badger, B. (2003). Managerial behavior,
entrepreneur style, and small firm performance. Journal of Small Business
Management, 41(1), 47-67
Sandberg, W. R. (1986). New venture performance: The role of strategy and industry
structure. Lexington
Sandberg, W. R. & Hofer, C. W. (1987). Improving new venture performance: The role
of strategy, industry structure, and the entrepreneur. Journal of Business
Venturing, 2(1), 5–28
Sapienza, H. J., Smith, K. G. & Gannon, M. J. (1988). Using subjective evaluations of
organizational performance in small business research. American Journal of Small
Business, 12(3), 45-53
Sarwoko, E., Surachman, Armanu, Hadiwidjojo, D. (2013). Entrepreneurial
characteristics and competency as determinants of business performance in SMEs.
Journal of Business and Management, 7(3), 31-38
Saunders, M., Lewis, P., & Thornhill, A. (2007). Research methods for business students.
London: Prentice Hall
Say, J. B. A. (1971). Treatise on political economy. New York, 1827, first published in
1803 in French, 295
Schein, E. H. (2009). Helping: How to offer, give, and receive help. San Francisco:
Berrett-Koehler Publishers
Schreckenberg, K., Marshall E., Newton, A., Willem te Velde, D., Rushton, J., &
Edouard, F. (2006). Commercialization of non-timber forest products: What
determines success? ODI. Forestry Briefing. Number 10, March 2006
Schumpeter, J. A. (1942). Capitalism, socialism and democracy. Third Edition, Harper
and Brothers
Scott, W. R. (2004). Institutions and organizations. Thousand Oaks: CA, Sage
Publications
Scott, W. R. (2007). Institutions and organizations: Ideas and interests. Thousand Oaks:
CA: Sage Publications
Sedlacek, P. (2011). Firm age, business cycles and aggregate labor market dynamics.
Accessed on 24th
August 2014 at http://comp-econ.org/Sedlacek-FirmAge.pdf

176
Selznick, P. (1957). Leadership in administrative framework. New York: Harper & Row,
Publishers
Shackleton, C. M., Shackleton, S. E., Buiten, E. & Bird, N. (2007). The importance of
dry woodlands and forests in rural livelihoods and poverty alleviation in South
Africa. Forest Policy and Economics, 9 (5), 558-577
Shane, S., Locke, E. A., & Collins, C J. (2003). Entrepreneurial motivation. Retrieved
from http://login.oaresciences.org/whalecomwww.sciencedirect.com
Shanley, P., Pierce, A., Laird, S., & Robinson, D. (2008). Beyond timber certification and
management of non-timber forest products. http://www.proforest.net/publication-
objects
Shehu, U. H. (2011). Corporate governance and financial reporting quality: A study of
Nigerian money deposit bank. International Journal of Research in Computer
Application and Management (U.S.A), 1(6), 12-19 ISSN: 2231-1009
Shigang, Y. (2010). Competitive strategy and business environment: The case of small
enterprises in China. Asian Social Science, 6(11)
Shivani, S., Mukerjee, S. K., & Sharan, R. (2006). Socio-cultural influences on Indian
entrepreneurs: The need for appropriate structural interventions. Journal of Asian
Economics, 17, 5–13
Shrader, R., & Siegel, D. (2007). Assessing the relationship between human capital and
firm performance: Evidence from technology-based new ventures.
Entrepreneurship Theory and Practice, 31(6), 893–908
Sidik, I. G. (2012). Conceptual framework of factors affecting SME development:
Mediating factors on the relationship of entrepreneur traits and SME performance.
Procedia Economics and Finance, 4 (2012), 373 – 383
Širec, K., & Močnik, D. (2010). How entrepreneurs’ personal characteristics affect
SMEs’ growth. Izvirni Znanstveni Članki – Original Scientific Papers. NG, št. 1–
2/2010 Izvirni znanstveni članki
Song, M., Droge, C., Hanvanich, S. & Calantone, R. (2005). Marketing and technology
resource complementarity: An analysis of their interaction effect in two
environmental contexts. Strategic Management Journal, 26(3), 259-276
Spanous, Y. & Lioukas, S. (2001). An examination into the causal logic of rent
generation: Contrasting Porter's competitive strategy framework and the
resource‐based perspective. Strategic Management Journal, 22, 907‐34

177
Steinhoff, D., & Burgess. L. (1993). Small business management fundamental.
Singapore: McGraw-Hill, Inc
Stiglitz, J., & Weiss, A. (1981), Credit rationing in markets with imperfect information.
American Economic Review, 71, 393-411
Stinchcombe, A. (1965). Social structure and organizations. In March, J. (Ed.). Handbook
of Organizations (pp. 142–193). Chicago: Rand-McNally
Subedi, B. P. (2003). Non-timber forest products sub-sector in Nepal: Opportunities and
challenges for linking business with biodiversity conservation. The Nepal Journal
of Forestry, XII(2), 18-32
Suchman, M. C. (1995). Managing legitimacy: Strategic and institutional approaches.
Academy of Management Review, 20(3), 57–611
Sulistyowati, K., Salim, U., Surachman & Solimun. (2013). Competitive strategy: As
mediation the effect of external business environment and total quality
management implementation toward company performance. Journal of Business
and Management, 8 ( 2), 7-20
Sunderlin, W. D., Angelsen, A., Belcher, B., Burgers, P., Nasi, R., Santoso, L. &
Wunder, S. (2005). Livelihoods, forests and conservation in developing countries:
An overview. World Development, 33 (9), 1383-1402
Tabachnick, B. G., & Fidell, L. S. (2007). Using multivariate statistics. New York (5th
Ed.)
Tanizaki, H. (1997). Power comparison of non-parametric tests: Small-sample properties
from Monte Carlo experiments. Journal of Applied Statistics, 24, 603-632
Tan, C., & Smyrnios, K., (2011). How do Australian fast-growth small-to-medium
enterprises measure performance? Journal of Enterprising Culture, 19(1), 41-60
Teach, R. D., & Schwartz, R. G. (2000). The congruence game: A team building game
for entrepreneurs. Published in the ISAGA Proceedings
Teece, D. J. (1986). Profiting from technological guideposts and innovation: Implications
for integration, collaboration, licensing and public policy. Research Policy, 15,
285-305
Temtine, Z. T., & Pansiri, J. (2004). Small business critical success/failure factors in
developing economies: Some evidence from Botswana. American Journal of
Academy Sciences, 1 (1): 18-25

178
Timmons, J. A. (1994). New venture creation: Entrepreneurship for the 21st century.
Fourth edition. Irwin Press, Burr Ridge, II
Tsai, C. & Yen, Y. (2008). A model to explore the mystery between organizations‟
downsizing strategies and firm performance: Integrating the perspectives of
organizational change, strategy and strategic human resource management.
Journal of Organizational Change Management, 21 (3), 367 – 384
Tyebjee, T. T., & Bruno, A. V. (1984). A model of venture capitalist investment activity.
Management Science, 30(9), 305-322
Urban, B., Van Vuuren, J. & Barreira, J.D. (2009). High-growth entrepreneurs: The
relevance of business knowledge and work experience on venture success.
Journal of Contemporary Management, 5, 58 - 71
Venkataraman, N. & Camillus, J. C. (1984). Exploring the concept of “fit” in strategic
management. Academy of Management Review, 9(3), 512-525
Venkatraman, N., & Ramanujam, V. (1986). Measurement of business performance in
strategy research: A comparison of approaches. Academy of Management Review,
11, 801-814
Verhees, F. J. H., & Meulenberg, M. T. G. (2004). Market orientation, innovativeness,
product innovation, and performance in small firms. Journal of Small Business
Management, 42(2)
Waema, T. M., Odera, G., Adeya-Weya, C. N. A., Were, P., Masinde, E. M., Chepken,
C., Kariuki, E., & Kenduiywo, P. (2009). Development of a business process
outsourcing industry in Kenya: Critical success factors. IDRC Grant No. 104488-
001. Policy Brief. August 2009
Wanjohi, A. M., & Mugure, A. (2008). Factors affecting the growth of MSEs in rural
areas of Kenya: A case of ICT firms in Kiserian Township, Kajiado District.
Unpublished paper
Wells, L. T. Jr. (1974). Picard printing products. Boston: Harvard Business School Case
374-227
Wernerfelt, B. (1984). A resource-based view of the firm. Strategic Management
Journal, 5, 171-180
Westerberg, M., & Wincent, J. (2008). CEO characteristics and management control.
Journal of Business & Entrepreneurship, 20(1), 37-60

179
White, R. E. (1986). Generic business strategies, organizational context and performance:
An empirical investigation. Strategic Management Journal, Vol. 7, 217-231
Woldie, A., Leighton, P., & Adesua, A. (2008). Factors influencing small and medium
enterprises (SMEs). Banks and Bank Systems, 3(3)
World Bank. (2014). World bank indicators: Kenyan business environment. Washington
DC: World Bank
Wright, P. M., & McMahan, G. C. (1992) Theoretical perspectives for strategic human
resource management. Journal of Management, 18, 295-320
Yang, C., & Chen, K. (2009). Are small firms less efficient? Small Business Economics,
32(4), 375-395
Yuan-Yao, F., Wei-Hwa P., Yueh-Chuen, H., & Yan-Kwang, C. (2009). The effect of
firm‟s resources and capabilities on its performance of ICT design industry in
Taiwan. Information Technology Journal, 8(5), 688-697
Zikmund, W.G. (2000). Exploring marketing research, 7th Edition, Dryden Press
Zimmerman, D. W. (1998). Invalidation of parametric and nonparametric statistical tests
by concurrent violation of two assumptions. Journal of Experimental Education,
67, 55-68
Zucker, L. G. (1987). Institutional theories of organizations. Annual Review of Sociology,
13, 443-464
Zulkiffli, S., & Perera, N. (2011). A literature analysis on business performance for
SMES - subjective or objective measures? 2011 SIBR Conference on
Interdisciplinary Business and Economics Research, 1-9. Bangkok, Thailand

180
APPENDICES
Appendix I: Letter of Introduction for Data Collection

181
Appendix II: Letter of Request for Permission to Collect Data
KENYA FORESTRY RESEARCH INSTITUTE
Coast Eco Region Research Programme - Gede
Telkom Wireless:+254-20-23S6358 P.O. Box 1078 – 80200
E-mail:cdgcde@ke fri.org Malindi KENYA
Ref: GRRC/1/4/93 Date: 25th March 2014
TO WHOM IT MAY CONCERN
This questionnaire has been designed to gather information on the performance of
business organizations dealing with non-timber forest products. This is purely an
academic exercise conducted under the framework of Kenya Forestry Research Institute
(KEFRI) and the School of Business, University of Nairobi towards meeting the
requirements for my award of the degree of Doctor of Philosophy in Business
Administration.
You are kindly requested to spare a few minutes to respond to the questions by ticking
appropriate choices that reflect your general impressions/perceptions. The information
that you provide will be treated with utmost confidentiality and in no instance will your
name or that of your organization be mentioned in the report. I have attached a letter from
the university certifying my candidature and a copy of the questionnaire. The findings of
this study will be availed to you upon request.
Thanking you in advance.
Yours faithfully
Linus Wekesa
Social Economist/PhD. Candidate

182
Appendix III: Questionnaire for Small and Medium Enterprises in the Non-timber
Forest Products Sub-sector
Business organization Code………… Name ……………………………………….
Part I: Bio Data
1. Your job title in the business organization (tick)
i. Owner/Director ……………………………………………………....... [ ]
ii. Chairman ……………………………………………………………… [ ]
iii. Manager ………………………………………………………………. [ ]
iv. Other (specify…………………………………………)..……………... [ ]
2. Products/services provided by business organization
i What is the nature of products you deal with? (tick)
a. Fruits ………………………………………………………….. [ ]
b. Medicinal ………………………………………………………. [ ]
c. Bee products …………………………………………………… [ ]
d. Others (specify ………………………………………….)…….. [ ]
ii How many products of the above (in 2(i)) do you deal with? (tick)
a. One ……………………………………...……………………… [ ]
b. Two ……..………………………………………...……………. [ ]
c. Three …….…………………………………………...……….... [ ]
d. More than three ……………………………………...………… [ ]
3. Legal status of the business organization (tick)
i. Sole proprietorship ……………………………………………………..[ ]
ii. Partnership …………………………………………………………….. [ ]
iii. Limited Company ……………………………………………………... [ ]
iv. Cooperative society/self-help group ……….………………………….. [ ]
4. How old is this business organization? (tick)
i 0 – 5 years …………………………………………………………….. [ ]
ii 6 – 10 years ………………………………………………………….... [ ]
iii 11 – 20 years ………………………………………………………….[ ]
iv Over 20 years ………………………………………………………...[ ]
5. Year when business was registered ………………………...
6. Telephone contact of business ……………………………...

183
Part II: Entrepreneur Characteristics
7. What is your age bracket amongst the following? (Tick as appropriate)
i. Below 20 years ……………………….. [ ]
ii. 20 – 29 years ……………………………[ ]
iii. 30 – 39 years ………………………….. [ ]
iv. 40 – 49 years …………………………… [ ]
v. 50 – 59 years …………………………… [ ]
vi. Over 60 years ………………………….. [ ]
8. Gender: Male ( ) Female ( )
9. Highest level of education attained
i. Primary School ………..………………. [ ]
ii. Secondary School ……………………… [ ]
iii. Tertiary ……………………………….…[ ]
iv. Others (specify……………………….). . [ ]
10. How long have you been involved in a managerial position or in running the
business? (tick)
i 0 – 5 years ………..………………… [ ]
ii 6 – 10 years ………..……………….. [ ]
iii 11 – 20 years ………..………………. [ ]
iv over 20 years ………..………………. [ ]
11. Social clubs, groups and organizations
(i) Do you belong to any social club, group or organization? (tick) Yes [ ] No [ ]
(ii) If yes in (i) above, how many social clubs, groups or organizations do you belong
to?
a. One ………..…………………………. [ ]
b. Two ………..……………………….... [ ]
c. Three ………..……………………….. [ ]
d. Over three ………..……………….…. [ ]
12. Managerial skills
(i) Have you undertaken any training to enhance your managerial skills? (tick) Yes
[ ] No [ ]
(ii) If yes in (i) above, indicate the number of trainings you have undertaken within
last the 5 years

184
a. One ………..…………………………. [ ]
b. Between two to five ………..………... [ ]
c. Between six to ten ………..………….. [ ]
d. Over ten ………..……………….……. [ ]
Part III: Competitive strategy
13. To what extent do you implement the following strategy drivers in enhancing the
competitiveness of your business organization? Use the scale provided to TICK appropriate
response concerning the implementation of the strategy drivers.
Scale: 1= to a great extent 2=high extent 3=moderately 4=small extent 5=Not at all
a. Unique Drivers Approach used 1 2 3 4 5
i. We always brand our products and make them
unique [ ] [ ] [ ] [ ] [ ]
ii. Our products are always packaged with clear labels [ ] [ ] [ ] [ ] [ ]
iii. We apply pricing strategy to differentiate our
products [ ] [ ] [ ] [ ] [ ]
b. Focus Drivers
Approach used 1 2 3 4 5
i We always strive to learn and adhere to customer
needs [ ] [ ] [ ] [ ] [ ]
ii We always try out new ways of service delivery [ ] [ ] [ ] [ ] [ ]
iii We always make quick responses to market changes [ ] [ ] [ ] [ ] [ ]
iv We have been consistent in our market strategy
selection [ ] [ ] [ ] [ ] [ ]
c. Cost Drivers
Approach used 1 2 3 4 5
i We always concentrate on process improvements [ ] [ ] [ ] [ ] [ ]
ii We have adopted newer technologies in our
products [ ] [ ] [ ] [ ] [ ]
iii We always observe and maintain cost cutting
measures [ ] [ ] [ ] [ ] [ ]
iv We strive to gain highest leverage per shilling spent [ ] [ ] [ ] [ ] [ ]

185
Part IV: Firm Institutions
(i) Resource Based Firm Institutions
14. To what extent are the following firm level resources availed for use by your business
organization? Use the scale provided to TICK appropriately
Scale: 1= to a great extent 2=high extent 3=moderately 4=small extent 5=Not at all
Firm Level Resources 1 2 3 4 5 i. Enough financial resources provided to all departments/ sections to
carry out key tasks of strategy implementation [ ] [ ] [ ] [ ] [ ]
ii. Serious consideration is placed on the skills and competency
development of staff in our strategic decision making process [ ] [ ] [ ] [ ] [ ]
iii. Need for retraining the workforce and management of change has
always been taken into account [ ] [ ] [ ] [ ] [ ]
iv. Management Style applied ensures that there is enough qualified and
professional staff to implement organizational strategy [ ] [ ] [ ] [ ] [ ]
v. Possession of tacit/implicit/intangible knowledge is embedded in the
organizational culture [ ] [ ] [ ] [ ] [ ]
vi. Rare, valuable, and imperfectly imitable organizational culture [ ] [ ] [ ] [ ] [ ]
vii. Emphasis on continuous learning on how to do things better [ ] [ ] [ ] [ ] [ ]
viii. Emphasis on having highly charged, motivated and loyal employees [ ] [ ] [ ] [ ] [ ]
ix. Organization possesses highly valued and rare resources [ ] [ ] [ ] [ ] [ ]
(ii) Administrative Based Firm Institutions
15. Specify to what extent the following administrative based firm institutions are true in
your organization by TICKING appropriately.
Use the scale where 1= to a great extent 2=high extent 3=moderately 4=small extent 5=
not at all
Administrative Based Firm Institutions 1 2 3 4 5
i. Whenever there is need, appropriate and suitable organizational
structure has always been put in place to support the implementation
of strategy [ ] [ ] [ ] [ ] [ ]
ii. Management style is clear assigning responsibility of various tasks of
strategic implementation [ ] [ ] [ ] [ ] [ ]
iii. The management systems used have always been adapted to support
strategy implementation [ ] [ ] [ ] [ ] [ ]
iv. The work processes are highly automated [ ] [ ] [ ] [ ] [ ]
v. Decision making process is highly decentralized [ ] [ ] [ ] [ ] [ ]
vi. Internal Controls to manage resources put in place and functional [ ] [ ] [ ] [ ] [ ]
vii. Various systems and processes have been enforced to closely monitor
what individuals are expected to do [ ] [ ] [ ] [ ] [ ]

186
viii. Clear working procedure are defined and applied in the strategy
implementation process [ ] [ ] [ ] [ ] [ ]
Part V: Firm Performance
(i) Financial Performance Indicators
16. What is the average annual sales made by your business organization in last five
years? (Tick)
Annual sales (Ksh) 2009 2010 2011 2012 2013
i. <100,000 [ ] [ ] [ ] [ ] [ ]
ii. 100,001 – 500,000 [ ] [ ] [ ] [ ] [ ]
iii. 500,001 – 1,000,000 [ ] [ ] [ ] [ ] [ ]
iv. 1,000,001 – 5,000,000 [ ] [ ] [ ] [ ] [ ]
v. 5,000,001 – 10,000,000 [ ] [ ] [ ] [ ] [ ]
vi. 10,000, 001 – 20,000,000 [ ] [ ] [ ] [ ] [ ]
vii. 20,000,001 – 30,000,000 [ ] [ ] [ ] [ ] [ ]
viii. 30,000,001 – 50,000,000 [ ] [ ] [ ] [ ] [ ]
ix. 50,000,001 – 100,000,000. [ ] [ ] [ ] [ ] [ ]
x. 100,000,001 – 200,000,000 [ ] [ ] [ ] [ ] [ ]
xi. 200,000,001 – 500,000,000 [ ] [ ] [ ] [ ] [ ]
xii. >500,000,000 [ ] [ ] [ ] [ ] [ ]
17. What is the annual net profits made from your business organization for the last five
years? (Tick)
Annual net profit (Ksh) 2009 2010 2011 2012 2013
i. <100,000 [ ] [ ] [ ] [ ] [ ]
ii. 100,001 - 500,000 [ ] [ ] [ ] [ ] [ ]
iii. 500,001– 1,000,000 [ ] [ ] [ ] [ ] [ ]
iv. 1,000,001 – 5,000,000 [ ] [ ] [ ] [ ] [ ]
v. 5,000,001 – 10,000,000 [ ] [ ] [ ] [ ] [ ]
vi. 10,000,001 – 20,000,000 [ ] [ ] [ ] [ ] [ ]
vii. 20,000,001 – 50,000,000 [ ] [ ] [ ] [ ] [ ]
viii. 50,000,001 – 100,000,000 [ ] [ ] [ ] [ ] [ ]
ix. >100,000,000 [ ] [ ] [ ] [ ] [ ]

187
18. To what extent do you agree with the following statements indicating that your
financial performance has been superior to your competition? Use the scale provided
to TICK:
Key: 1= strongly agree; 2 = agree; 3 = indifferent; 4 = disagree; 5 = strongly disagree
Factor 1 2 3 4 5
i. Our business firm annual sales have been on an upward trend
over the past five years [ ] [ ] [ ] [ ] [ ]
ii. Our business firm annual net profit margins have been on an
upward trend over past 5 years [ ] [ ] [ ] [ ] [ ]
(ii) Non-Financial indicators
19. What is the average percentage market coverage that your business organization
commands for its products/services in the last five years? (Tick)
Average market coverage () 2009 2010 2011 2012 2013
<5 [ ] [ ] [ ] [ ] [ ]
6 – 10 [ ] [ ] [ ] [ ] [ ]
11 – 15 [ ] [ ] [ ] [ ] [ ]
16 – 20 [ ] [ ] [ ] [ ] [ ]
21 – 50 [ ] [ ] [ ] [ ] [ ]
> 50 [ ] [ ] [ ] [ ] [ ]
20. To what extent do you agree with the following statements indicating that your non-
financial performance has been superior to your competition? Use the keys provided
to TICK:
Key: 1= strongly agree; 2 = agree; 3 = indifferent; 4 = disagree; 5 = strongly disagree
Factor 1 2 3 4 5
i. The organization has a good reputation [ ] [ ] [ ] [ ] [ ]
ii. The organization protects its business domain aggressively [ ] [ ] [ ] [ ] [ ]
iii. The organization has continued to expand its market coverage [ ] [ ] [ ] [ ] [ ]
iv. The processes of service delivery are efficient [ ] [ ] [ ] [ ] [ ]
v. Quality of management system in the organization is high [ ] [ ] [ ] [ ] [ ]
vi. Clients are satisfied with goods/services of organization [ ] [ ] [ ] [ ] [ ]
vii. The organization‟s number of employees has been on an
upward trend over past 5 years [ ] [ ] [ ] [ ] [ ]
21. What is the number of employees in this business organization?
Less than 5 ……………………………………………. [ ]
5-15 …………………………………………………… [ ]
16-25 ……………………………………………….…. [ ]
26-50 ………………………………………………….. [ ]
51-99 ………………………………………………….. [ ]
Over 99 ……………………………………………….. [ ]

188
Appendix IV: Population of Small and Medium Enterprises in the Non-timber
Forest Products Sub-sector in Kenya
County Number of SMEs Percentage (%)
1 Mombasa 211 12
2 Kwale 56 3
3 Kilifi 78 3
4 Tana River 41 2
5 Lamu 34 2
6 Taita-Taveta 36 2
7 Garissa 47 3
8 Wajir 43 3
9 Mandera 35 2
10 Marsabit 56 3
11 Isiolo 69 3
12 Meru 34 2
13 Tharaka-Nithi 23 1
14 Embu 35 2
15 Kitui 88 3
16 Machakos 45 3
17 Makueni 56 3
18 Nyandarua - 0
19 Nyeri - 0
20 Kirinyaga - 0
21 Murang'a - 0
22 Kiambu 10 1
23 Turkana 21 1
24 West Pokot 15 1
25 Samburu 12 1
26 Trans Nzoia - 0
27 Uasin Gishu - 2
28 Elgeyo-Marakwet 11 1
29 Nandi - 0
30 Baringo 17 1
31 Laikipia 16 1
32 Nakuru 24 2
33 Narok 31 2
34 Kajiado 44 3
35 Kericho - 0
36 Bomet - 0
37 Kakamega 23 1
38 Vihiga - 0
39 Bungoma - 0
40 Busia - 0
41 Siaya - 0
42 Kisumu - 2
43 Homa Bay 15 1
44 Migori 16 1
45 Kisii - 0
46 Nyamira - 0
47 Nairobi 470 27
TOTAL 1712 100
Source: Compilation from April 2013 Databases of Counties, KEBS, KEFRI and KFS

189
Appendix V: Map of Kenya Showing Nine Counties where Data was Collected
Source: Kenya Open Data Project, 2012
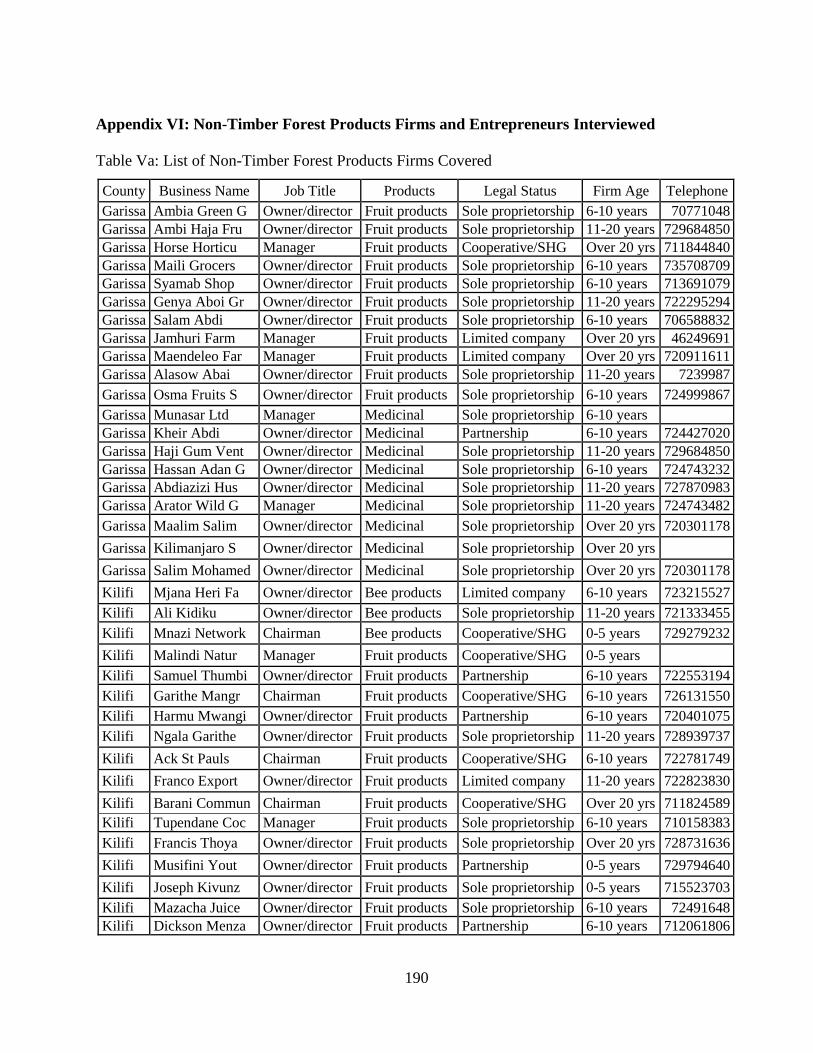
190
Appendix VI: Non-Timber Forest Products Firms and Entrepreneurs Interviewed
Table Va: List of Non-Timber Forest Products Firms Covered
County Business Name Job Title Products Legal Status Firm Age Telephone
Garissa Ambia Green G Owner/director Fruit products Sole proprietorship 6-10 years 70771048
Garissa Ambi Haja Fru Owner/director Fruit products Sole proprietorship 11-20 years 729684850
Garissa Horse Horticu Manager Fruit products Cooperative/SHG Over 20 yrs 711844840
Garissa Maili Grocers Owner/director Fruit products Sole proprietorship 6-10 years 735708709
Garissa Syamab Shop Owner/director Fruit products Sole proprietorship 6-10 years 713691079
Garissa Genya Aboi Gr Owner/director Fruit products Sole proprietorship 11-20 years 722295294
Garissa Salam Abdi Owner/director Fruit products Sole proprietorship 6-10 years 706588832
Garissa Jamhuri Farm Manager Fruit products Limited company Over 20 yrs 46249691
Garissa Maendeleo Far Manager Fruit products Limited company Over 20 yrs 720911611
Garissa Alasow Abai Owner/director Fruit products Sole proprietorship 11-20 years 7239987
Garissa Osma Fruits S Owner/director Fruit products Sole proprietorship 6-10 years 724999867
Garissa Munasar Ltd Manager Medicinal Sole proprietorship 6-10 years
Garissa Kheir Abdi Owner/director Medicinal Partnership 6-10 years 724427020
Garissa Haji Gum Vent Owner/director Medicinal Sole proprietorship 11-20 years 729684850
Garissa Hassan Adan G Owner/director Medicinal Sole proprietorship 6-10 years 724743232
Garissa Abdiazizi Hus Owner/director Medicinal Sole proprietorship 11-20 years 727870983
Garissa Arator Wild G Manager Medicinal Sole proprietorship 11-20 years 724743482
Garissa Maalim Salim Owner/director Medicinal Sole proprietorship Over 20 yrs 720301178
Garissa Kilimanjaro S Owner/director Medicinal Sole proprietorship Over 20 yrs
Garissa Salim Mohamed Owner/director Medicinal Sole proprietorship Over 20 yrs 720301178
Kilifi Mjana Heri Fa Owner/director Bee products Limited company 6-10 years 723215527
Kilifi Ali Kidiku Owner/director Bee products Sole proprietorship 11-20 years 721333455
Kilifi Mnazi Network Chairman Bee products Cooperative/SHG 0-5 years 729279232
Kilifi Malindi Natur Manager Fruit products Cooperative/SHG 0-5 years
Kilifi Samuel Thumbi Owner/director Fruit products Partnership 6-10 years 722553194
Kilifi Garithe Mangr Chairman Fruit products Cooperative/SHG 6-10 years 726131550
Kilifi Harmu Mwangi Owner/director Fruit products Partnership 6-10 years 720401075
Kilifi Ngala Garithe Owner/director Fruit products Sole proprietorship 11-20 years 728939737
Kilifi Ack St Pauls Chairman Fruit products Cooperative/SHG 6-10 years 722781749
Kilifi Franco Export Owner/director Fruit products Limited company 11-20 years 722823830
Kilifi Barani Commun Chairman Fruit products Cooperative/SHG Over 20 yrs 711824589
Kilifi Tupendane Coc Manager Fruit products Sole proprietorship 6-10 years 710158383
Kilifi Francis Thoya Owner/director Fruit products Sole proprietorship Over 20 yrs 728731636
Kilifi Musifini Yout Owner/director Fruit products Partnership 0-5 years 729794640
Kilifi Joseph Kivunz Owner/director Fruit products Sole proprietorship 0-5 years 715523703
Kilifi Mazacha Juice Owner/director Fruit products Sole proprietorship 6-10 years 72491648
Kilifi Dickson Menza Owner/director Fruit products Partnership 6-10 years 712061806

191
County Business Name Job Title Products Legal Status Firm Age Telephone
Kilifi Safina Handcr Owner/director Fruit products Partnership 11-20 years 734512446
Kilifi Festus Ngala Owner/director Fruit products Sole proprietorship Over 20 yrs 704213800
Kilifi Bayusufu Farm Manager Fruit products Partnership 6-10 years 721172340
Kilifi Muyoma Patric Owner/director Fruit products Sole proprietorship 11-20 years 733799534
Kilifi Masline Mitza Owner/director Fruit products Sole proprietorship 0-5 years 722533385
Kilifi Galana Farmer Manager Fruit products Cooperative/SHG 6-10 years 703277033
Kilifi Munzaa Mutind Owner/director Fruit products Sole proprietorship 0-5 years 727122051
Kilifi Tarumbeta Wom Chairman Medicinal Cooperative/SHG 6-10 years 722480819
Kilifi Rescue Women Chairman Medicinal Cooperative/SHG 0-5 years 710345025
Kilifi Ruruma Farmer Other Medicinal Cooperative/SHG 6-10 years 719577587
Kilifi Mkuzi Joha Owner/director Medicinal Sole proprietorship 0-5 years 706369405
Kitui Milsam Owner/director Bee products Sole proprietorship 0-5 years 702615656
Kitui Bidii Bee Kee Owner/director Bee products Sole proprietorship Over 20 yrs 720761973
Kitui Samson Muthag Owner/director Bee products Sole proprietorship 11-20 years 727485984
Kitui Ngulu Kimenyi Owner/director Bee products Sole proprietorship 6-10 years 701106754
Kitui Zayab Khamis Owner/director Fruit products Sole proprietorship 6-10 years 722969503
Kitui Muhidin Abuu Owner/director Fruit products Sole proprietorship 0-5 years 724508325
Kitui Khadija Bakar Owner/director Fruit products Sole proprietorship 11-20 years 715245400
Kitui Chuluni Horti Manager Fruit products Cooperative/SHG 6-10 years 729352399
Kitui Paul Syengo S Owner/director Fruit products Sole proprietorship 11-20 years
Kitui Maingi Kiema Owner/director Fruit products Sole proprietorship 11-20 years 722610228
Kitui Kavisa Kaula Other Fruit products Partnership 6-10 years 718488382
Kitui Mwanzia Maing Owner/director Fruit products Partnership 6-10 years 72674820
Kitui Gideon Kihind Owner/director Fruit products Partnership 6-10 years 725013007
Kitui David Ngondi Owner/director Fruit products Partnership 11-20 years 713056601
Kitui Afred Mbiti N Manager Fruit products Sole proprietorship Over 20 yrs 726638782
Kitui Racheal Ngina Manager Fruit products Sole proprietorship 0-5 years
Kitui Joseph Mwango Manager Fruit products Sole proprietorship Over 20 yrs 727348245
Kitui Dominic Kivoi Owner/director Medicinal Sole proprietorship 11-20 years 724470968
Kitui Malonza Farm Owner/director Medicinal Sole proprietorship 0-5 years 712127016
Kwale Msambweni Bee Chairman Bee products Cooperative/SHG 6-10 years 734373766
Kwale Chitsanze Fal Chairman Bee products Partnership 6-10 years 726012188
Kwale Kwale
Maphombe Chairman Bee products Cooperative/SHG 6-10 years 714705556
Kwale Asili Ya Asal Chairman Bee products Cooperative/SHG 0-5 years 721423253
Kwale Vanga Youth G Chairman Bee products Cooperative/SHG 0-5 years 728050557
Kwale Jimbo Environ Other Bee products Cooperative/SHG 6-10 years 702692034
Kwale Mwambiweje Wo Chairman Bee products Cooperative/SHG 11-20 years 720249630
Kwale Mkwajuni Slef Chairman Fruit products Cooperative/SHG 0-5 years 706108585
Kwale Suleiman Baka Owner/director Fruit products Sole proprietorship 0-5 years
Kwale Tumaini Youth Other Fruit products Cooperative/SHG Over 20 yrs 712778397
Kwale Ukunda Sc Mak Chairman Fruit products Cooperative/SHG 0-5 years 717789379
Kwale Malani Fruit Chairman Fruit products Sole proprietorship 0-5 years 716111783
Kwale Swaleh Mushee Owner/director Fruit products Sole proprietorship 11-20 years 704973457

192
County Business Name Job Title Products Legal Status Firm Age Telephone
Kwale Kilulu Self H Chairman Fruit products Cooperative/SHG 0-5 years 714705556
Kwale Msabweni Coco Chairman Fruit products Cooperative/SHG 6-10 years 724146850
Kwale Masika Selema Owner/director Fruit products Sole proprietorship 0-5 years
Kwale Tumaini Self Chairman Fruit products Cooperative/SHG 0-5 years 713936162
Kwale Aloe Producti Chairman Medicinal Partnership 6-10 years 713094547
Kwale Tomoni Farms Owner/director Medicinal Limited company 0-5 years 720934006
Kwale Upendo Magon Chairman Medicinal Partnership 6-10 years 729176792
Kwale Choir Supplie Owner/director Others Sole proprietorship 6-10 years 722365058
Machakos Sobete Genera Owner/director Bee products Sole proprietorship 6-10 years 727789748
Machakos James Mbuthia Owner/director Bee products Sole proprietorship 6-10 years 721407003
Machakos Masala Beekep Chairman Bee products Sole proprietorship Over 20 yrs 724562326
Machakos Makiyika Mang Chairman Fruit products Cooperative/SHG 6-10 years 736942526
Machakos Gleen Quoich Owner/director Fruit products Limited company 6-10 years 724817593
Machakos Makueni Fruit Chairman Fruit products Cooperative/SHG 0-5 years 7221905714
Machakos Mbae Farm Owner/director Fruit products Sole proprietorship 6-10 years 724271214
Machakos Makueni Herba Manager Medicinal Cooperative/SHG 6-10 years 713419743
Makueni Christine Mul Owner/director Bee products Sole proprietorship 6-10 years 713879075
Makueni Nzukini Heny Manager Bee products Cooperative/SHG 11-20 years 727724811
Makueni Catherine Usa Owner/director Bee products Sole proprietorship
Makueni Ndambu Manzo Owner/director Bee products Sole proprietorship Over 20 yrs 718959099
Makueni Jane Ngina Mu Owner/director Bee products Sole proprietorship Over 20 yrs 712007943
Makueni Agnes Mutua Chairman Bee products Cooperative/SHG Over 20 yrs 721655278
Makueni Mukunzu Mwa Owner/director Bee products Sole proprietorship Over 20 yrs
Makueni John Mwanthi Owner/director Bee products Sole proprietorship Over 20 yrs 729319993
Makueni Julius Masia Owner/director Bee products Sole proprietorship Over 20 yrs 726129878
Makueni Nthenya Muli Owner/director Fruit products Sole proprietorship 11-20 years 720676717
Makueni Nathaniel Mak Owner/director Fruit products Sole proprietorship 6-10 years 729320317
Makueni Agnes Munini Owner/director Fruit products Sole proprietorship Over 20 yrs 723932327
Makueni Martha Matuku Owner/director Fruit products Sole proprietorship Over 20 yrs 714883011
Makueni Dancan Mutie Owner/director Medicinal Sole proprietorship 0-5 years 726780047
Makueni Kasmona Herba Owner/director Medicinal Sole proprietorship 6-10 years 712468323
Makueni Toru Health C Manager Medicinal Cooperative/SHG 11-20 years 721386961
Mombasa Kipepeo Proje Manager Bee products Partnership Over 20 yrs 719671161
Mombasa Honey Care Li Owner/director Bee products Limited company 11-20 years 722590788
Mombasa Kenya Nuts Co Manager Fruit products Limited company Over 20 yrs 721748915
Mombasa Wondernut Ken Manager Fruit products Limited company 11-20 years 412318932
Mombasa Millennium Ma Manager Fruit products Limited company 11-20 years 722983232
Mombasa Dahman Green Owner/director Fruit products Sole proprietorship 11-20 years 721253887
Mombasa Ziwani Self H Chairman Fruit products Partnership 11-20 years 720712114
Mombasa Nasur Coconut Manager Fruit products Sole proprietorship 11-20 years 724380761
Mombasa Maina John Owner/director Fruit products Sole proprietorship 6-10 years 710680781

193
County Business Name Job Title Products Legal Status Firm Age Telephone
Mombasa Peter Ndolo I Owner/director Fruit products Sole proprietorship Over 20 yrs 721399794
Mombasa Salim Mango I Owner/director Fruit products Sole proprietorship 6-10 years 700726383
Mombasa Macharia Mang Owner/director Fruit products Sole proprietorship 11-20 years 729223011
Mombasa Games Muyoke Owner/director Fruit products Sole proprietorship 11-20 years 728765752
Mombasa Pari Investme Manager Fruit products Partnership 11-20 years 712519052
Mombasa Musyoka Mutua Owner/director Fruit products Sole proprietorship Over 20 yrs
Mombasa Danson Joshua Chairman Fruit products Cooperative/SHG 6-10 years 713689137
Mombasa Hidaya Rajabu Owner/director Fruit products Sole proprietorship 11-20 years 700483094
Mombasa Daniel Mukui Owner/director Fruit products Sole proprietorship Over 20 yrs 722768268
Mombasa Barisa Baya Owner/director Fruit products Sole proprietorship 11-20 years 7103835565
Mombasa Karuku Enterp Owner/director Fruit products Sole proprietorship 11-20 years 720655671
Mombasa Wild Remedies Owner/director Medicinal Sole proprietorship 11-20 years 727484526
Mombasa Waqash Enterp Owner/director Medicinal Limited company 6-10 years 722410942
Mombasa Neem Tea Pack Manager Medicinal Limited company 11-20 years 720708031
Mombasa Great Lakes C Owner/director Medicinal Limited company 11-20 years 735677777
Mombasa Navida Natura Manager Medicinal Limited company 6-10 years 738321038
Mombasa Kentex Ltd Manager Medicinal Limited company 11-20 years 722843743
Mombasa Kenta Ltd Manager Medicinal Limited company 11-20 years 722843743
Mombasa Jailal Servic Owner/director Medicinal Limited company 11-20 years 72224752
Mombasa Matano Copra Owner/director Medicinal Sole proprietorship 6-10 years 728704582
Mombasa Honest Indust Manager Medicinal Limited company 11-20 years 722382078
Mombasa Harnest Indus Manager Medicinal Limited company 11-20 years 722382078
Mombasa G-Cline Limit Owner/director Medicinal Limited company 11-20 years 720644655
Mombasa Ngagi Enterpr Owner/director Medicinal Sole proprietorship 6-10 years 714846206
Mombasa Salim Nut Sel Owner/director Medicinal Sole proprietorship 11-20 years 727842438
Mombasa Nuru Mwkudha Manager Medicinal Partnership 11-20 years 710841492
Mombasa Grace Gitau Owner/director Medicinal Sole proprietorship 11-20 years 726988781
Mombasa Omar Hassan M Owner/director Medicinal Sole proprietorship 6-10 years 710114374
Mombasa Kariuki John Owner/director Medicinal Sole proprietorship 0-5 years 7230446198
Mombasa Kamau Mango Owner/director Medicinal Sole proprietorship 11-20 years 729223011
Mombasa Hussein Cocon Owner/director Medicinal Sole proprietorship 11-20 years 722258240
Mombasa Kazungu Fruit Owner/director Medicinal Sole proprietorship Over 20 yrs 723775258
Mombasa Mama Riziki H Owner/director Medicinal Sole proprietorship Over 20 yrs 711973760
Mombasa Lima Self Hel Chairman Medicinal Partnership 11-20 years 725660113
Mombasa Hinzano Herba Owner/director Medicinal Sole proprietorship Over 20 yrs 725403624
Mombasa Tabu Kazungu Owner/director Medicinal Sole proprietorship 6-10 years 702968458
Nairobi Janester Ente Manager Bee products Partnership 11-20 years 722382679
Nairobi Back To Natur Manager Bee products Partnership 11-20 years 722387136
Nairobi Benflo Qualit Owner/director Bee products Sole proprietorship 6-10 years 721239195
Nairobi Care Africa Owner/director Bee products Sole proprietorship 0-5 years 733470356
Nairobi Innovative Fo Manager Bee products Sole proprietorship 6-10 years 716635248
Nairobi Rosana Horney Chairman Bee products Partnership 11-20 years 716166000
Nairobi Peak Performa Manager Bee products Sole proprietorship 6-10 years 202051708
Nairobi Liberty Garde Manager Bee products Sole proprietorship 0-5 years 721929715
Nairobi Octagon Ventur Manager Bee products Limited company 6-10 years 720362084
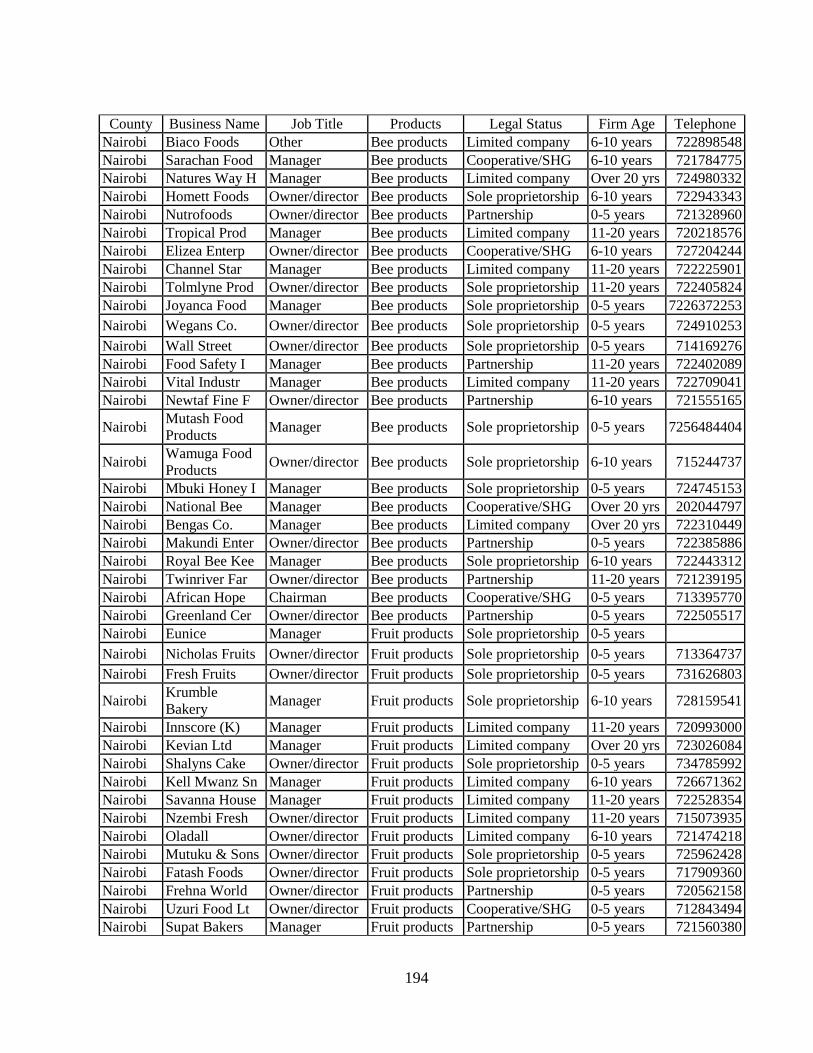
194
County Business Name Job Title Products Legal Status Firm Age Telephone
Nairobi Biaco Foods Other Bee products Limited company 6-10 years 722898548
Nairobi Sarachan Food Manager Bee products Cooperative/SHG 6-10 years 721784775
Nairobi Natures Way H Manager Bee products Limited company Over 20 yrs 724980332
Nairobi Homett Foods Owner/director Bee products Sole proprietorship 6-10 years 722943343
Nairobi Nutrofoods Owner/director Bee products Partnership 0-5 years 721328960
Nairobi Tropical Prod Manager Bee products Limited company 11-20 years 720218576
Nairobi Elizea Enterp Owner/director Bee products Cooperative/SHG 6-10 years 727204244
Nairobi Channel Star Manager Bee products Limited company 11-20 years 722225901
Nairobi Tolmlyne Prod Owner/director Bee products Sole proprietorship 11-20 years 722405824
Nairobi Joyanca Food Manager Bee products Sole proprietorship 0-5 years 7226372253
Nairobi Wegans Co. Owner/director Bee products Sole proprietorship 0-5 years 724910253
Nairobi Wall Street Owner/director Bee products Sole proprietorship 0-5 years 714169276
Nairobi Food Safety I Manager Bee products Partnership 11-20 years 722402089
Nairobi Vital Industr Manager Bee products Limited company 11-20 years 722709041
Nairobi Newtaf Fine F Owner/director Bee products Partnership 6-10 years 721555165
Nairobi Mutash Food
Products Manager Bee products Sole proprietorship 0-5 years 7256484404
Nairobi Wamuga Food
Products Owner/director Bee products Sole proprietorship 6-10 years 715244737
Nairobi Mbuki Honey I Manager Bee products Sole proprietorship 0-5 years 724745153
Nairobi National Bee Manager Bee products Cooperative/SHG Over 20 yrs 202044797
Nairobi Bengas Co. Manager Bee products Limited company Over 20 yrs 722310449
Nairobi Makundi Enter Owner/director Bee products Partnership 0-5 years 722385886
Nairobi Royal Bee Kee Manager Bee products Sole proprietorship 6-10 years 722443312
Nairobi Twinriver Far Owner/director Bee products Partnership 11-20 years 721239195
Nairobi African Hope Chairman Bee products Cooperative/SHG 0-5 years 713395770
Nairobi Greenland Cer Owner/director Bee products Partnership 0-5 years 722505517
Nairobi Eunice Manager Fruit products Sole proprietorship 0-5 years
Nairobi Nicholas Fruits Owner/director Fruit products Sole proprietorship 0-5 years 713364737
Nairobi Fresh Fruits Owner/director Fruit products Sole proprietorship 0-5 years 731626803
Nairobi Krumble
Bakery Manager Fruit products Sole proprietorship 6-10 years 728159541
Nairobi Innscore (K) Manager Fruit products Limited company 11-20 years 720993000
Nairobi Kevian Ltd Manager Fruit products Limited company Over 20 yrs 723026084
Nairobi Shalyns Cake Owner/director Fruit products Sole proprietorship 0-5 years 734785992
Nairobi Kell Mwanz Sn Manager Fruit products Limited company 6-10 years 726671362
Nairobi Savanna House Manager Fruit products Limited company 11-20 years 722528354
Nairobi Nzembi Fresh Owner/director Fruit products Limited company 11-20 years 715073935
Nairobi Oladall Owner/director Fruit products Limited company 6-10 years 721474218
Nairobi Mutuku & Sons Owner/director Fruit products Sole proprietorship 0-5 years 725962428
Nairobi Fatash Foods Owner/director Fruit products Sole proprietorship 0-5 years 717909360
Nairobi Frehna World Owner/director Fruit products Partnership 0-5 years 720562158
Nairobi Uzuri Food Lt Owner/director Fruit products Cooperative/SHG 0-5 years 712843494
Nairobi Supat Bakers Manager Fruit products Partnership 0-5 years 721560380

195
County Business Name Job Title Products Legal Status Firm Age Telephone
Nairobi George Manager Fruit products Sole proprietorship 6-10 years 728159541
Nairobi New Ebenezer Manager Fruit products Partnership 11-20 years 718750776
Nairobi Agnes Mwangi Owner/director Fruit products Sole proprietorship 0-5 years 720450271
Nairobi Deepa Industries Manager Fruit products Partnership 6-10 years 727967176
Nairobi Sweet Gardens Chairman Fruit products Sole proprietorship 0-5 years 727798867
Nairobi J. T. Enterpr Manager Fruit products Sole proprietorship 0-5 years 723456529
Nairobi Gladys Fruitp Owner/director Fruit products Sole proprietorship 11-20 years 723813495
Nairobi Mama Njoki's Owner/director Fruit products Sole proprietorship 11-20 years 722449671
Nairobi Sammy Fruit S Manager Fruit products Sole proprietorship 0-5 years 727667931
Nairobi Julius Brothe Owner/director Fruit products Sole proprietorship 11-20 years 717386170
Nairobi Ebenezer Juice Manager Fruit products Partnership 0-5 years 710431309
Nairobi Matunda Green Owner/director Fruit products Sole proprietorship 6-10 years 723701619
Nairobi Nanjala Ltd C Manager Fruit products Limited company 6-10 years 722238767
Nairobi Californian C Manager Fruit products Limited company Over 20 yrs 721247757
Nairobi Lily's Chairman Fruit products Sole proprietorship 0-5 years 728536562
Nairobi Inscor Kenya Owner/director Fruit products Limited company Over 20 yrs 720067511
Nairobi Krumble Cake Manager Fruit products Limited company 6-10 years 700329891
Nairobi Fresh Fruits Manager Fruit products Partnership 0-5 years 723194618
Nairobi Kimzacks Owner/director Fruit products Sole proprietorship 0-5 years 725009252
Nairobi Mulaa Fruits Manager Fruit products Sole proprietorship 6-10 years 727764232
Nairobi Jazz Touch Owner/director Fruit products Sole proprietorship 0-5 years 721937261
Nairobi Bakers Byte Other Fruit products Sole proprietorship 6-10 years 723628192
Nairobi Nemuua Cereal Chairman Fruit products Partnership 0-5 years 738740805
Nairobi Cookies Mans Owner/director Fruit products Partnership 11-20 years 723952142
Nairobi Ben Enterprise Owner/director Fruit products Partnership 0-5 years 705966509
Nairobi Myks Fruit St Owner/director Fruit products Sole proprietorship 6-10 years 720099171
Nairobi Bobos Manager Fruit products Partnership 0-5 years 700030001
Nairobi Pamoja Superm Manager Fruit products Sole proprietorship 11-20 years 724462206
Nairobi Wholemeal Bak Manager Fruit products Limited company 0-5 years 726924788
Nairobi George Mwangi Owner/director Fruit products Sole proprietorship 0-5 years 724912380
Nairobi Confaire Food Other Fruit products Sole proprietorship 0-5 years 726911841
Nairobi Archies Consu Owner/director Fruit products Sole proprietorship 0-5 years 725901248
Nairobi Cansur Trader Owner/director Fruit products Partnership 0-5 years 720424014
Nairobi Anury Enterpr Owner/director Fruit products Partnership 0-5 years 722996690
Nairobi Mwangis Fruit Owner/director Fruit products Sole proprietorship 11-20 years 721975967
Nairobi Maliq Coz Ven Manager Fruit products Sole proprietorship 0-5 years 700371140
Nairobi Sarah Fruits Owner/director Fruit products Sole proprietorship 0-5 years 720037544
Nairobi Gertobert Ent Manager Fruit products Partnership 6-10 years 722648132
Nairobi Joseph's Fruits Owner/director Fruit products Sole proprietorship 6-10 years 722418905
Nairobi Beyond Fruits Owner/director Fruit products Sole proprietorship 0-5 years 727426844
Nairobi Stephene Fruits Owner/director Fruit products Sole proprietorship 0-5 years 725297945
Nairobi Amarus Foods Owner/director Fruit products Sole proprietorship 0-5 years 725944978

196
County Business Name Job Title Products Legal Status Firm Age Telephone
Nairobi Githurai Inn Other Fruit products Sole proprietorship 6-10 years 729746241
Nairobi Umoja Fresh J Owner/director Fruit products Sole proprietorship 11-20 years 722759312
Nairobi Tabitha Fruit Owner/director Fruit products Sole proprietorship 0-5 years 723468600
Nairobi International Owner/director Medicinal Partnership Over 20 yrs 726584677
Nairobi Makini Herbal Owner/director Medicinal Partnership 11-20 years 700711914
Nairobi Menengai Bro Manager Medicinal Partnership 6-10 years 715894616
Nairobi Specialisties Manager Medicinal Partnership 6-10 years 724546292
Nairobi Kosilo Invest Owner/director Medicinal Partnership 6-10 years 720107472
Nairobi United Aloe H Owner/director Medicinal Partnership 6-10 years 727145061
Nairobi Glen Quioich Manager Medicinal Partnership 6-10 years 729432784
Nairobi Millennium Al Chairman Medicinal Cooperative/SHG 6-10 years 700711914
Nairobi Charag (K) Lt Owner/director Medicinal Partnership 11-20 years
Nairobi Herbal Garden Manager Medicinal Limited company 11-20 years 701821373
Nairobi Mercuto Asali Chairman Medicinal Sole proprietorship 0-5 years 733385968
Nairobi Kates Organic Owner/director Medicinal Limited company 0-5 years 705646581
Nairobi Allspice Manager Medicinal Partnership 0-5 years 715065259
Nairobi Zamichemicals Manager Medicinal Limited company 6-10 years 715789617
Nairobi Kamili Packer Chairman Medicinal Limited company 11-20 years 714264152
Nairobi Balm Industries Chairman Medicinal Limited company 11-20 years 718377400
Nairobi Pick Performa Manager Medicinal Partnership 0-5 years 202051708
Nairobi Homes And Life Owner/director Others Limited company 0-5 years 722609422
Nairobi Primavara Pic Other Others Sole proprietorship 11-20 years 722714275
Nairobi Stop N Snack B Manager Others Sole proprietorship 6-10 years 728277446
Nairobi Supa Sam Snac Owner/director Others Sole proprietorship 11-20 years 720840915
Nairobi Equator Cereals Manager Others Partnership 11-20 years 718465843
Nairobi Jire Cake Shop Manager Others Sole proprietorship 0-5 years 721805665
Nairobi Lenas Confect Manager Others Limited company 0-5 years 710253865
Nairobi Angela Cereals Owner/director Others Partnership 0-5 years 724450455
Table VIb: Summary of Entrepreneurs Interviewed
County Managers Others Owners/chairmen Owners/ Directors TOTAL
Garissa 5
15 20
Kajiado
0
Kilifi 4 1 6 17 28
Kitui 4 1
14 19
Kwale
2 14 5 21
Machakos 1
3 4 8
Makueni 2
1 13 16
Mombasa 13
3 29 45
Nairobi 52 5 9 54 120
TOTAL 81(29%) 9(3%) 36(13%) 151(55%) 277(100%)

197
Appendix VII: Scatter Plots for Dependent and Independent Variables
Scatter Plot of Performance With Entrepreneur Characteristics

198
Scatter Plot of Performance With Competitive Strategy

199
Scatter Plot of Performance With Firm Level Institutions

200
Appendix VIII: Normal Distribution Graphs for Study Dependent Variables
Normal Distribution Curve of Uniqueness Drivers
Normal Q-Q plot of Uniqueness Drivers

201
Normal Distribution Curve of Focus Drivers
Normal Q-Q plot of Focus Drivers

202
Normal Distribution Curve of Cost Drivers
Normal Q-Q plot of Cost Drivers

203
Normal Distribution Curve of Performance
Normal Q-Q Plot of Performance

204
Appendix IX: Correlation Matrix for Performance Metrics
Performance Metrics Performance
Index Final
Annual
Sales
Growth
Rate
Annual
Profit
Growth
Rate
Market
Share Efficiency
Client
Satisfaction
Performance index 1.000 .612** .627** .514** .436** .440**
Annual sales
growth rate
.612** 1.000 .461** .193* .199* .141*
Annual profit
growth rate
.627** .461** 1.000 .223** .154* .140*
Market share .514** .193* .223** 1.000 .726** .418**
Efficiency .436** .199* .154* .726** 1.000 .445**
Client satisfaction .440** .141* .140* .418** .445** 1.000
* Correlation is significant at the 0.05 level (1-tailed)
** Correlation is significant at the 0.01 level (1-tailed)

205
Appendix X: Regression of Entrepreneur Characteristics and Firm Performance
Variables Entered/Removed
a
Model Variables Entered
Variables Removed
Method
1
social skills, highest level of education, age, gender, managerial skills, industry experience
. Enter
a. Dependent Variable: performance index b. All requested variables entered.
Model Summary
Model R R Square Adjusted R Square
Std. Error of the Estimate
1 .467a .218 .196 .78889
a. Predictors: (Constant), social skills, highest level of education, age, gender, managerial skills, industry experience
ANOVA
a
Model Sum of Squares df Mean Square F Sig.
1
Regression 36.663 6 6.110 9.818 .000b
Residual 131.315 211 .622
Total 167.978 217 a. Dependent Variable: performance index b. Predictors: (Constant), social skills, highest level of education, age, gender, managerial skills, industry experience
Coefficients
a
Model Unstandardized Coefficients Standardized Coefficients
t Sig.
B Std. Error Beta
1
(Constant) 1.813 .274 6.611 .000
age -.104 .050 -.142 -2.102 .037
gender .035 .114 .019 .311 .756
highest level of education .063 .071 .056 .886 .377
managerial skills .398 .113 .224 3.533 .001
industry experience .146 .061 .163 2.379 .018
social skills .535 .115 .296 4.666 .000
a. Dependent Variable: performance index

206
Variables Entered/Removed
a
Model Variables Entered
Variables Removed
Method
2
social skills, highest level of education, age, managerial skills, industry experience
b
. Enter
a. Dependent Variable: performance index b. All requested variables entered.
Model Summary
Model R R Square Adjusted R Square
Std. Error of the Estimate
2 .469a .220 .202 .78280
a. Predictors: (Constant), social skills, highest level of education, age, managerial skills, industry experience
ANOVA
a
Model Sum of Squares df Mean Square F Sig.
2
Regression 37.226 5 7.445 12.150 .000b
Residual 131.746 215 .613
Total 168.972 220 a. Dependent Variable: performance index b. Predictors: (Constant), social skills, highest level of education, age, managerial skills, industry experience
Coefficients
a
Model Unstandardized Coefficients Standardized Coefficients
t Sig.
B Std. Error Beta
2
(Constant) 1.799 .266 6.755 .000
age -.094 .047 -.130 -1.991 .048
highest level of education .064 .069 .057 .931 .353
managerial skills .395 .111 .224 3.551 .000
industry experience .133 .059 .150 2.274 .024
social skills .549 .112 .307 4.893 .000
a. Dependent Variable: performance index

207
Appendix XI: Regression of Competitive Strategy and Firm Performance
Variables Entered/Removed
a
Model Variables Entered Variables Removed
Method
1
cost drivers, focus drivers, uniqueness drivers
b
. Enter
a. Dependent Variable: performance index b. All requested variables entered.
Model Summary
Model R R Square Adjusted R Square
Std. Error of the Estimate
1 .560a .313 .306 .65680
a. Predictors: (Constant), cost drivers, focus drivers, uniqueness drivers
ANOVA
a
Model Sum of Squares df Mean Square F Sig.
1
Regression 51.776 3 17.259 40.008 .000b
Residual 113.454 263 .431
Total 165.231 266
a. Dependent Variable: performance index b. Predictors: (Constant), cost drivers, focus drivers, uniqueness drivers
Coefficients
a
Model Unstandardized Coefficients Standardized Coefficients
t Sig.
B Std. Error Beta
1
(Constant) .626 .129 4.831 .000
uniqueness drivers .104 .042 .166 2.457 .015
focus drivers .288 .059 .319 4.885 .000
cost drivers .145 .057 .172 2.540 .012

208
Appendix XII: Regression of Firm Institutions, Competitive Strategy and Performance
Variables Entered/Removed
a
Model Variables Entered
Variables Removed
Method
1 strategy indexb . Enter
a. Dependent Variable: performance index b. All requested variables entered.
Model Summary
Model R R Square Adjusted R Square
Std. Error of the Estimate
1 .460a .211 .208 .70130
a. Predictors: (Constant), strategy index
ANOVAa
Model Sum of Squares df Mean Square F Sig.
1
Regression 34.898 1 34.898 70.956 .000b
Residual 130.333 265 .492
Total 165.231 266 a. Dependent Variable: performance index b. Predictors: (Constant), strategy index
Coefficientsa
Model Unstandardized Coefficients Standardized Coefficients
t Sig.
B Std. Error Beta
1 (Constant) 1.235 .095 13.034 .000
strategy index .127 .015 .460 8.424 .000
a. Dependent Variable: performance index
Variables Entered/Removed
a
Model Variables Entered
Variables Removed
Method
2 institutions index, strategy index
b
. Enter
a. Dependent Variable: performance index b. All requested variables entered.
Model Summary
Model R R Square Adjusted R Square
Std. Error of the Estimate
2 .459a .211 .204 .63390
a. Predictors: (Constant), institutions index, strategy index
ANOVA
a
Model Sum of Squares df Mean Square F Sig.
2
Regression 24.551 2 12.276 30.549 .000b
Residual 92.018 229 .402
Total 116.569 231 a. Dependent Variable: performance index
b. Predictors: (Constant), institutions index, strategy index

209
Coefficients
a
Model Unstandardized Coefficients Standardized Coefficients
t Sig.
B Std. Error Beta
2
(Constant) .953 .146 6.521 .000
strategy index .072 .019 .285 3.794 .000
institutions index .202 .068 .223 2.967 .003
Variables Entered/Removed
a
Model Variables Entered
Variables Removed
Method
3
product of strategy and institutions, strategy index, institutions index
b
. Enter
a. Dependent Variable: performance index b. All requested variables entered.
Model Summary
Model R R Square Adjusted R Square
Std. Error of the Estimate
3 .482a .233 .222 .62640
a. Predictors: (Constant), product of strategy and institutions, strategy index, institutions index
ANOVA
a
Model Sum of Squares df Mean Square F Sig.
3
Regression 27.106 3 9.035 23.027 .000b
Residual 89.463 228 .392
Total 116.569 231 a. Dependent Variable: performance index b. Predictors: (Constant), product of strategy and institutions, strategy index, institutions index
Coefficients
a
Model Unstandardized Coefficients Standardized Coefficients
t Sig.
B Std. Error Beta
3
(Constant) 1.281 .193 6.624 .000
strategy index .044 .022 .177 2.062 .040
institutions index .075 .084 .083 .893 .373
product of strategy and institutions
.001 .000 .269 2.552 .011
a. Dependent Variable: performance index

210
Appendix XIII: Regression of Joint Effect of Entrepreneur Characteristics and Competitive
Strategy on Performance
Variables Entered/Removed
a
Model Variables Entered
Variables Removed
Method
1 ecfinalb . Enter
a. Dependent Variable: performance index b. All requested variables entered.
Model Summary
Model R R Square Adjusted R Square
Std. Error of the Estimate
1 .276a .131 .127 .85792
a. Predictors: (Constant), entrepreneur characteristics index
ANOVA
a
Model Sum of Squares df Mean Square F Sig.
1
Regression 5.225 1 5.225 7.100 .008b
Residual 163.397 222 .736
Total 168.622 223 a. Dependent Variable: performance index b. Predictors: (Constant), entrepreneur characteristics index
Coefficients
a
Model Unstandardized Coefficients Standardized Coefficients
t Sig.
B Std. Error Beta
1
(Constant) 1.894 .210 9.025 .000
entrepreneur characteristics index
.371 .139 .176 2.665 .008
a. Dependent Variable: performance index
Variables Entered/Removed
a
Model Variables Entered
Variables Removed
Method
2 strategy indexb . Enter
a. Dependent Variable: performance index b. All requested variables entered.
Model Summary
Model R R Square Adjusted R Square Std. Error of the Estimate
2 .492a .242 .239 .75239
a. Predictors: (Constant), strategy index
ANOVA
a
Model Sum of Squares df Mean Square F Sig.
2
Regression 41.405 1 41.405 73.142 .000b
Residual 129.636 229 .566
Total 171.041 230 a. Dependent Variable: performance index
c. Predictors: (Constant), strategy index

211
Coefficientsa
Model Unstandardized Coefficients Standardized Coefficients
t Sig.
B Std. Error Beta
2 (Constant) 1.193 .153 7.773 .000
strategy index .168 .020 .492 8.552 .000
a. Dependent Variable: performance index
Variables Entered/Removed
a
Model Variables Entered Variables Removed
Method
3 entrepreneur characteristics index strategy index
b
. Enter
a. Dependent Variable: performance index b. All requested variables entered.
Model Summary
Model R R Square Adjusted R Square
Std. Error of the Estimate
3 .517a .267 .261 .74433
a. Predictors: (Constant), entrepreneur characteristics index, strategy index
ANOVA
a
Model Sum of Squares df Mean Square F Sig.
3
Regression 44.302 2 22.151 39.981 .000b
Residual 121.332 219 .554
Total 165.634 221 a. Dependent Variable: performance index b. Predictors: (Constant), entrepreneur characteristics index, strategy index
Coefficients
a
Model Unstandardized Coefficients Standardized Coefficients
t Sig.
B Std. Error Beta
3
(Constant) 1.168 .203 5.750 .000
strategy index .180 .021 .526 8.442 .000
entrepreneur characteristics index
-.054 .131 -.026 -.414 .679
a. Dependent Variable: performance index