
Entrainment of Brain Oscillations by Transcranial ... · Entrainment of Brain Oscillations by...
7
Current Biology 24, 333–339, February 3, 2014 ª2014 Elsevier Ltd All rights reserved http://dx.doi.org/10.1016/j.cub.2013.12.041 Report Entrainment of Brain Oscillations by Transcranial Alternating Current Stimulation Randolph F. Helfrich, 1, * Till R. Schneider, 1 Stefan Rach, 2,3 Sina A. Trautmann-Lengsfeld, 1 Andreas K. Engel, 1,4 and Christoph S. Herrmann 2,3,4 1 Department of Neurophysiology and Pathophysiology, University Medical Center Hamburg-Eppendorf, 20246 Hamburg, Germany 2 Experimental Psychology Lab, Center for Excellence ‘‘Hearing4all,’’ European Medical School, University of Oldenburg, 26111 Oldenburg, Germany 3 Research Center Neurosensory Science, University of Oldenburg, 26111 Oldenburg, Germany Summary Novel methods for neuronal entrainment [1–4] provide the unique opportunity to modulate perceptually relevant brain oscillations [5, 6] in a frequency-specific manner and to study their functional impact on distinct cognitive functions. Recently, evidence has emerged that tACS (transcranial alternating current stimulation) can modulate cortical oscil- lations [7–9]. However, the study of electrophysiological effects has been hampered so far by the absence of con- current electroencephalogram (EEG) recordings. Here, we applied 10 Hz tACS to the parieto-occipital cortex and utilized simultaneous EEG recordings to study neuronal entrainment during stimulation. We pioneer a novel approach for simultaneous tACS-EEG recordings and suc- cessfully separate stimulation artifacts from ongoing and event-related cortical activity. Our results reveal that 10 Hz tACS increases parieto-occipital alpha activity and synchro- nizes cortical oscillators with similar intrinsic frequencies to the entrainment frequency. Additionally, we demonstrate that tACS modulates target detection performance in a phase-dependent fashion highlighting the causal role of alpha oscillations for visual perception. Results In order to study the immediate electrophysiological effects of transcranial alternating current stimulation (tACS), we analyzed simultaneously recorded electroencephalogram (EEG) in 14 participants (Figure 1E). We employed a well- established visual oddball paradigm (Figure 1A) in order to retrieve highly predictable event-related potential (ERP) com- ponents [12]. To study phase-dependent effects, we delivered the visual stimulus relative to four different phase angles of the tACS wave (Figure 1B). A sham session always preceded the stimulation session to avoid carryover effects (Figure 1C). All participants received 1,000 mA stimulation intensity at 10 Hz for 20 min. Based on a previously published finite-element model of the current flow (Figure 1D) [11], we predicted that our tACS layout should induce the highest current densities in medial parieto-occipital cortex. Retrieval of EEG Activity and ERP Components We pioneered a novel approach for artifact removal (Supple- mental Experimental Procedures available online) to remove the tACS artifact, which ideally would be removed by sub- tracting a constant sine wave fitted to the recordings. How- ever, due to slight signal variations this approach did not yield satisfactory results. In order to account for the non- stationary characteristic of the recordings, we utilized a two-step procedure. First, an artifact template, comprising several adjacent artifact segments, was subtracted from every artifact segment (moving average approach). In a sec- ond step, remaining artifacts were captured by principal component analysis (PCA; Figure S1). In order to assess the impact of the artifact removal approach on the true EEG sig- nals, we introduced a simulation approach (Supplemental Experimental Procedures) by adding a constant 10 Hz sine wave with similar characteristics to the sham data (Figure 2A, II). In order to quantify the impact of the artifact rejection on ongoing power, we compared the mean spectral power after fast Fourier transform (FFT) of the baseline sham condi- tion (Figure 2A, I) to the artifact-corrected sham data for three frequency bands of interest (delta/theta: 1–6 Hz, alpha: 8–12 Hz, beta: 13–30 Hz). We found that the first correction step was insufficient to recover the original data in the alpha band because cleaned data and original data were significantly different (Figure 2A, III; t 13 = 28.56, p < 0.0005, paired t test), but it was successful after the second step (Figure 2A, IV; t 13 = 0.5, p = 0.6). Subsequently, we applied the same approach to the tACS-EEG data (Figure 2B, I) and obtained an artifact-cleaned recording (Figure 2B, III). The comparison to the alpha power in the baseline sham condition (t 13 = 23.74, p < 0.005) indicated that neuronal activity was modulated in the alpha band and was not related to residual stimulation artifacts. Our results also suggest that true brain activity was recovered in the delta/theta band (cleaned sham: t 13 = 0.58, p = 0.57; cleaned stimulation data: t 13 = 22.02, p = 0.06) and the beta band (cleaned sham data: t 13 = 21.14, p = 0.28, cleaned stimulation data: t 13 = 21.15, p = 0.27). In addition, we also retrieved ERPs and their respective topographies (Figures 2C and 2D; Sup- plemental Experimental Procedures). Power of Ongoing Activity Is Modulated by 10 Hz tACS Although the power spectrum in the alpha band was broadly distributed during sham (Figure 3A), the peak (Figure 3B) and shape (Supplemental Experimental Procedures) were clearly modulated by stimulation. We analyzed the absolute power values with a three-way repeated-measures ANOVA (Greenhouse-Geisser corrected) with the factor condition (sham or stimulation), frequency (delta/theta: 1–6 Hz, alpha: 8–12 Hz, beta: 13–30 Hz), and time (pre, ISI [interstimulus interval] 6500 ms around T 0 [Figure 1B], post). We found a significant influence of the factor frequency (F 1.3,16.2 = 68.03, p < 0.0005), along with a significant effect of the factor time (F 1.2,16 = 5.06, p < 0.05). The factor condition was not significant (F 1,13 = 0.06, p = 0.8). However, the crucial interactions of condition 3 frequency (F 1.5,19.7 = 33.54, p < 0.0005), time 3 frequency (F 2,26.5 = 5.3, p < 0.05), and 4 These authors contributed equally to this work *Correspondence: [email protected]
Transcript of Entrainment of Brain Oscillations by Transcranial ... · Entrainment of Brain Oscillations by...
Entrainment of Brain Oscilla
Current Biology 24, 333–339, February 3, 2014 ª2014 Elsevier Ltd All rights reserved http://dx.doi.org/10.1016/j.cub.2013.12.041
Reporttions
by Transcranial AlternatingCurrent Stimulation
Randolph F. Helfrich,1,* Till R. Schneider,1 Stefan Rach,2,3
Sina A. Trautmann-Lengsfeld,1 Andreas K. Engel,1,4
and Christoph S. Herrmann2,3,4
1Department of Neurophysiology and Pathophysiology,University Medical Center Hamburg-Eppendorf,20246 Hamburg, Germany2Experimental Psychology Lab, Center for Excellence‘‘Hearing4all,’’ European Medical School, University ofOldenburg, 26111 Oldenburg, Germany3Research Center Neurosensory Science, University ofOldenburg, 26111 Oldenburg, Germany
Summary
Novel methods for neuronal entrainment [1–4] provide theunique opportunity to modulate perceptually relevant brain
oscillations [5, 6] in a frequency-specific manner and tostudy their functional impact on distinct cognitive functions.
Recently, evidence has emerged that tACS (transcranialalternating current stimulation) can modulate cortical oscil-
lations [7–9]. However, the study of electrophysiologicaleffects has been hampered so far by the absence of con-
current electroencephalogram (EEG) recordings. Here, weapplied 10 Hz tACS to the parieto-occipital cortex and
utilized simultaneous EEG recordings to study neuronalentrainment during stimulation. We pioneer a novel
approach for simultaneous tACS-EEG recordings and suc-
cessfully separate stimulation artifacts from ongoing andevent-related cortical activity. Our results reveal that 10 Hz
tACS increases parieto-occipital alpha activity and synchro-nizes cortical oscillators with similar intrinsic frequencies to
the entrainment frequency. Additionally, we demonstratethat tACS modulates target detection performance in a
phase-dependent fashion highlighting the causal role ofalpha oscillations for visual perception.
Results
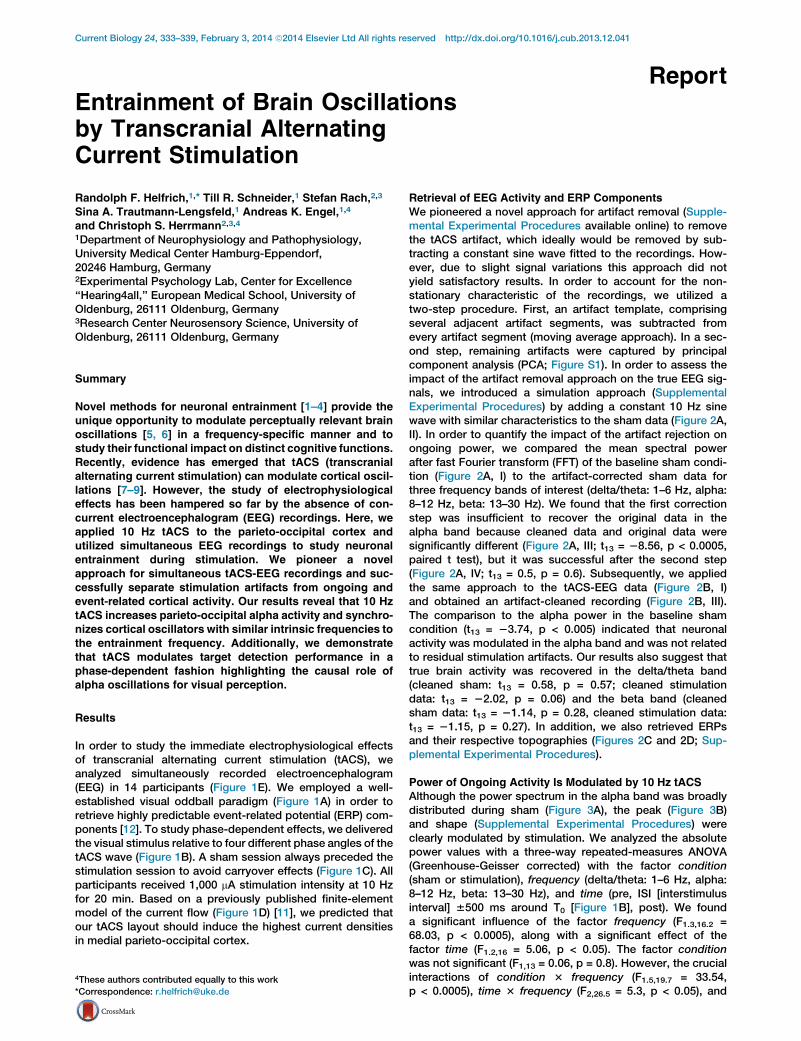
In order to study the immediate electrophysiological effectsof transcranial alternating current stimulation (tACS), weanalyzed simultaneously recorded electroencephalogram(EEG) in 14 participants (Figure 1E). We employed a well-established visual oddball paradigm (Figure 1A) in order toretrieve highly predictable event-related potential (ERP) com-ponents [12]. To study phase-dependent effects, we deliveredthe visual stimulus relative to four different phase angles of thetACS wave (Figure 1B). A sham session always preceded thestimulation session to avoid carryover effects (Figure 1C). Allparticipants received 1,000 mA stimulation intensity at 10 Hzfor 20 min. Based on a previously published finite-elementmodel of the current flow (Figure 1D) [11], we predicted thatour tACS layout should induce the highest current densitiesin medial parieto-occipital cortex.
4These authors contributed equally to this work
*Correspondence: [email protected]
Retrieval of EEG Activity and ERP Components
We pioneered a novel approach for artifact removal (Supple-mental Experimental Procedures available online) to removethe tACS artifact, which ideally would be removed by sub-tracting a constant sine wave fitted to the recordings. How-ever, due to slight signal variations this approach did notyield satisfactory results. In order to account for the non-stationary characteristic of the recordings, we utilized atwo-step procedure. First, an artifact template, comprisingseveral adjacent artifact segments, was subtracted fromevery artifact segment (moving average approach). In a sec-ond step, remaining artifacts were captured by principalcomponent analysis (PCA; Figure S1). In order to assess theimpact of the artifact removal approach on the true EEG sig-nals, we introduced a simulation approach (SupplementalExperimental Procedures) by adding a constant 10 Hz sinewave with similar characteristics to the sham data (Figure 2A,II). In order to quantify the impact of the artifact rejection onongoing power, we compared the mean spectral powerafter fast Fourier transform (FFT) of the baseline sham condi-tion (Figure 2A, I) to the artifact-corrected sham data forthree frequency bands of interest (delta/theta: 1–6 Hz, alpha:8–12 Hz, beta: 13–30 Hz). We found that the first correctionstep was insufficient to recover the original data in thealpha band because cleaned data and original data weresignificantly different (Figure 2A, III; t13 = 28.56, p < 0.0005,paired t test), but it was successful after the second step(Figure 2A, IV; t13 = 0.5, p = 0.6). Subsequently, we appliedthe same approach to the tACS-EEG data (Figure 2B, I)and obtained an artifact-cleaned recording (Figure 2B, III).The comparison to the alpha power in the baseline shamcondition (t13 = 23.74, p < 0.005) indicated that neuronalactivity was modulated in the alpha band and was not relatedto residual stimulation artifacts. Our results also suggest thattrue brain activity was recovered in the delta/theta band(cleaned sham: t13 = 0.58, p = 0.57; cleaned stimulationdata: t13 = 22.02, p = 0.06) and the beta band (cleanedsham data: t13 = 21.14, p = 0.28, cleaned stimulation data:t13 = 21.15, p = 0.27). In addition, we also retrieved ERPsand their respective topographies (Figures 2C and 2D; Sup-plemental Experimental Procedures).
Power of Ongoing Activity Is Modulated by 10 Hz tACSAlthough the power spectrum in the alpha band was broadlydistributed during sham (Figure 3A), the peak (Figure 3B)and shape (Supplemental Experimental Procedures) wereclearly modulated by stimulation. We analyzed the absolutepower values with a three-way repeated-measures ANOVA(Greenhouse-Geisser corrected) with the factor condition(sham or stimulation), frequency (delta/theta: 1–6 Hz, alpha:8–12 Hz, beta: 13–30 Hz), and time (pre, ISI [interstimulusinterval] 6500 ms around T0 [Figure 1B], post). We founda significant influence of the factor frequency (F1.3,16.2 =68.03, p < 0.0005), along with a significant effect of thefactor time (F1.2,16 = 5.06, p < 0.05). The factor conditionwas not significant (F1,13 = 0.06, p = 0.8). However, the crucialinteractions of condition 3 frequency (F1.5,19.7 = 33.54,p < 0.0005), time 3 frequency (F2,26.5 = 5.3, p < 0.05), and
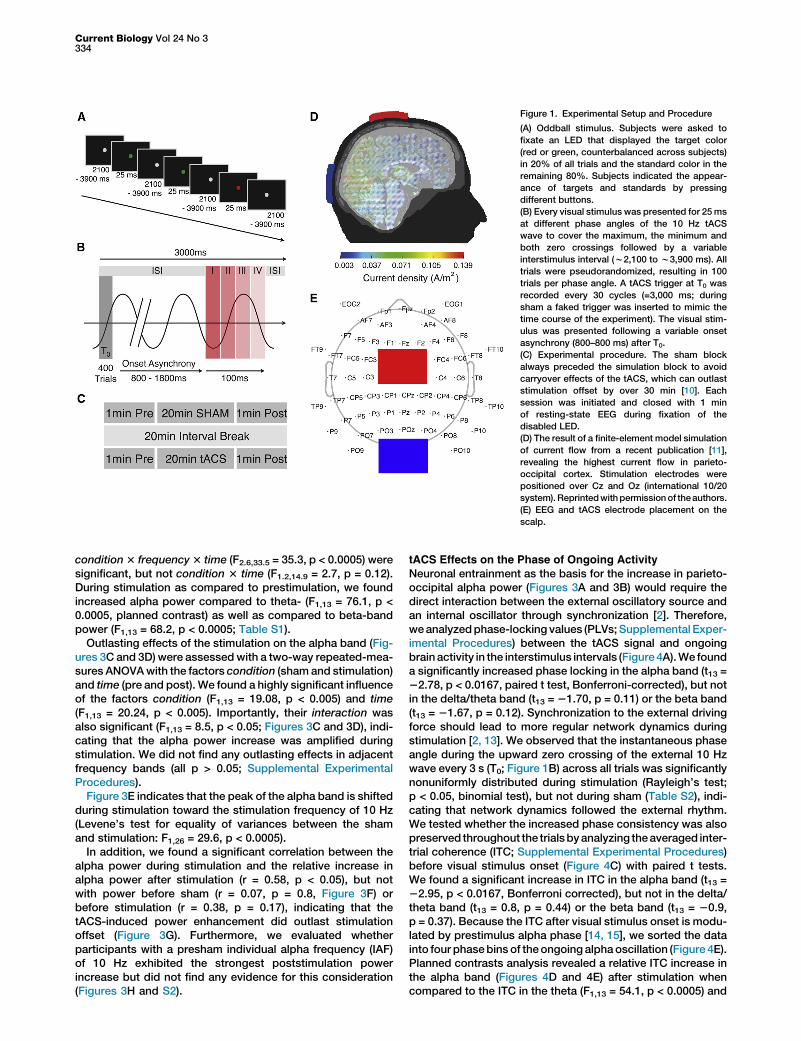
Figure 1. Experimental Setup and Procedure
(A) Oddball stimulus. Subjects were asked to
fixate an LED that displayed the target color
(red or green, counterbalanced across subjects)
in 20% of all trials and the standard color in the
remaining 80%. Subjects indicated the appear-
ance of targets and standards by pressing
different buttons.
(B) Every visual stimulus was presented for 25ms
at different phase angles of the 10 Hz tACS
wave to cover the maximum, the minimum and
both zero crossings followed by a variable
interstimulus interval (w2,100 to w3,900 ms). All
trials were pseudorandomized, resulting in 100
trials per phase angle. A tACS trigger at T0 was
recorded every 30 cycles (=3,000 ms; during
sham a faked trigger was inserted to mimic the
time course of the experiment). The visual stim-
ulus was presented following a variable onset
asynchrony (800–800 ms) after T0.
(C) Experimental procedure. The sham block
always preceded the simulation block to avoid
carryover effects of the tACS, which can outlast
stimulation offset by over 30 min [10]. Each
session was initiated and closed with 1 min
of resting-state EEG during fixation of the
disabled LED.
(D) The result of a finite-element model simulation
of current flow from a recent publication [11],
revealing the highest current flow in parieto-
occipital cortex. Stimulation electrodes were
positioned over Cz and Oz (international 10/20
system).Reprintedwithpermissionof theauthors.
(E) EEG and tACS electrode placement on the
scalp.
Current Biology Vol 24 No 3334
condition3 frequency3 time (F2.6,33.5 = 35.3, p < 0.0005) weresignificant, but not condition 3 time (F1.2,14.9 = 2.7, p = 0.12).During stimulation as compared to prestimulation, we foundincreased alpha power compared to theta- (F1,13 = 76.1, p <0.0005, planned contrast) as well as compared to beta-bandpower (F1,13 = 68.2, p < 0.0005; Table S1).
Outlasting effects of the stimulation on the alpha band (Fig-ures 3C and 3D) were assessedwith a two-way repeated-mea-sures ANOVAwith the factors condition (shamand stimulation)and time (pre and post). We found a highly significant influenceof the factors condition (F1,13 = 19.08, p < 0.005) and time(F1,13 = 20.24, p < 0.005). Importantly, their interaction wasalso significant (F1,13 = 8.5, p < 0.05; Figures 3C and 3D), indi-cating that the alpha power increase was amplified duringstimulation. We did not find any outlasting effects in adjacentfrequency bands (all p > 0.05; Supplemental ExperimentalProcedures).
Figure 3E indicates that the peak of the alpha band is shiftedduring stimulation toward the stimulation frequency of 10 Hz(Levene’s test for equality of variances between the shamand stimulation: F1,26 = 29.6, p < 0.0005).
In addition, we found a significant correlation between thealpha power during stimulation and the relative increase inalpha power after stimulation (r = 0.58, p < 0.05), but notwith power before sham (r = 0.07, p = 0.8, Figure 3F) orbefore stimulation (r = 0.38, p = 0.17), indicating that thetACS-induced power enhancement did outlast stimulationoffset (Figure 3G). Furthermore, we evaluated whetherparticipants with a presham individual alpha frequency (IAF)of 10 Hz exhibited the strongest poststimulation powerincrease but did not find any evidence for this consideration(Figures 3H and S2).
tACS Effects on the Phase of Ongoing Activity
Neuronal entrainment as the basis for the increase in parieto-occipital alpha power (Figures 3A and 3B) would require thedirect interaction between the external oscillatory source andan internal oscillator through synchronization [2]. Therefore,weanalyzedphase-locking values (PLVs; Supplemental Exper-imental Procedures) between the tACS signal and ongoingbrainactivity in the interstimulus intervals (Figure4A).We founda significantly increased phase locking in the alpha band (t13 =22.78, p < 0.0167, paired t test, Bonferroni-corrected), but notin the delta/theta band (t13 = 21.70, p = 0.11) or the beta band(t13 = 21.67, p = 0.12). Synchronization to the external drivingforce should lead to more regular network dynamics duringstimulation [2, 13]. We observed that the instantaneous phaseangle during the upward zero crossing of the external 10 Hzwave every 3 s (T0; Figure 1B) across all trials was significantlynonuniformly distributed during stimulation (Rayleigh’s test;p < 0.05, binomial test), but not during sham (Table S2), indi-cating that network dynamics followed the external rhythm.We tested whether the increased phase consistency was alsopreserved throughout the trialsbyanalyzing theaveraged inter-trial coherence (ITC; Supplemental Experimental Procedures)before visual stimulus onset (Figure 4C) with paired t tests.We found a significant increase in ITC in the alpha band (t13 =22.95, p < 0.0167, Bonferroni corrected), but not in the delta/theta band (t13 = 0.8, p = 0.44) or the beta band (t13 = 20.9,p = 0.37). Because the ITC after visual stimulus onset is modu-lated by prestimulus alpha phase [14, 15], we sorted the datainto four phasebins of theongoing alphaoscillation (Figure 4E).Planned contrasts analysis revealed a relative ITC increase inthe alpha band (Figures 4D and 4E) after stimulation whencompared to the ITC in the theta (F1,13 = 54.1, p < 0.0005) and
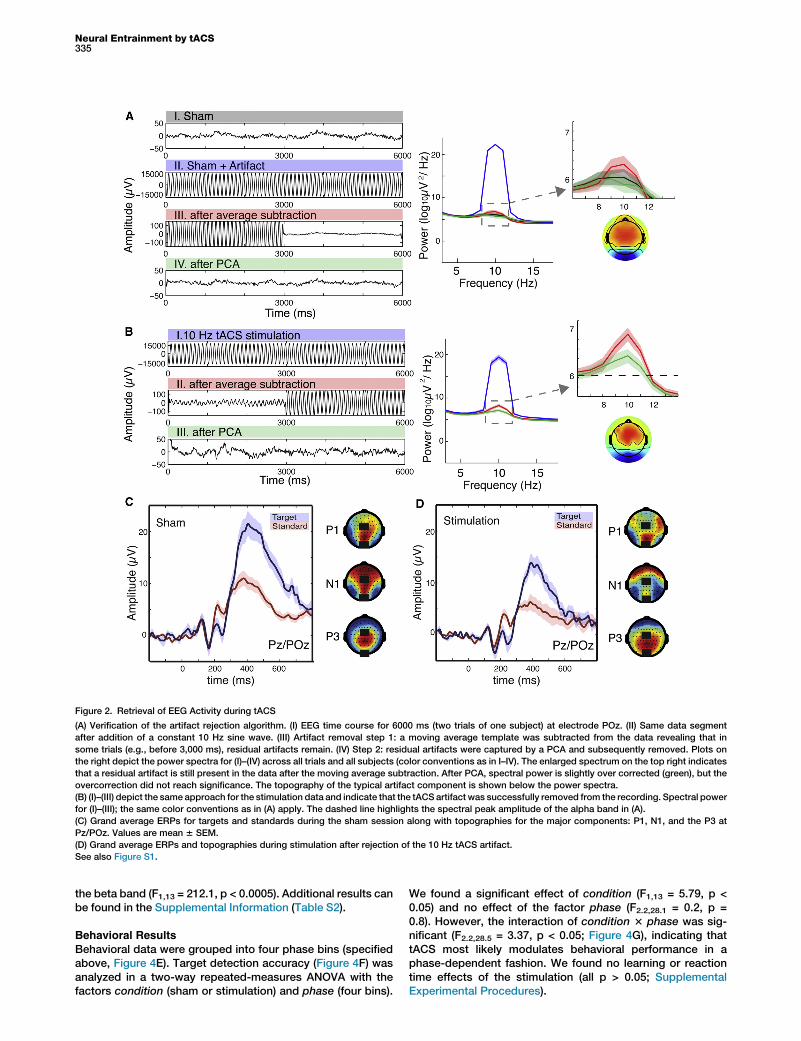
Figure 2. Retrieval of EEG Activity during tACS
(A) Verification of the artifact rejection algorithm. (I) EEG time course for 6000 ms (two trials of one subject) at electrode POz. (II) Same data segment
after addition of a constant 10 Hz sine wave. (III) Artifact removal step 1: a moving average template was subtracted from the data revealing that in
some trials (e.g., before 3,000 ms), residual artifacts remain. (IV) Step 2: residual artifacts were captured by a PCA and subsequently removed. Plots on
the right depict the power spectra for (I)–(IV) across all trials and all subjects (color conventions as in I–IV). The enlarged spectrum on the top right indicates
that a residual artifact is still present in the data after the moving average subtraction. After PCA, spectral power is slightly over corrected (green), but the
overcorrection did not reach significance. The topography of the typical artifact component is shown below the power spectra.
(B) (I)–(III) depict the same approach for the stimulation data and indicate that the tACS artifact was successfully removed from the recording. Spectral power
for (I)–(III); the same color conventions as in (A) apply. The dashed line highlights the spectral peak amplitude of the alpha band in (A).
(C) Grand average ERPs for targets and standards during the sham session along with topographies for the major components: P1, N1, and the P3 at
Pz/POz. Values are mean 6 SEM.
(D) Grand average ERPs and topographies during stimulation after rejection of the 10 Hz tACS artifact.
See also Figure S1.
Neural Entrainment by tACS335
the beta band (F1,13 = 212.1, p < 0.0005). Additional results canbe found in the Supplemental Information (Table S2).
Behavioral Results
Behavioral data were grouped into four phase bins (specifiedabove, Figure 4E). Target detection accuracy (Figure 4F) wasanalyzed in a two-way repeated-measures ANOVA with thefactors condition (sham or stimulation) and phase (four bins).
We found a significant effect of condition (F1,13 = 5.79, p <0.05) and no effect of the factor phase (F2.2,28.1 = 0.2, p =0.8). However, the interaction of condition 3 phase was sig-nificant (F2.2,28.5 = 3.37, p < 0.05; Figure 4G), indicating thattACS most likely modulates behavioral performance in aphase-dependent fashion. We found no learning or reactiontime effects of the stimulation (all p > 0.05; SupplementalExperimental Procedures).
Figure 3. Entrainment of Ongoing Alpha-Band Activity
(A) Grand mean power spectra across all subjects during the sham session (electrode POz). One minute of pre- and postmeasurements were subdivided
into 60 segments of 1 s each; the resulting spectra after FFTwere averaged. The same procedure was applied to the 400 ISIs (fragmented into 1 s segments).
The inset depicts the topography of the alpha-band power (dashed line) during sham.
(B) Grand averages of power spectra during 10 Hz tACS along with pre- and poststimulation measurements (electrode POz).
(C) Average alpha power before, during, and after sham (mean 6 SEM) at POz. Values are normalized to the presham baseline power in each subject. The
400 interstimulus interval segments were grouped into six equally distanced grand averages, each containing 60 consecutive spectra sorted with respect
to their occurrence during the session. The 40 remaining spectra were discarded. The topography indicates the alpha power change in the postsham
measurement relative to the presham baseline.
(D) Average relative alpha power before, during, and after 10 Hz tACS (mean 6 SEM). The topographies correspond to the prestimulation and post-
stimulation condition and reveal the spatial specific alpha power enhancement after 10 Hz tACS. Note that the power enhancement effect during stimulation
outlasts the stimulation period.
(E) Spectral peak analysis of all 14 subjects with a mean IAF of 9.86 Hz 6 0.4 (mean 6 SEM). During 10 Hz tACS, the spectral peak is at 10.07 Hz 6 0.1.
A Levene’s test for equality of variances revealed that the assumption of homoscedasticity was not met during stimulation.
(F) Linear correlation analysis of the absolute alpha power values during presham baseline and the relative poststimulation enhancement in the alpha band
revealed no significant interaction. Black dots depict individual subjects.
(G) Linear correlation analysis of the absolute alpha power value observed during stimulation and the relative poststimulation alpha power enhancement
revealed a significant interaction.
(H) The IAF was defined as the spectral peak or maximal power value in the presham measurement in the range from 8–12 Hz. The results indicate that the
relative alpha power increase after stimulation was not related to the peak frequency before stimulation.
See also Figure S2 and Table S1.
Current Biology Vol 24 No 3336
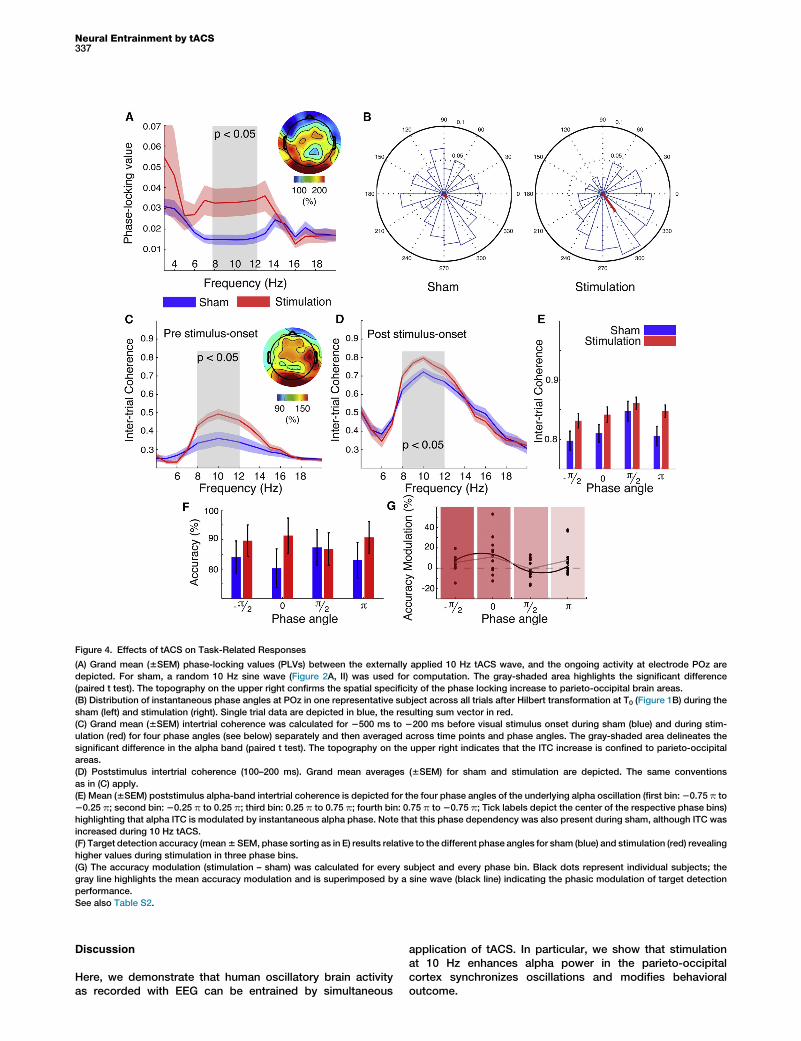
Figure 4. Effects of tACS on Task-Related Responses
(A) Grand mean (6SEM) phase-locking values (PLVs) between the externally applied 10 Hz tACS wave, and the ongoing activity at electrode POz are
depicted. For sham, a random 10 Hz sine wave (Figure 2A, II) was used for computation. The gray-shaded area highlights the significant difference
(paired t test). The topography on the upper right confirms the spatial specificity of the phase locking increase to parieto-occipital brain areas.
(B) Distribution of instantaneous phase angles at POz in one representative subject across all trials after Hilbert transformation at T0 (Figure 1B) during the
sham (left) and stimulation (right). Single trial data are depicted in blue, the resulting sum vector in red.
(C) Grand mean (6SEM) intertrial coherence was calculated for 2500 ms to 2200 ms before visual stimulus onset during sham (blue) and during stim-
ulation (red) for four phase angles (see below) separately and then averaged across time points and phase angles. The gray-shaded area delineates the
significant difference in the alpha band (paired t test). The topography on the upper right indicates that the ITC increase is confined to parieto-occipital
areas.
(D) Poststimulus intertrial coherence (100–200 ms). Grand mean averages (6SEM) for sham and stimulation are depicted. The same conventions
as in (C) apply.
(E) Mean (6SEM) poststimulus alpha-band intertrial coherence is depicted for the four phase angles of the underlying alpha oscillation (first bin:20.75 p to
20.25 p; second bin: 20.25 p to 0.25 p; third bin: 0.25 p to 0.75 p; fourth bin: 0.75 p to 20.75 p; Tick labels depict the center of the respective phase bins)
highlighting that alpha ITC is modulated by instantaneous alpha phase. Note that this phase dependency was also present during sham, although ITC was
increased during 10 Hz tACS.
(F) Target detection accuracy (mean6SEM, phase sorting as in E) results relative to the different phase angles for sham (blue) and stimulation (red) revealing
higher values during stimulation in three phase bins.
(G) The accuracy modulation (stimulation – sham) was calculated for every subject and every phase bin. Black dots represent individual subjects; the
gray line highlights the mean accuracy modulation and is superimposed by a sine wave (black line) indicating the phasic modulation of target detection
performance.
See also Table S2.
Neural Entrainment by tACS337
Discussion
Here, we demonstrate that human oscillatory brain activityas recorded with EEG can be entrained by simultaneous
application of tACS. In particular, we show that stimulationat 10 Hz enhances alpha power in the parieto-occipitalcortex synchronizes oscillations and modifies behavioraloutcome.
Current Biology Vol 24 No 3338
Artifact RejectionThe crucial factor in tACS-EEG experiments is the distinctionbetween physiological brain activity and stimulation-inducedartifacts, because the frequency of interest is usually equalto the stimulation frequency. We verified our artifact removalapproach with a simulation, which strongly supports a suc-cessful artifact rejection. (1) Spectral power after artifactrejection on the sham data did not differ significantly fromthe original sham data (Figures 2AI and 2AIV). (2) Alpha topog-raphies were highly similar during sham and stimulation(Figures 3A, 3B, and S2), indicating that cortical sources ofalpha activity were modulated during stimulation. (3) Alphapower during stimulation was significantly correlated withpoststimulation power increase (Figure 3G). (4) Increments ofpower (Figure 3D), phase locking (Figure 4A), and intertrialcoherence (Figure 4C) were mainly confined to parieto-occip-ital areas and the alpha band. (5) The physiological phase-dependent response to the visual stimulus was still present(Figures 4D and 4E; also see evoked power analysis in theSupplemental Experimental Procedures). If residual artifactswere the underlying cause for the phase locking and powerincrease, a physiological modulation would have been highlyunlikely. (6) ERP waveforms and topographies were restoredsuccessfully. (7) PCA revealed distinct artifact components(Figure S1).
Physiological Efficacy of tACS
Intracranial recordings in animals demonstrated that spikingactivity could be synchronized to different driving frequencies[16] and synchronized to the phase of externally applied alter-nating currents [17]. So far, electrophysiological evidence inhumans was limited to EEG recordings after stimulation[18, 19]. Our data now suggest that (1) 10 Hz tACS increasedoscillatory power in the alpha band; (2) the alpha powerincrease was based on synchronization to the external drivingforce [2]. (3) 10 Hz tACS transiently shifts the individual alphapeak toward 10 Hz (Figure 3E). This finding has been demon-strated in a modeling study for a 3 Hz network in a frequencyrange from 2–4.5 Hz [13, 20]; (4) effects of stimulation at10 Hz are confined to the alpha band. These results agreewith a modeling study [21] predicting tACS effects on EEGelectrodes and brain activity. However, it remains unresolvedwhether neuronal entrainment [2] and mechanisms of neuralplasticity [19] are the only factors contributing to the outlastingpower effect [20]. Importantly, our results reveal that neitherbaseline power nor the IAF (Figures 3F and 3H) were reliablepredictors whether entrainment through 10 Hz tACS wassuccessful (Figure 3G). Complementary modeling approacheswill be necessary to individually tailor electrode features (e.g.,size or location) and stimulation parameters (e.g., frequency,intensity, phase delay, offset, waveforms [11]) to overcomecurrent limitations of tACS such as the low spatial specificityand the unclear cortical current distribution.
Role of Alpha Oscillations for Visual PerceptionIn general, alpha is assumed to be a rhythm that can activelysuppress processing of irrelevant sensory information andtherefore direct information flow to task-relevant neuronalstructures (gating by inhibition hypothesis, reviewed in[22–24]). Specifically, it has been demonstrated that high pres-timulus alpha power is predictive of decreased visual detec-tion performance in a phase-dependent fashion [15, 25, 26].Here, we observed a phase-dependent enhancement of targetdetection performance in states of exogenously boosted alpha
activity. Under the assumption that tACS can only entraincortical oscillators operating close to the driving frequency[2], our results suggest that we successfully modulated theinhibitory alpha network. Furthermore, states of increasedalpha phase alignment are predictive of improved memoryperformance [14] and might facilitate recall performance inan oddball task. In line with the above, previous rTMS experi-ments on exogenous alpha enhancement described eitherfacilitation [27] or impairment [28] of task performance indifferent cognitive paradigms. Taken together, our findingsimply that exogenously enhanced alpha power reflects in-creased inhibition of task-irrelevant sites through augmentedcortical alpha synchronization.An unequivocal confirmation on entrainment would be the
demonstration that behavioral performance cycles at differentfrequencies before and after stimulation. However, in contrastto previous reports [29, 30] we did not find a phasicmodulationin behavior. A potential confound is the preceding shamsession and the slow alpha power increase throughout thetask. However, a significant interaction between conditionand time demonstrated that the increase was strongerduring stimulation (Figure 3D). Outlasting changes after tACS(>30 min [10]) impede an inverse experimental procedure.
Relation to Previous Studies and Implications for FutureStudies
Our results extend previous findings and suggest neuronal en-trainment as the putative mechanism, which may underlie thepreviously observed stimulation effects on visual [19, 31–34],somatosensory [35], auditory [18], motor [9, 36–38], and mem-ory systems [7, 39]. This is the first study that combines simu-lated current flow predictions with electrophysiological andbehavioral evidence to demonstrate the efficacy of the stimu-lation. Our results show that the externally applied electric fielddoes directly influence cortical oscillators in a frequency-spe-cific manner and indicate that tACS can be a powerful toolto investigate neuronal oscillations involved in perceptualand cognitive processing. In the future, tACS might prove tobe useful for the clinical application in disorders associatedwith disturbances of oscillatory signals such as Parkinson’sdisease [37] or neuropsychiatric disorders [40, 41].
Supplemental Information
Supplemental Information includes Supplemental Experimental Proce-
dures, two figures, and two tables and can be found with this article online
at http://dx.doi.org/10.1016/j.cub.2013.12.041.
Acknowledgments
The authors would like to thank Johannes Vosskuhl for help with participant
recruitment and data acquisition. This work was supported by grants from
the European Union (ERC-2010-AdG-269716, A.K.E.), the German Research
Foundation (SFB936/A2/A3/Z1, A.K.E.; RA2357/1-1, S.R.; SFB/TRR 31,
C.S.H.), and the German National Academic Foundation (R.F.H.).
Received: June 7, 2013
Revised: November 15, 2013
Accepted: December 17, 2013
Published: January 23, 2014
References
1. Thut, G., Miniussi, C., and Gross, J. (2012). The functional importance of
rhythmic activity in the brain. Curr. Biol. 22, R658–R663.
Neural Entrainment by tACS339
2. Thut, G., Schyns, P.G., and Gross, J. (2011). Entrainment of perceptually
relevant brain oscillations by non-invasive rhythmic stimulation of the
human brain. Front. Psychol. 2, 170.
3. Romei, V., Driver, J., Schyns, P.G., and Thut, G. (2011). Rhythmic TMS
over parietal cortex links distinct brain frequencies to global versus
local visual processing. Curr. Biol. 21, 334–337.
4. Thut, G., Veniero, D., Romei, V., Miniussi, C., Schyns, P., and Gross, J.
(2011). Rhythmic TMS causes local entrainment of natural oscillatory
signatures. Curr. Biol. 21, 1176–1185.
5. Buzsaki, G., and Draguhn, A. (2004). Neuronal oscillations in cortical
networks. Science 304, 1926–1929.
6. Engel, A.K., Fries, P., and Singer, W. (2001). Dynamic predictions: oscil-
lations and synchrony in top-down processing. Nat. Rev. Neurosci. 2,
704–716.
7. Polanıa, R., Nitsche, M.A., Korman, C., Batsikadze, G., and Paulus, W.
(2012). The importance of timing in segregated theta phase-coupling
for cognitive performance. Curr. Biol. 22, 1314–1318.
8. Herrmann, C., Rach, S., Neuling, T., and Struber, D. (2013). Transcranial
alternating current stimulation: a review of the underlying mechanisms
and modulation of cognitive processes. Front. Hum. Neurosci 7, 279.
9. Pogosyan, A., Gaynor, L.D., Eusebio, A., and Brown, P. (2009). Boosting
cortical activity at Beta-band frequencies slows movement in humans.
Curr. Biol. 19, 1637–1641.
10. Neuling, T., Rach, S., and Herrmann, C.S. (2013). Orchestrating neuronal
networks: sustained after-effects of transcranial alternating current
stimulation depend upon brain states. Front. Hum. Neurosci. 7, 161.
11. Neuling, T., Wagner, S., Wolters, C.H., Zaehle, T., and Herrmann, C.S.
(2012). Finite-element model predicts current density distribution for
clinical applications of tDCS and tACS. Front. Psychiatry 3, 83.
12. Polich, J. (2007). Updating P300: an integrative theory of P3a and P3b.
Clin. Neurophysiol. 118, 2128–2148.
13. Ali, M.M., Sellers, K.K., and Frohlich, F. (2013). Transcranial alternating
current stimulation modulates large-scale cortical network activity by
network resonance. J. Neurosci. 33, 11262–11275.
14. Hanslmayr, S., Klimesch, W., Sauseng, P., Gruber, W., Doppelmayr, M.,
Freunberger, R., and Pecherstorfer, T. (2005). Visual discrimination
performance is related to decreased alpha amplitude but increased
phase locking. Neurosci. Lett. 375, 64–68.
15. Hanslmayr, S., Aslan, A., Staudigl, T., Klimesch, W., Herrmann, C.S., and
Bauml, K.-H. (2007). Prestimulus oscillations predict visual perception
performance between and within subjects. Neuroimage 37, 1465–1473.
16. Frohlich, F., and McCormick, D.A. (2010). Endogenous electric fields
may guide neocortical network activity. Neuron 67, 129–143.
17. Ozen, S., Sirota, A., Belluscio, M.A., Anastassiou, C.A., Stark, E., Koch,
C., and Buzsaki, G. (2010). Transcranial electric stimulation entrains
cortical neuronal populations in rats. J. Neurosci. 30, 11476–11485.
18. Neuling, T., Rach, S., Wagner, S., Wolters, C.H., and Herrmann, C.S.
(2012). Good vibrations: oscillatory phase shapes perception.
Neuroimage 63, 771–778.
19. Zaehle, T., Rach, S., and Herrmann, C.S. (2010). Transcranial alternating
current stimulation enhances individual alpha activity in human EEG.
PLoS ONE 5, e13766.
20. Helfrich, R.F., and Schneider, T.R. (2013). Modulation of cortical
network activity by transcranial alternating current stimulation.
J. Neurosci. 33, 17551–17552.
21. Merlet, I., Birot, G., Salvador, R., Molaee-Ardekani, B., Mekonnen, A.,
Soria-Frish, A., Ruffini, G., Miranda, P.C., and Wendling, F. (2013).
From oscillatory transcranial current stimulation to scalp EEG changes:
a biophysical and physiological modeling study. PLoS ONE 8, e57330.
22. Jensen, O., and Mazaheri, A. (2010). Shaping functional architecture
by oscillatory alpha activity: gating by inhibition. Front. Hum. Neurosci.
4, 186.
23. Klimesch, W., Sauseng, P., and Hanslmayr, S. (2007). EEG alpha oscilla-
tions: the inhibition-timing hypothesis. Brain Res. Brain Res. Rev. 53,
63–88.
24. Klimesch, W., Fellinger, R., and Freunberger, R. (2011). Alpha oscilla-
tions and early stages of visual encoding. Front. Psychol. 2, 118.
25. van Dijk, H., Schoffelen, J.-M., Oostenveld, R., and Jensen, O. (2008).
Prestimulus oscillatory activity in the alpha band predicts visual
discrimination ability. J. Neurosci. 28, 1816–1823.
26. Mathewson, K.E., Gratton, G., Fabiani, M., Beck, D.M., and Ro, T. (2009).
To see or not to see: prestimulus alpha phase predicts visual aware-
ness. J. Neurosci. 29, 2725–2732.
27. Klimesch, W., Sauseng, P., and Gerloff, C. (2003). Enhancing cognitive
performance with repetitive transcranial magnetic stimulation at human
individual alpha frequency. Eur. J. Neurosci. 17, 1129–1133.
28. Romei, V., Gross, J., and Thut, G. (2010). On the role of prestimulus
alpha rhythms over occipito-parietal areas in visual input regulation:
correlation or causation? J. Neurosci. 30, 8692–8697.
29. Callaway, E., 3rd, and Yeager, C.L. (1960). Relationship between reac-
tion time and electroencephalographic alpha phase. Science 132,
1765–1766.
30. de Graaf, T.A., Gross, J., Paterson, G., Rusch, T., Sack, A.T., and Thut,
G. (2013). Alpha-band rhythms in visual task performance: phase-
locking by rhythmic sensory stimulation. PLoS ONE 8, e60035.
31. Kanai, R., Chaieb, L., Antal, A., Walsh, V., and Paulus, W. (2008).
Frequency-dependent electrical stimulation of the visual cortex. Curr.
Biol. 18, 1839–1843.
32. Kanai, R., Paulus, W., and Walsh, V. (2010). Transcranial alternating
current stimulation (tACS) modulates cortical excitability as assessed
by TMS-induced phosphene thresholds. Clin. Neurophysiol. 121,
1551–1554.
33. Brignani, D., Ruzzoli, M., Mauri, P., and Miniussi, C. (2013). Is transcra-
nial alternating current stimulation effective in modulating brain oscilla-
tions? PLoS ONE 8, e56589.
34. Struber, D., Rach, S., Trautmann-Lengsfeld, S.A., Engel, A.K., and
Herrmann, C.S. (2014). Antiphasic 40 Hz oscillatory current stimulation
affects bistable motion perception. Brain Topogr. 27, 158–171.
35. Feurra, M., Paulus, W., Walsh, V., and Kanai, R. (2011). Frequency spe-
cific modulation of human somatosensory cortex. Front. Psychol. 2, 13.
36. Antal, A., Boros, K., Poreisz, C., Chaieb, L., Terney, D., and Paulus, W.
(2008). Comparatively weak after-effects of transcranial alternating cur-
rent stimulation (tACS) on cortical excitability in humans. Brain Stimulat.
1, 97–105.
37. Brittain, J.-S., Probert-Smith, P., Aziz, T.Z., and Brown, P. (2013).
Tremor suppression by rhythmic transcranial current stimulation.
Curr. Biol. 23, 436–440.
38. Feurra, M., Bianco, G., Santarnecchi, E., Del Testa, M., Rossi, A., and
Rossi, S. (2011). Frequency-dependent tuning of the human motor sys-
tem induced by transcranial oscillatory potentials. J. Neurosci. 31,
12165–12170.
39. Marshall, L., Helgadottir, H., Molle, M., and Born, J. (2006). Boosting
slow oscillations during sleep potentiates memory. Nature 444,
610–613.
40. Herrmann, C.S., and Demiralp, T. (2005). Human EEG gamma oscilla-
tions in neuropsychiatric disorders. Clin. Neurophysiol. 116, 2719–2733.
41. Uhlhaas, P.J., and Singer, W. (2010). Abnormal neural oscillations and
synchrony in schizophrenia. Nat. Rev. Neurosci. 11, 100–113.


![Neural entrainment determines the words we hear · 46 influence sensory processing and perception [1]. Neural entrainment that relies on the 47 recruitment of endogenous oscillations](https://static.fdocuments.net/doc/165x107/5f0a9e7a7e708231d42c8574/neural-entrainment-determines-the-words-we-hear-46-influence-sensory-processing.jpg)


