Auto-Generated Expense Reports: The Future of Expense Management

[Summary Ledgers]
Revised 2/14/2005
Page 1 of 34

Table of Contents
Getting Started ........................................................................................................3 Navigation ...........................................................................................................3 Creating a Report..................................................................................................5 Personalizing the Screen ........................................................................................6
Looking at the Selection Prompts on the Blue Bar .........................................................8 ChartField Prompts ...................................................................................................9 Accounting Time Prompts ........................................................................................ 10 Making Selections for the Report and Retrieving Data .................................................. 11 Viewing the Summary Ledger Data ........................................................................... 12 Improving the View ................................................................................................ 15 Exporting the Report to Excel or PDF......................................................................... 17 Drill-Through Reports to get Detail............................................................................ 19 Changing the Look - Crosstab View or Indented Crosstab............................................. 23 Viewing a Summary Ledger for Grants ...................................................................... 25 Viewing a Summary Ledger for Auxiliary.................................................................... 28 Viewing a Summary Ledger for Cash ......................................................................... 29 Viewing a Summary Ledger for Construction .............................................................. 30 Saving the Report .................................................................................................. 31 Finding a Saved Report ........................................................................................... 32 Creating a New Folder............................................................................................. 33 Best Practices ........................................................................................................ 34
Revised 2/14/2005
Page 2 of 34

Getting Started This guide will get you started with viewing summary ledgers.
Navigation 1. Log into myUFL with your GatorLink userid and password. 2. Go to Enterprise Reporting > Access Reporting. 3. Open the new browser window that appears. 4. Read the Acceptable Use policy and if you agree, click on Accept. 5. The Enterprise Reporting panel will display. 6. Click on Financial Information
7. Click on the Ledger folder to view the reporting folders within it.
You will see five ledger groups -
Appropriations Cash Grants Construction Auxiliary Student Government
Revised 2/14/2005
Page 3 of 34
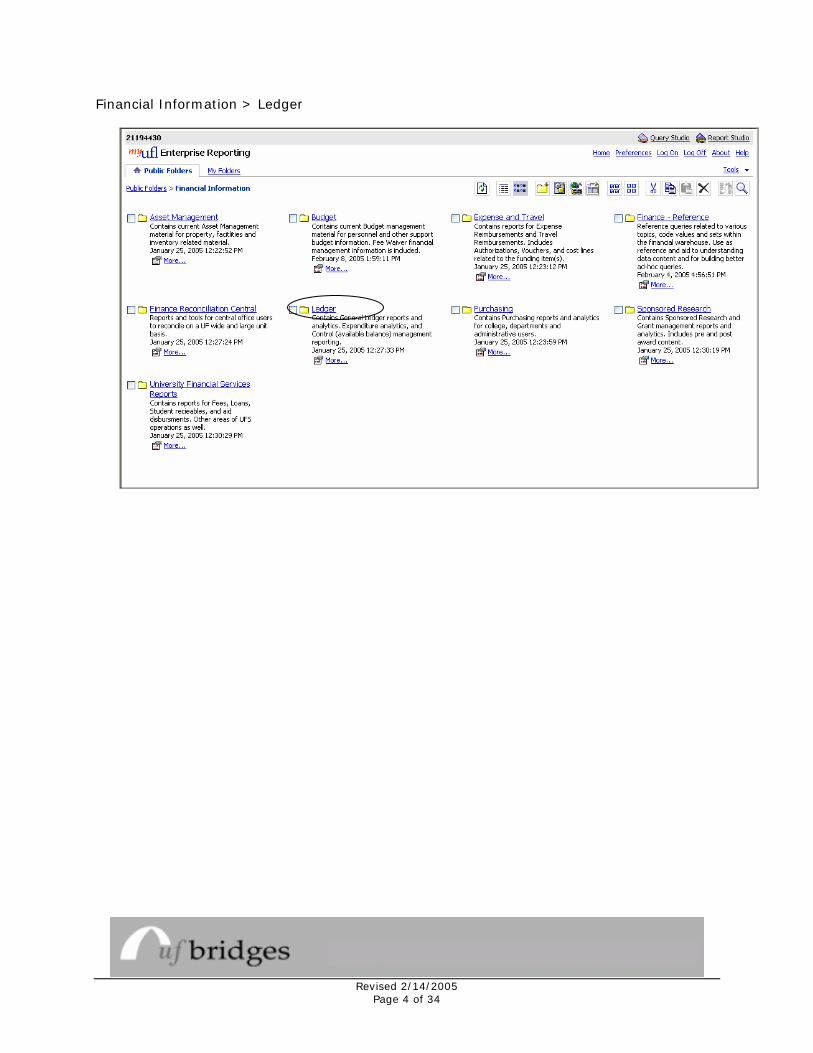
Financial Information > Ledger
Revised 2/14/2005
Page 4 of 34
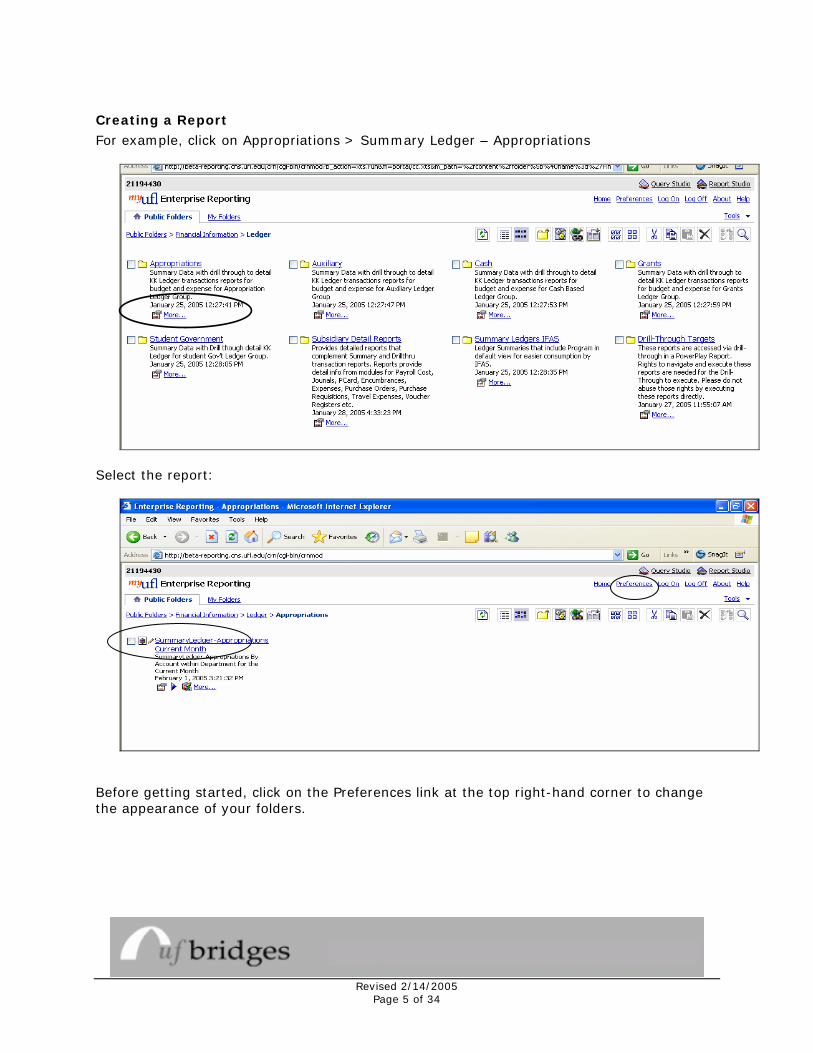
Creating a Report
For example, click on Appropriations > Summary Ledger – Appropriations
Select the report:
Before getting started, click on the Preferences link at the top right-hand corner to change the appearance of your folders.
Revised 2/14/2005
Page 5 of 34
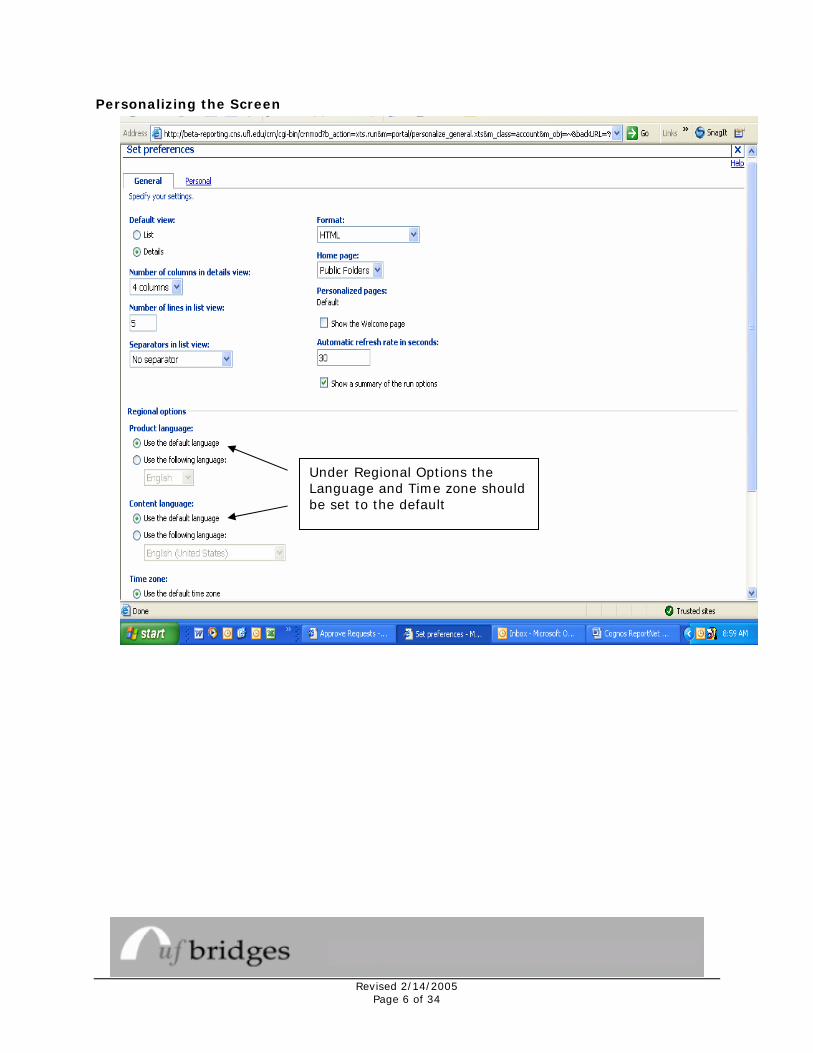
Personalizing the Screen
Under Regional Options the Language and Time zone should be set to the default
Revised 2/14/2005
Page 6 of 34

Now you may tailor this report to get the ledger amounts for your department.
Take a moment to study the panel. The ledger measure amounts will be displayed by Fund and Account. Click on the Wrapping On icon (top right-hand corner, the last icon on the right after the blue bar) to see the whole blue bar at the top. The prompts on this bar drive the report. For example, if you would like a summary ledger report for Astronomy, use the All Departments prompt on the blue bar to select Astronomy. Become familiar with these prompts.
Revised 2/14/2005
Page 7 of 34

Looking at the Selection Prompts on the Blue Bar
The prompts on the blue bar consist of ChartFields, Group Ledger and Accounting Time periods. Let's take a closer look at each group of prompts on the blue bar.
Revised 2/14/2005
Page 8 of 34

ChartField Prompts
These prompts contain ChartFields: Prompt ChartField
All Departments DeptID All Funds Fund Code All Programs Program Code All Budget References Bud Ref All Fund Sources Fund Source All Flexfields Flex All Employees EmplID All Projects Project All CRIS CRIS All Accounts Account Code
Revised 2/14/2005
Page 9 of 34

Accounting Time Prompts
These prompts are for accounting time periods:
All Acct Periods All Months Budget Period
Why is this important? Because your selections from the prompts on the blue bar create the report! For example you might select:
All Departments = Astronomy All Funds = 101 E & G General Revenue All Months = Last Month
This will create a report ready to retrieve amounts for a summary ledger for the Astronomy department's Fund 101 for all Revenue and Expense accounts that had activity for last month. Let's try it.
Revised 2/14/2005
Page 10 of 34
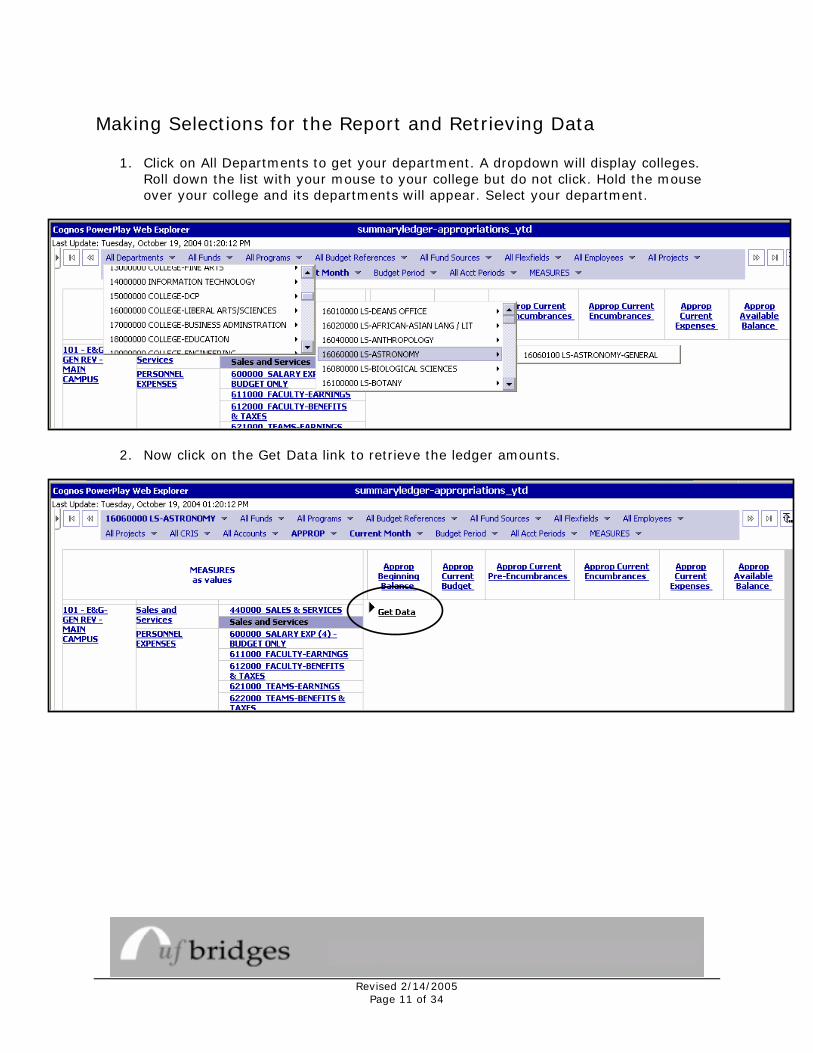
Making Selections for the Report and Retrieving Data
1. Click on All Departments to get your department. A dropdown will display colleges. Roll down the list with your mouse to your college but do not click. Hold the mouse over your college and its departments will appear. Select your department.
2. Now click on the Get Data link to retrieve the ledger amounts.
Revised 2/14/2005
Page 11 of 34

Viewing the Summary Ledger Data How do we read this? Let's take a closer look.
1. The report will show only the Fund and Account column headings that contain activity.
(Scroll down)
Report shows only the Funds and Accounts that have activity.
Revised 2/14/2005
Page 12 of 34
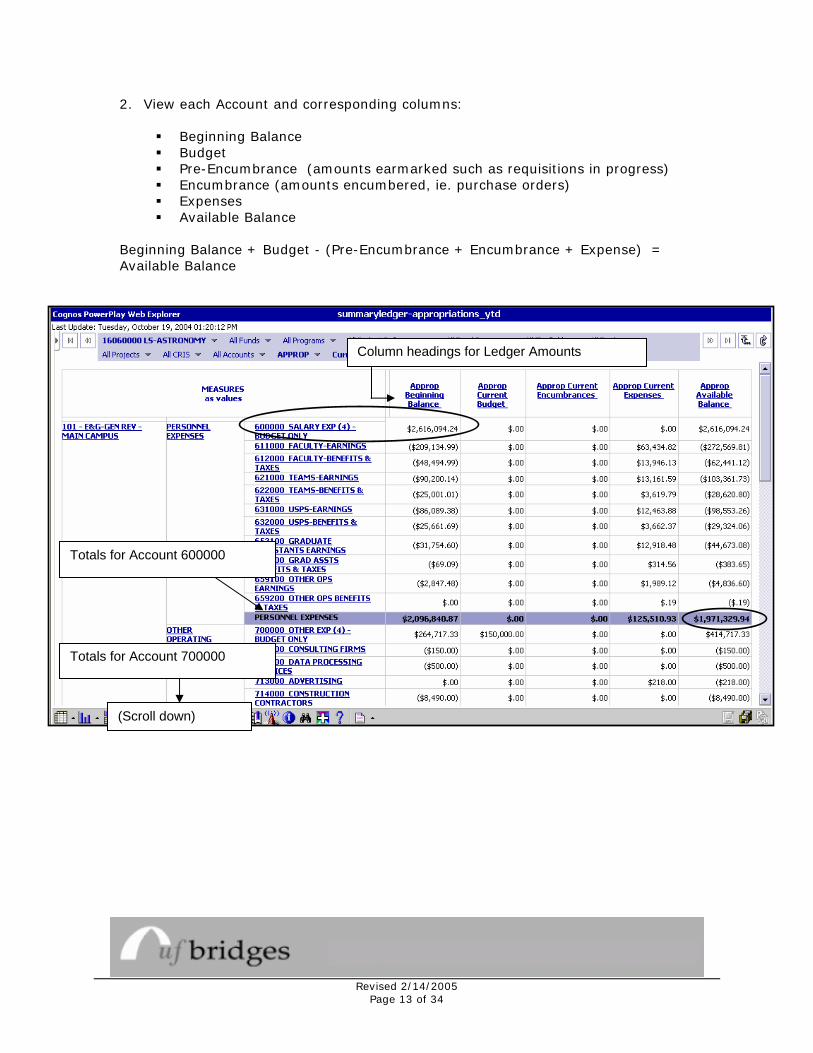
2. View each Account and corresponding columns:
Beginning Balance Budget Pre-Encumbrance (amounts earmarked such as requisitions in progress) Encumbrance (amounts encumbered, ie. purchase orders) Expenses Available Balance
Beginning Balance + Budget - (Pre-Encumbrance + Encumbrance + Expense) = Available Balance
(Scroll down)
Totals for Account 700000
Column headings for Ledger Amounts
Totals for Account 600000
Revised 2/14/2005
Page 13 of 34
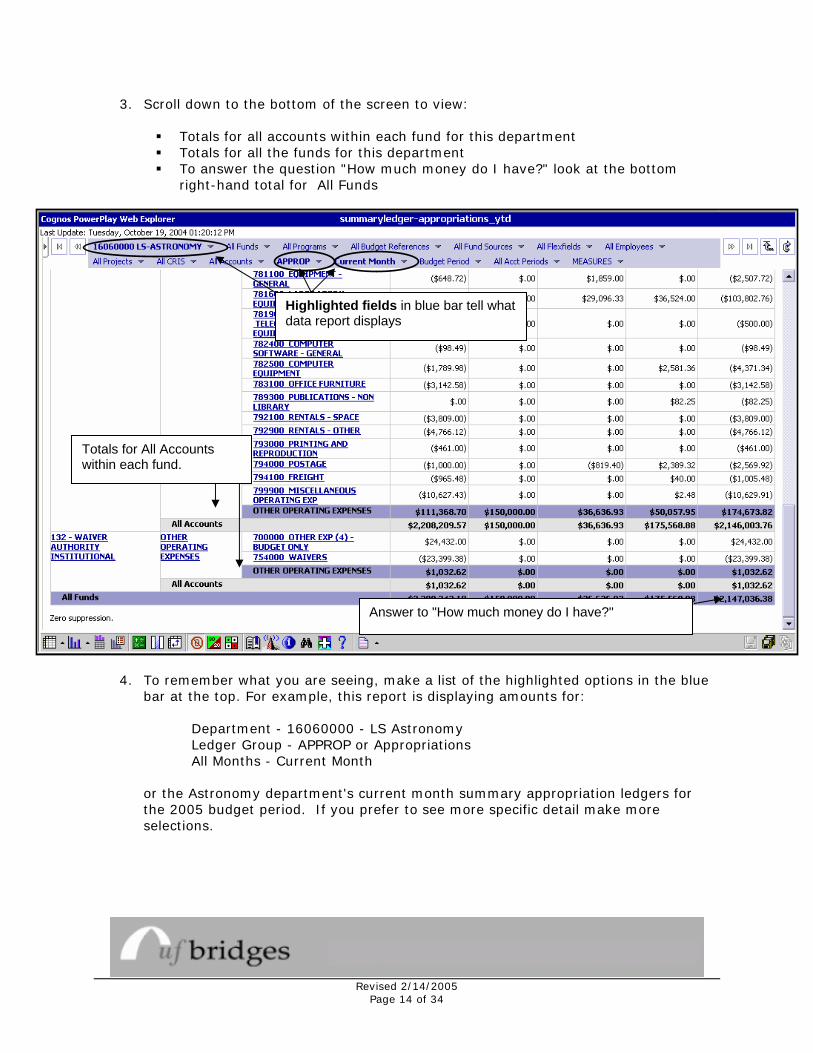
3. Scroll down to the bottom of the screen to view:
Totals for all accounts within each fund for this department Totals for all the funds for this department To answer the question "How much money do I have?" look at the bottom
right-hand total for All Funds
Highlighted fields in blue bar tell what data report displays
Answer to "How much money do I have?"
Totals for All Accounts within each fund.
4. To remember what you are seeing, make a list of the highlighted options in the blue
bar at the top. For example, this report is displaying amounts for: Department - 16060000 - LS Astronomy Ledger Group - APPROP or Appropriations All Months - Current Month
or the Astronomy department's current month summary appropriation ledgers for the 2005 budget period. If you prefer to see more specific detail make more selections.
Revised 2/14/2005
Page 14 of 34
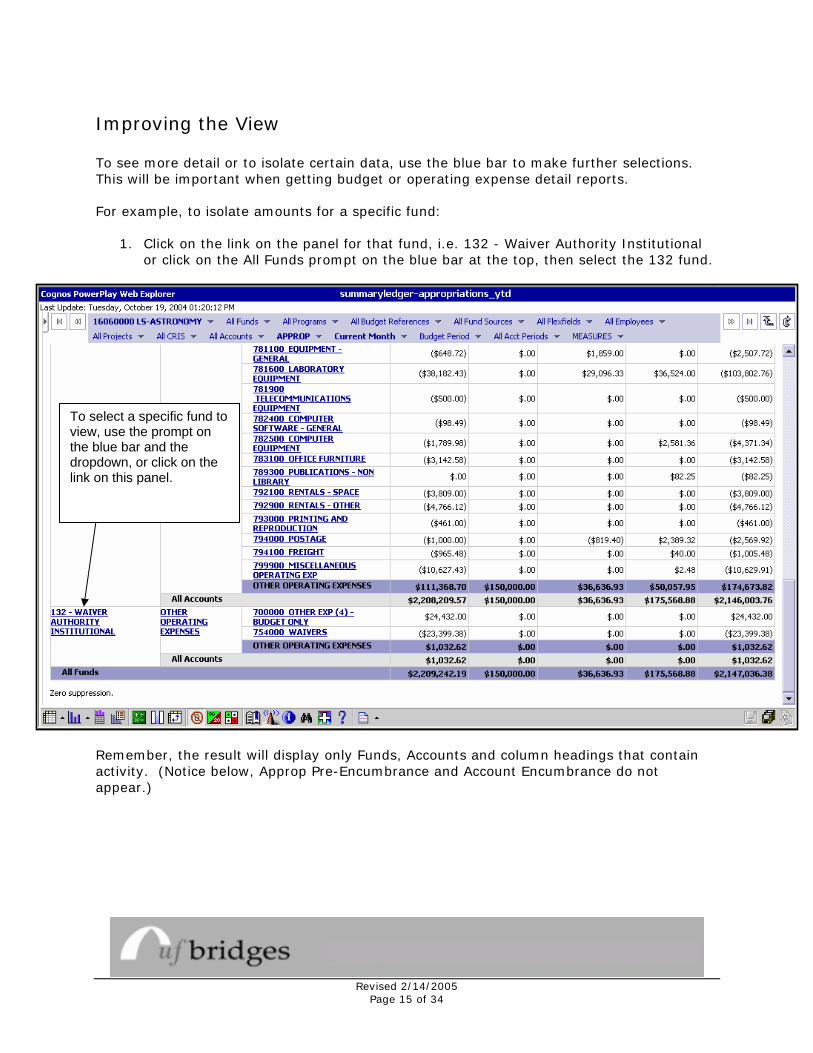
Improving the View To see more detail or to isolate certain data, use the blue bar to make further selections. This will be important when getting budget or operating expense detail reports. For example, to isolate amounts for a specific fund:
1. Click on the link on the panel for that fund, i.e. 132 - Waiver Authority Institutional or click on the All Funds prompt on the blue bar at the top, then select the 132 fund.
To select a specific fund to view, use the prompt on the blue bar and the dropdown, or click on the link on this panel.
Remember, the result will display only Funds, Accounts and column headings that contain activity. (Notice below, Approp Pre-Encumbrance and Account Encumbrance do not appear.)
Revised 2/14/2005
Page 15 of 34
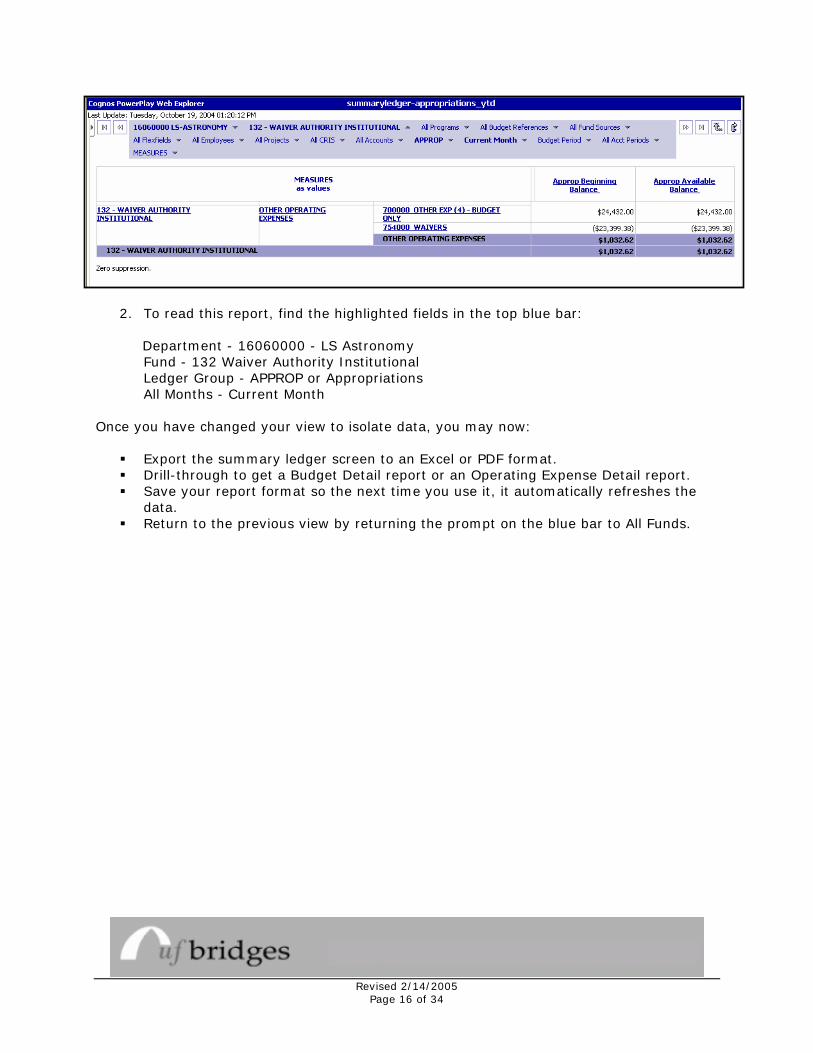
2. To read this report, find the highlighted fields in the top blue bar:
Department - 16060000 - LS Astronomy Fund - 132 Waiver Authority Institutional Ledger Group - APPROP or Appropriations All Months - Current Month Once you have changed your view to isolate data, you may now:
Export the summary ledger screen to an Excel or PDF format. Drill-through to get a Budget Detail report or an Operating Expense Detail report. Save your report format so the next time you use it, it automatically refreshes the
data. Return to the previous view by returning the prompt on the blue bar to All Funds.
Revised 2/14/2005
Page 16 of 34

Exporting the Report to Excel or PDF For example, this report is for the Astronomy department showing the summary ledger for the Appropriation Current Expenses column only.
1. To export to another format, click on the small triangle at the bottom center of the screen.
Select Export CSV to export to Excel or Export PDF to export to a PDF file.
Click on the triangle.
2. Follow the prompts that pop-up on your screen. 3. You may need to have Excel set up properly to work with your browser. 4. Once the report is in Excel format, work with the columns to adjust it.
Revised 2/14/2005
Page 17 of 34

Revised 2/14/2005
Page 18 of 34
Revised 2/14/2005
Page 18 of 34
Drill-Through Reports to get Detail There are two kinds of detail reports available:
Detailed transaction data - Use Operating Expenses Detailed budget data - Use Budget Inquiry
To do a drill-through report, only use the blue bar prompts to narrow your terms for the detail report. Do not use the column headings or the screen view to tailor your report. Only the blue bar prompts, except for Measures, define the report. Measures and column headings only work to change the screen display. Instead, click on the Appropriations prompt to select a specific ledger within Appropriations: Appropriations Encumbrance Appropriations Expense Appropriations Pre-Encumbrance If none are selected, the detail report will include all of them as part of the Appropriations prompt. Likewise, to create a Drill-Through report for Grants you may select a Ledger group from within KKGMCHD or Grants:
Grants Child Enc (Encumbrance) Ledger Grants Child Expense Ledger Grants Child PreEnc (Pre-Encumbrance) Ledger
Revised 2/14/2005
Page 19 of 34

Example 1
1. Select Grants Child Expense Ledger as shown below:
5. Select Grants Child Expense Ledger. Notice the column headings or Measures.
6. Click on the Drill Through icon at the bottom.
Revised 2/14/2005
Page 20 of 34

7. At the Drill Through screen, select your report:
8. Below is a Ledger Detail Report for a Grants Child Expense Ledger as selected.
To do a Budget Inquiry Detail Report in a spreadsheet format:
1. Open Excel on the desktop before proceeding.
2. Use the blue bar prompts to define the report. 3. Scroll down and click on the Drill-Through icon on the bottom bar.
4. Select a report from the Drill Through panel. This example uses a Spreadsheet format.
Revised 2/14/2005
Page 21 of 34

5. When the report is ready, a dialog box appears:
6. You may save it or open the report to view it first. If you save it from this dialog box, it will save it separately outside of the browser.
This is part of a Budget Inquiry Spreadsheet report:
Revised 2/14/2005
Page 22 of 34
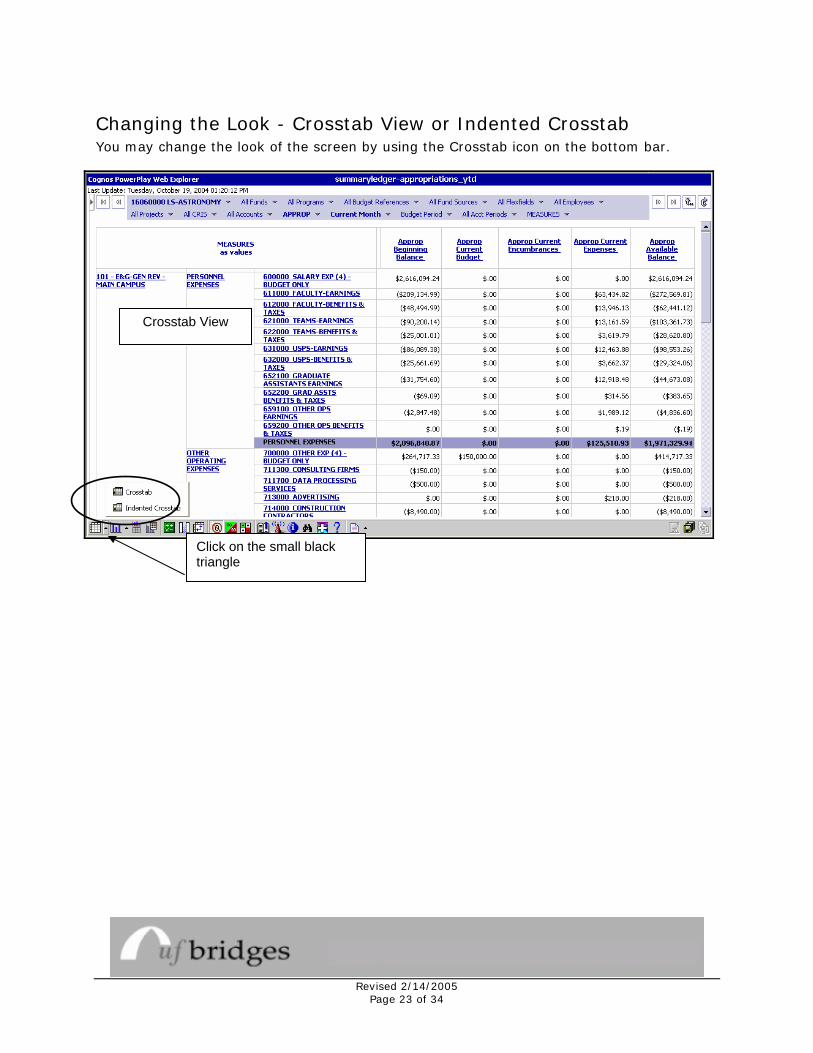
Changing the Look - Crosstab View or Indented Crosstab You may change the look of the screen by using the Crosstab icon on the bottom bar.
Crosstab View
Click on the small black triangle
Revised 2/14/2005
Page 23 of 34
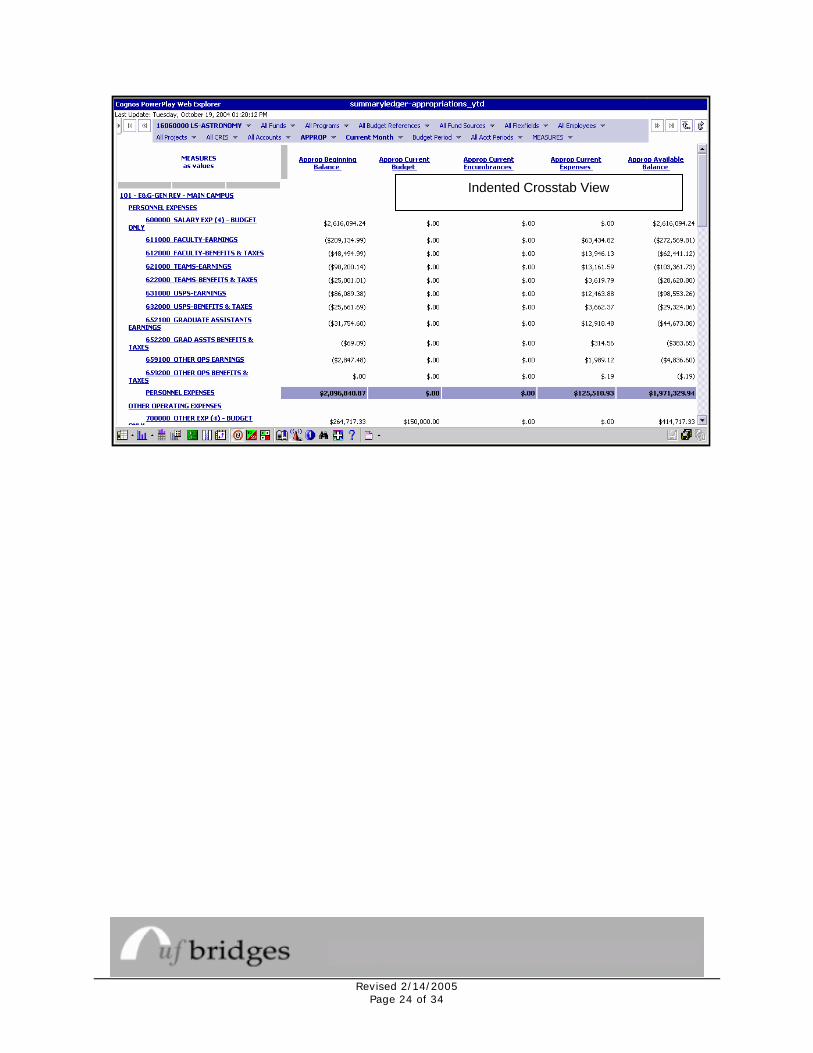
Indented Crosstab View
Revised 2/14/2005
Page 24 of 34
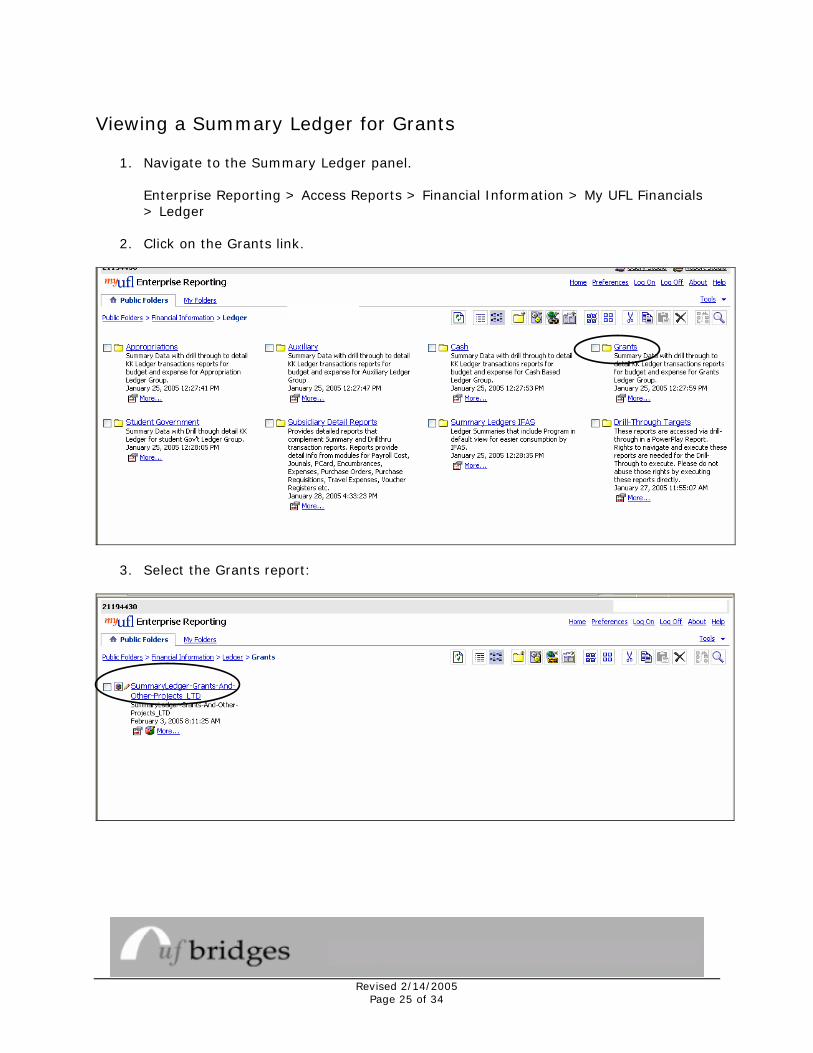
Viewing a Summary Ledger for Grants
1. Navigate to the Summary Ledger panel. Enterprise Reporting > Access Reports > Financial Information > My UFL Financials > Ledger
2. Click on the Grants link.
3. Select the Grants report:
Revised 2/14/2005
Page 25 of 34

4. Follow the same steps as when creating a report for the Appropriations ledger group:
Click on the Wrapping On icon to see all of the blue bar prompts Remember, the prompts include ChartFields, Time Periods and the Ledger Group.
For Grants it is KKGMCHD.
ChartFields
Ledger Group Time Periods
5. For example, to find a project click on All Projects.
6. Click on GRANT.
7. Find the first five digits of your project number and roll the mouse over it. The box will expand with complete project numbers. Select your project.
8. Click on the Get Data link to retrieve data.
Revised 2/14/2005
Page 26 of 34
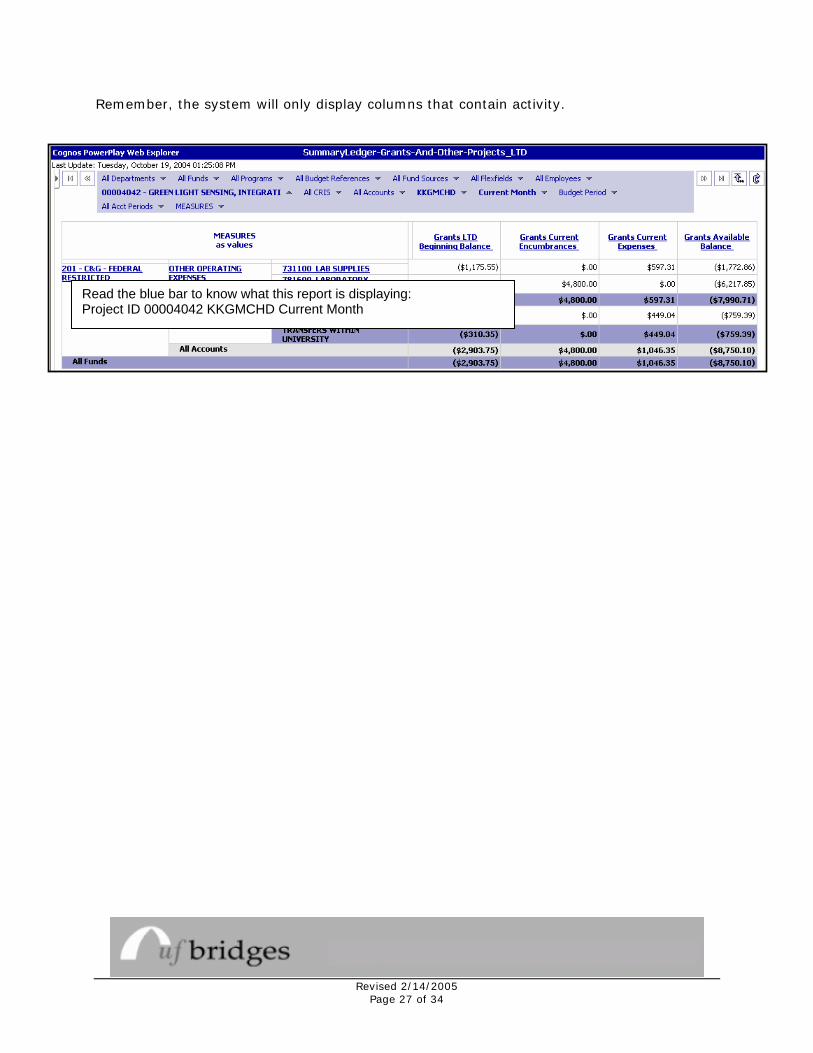
Remember, the system will only display columns that contain activity.
Read the blue bar to know what this report is displaying: Project ID 00004042 KKGMCHD Current Month
Revised 2/14/2005
Page 27 of 34
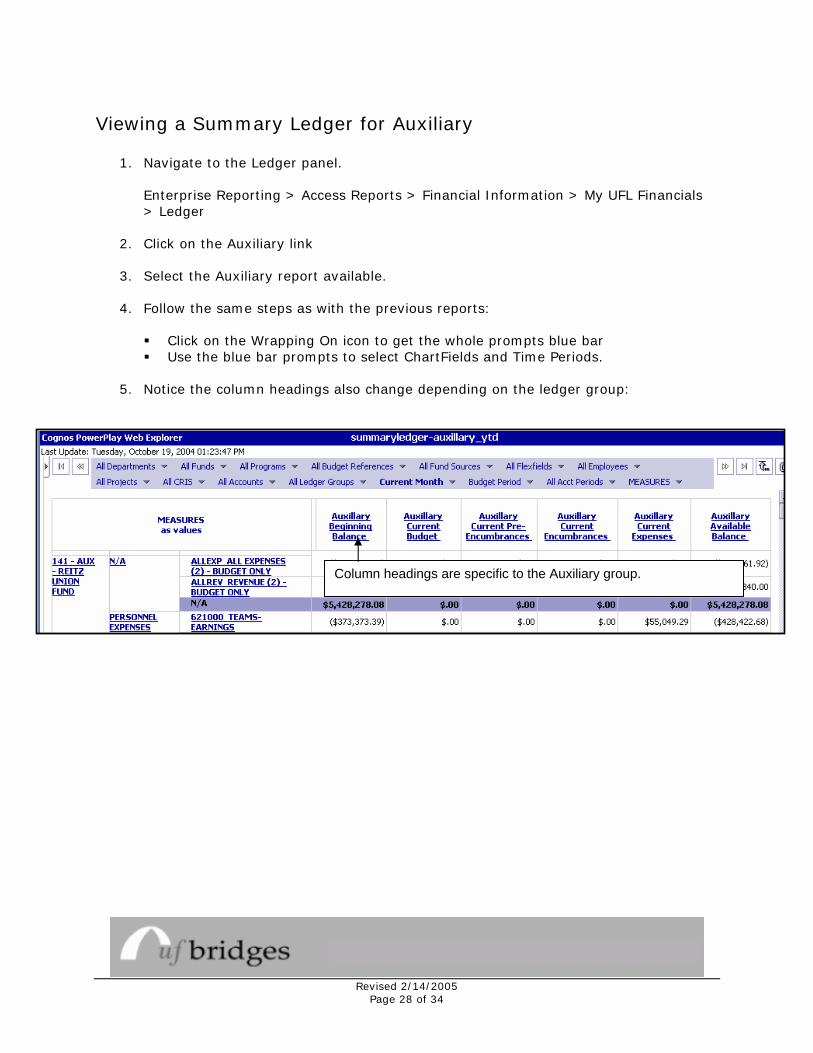
Viewing a Summary Ledger for Auxiliary
1. Navigate to the Ledger panel. Enterprise Reporting > Access Reports > Financial Information > My UFL Financials > Ledger
2. Click on the Auxiliary link
3. Select the Auxiliary report available. 4. Follow the same steps as with the previous reports:
Click on the Wrapping On icon to get the whole prompts blue bar Use the blue bar prompts to select ChartFields and Time Periods.
5. Notice the column headings also change depending on the ledger group:
Column headings are specific to the Auxiliary group.
Revised 2/14/2005
Page 28 of 34
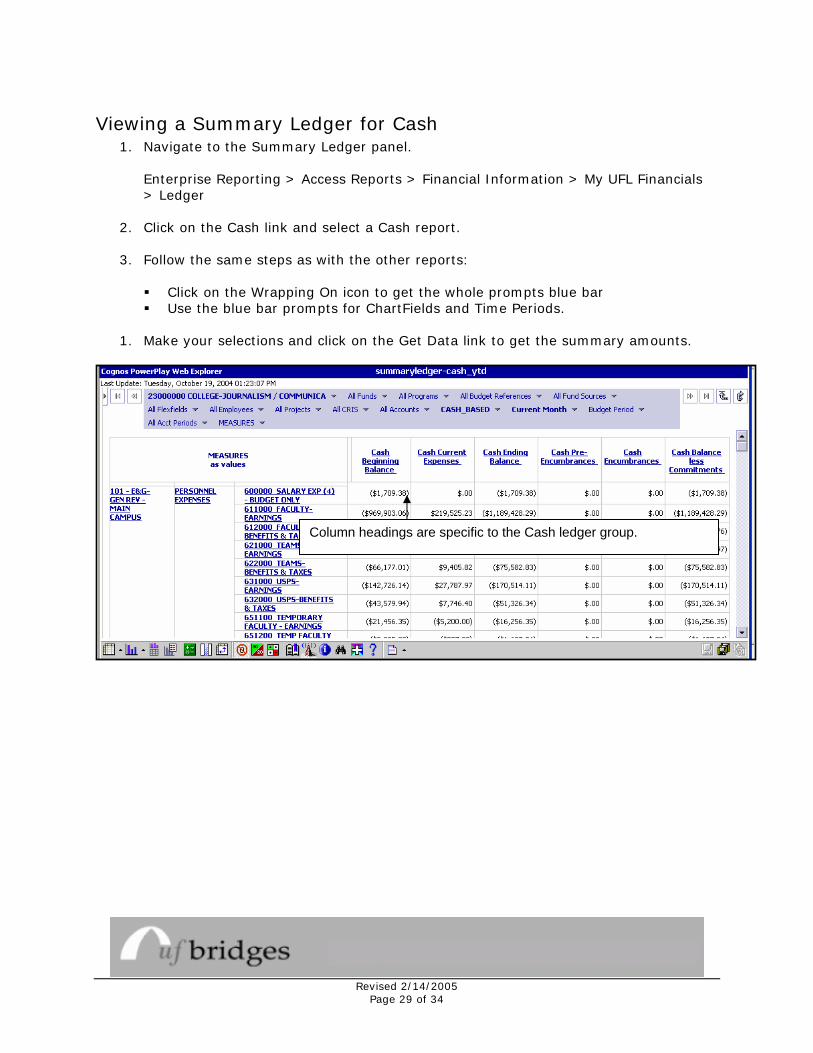
Viewing a Summary Ledger for Cash 1. Navigate to the Summary Ledger panel.
Enterprise Reporting > Access Reports > Financial Information > My UFL Financials > Ledger
2. Click on the Cash link and select a Cash report.
3. Follow the same steps as with the other reports:
Click on the Wrapping On icon to get the whole prompts blue bar Use the blue bar prompts for ChartFields and Time Periods.
1. Make your selections and click on the Get Data link to get the summary amounts.
Column headings are specific to the Cash ledger group.
Revised 2/14/2005
Page 29 of 34
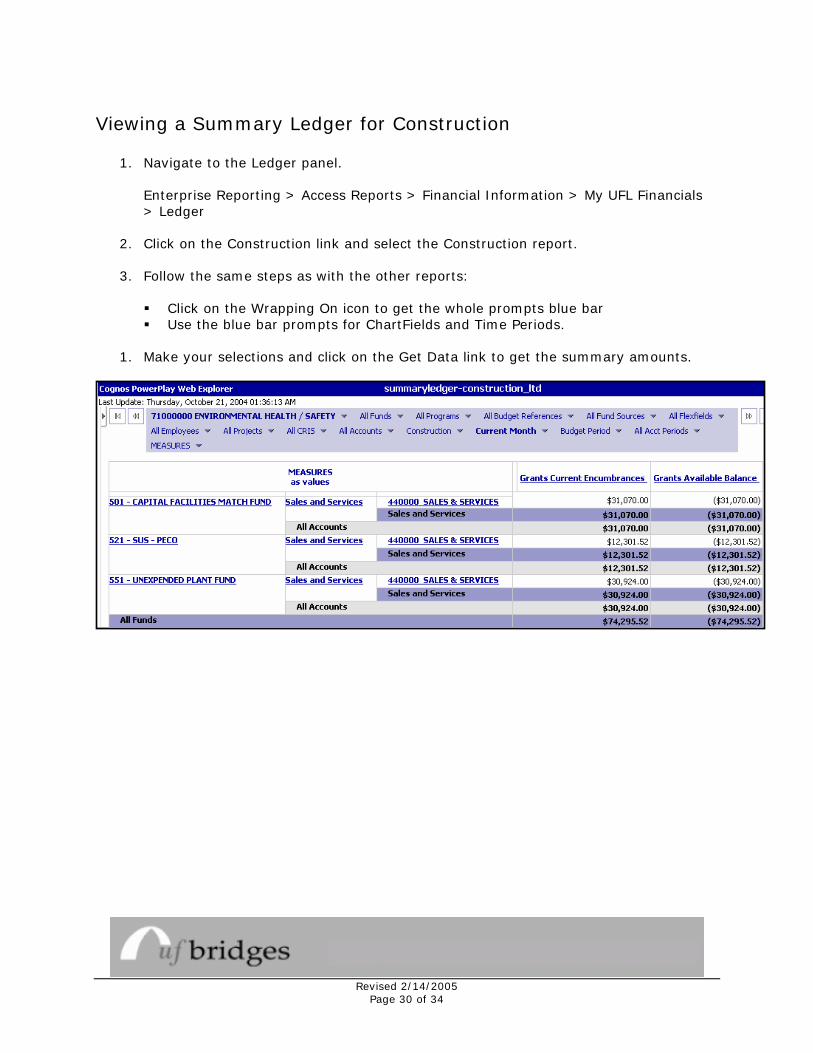
Viewing a Summary Ledger for Construction
1. Navigate to the Ledger panel. Enterprise Reporting > Access Reports > Financial Information > My UFL Financials > Ledger
2. Click on the Construction link and select the Construction report.
3. Follow the same steps as with the other reports:
Click on the Wrapping On icon to get the whole prompts blue bar Use the blue bar prompts for ChartFields and Time Periods.
1. Make your selections and click on the Get Data link to get the summary amounts.
Revised 2/14/2005
Page 30 of 34

Saving the Report When you save the report two things happen:
The format is saved so you do not have to make your selections again. Each time you open it, the report will retrieve new data.
1. Click on the Save As icon at the bottom right of the screen. It looks like a floppy disk.
2. Default information will appear in the Name and Description boxes, which you may elect to change.
3. Click on the OK button.
Revised 2/14/2005
Page 31 of 34
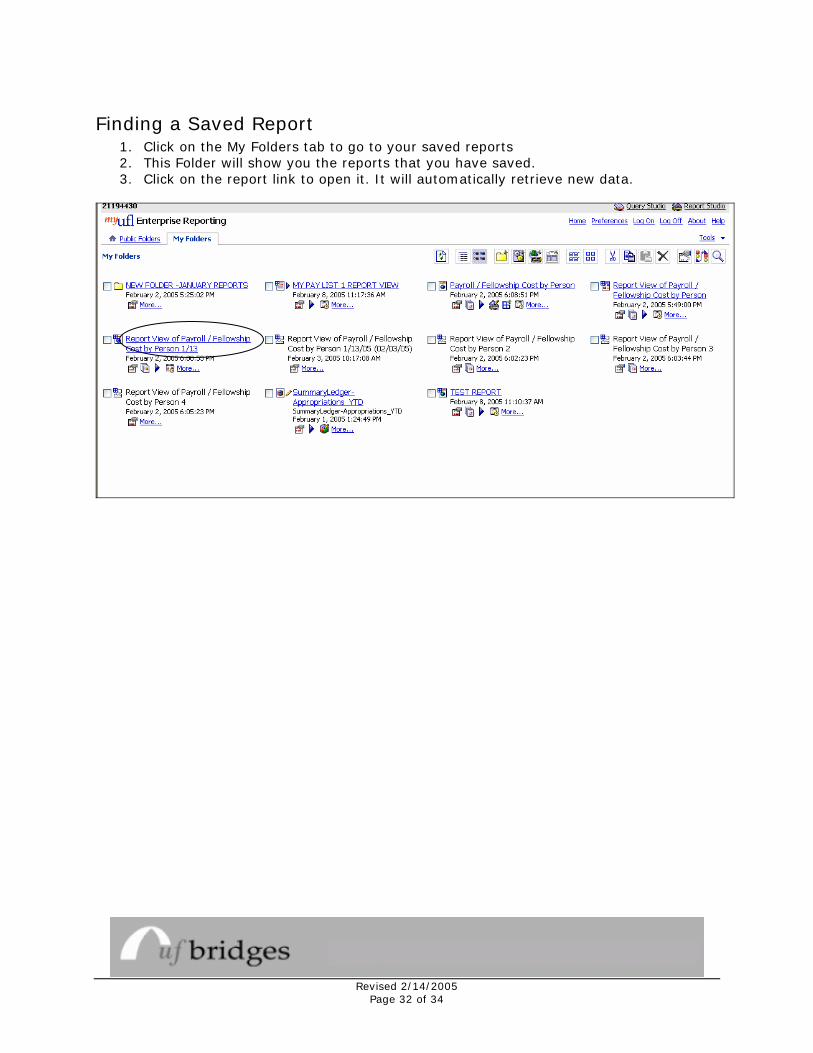
Finding a Saved Report 1. Click on the My Folders tab to go to your saved reports 2. This Folder will show you the reports that you have saved. 3. Click on the report link to open it. It will automatically retrieve new data.
Revised 2/14/2005
Page 32 of 34

Creating a New Folder You may create a new folder to organize your saved reports.
1. You may select the Folder Icon from Public Folders or My Folders to create a new folder.
2. Enter a name and a description, the click on Finish.
The My Folders tab will now include the saved folder, New Folder February Reports.
Revised 2/14/2005
Page 33 of 34

Best Practices Do not use the Back button. Use the blue bar prompts to drive your reports. Study the screens and report formats to become familiar with the tools.
Revised 2/14/2005
Page 34 of 34