ENTERPRISE Pool Fund Study: Solar/Wind Hybrid … · ENTERPRISE Pool Fund Study: Solar/Wind Hybrid...
103
ENTERPRISE Pool Fund Study: Solar/Wind Hybrid Renewable Power Generator for a Dynamic Message Sign Final Report Prepared By: Taek Kwon (Principal Investigator) Ryan Weidemann (Research Assistant) Department of Electrical and Computer Engineering University of Minnesota Duluth February 2009 Published by ENTERPRISE SPR-3 (020) Pooled Fund Study This report represents the results of research conducted by the author and does not necessarily represent the view or policy of the Minnesota Department of Transportation and/or the ENTERPRISE Pooled Fund. This report does not contain a standard or specified technique. The author and the ENTERPRISE Pooled Fund do not endorse products or manufacturers. Trade or manufacturers’ names appear herein solely because they are considered essential to this report.
-
Upload
nguyenthuy -
Category
Documents
-
view
218 -
download
0
Transcript of ENTERPRISE Pool Fund Study: Solar/Wind Hybrid … · ENTERPRISE Pool Fund Study: Solar/Wind Hybrid...

ENTERPRISE Pool Fund Study: Solar/Wind Hybrid Renewable Power Generator
for a Dynamic Message Sign
Final Report
Prepared By:
Taek Kwon (Principal Investigator) Ryan Weidemann (Research Assistant)
Department of Electrical and Computer Engineering University of Minnesota Duluth
February 2009
Published by
ENTERPRISE SPR-3 (020) Pooled Fund Study
This report represents the results of research conducted by the author and does not necessarily represent the view or policy of the Minnesota Department of Transportation and/or the ENTERPRISE Pooled Fund. This report does not contain a standard or specified technique. The author and the ENTERPRISE Pooled Fund do not endorse products or manufacturers. Trade or manufacturers’ names appear herein solely because they are considered essential to this report.

ACKNOWLEDGEMENTS This research was sponsored by the ENTERPRISE Pooled Fund. The authors thank
Roger Sowder and Jeff Mast of Mn/DOT for their efforts in installation of the cabinets, mounting pole, solar panels, and wind turbine. Kevin Schmidt at Mn/DOT District-3 helped to find contractors for foundation construction and monitored the progress of construction, and also tested the Dynamic Message Sign (DMS) for many days, providing invaluable test data. Ray Starr at Mn/DOT represented Minnesota for the ENTERPRISE Pooled Fund meetings and oversaw the project. The authors thank him for his guidance on the project. Last but not least, the authors thank the member states and committee of the ENTERPRISE Pooled Fund for their interest and support for this project.

TABLE OF CONTENTS
CHAPTER 1 – INTRODUCTION .................................................................................... 1
CHAPTER 2 – DESIGN OF SOLAR/WIND HYBRID POWER GENERATOR ............... 3
2.1 System Design Goals..............................................................................................................................................3
2.2 Design Preparation ................................................................................................................................................3 2.2.1 Project Site and System Location ....................................................................................................................3 2.2.2 Weather Data Analysis ....................................................................................................................................4 2.2.3 Dynamic Message Sign....................................................................................................................................6
2.3 System Design ........................................................................................................................................................7 2.3.1 Power Demand Estimate and Battery Bank Sizing..........................................................................................7 2.3.2 PV Panels and Wind Turbine Sizing................................................................................................................9 2.3.3 Wind Load for Mounting Pole .......................................................................................................................12 2.3.4 Mounting Pole Design ...................................................................................................................................13 2.3.5 Charge Controllers and Inverter.....................................................................................................................16 2.3.6 Charge Monitoring Circuit.............................................................................................................................18 2.3.7 Data Logging .................................................................................................................................................20 2.3.8 Final Design...................................................................................................................................................21
CHAPTER 3 – IMPLEMENTATION.............................................................................. 23
3.1 Battery Cabinet....................................................................................................................................................23
3.2 PV Panel Rack and Wind Turbine Assembly ...................................................................................................25
3.3 Control Cabinet ...................................................................................................................................................25
3.4 Pole, Wind Turbine, and Solar Panel Installation ............................................................................................27
3.5 Solar and Wind Charge Control ........................................................................................................................31
3.6 Cost Analysis ........................................................................................................................................................32
CHAPTER 4 - DATA ANALYSIS.................................................................................. 33
4.1 Introduction .........................................................................................................................................................33
4.2 Data Calibration ..................................................................................................................................................33 4.2.1 The Need for Data Calibration.......................................................................................................................33 4.2.2 HRPG Design ................................................................................................................................................34
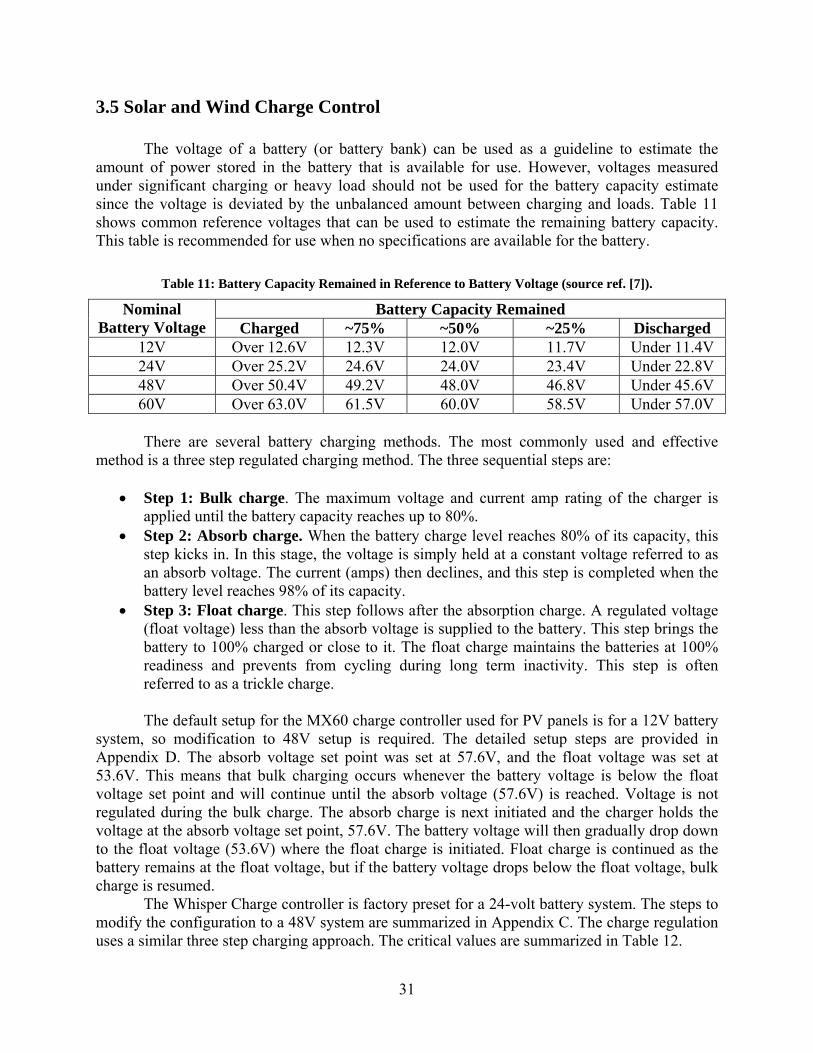
4.3 Data Analysis........................................................................................................................................................36 4.3.1 Monthly Ah Analysis.....................................................................................................................................36 4.3.2 Battery Bank Charge Level Analysis.............................................................................................................39 4.3.3 Power Generation Pattern ..............................................................................................................................40
4.4 DMS Testing.........................................................................................................................................................42
CHAPTER 5 - DESIGN STEPS .................................................................................... 44
CHAPTER 6 - CONCLUSION....................................................................................... 45
REFERENCES.............................................................................................................. 47
APPENDIX A: MOUNTING POLE DESIGN ................................................................. 48
APPENDIX B: SOLAR PANEL ASSEMBLY................................................................ 56
APPENDIX C: WIND TURBINE AND CONTROLLER ASSEMBLY ............................ 61
APPENDIX D: OUTBACK MX60 MPPT CHARGE CONTROLLER SET UP............... 67
APPENDIX E: RAW DAILY DATA ............................................................................... 70
APPENDIX F: CALIBRATED DAILY DATA................................................................. 83
LIST OF FIGURES
FIGURE 1: PROJECT SITE (SOURCE REF. [3]). ...................................................................................................................3 FIGURE 2: PROJECT SITE DIAGRAM. ................................................................................................................................4 FIGURE 3: NATIONAL AVERAGE SOLAR RADIATION ENERGY MAP FOR JULY (SOURCE REF. [2])......................................5 FIGURE 4: WINTER WIND MAP (SOURCE REF. [2]). ..........................................................................................................6 FIGURE 5: IMAGE OF ADDCO BRICK DMS SYSTEM INSTALLED AT THE PROJECT SITE. ...............................................6 FIGURE 6: PVX2240T AGM BATTERY...........................................................................................................................9 FIGURE 7: BATTERY CONNECTIONS FOR THE BATTERY BANK.........................................................................................9 FIGURE 8: MONTHLY ENERGY OUTPUT OF AIR-X PER ANNUAL AVERAGE WIND SPEED (SOURCE REF. [6]). ..................11 FIGURE 9: MOUNTING POLE DESIGN SPECIFICATION. ....................................................................................................15 FIGURE 10: OUTBACK MX60 PV CHARGE CONTROLLER. ............................................................................................16 FIGURE 11: WHISPER 200 CHARGE CONTROLLER. ........................................................................................................17 FIGURE 12: OUTBACK VFX3638 OFF-GRID INVERTER. ................................................................................................17 FIGURE 13: 50MV/500A SHUNT. ..................................................................................................................................18 FIGURE 14: TS-7260 SBC. ...........................................................................................................................................19 FIGURE 15: DATA LOGGING SYSTEM. ...........................................................................................................................20 FIGURE 16: SOLAR/WIND HRPG CIRCUIT DESIGN........................................................................................................22 FIGURE 17: BATTERY CABINET SPECIFICATION. ...........................................................................................................23 FIGURE 18: BATTERY CABINET AND FOUNDATION DIMENSIONS. ..................................................................................24 FIGURE 19: BATTERY CABINET WITH 32 BATTERIES. ....................................................................................................25 FIGURE 20: CONTROL CABINET. ...................................................................................................................................26 FIGURE 21: SHUNT PANEL. ...........................................................................................................................................26 FIGURE 22: INSTALLATION OF THE POLE. .....................................................................................................................27 FIGURE 23: INSTALLATION OF THE WIND TURBINE. ......................................................................................................27 FIGURE 24: INSTALLATION OF THE SOLAR PANEL. ........................................................................................................28 FIGURE 25: SOLAR PANEL TILT ANGLE (SOURCE REF. [5]). ...........................................................................................29 FIGURE 26: COMPLETED HRPG POLE...........................................................................................................................30 FIGURE 27: SIMPLIFIED HRPG CIRCUIT........................................................................................................................34 FIGURE 28: MONTHLY AH TOTALS FOR SOLAR, WIND, AND INVERTER FROM NOV. 2007 – OCT. 2008. ........................37 FIGURE 29: MONTHLY AH TOTALS FOR SOLAR + WIND AND INVERTER FROM NOV. 2007 – OCT. 2008. .......................38 FIGURE 30: DAILY AVERAGE BATTERY VOLTAGE FROM NOV. 2007 – OCT. 2008.........................................................39 FIGURE 31: MONTHLY AVERAGE BATTERY VOLTAGE FROM NOV. 2007 – OCT. 2008...................................................40 FIGURE 32: HOURLY SOLAR AND WIND AH ON 8/21/08. ...............................................................................................41 FIGURE 33: AH TOTALS FOR SOLAR, WIND, INVERTER, AND AVERAGE BATTERY VOLTAGE FOR FEBRUARY 2008. .......41 FIGURE 34: IMAGES OF THE DMS TEST MESSAGES. ......................................................................................................42 FIGURE 35: HIGH LOAD TEST USING AN IRON, HEATER, AND 100 WATT BULB...............................................................43
LIST OF TABLES
TABLE 1: CLASSES OF WIND POWER DENSITY AT 10M AND 50M HEIGHT (SOURCE REF. [2]) .........................................5 TABLE 2: BRICK SPECIFICATION (SOURCE REF. [4]) .....................................................................................................7 TABLE 3: SPECIFICATION OF KC170TM (SOURCE REG. [5]) .........................................................................................10 TABLE 4: WHISPER 200 WIND GENERATOR SPECIFICATION (SOURCE REF. [6])............................................................11 TABLE 5: ESTIMATED SEASONAL DAILY ENERGY GENERATION AND DEMANDS .........................................................12 TABLE 6: ESTIMATED SEASONAL DAILY ENERGY GENERATION AND ADJUSTED DEMANDS........................................12 TABLE 7: WIND PRESSURE ...........................................................................................................................................13 TABLE 8: COLUMNS OF THE DATA FILE........................................................................................................................21 TABLE 9: KEY FUNCTIONS ...........................................................................................................................................21 TABLE 10: RECOMMENDED SOLAR PANEL TILT ANGLES (SOURCE REF. [5]). ...............................................................28 TABLE 11: BATTERY CAPACITY REMAINED IN REFERENCE TO BATTERY VOLTAGE (SOURCE REF. [7]). ......................31 TABLE 12: ABSORB/FLOAT VOLTAGE SET POINTS .......................................................................................................32 TABLE 13: PURCHASED COMPONENTS LIST .................................................................................................................32 TABLE 14: ACTUAL SEASONAL DAILY ENERGY GENERATION AND DEMANDS FROM NOV. 2007 – OCT. 2008 ............38 TABLE 15: BATTERY CAPACITY REMAINED FOR A 48V SYSTEM..................................................................................39 TABLE 16: SUMMARY OF DMS TEST MESSAGES..........................................................................................................42 TABLE 17: SIGN TESTS AFTER INVERTER REPLACEMENT ............................................................................................43

EXECUTIVE SUMMARY With increased dependencies on foreign oil, unpredictable oil prices and global warming
concerns, U.S. energy policies have recently shifted to increased use of clean renewable energy. Member states participating in the ENTERPRISE Pooled Fund have also shown strong interest on renewable energy and resulted in supporting this project which demonstrates increased power-supply reliability through solar/wind integrated electricity generation.
Recently, the authors of this report at the University of Minnesota-Duluth have developed a hybrid renewable generator that integrates solar panels with a wind turbine for powering rural Intelligent Transportation Systems (ITS) applications. The effectiveness of this Hybrid Renewable Power Generator (HRPG) was successfully demonstrated through a street lighting application. In most Midwest states in the U.S., solar panels alone are not sufficient to supply reliable power for many ITS applications during the winter months, due to significantly shorter daylight periods. The hybrid technology solves the problem by integrating a wind turbine to the solar only renewable power system. Since winds are stronger in winter in Midwest states, the wind turbine generates more electricity and complements the shortage of solar energy. Furthermore, winter or summer storms often produce little or no solar energy but stronger winds become a good source of energy on stormy days. Therefore, the solar/wind hybrid technology provides higher power reliability, turning stormy, windy days into good electricity generating days.
As the real-world application, a Dynamic Message Sign (DMS) was chosen to be powered by the HRPG. The HRPG was successfully developed and implemented with the DMS at Camp Ripley Junction, MN near the intersection between State Highway 371 and 250th Street. The DMS provides messages to the traffic traveling Southbound Highway 371 and is controlled by District-3 office at Baxter MN. This HRPG consists of a 1,000W wind turbine, three 170W solar panels, thirty-two 250 amp hours (Ah) batteries, a 3,000W DMS, two charge controllers, a 3,600W inverter, and simple control circuits.
The design of a HRPG must carefully consider the available solar and wind resources. With the aid of solar radiation and wind energy maps, and the power ratings of the selected solar panels and wind turbine, an estimate of the daily seasonal energy generation can be calculated. Using the specifications of the DMS, a daily energy demand can be calculated. If the estimated daily seasonal energy generation is sufficient enough to provide the estimated daily demand of the DMS, the location, solar panels, and wind turbine have been selected properly. Also, using the estimated daily energy demand of the DMS, battery bank sizing can be done. When considering battery bank capacity, a 7-day continuous supply at 50% of the battery bank capacity was used in this project and is recommended for most rural ITS applications. A storage capacity longer than 7 days may increase the cost without providing much benefit, since the weather condition with no wind and sun for seven consecutive days rarely occurs.
A key component of the HRPG is the mounting pole. The wind turbine is installed on the top of the mounting pole. Since wind increases in strength further from the ground, the wind turbine will produce more power the higher it is installed above ground. However, the higher the mounting pole, the higher the cost. For this application, the tree line at the site became the main factor in determining the height of the mounting pole. The height on the mounting pole was chosen to be 62 feet, which is just above the height of the tree line. The solar panels are also installed on the mounting pole. The height of the solar panels is less of an issue than the wind turbine but they should be installed at a position where there is no chance of a shadows falling on

the face of the panels either by another panel or from a trees or other objects. Also, the solar panels must be angled towards the sun depending on the latitude of the site.
The research team also developed a charge monitoring system that records how much power each source generates and how much the application consumes. The purpose of the charge monitoring system is to investigate how reliably the HRPG can support the power needs of the DMS. The charge monitoring consists of three shunts connected in series on the negative rail of the solar panels, wind turbine, and inverter. Since the shunts are connected to the negative rails, low-side measurements were collected. These shunts are monitored by an analog-to-digital converter which is connected to a data logging microcontroller. Data is logged in 15 minute intervals 24 hours a day. The data logged includes battery bank voltage, average battery bank voltage, solar panel instantaneous amps, solar panel Ah, wind turbine instantaneous amps, wind turbine Ah, inverter instantaneous amps, inverter Ah, and temperature. Data is stored in an external USB device and can also be viewed on-site using an LCD screen and keypad.
The final wiring of the HRPG was completed on July 17, 2007 and data collection began on August 8, 2007 until December 28, 2008. For data analysis, a full year of data was analyzed, from November 1, 2007 to October 31, 2008. Due to problems with low-side measurements in the HRPG, the data needed to be calibrated. The problem occurred due to a path for current to flow directly from the wind turbine into the inverter and not be recorded by the data logging system. A simple software program was created in order to calibrate the original data to account for this problem. Also, as part of the data analysis, the DMS was tested using several different messages, i.e., 8, 13, 18, and 34 character sets up to 13 continuous days (312 hours). In all tests, the HRPG reliably supplied the power. Finally, general design steps were created in order to aid in the future design of a HRPG independent of battery bank voltage and the target application.
In conclusion, this research demonstrated that a reliable renewable power generator can be easily built using off-the-shelf products for rural ITS applications. For increasing the power reliability, solar panels and a wind turbine were integrated as a unified system on a single pole. This design is aesthetically pleasant and can be duplicated at most highways and rural locations.

1
CHAPTER 1 – INTRODUCTION With increased dependencies on foreign oil, unpredictable oil prices and global warming
concerns, U.S. energy policies increasingly emphasize the use of clean, renewable energy, especially in the area of solar, wind, and hydrogen resources. The member States of the ENTERPRISE Pooled Fund also have supported a broader application of renewable energy in Intelligent Transportation Systems (ITS), and this project is an example. This report describes the development and field test results of a solar/wind Hybrid Renewable Power Generator (HRPG) that powers a typical highway Dynamic Message Sign (DMS).
Use of renewable power generators is often scrutinized in terms of its initial cost and the time it takes to recover the recurring cost of equivalent grid power. The researchers of this project found that remote rural ITS applications are the best candidates for the use of renewable power generators, if the decision is purely based on the cost. In Minnesota for example, the cost of bringing a utility power line to a rural intersection is approximately $3 per foot in 2007. For a location just 20 miles away from a power distribution center, bringing power costs about $316,800. Considering additional monthly recurring fees of grid power, such a high cost for the deployment of an ITS application is difficult to justify for most Transportation Departments. On the contrary, the cost of solar/wind generated power is independent of the distance to the location, and the total cost including the initial investment and maintenance (no monthly electric fees) could be significantly lower than that of utility grid power (depending on the location). Assuming that the cost of bringing the grid power can be easily estimated by utility companies, justification of a renewable power generator in terms of cost can be easily computed. In a rule of thumb, many rural ITS applications require power less than 80 watts. Applications in this category include small DMS, advanced warning signals/flashers, animal crossing detection, and road-weather information systems (RWIS). A renewable power generator supporting these applications could be easily built with less than $5,000, and the decision can be made based on a simple cost analysis. (Note: The figure, $5,000, was obtained based on a previous demonstration project that implements a renewable street light using a HRPG [1].) Therefore, the cost issue can be easily addressed.
Another important issue with renewable power generators is the power reliability. In most Midwest states in the U.S., solar panels alone are not sufficient to supply reliable power to many ITS applications during the winter months, due mainly to significantly shorter daylight time and weaker solar radiation. A hybrid technology solves this problem by integrating photovoltaic (PV) generation with wind generation. According to seasonal wind maps [2] of U.S., winds are stronger in winters in Midwest states. This seasonal wind characteristic suggests that the shortage of electricity generation caused by reduced solar radiation in winter could be readily supplemented by higher electricity generation by stronger wind conditions. Another complementing weather factor is that winter and/or summer storms generally produce stronger winds while they reduce solar radiation. Consequently, solar and wind resources often complement each other, and thus integrating them into a single electricity generator results in higher power-supply reliability under various weather conditions.
The objective of this project was to examine whether a typical DMS can be reliably powered by a solar/wind HRPG. The project location is near a State highway and has an easy access to utility grid power, and thus the location was not selected based on the needs and cost benefits of an HRPG but rather selected based on the convenience of field tests and availability

2
of a DMS for testing. Since solar/wind HRPGs are not available on the market, the researchers designed and put together a solar/wind HRPG using off-the-shelf products. Installation was done with the help and resources provided by the Minnesota Department of Transportation (Mn/DOT). The DMS was originally designed and installed to be powered by a grid AC source. Consequently, power efficiency was not a concern in the design. This project replaced the grid AC power supply with a solar/wind HRPG.
This report is composed as follows. Chapter 2 describes a step-by-step design procedure of the HRPG implemented. Since solar radiation and winds are highly dependent upon the location and season, a careful analysis must be performed based on the statistics of weather data. The details on how to estimate the power generation using the available solar/wind maps are shown. The estimate of wind and solar resources and the power requirement of the DMS are then used for designing the solar/wind HRPG and computing the battery bank requirement. In the design procedure, part selection is important and the details are provided. Chapter 3 describes how the HRPG was installed. This includes installation of the pole, mounting the solar panels and wind turbine, battery and controller cabinet installation, controller setups, and the total cost of the HRPG. Data was collected from the HRPG via the data logging system. A total of 509 days worth of data was collected. Chapter 4 analyzes this data and also summarizes the testing of the DMS. Chapter 5 describes a generalized design procedure that needs to be considered when designing a HRPG for an application. Finally, Chapter 6 describes conclusions of this project.

3
CHAPTER 2 – DESIGN OF SOLAR/WIND HYBRID POWER GENERATOR
2.1 System Design Goals
The design objective is to develop a self-sufficient system that generates and stores electric power whenever solar radiation or wind is available, and then provide enough power to sustain continuous operation of the given DMS. The battery bank is sized to retain 50% of its full capacity after seven days of continuous power supply to the DMS without any charging.
2.2 Design Preparation
Before the actual design of the solar/wind HRPG can be started, the project location and the application to power must be identified. More specifically, the power demand for the system and average wind and solar resource availability must be analyzed and estimated. This section describes these data preparations for the design.
2.2.1 Project Site and System Location The project site is located at the Camp Ripley Junction, MN, near the intersection of State
Highway 371 and 250th Street as shown in the aerial photo in Figure 1.
Figure 1: Project site (source ref. [3]).
The DMS is located on the opposite side of the HRPG providing messages to the traffic traveling southbound Highway 371. The messages displayed on the DMS are controlled by Mn/DOT District-3 office in Baxter, MN. Conduit and electrical cable from the HRPG runs under 250th Street to a telephone and electrical pole and then across both north and south bound
4
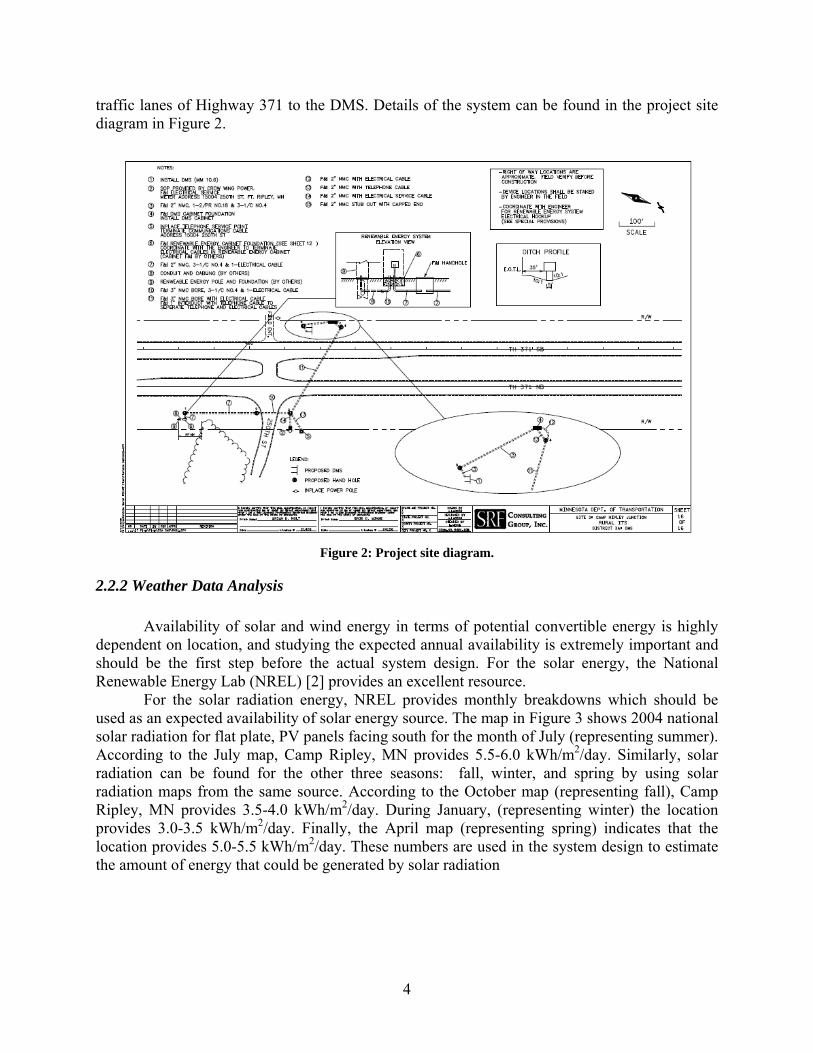
traffic lanes of Highway 371 to the DMS. Details of the system can be found in the project site diagram in Figure 2.
Figure 2: Project site diagram.
2.2.2 Weather Data Analysis Availability of solar and wind energy in terms of potential convertible energy is highly
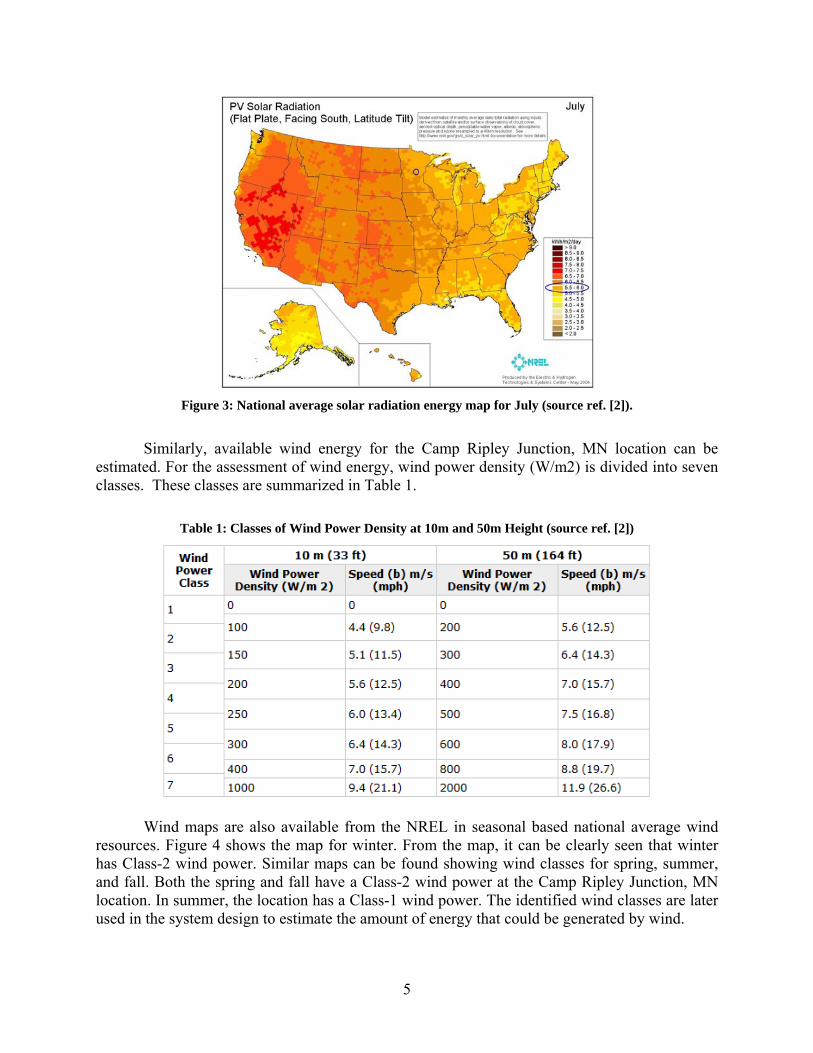
dependent on location, and studying the expected annual availability is extremely important and should be the first step before the actual system design. For the solar energy, the National Renewable Energy Lab (NREL) [2] provides an excellent resource.
For the solar radiation energy, NREL provides monthly breakdowns which should be used as an expected availability of solar energy source. The map in Figure 3 shows 2004 national solar radiation for flat plate, PV panels facing south for the month of July (representing summer). According to the July map, Camp Ripley, MN provides 5.5-6.0 kWh/m2/day. Similarly, solar radiation can be found for the other three seasons: fall, winter, and spring by using solar radiation maps from the same source. According to the October map (representing fall), Camp Ripley, MN provides 3.5-4.0 kWh/m2/day. During January, (representing winter) the location provides 3.0-3.5 kWh/m2/day. Finally, the April map (representing spring) indicates that the location provides 5.0-5.5 kWh/m2/day. These numbers are used in the system design to estimate the amount of energy that could be generated by solar radiation
5
Figure 3: National average solar radiation energy map for July (source ref. [2]).
Similarly, available wind energy for the Camp Ripley Junction, MN location can be
estimated. For the assessment of wind energy, wind power density (W/m2) is divided into seven classes. These classes are summarized in Table 1.
Table 1: Classes of Wind Power Density at 10m and 50m Height (source ref. [2])
Wind maps are also available from the NREL in seasonal based national average wind
resources. Figure 4 shows the map for winter. From the map, it can be clearly seen that winter has Class-2 wind power. Similar maps can be found showing wind classes for spring, summer, and fall. Both the spring and fall have a Class-2 wind power at the Camp Ripley Junction, MN location. In summer, the location has a Class-1 wind power. The identified wind classes are later used in the system design to estimate the amount of energy that could be generated by wind.

6
Figure 4: Winter wind map (source ref. [2]).
2.2.3 Dynamic Message Sign The DMS used for this project is the ADDCO Inc. BRICK Standard Density DMS
(shown in Figure 5), which is compliant with NTCIP and NEMA/TS4. This DMS sign was previously installed by the SRF Consulting Group, Inc. as part of a separate, completed project. The responsibility of this project was to supply power to this DMS unit using a solar/wind HRPG.
Figure 5: Image of ADDCO BRICK DMS system installed at the project site.

7
Table 2: BRICK Specification (Source ref. [4])
Characteristics High Density Standard Density Pixel arrangement 8× 12 5× 7 Number of pixels 96 35 LEDs per pixel (Note 1) 4 4 Number of LEDs 384 140 LED spacing in pixel 0.5 in. (1.27 cm) 1.350 in. (3.4 cm) Pixel spacing 1.625 in. (4.1 cm) 2.745 in. (7.0 cm) LED type 592 nm amber 592 nm amber Minimum character size 10.5 in. (5× 7), 7.125 in. (4× 5) 18 in. Average 24-hour current draw (Note 2) 11.5 Amps 3.5 Amps Absolute maximum current draw (Note 3) 4.8 Amps 1.75 Amps Typical maximum current draw (Note 4) 3.1 Amps 0.7 Amps Nominal voltage 12.0 VDC 12.0 VDC Minimum voltage 10.5 VDC 10.5 VDC Maximum voltage 16.0 VDC 16.0 VDC
Note 1: The model installed in the field had eight LEDs per pixel (twice more than specified). Note 2: Average 24 Hour Current --- Current draw over a 24 hour day (assume 12 hours daytime, 12 hours
nighttime) with an average test based display that utilizes approximately 30% of the LEDs pixels for a High Density BRICK, 40% LEDs for a Standard Density BRICK. Units should be Amp Hours.
Note 3: Absolute Maximum Current --- Current limit setting on a BRICK resulting in the worst case current draw in the event of a failure.
Note 4: Typical Maximum Current --- Current draw for a BRICK in maximum ambient light conditions with all of the pixels lit.
The BRICK DMS specification is shown in Table 2. These specifications are for a single
BRICK. The DMS in this system has 36 BRICKS, one BRICK for each character. The researcher later found that this specification was for the newer version DMS and did not accurately match with the installed version. The actual number of LEDs per pixel was eight instead of four. Therefore, the power consumption should be adjusted accordingly. Also, the units for the average 24-hour current draw should be in units of amp hours (Ah) and not amps.
2.3 System Design The design of a HRPG must carefully consider the available solar and wind resources, the
dimensions of the mounting pole, the size and capacity of the battery bank, the characteristics of the DMS, the choice of PV panel and wind generator, and the overall cost. The design should attempt to strike a balance between the cost and performance. This section presents the overall design components and process.
2.3.1 Power Demand Estimate and Battery Bank Sizing The DMS is a standard density model which consists of 3 lines with 12 characters per
line. Each character has a 5x7 pixel arrangement. The average 24-hour current is 3.5Ah per character, which was computed based on 40% ON states of LEDs for standard density. Therefore, the average 24-hour current draw for the entire sign is 126Ah (3.5Ah x 36 characters). The 24-hour energy requirement for the sign is then computed as: Average 24-hour DMS energy requirement = 126Ah x 12V = 1,512Wh (1)
8
The DMS system was originally designed to be powered by 120VAC from the nearby electrical grid. Because of this, a 12V AC to DC inverter was already installed to convert the 120VAC to the needed 12VDC to power the DMS sign (Table 2). This AC to DC inverter is rated for a maximum output of 645W and its no load draw (idle power) is about 26W.
The HRPG is a DC system. In order to provide the AC requirement of the DMS, a DC to AC inverter is used. This DC to AC inverter is rated at 3,600W and its no load draw is about 23W. Adding the two inverter’s no load draws, Eq. 1 gives: Average 24-hour energy requirement = 1,512Wh + (49 x 24)Wh = 2,688Wh (2)
For this system design, 7-day continuous supply is used as the battery storage
requirement. A storage capacity longer than seven days may increase the cost without providing much benefit, since the weather condition with no wind and sun for seven consecutive days occurs rarely. The 7-day energy requirement is then: 7-day energy requirement = 2,688Wh x 7 = 18,816Wh (3)
For this project Absorbed Glass Mat (AGM), deep cycle, lead acid batteries are used. In
these batteries, acid is absorbed between the two plates and immobilized by boron-silicate glass mats (very fine fiberglass mats). Nearly all AGM batteries are "recombinant" - meaning that the oxygen and hydrogen recombine inside the battery. These use the gas phase transfer of oxygen to the negative plates to recombine them back into water while charging and prevent the loss of water through electrolysis. The recombining is typically 99+% efficient, i.e., almost no water is lost. Since there is no liquid to freeze and expand, they are practically immune from the damages of freezing.
Typically, AGM batteries allow around 400 cycles of 100% discharges in its lifetime. Although AGM plates are designed thicker for a longer lifespan, the plates tend to wear out when more than 50% of the battery capacity is discharged. To insure a long battery life, a limit of 50% discharge level is used for this design. This would extend the AGM battery lifetime to more than 10 years. Adding this limit to the energy requirement gives: 7-day energy w/ low voltage protection = 18,816Wh /0.50 = 37,632Wh (4)
In addition to the planned limit on the discharge level, extremely low temperatures must
be considered. At -40ºF, effective battery capacity drops about 30%. Although this low temperature can be reached in the Camp Ripley Junction, MN location, it rarely happens and the battery cabinet is insulated to protect the batteries.
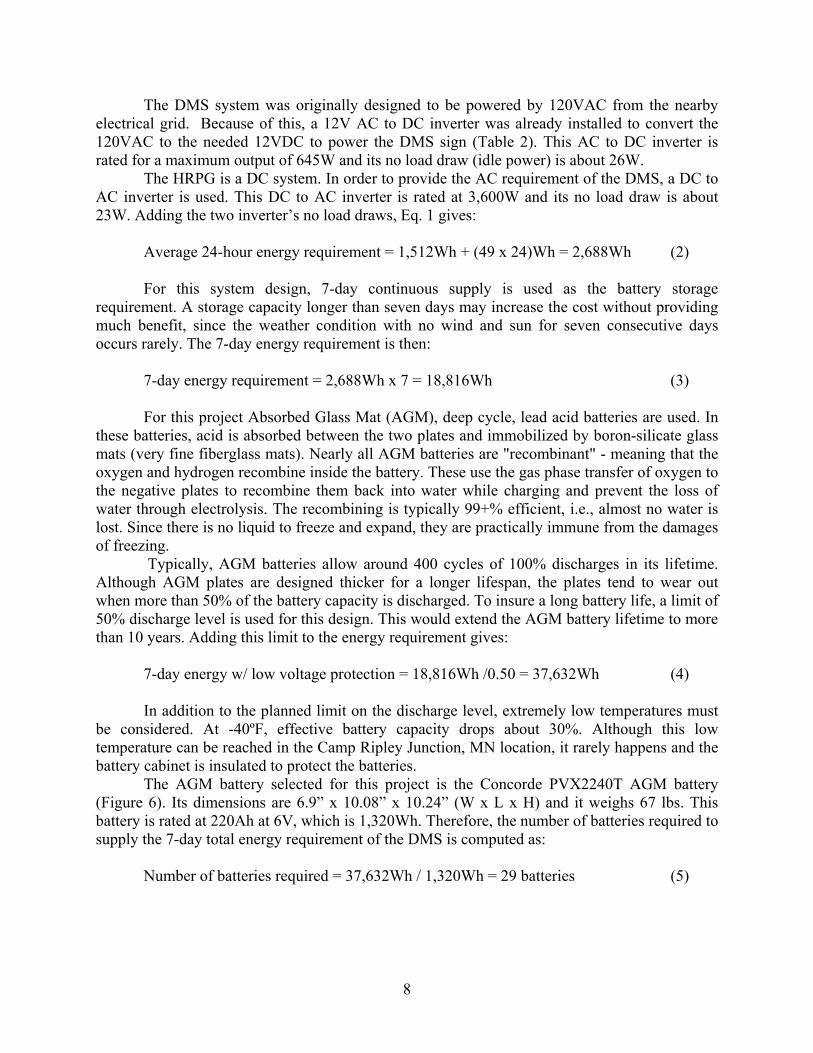
The AGM battery selected for this project is the Concorde PVX2240T AGM battery (Figure 6). Its dimensions are 6.9” x 10.08” x 10.24” (W x L x H) and it weighs 67 lbs. This battery is rated at 220Ah at 6V, which is 1,320Wh. Therefore, the number of batteries required to supply the 7-day total energy requirement of the DMS is computed as:
Number of batteries required = 37,632Wh / 1,320Wh = 29 batteries (5)
9
Figure 6: PVX2240T AGM battery.
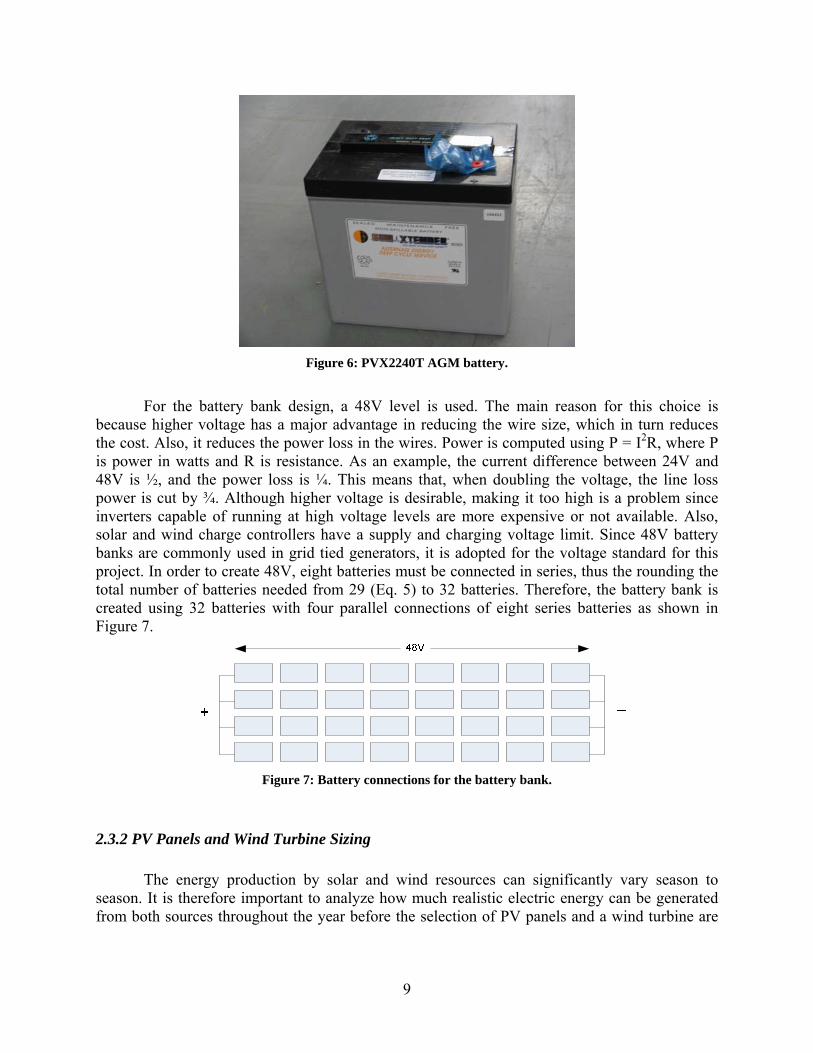
For the battery bank design, a 48V level is used. The main reason for this choice is
because higher voltage has a major advantage in reducing the wire size, which in turn reduces the cost. Also, it reduces the power loss in the wires. Power is computed using P = I2R, where P is power in watts and R is resistance. As an example, the current difference between 24V and 48V is ½, and the power loss is ¼. This means that, when doubling the voltage, the line loss power is cut by ¾. Although higher voltage is desirable, making it too high is a problem since inverters capable of running at high voltage levels are more expensive or not available. Also, solar and wind charge controllers have a supply and charging voltage limit. Since 48V battery banks are commonly used in grid tied generators, it is adopted for the voltage standard for this project. In order to create 48V, eight batteries must be connected in series, thus the rounding the total number of batteries needed from 29 (Eq. 5) to 32 batteries. Therefore, the battery bank is created using 32 batteries with four parallel connections of eight series batteries as shown in Figure 7.
Figure 7: Battery connections for the battery bank.
2.3.2 PV Panels and Wind Turbine Sizing The energy production by solar and wind resources can significantly vary season to
season. It is therefore important to analyze how much realistic electric energy can be generated from both sources throughout the year before the selection of PV panels and a wind turbine are

10
made (Section 2.2.2). This sub-section describes what components were selected and the estimation processes that were done for this project.
The PV panel selected for this project was KC170TM produced by Kyocera, and its key specifications are summarized in Table 3. The design process should start by selecting a PV panel based on the specifications and then computing the realistic energy generation for the given application.
Table 3: Specification of KC170TM (source reg. [5])
Maximum Power 170W Maximum Power Voltage 23.4V Maximum Power Current 7.27A Open Circuit Voltage 29.0V Short Circuit Current 8.03A Length x Width x Depth 50.8” x 39.0” x 1.4”(1290 x 990 x 36mm) Weight 35.3lbs (16.0kg)
Although the PV panel is rated at 170W as its maximum power, the maximum is only
attainable under solar radiation of a full sun near the equator. In Minnesota, the maximum convertible power of the 170W PV is about 127W under the full sun, which is 75%. This estimation is based on actual monitoring of the PV panel. Another estimate we need to make is the number of equivalent full solar radiation hours per day. In a previous research project [1], it was found that the equivalent full solar radiation hours per day in summer in Duluth, MN was 4.5 hours. This was also based on actual monitoring of a PV panel. The average rate of power generation per day in summer in Duluth, MN is 5.5-6.0 KWh/m2/day [2]. This number is the same for the Camp Ripley Junction, MN location that was found in section 2.2.2. Since these numbers are similar, we will use 4.5 hours as the equivalent full solar radiation hours per day in summer in Camp Ripley Junction, MN. Using this number and the average rate of power generation per day in spring, fall, and winter found in Section 2.2.2, the equivalent full solar radiation hours per day for these 3 seasons can be calculated. The actual daylight hours are longer than these hours and the radiation strength varies, but the useable hours provide an estimate of the total producible power per day. Finally, the expected average daily producible power by the KC170TM is estimated as:
4.0hrs x 127W = 508Wh for spring (6) 4.5hrs x 127W = 572Wh for summer (7) 3.0hrs x 127W = 381Wh for fall (8) 2.5hrs x 127W = 318Wh for winter (9) Since the DMS requires 1,260Wh per day (eq. 2), it would require at least three solar
panels during the spring and summer and four solar panels for fall and winter to supply enough power for the DMS if only solar panels are used. Since the hybrid renewable power generator receives its energy from both solar and wind, a fewer number of solar panels than the winter requirement would be desirable. For this design, three solar panels are used.
The wind turbine selected for this project was the 1,000W Whisper-200 model manufactured by Southwest Windpower. The charge controller for this unit is separately housed in the control cabinet. The charge controller senses the voltage from the battery bank and
11
determines whether or not to continue charging. If the battery voltage matches the regulation set point, the regulator will change mode to power dump at which the generated power is simply dumped into a heat sink. The key specifications for this wind turbine are summarized in Table 4.
Table 4: Whisper 200 Wind Generator Specification (source ref. [6])
Model Whisper 200 Rotor Diameter 9 ft. Weight 65 lbs. Mount 2.5” schedule 40 pipe Voltage 12, 24, 36, 46 VDC Startup Wind Speed 7 mph Rated Power 1,000W at 26mph Blades (three) Polypro/Carbon Fiber
Glass Reinforced Body Cast Aluminum Kilowatt Hours Per Month 158 KWh/mo @ 12mph Survival Wind Speed 120 mph
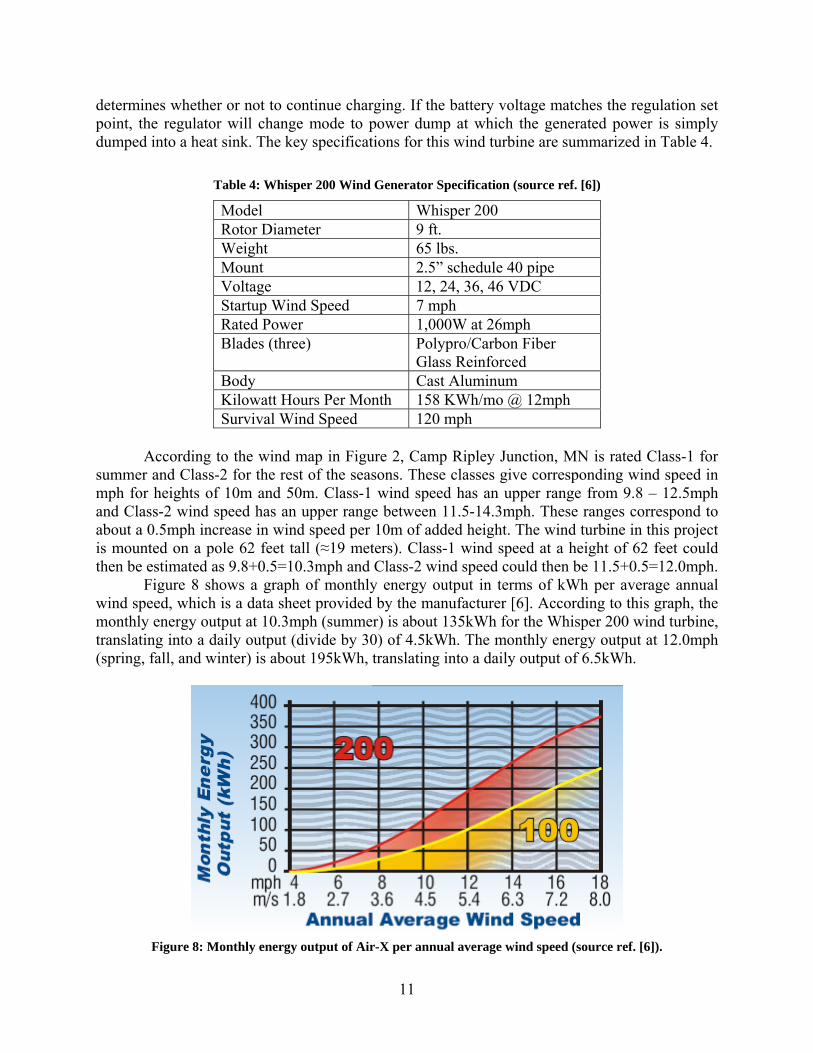
According to the wind map in Figure 2, Camp Ripley Junction, MN is rated Class-1 for
summer and Class-2 for the rest of the seasons. These classes give corresponding wind speed in mph for heights of 10m and 50m. Class-1 wind speed has an upper range from 9.8 – 12.5mph and Class-2 wind speed has an upper range between 11.5-14.3mph. These ranges correspond to about a 0.5mph increase in wind speed per 10m of added height. The wind turbine in this project is mounted on a pole 62 feet tall (≈19 meters). Class-1 wind speed at a height of 62 feet could then be estimated as 9.8+0.5=10.3mph and Class-2 wind speed could then be 11.5+0.5=12.0mph.
Figure 8 shows a graph of monthly energy output in terms of kWh per average annual wind speed, which is a data sheet provided by the manufacturer [6]. According to this graph, the monthly energy output at 10.3mph (summer) is about 135kWh for the Whisper 200 wind turbine, translating into a daily output (divide by 30) of 4.5kWh. The monthly energy output at 12.0mph (spring, fall, and winter) is about 195kWh, translating into a daily output of 6.5kWh.
Figure 8: Monthly energy output of Air-X per annual average wind speed (source ref. [6]).

12
This estimate of the daily output power of the wind turbine along with the previously
estimated solar panel output power can be combined to see if the electricity generation of the HRPG is sufficient for the daily demand of the DMS. Table 5 summarizes the estimates.
Table 5: Estimated Seasonal Daily Energy Generation and Demands
Spring Summer Fall Winter PV generated 1,524Wh 1,716Wh 1,143Wh 954Wh Wind generated 6,500Wh 4,500Wh 6,500Wh 6,500Wh Total generated 8,024Wh 6,216Wh 7,643Wh 7,454Wh Daily energy demand 1,512Wh 1,512Wh 1,512Wh 1,512Wh Excess energy +6,512Wh +4,704Wh +6,131Wh +5,924Wh
It should be noted that Spring consist of the months March, April, and May; Summer is June, July, and August; Fall is September, October, and November; and Winter is December, January, and February. It should also be noted from Table 5 that the combined energy generation has large excess energy mainly due to wind generation. It is clearly an over-designed case. However, it was learned from past experience in building HRPG that nature is unpredictable and over design provides margin of safety in power reliability. Also, power specifications can contain errors. In the actual system tests, the research team found an error in DMS power specification. Each pixel contained eight LEDs (twice more) than the specification. Also, the DMS cabinet consumed additional 40W more from modem, fans, and other components. By incorporating these factors, the daily power demand for the DMS is computed as:
Daily energy demand = 3,024Wh + (89 x 24)Wh = 5,160Wh (10) The values adjusted for the actual power demand are shown in Table 6. The excess
energy is now reduced to for all four seasons but all still contain an excess amount of energy produced which could be used for other applications such as lighting.
Table 6: Estimated Seasonal Daily Energy Generation and Adjusted Demands
Spring Summer Fall Winter PV generated 1,524Wh 1,716Wh 1,143Wh 954Wh Wind generated 6,500Wh 4,500Wh 6,500Wh 6,500Wh Total generated 8,024Wh 6,216Wh 7,643Wh 7,454Wh Daily energy demand 5,160Wh 5,160Wh 5,160Wh 5,160Wh Excess energy +2,864Wh +1,056Wh +2,483Wh +2,294Wh
2.3.3 Wind Load for Mounting Pole
In designing the pole, one of the important factors is the wind load that the pole must reliably support. Wind load is computed based on so-called “Basic Wind Speed” which is simply a statistical average wind speed. A generic form is given by:

13
F = A x P x Cd (11) where F is force in pounds, A is the projected area of the item, P is the wind pressure in pounds per square feet (psf), and Cd is a drag coefficient (Cd = 2.0 for plates = and Cd = 1.2 for cylinder). The basic wind pressure, P, is computed by: P = 0.00256 x v2 (12)
where v is the wind speed in mph. A simple lookup table constructed based on this relation is shown in Table 7.
Table 7: Wind Pressure
Basic Wind Speed (mph) 70 80 90 100 110 120 Wind Pressure (psf) 12.5 16.7 20.7 25.6 31.0 36.9
The area occupied by a single PV panel in our design is 4.2 x 3.25 = 13.65 square feet
(sf). There are a total of three PV panels, so the total area occupied is 13.65sf x 3 = 40.95 sf. The area formed by the wind turbine rotor is 63.6 sf (πr2 where r = 4.5ft). The PV panels are mounted at a 60° angle from the ground, and the area covered by wind turbine rotor is not a filled space, so taking those into account, we estimate the projected effective area as:
PV panel = 40.95 x sin60° = 33.1 sf (13) Wind turbine effective area = 63.6 x ⅔ = 42.4 sf (14)
If we consider 120mph wind speed as the maximum wind speed, the wind load created by
the PV panel and the wind turbine is computed using Eq. (12) as:
Wind load (F) = 75.5 x 36.9 x 2 = 5,572 lbs. (15) The additional wind load is created by the pole itself. The pole is designed by the
manufacturer, and the wind load created by PV panels and wind turbine should be provided.
2.3.4 Mounting Pole Design Several factors must be considered for the pole design. For the wind turbine, the higher
the height, the more power is generated. However, high poles cost more and the designer must carefully strike a balance between the height and installation cost. For this application, the main consideration was the height of the tree line at the site, which is about 50-60 feet. Therefore, the pole height was designed at 62 feet. Since the pole has many spaces, the solar panels were directly mounted on the pole.
The next important issue is where to position the PV panels and the wind turbine. A logical choice is that the wind turbine must be positioned at the highest point and the PV panels should be positioned so that a shadow cast by a higher panel does not land on the face of a lower panel. The three PV panels were positioned at heights of 26, 32, and 38 feet above the ground based on the computation of shadow fall lengths. The final design specification along with wind

14
load sent to the manufacturer is shown in Figure 9. The pole was constructed by Millerbernd Co., and the detailed design data is attached in Appendix A.

15
SCH 40 Pipe (2.875 OD, .20 Wall)
26'
32'
38'
60'
UMD PV/Wind-TurbinePole Design
KC170TM, PV Panel
50.8"
39.0"
Wind Turbine Rotor Diameter: 9'
25"
Figure 9: Mounting pole design specification.

16
2.3.5 Charge Controllers and Inverter The PV charge controller used is an OutBack MX60. This controller uses the Maximum
Power Point Tracking (MPPT) technology, which is a technique that matches the voltage to maximize the current. This technique is known to improve efficiency by 20-30% by increasing the current size during the cold months [7]. It can handle up to a maximum of 60 amps and its idle power consumption is less than 1W. Nominal battery voltages supported are 12, 24, 32, 36, 48, 54, and 60 VDC. It was set to charge 48V in the HRPG. The maximum voltage this controller can handle is 125V. This controller was selected based on its high efficiency in charging performance. Steps on setting up the OutBack MX60 can be found in Appendix D.
Figure 10: OutBack MX60 PV charge controller.
The Whisper 200 controller, shown in Figure 11, is provided by Southwest Windpower and specifically designed to control the operation and convert the power of a Whisper 200 wind turbine. Its basic functions are rectification, regulation, and resistive power dumping. The Whisper Controller provides all of the necessary functions and displays for wind turbine operation. It includes interface features for setting the regulation voltage, monitoring the state of the system, and manually disabling battery charging using the Diversion Switch. The display module is an optional part of this controller and was not purchased for this project. The details of these interfaces are discussed in Appendix C.

17
Figure 11: Whisper 200 charge controller.
The AC inverter selected for this system is OutBack VFX3638 Off-Grid Inverter (Figure
12). This model converts 48VDC to 60Hz, 120VAC sine wave. It is rated at 3,600W continuous and 6,000W surge. The idle power consumption is 23W. This inverter was selected after experiencing several failures from lower surge rated inverters.
Figure 12: OutBack VFX3638 off-grid inverter.

18
2.3.6 Charge Monitoring Circuit One of the objectives of this research is to investigate how reliably the proposed
solar/wind HRPG can support the electricity needs of the DMS. It is therefore essential to monitor and record how much electricity is actually produced by the solar panels and wind turbine and consumed by the DMS. The approach used in this project is to sense the current from each source and load using shunts. The shunts selected for this project are rated at 50mV/500A (MKB-500-50) and shown in Figure 13. This shunt is essentially a very low resistor and the voltage across the shunt terminals determines the current. The resistance of this shunt and the current are determined by:
R = V/I = 0.05/500 = 0.1 mΩ (16) I = V/R = V/0.1 mA (17)
Figure 13: 50mV/500A shunt.
For this project three shunts are need to monitor the PV panels, wind turbine, and
inverter, and the voltages are monitored using Analog to Digital (A/D) converters. For the A/D conversion, PentaMetric by Bogart Engineering was used. This unit samples the shunt voltages, converts them to current values, and then transmits the data through an RS232 interface. However, this unit does not have memory to save the shunt data. Therefore, data logging device is separately needed.
Data logging involves 24/7 continuous monitoring of the current flow into the battery from the two sources and the current flow out to the load. For this purpose, we selected TS-7260 Single Board Computer (SBC), which runs on an ARM-9 32bit processor with an embedded Linux OS. Important criteria of selecting TS-7260 were large available flash memory that is required for storing more than a year and a real-time clock for time-stamping of the data. Also, additional required parts used are a small keypad and an LCD display. This board is shown in Figure 14, which has the following specification:

19
• Embedded Linux OS • ARM9 CPU: Cirrus EP9302 (32-bit, 16KB instruction and data cache) • 200MHz clock speed • 64MB SDRAM • 32MB on-board NAND flash • 2 USB ports • 3 serial ports • 10/100 Ethernet • 30 digital input/output pins • 2-channel on-board 12-bit A/D converter • PC/104 expansion bus • Real time clock • 4.5 – 20V DC Unregulated input • Size: 3.8 x 4.8 inches
Figure 14: TS-7260 SBC.
This board is programmed at a PC using a gnu c-compiler gcc available at Cygwin.
Cygwin is a simulated Linux OS that runs on a Windows environment. In order to produce a binary compatible with the ARM9 processor, a cross compiler called CrossTool is used. The compiled binary code is downloaded to the SBC either through an Ethernet or a serial port. To increase the data logging capacity, a 256MB flash memory stick was added through a USB port. This flash memory expansion provides data storage logging for more than 10 years in this power application. The enclosed data logger along with the PentaMetric is shown in Figure 15. In the picture, a small aluminum tube with mounting hole is a temperature sensor that records the temperature of the battery.
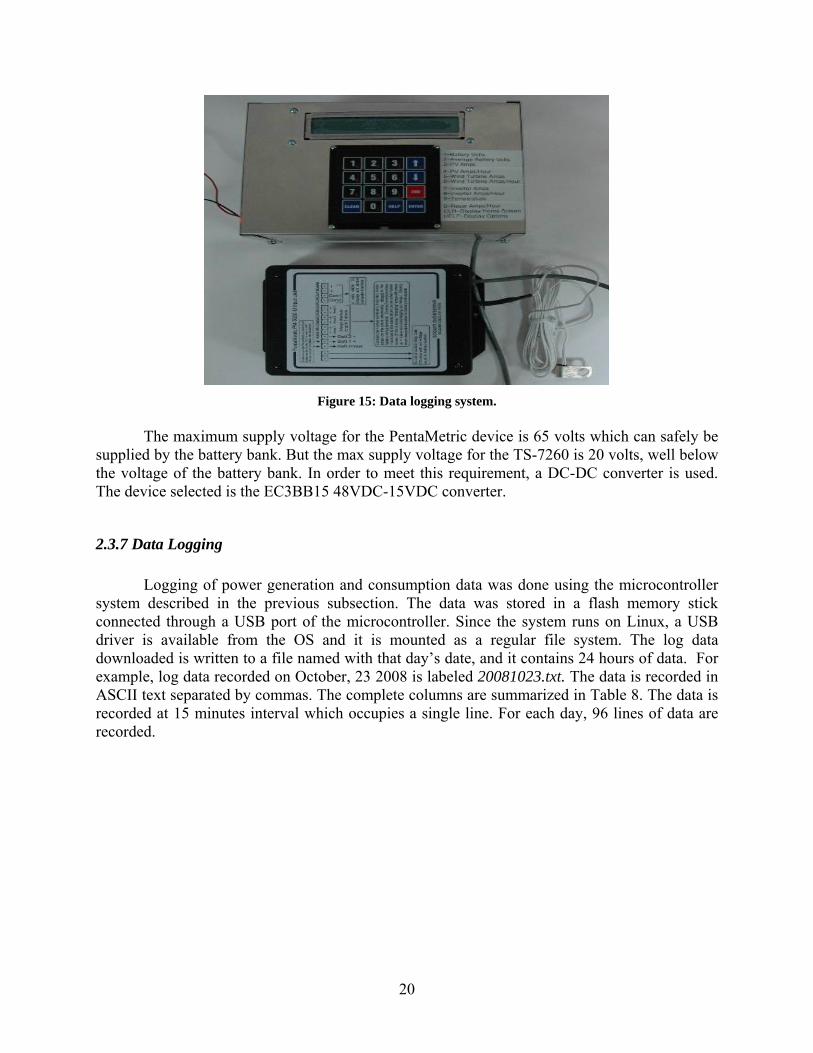
20
Figure 15: Data logging system.
The maximum supply voltage for the PentaMetric device is 65 volts which can safely be
supplied by the battery bank. But the max supply voltage for the TS-7260 is 20 volts, well below the voltage of the battery bank. In order to meet this requirement, a DC-DC converter is used. The device selected is the EC3BB15 48VDC-15VDC converter.
2.3.7 Data Logging Logging of power generation and consumption data was done using the microcontroller
system described in the previous subsection. The data was stored in a flash memory stick connected through a USB port of the microcontroller. Since the system runs on Linux, a USB driver is available from the OS and it is mounted as a regular file system. The log data downloaded is written to a file named with that day’s date, and it contains 24 hours of data. For example, log data recorded on October, 23 2008 is labeled 20081023.txt. The data is recorded in ASCII text separated by commas. The complete columns are summarized in Table 8. The data is recorded at 15 minutes interval which occupies a single line. For each day, 96 lines of data are recorded.

21
Table 8: Columns of the Data File
Column # Description 1 Timestamp, hh:mm:ss 2 Battery voltage, V 3 Average battery voltages of the 15minute interval, V 4 PV currents, amps 5 PV amp hours collected in 15 minute interval, Ah 6 Wind turbine currents, amps 7 Wind turbine amp hours collected in 15 minute interval, Ah 8 Inverter currents, amps 9 Inverter amp hours collected in 15 minute interval, Ah 10 Temperature of the battery cabinet in Celsius
The system includes an LCD screen and a keypad that allows a user to read instantaneous
values of the system when a key is pressed. The function of each key is summarized in Table 9.
Table 9: Key Functions
Key Description 1 Displays Battery Volts 2 Displays Average Battery Volts 3 Displays PV Amps 4 Displays PV Amps/Hour 5 Displays Wind Turbine Amps 6 Displays Wind Turbine Amps/Hour 7 Displays Inverter Amps 8 Displays Inverter Amps/Hour 9 Displays Temperature 0 Resets PV, Wind Turbine, and Inverter Amps/Hour
CLEAR Clears display and displays Home Screen ENTER Return Home (First Row, First Column)
UP arrow Return Home DOWN arrow Return Home
HELP Displays ‘Help Menu’ and then displays Home Screen 2nd Return Home
2.3.8 Final Design
The wiring for the final design of the HRPG is shown in Figure 16. The final design includes wiring of the wind turbine, three solar panels in series, the inverter, battery bank, and the charge monitoring and data logging circuits. There are three shunts connected in series on the negative rail of the wind turbine, solar panels, and inverter. From these shunts, a negative and positive connection is made to the PentaMetric in order to monitor current production or consumption. The PentaMetric is designed to be connected on the negative rail (low side monitoring device). The PentaMetric device is powered from the 48 volt battery bank and is
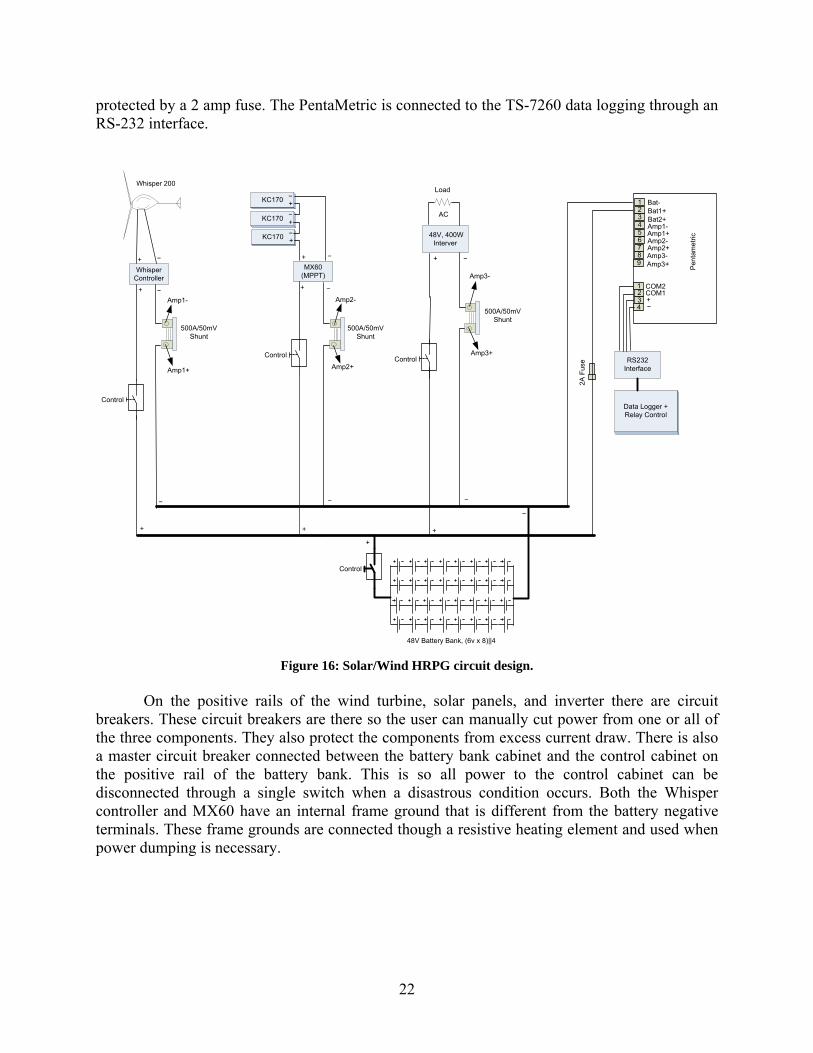
22
protected by a 2 amp fuse. The PentaMetric is connected to the TS-7260 data logging through an RS-232 interface.
Whisper Controller
+ + −
−
−
+
−+KC170
−+KC170
−+KC170
MX60 (MPPT)
48V, 400W Interver
Load
48V Battery Bank, (6v x 8)||4
Whisper 200
1
4321
98765432
Bat-Bat1+Bat2+Amp1-Amp1+Amp2-Amp2+Amp3-Amp3+
COM2COM1+−
+
+
−
−
RS232Interface
Data Logger + Relay Control
2A F
use
Pen
tam
etric
Amp3-
Amp3+
+ −
Amp2+
Amp2-Amp1-
Amp1+
500A/50mVShunt
500A/50mVShunt
500A/50mVShunt
+ + +
−−−
AC
Control Control
Control
Control
Figure 16: Solar/Wind HRPG circuit design.
On the positive rails of the wind turbine, solar panels, and inverter there are circuit
breakers. These circuit breakers are there so the user can manually cut power from one or all of the three components. They also protect the components from excess current draw. There is also a master circuit breaker connected between the battery bank cabinet and the control cabinet on the positive rail of the battery bank. This is so all power to the control cabinet can be disconnected through a single switch when a disastrous condition occurs. Both the Whisper controller and MX60 have an internal frame ground that is different from the battery negative terminals. These frame grounds are connected though a resistive heating element and used when power dumping is necessary.

23
CHAPTER 3 – IMPLEMENTATION
3.1 Battery Cabinet The battery cabinet was custom designed to meet the following requirements. (1) It must
hold at least 32 batteries weighing 67 pounds each. (2) It must be insulated to protect from low winter temperatures. (3) Air must be ventilated to protect from small acid gas traces produced by batteries. (4) The bottom of the cabinet and foundation must have a sufficient gap to prevent moisture build up and rusting. The final design specification sent to the machine shop is shown in Figure 17.
Control Mounting
Panel
Side View Cross Section Front Elevation
Insulate All Sides
Top View Cross Section
32 ½”
32 ½”
36"7 ? " 7 ? " 7 ? " 7 ? "
12 ½”
12 ½”
12 ½ “
2 ½”
? " ¼” ¼” ? "¼”
2 ½”
2 ½”1 ½”
1 ½”1 ½”
1 ½”1 ½”
1 ½”
Materials:Construction: WeldedCabinet: 18 gallon SteelRack: 1½” x 1½” x ? SteelInsulation: 1" StyrofoamFinish: Machinery Enamel PaintHardware: Two Point Latch with Locking Handle Continuous Hinge
Figure 17: Battery cabinet specification.

24
In the design, built in rails allow the batteries to easily slide into the cabinet and to hold the batteries in place. The air flow path was designed to flow from top to bottom, requiring no fans. The dimensions of the cabinet and its foundation are shown in Figure 18.
Figure 18: Battery cabinet and foundation dimensions.
The actual implemented battery cabinet is shown in Figure 19. Note from the picture that
top of cabinet has a dome which allows air to enter. Also notice that the cabinet bottom does not directly touch the concrete foundation, which allows air circulation as well as water drainage.

25
Figure 19: Battery cabinet with 32 batteries.
3.2 PV Panel Rack and Wind Turbine Assembly
For easy field installation, PV panels were pre-mounted on a rack. The rack type used is Unirack 4002 and required fitting to be able to mount the KC170 PV panels. Assembly steps are provided in Appendix B. Wind turbine assembly is fairly simple and the steps are shown in Appendix C.
3.3 Control Cabinet For the control cabinet, a recycled signal cabinet provided by Mn/DOT was customized
to fit all control circuits, PV and wind charger controllers, charge monitoring hardware, and the inverter shown in Figure 21. The wind generator charge controller was placed at the bottom of the cabinet on an aluminum shelf. When the battery bank is fully charged, the wind charge controller dumps the excess power to an onboard heat sink. This excess heat is conducted to outside the cabinet through the aluminum shelf. The PV charger is placed on the left side of the middle shelf. And the charge monitoring hardware and circuit breaker panel occupy the right side of the shelf. The shelf is constructed out of wood and is ¼” thick. The top shelf contains the inverter and master circuit breaker. This shelf is ½” thick wood shelf. It is twice the thickness of the middle shelf due to the weight of the inverter.

26
Figure 20: Control cabinet.
In the control cabinet, a shunt panel is positioned between the middle and top shelf
(Figure 21). This panel consists of the three shunts used for charge monitoring and data logging, three circuit breakers, and a positive and negative 48V rail. Before moving the cabinet to the site, all necessary wiring was done at the lab except connections to the charge controllers and inverter.
Figure 21: Shunt panel.

27
3.4 Pole, Wind Turbine, and Solar Panel Installation The detailed pole installation sequence is shown in Appendix D. Due to its 62 foot height
the pole was delivered in two pieces. Its design allowed the top piece to be placed on the bottom piece without welding. This was due to its weight and tapered shape, the top piece is securely overlaid on the bottom piece. Figure 22 shows two bucket trucks erecting the pole.
Figure 22: Installation of the pole.
After the pole was erected, the wind turbine was mounted on the top of the pole. A bucket truck was used to first connect the wind turbine rotor’s 3-phase wires and to secure the base to the pole. Next the three blades and tail fin were attached to the rotor. Figure 23 shows the mounted wind turbine rotor.
Figure 23: Installation of the wind turbine.
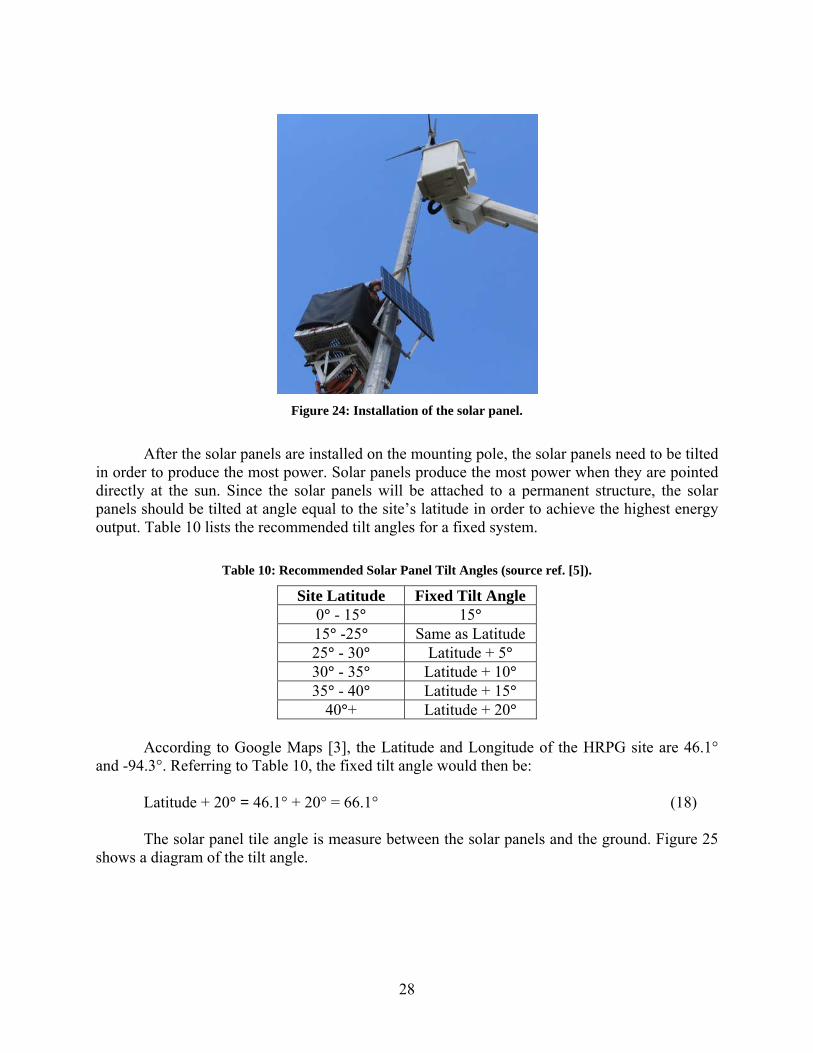
Two bucket trucks were used for mounting the solar panels. One was used for lifting the
solar panels and another one for mounting the racks to the pole.
28
Figure 24: Installation of the solar panel.
After the solar panels are installed on the mounting pole, the solar panels need to be tilted in order to produce the most power. Solar panels produce the most power when they are pointed directly at the sun. Since the solar panels will be attached to a permanent structure, the solar panels should be tilted at angle equal to the site’s latitude in order to achieve the highest energy output. Table 10 lists the recommended tilt angles for a fixed system.
Table 10: Recommended Solar Panel Tilt Angles (source ref. [5]).
Site Latitude Fixed Tilt Angle 0° - 15° 15° 15° -25° Same as Latitude 25° - 30° Latitude + 5° 30° - 35° Latitude + 10° 35° - 40° Latitude + 15°
40°+ Latitude + 20° According to Google Maps [3], the Latitude and Longitude of the HRPG site are 46.1° and -94.3°. Referring to Table 10, the fixed tilt angle would then be: Latitude + 20° = 46.1° + 20° = 66.1° (18) The solar panel tile angle is measure between the solar panels and the ground. Figure 25 shows a diagram of the tilt angle.

29
Figure 25: Solar panel tilt angle (source ref. [5]).
Finally, Figure 26 shows a photo of the completed HRPG pole.

30
Figure 26: Completed HRPG pole.
31
3.5 Solar and Wind Charge Control The voltage of a battery (or battery bank) can be used as a guideline to estimate the
amount of power stored in the battery that is available for use. However, voltages measured under significant charging or heavy load should not be used for the battery capacity estimate since the voltage is deviated by the unbalanced amount between charging and loads. Table 11 shows common reference voltages that can be used to estimate the remaining battery capacity. This table is recommended for use when no specifications are available for the battery.
Table 11: Battery Capacity Remained in Reference to Battery Voltage (source ref. [7]).
Battery Capacity Remained Nominal Battery Voltage Charged ~75% ~50% ~25% Discharged
12V Over 12.6V 12.3V 12.0V 11.7V Under 11.4V 24V Over 25.2V 24.6V 24.0V 23.4V Under 22.8V 48V Over 50.4V 49.2V 48.0V 46.8V Under 45.6V 60V Over 63.0V 61.5V 60.0V 58.5V Under 57.0V
There are several battery charging methods. The most commonly used and effective method is a three step regulated charging method. The three sequential steps are:
• Step 1: Bulk charge. The maximum voltage and current amp rating of the charger is applied until the battery capacity reaches up to 80%.
• Step 2: Absorb charge. When the battery charge level reaches 80% of its capacity, this step kicks in. In this stage, the voltage is simply held at a constant voltage referred to as an absorb voltage. The current (amps) then declines, and this step is completed when the battery level reaches 98% of its capacity.
• Step 3: Float charge. This step follows after the absorption charge. A regulated voltage (float voltage) less than the absorb voltage is supplied to the battery. This step brings the battery to 100% charged or close to it. The float charge maintains the batteries at 100% readiness and prevents from cycling during long term inactivity. This step is often referred to as a trickle charge. The default setup for the MX60 charge controller used for PV panels is for a 12V battery
system, so modification to 48V setup is required. The detailed setup steps are provided in Appendix D. The absorb voltage set point was set at 57.6V, and the float voltage was set at 53.6V. This means that bulk charging occurs whenever the battery voltage is below the float voltage set point and will continue until the absorb voltage (57.6V) is reached. Voltage is not regulated during the bulk charge. The absorb charge is next initiated and the charger holds the voltage at the absorb voltage set point, 57.6V. The battery voltage will then gradually drop down to the float voltage (53.6V) where the float charge is initiated. Float charge is continued as the battery remains at the float voltage, but if the battery voltage drops below the float voltage, bulk charge is resumed.
The Whisper Charge controller is factory preset for a 24-volt battery system. The steps to modify the configuration to a 48V system are summarized in Appendix C. The charge regulation uses a similar three step charging approach. The critical values are summarized in Table 12.

32
Table 12: Absorb/Float Voltage Set Points
Battery bank nominal voltage 48V Absorb voltage set point 57.6V Float voltage set point 53.6V
3.6 Cost Analysis
Finally, the total cost of the HRPG is discussed. The most expensive part of the system was the pole and its installation costs. The next most expensive item was the 32 AGM batteries. Actual purchased cost of components is summarized in Table 13. Take note that this total cost does not included the cost of the DMS. This relatively high cost is due to power inefficiency of the installed DMS, which was originally designed for AC grid power. Using a newer, power-efficient DMS model should decrease the total cost.
Table 13: Purchased Components List
Items Unit Cost Quantity Total Cost KC170 Solar Panel $839 3 $2,517 OutBack MX60 Solar Panel Charge Controller $636 1 $636 UniRac 4002 PV Module Rack $180 3 $540 Whisper 200 w/ Charge Controller $2,512 1 $2,512 6V AGM Battery $187 32 $5,984 Outback VFX3648 Off-Grid Inverter $1,899 1 $1,899 Battery Bank Cabinet $2,000 1 $2,000 Mounting Pole (62 feet) $5,786 1 $5,786 Pole/cabinet foundation (contractor) $5,270 1 $5,270 Battery Cables $300 1 $300 Microcontroller (Data Logger) $330 1 $330 PentaMetric Current Sensor (A/D Converter) $264 1 $264 Shunts $20 3 $60 EC3BB15 DC to DC Converter $27 1 $27 Control Cabinet $1,900 1 $1,900 Total $30,025

33
CHAPTER 4 - DATA ANALYSIS
4.1 Introduction
The final wiring of the HRPG was completed on July 17, 2007 from which startup tests were conducted. When the main battery switch was first time turned on, the wind turbine controller caught fire. It was later learned that the battery must be connected to the controller before connecting wires from the wind turbine. When this order is reversed, power generated from wind turbine flows to the wind turbine controller which is not ready for regulation and causes burning of the circuit. We returned two weeks later with a new wind turbine controller and the control knowledge only to find that the solar panel charge controller, the OutBack MX60, was not operating. This was due to a faulty control circuit in the controller. Finally, on August 7, 2008, we returned with a new PV charge controller, installed it, and the HRPG became fully functional. August 8, 2007 was the first day that data was recorded for a full 24 hours. Since then, a total of 509 days worth of data was collect from August 8, 2007 to December 28, 2008. This chapter describes analysis of this data.
During the testing, the inverter gave transient problems. Originally, a 600W continuous, 1200W surge (Exceltech XP600) inverter was used to convert the DC battery voltage to AC. During testing of the DMS sign, it was concluded that this inverter was not sufficient enough to support the DMS. On April 4, 2008, the inverter was changed to a 1,100W continuous, 2,200W surge inverter (Exceltech XP1100). On June 13, 2008, this inverter broke. Finally, on July 1, 2008, the OutBack VFX3648 3,600W continuous, 6,000W surge inverter was installed. After this point no inverter problems have been encountered.
4.2 Data Calibration
4.2.1 The Need for Data Calibration
When analyzing the recorded data, it was noticed right away that the energy consumed by the inverter was much greater than the energy produced by both the solar panels and wind turbine. This seemed very peculiar since the battery voltage remained either fully charged or at least 75% charged throughout the data collection time period. Only a couple times did the voltage drop slightly below 48 volts. And when it did, it was quickly charged back up. So if the battery remained charged and the energy produced was less than the energy consumed, some energy produced by either the solar panel or wind turbine must have not been detected by the shunt circuit. Later analysis confirms that some portion of energy was directly fed into the inverter without passing through the shunt circuit. This was caused by the low side measurement of the PentaMetric unit installed on the HRPG data logging system. Therefore, the original data recorded through PentaMetric requires a calibration in order to account the direct current flows from generators to load. The analysis and the calibration methods are discussed in the subsequent subsection.

34
4.2.2 HRPG Design
The HRPG circuit design contains three shunts connected in series on the negative rail of the wind turbine, solar panels, and inverter. These shunts are used for current monitoring of the two generators and one inverter load. Since the shunts are connected on the negative rail of each source or load, the system monitors current using a low-side measurement. The alternative is using a high-side measurement; where the shunts would be connected in series with each component on the positive rail. Most of today’s current monitoring devices for renewable energy generators are designed for low-side current measurements.
Low-side measurements monitor the current returning to the component. If there is an alternative path for the current to flow before returning to the negative rail, some portion of the current will bypass the shunt and therefore not be measured. High-side measurements combat this bypassing of the shunt because all current produced from the component must travel through the positive rail where the shunt is connected. Through inspection of the recorded data and circuit design, it was found that this bypassing of a shunt was occurring in the HRPG circuit. Figure 27 shows a simplified circuit of the HRPG that illustrates a direct current path between the wind turbine controller and inverter.
Figure 27: Simplified HRPG circuit

35
Consider the wind turbine and inverter circuit. The wind turbine uses a three-step controller to charge the battery bank (see Section 3.5). In a charging circuit analysis, a battery can considered as a large load. During the bulk charge stage, the controller maintains a maximum possible current and voltage. The bulk currents are then consumed by two loads: the battery bank and the 48V inverter connected to the DMS shown in red in Figure 27. The inverter is designed to receive currents until the voltage drops to 42V. It is unclear how much current will directly flow to the inverter and battery bank since we do not know how impedances are changed between them. However, considering that the inverter is a true load, a large portion of the wind turbine generated currents will directly flow to the inverter, bypassing the shunt.
Next, consider the PV generation. The maximum output voltage is 23.4V and the maximum output current is 7.27A for a single solar panel (Table 3). There are three solar panels in series resulting in a 70.2V maximum output voltage. The maximum output power from the three solar panels is then:
70.2V x 7.27A = 510W (19) If the three solar panels were directly connected to the 48V battery bank, the resulting
maximum output power would be: 48.0V x 7.27A = 349W (20) This means that 161W are wasted because there is a poor match between the voltage of
the solar panels and the battery bank. The controller for the solar panels in the HRPG design is the OutBack MX60 charge controller. This controller uses a technique called the Maximum Power Point Tracking (MPPT) [8]. A MPPT is an electronic DC to DC converter that optimizes the match between the solar panels and the battery bank voltages. To put it simply, they convert a higher DC voltage output from the solar panels down to the lower voltage needed to charge batteries. In this case, if the battery bank voltage is 48 V, the charge controller will drop the solar panels from 70.2V at 7.27A down to 10.6A at 48V (or battery voltage). The voltage has been reduced increasing the current and allowing the solar panels to operate at its maximum output power of 510W.
Since the solar and wind controller outputs are on the same line but the solar controller output maintains a lower voltage by MPPT, the higher voltage source of the wind turbine currents will naturally flow to the inverter when currents are present from both sources. This effect was observed from the data and used for data calibration. From the circuit in Figure 27, all current that flows into the inverter should flow out to the negative side passing the shunt. Since the current sharing does not occur at the inverter side, the Ah recorded at the negative rail of the inverter is accurate and can be used as the reference of the calibration. The inverter Ah values along with the battery voltages are used for calibration, and the method is described next.
Battery voltages are recorded at every 15 minute (average of 15 minutes) in the data logger and it is denoted as Battery_Voltage(i). Inverter, solar, and wind Ah are denoted inverter_Ah(i), solar_Ah(i), and wind_Ah(i), respectively. If the battery bank voltage did not change, that means that the energy produced by both the solar panels and wind turbine must be equal to the energy consumed by the inverter. As described above, the difference is likely in the wind Ah. Therefore, the data is calibrated using the following.

36
If Battery_Voltage(i) = Battery_Voltage(i + 1) And Battery_Voltage(i) < 52.0V Then difference = inverter_Ah(i) – (solar_Ah(i) + wind_Ah(i)) wind_Ah(i) = wind_Ah(i) + difference End If
This is only applied if the battery bank voltage is under 52.0V. The reason of placing this
limit is because the battery is in a fully charged state where the controllers maintain absorption or a float stage. At these stages, the controllers produce only a small amount of current and the excess current is diverted to an external load (heat sink). This means that most of current consumed by the inverter comes from the battery and not from either the wind or solar source.
The second part of calibration is done to compensate the difference between amp and Ah. The amps are recorded at 15 minute intervals, so Ah are in general one forth of instantaneous amps. This relation can be observed from the solar and inverter Ah. However, this relation did not hold for wind Ah in the data but also constantly underestimating its Ah. This is due to a high variability of wind speeds and a low sampling rate of the PentaMetric measurements that misses fine measurements. In order to mitigate this underestimation effect, the Ah were calibrated using a smoothing function as:
If (wind_amp(i) / 4) > wind_Ah(i) Then
wind_Ah(i) = (wind_amp(i) / 4 + wind_Ah(i)) / 2 End If
This smoothing function was applied before Ah balancing is applied. After the calibration
described above is applied to the raw data collected, the battery bank voltage was increased if the produced amount exceeds the spent and vice versa. However, since we do not precisely know how much current was exactly bypassed the shunts at every moment, this calibrated data is only used for daily energy generation and consumption. For reference, the complete raw daily data and calibrated daily data are provided in Appendix E and F, respectively. All daily and monthly data used for analysis in the following section are computed using the calibrated data. However, the raw non-calibrated data is used for hourly data analysis. To avoid the calibrating of data, the design of the HRPG must be altered. The current produced by both the solar panels and wind turbine should be monitored using high-side measurements. The current consumed by the inverter can remain a low-side measurement.
4.3 Data Analysis
4.3.1 Monthly Ah Analysis Figure 28 shows a graph of the monthly Ah totals for the solar panels, wind turbine, and inverter. For the first three months, the DMS did not display a message. That means the Ah spent by the inverter were due to the total power consumption of the DMS cabinet. In the cabinet are a modem, fans, and other components, which are constantly ON and consumes about 90 watts. The Ah produced by the solar panels and wind turbine for these three months was more than enough to support the current draw of the inverter. Keep in mind that when the battery bank is fully

37
charged, energy from both the solar panels and wind turbine is diverted to a heat sink and cannot be traced. Therefore, the total amount that can be produced by the HRPG is higher than the actual data recorded. In February, testing of the DMS sign began. Testing involved displaying several different messages on the DMS sign and is discussed in detail in Section 4.4. Because of the testing, the Ah consumed by the inverter doubled compared to the previous months. Because more energy was being consumed by the inverter, more energy needed to be produced by the solar panels and wind turbine. Instead of extra energy being dumped to heat sinks, it was now needed to support the increased energy draw of the inverter. That is why both Ah totals for the solar panels and wind turbine increased in February.
Monthly Ah Totals
0
500
1000
1500
2000
2500
Nov. Dec. Jan. Feb. March April May June July Aug. Sept. Oct.
Month
Ah
Solar Ah
Wind Ah
Inverter AH
Figure 28: Monthly Ah totals for solar, wind, and inverter from Nov. 2007 – Oct. 2008.
Limited DMS testing was done in the months of March, April, and May. In the middle of June, the inverter broke and was not replaced until July 1st. Because the inverter was broke for half of the month, the Ah consumed by the inverter is low. Since there is no load consuming power from the battery bank, it remained charged for most of that month, and much less energy from the solar panels and wind turbine were needed to charge the battery bank. After a new inverter was installed in the system on July 1st, DMS testing continued.
For all twelve months of the data collection period, the energy produced (solar panel Ah + wind turbine Ah) was greater then the energy consumed (inverter Ah). This is shown as a bar graph in Figure 29. Notice that the energy produced is never much more than the energy consumed. The extra difference is caused by the data logger which consumes about 24Wh per day. Again, the reason that the produced and consumed energy are similar is because a fully charged battery bank does not accept extra energy produced. This energy is wasted by diverting it to a heat sink.
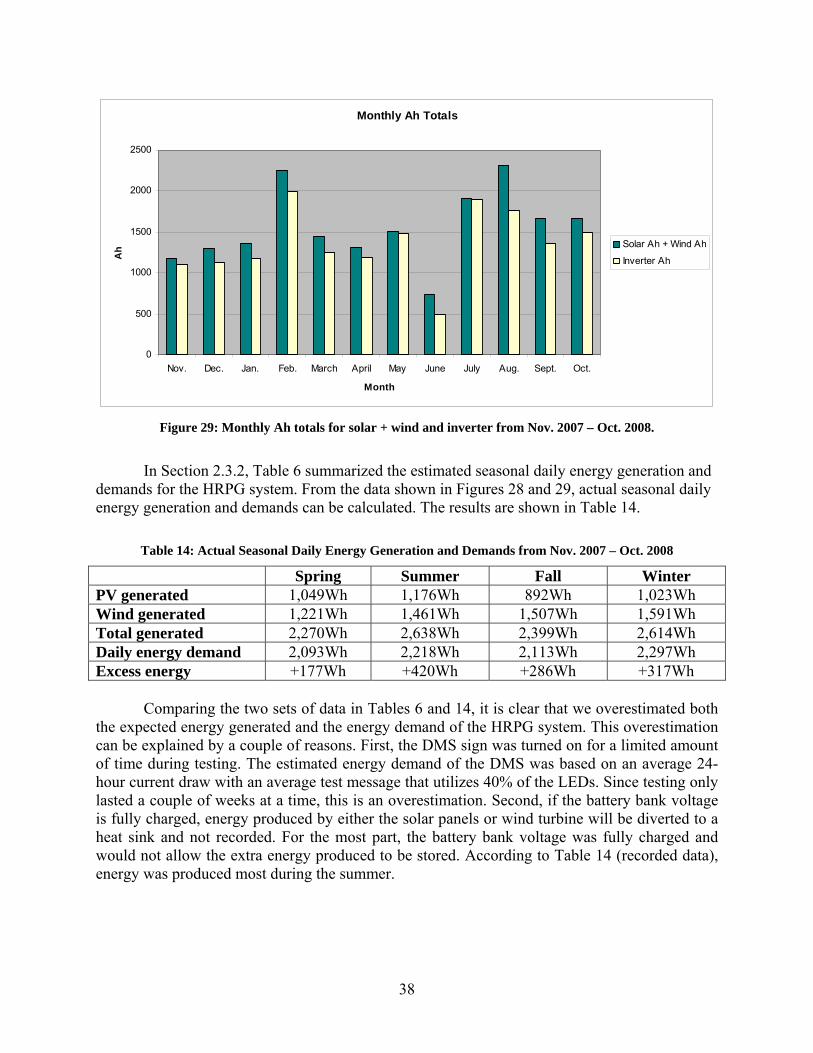
38
Monthly Ah Totals
0
500
1000
1500
2000
2500
Nov. Dec. Jan. Feb. March April May June July Aug. Sept. Oct.
Month
Ah Solar Ah + Wind Ah
Inverter Ah
Figure 29: Monthly Ah totals for solar + wind and inverter from Nov. 2007 – Oct. 2008.
In Section 2.3.2, Table 6 summarized the estimated seasonal daily energy generation and demands for the HRPG system. From the data shown in Figures 28 and 29, actual seasonal daily energy generation and demands can be calculated. The results are shown in Table 14.
Table 14: Actual Seasonal Daily Energy Generation and Demands from Nov. 2007 – Oct. 2008
Spring Summer Fall Winter PV generated 1,049Wh 1,176Wh 892Wh 1,023Wh Wind generated 1,221Wh 1,461Wh 1,507Wh 1,591Wh Total generated 2,270Wh 2,638Wh 2,399Wh 2,614Wh Daily energy demand 2,093Wh 2,218Wh 2,113Wh 2,297Wh Excess energy +177Wh +420Wh +286Wh +317Wh
Comparing the two sets of data in Tables 6 and 14, it is clear that we overestimated both the expected energy generated and the energy demand of the HRPG system. This overestimation can be explained by a couple of reasons. First, the DMS sign was turned on for a limited amount of time during testing. The estimated energy demand of the DMS was based on an average 24-hour current draw with an average test message that utilizes 40% of the LEDs. Since testing only lasted a couple of weeks at a time, this is an overestimation. Second, if the battery bank voltage is fully charged, energy produced by either the solar panels or wind turbine will be diverted to a heat sink and not recorded. For the most part, the battery bank voltage was fully charged and would not allow the extra energy produced to be stored. According to Table 14 (recorded data), energy was produced most during the summer.

39
4.3.2 Battery Bank Charge Level Analysis Battery bank voltage is the key to monitoring the reliability of the HRPG system. Borrowing data from Table 11, Table 15 shows the capacity state of a 48V battery bank.
Table 15: Battery Capacity Remained for a 48V System
Battery Voltage Charged ~75% ~50% ~25% Discharged 48V Over 50.4V 49.2V 48.0V 46.8V Under 45.6V
Any voltage over 50.4V means that the battery bank is fully charged. Any voltage under 45.6V means the battery is considered discharged. Figure 30 shows the average daily battery bank voltage at the start of each day from 11/1/07 to 10/31/08. First, notice that the average battery bank voltage never drops below the fully discharged level of 45.6V. Second, only a few times does the battery bank voltage drop below the 50% discharge level; twice in February (inverter problem) and a couple of times at the end of August (high load test). Finally, the spikes in the average battery voltage suggest that the bulk charging step is taking place. Spikes can reach as high as 60V but the battery bank voltage quickly drops when the charge level reaches 80% and the absorb charge stage is entered. Therefore, the spikes in battery voltages are only temporary and due to the three stage charging methods applied by the charge controllers.
Daily Average Battery Voltage
0
10
20
30
40
50
60
70
11/1
/200
7
12/1
/200
7
1/1/
2008
2/1/
2008
3/1/
2008
4/1/
2008
5/1/
2008
6/1/
2008
7/1/
2008
8/1/
2008
9/1/
2008
10/1
/200
8
Days
Volts Average Battery Voltage
Fully Discharged Level
Figure 30: Daily average battery voltage from Nov. 2007 – Oct. 2008.
The next graph, Figure 31, shows the monthly average battery voltage from 11/1/07 to 10/31/08. The difference between this figure and the last is that the daily battery bank voltage is averaged for each month. This produces a smooth curve over the year long data period. This averaging over each month removes the bulk charging stages. Again, the average battery bank voltage never dips below the fully discharged level of 45.6V. Also, August is the only month
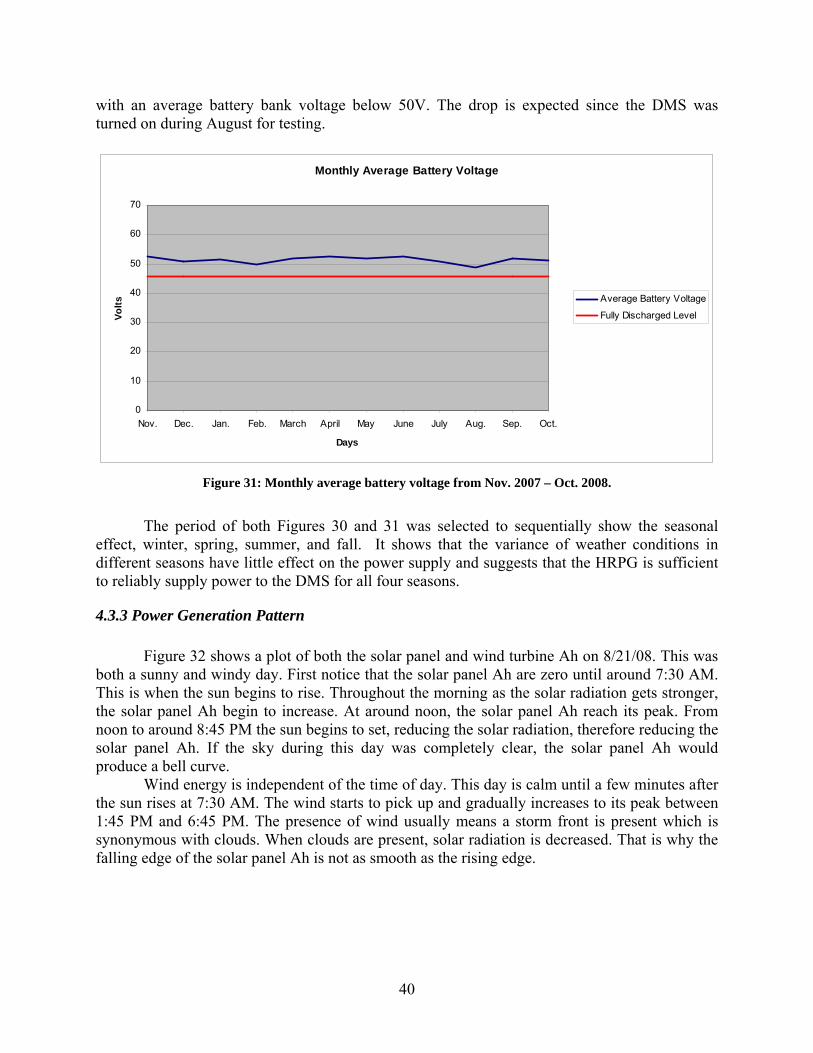
40
with an average battery bank voltage below 50V. The drop is expected since the DMS was turned on during August for testing.
Monthly Average Battery Voltage
0
10
20
30
40
50
60
70
Nov. Dec. Jan. Feb. March April May June July Aug. Sep. Oct.
Days
Volts Average Battery Voltage
Fully Discharged Level
Figure 31: Monthly average battery voltage from Nov. 2007 – Oct. 2008.
The period of both Figures 30 and 31 was selected to sequentially show the seasonal effect, winter, spring, summer, and fall. It shows that the variance of weather conditions in different seasons have little effect on the power supply and suggests that the HRPG is sufficient to reliably supply power to the DMS for all four seasons.
4.3.3 Power Generation Pattern Figure 32 shows a plot of both the solar panel and wind turbine Ah on 8/21/08. This was both a sunny and windy day. First notice that the solar panel Ah are zero until around 7:30 AM. This is when the sun begins to rise. Throughout the morning as the solar radiation gets stronger, the solar panel Ah begin to increase. At around noon, the solar panel Ah reach its peak. From noon to around 8:45 PM the sun begins to set, reducing the solar radiation, therefore reducing the solar panel Ah. If the sky during this day was completely clear, the solar panel Ah would produce a bell curve. Wind energy is independent of the time of day. This day is calm until a few minutes after the sun rises at 7:30 AM. The wind starts to pick up and gradually increases to its peak between 1:45 PM and 6:45 PM. The presence of wind usually means a storm front is present which is synonymous with clouds. When clouds are present, solar radiation is decreased. That is why the falling edge of the solar panel Ah is not as smooth as the rising edge.
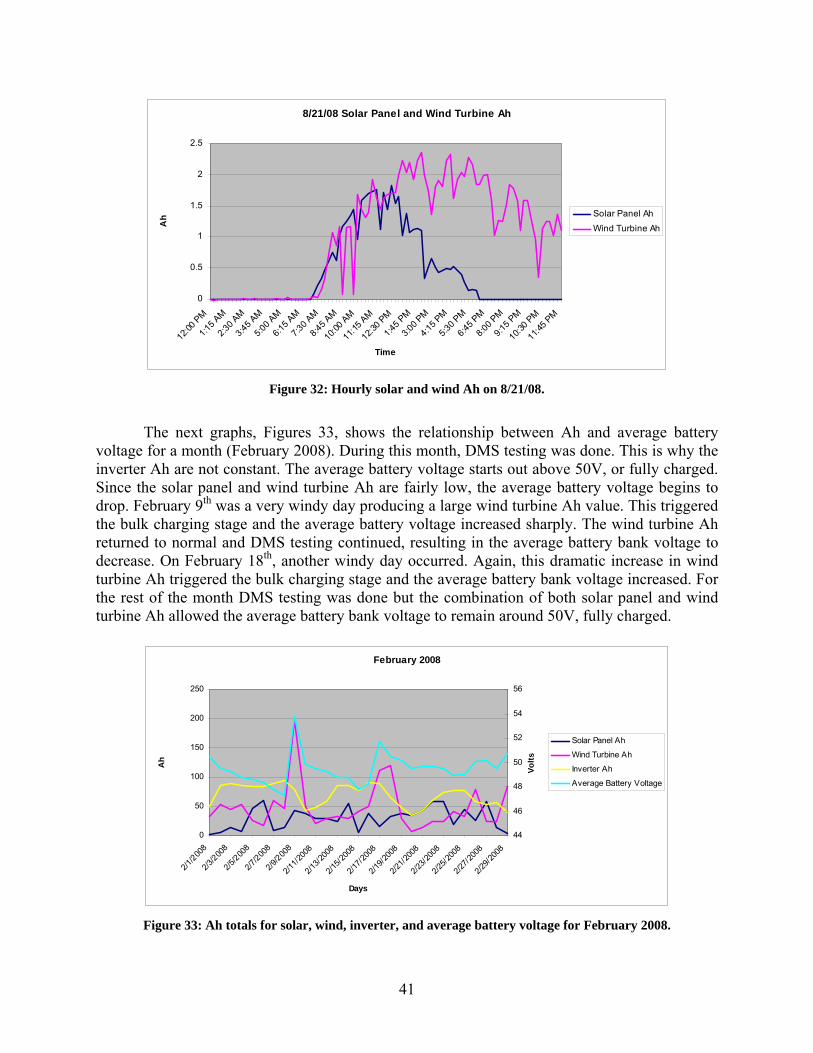
41
8/21/08 Solar Panel and Wind Turbine Ah
0
0.5
1
1.5
2
2.5
12:00
PM
1:15 A
M
2:30 A
M
3:45 A
M
5:00 A
M
6:15 A
M
7:30 AM
8:45 A
M
10:00
AM
11:15
AM
12:30
PM
1:45 P
M
3:00 P
M
4:15 P
M
5:30 P
M
6:45 P
M
8:00 P
M
9:15 P
M
10:30 P
M
11:45
PM
Time
Ah Solar Panel Ah
Wind Turbine Ah
Figure 32: Hourly solar and wind Ah on 8/21/08.
The next graphs, Figures 33, shows the relationship between Ah and average battery voltage for a month (February 2008). During this month, DMS testing was done. This is why the inverter Ah are not constant. The average battery voltage starts out above 50V, or fully charged. Since the solar panel and wind turbine Ah are fairly low, the average battery voltage begins to drop. February 9th was a very windy day producing a large wind turbine Ah value. This triggered the bulk charging stage and the average battery voltage increased sharply. The wind turbine Ah returned to normal and DMS testing continued, resulting in the average battery bank voltage to decrease. On February 18th, another windy day occurred. Again, this dramatic increase in wind turbine Ah triggered the bulk charging stage and the average battery bank voltage increased. For the rest of the month DMS testing was done but the combination of both solar panel and wind turbine Ah allowed the average battery bank voltage to remain around 50V, fully charged.
February 2008
0
50
100
150
200
250
2/1/200
8
2/3/200
8
2/5/200
8
2/7/200
8
2/9/200
8
2/11/2
008
2/13/2
008
2/15/2
008
2/17/2
008
2/19/2
008
2/21/2
008
2/23/2
008
2/25/2
008
2/27/2
008
2/29/2
008
Days
Ah
44
46
48
50
52
54
56
Volts
Solar Panel Ah
Wind Turbine Ah
Inverter Ah
Average Battery Voltage
Figure 33: Ah totals for solar, wind, inverter, and average battery voltage for February 2008.

42
4.4 DMS Testing Over the year long data collection period, several DMS test messages were used in order to test the reliability of the HRPG. Figure 34 shows images of the four test messages used.
Figure 34: Images of the DMS test messages.
These four messages varied in length or the number of bricks that were used. Power consumed by the DMS sign is dependent on the number of bricks used, i.e. the more bricks that are on, the more LEDS, and the larger the current draw. Table 16 summarizes current and powered consumed by the four DMS test messages.
Table 16: Summary of DMS Test Messages.
Message Number of Bricks Current Power none 0 1.9 amp 91W BUCKLE UP 8 3.2 amp 154W DRIVE WITH CARE 13 3.7 amp 178W SIGN TEST IN PROGRESS 18 4.0 amp 192W TEST 01 TEST ABCDEFGHIJKLMNOPQRSTUVW
34 5.5 amp 264W
As stated before, the DMS with no message displayed still consumes power due to the DC power supply, modem, fan, and other components in the DMS control cabinet. This power consumption is about 91W. The smallest message used for DMS testing was “BUCKLE UP”. This message contained 8 bricks and increased the power consumed by the DMS by 63W drawing a total of 154W. The largest message used for the DMS testing was “TEST 01 TEST ABCDEFGHIJKLMNOPQRSTUVW”, which used 34 bricks. The total power consumed by the DMS sign was increased by 173W. The continuous sign-on tests were conducted between Jan. - June, 2008. During this period inverter failures were experienced. Finally, the inverter was upgraded to an OutBack VFX3648 3,600W unit on July 1, 2008. Sign tests were continued and conducted by Kevin Schmidt at Mn/DOT District-3 and the data is summarized in Table 17. With the change to a higher output inverter, the DMS sign worked for all continuous-on tests without any problem.

43
Table 17: Sign Tests After Inverter Replacement
Period Continuously ON Message DMS Status 7/7/2008-7/14/2008 132 hours 18 characters On, No failure
7/15/2008-7/23/2008 193 hours 34 characters On, No failure 8/7/2008-8/20/2008 312 hours 13 characters On, No failure
Also, in order to insure that the installed HRPG works at a higher load, heavy load tests were performed on August 21, 2008. A regular iron and heater were connected at the DMS AC outlet which is powered by the HRPG. Also, a 100 watt light bulb was connected to increase the power. The combined load was 2,300W, and the inverter was able to handle the load.
Figure 35: High load test using an iron, heater, and 100 watt bulb

44
CHAPTER 5 - DESIGN STEPS
The solar/wind hybrid renewable power generator in this report was a 48V system that supplied power to a DMS. No matter what type of application is intended to be powered or at what voltage level the energy produced is being stored, a set of certain steps need to be followed in order to properly implement a HRPG. Below are those steps.
1. Chose a location and application. 2. Using solar radiation maps supplied by the NREL, estimate the expected seasonal
daily solar energy. Section 2.2.2 3. Using wind maps and the classes of wind power density, estimate the expected
seasonal daily wind power energy. Section 2.3.2 4. Compute the daily power demands of the target application Section 2.3.1 5. Compute the battery bank using requirement of the application power demand,
number of consecutive days of power supply (typically 7 days), temperature effect, and the maximum allowable battery discharge level. Section 2.3.1
6. Select batteries that are suitable for the weather conditions of the system and consider adding low voltage protection in order to prolong battery life. Section 2.3.1
7. Select a solar panel and wind turbine model. Use the expected seasonal daily energy estimates found in steps 2 and 3 to determine if the combination of both can produced enough power to supply the target application for all seasons. Section 2.3.2
8. Calculate the wind load for the mounting pole and carefully select the height and placements of the solar panel(s) and wind turbine on the pole. Section 2.3.3
9. Design the circuit using the example given in Figure 16. 10. Install the system using the information provided in Chapter 3.

45
CHAPTER 6 - CONCLUSION The objective of this research was to design, build, and field test a solar/wind hybrid
renewable power generator (HRPG) that could reliably supply power to a typical a DMS. The DMS consists of 36 bricks arranged as three lines of 12 characters. The HRPG was designed using three 170W solar panels, a 1,000W wind turbine, thirty-two 6V AGM batteries with 42kWh capacity, and a 3,600W inverter. The construction was completed on July 17, 2007, and the data was collect from August 8, 2007 to December 28, 2008.
During the beginning of the field test period, transient inverter failures were observed. Because these failures were short, it took a long time to discover the cause. In the initial design of the HRPG, a 600W inverter with a 1,200W surge was used. Testing of the DMS sign began in February 2008 with several different messages. On-site observations of the status of the DMS were recorded daily. It was found that some days the DMS was blank even though the battery bank voltage was still fully charged. On April, 20 2008 the inverter was changed to a 1,100W inverter a 2,200W surge. Again, the DMS was tested and it was observed that the DMS was not displaying messages. This inverter failed on June 13, 2008. Finally, on July 1, 2008, the inverter was replaced with the present OutBack VFX3638. This inverter is rated for 3,600W at 48V with surges up to 6,000W. Since then, the DMS was tested for a month with different messages and no failures were observed.
As part of the design of the HRPG, seasonal daily energy generation and demands were calculated based on the solar radiation and wind energy available at the Camp Ripley Junction, MN location and the average power consumption of the DMS. It was concluded that the system was over designed, meaning that estimated daily energy generation of the solar panels and wind turbine was much more than the estimated daily energy demand of the DMS. When the recorded data was analyzed, the actual seasonal daily energy generation and demands of the system were much less. First, the actual energy demand of DMS was much less than the estimated demand. This is because the energy demand of the DMS was based on an average 24-hour current draw with a message that utilizes 40% of the LEDs. Testing of the DMS sign only lasted a few weeks at a time, with the DMS turned off the rest of the time. Second, if the battery bank voltage is above 50.4V, it is considered fully charged. The monthly average battery bank voltage graph suggested that the battery bank was fully charged for a majority of the data collection period. When the battery bank is fully charged, energy produced by either the solar panels or wind turbine cannot be used to charge the battery bank and is considered extra energy. This extra energy is then diverted to a heat sink on either the solar panel or wind turbine charge controller and not recorded as energy produced. Not only did this result in the actual energy generation being much less than the estimated energy generation, but the difference between actual energy generated and energy demand was minimal. In other words, the energy use by DMS was not sufficient to test the full electricity generation capability of the HRPG. On the other hand, the HRPG provided very high power reliability. Data was collected from the data logging system consisted of battery bank voltage, average battery bank voltage, solar panel instantaneous amps, solar panel Ah, wind turbine instantaneous amps, wind turbine Ah, inverter instantaneous amps, inverter Ah, and temperature. The data logging system used an A/D converter unit and shunts connected in series with the negative rail of the solar panels, wind turbine, and inverter. Since the shunts are connected on the negative rail of each source or load, the system monitors current using low-side measurements. This created a direct current path from the generators to the load bypassing the shunt, which

46
resulted in inaccurate measurement the amp hours produced. In the data analysis, a simple calibration algorithm resolved the measurement issue. However, if high side measurements were used in the first place, no calibration would be required. Low-side measurements are typically used for renewable energy generators and use absolute voltage measurements from the battery ground to calculate current. This method is used most commercial systems because it is cheaper than building accurate differential measurements. The alternative approach is to use high-side measurements. In this approach, the shunts are connected in series with the components of the system on the positive rail. High-side measurements use differential voltages to calculate current. This technique is more complex and requires higher accuracy components than the absolute low-side measurements. Also, high-side measurements are typically used for low voltage, low power systems, such as cell phones. For measurements of high voltage, high power systems, development of a high-side measurement system is recommended. If an opportunity is given to extend this research, the authors of this report are interested in developing a high-side power measurement systems for high voltage, high power systems.
As part of a previous research project, the research team designed and built a solar/wind hybrid renewable light pole [1]. This was a 12V system that powered a street light. Similarly, a solar panel and wind turbine were used to charge the battery bank but with smaller generation capacities. The battery bank consisted of six 6V AGM batteries with a capacity of 4.3kWh. In comparison, the battery capacity of the present HRPG is 42kWh, which is about 10 times more. Also, solar and wind generators have much higher power generation capacities. When the battery levels of two systems were compared, a small pond against big lake effect was observed. That is, adding or drawing a small amount of water to or from a big lake does not change the water level much. On the other hand, adding or drawing a small amount of water to or from a small pond could quickly change the water level. This means that if an application requires a higher power reliability, the battery capacity should be increased in addition to increasing the power generation capacity. Another important factor is that stable battery level also extends the battery life, eventually recovering the extra cost of battery.
In conclusion, this project successfully demonstrated that a solar/wind integrated HRPG can reliably support the power requirement of a typical DMS under all weather conditions.

47
REFERENCES
[1] T.M. Kwon, R. Weidemann, and D. Cinnamon, TDRL Projects: Solar/Wind Hybrid Renewable Light Pole, Gravel-Road Traffic Counter, DLL-Based Traffic Software Development Kit, CTS 08-21, ITS Institute, Center for Transportation Studies, Twin Cities, MN, Dec 2008. [2] National Renewable Energy Laboratory, http://www.nrel.gov/gis/maps.html, accessed January 12, 2009 [3] Google Maps, http://maps.google.com/maps, accessed January 13, 2009 [4] ADDCO Inc., ADDCO BRICK Modular Message Sign System Procurement Specification, ADDCO Inc., St. Paul, MN, 2000. [5] Kyocera, KC170GT High Efficiency Multicrystal Photovoltaic Module, Kyocera, Tokyo, Japan. [6] Southwest Windpower, Whisper 100, Whisper 200 Technical Specification, Southwest Windpower, Flagstaff, AZ, 2005. [7] OutBack Power Systems, MX60 PV MPPT Charge Controller: Installation and User’s Manual, OutBack Power Systems, Arlington, WA, 2003. [8] D.P. Hohm and M.E. Ropp, “Comparative Study of Maximum Power Point Tracking Algorithms Using an Experimental, Programmable, Maximum Power Point Tracking Test Bed,” Proc. Photovoltaic Specialist Conference, 2000, pp. 1699- 1702.

48
APPENDIX A: MOUNTING POLE DESIGN

49

50

51

52

53

54

55

56
APPENDIX B: SOLAR PANEL ASSEMBLY

57
Solar Panel Rack Assembly: UniRac 4002 PV Module Rack Components:
• 2-40” rails • 2-35” U-channels • 2 legs (short one) • 9/16” bolts and nuts • 7/16” bolts and nuts • Mounting clips • 2 U-bolts
1. Place and mount 40” rails on the back of PV panel using the mounting clips.
2. Tighten the clips using the 7/16” bolts, washer, and lock nuts.
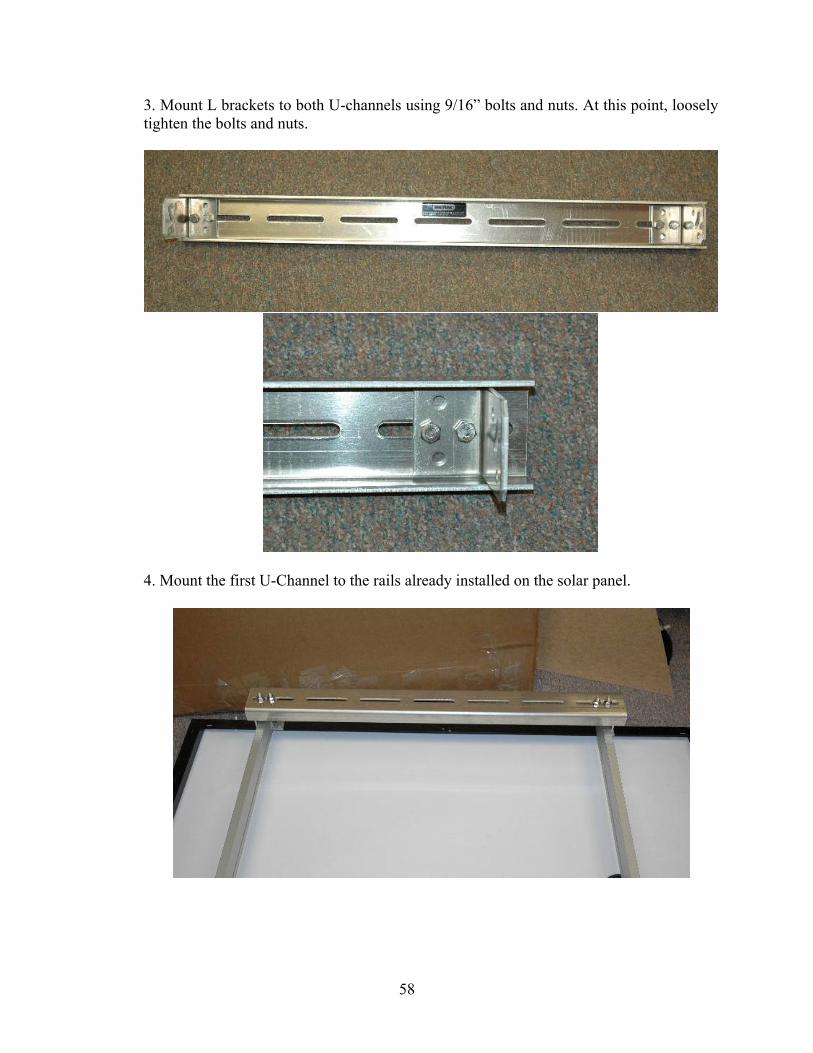
58
3. Mount L brackets to both U-channels using 9/16” bolts and nuts. At this point, loosely tighten the bolts and nuts.
4. Mount the first U-Channel to the rails already installed on the solar panel.
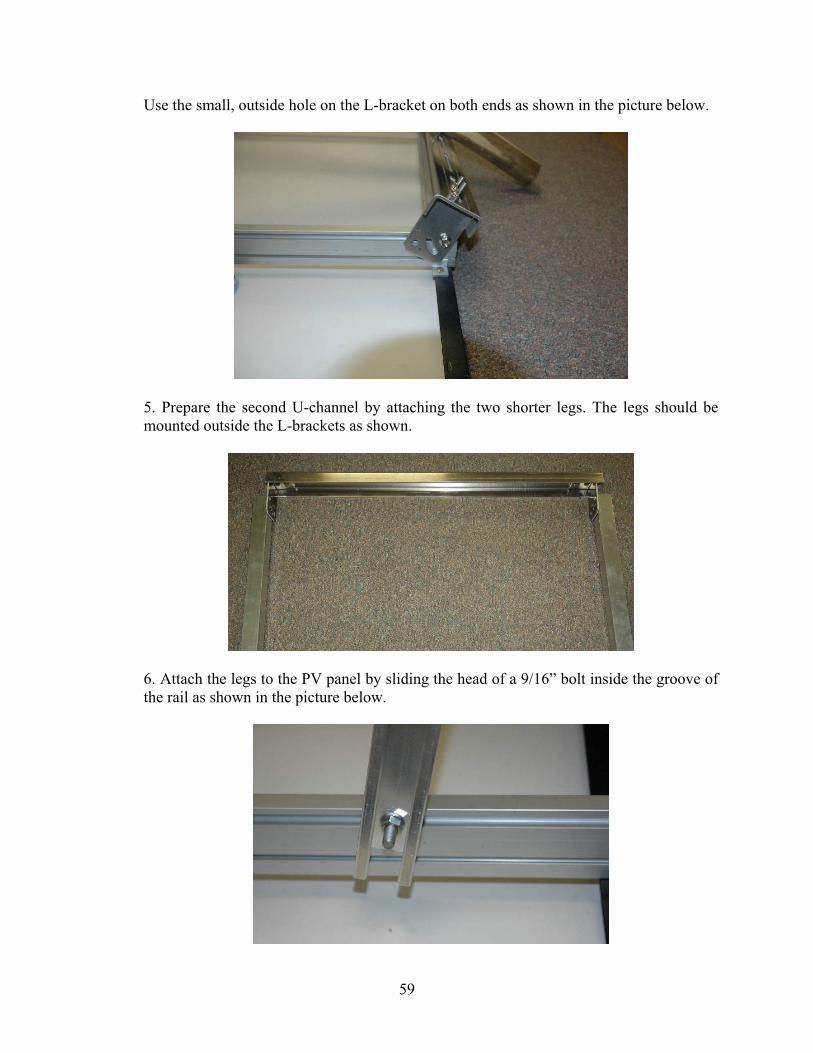
59
Use the small, outside hole on the L-bracket on both ends as shown in the picture below.
5. Prepare the second U-channel by attaching the two shorter legs. The legs should be mounted outside the L-brackets as shown.
6. Attach the legs to the PV panel by sliding the head of a 9/16” bolt inside the groove of the rail as shown in the picture below.

60
7. After attaching both legs, the PV panel should look like below picture.
8. Adjust the tilt angle of the PV and the face direction as shown below. Tighten all nuts and bolts.

61
APPENDIX C: WIND TURBINE AND CONTROLLER ASSEMBLY

62
Assembly of Wind Turbine: The diagram below is from page 5 of the Whisper 200 Owner’s Manual and best
describes the assembly of the wind turbine.
For mounting the wind turbine on the top of the pole, please refer to the diagrams on page
12 of the Whisper 200 Owner’s Manual.
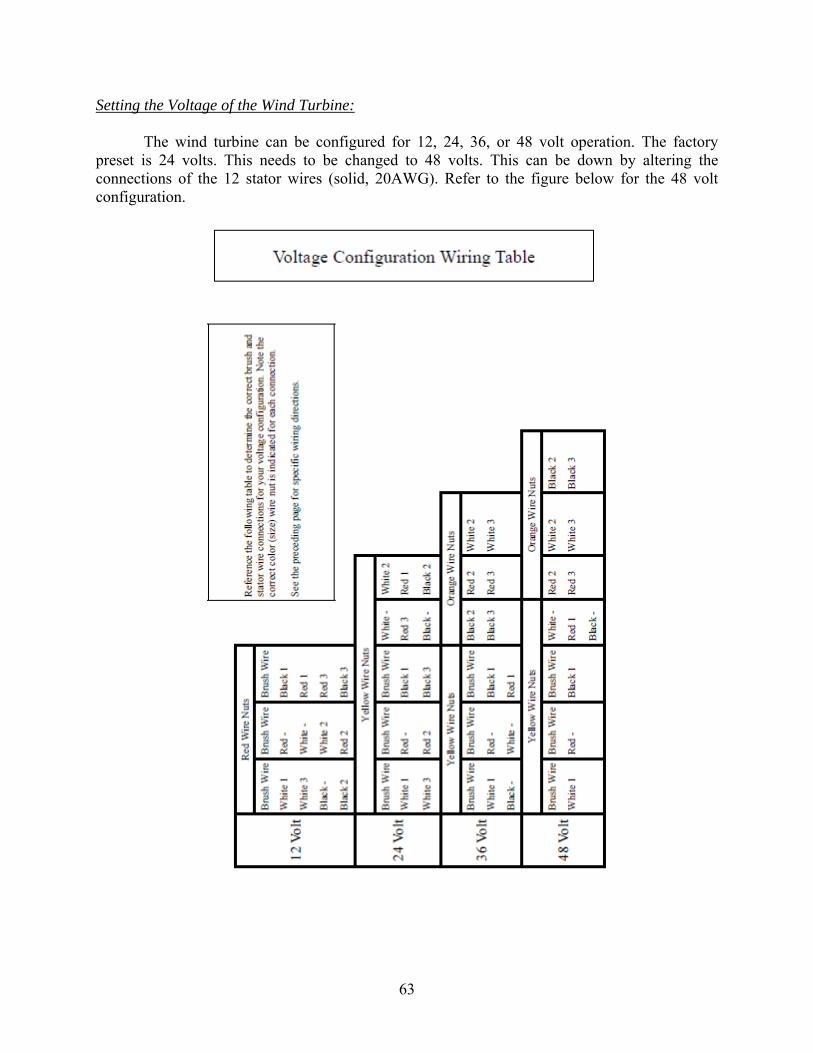
63
Setting the Voltage of the Wind Turbine: The wind turbine can be configured for 12, 24, 36, or 48 volt operation. The factory
preset is 24 volts. This needs to be changed to 48 volts. This can be down by altering the connections of the 12 stator wires (solid, 20AWG). Refer to the figure below for the 48 volt configuration.

64
There are three brush wires (stranded, 8AWG) exiting the bottom of the wind turbine rotor. For extension of these wires, 10 or 12AWG can be used. The extended wires should be taped so that they stay together. The three brush wires are connected to the Whisper 200 controller at the connectors shown below. The wires can be connected to the charge controller in any order.
Controller DIP Switch Settings:
The Whisper Controller is equipped with a six-position switch shown below. Switches 1 and 2 are used to set the system voltage. The remaining switches are only used in special situations and should remain in their default positions.

65
Switches 1 and 2: The switches are factory preset for 24 volt operation. To change the voltage setting adjust
the switches according to Table 1. After changing the switch settings the Reset Switch must be depressed to “activate” the switch settings.
System Voltage Switch 1 Switch 2 12 Volt ON ON 24 Volt OFF ON 36 Volt ON OFF 48 Volt OFF OFF
Switch 3: Time Hysteresis, Default Setting “ON” Switch 4: Voltage Hysteresis, Default Setting “OFF” Switch 5: Potentiometer Enable, Default Setting “OFF” Switch 6: Unassigned, Default Setting “OFF” Setting Regulation Voltage (without the display):
The battery voltage at which the controller begins regulating the battery (i.e. diverting power to the heat sink) can be adjusted by turning a potentiometer on the controller’s circuit board. The potentiometer is accessed by removing the Whisper Controller electronics cover. When the controller measures a battery voltage above the Regulation Voltage for more than approximately one minute, it begins diverting power. If the controller measures a battery voltage below the Release Voltage for approximately one minute it will stop diverting power and start charging the battery again. This set point only adjusts the “shut down” voltage for battery charging. Overcharging will significantly reduce a battery’s life expectancy.
Diversion Switch:
The diversion switch is located on the top of the controller to the left of the LEDs. This switch will divert turbine power to the heat sink to keep the batteries from being charged. While this switch does not necessarily stop a spinning turbine, once the turbine has stopped, this switch will keep it from spinning. Therefore, it should be noted that in most situations this switch

66
can be used as a stop switch; however, spinning blades with an activated diversion switch is a normal and safe operational state. In short, the Red LED indicates that turbine power is being diverted to the heat sink and the Green LED indicates that the turbine is spinning and the battery is being charged. The LED operation is detailed in the tables below. Diversion Switch ON: Used for normal operation. The voltage will be regulated according to the Voltage Setting and Regulation ON and OFF voltages in Figure 3: Diversion Switch OFF: Used to divert the turbine power to the heat sink manually. Green LED Red LED Status
ON OFF Available turbine power directed to battery. The batteries are being charged. Diversion Switch ON.
OFF Blinking Available turbine power directed to the heat sink for battery regulation. Diversion Switch ON.
OFF ON Available turbine power directed to heat sink by operator request. Diversion Switch OFF.
*Note: Connect the Controller to the battery BEFORE connecting to the turbine, otherwise the Controller will be damaged.

67
APPENDIX D: OUTBACK MX60 MPPT CHARGE CONTROLLER SET UP

68
Before any connection or setup, the battery system voltage must be set to 48V. Factory default setting is 24V. Before describing the setup, the soft keys are named as shown below.
Setup Steps: 1. Disconnect the PV and Battery lines. 2. Hold down soft keys 1 and 3. 3. Connect the Battery lines (or breaker to ON). 4. Release both soft keys. 5. You will be now at the voltage selection screen. Pressing or ENTER will require
password. 6. Push “-“ until the number becomes 141. Press the soft key ENTER. 7. Press NEXT to select the system battery voltage, and select 48V.
SYSTEM VOLTAGE12 24 36 48 60 ^^ EXIT -> ENTER
Password *** 141 *** Enter - +
SYSTEM VOLTAGE12 24 36 48 60 ^^ EXIT -> ENTER

69
8. Confirm that the selected battery voltage is correct by pressing the YES soft key. When the MX60 is powered up, the initial screen should show the selected 48V as
shown. Battery Charger Set Points (AGM) Absorb voltage set point: 57.2V Float voltage set point: 54.4V
Are you sure?12 24 36 48 60 ^^ NO YES
Outback 48V Power System MX60

70
APPENDIX E: RAW DAILY DATA
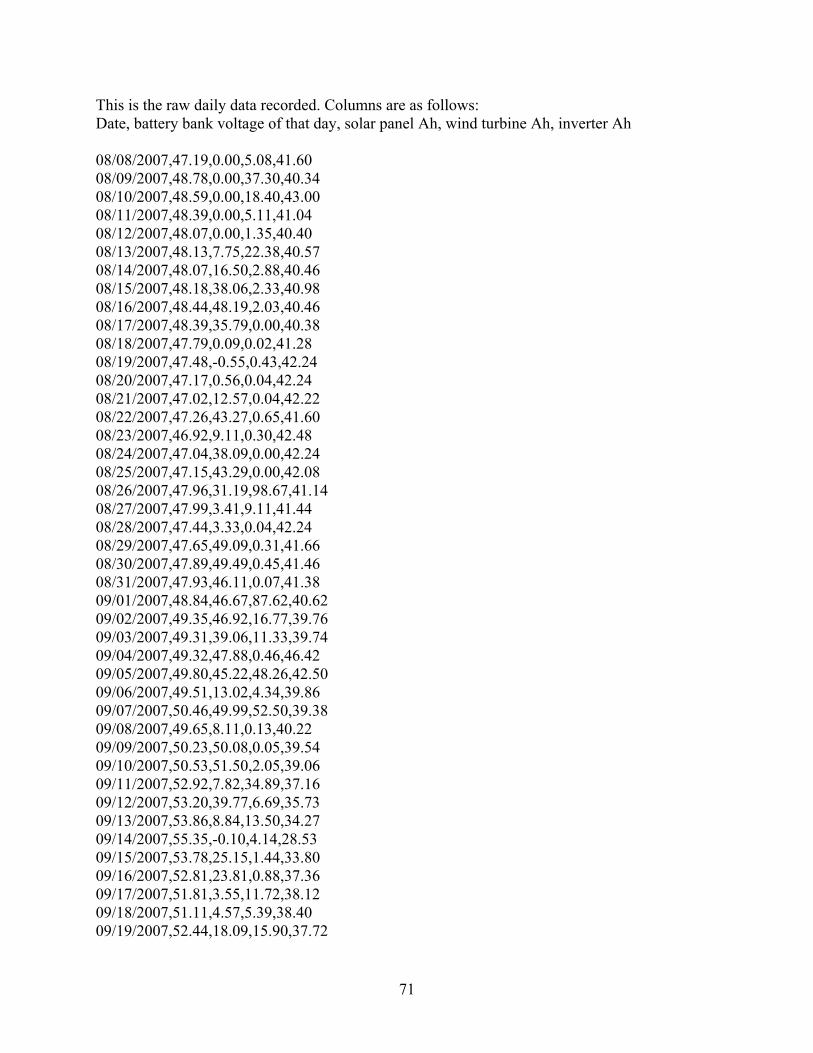
71
This is the raw daily data recorded. Columns are as follows: Date, battery bank voltage of that day, solar panel Ah, wind turbine Ah, inverter Ah 08/08/2007,47.19,0.00,5.08,41.60 08/09/2007,48.78,0.00,37.30,40.34 08/10/2007,48.59,0.00,18.40,43.00 08/11/2007,48.39,0.00,5.11,41.04 08/12/2007,48.07,0.00,1.35,40.40 08/13/2007,48.13,7.75,22.38,40.57 08/14/2007,48.07,16.50,2.88,40.46 08/15/2007,48.18,38.06,2.33,40.98 08/16/2007,48.44,48.19,2.03,40.46 08/17/2007,48.39,35.79,0.00,40.38 08/18/2007,47.79,0.09,0.02,41.28 08/19/2007,47.48,-0.55,0.43,42.24 08/20/2007,47.17,0.56,0.04,42.24 08/21/2007,47.02,12.57,0.04,42.22 08/22/2007,47.26,43.27,0.65,41.60 08/23/2007,46.92,9.11,0.30,42.48 08/24/2007,47.04,38.09,0.00,42.24 08/25/2007,47.15,43.29,0.00,42.08 08/26/2007,47.96,31.19,98.67,41.14 08/27/2007,47.99,3.41,9.11,41.44 08/28/2007,47.44,3.33,0.04,42.24 08/29/2007,47.65,49.09,0.31,41.66 08/30/2007,47.89,49.49,0.45,41.46 08/31/2007,47.93,46.11,0.07,41.38 09/01/2007,48.84,46.67,87.62,40.62 09/02/2007,49.35,46.92,16.77,39.76 09/03/2007,49.31,39.06,11.33,39.74 09/04/2007,49.32,47.88,0.46,46.42 09/05/2007,49.80,45.22,48.26,42.50 09/06/2007,49.51,13.02,4.34,39.86 09/07/2007,50.46,49.99,52.50,39.38 09/08/2007,49.65,8.11,0.13,40.22 09/09/2007,50.23,50.08,0.05,39.54 09/10/2007,50.53,51.50,2.05,39.06 09/11/2007,52.92,7.82,34.89,37.16 09/12/2007,53.20,39.77,6.69,35.73 09/13/2007,53.86,8.84,13.50,34.27 09/14/2007,55.35,-0.10,4.14,28.53 09/15/2007,53.78,25.15,1.44,33.80 09/16/2007,52.81,23.81,0.88,37.36 09/17/2007,51.81,3.55,11.72,38.12 09/18/2007,51.11,4.57,5.39,38.40 09/19/2007,52.44,18.09,15.90,37.72

72
09/20/2007,51.17,-0.46,5.51,38.30 09/21/2007,52.94,10.88,16.27,34.55 09/22/2007,53.12,24.59,1.70,35.48 09/23/2007,55.49,5.18,14.71,28.38 09/24/2007,53.30,2.60,9.05,35.05 09/25/2007,52.94,0.47,18.03,37.02 09/26/2007,53.24,17.04,5.51,35.25 09/27/2007,53.42,29.39,0.81,34.48 09/28/2007,53.37,26.06,1.72,36.40 09/29/2007,56.20,0.11,4.74,24.69 09/30/2007,52.68,3.81,2.08,34.79 10/01/2007,51.60,26.60,1.27,44.28 10/02/2007,54.06,6.88,27.03,34.63 10/03/2007,53.96,22.38,3.52,34.01 10/04/2007,52.50,21.66,4.68,40.64 10/05/2007,50.90,0.17,0.05,40.26 10/06/2007,52.09,30.35,26.39,40.68 10/07/2007,51.19,-0.08,3.35,40.08 10/08/2007,51.44,4.23,14.67,38.70 10/09/2007,56.63,-0.54,35.73,24.67 10/10/2007,54.10,4.04,0.74,32.61 10/11/2007,51.17,4.85,0.00,40.36 10/12/2007,50.70,7.44,0.00,40.30 10/13/2007,51.08,21.11,0.00,39.28 10/14/2007,50.24,3.32,0.00,40.08 10/15/2007,50.07,-0.74,0.09,40.24 10/16/2007,49.82,-0.64,0.00,40.32 10/17/2007,49.67,1.05,1.16,40.32 10/18/2007,49.77,-0.69,29.69,43.66 10/19/2007,52.93,1.65,184.36,44.14 10/20/2007,51.10,14.29,0.00,38.40 10/21/2007,50.51,-0.10,1.08,39.00 10/22/2007,51.58,46.59,13.34,38.70 10/23/2007,53.14,19.74,20.52,37.68 10/24/2007,52.98,47.36,0.13,37.50 10/25/2007,54.05,9.68,23.36,34.16 10/26/2007,53.39,27.74,0.39,36.74 10/27/2007,53.51,16.16,2.28,35.47 10/28/2007,54.28,23.84,1.66,34.48 10/29/2007,52.82,25.81,0.04,37.96 10/30/2007,52.91,33.44,5.62,38.26 10/31/2007,57.39,-0.46,1.39,20.44 11/01/2007,55.18,27.32,1.87,31.55 11/02/2007,55.54,1.92,5.57,28.88 11/03/2007,53.13,27.74,1.54,37.36 11/04/2007,52.23,26.86,0.01,37.80

73
11/05/2007,58.53,-0.20,12.43,20.55 11/06/2007,55.76,-0.14,1.53,26.60 11/07/2007,53.07,4.18,6.26,37.28 11/08/2007,51.58,15.15,0.11,38.06 11/09/2007,51.20,5.66,3.06,38.14 11/10/2007,52.78,6.28,25.27,37.46 11/11/2007,51.49,12.81,6.78,38.22 11/12/2007,52.26,26.11,7.08,37.86 11/13/2007,54.21,-0.35,31.51,38.77 11/14/2007,59.12,-0.69,3.24,16.90 11/15/2007,54.33,1.86,4.28,34.45 11/16/2007,52.83,30.45,0.00,37.50 11/17/2007,51.06,1.06,0.06,38.40 11/18/2007,53.66,0.20,35.32,36.11 11/19/2007,51.79,8.91,1.55,39.96 11/20/2007,51.52,4.68,11.53,50.58 11/21/2007,50.95,3.30,3.13,51.80 11/22/2007,51.17,21.20,0.01,38.80 11/23/2007,51.80,13.81,9.57,37.96 11/24/2007,52.10,14.05,5.98,38.30 11/25/2007,53.00,11.17,21.01,37.38 11/26/2007,54.71,20.10,16.68,34.32 11/27/2007,54.72,12.50,0.67,33.43 11/28/2007,54.62,5.96,3.72,30.13 11/29/2007,55.99,11.15,2.00,30.78 11/30/2007,55.85,13.57,0.60,31.10 12/01/2007,50.70,0.00,0.06,38.68 12/02/2007,54.53,5.99,15.90,34.50 12/03/2007,50.90,4.87,0.00,39.67 12/04/2007,50.13,-0.03,0.24,38.84 12/05/2007,52.51,49.18,0.07,37.66 12/06/2007,50.78,-0.15,10.76,37.70 12/07/2007,52.71,37.24,0.00,31.78 12/08/2007,52.45,19.44,0.00,24.61 12/09/2007,49.80,6.91,0.00,34.53 12/10/2007,52.49,32.94,6.17,31.06 12/11/2007,52.37,40.77,1.10,37.66 12/12/2007,53.56,40.89,21.38,36.26 12/13/2007,55.04,9.52,6.85,33.02 12/14/2007,53.33,23.37,-0.01,30.01 12/15/2007,50.70,4.17,0.74,35.56 12/16/2007,50.13,3.50,0.04,38.10 12/17/2007,51.36,32.95,0.00,37.78 12/18/2007,51.28,30.61,0.00,37.50 12/19/2007,49.69,3.57,0.06,40.00 12/20/2007,50.36,15.66,5.92,39.06

74
12/21/2007,49.58,1.05,0.51,40.32 12/22/2007,52.31,24.23,90.88,38.06 12/23/2007,57.42,-0.41,16.12,23.04 12/24/2007,53.86,20.26,5.55,34.96 12/25/2007,51.06,3.49,0.09,38.20 12/26/2007,50.63,1.92,0.00,38.72 12/27/2007,50.25,2.62,0.30,39.42 12/28/2007,49.74,2.51,0.00,39.28 12/29/2007,49.46,6.38,1.31,39.44 12/30/2007,50.94,25.30,18.52,37.82 12/31/2007,51.62,21.22,48.11,38.56 01/01/2008,55.24,21.96,41.02,32.90 01/02/2008,53.93,21.54,9.92,30.89 01/03/2008,55.63,8.94,3.42,30.62 01/04/2008,53.13,13.55,7.92,34.56 01/05/2008,53.74,16.98,13.75,35.11 01/06/2008,52.30,19.29,0.30,37.84 01/07/2008,51.58,20.70,0.00,38.10 01/08/2008,52.26,27.48,7.83,37.70 01/09/2008,50.82,8.19,0.17,38.78 01/10/2008,50.51,-0.05,9.54,39.60 01/11/2008,50.22,6.10,2.11,40.10 01/12/2008,50.27,28.79,0.00,58.44 01/13/2008,50.09,20.82,15.98,59.44 01/14/2008,52.56,46.26,11.95,42.16 01/15/2008,53.88,30.64,17.20,26.00 01/16/2008,53.58,1.24,20.72,35.62 01/17/2008,53.07,24.49,0.12,36.89 01/18/2008,57.01,19.22,5.09,28.16 01/19/2008,53.48,13.44,0.02,18.50 01/20/2008,53.09,15.83,0.00,16.73 01/21/2008,51.56,14.30,0.00,42.26 01/22/2008,53.07,28.95,1.72,30.03 01/23/2008,53.07,21.45,0.33,20.20 01/24/2008,53.07,20.05,-2.54,23.37 01/25/2008,52.61,36.77,1.00,54.62 01/26/2008,50.25,23.51,0.10,59.08 01/27/2008,50.55,34.76,5.98,59.88 01/28/2008,51.20,10.00,58.46,57.24 01/29/2008,58.72,-0.50,4.44,19.86 01/30/2008,54.95,10.39,0.24,24.07 01/31/2008,53.04,20.80,0.26,38.20 02/01/2008,53.43,2.14,10.59,45.80 02/02/2008,50.02,5.57,0.17,85.66 02/03/2008,49.65,14.65,16.17,88.00 02/04/2008,48.94,6.80,0.00,84.80

75
02/05/2008,49.23,45.62,0.02,83.38 02/06/2008,49.35,59.38,0.00,83.02 02/07/2008,48.00,8.85,0.00,88.98 02/08/2008,47.51,13.63,0.00,94.48 02/09/2008,50.64,42.93,165.48,77.70 02/10/2008,54.77,38.13,15.42,39.74 02/11/2008,50.59,29.80,0.05,46.17 02/12/2008,49.96,29.03,1.50,57.42 02/13/2008,49.10,24.98,0.04,84.18 02/14/2008,49.67,54.50,10.17,84.94 02/15/2008,48.11,5.00,0.68,76.86 02/16/2008,48.88,38.80,39.81,91.66 02/17/2008,49.34,15.41,103.19,89.36 02/18/2008,52.68,31.57,104.51,65.38 02/19/2008,52.28,38.35,16.03,45.42 02/20/2008,52.66,32.77,0.00,33.96 02/21/2008,52.26,42.56,1.63,42.51 02/22/2008,50.99,58.15,0.00,58.56 02/23/2008,50.46,57.84,0.09,73.52 02/24/2008,49.22,19.72,0.00,77.48 02/25/2008,49.73,45.40,4.28,77.24 02/26/2008,50.81,25.83,62.06,57.16 02/27/2008,51.26,57.83,6.62,53.00 02/28/2008,49.93,13.58,1.13,56.42 02/29/2008,53.11,3.54,47.32,38.46 03/01/2008,52.77,44.84,0.36,38.06 03/02/2008,52.39,5.80,12.03,34.85 03/03/2008,55.21,33.96,4.90,33.11 03/04/2008,53.39,10.70,2.88,33.12 03/05/2008,54.40,23.11,10.61,33.93 03/06/2008,54.04,27.57,1.14,33.28 03/07/2008,53.72,21.90,0.20,30.05 03/08/2008,53.96,10.13,3.73,34.19 03/09/2008,51.73,32.48,0.00,32.62 03/10/2008,55.18,22.56,4.51,37.93 03/11/2008,53.40,25.07,5.35,36.38 03/12/2008,52.05,6.80,6.18,37.64 03/13/2008,54.10,25.24,11.04,34.19 03/14/2008,55.59,8.46,13.94,36.00 03/15/2008,53.72,29.15,0.13,36.04 03/16/2008,53.53,32.39,0.86,36.52 03/17/2008,51.43,1.51,13.19,51.28 03/18/2008,50.94,9.01,7.13,56.02 03/19/2008,52.54,50.11,6.49,55.22 03/20/2008,51.93,42.04,0.00,55.66 03/21/2008,50.64,15.21,0.04,57.70

76
03/22/2008,50.79,24.40,7.90,58.78 03/23/2008,51.73,45.83,10.43,58.48 03/24/2008,54.29,16.44,31.09,41.08 03/25/2008,56.08,2.24,10.20,30.21 03/26/2008,53.92,17.04,3.20,36.36 03/27/2008,52.97,29.88,0.00,37.06 03/28/2008,53.51,33.72,0.83,36.72 03/29/2008,57.07,3.87,10.77,25.42 03/30/2008,55.24,15.87,4.49,34.11 03/31/2008,52.99,9.30,0.63,36.78 04/01/2008,53.71,19.84,0.33,36.52 04/02/2008,52.58,12.33,2.23,37.20 04/03/2008,53.46,41.33,2.01,36.72 04/04/2008,53.69,25.43,1.66,35.62 04/05/2008,53.18,35.97,0.08,36.74 04/06/2008,51.49,1.86,0.63,38.16 04/07/2008,52.23,12.41,8.75,40.98 04/08/2008,51.25,12.48,0.03,38.04 04/09/2008,51.30,28.80,0.00,51.32 04/10/2008,52.55,4.33,5.54,51.94 04/11/2008,55.50,1.82,2.77,33.24 04/12/2008,53.94,10.16,0.31,36.40 04/13/2008,53.38,35.77,0.00,36.04 04/14/2008,54.92,22.64,9.89,33.46 04/15/2008,58.09,2.50,3.77,25.41 04/16/2008,55.10,15.02,6.47,34.62 04/17/2008,52.68,27.00,0.04,37.74 04/18/2008,51.99,18.03,0.01,38.00 04/19/2008,52.76,37.23,0.11,37.60 04/20/2008,51.53,13.35,0.33,40.36 04/21/2008,53.73,28.51,25.69,39.97 04/22/2008,53.49,23.02,2.10,40.80 04/23/2008,53.27,37.89,0.77,40.92 04/24/2008,54.24,-0.50,23.67,38.45 04/25/2008,55.27,-0.25,2.75,34.27 04/26/2008,58.31,0.30,3.57,27.20 04/27/2008,53.95,31.06,1.35,40.60 04/28/2008,53.17,35.65,0.06,41.60 04/29/2008,53.38,40.63,0.61,41.42 04/30/2008,52.74,31.65,2.56,71.08 05/01/2008,52.19,19.23,2.13,71.44 05/02/2008,52.84,-0.54,4.33,56.82 05/03/2008,56.18,7.01,5.41,32.31 05/04/2008,54.18,30.35,2.32,39.06 05/05/2008,53.25,36.88,0.64,40.52 05/06/2008,53.28,26.70,3.04,40.16

77
05/07/2008,53.98,25.20,1.61,47.97 05/08/2008,52.66,30.49,0.05,40.82 05/09/2008,52.47,34.21,0.00,40.88 05/10/2008,51.24,3.42,0.47,42.24 05/11/2008,52.84,36.42,0.82,40.78 05/12/2008,53.65,12.19,5.20,47.86 05/13/2008,53.65,2.78,12.53,39.76 05/14/2008,53.17,31.60,0.12,40.56 05/15/2008,52.98,20.66,2.61,40.42 05/16/2008,54.19,20.52,3.84,38.11 05/17/2008,54.80,11.68,2.93,33.17 05/18/2008,53.40,31.23,0.86,40.46 05/19/2008,51.21,3.51,0.14,42.24 05/20/2008,54.01,19.36,12.54,39.62 05/21/2008,52.99,35.37,0.10,40.74 05/22/2008,51.78,33.35,0.05,72.22 05/23/2008,51.45,35.20,0.31,81.94 05/24/2008,52.09,29.67,19.34,80.44 05/25/2008,52.32,15.90,39.53,71.58 05/26/2008,51.99,13.50,28.47,66.74 05/27/2008,52.03,33.50,0.01,41.24 05/28/2008,51.93,29.15,0.55,41.28 05/29/2008,51.05,0.92,2.77,42.12 05/30/2008,51.05,17.05,0.04,41.82 05/31/2008,51.57,36.67,0.41,41.38 06/01/2008,51.64,33.67,1.16,41.24 06/02/2008,50.74,7.08,0.27,42.18 06/03/2008,50.50,5.95,0.08,42.24 06/04/2008,50.41,14.77,0.00,42.16 06/05/2008,50.55,7.98,2.77,42.16 06/06/2008,52.12,14.74,94.11,41.16 06/07/2008,52.08,28.21,10.50,41.06 06/08/2008,51.58,26.47,0.80,41.50 06/09/2008,51.95,26.90,13.98,41.22 06/10/2008,51.65,26.77,0.99,41.42 06/11/2008,51.42,-0.38,2.67,41.74 06/12/2008,52.68,34.17,19.85,35.58 06/13/2008,54.60,2.74,10.37,0.00 06/14/2008,54.22,5.53,1.27,0.00 06/15/2008,55.48,2.57,2.83,0.00 06/16/2008,55.78,0.38,2.41,0.00 06/17/2008,54.25,6.46,1.66,0.00 06/18/2008,53.45,5.83,0.15,0.00 06/19/2008,53.65,3.36,0.11,0.00 06/20/2008,54.85,1.95,1.29,0.00 06/21/2008,54.53,8.87,3.55,0.00
78
06/22/2008,53.91,7.75,0.23,0.00 06/23/2008,52.67,6.22,0.00,0.00 06/24/2008,54.94,4.26,0.84,0.00 06/25/2008,54.56,2.74,2.70,0.00 06/26/2008,53.20,9.02,0.00,0.00 06/27/2008,54.14,6.05,1.83,0.00 06/28/2008,55.42,8.63,0.63,0.00 06/29/2008,55.04,-0.66,3.64,0.00 06/30/2008,53.35,7.27,0.14,0.00 07/01/2008,53.80,3.48,6.55,21.35 07/02/2008,53.33,19.22,1.91,45.04 07/03/2008,52.33,32.50,0.00,45.48 07/04/2008,52.11,26.51,0.08,46.50 07/05/2008,54.02,17.27,37.41,46.48 07/06/2008,53.30,27.50,5.46,48.20 07/07/2008,51.76,18.72,0.21,57.98 07/08/2008,52.89,34.48,43.91,66.96 07/09/2008,52.44,31.67,6.90,68.52 07/10/2008,51.28,9.78,1.10,62.36 07/11/2008,53.49,21.12,77.44,64.62 07/12/2008,55.17,4.98,10.79,63.94 07/13/2008,55.06,0.57,10.63,64.94 07/14/2008,52.30,34.64,10.53,70.36 07/15/2008,51.58,34.17,0.00,86.18 07/16/2008,51.08,12.01,3.59,75.02 07/17/2008,50.70,15.95,0.01,82.88 07/18/2008,50.55,35.37,0.01,86.90 07/19/2008,50.01,8.29,0.02,78.24 07/20/2008,49.67,21.94,0.38,86.38 07/21/2008,49.45,38.92,0.00,88.06 07/22/2008,49.14,40.21,0.01,89.92 07/23/2008,49.24,35.62,6.55,58.18 07/24/2008,48.97,9.82,4.88,48.00 07/25/2008,49.29,26.50,33.28,47.56 07/26/2008,49.36,35.76,0.60,49.16 07/27/2008,49.07,28.09,0.00,50.80 07/28/2008,49.16,36.93,3.22,49.64 07/29/2008,49.44,41.19,19.40,50.06 07/30/2008,49.48,39.34,1.02,49.62 07/31/2008,49.39,28.36,9.11,49.68 08/01/2008,49.46,38.32,3.95,49.12 08/02/2008,49.48,34.57,3.52,47.68 08/03/2008,49.06,7.60,6.62,47.90 08/04/2008,49.00,33.55,0.00,50.10 08/05/2008,49.20,39.71,2.59,49.78 08/06/2008,49.46,42.28,17.79,49.20
79
08/07/2008,49.49,43.32,0.05,49.20 08/08/2008,48.96,19.49,0.03,58.16 08/09/2008,48.86,44.92,0.00,67.46 08/10/2008,48.76,41.71,0.01,65.50 08/11/2008,48.52,21.32,7.14,62.20 08/12/2008,48.34,23.99,5.61,63.14 08/13/2008,48.09,31.50,0.00,65.70 08/14/2008,47.77,25.79,0.04,65.78 08/15/2008,47.66,39.75,0.00,67.02 08/16/2008,47.66,41.06,3.44,68.16 08/17/2008,47.69,47.72,4.91,68.36 08/18/2008,47.55,42.69,0.04,68.82 08/19/2008,47.45,47.19,1.78,67.90 08/20/2008,47.77,45.04,45.44,57.54 08/21/2008,48.53,40.33,100.77,75.54 08/22/2008,49.02,10.72,75.55,74.96 08/23/2008,49.60,32.69,27.61,47.32 08/24/2008,49.39,51.40,0.05,47.50 08/25/2008,49.45,50.48,0.52,47.38 08/26/2008,50.14,47.46,69.02,47.06 08/27/2008,49.48,7.30,1.53,47.74 08/28/2008,49.84,42.84,5.18,47.16 08/29/2008,49.94,41.42,2.18,48.24 08/30/2008,50.38,42.43,48.27,46.72 08/31/2008,51.69,40.50,114.86,45.84 09/01/2008,53.49,32.76,134.37,46.44 09/02/2008,52.34,4.59,13.80,45.62 09/03/2008,52.61,30.90,0.28,45.18 09/04/2008,52.43,39.08,0.01,45.34 09/05/2008,51.53,18.27,0.47,45.86 09/06/2008,51.91,42.60,0.26,45.44 09/07/2008,52.24,19.57,3.88,45.36 09/08/2008,52.26,32.93,0.24,45.36 09/09/2008,52.55,41.21,1.06,45.18 09/10/2008,53.81,0.69,21.02,44.54 09/11/2008,51.88,1.62,7.34,45.68 09/12/2008,51.73,37.19,0.00,45.64 09/13/2008,50.71,1.43,0.26,46.08 09/14/2008,50.83,1.55,1.96,46.08 09/15/2008,50.89,19.98,0.19,45.94 09/16/2008,51.50,51.23,5.62,45.50 09/17/2008,51.60,50.28,0.00,45.60 09/18/2008,52.29,37.50,27.55,45.34 09/19/2008,52.19,22.83,4.32,45.60 09/20/2008,52.03,41.16,0.00,45.52 09/21/2008,52.68,28.24,4.74,45.16
80
09/22/2008,54.67,-0.18,17.30,44.16 09/23/2008,53.82,2.63,10.01,44.60 09/24/2008,52.99,27.72,0.23,45.10 09/25/2008,53.56,11.74,12.80,44.68 09/26/2008,52.98,12.83,5.52,45.16 09/27/2008,52.62,22.02,0.03,45.24 09/28/2008,51.09,6.83,0.70,46.08 09/29/2008,52.68,27.05,13.52,45.22 09/30/2008,52.02,25.35,0.00,45.58 10/01/2008,50.93,11.34,0.04,46.00 10/02/2008,51.96,33.32,3.66,45.56 10/03/2008,52.31,53.24,0.00,45.42 10/04/2008,52.77,41.46,0.26,45.04 10/05/2008,50.79,-0.34,0.12,46.08 10/06/2008,51.44,8.79,11.17,45.88 10/07/2008,50.73,4.86,2.98,46.08 10/08/2008,51.72,38.55,4.99,45.44 10/09/2008,53.11,13.79,5.76,44.90 10/10/2008,50.91,-0.56,0.09,46.08 10/11/2008,50.51,10.78,0.00,46.06 10/12/2008,51.17,0.08,33.22,46.08 10/13/2008,50.93,15.57,2.56,45.90 10/14/2008,51.30,40.90,0.28,45.62 10/15/2008,52.73,11.37,36.12,44.86 10/16/2008,51.08,13.26,0.00,46.04 10/17/2008,50.38,9.76,0.00,46.08 10/18/2008,52.28,34.40,44.18,45.02 10/19/2008,52.16,31.92,3.52,45.54 10/20/2008,51.75,52.91,0.34,70.62 10/21/2008,52.04,29.04,4.60,75.36 10/22/2008,50.35,-0.46,0.63,58.86 10/23/2008,50.86,35.42,0.02,48.60 10/24/2008,49.72,-0.67,0.00,48.74 10/25/2008,51.14,41.41,17.99,61.72 10/26/2008,55.62,-0.54,50.31,43.32 10/27/2008,55.52,0.21,6.20,43.58 10/28/2008,53.06,28.21,0.24,44.66 10/29/2008,52.88,36.38,0.64,45.06 10/30/2008,52.93,22.53,3.39,45.14 10/31/2008,52.50,36.84,0.00,45.24 11/01/2008,52.35,38.34,0.10,45.32 11/02/2008,50.93,21.57,1.58,45.80 11/03/2008,53.21,10.07,8.05,44.84 11/04/2008,52.08,31.10,9.21,45.58 11/05/2008,51.79,3.64,16.51,45.70 11/06/2008,51.71,1.71,22.69,45.72

81
11/07/2008,51.23,4.43,16.58,45.80 11/08/2008,54.84,-0.65,12.64,43.62 11/09/2008,53.74,3.48,2.37,44.42 11/10/2008,52.55,31.34,0.00,44.86 11/11/2008,50.17,-0.24,0.00,45.54 11/12/2008,50.23,0.64,7.17,46.02 11/13/2008,51.26,-0.48,21.64,45.76 11/14/2008,51.59,2.73,48.53,45.26 11/15/2008,52.14,9.98,18.00,45.38 11/16/2008,50.47,3.40,3.12,46.08 11/17/2008,52.71,12.98,12.96,44.82 11/18/2008,54.02,6.77,13.28,43.54 11/19/2008,54.73,-0.51,12.83,43.90 11/20/2008,55.36,8.70,4.69,43.06 11/21/2008,52.76,26.80,1.02,43.80 11/22/2008,52.30,5.12,6.87,45.26 11/23/2008,50.30,1.01,0.00,46.06 11/24/2008,52.20,9.26,29.20,45.28 11/25/2008,50.97,20.42,0.66,44.58 11/26/2008,51.54,40.66,0.00,44.60 11/27/2008,53.21,0.91,30.60,44.48 11/28/2008,52.71,36.32,0.01,44.70 11/29/2008,50.49,6.71,0.00,46.42 11/30/2008,50.32,6.50,1.44,46.14 12/01/2008,52.39,39.58,7.74,44.06 12/02/2008,54.28,16.66,27.82,43.78 12/03/2008,55.45,20.55,3.08,42.82 12/04/2008,53.12,4.56,4.03,43.22 12/05/2008,53.21,3.69,7.57,44.04 12/06/2008,55.62,14.35,1.11,42.86 12/07/2008,50.67,0.00,3.07,43.86 12/08/2008,49.84,-0.14,0.10,45.76 12/09/2008,51.78,38.55,0.41,44.00 12/10/2008,52.53,2.36,16.53,45.22 12/11/2008,51.52,7.50,8.21,43.58 12/12/2008,50.88,3.27,19.00,43.33 12/13/2008,49.30,0.17,0.09,47.54 12/14/2008,53.69,0.11,10.38,43.80 12/15/2008,55.60,19.84,1.95,34.64 12/16/2008,50.20,1.03,0.01,30.21 12/17/2008,49.70,9.55,0.05,40.95 12/18/2008,50.47,28.41,0.00,33.75 12/19/2008,50.09,26.27,0.00,44.20 12/20/2008,51.65,-0.01,54.77,41.86 12/21/2008,55.97,17.39,6.37,34.49 12/22/2008,53.13,15.40,1.01,32.47

82
12/23/2008,50.38,0.00,1.22,44.48 12/24/2008,49.68,4.43,0.00,41.34 12/25/2008,51.66,22.97,25.60,38.07 12/26/2008,50.33,0.35,1.10,46.06 12/27/2008,50.20,2.03,28.85,46.00 12/28/2008,50.15,15.90,0.12,17.34

83
APPENDIX F: CALIBRATED DAILY DATA

84
This is the calibrated daily data. Columns are as follows: Data, start average battery bank voltage of that day, end average battery bank voltage of that day, voltage difference, solar panel Ah, wind turbine Ah, inverter Ah, excess Ah (solar Ah + wind Ah – inverter Ah) 08/08/2007,48.65,48.45,-0.20,0.00,33.18,41.60,-8.42 08/09/2007,48.45,48.75,0.30,0.00,41.99,40.34,1.65 08/10/2007,48.70,48.55,-0.15,0.00,34.88,43.00,-8.12 08/11/2007,48.55,48.30,-0.25,0.00,24.64,41.04,-16.40 08/12/2007,48.20,47.90,-0.30,0.00,31.46,40.40,-8.94 08/13/2007,47.90,48.15,0.25,7.75,48.30,41.04,15.01 08/14/2007,48.15,47.75,-0.40,16.50,19.99,40.46,-3.97 08/15/2007,47.75,48.10,0.35,38.06,14.62,40.98,11.70 08/16/2007,48.10,48.25,0.15,48.19,18.91,40.46,26.64 08/17/2007,48.25,48.10,-0.15,35.79,16.89,40.38,12.30 08/18/2007,48.10,47.55,-0.55,0.09,26.30,41.28,-14.89 08/19/2007,47.55,47.35,-0.20,-0.55,19.22,42.24,-23.57 08/20/2007,47.30,47.00,-0.30,0.56,24.32,42.24,-17.36 08/21/2007,47.00,46.80,-0.20,12.57,19.77,42.22,-9.88 08/22/2007,46.80,47.15,0.35,43.27,16.40,41.60,18.07 08/23/2007,47.15,46.65,-0.50,9.11,24.47,42.48,-8.90 08/24/2007,46.65,46.90,0.25,38.09,13.05,42.24,8.90 08/25/2007,46.85,46.95,0.10,43.29,11.72,42.08,12.93 08/26/2007,46.95,48.65,1.70,31.19,92.37,41.14,82.42 08/27/2007,48.90,47.65,-1.25,3.41,29.64,41.44,-8.39 08/28/2007,47.65,47.20,-0.45,3.33,29.69,42.24,-9.22 08/29/2007,47.20,47.45,0.25,49.09,14.71,41.66,22.14 08/30/2007,47.45,47.60,0.15,49.49,11.29,41.46,19.32 08/31/2007,47.60,47.70,0.10,46.11,18.27,41.38,23.00 09/01/2007,47.65,49.50,1.85,46.67,68.04,40.62,74.09 09/02/2007,49.30,48.70,-0.60,46.92,26.46,39.76,33.62 09/03/2007,48.70,48.95,0.25,39.06,25.27,39.74,24.59 09/04/2007,48.95,48.90,-0.05,47.88,13.65,46.42,15.11 09/05/2007,48.90,49.50,0.60,45.22,56.36,42.50,59.08 09/06/2007,49.45,49.20,-0.25,13.02,18.58,39.86,-8.26 09/07/2007,49.20,49.80,0.60,49.99,69.03,39.38,79.64 09/08/2007,49.80,49.40,-0.40,8.11,20.44,40.22,-11.67 09/09/2007,49.40,49.65,0.25,50.08,17.68,39.54,28.22 09/10/2007,49.65,50.00,0.35,51.50,21.34,39.06,33.78 09/11/2007,49.90,50.70,0.80,7.82,76.61,37.16,47.27 09/12/2007,50.65,51.65,1.00,39.77,34.27,36.70,37.34 09/13/2007,51.60,56.55,4.95,8.84,40.48,36.14,13.18 09/14/2007,52.65,51.00,-1.65,-0.10,35.10,32.42,2.58

85
09/15/2007,50.95,51.30,0.35,25.15,23.01,35.48,12.68 09/16/2007,51.20,51.20,0.00,23.81,17.55,37.36,4.00 09/17/2007,51.35,52.00,0.65,3.55,28.24,38.12,-6.33 09/18/2007,52.05,51.40,-0.65,4.57,26.58,38.40,-7.25 09/19/2007,51.50,50.80,-0.70,18.09,28.65,37.72,9.02 09/20/2007,50.80,50.90,0.10,-0.46,30.72,38.30,-8.04 09/21/2007,50.75,51.15,0.40,10.88,42.44,35.66,17.66 09/22/2007,51.15,51.10,-0.05,24.59,22.74,36.38,10.95 09/23/2007,51.10,60.15,9.05,5.18,38.01,31.58,11.61 09/24/2007,54.95,51.10,-3.85,2.60,28.82,36.28,-4.86 09/25/2007,51.15,50.90,-0.25,0.47,33.02,37.36,-3.87 09/26/2007,50.85,51.15,0.30,17.04,29.46,36.38,10.12 09/27/2007,51.15,51.30,0.15,29.39,19.67,35.44,13.62 09/28/2007,51.30,52.30,1.00,26.06,18.10,37.32,6.84 09/29/2007,52.50,57.85,5.35,0.11,30.85,29.44,1.52 09/30/2007,55.95,51.10,-4.85,3.81,21.38,35.52,-10.33 10/01/2007,51.05,51.25,0.20,26.60,17.18,44.28,-0.50 10/02/2007,51.40,51.40,0.00,6.88,46.33,35.36,17.85 10/03/2007,51.40,51.65,0.25,22.38,19.39,35.54,6.23 10/04/2007,52.05,51.10,-0.95,21.66,17.29,40.64,-1.69 10/05/2007,51.15,50.70,-0.45,0.17,26.75,40.26,-13.34 10/06/2007,50.70,51.50,0.80,30.35,48.32,40.68,37.99 10/07/2007,51.50,50.75,-0.75,-0.08,24.54,40.08,-15.62 10/08/2007,50.75,51.25,0.50,4.23,34.77,38.70,0.30 10/09/2007,51.45,57.20,5.75,-0.54,85.67,28.92,56.21 10/10/2007,62.15,51.40,-10.75,4.04,15.71,34.68,-14.93 10/11/2007,51.40,50.80,-0.60,4.85,27.87,40.36,-7.64 10/12/2007,50.75,50.35,-0.40,7.44,23.00,40.30,-9.86 10/13/2007,50.35,50.35,0.00,21.11,16.77,39.28,-1.40 10/14/2007,50.35,50.10,-0.25,3.32,25.79,40.08,-10.97 10/15/2007,50.15,49.90,-0.25,-0.74,18.98,40.24,-22.00 10/16/2007,49.90,49.70,-0.20,-0.64,30.33,40.32,-10.63 10/17/2007,49.70,49.60,-0.10,1.05,25.48,40.32,-13.79 10/18/2007,49.60,52.05,2.45,-0.69,50.85,43.66,6.50 10/19/2007,52.05,51.20,-0.85,1.65,204.23,44.14,161.74 10/20/2007,51.20,50.70,-0.50,14.29,19.50,38.40,-4.61 10/21/2007,50.70,50.25,-0.45,-0.10,23.66,39.00,-15.44 10/22/2007,50.25,50.90,0.65,46.59,37.68,38.70,45.57 10/23/2007,50.85,51.95,1.10,19.74,58.80,37.68,40.86 10/24/2007,51.80,51.20,-0.60,47.36,13.58,37.50,23.44 10/25/2007,51.20,51.45,0.25,9.68,44.80,35.24,19.24 10/26/2007,51.45,51.85,0.40,27.74,14.71,36.74,5.71 10/27/2007,51.90,51.10,-0.80,16.16,21.32,36.44,1.04 10/28/2007,51.10,51.50,0.40,23.84,20.80,35.68,8.96 10/29/2007,51.45,51.05,-0.40,25.81,13.00,37.96,0.84 10/30/2007,51.05,54.15,3.10,33.44,21.91,38.26,17.09
86
10/31/2007,57.60,51.55,-6.05,-0.46,37.19,26.06,10.67 11/01/2007,51.50,54.20,2.70,27.32,23.61,33.30,17.63 11/02/2007,53.70,51.60,-2.10,1.92,27.09,32.10,-3.09 11/03/2007,51.60,51.25,-0.35,27.74,15.24,37.36,5.61 11/04/2007,51.20,51.00,-0.20,26.86,16.04,37.80,5.10 11/05/2007,51.50,57.25,5.75,-0.20,49.01,26.58,22.23 11/06/2007,56.80,51.35,-5.45,-0.14,25.60,30.80,-5.34 11/07/2007,51.35,50.95,-0.40,4.18,28.85,37.28,-4.26 11/08/2007,50.95,50.65,-0.30,15.15,17.58,38.06,-5.33 11/09/2007,50.65,50.70,0.05,5.66,28.10,38.14,-4.38 11/10/2007,50.65,51.30,0.65,6.28,48.39,37.46,17.21 11/11/2007,51.30,52.65,1.35,12.81,17.88,38.22,-7.53 11/12/2007,52.90,51.05,-1.85,26.11,18.85,37.86,7.10 11/13/2007,51.35,53.40,2.05,-0.35,67.24,39.40,27.49 11/14/2007,57.00,57.40,0.40,-0.69,53.76,24.56,28.51 11/15/2007,56.15,51.40,-4.75,1.86,27.64,35.30,-5.80 11/16/2007,51.40,51.25,-0.15,30.45,15.83,37.50,8.78 11/17/2007,51.25,50.75,-0.50,1.06,16.96,38.40,-20.39 11/18/2007,50.75,52.10,1.35,0.20,63.08,36.80,26.48 11/19/2007,52.00,50.90,-1.10,8.91,17.90,39.96,-13.15 11/20/2007,50.90,52.65,1.75,4.68,35.96,50.58,-9.94 11/21/2007,51.80,50.50,-1.30,3.30,22.37,51.80,-26.13 11/22/2007,50.50,50.20,-0.30,21.20,13.54,38.80,-4.06 11/23/2007,50.20,50.55,0.35,13.81,24.24,37.96,0.09 11/24/2007,50.55,51.10,0.55,14.05,24.03,38.30,-0.22 11/25/2007,51.15,51.95,0.80,11.17,37.30,37.38,11.09 11/26/2007,52.20,57.30,5.10,20.10,32.60,35.24,17.45 11/27/2007,61.85,51.00,-10.85,12.50,16.18,35.16,-6.48 11/28/2007,51.05,56.75,5.70,5.96,35.12,32.90,8.18 11/29/2007,55.35,60.20,4.85,11.15,18.27,33.16,-3.74 11/30/2007,55.25,50.90,-4.35,13.57,11.11,32.72,-8.04 12/01/2007,50.85,50.40,-0.45,0.00,18.92,38.68,-19.76 12/02/2007,50.40,51.75,1.35,5.99,38.87,34.82,10.04 12/03/2007,51.70,50.15,-1.55,4.87,19.35,39.86,-15.65 12/04/2007,50.15,50.45,0.30,-0.03,20.83,38.84,-18.04 12/05/2007,50.75,50.90,0.15,49.18,12.66,37.66,24.18 12/06/2007,50.90,49.85,-1.05,-0.15,26.04,37.70,-11.81 12/07/2007,49.80,50.70,0.90,37.24,13.53,32.08,18.69 12/08/2007,50.70,49.85,-0.85,19.44,3.43,25.76,-2.89 12/09/2007,49.80,49.40,-0.40,6.91,19.70,34.72,-8.11 12/10/2007,49.40,50.70,1.30,32.94,17.51,31.68,18.77 12/11/2007,50.70,50.70,0.00,40.77,11.64,37.66,14.75 12/12/2007,50.70,53.00,2.30,40.89,32.07,36.26,36.70 12/13/2007,52.45,52.20,-0.25,9.52,27.17,34.38,2.31 12/14/2007,52.10,50.85,-1.25,23.37,8.33,30.58,1.12 12/15/2007,50.85,50.35,-0.50,4.17,22.80,36.38,-9.41
87
12/16/2007,50.35,49.80,-0.55,3.50,23.84,38.10,-10.76 12/17/2007,49.75,50.20,0.45,32.95,13.34,37.78,8.51 12/18/2007,50.15,50.10,-0.05,30.61,10.52,37.50,3.63 12/19/2007,50.05,50.05,0.00,3.57,22.79,40.00,-13.64 12/20/2007,50.70,49.55,-1.15,15.66,15.41,39.06,-7.99 12/21/2007,49.55,49.45,-0.10,1.05,24.99,40.32,-14.28 12/22/2007,49.45,51.40,1.95,24.23,111.53,38.06,97.70 12/23/2007,51.55,55.05,3.50,-0.41,61.96,29.74,31.81 12/24/2007,54.95,51.60,-3.35,20.26,15.86,35.30,0.82 12/25/2007,51.45,50.80,-0.65,3.49,27.11,38.20,-7.60 12/26/2007,50.80,50.40,-0.40,1.92,26.99,38.72,-9.81 12/27/2007,50.40,50.00,-0.40,2.62,27.13,39.42,-9.67 12/28/2007,50.00,49.45,-0.55,2.51,29.30,39.28,-7.47 12/29/2007,49.45,49.40,-0.05,6.38,25.23,39.44,-7.83 12/30/2007,49.50,50.05,0.55,25.30,31.49,37.82,18.97 12/31/2007,50.00,53.25,3.25,21.22,59.97,38.56,42.63 01/01/2008,53.25,51.60,-1.65,21.96,58.59,33.26,47.29 01/02/2008,51.50,55.20,3.70,21.54,19.50,31.56,9.48 01/03/2008,54.60,51.15,-3.45,8.94,23.69,32.78,-0.15 01/04/2008,51.10,51.15,0.05,13.55,26.51,35.84,4.22 01/05/2008,51.10,53.40,2.30,16.98,36.79,35.66,18.11 01/06/2008,52.70,51.05,-1.65,19.29,15.13,37.84,-3.42 01/07/2008,51.00,50.85,-0.15,20.70,20.40,38.10,3.00 01/08/2008,50.80,51.25,0.45,27.48,23.89,37.70,13.67 01/09/2008,51.45,50.45,-1.00,8.19,22.32,38.78,-8.27 01/10/2008,50.45,51.15,0.70,-0.05,33.73,39.60,-5.92 01/11/2008,50.90,49.90,-1.00,6.10,20.51,40.10,-13.49 01/12/2008,49.90,49.65,-0.25,28.79,24.64,58.44,-5.01 01/13/2008,49.65,51.25,1.60,20.82,29.15,59.44,-9.47 01/14/2008,51.15,50.55,-0.60,46.26,28.84,43.86,31.24 01/15/2008,50.55,53.50,2.95,30.64,31.06,26.72,34.98 01/16/2008,53.50,51.20,-2.30,1.24,52.67,36.60,17.31 01/17/2008,51.20,51.10,-0.10,24.49,13.97,37.14,1.31 01/18/2008,51.60,51.25,-0.35,19.22,19.41,29.48,9.15 01/19/2008,51.20,50.30,-0.90,13.44,3.43,19.92,-3.05 01/20/2008,50.30,50.05,-0.25,15.83,2.39,19.20,-0.99 01/21/2008,50.05,50.00,-0.05,14.30,24.81,43.38,-4.27 01/22/2008,50.00,50.65,0.65,28.95,11.49,30.50,9.94 01/23/2008,50.60,50.10,-0.50,21.45,6.14,21.76,5.83 01/24/2008,50.05,50.10,0.05,20.05,2.40,23.37,-0.92 01/25/2008,50.15,50.10,-0.05,36.77,19.54,55.00,1.31 01/26/2008,50.05,49.75,-0.30,23.51,27.00,59.08,-8.57 01/27/2008,49.70,49.90,0.20,34.76,21.87,59.88,-3.25 01/28/2008,49.95,56.20,6.25,10.00,72.28,57.24,25.04 01/29/2008,56.70,61.70,5.00,-0.50,57.17,25.86,30.81 01/30/2008,58.50,50.80,-7.70,10.39,8.49,26.32,-7.44

88
01/31/2008,50.80,50.70,-0.10,20.80,15.53,38.56,-2.23 02/01/2008,50.70,50.55,-0.15,2.14,32.21,49.38,-15.03 02/02/2008,50.55,49.50,-1.05,5.57,51.97,85.66,-28.12 02/03/2008,49.50,49.20,-0.30,14.65,44.36,88.00,-28.99 02/04/2008,49.20,48.80,-0.40,6.80,53.10,84.80,-24.90 02/05/2008,48.80,48.60,-0.20,45.62,25.07,83.38,-12.69 02/06/2008,48.60,48.40,-0.20,59.38,18.39,83.02,-5.25 02/07/2008,48.40,47.80,-0.60,8.85,59.97,88.98,-20.16 02/08/2008,47.80,47.30,-0.50,13.63,46.78,94.48,-34.07 02/09/2008,47.30,53.80,6.50,42.93,195.75,79.20,159.48 02/10/2008,55.25,49.85,-5.40,38.13,49.99,43.36,44.75 02/11/2008,49.85,49.45,-0.40,29.80,20.15,47.78,2.17 02/12/2008,49.45,49.25,-0.20,29.03,29.03,57.42,0.64 02/13/2008,49.25,48.75,-0.50,24.98,31.55,84.18,-27.66 02/14/2008,48.75,48.80,0.05,54.50,29.74,84.94,-0.71 02/15/2008,48.75,47.80,-0.95,5.00,41.36,76.86,-30.50 02/16/2008,47.80,48.30,0.50,38.80,50.11,91.66,-2.75 02/17/2008,48.45,51.75,3.30,15.41,110.27,89.36,36.32 02/18/2008,51.95,50.45,-1.50,31.57,120.98,65.88,86.67 02/19/2008,50.25,50.15,-0.10,38.35,29.75,48.68,19.42 02/20/2008,50.10,49.45,-0.65,32.77,6.89,34.82,4.84 02/21/2008,49.45,49.65,0.20,42.56,14.66,43.82,13.39 02/22/2008,49.65,49.65,0.00,58.15,22.85,58.56,22.44 02/23/2008,49.60,49.45,-0.15,57.84,23.89,73.52,8.21 02/24/2008,49.40,48.95,-0.45,19.72,41.03,77.48,-16.73 02/25/2008,48.95,49.05,0.10,45.40,32.42,77.24,0.58 02/26/2008,49.05,50.10,1.05,25.83,78.76,57.16,47.43 02/27/2008,50.10,50.15,0.05,57.83,23.15,53.00,27.98 02/28/2008,50.15,49.55,-0.60,13.58,23.32,56.42,-19.52 02/29/2008,49.55,50.80,1.25,3.54,82.71,39.66,46.59 03/01/2008,50.80,51.05,0.25,44.84,14.81,38.06,21.59 03/02/2008,50.95,55.95,5.00,5.80,46.14,35.86,16.08 03/03/2008,54.40,51.05,-3.35,33.96,25.32,34.12,25.16 03/04/2008,51.05,50.90,-0.15,10.70,25.35,34.68,1.37 03/05/2008,50.90,51.15,0.25,23.11,27.29,34.16,16.24 03/06/2008,51.15,50.90,-0.25,27.57,12.87,37.48,2.96 03/07/2008,50.85,50.50,-0.35,21.90,7.59,30.42,-0.93 03/08/2008,50.50,50.50,0.00,10.13,18.19,34.56,-6.24 03/09/2008,50.50,50.75,0.25,32.48,12.40,33.98,10.90 03/10/2008,50.70,51.15,0.45,22.56,19.25,37.02,4.79 03/11/2008,51.15,51.20,0.05,25.07,20.93,36.72,9.28 03/12/2008,51.15,50.85,-0.30,6.80,30.14,37.64,-0.70 03/13/2008,50.85,51.70,0.85,25.24,39.78,35.46,29.56 03/14/2008,51.65,51.95,0.30,8.46,38.90,38.10,9.26 03/15/2008,51.80,51.25,-0.55,29.15,8.92,36.04,2.03 03/16/2008,51.25,51.25,0.00,32.39,14.10,36.52,9.97

89
03/17/2008,51.20,50.90,-0.30,1.51,31.42,51.28,-18.35 03/18/2008,50.90,50.65,-0.25,9.01,30.41,56.02,-16.60 03/19/2008,50.65,51.20,0.55,50.11,27.45,55.22,22.34 03/20/2008,51.20,50.75,-0.45,42.04,15.59,55.66,1.97 03/21/2008,50.75,50.45,-0.30,15.21,25.90,57.70,-16.59 03/22/2008,50.45,51.10,0.65,24.40,21.76,58.78,-12.62 03/23/2008,50.85,50.60,-0.25,45.83,23.00,58.48,10.35 03/24/2008,50.60,52.80,2.20,16.44,65.04,42.74,38.74 03/25/2008,52.65,51.70,-0.95,2.24,36.21,32.42,6.03 03/26/2008,51.65,51.45,-0.20,17.04,21.51,36.36,2.19 03/27/2008,51.45,51.25,-0.20,29.88,16.10,37.06,8.92 03/28/2008,51.25,51.55,0.30,33.72,14.14,36.72,11.14 03/29/2008,51.40,61.95,10.55,3.87,35.16,29.68,9.35 03/30/2008,58.25,51.55,-6.70,15.87,20.23,34.38,1.71 03/31/2008,51.55,54.15,2.60,9.30,18.12,37.16,-9.74 04/01/2008,53.55,51.20,-2.35,19.84,8.70,36.52,-7.98 04/02/2008,51.20,51.05,-0.15,12.33,19.26,37.20,-5.61 04/03/2008,51.05,51.50,0.45,41.33,16.57,36.72,21.18 04/04/2008,51.45,51.55,0.10,25.43,18.78,35.94,8.27 04/05/2008,51.50,51.60,0.10,35.97,9.61,36.74,8.84 04/06/2008,51.60,50.95,-0.65,1.86,20.67,38.16,-15.64 04/07/2008,50.95,50.95,0.00,12.41,28.36,40.98,-0.21 04/08/2008,50.95,50.70,-0.25,12.48,18.66,38.04,-6.91 04/09/2008,50.70,50.65,-0.05,28.80,19.68,51.32,-2.84 04/10/2008,50.65,54.45,3.80,4.33,47.54,51.94,-0.07 04/11/2008,54.55,54.50,-0.05,1.82,39.51,34.20,7.13 04/12/2008,55.85,51.55,-4.30,10.16,15.03,36.40,-11.21 04/13/2008,51.55,51.40,-0.15,35.77,12.89,36.04,12.62 04/14/2008,51.40,54.90,3.50,22.64,31.76,34.66,19.74 04/15/2008,56.35,59.20,2.85,2.50,41.31,28.64,15.16 04/16/2008,56.90,51.70,-5.20,15.02,25.65,35.52,5.15 04/17/2008,51.70,51.40,-0.30,27.00,12.46,37.74,1.72 04/18/2008,51.40,51.10,-0.30,18.03,15.70,38.00,-4.27 04/19/2008,51.10,51.35,0.25,37.23,13.05,37.60,12.68 04/20/2008,51.35,50.95,-0.40,13.35,18.51,40.72,-8.86 04/21/2008,50.95,52.20,1.25,28.51,56.80,40.66,44.65 04/22/2008,52.25,51.55,-0.70,23.02,17.59,40.80,-0.19 04/23/2008,51.55,52.15,0.60,37.89,14.11,40.92,11.08 04/24/2008,52.25,52.15,-0.10,-0.50,46.90,39.12,7.28 04/25/2008,52.00,57.20,5.20,-0.25,36.38,37.30,-1.17 04/26/2008,59.10,53.25,-5.85,0.30,32.49,31.54,1.25 04/27/2008,52.55,51.15,-1.40,31.06,11.81,40.60,2.27 04/28/2008,51.15,51.05,-0.10,35.65,15.05,41.60,9.10 04/29/2008,51.05,51.35,0.30,40.63,14.66,41.42,13.87 04/30/2008,51.35,51.15,-0.20,31.65,23.98,71.08,-15.45 05/01/2008,51.10,52.05,0.95,19.23,32.86,71.44,-19.35

90
05/02/2008,52.00,52.20,0.20,-0.54,42.43,56.82,-14.93 05/03/2008,52.40,51.80,-0.60,7.01,43.44,35.36,15.09 05/04/2008,51.75,51.85,0.10,30.35,20.55,39.32,11.58 05/05/2008,51.85,51.40,-0.45,36.88,11.58,40.52,7.94 05/06/2008,51.40,52.35,0.95,26.70,23.45,40.16,9.99 05/07/2008,52.20,51.55,-0.65,25.20,20.26,48.36,-2.90 05/08/2008,51.50,51.20,-0.30,30.49,12.03,40.82,1.70 05/09/2008,51.20,51.15,-0.05,34.21,11.23,40.88,4.56 05/10/2008,51.15,51.25,0.10,3.42,25.21,42.24,-13.61 05/11/2008,51.15,51.55,0.40,36.42,16.60,40.78,12.24 05/12/2008,51.50,53.75,2.25,12.19,31.09,47.86,-4.58 05/13/2008,53.80,51.50,-2.30,2.78,31.77,39.76,-5.21 05/14/2008,51.50,51.35,-0.15,31.60,13.90,40.56,4.94 05/15/2008,51.35,51.50,0.15,20.66,22.68,40.42,2.92 05/16/2008,51.50,51.95,0.45,20.52,29.34,38.78,11.09 05/17/2008,51.95,51.85,-0.10,11.68,43.03,37.22,17.49 05/18/2008,51.85,51.45,-0.40,31.23,14.78,40.46,5.55 05/19/2008,51.40,51.15,-0.25,3.51,26.64,42.24,-12.09 05/20/2008,51.45,51.80,0.35,19.36,35.71,39.62,15.45 05/21/2008,51.80,51.45,-0.35,35.37,13.71,40.74,8.34 05/22/2008,51.45,51.05,-0.40,33.35,22.34,72.22,-16.53 05/23/2008,51.05,50.95,-0.10,35.20,27.98,81.94,-18.76 05/24/2008,50.90,53.20,2.30,29.67,52.42,80.44,1.65 05/25/2008,53.20,51.20,-2.00,15.90,55.86,71.58,0.18 05/26/2008,51.15,51.10,-0.05,13.50,51.19,66.74,-2.06 05/27/2008,51.10,51.15,0.05,33.50,13.02,41.24,5.28 05/28/2008,51.10,51.15,0.05,29.15,16.09,41.28,3.96 05/29/2008,51.10,50.70,-0.40,0.92,22.13,42.12,-19.07 05/30/2008,50.70,50.65,-0.05,17.05,19.26,41.82,-5.51 05/31/2008,50.65,50.85,0.20,36.67,17.76,41.38,13.05 06/01/2008,50.80,50.95,0.15,33.67,17.63,41.24,10.06 06/02/2008,50.95,50.50,-0.45,7.08,23.80,42.18,-11.30 06/03/2008,50.45,50.25,-0.20,5.95,25.49,42.24,-10.80 06/04/2008,50.25,50.15,-0.10,14.77,24.09,42.16,-3.30 06/05/2008,50.20,51.10,0.90,7.98,22.10,42.16,-12.08 06/06/2008,51.20,51.50,0.30,14.74,114.77,41.16,88.35 06/07/2008,51.55,51.25,-0.30,28.21,26.92,41.06,14.07 06/08/2008,51.25,51.00,-0.25,26.47,18.12,41.50,3.09 06/09/2008,51.00,51.30,0.30,26.90,36.45,41.22,22.13 06/10/2008,51.25,51.05,-0.20,26.77,12.43,41.42,-2.22 06/11/2008,50.95,52.40,1.45,-0.38,21.67,41.74,-20.45 06/12/2008,53.15,52.20,-0.95,34.17,36.10,35.78,34.49 06/13/2008,52.15,52.90,0.75,2.74,10.37,0.00,13.11 06/14/2008,53.00,52.55,-0.45,5.53,1.27,0.00,6.80 06/15/2008,52.55,54.60,2.05,2.57,2.83,0.00,5.40 06/16/2008,54.25,52.55,-1.70,0.38,2.41,0.00,2.79

91
06/17/2008,52.50,52.40,-0.10,6.46,1.66,0.00,8.12 06/18/2008,52.40,52.35,-0.05,5.83,0.15,0.00,5.98 06/19/2008,52.35,53.05,0.70,3.36,0.11,0.00,3.47 06/20/2008,52.95,52.35,-0.60,1.95,1.29,0.00,3.24 06/21/2008,52.35,52.35,0.00,8.87,3.55,0.00,12.42 06/22/2008,52.30,52.25,-0.05,7.75,0.23,0.00,7.98 06/23/2008,52.20,52.30,0.10,6.21,0.00,0.00,6.21 06/24/2008,52.25,52.45,0.20,4.27,0.84,0.00,5.11 06/25/2008,52.45,52.35,-0.10,2.74,2.70,0.00,5.44 06/26/2008,52.30,52.15,-0.15,9.02,0.00,0.00,9.02 06/27/2008,52.15,57.10,4.95,6.05,1.83,0.00,7.88 06/28/2008,55.15,60.65,5.50,8.63,0.63,0.00,9.26 06/29/2008,57.10,52.40,-4.70,-0.66,3.64,0.00,2.98 06/30/2008,52.35,52.20,-0.15,7.27,0.14,0.00,7.41 07/01/2008,52.15,51.65,-0.50,3.48,20.48,21.56,2.40 07/02/2008,51.65,51.65,0.00,19.22,26.45,45.04,0.63 07/03/2008,51.65,51.40,-0.25,32.50,13.26,45.48,0.28 07/04/2008,51.40,51.35,-0.05,26.51,17.03,46.50,-2.96 07/05/2008,51.30,54.95,3.65,17.27,75.21,46.48,46.01 07/06/2008,55.70,51.75,-3.95,27.50,19.73,48.20,-0.97 07/07/2008,51.75,51.35,-0.40,18.72,25.95,57.98,-13.31 07/08/2008,51.30,51.90,0.60,34.48,71.93,66.96,39.45 07/09/2008,51.85,51.50,-0.35,31.67,31.97,68.52,-4.88 07/10/2008,51.45,51.10,-0.35,9.78,34.89,62.36,-17.69 07/11/2008,51.10,56.55,5.45,21.12,101.06,64.62,57.56 07/12/2008,56.65,55.60,-1.05,4.98,59.24,63.94,0.28 07/13/2008,55.95,51.70,-4.25,0.57,55.16,64.94,-9.21 07/14/2008,51.70,51.60,-0.10,34.64,29.50,70.36,-6.22 07/15/2008,51.55,51.20,-0.35,34.17,30.15,86.18,-21.86 07/16/2008,51.20,50.90,-0.30,12.01,40.25,75.02,-22.76 07/17/2008,50.90,50.55,-0.35,15.95,45.27,82.88,-21.66 07/18/2008,50.55,50.30,-0.25,35.37,35.62,86.90,-15.91 07/19/2008,50.30,49.85,-0.45,8.29,45.33,78.24,-24.62 07/20/2008,49.85,49.50,-0.35,21.94,33.40,86.38,-31.04 07/21/2008,49.50,49.20,-0.30,38.92,32.42,88.06,-16.73 07/22/2008,49.20,48.90,-0.30,40.21,34.50,89.92,-15.21 07/23/2008,48.90,49.05,0.15,35.62,31.25,58.18,8.69 07/24/2008,49.05,48.70,-0.35,9.82,24.48,48.00,-13.70 07/25/2008,48.70,49.15,0.45,26.50,49.02,47.56,27.96 07/26/2008,49.15,49.05,-0.10,35.76,20.39,49.16,6.99 07/27/2008,49.05,48.80,-0.25,28.09,19.44,50.80,-3.27 07/28/2008,48.75,48.95,0.20,36.93,24.33,49.64,11.62 07/29/2008,48.95,49.20,0.25,41.19,38.18,50.06,29.31 07/30/2008,49.20,49.15,-0.05,39.34,22.59,49.62,12.31 07/31/2008,49.15,49.10,-0.05,28.36,26.77,49.68,5.45 08/01/2008,49.05,49.20,0.15,38.32,29.05,49.12,18.25
92
08/02/2008,49.20,49.20,0.00,34.57,17.49,47.68,4.38 08/03/2008,49.20,48.80,-0.40,7.60,29.99,47.90,-10.31 08/04/2008,48.80,48.70,-0.10,33.55,21.98,50.10,5.43 08/05/2008,48.70,48.95,0.25,39.71,27.11,49.78,17.04 08/06/2008,48.95,49.20,0.25,42.28,36.23,49.20,29.31 08/07/2008,49.20,49.15,-0.05,43.32,21.08,49.20,15.20 08/08/2008,49.10,48.65,-0.45,19.49,26.39,58.16,-12.28 08/09/2008,48.65,48.55,-0.10,44.92,23.19,67.46,0.65 08/10/2008,48.55,48.40,-0.15,41.71,23.88,65.50,0.09 08/11/2008,48.40,48.25,-0.15,21.32,34.02,62.20,-6.86 08/12/2008,48.30,48.05,-0.25,23.99,25.81,63.14,-13.34 08/13/2008,48.05,47.85,-0.20,31.50,28.04,65.70,-6.16 08/14/2008,47.80,47.55,-0.25,25.79,29.78,65.78,-10.21 08/15/2008,47.55,47.35,-0.20,39.75,24.28,67.02,-2.99 08/16/2008,47.35,47.40,0.05,41.06,26.01,68.16,-1.09 08/17/2008,47.40,47.50,0.10,47.72,31.51,68.36,10.87 08/18/2008,47.50,47.25,-0.25,42.69,15.94,68.82,-10.19 08/19/2008,47.25,47.20,-0.05,47.19,23.95,67.90,3.24 08/20/2008,47.20,47.75,0.55,45.04,66.07,57.54,53.57 08/21/2008,47.80,48.55,0.75,40.33,103.23,77.12,66.44 08/22/2008,48.55,48.95,0.40,10.72,87.16,74.96,22.92 08/23/2008,49.10,48.90,-0.20,32.69,55.91,47.32,41.29 08/24/2008,48.90,48.90,0.00,51.40,13.42,47.50,17.32 08/25/2008,48.90,49.00,0.10,50.48,13.37,47.38,16.47 08/26/2008,49.00,49.70,0.70,47.46,91.76,47.06,92.16 08/27/2008,49.75,49.25,-0.50,7.30,27.59,47.74,-12.85 08/28/2008,49.25,49.40,0.15,42.84,21.05,47.16,16.73 08/29/2008,49.40,49.50,0.10,41.42,25.90,48.24,19.08 08/30/2008,49.50,49.95,0.45,42.43,58.96,46.72,54.67 08/31/2008,49.95,52.45,2.50,40.50,134.11,45.84,128.77 09/01/2008,52.70,54.00,1.30,32.76,148.56,46.44,134.88 09/02/2008,53.60,51.40,-2.20,4.59,34.75,45.62,-6.28 09/03/2008,51.55,51.20,-0.35,30.90,15.88,45.18,1.60 09/04/2008,51.20,51.15,-0.05,39.08,19.12,45.34,12.86 09/05/2008,51.15,50.90,-0.25,18.27,22.17,45.86,-5.42 09/06/2008,50.90,51.05,0.15,42.60,17.18,45.44,14.34 09/07/2008,51.00,51.30,0.30,19.57,33.73,45.36,7.94 09/08/2008,51.25,51.05,-0.20,32.93,16.29,45.36,3.86 09/09/2008,51.05,51.30,0.25,41.21,18.06,45.18,14.09 09/10/2008,51.30,55.20,3.90,0.69,52.50,44.54,8.65 09/11/2008,53.15,50.85,-2.30,1.62,25.75,45.68,-18.31 09/12/2008,50.85,51.05,0.20,37.19,18.58,45.64,10.13 09/13/2008,51.00,50.50,-0.50,1.43,32.19,46.08,-12.46 09/14/2008,50.50,50.30,-0.20,1.55,31.81,46.08,-12.72 09/15/2008,50.30,50.25,-0.05,19.98,20.66,45.94,-5.30 09/16/2008,50.25,50.95,0.70,51.23,28.11,45.50,33.84

93
09/17/2008,50.95,50.90,-0.05,50.28,17.20,45.60,21.88 09/18/2008,50.90,51.90,1.00,37.50,53.28,45.34,45.44 09/19/2008,52.10,51.20,-0.90,22.83,21.63,45.60,-1.14 09/20/2008,51.20,51.15,-0.05,41.16,20.44,45.52,16.08 09/21/2008,51.15,51.65,0.50,28.24,28.38,45.16,11.46 09/22/2008,51.50,55.90,4.40,-0.18,57.48,44.16,13.14 09/23/2008,58.45,51.85,-6.60,2.63,40.97,44.60,-1.00 09/24/2008,51.70,51.25,-0.45,27.72,18.99,45.10,1.61 09/25/2008,51.25,51.75,0.50,11.74,40.64,44.68,7.70 09/26/2008,51.75,51.45,-0.30,12.83,21.34,45.16,-10.99 09/27/2008,51.45,51.20,-0.25,22.02,17.97,45.24,-5.25 09/28/2008,51.20,50.80,-0.40,6.83,29.00,46.08,-10.25 09/29/2008,50.80,51.55,0.75,27.05,42.98,45.22,24.81 09/30/2008,51.50,50.85,-0.65,25.35,16.19,45.58,-4.04 10/01/2008,50.85,50.45,-0.40,11.34,23.50,46.00,-11.16 10/02/2008,50.45,51.25,0.80,33.32,28.99,45.56,16.75 10/03/2008,51.25,51.25,0.00,53.24,14.18,45.42,22.00 10/04/2008,51.25,51.35,0.10,41.46,17.96,45.04,14.38 10/05/2008,51.35,50.45,-0.90,-0.34,19.77,46.08,-26.65 10/06/2008,50.55,51.25,0.70,8.79,33.21,45.88,-3.88 10/07/2008,51.20,50.30,-0.90,4.86,23.90,46.08,-17.32 10/08/2008,50.30,51.75,1.45,38.55,27.43,45.44,20.54 10/09/2008,51.55,51.35,-0.20,13.79,31.45,44.90,0.34 10/10/2008,51.35,50.50,-0.85,-0.56,29.83,46.08,-16.81 10/11/2008,50.50,50.20,-0.30,10.78,27.39,46.06,-7.89 10/12/2008,50.20,51.75,1.55,0.08,51.61,46.08,5.61 10/13/2008,51.65,50.25,-1.40,15.57,20.04,45.90,-10.29 10/14/2008,50.20,50.70,0.50,40.90,18.52,45.62,13.80 10/15/2008,50.70,51.25,0.55,11.37,67.83,44.86,34.35 10/16/2008,51.25,50.55,-0.70,13.26,22.72,46.04,-10.06 10/17/2008,50.55,50.00,-0.55,9.76,27.68,46.08,-8.64 10/18/2008,49.95,52.35,2.40,34.40,69.74,45.02,59.12 10/19/2008,52.60,51.05,-1.55,31.92,18.86,45.54,5.24 10/20/2008,51.05,50.70,-0.35,52.91,24.10,70.62,6.39 10/21/2008,50.70,50.80,0.10,29.04,30.86,75.36,-15.46 10/22/2008,50.75,49.95,-0.80,-0.46,36.76,58.86,-22.56 10/23/2008,49.95,50.00,0.05,35.42,17.56,48.60,4.38 10/24/2008,49.95,49.55,-0.40,-0.67,42.31,48.74,-7.10 10/25/2008,49.55,51.75,2.20,41.41,45.49,61.72,25.18 10/26/2008,51.55,56.40,4.85,-0.54,110.93,43.32,67.07 10/27/2008,57.55,51.30,-6.25,0.21,44.98,43.58,1.61 10/28/2008,51.30,51.05,-0.25,28.21,20.92,44.66,4.47 10/29/2008,51.05,51.05,0.00,36.38,17.42,45.06,8.74 10/30/2008,51.00,51.05,0.05,22.53,22.56,45.14,-0.05 10/31/2008,51.05,51.00,-0.05,36.84,20.11,45.24,11.71 11/01/2008,50.95,51.15,0.20,38.34,19.83,45.32,12.85
94
11/02/2008,51.20,50.70,-0.50,21.57,16.83,45.80,-7.40 11/03/2008,50.70,51.30,0.60,10.07,42.22,44.84,7.45 11/04/2008,51.30,52.20,0.90,31.10,23.98,45.58,9.50 11/05/2008,52.10,50.95,-1.15,3.64,35.68,45.70,-6.38 11/06/2008,50.80,51.00,0.20,1.71,48.76,45.72,4.75 11/07/2008,50.95,54.20,3.25,4.43,41.82,45.80,0.45 11/08/2008,53.65,52.55,-1.10,-0.65,48.78,43.62,4.51 11/09/2008,53.05,50.85,-2.20,3.48,22.92,44.42,-18.02 11/10/2008,51.00,50.50,-0.50,31.34,11.13,44.86,-2.39 11/11/2008,50.50,50.05,-0.45,-0.24,40.15,45.54,-5.63 11/12/2008,50.05,52.10,2.05,0.64,36.61,46.02,-8.77 11/13/2008,52.25,49.95,-2.30,-0.48,39.03,45.76,-7.21 11/14/2008,49.95,53.00,3.05,2.73,74.02,45.26,31.49 11/15/2008,53.55,50.65,-2.90,9.98,41.43,45.38,6.03 11/16/2008,50.65,51.75,1.10,3.40,26.08,46.08,-16.60 11/17/2008,51.45,50.75,-0.70,12.98,33.75,44.82,1.91 11/18/2008,50.70,51.70,1.00,6.77,48.04,43.54,11.27 11/19/2008,51.50,52.90,1.40,-0.51,46.91,43.90,2.50 11/20/2008,54.30,51.05,-3.25,8.70,28.53,43.06,-5.83 11/21/2008,51.00,50.85,-0.15,26.80,18.52,43.80,1.52 11/22/2008,50.65,50.60,-0.05,5.12,26.79,45.26,-13.35 11/23/2008,50.55,49.90,-0.65,1.01,33.51,46.06,-11.54 11/24/2008,49.90,50.80,0.90,9.26,55.76,45.28,19.74 11/25/2008,50.80,49.80,-1.00,20.42,14.19,44.58,-9.97 11/26/2008,49.75,50.35,0.60,40.66,16.91,44.60,12.97 11/27/2008,50.30,51.25,0.95,0.91,59.16,44.48,15.59 11/28/2008,51.25,50.70,-0.55,36.32,17.29,44.70,8.91 11/29/2008,50.70,49.80,-0.90,6.71,25.55,46.42,-14.16 11/30/2008,49.80,50.00,0.20,6.50,28.48,46.14,-11.15 12/01/2008,49.95,50.70,0.75,39.58,24.57,44.06,20.09 12/02/2008,50.75,55.90,5.15,16.66,49.35,43.78,22.23 12/03/2008,60.30,50.95,-9.35,20.55,26.63,42.82,4.36 12/04/2008,50.90,50.50,-0.40,4.56,20.94,43.22,-17.72 12/05/2008,50.50,57.00,6.50,3.69,33.95,44.04,-6.40 12/06/2008,57.55,50.65,-6.90,14.35,25.90,42.86,-2.61 12/07/2008,50.60,50.00,-0.60,0.00,25.25,44.10,-18.85 12/08/2008,50.00,50.10,0.10,-0.14,32.75,45.76,-13.15 12/09/2008,49.70,50.40,0.70,38.55,15.31,44.00,9.86 12/10/2008,50.35,55.60,5.25,2.36,42.39,45.22,-0.47 12/11/2008,53.75,49.85,-3.90,7.50,21.53,44.14,-15.11 12/12/2008,49.80,49.40,-0.40,3.27,29.95,43.84,-10.62 12/13/2008,49.40,49.70,0.30,0.17,29.54,47.54,-17.83 12/14/2008,49.60,56.15,6.55,0.11,58.60,43.80,14.91 12/15/2008,57.60,50.50,-7.10,19.84,24.75,35.04,9.55 12/16/2008,50.45,49.75,-0.70,1.03,19.68,30.46,-9.75 12/17/2008,49.75,48.80,-0.95,9.55,18.94,41.10,-12.61

95
12/18/2008,48.80,48.90,0.10,28.41,6.36,34.00,0.77 12/19/2008,48.85,48.85,0.00,26.27,14.16,44.20,-3.77 12/20/2008,48.85,53.40,4.55,-0.01,88.58,42.34,46.23 12/21/2008,53.40,53.15,-0.25,17.39,31.87,34.82,14.44 12/22/2008,52.55,50.70,-1.85,15.40,9.90,33.02,-7.72 12/23/2008,53.00,49.95,-3.05,0.00,27.53,44.48,-16.95 12/24/2008,49.95,49.20,-0.75,4.43,24.25,43.70,-15.03 12/25/2008,49.20,50.85,1.65,22.97,39.92,39.02,23.87 12/26/2008,50.90,49.70,-1.20,0.35,21.75,46.06,-23.96 12/27/2008,49.60,49.85,0.25,2.03,44.39,46.00,0.42