Enterprise Management Network Architecture The Organization …€¦ · Enterprise Management...
69
Enterprise Management Network Architecture The Organization Layer Michel Roboam, Mark S. Fox and Katia Sycara CMU-RL-TR-90-22 Center for Integrated Manufacturing Decision Systems The Robotics Institute Carnegie Mellon University Pittsburgh, Pennsylvania 1521 3 November 1990 0 1990 Camegie Mellon University Michel Roboam is currently visiting scientist in the Center for Integrated Manufacturing Decision Systems and is sponsored by the AEROSPATIALE Company (France). This research has been supported, in part, by the Defense Advance Research Projects Agency under contract ttF30602-88-C-OOO1, and in part by grants from McDonnell Aircraft Company and Digital Equipment Corporation.
Transcript of Enterprise Management Network Architecture The Organization …€¦ · Enterprise Management...
Enterprise Management Network Architecture
The Organization Layer
Michel Roboam, Mark S. Fox and Katia Sycara
CMU-RL-TR-90-22
Center for Integrated Manufacturing Decision Systems The Robotics Institute
Carnegie Mellon University Pittsburgh, Pennsylvania 1521 3
November 1990
0 1990 Camegie Mellon University
Michel Roboam is currently visiting scientist in the Center for Integrated Manufacturing Decision Systems and is sponsored by the AEROSPATIALE Company (France).
This research has been supported, in part, by the Defense Advance Research Projects Agency under contract ttF30602-88-C-OOO1, and in part by grants from McDonnell Aircraft Company and Digital Equipment Corporation.


i
Table of Contents 1. Introduction
1.1 Enterprise Management Network Capabilities 1.2 Distributed Systems Definition
1.2.1 Distributed Systems Advantages 163 Decentralized System top-level description 1.223 Distributed System Dimensions
1.2.4 Dmtributed Systems capabilities 1.2.6 Diehtuted Systems Problems
2. Enterprise Management Network Node 3. Organization Layer
133.1 Parallel Distributed procesSing Systems 1.2.3.2 Distributed Problem Solving Systems DeRnition
3.1 Modeling tool selection 3.2 Enterprise Mode-
324.1 The GRAI Methodology 3.2.1.1 The GRAI method modeling tools
3.2.2 Using the GRAI Model 322.1 Em-nodes identification 3.222.2 EMN-nodes hierarchy and inter-actions identification
3.2.3 A generic organizational model 3.2.4 The MERISE data modeling tooh
3.2.4.1 Entities and entity types 323.4% Relationship 3.Z.4.3 The MERISE data models S23.4.4 Translation rules for MERISE-CDM into MERISE-LDM
S2.6 A generic data model supporting a manufacturing organization 3.2.6 Cohewnce tools
3.3 Schemata defined at the organizational level 3.4 Example 3.5 Organization Layer example
4. Conclusion Acknowledgement References
1 3 4 4 6 6 8 8 7 7 8 12 14 16 16 18 21 21 25 28 29 29 so 31 52 35 37 38 51 52 54 55 56

L

ii
List of Figures Figure 1-1: Network Layer Implementation Example Figure 1-2: Data Layer Implementation Example Figure 1.3: Information Layer Implementation Example Figure 2-1: Example of decentralized system Figure 2-2 The elements of an EMN-node Figure 2-3: Information exchanges overview Figure 2-4: Decentralized system example Figure 3-1: EMN architecture instantiation Figure 3-2: Methodologies typology Figure 35: Global conceptual model of the GRAI method Figure 34. Structure of a Decision Center Figure3-5: GRAIgrid Figure 3-6: GRAI grid example Figure 3-7: GRAI grid decomposition in GRAI nets Figure3.8: GRAInet Figure 3-9: GRAI net example Figure 3-10 EMN-nodes identification using the organizational model Figure 3-11: The organization tree Figure 3-12: Example of E"-nodes identification Figure 3-13: Identification of the information exchanges Figure 3-14: EMN-node hierarchy identification Figure 3-15: MSP type identification Figure 3-16 SPP type identification Figure 3-17: MUP type identification Figure 3-18: Example of EMN-node links identification Figure 3-19: Organizational model: decisional point of view Figure 3-u). The entity content Figure 3-21: The relationship content Figure 3-22: The entityhlationsbip model Figure 3-23: Example of CDM Figure 3-e4: The Logical Data model Figure 3-25: Organizational model: data point of view Figure 3-26: The supplying function conceptual data model Figure 3-21: The logical data model derivation Figure 3-28: The supplying function logical data model Figure 3-29: Data/Procese coherence tool Figure 3-30 ProceaslData coherence tool Figure 3-31: Example of task decomposition Figure 3-32: Content of the central kernel Figure 3-33: Problem-solving hierarchical levels Figure 3-34: Problem solving hierarchical decomposition Figure 3-36 Problem solving hierarchical dewmpdtion example Figure 3-36 Organization Layer implementation example
1 2 2 8 9 10 11 13 15 16 17 18 19 20 20 21 22 23 24 25 26 26 21 27 28 29 30 30 31 31 32 35 36 36 37 38 38 39 42 43 44 51 53


Schema 3-1: Schema 3-2: Schema 3-3: schema 3-4: Schema 3-5 Schema 3-6: Schema 3-7: Schema 3-8:
List of Schemata Grid Function Dedsion-level Decision-center Model Knowledge-Base Enowledgeobject Problem-solvine -
Schema 3-9: Procedure Schema 3-10: Activity Schema 3-1 1: Decision-activity Schema 3-12: Execution-activity Schema 3-13: Informational-link Schema 3-14: Decision-frame Schema3-15: Goal Schema3-16 Role
41 41 42 45 46 46 48 47 47 48 48 48 49 49 60 50


Abstract
Achieving manufacturing efficiency requires that many groups that comprise a manufacturing enterprise, such as design, planning, production, distribution, field service, accounting, sales and marketing, cooperate in order to achieve their common goal. In this paper we introduce the concept of Enterprise Management Network (EMN) as the element to facilitate the integration of distributed heterogeneous functions of a manufacturing enterprise. The integration is supported by having the network first play a more active role in the accessing and communication of information, and second provide the appropriate protocols for the distribution, coordination, and negotiation of tasks and outcomes. The Enterprise Management Network is divided into six layers: Network Layer, Data Layer, Information Layer, Organization Layer, Coordination Layer, and Market Layer. Each of these layers provides a portion of the elements, functions and protocols to allow the integration of a manufacturingenterprise. The Organization Layer plays the central role in the EMN architecture by defming the model of a decentralized structure, and identifying its major components to be supported by the other layers. Methods of analysis and representation are defined at this layer to model manufacturing organization. Thin representation provides a defmition of the decentralized agents and of their interactions. They will be the basin for identifying coordination and negotiation protocols to support distributed problem solving.

1
1. Introduction In the first report1381, we have introduced the concept of Enterprise Management Network
( E m architecture to support the integration of the manufacturing enterprise. We defined this architecture as a multi-layers system supporting both distributed knowledge base and distributed problem solving. We have idenwied six different layers:
6. Market Layer
5. Coordination Layer
4. Organization Layer
3. Information Layer
2. Data Layer
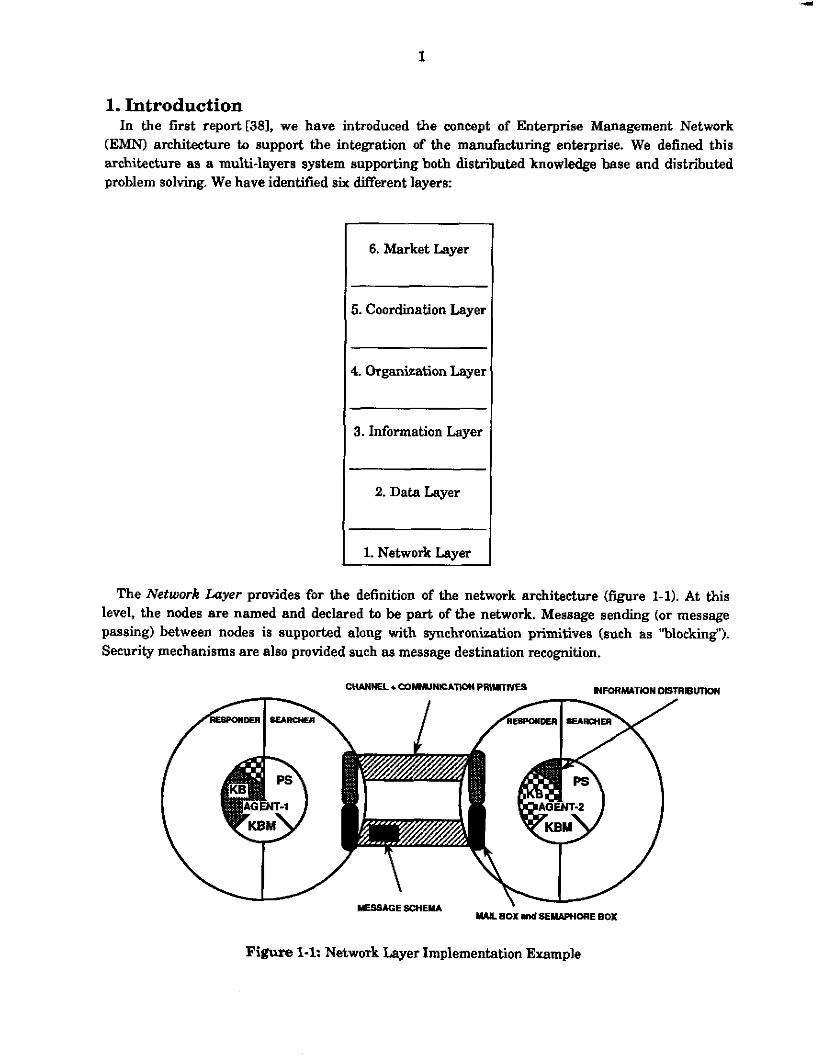
The Network Layer provides for the definition of the network architecture (figure 1-11, At this level, the nodes are named and declared to be part of the network. Message sending (or message passing) between nodes is supported along with synchronization primitives (such as %lockiig"). Security mechanisms are also provided such as message destination recognition.
.
Figure 1-1: Network Layer Implementation Example
2
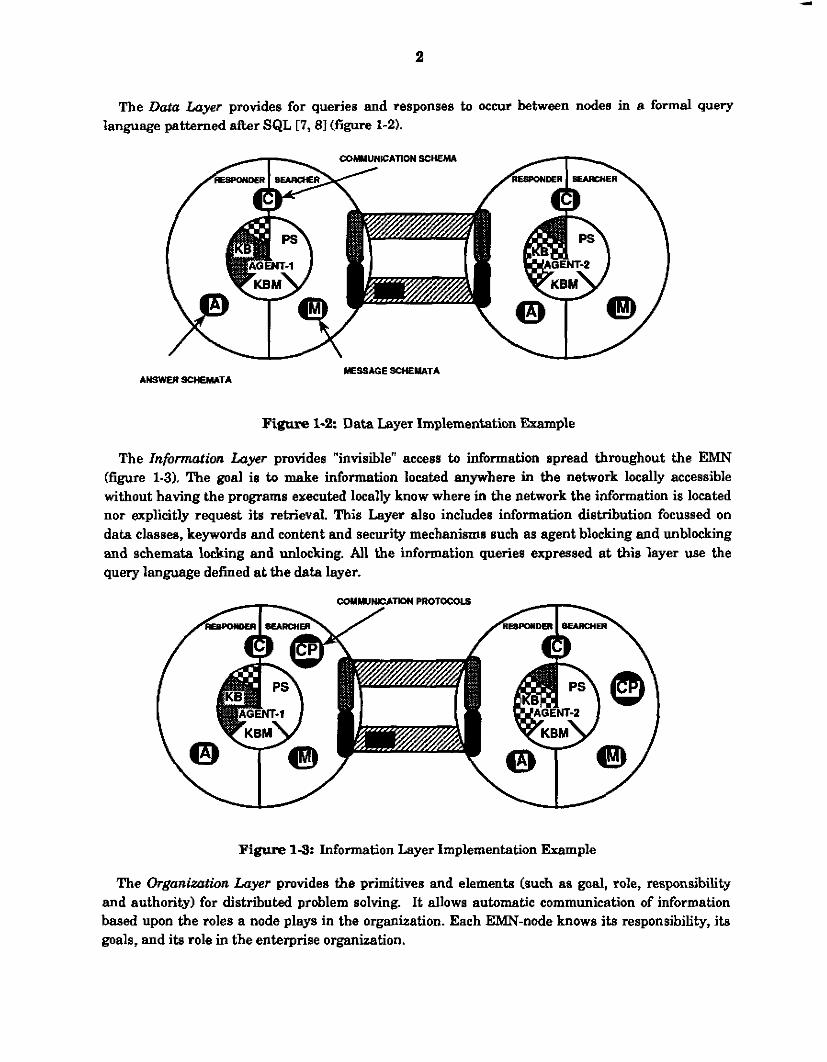
The Data Layer provides for queries and responses to occur between nodes in a formal query language patterned after SQL [7,81 (figure 1-2).
WMIUNICATION SCHEMI
A I I o w u 1 s w E M I T I
Figure 1-2: Data Layer Implementation Example
The Information Luyer provides "invisible" access to information spread throughout the EMN (figure 1-3). The goal ie to make information located anywhere in the network locally accessible without having the programs executed locally know where in the network the information is located nor explicitly request its retrieval. This Layer also includes information distribution focussed on data classes, keywords and content and security mechanisms such as agent blocking and unblocking and schemata locking and unlocking. AU the information queries expressed at this layer use the query language defined at the data layer.
Figure 1-3: Information Layer Implementation Example
The Organization Layer provides the primitives and elements (such as goal, role, responsibility and authority) for distributed problem solving. It allows automatic communication of information based upon the roles a node plays in the organization. Each EMN-node knows its responsibility, ita goals, and its role in the enterprise organization.

3
The Cmrdination Luyer provides the protocol for coordinating the activities of the EMN-nodes through negotiation and cooperation mechanisms.
The Market Layer provides the protocol for coordination among organization in a market environment. I t supports the distribution of tasks and the negotiation of change and the strategies to deal with the environment. In this report, we present in details the fourth layer of this architecture (Organization Layer). The aspects covered by this report mainly concern the distributed problem solving supported by the EMN architecture. In the previous report [381, we presented the problems of distributed knowledge base and how they are covered and supported by the EMN architecture (AB another example for distributed knowledge base, we can refer to [25,1,341). The implementation of this architecture and of the communication system is described in [391. This Layer provides the support for distributed problem solving by defining the type of interactions we can have between EMN-nodes. In the next layers (Coordination and Market), we will defrne the protocols supporting these type of interactions.
We define a t first the concept of distributed problem solving by identifying its characteristics such as coupling, grain size or degree of cooperation.
Then, aRer presenting the content of an EMN-node, we define the Organization Layer of our EMN architecture. This level is the platform on which we build the structure to support the distributed problem solving between the EMN-nodes. In addition, this layer provides information about the EMN-nodes to complete the three first layers of our architecture described in I381.
1.1 Enterprise Management Network Capabilities The optimization of the manufacturing enterprise can only be achieved by greater integration of
activities throughout the production life cycle. Integration must not only address the issues of shared information and communication, but how to coordinate decisions and activities throughout the firm.
Achieving manufacturing efficiency requires that the many groups that comprise a manufacturing enterprise, such as design, planning, production, distriition, field service, accounting, sales and marketing, cooperate in order to achieve their common goal. Cooperation can take many forms:
Communication of information relevant to one or more groups' tasks. For example, sales informing marketing of customer requirements, or production informing the controller of production performances.
Feedback on the performance of a group's task. For example, field service informing design and manufacturing of the operating performance of a new product.
*Monitoring and controlling activities. For example, controlling the execution of operations on the factory floor.
Assignment of new tasks. For example, a new product manager signing up production facilities to produce a new produet. Joint decision making where groups of "agents" have to negotiate and cooperate in order to achieve their tasku (which can be antagonistic or not). For example, an inventory manager and a scheduler negotiating to defme the manufacturing activity.
An Enterprise Management Network is viewed as the "nervous system" of the enterprise, enabling the functions described above. It is more than a network protocol (e.g., MAP) in that it operates and

4
participates at the application level. Its philosophy is different in terms of participation and structuring. Such a system must be defined in such a generic way that it can be integrated with all kinds of applications an enterprise can use. The following describes the capabilities provided by the Enterprise Management Network
-Information routing: given a representation for information to be placed on the network and a representation of the goals and information needs of groups on the network, the information routing capability is able to provide the following
*Static routing: transfering information to groups where the sender and the receivers are predefined.
Dynamic muting: transfering information to groups which appear to be interested in the information. This is accomplished by matching a group's goals and information needs to the information packet. - Retrospective routing: reviewing old information packets to see if they match new goals and information requirements specified by a group.
Closed loop system: Often, the communication of information results in some activity, which the initiator of the communication may be interested in. The EMN will support the providing of feedback in two modes:
Predefine feedback: operationalizes pre-defmed information flows between groups in the organization. For example, production providing feedback to sales on the receipt of orders. - Novel feedback: Providing feedback for new and novel messages.
*Command and control Given a model of the h which includes personnel, departments, resources, goals. constraints, authority and responsibility relations, the EMN will support these lines of authority and responsibility in the assignment, execution and monitoring of goals and activities. In particular, it will manage the distribution of information and the performance oftashs. Dynamic task distribution: Supporting the creation of new organizational groups and decomposition, assignment and integration of new goals and tasks, contracting and negotiation are examples of techniques to be supported.
1.2 Distributed Systems Definition The Enterprise Management Network Architecture provides the elements and functions to define,
implement and support a distributed system. A distriiuted system is a system with many processing and many storage devices, connected together by a network.
1.21 Distributed Systems Advantages
two ways: Potentially, this makes a distributed system more powerful than a conventional, centralized one in
First, it ean be more reliable. Every function can be replicated several times. When a processor fails, another can take over the work. Each file can be stored on several disks, so a disk crash does not destroy any information. W e call this proparty hult tolerance. Second, a distributed system can do more in the same amount of time, because many computations can be carried out in parallel'.
'Note we are talki about large grain paralleliems not mpnectian machina atyla parallekin.

5
1.2.2 Decentralized Systems top-level description "In a very general terms, a system is said to be distributed when it includes several geographically
distinct components cooperating in order to achieve a common distributed task"r21. But this definition is not true for all the domains. If we consider, for example, games involving two players, the aim of each one is to win the game. So the two agents of this decentralized system do not cooperate, they compete (they cooperate in playing the game, Le., they follow some rules, but they compete about sub-goals-winning).
The set of nodes in the system is usually organized according to various domain dependent topologies. Decentralized systems in every day life come from a wide variety of areas, e.g., a business firm, a system for traf6c control, etc.
The processing nodes in a decentralized system may all be identical in their capabilities or they may each posse= specific skills. Whatever the configuration is, in a decentralized system both the control (process) and the knowledge can be distributed throughout the system.
In actuality, there is a range of approaches for decentralized architecture, from an almcxlt centralized system to a distributed system with a centralized planning and control element, to a distributed system with a distniuted, hierarchical group of control elements, to a fully distributed, "flat" system in which each element is responsible for its own control.
Moreover, the organization amongst the elements may either be static, remaining the same as time elapses, or dynamic, adapting itself as the requirements of the environment needs it. In any case, the processing nodes, or agents, contain knowledge about themselves and their environment, and a logical capability to work on that knowledge. In other words, the agents have a memory and a processor.
But we have a limitation for the memory aspect: we cannot have in a decentralized agent all the needed information for completely autonomous running (the concept of bounded rationality [411). This means that we must acquire some information from the other agents of the decentralized system: the agent must communicate. Bounded rationality implies that both the information a computing agent can absorb and the detail of control it may handle are limited.
1.2.3 Distributed System Dimensions Since almost any real world system is decentralized and, moreover, open in nature [21,29,221, the
spectrum of categories for decentralized system is infinite. But we can use two attributes to categorize decentralized systems along two continuous dimensions: the degree of coupling among the agents (or nodes), and the grain size of the processors of the agents.
Coupling is a measure related to links between the agents in the system. Loose coupling means that information exchange amongst the agents is limited. In loosely coupled nystems the agents spend most of their time in local processing rather than in communication among themselves. Tight coupling, therefore, indicates that there is no practical physical limit on the bandwidth of the communication channel between the agents. Because of excessive communication, tight coupling also indicates that the concept of bounded rationality of computing does not completely apply [411.

The grain size of the processors measures the individual problem-solving power of the agents. In this definition, problem-solving power amounts to the conceptual size of a single action taken by an agent visible to the other agents in the system. If the grain is coarse then the processing nodes are themselves rather sophisticated problem-solving systems with a fair amount of complexity. In coarse-grained applications, the distribution may be characterized to be, therefore, at the task level. Fine grain often indicates that the individual processors are functionally relatively simple, i.e., they do not exhibit MY "intelligence" per 8e, and that their number in the system is substantial. Thus, the distribution in fine-grained applications is at the statement level as opposed to task level distribution.
1.2.3.1 Parallel Distributed Processing System Decentralized, fine-grained systems with tight coupling are often referred to as parallel
distributed processing systems [26,9,6,211. The processing aspect emphasizes concurrent execution of functionally decomposable tasks.
The objective in parallel distributed processing systems is usually load balancing of shared informational and physical resources. In distributed processing systems, the computational or syntactic motivations for decentralization are highlighted
speed,
performandcost,
modularity,
availability,
scalability, re l i i l i ty ,
extensibility,
flexibility.
Although the current trends in the cost and availability of computer hardware would suggest that adding up enough conventional, low cost processors would result in an immense overall computing power with a reasonable investment, this has not proven to be the case. On the contrary, it has been recognized that a severe bureaucracy "bogdown" effect in multiprocessor systems calls for totally new architectural strategies to operate on the higher degree complexities in routine problem solving.
13.33 Distributed Problem Solving Systems Defiiition These are defmed
informally a8 networks of loosely coupled, relatively coarse-grained, semiautonomous, "artificially intelligent" asynchronous problem-solving agents, cooperating (or competing according to the domain) to fulfill their global mission. Asynchronous means that the agents are thought to function concurrently [261. Cooperation means that because no node is capable of solving the entire problem by itself; the nodes have to work as a team and exchange knowledge about the tasks, results, goals, and constraints to solve the global problem or set of problems.
As the opposite of F'DP, we have distributed problem solving Systems.
The degree of cooperation between the nodes in a decentralized problem-solving system may vary. On one extreme, the nodes may all be pursuing a common goal and be thus fully cooperative.

7
This assumption is oRen referred to as the benevolent agent assumption. On the other extreme of the cooperation continuum, the nodes are nonbenevolent, i.a, they are self-interested, possessing conflicting goals and preferences. Thus, a process of negotiation to resolve the conflicts becomes crucial.
Decentralized problem-solving architectures with the last set of characteristics mentioned above are often categorized as nearly decomposable systems. In nearly decomposable system, the interactions among the components are weak but not negligible. The emphasis in studying coordination within nearly decomposable systems is on dealing with the problems arising from restricted communication and bounded rationality. In the case of decentralized problem solving, the semantic motivation to pursue decentralization are thus addressed in terms of complexity, possibility and natural decomposition.
13.4 Distributed Systems capabilities
in the face of single-point failures, so it must have: As mentioned above, a distriiuted system has to be capable of parallel execution and of continuing
Multiple processing elements that can run independently. Therefore, each processing element, or node, must contain at least a CPU and memo+.
-There has to be communication between the processing elements, so a distributed system must have interconnection hardware which allows processes running in parallel to communicate and synchronize. A distributed system cannot be fault tolerant ifall nodes always fail simultaneously. The system must be structured in such a way that p-hg elements fail independently. Finally, in order to recover from failures, it is necessary that the nodes keep shared state for the distributed system.
1.2.5 Distributed Systems Problems
such systems [31,20,24,29,171. Some examples of system problems are: All these advantages of distributed systems cannot be satisfied due to the complexity of designing
the amount of interconnections and risk of failure,
the interferences between processes,
the problem of propagation of effects between processes,
the information inconsistency due to its duplication,
the effects of scale due to the dimension of distributed systems and
the partial failure of one processor that can perturbate the other ones.
The EMN architecture we define in this paper covers most of these aspects. The utilization of Artificial Intelligence techniques to support communication and distribution offers help in solving most of these problems, especially propagation of effect, and information inconsistency.
Wote that mkipk- =-a& may share a processor

8
2. Enterprise Management Network Node The Enterprise Management Network links together two or more application nodes (EMN-nodes)
by providing the "glue" that integrates the manufacturing enterprise through architectures and mechanisms to support decision making a t all levels of the organization. For example, the CORTES system 1181 is composed of an uncertainty analyser, a planner, a scheduler, a factory model and two dispatchers responsible for several machines (figure 2-1). Each i n defined as an EMN-node.
DISPATCHER-I DISPATCHER-2
MACHINE-1 .I MACHINE-2.1
MACHINE-I .2 (-)- Figure 2-1: Example of decentralized system
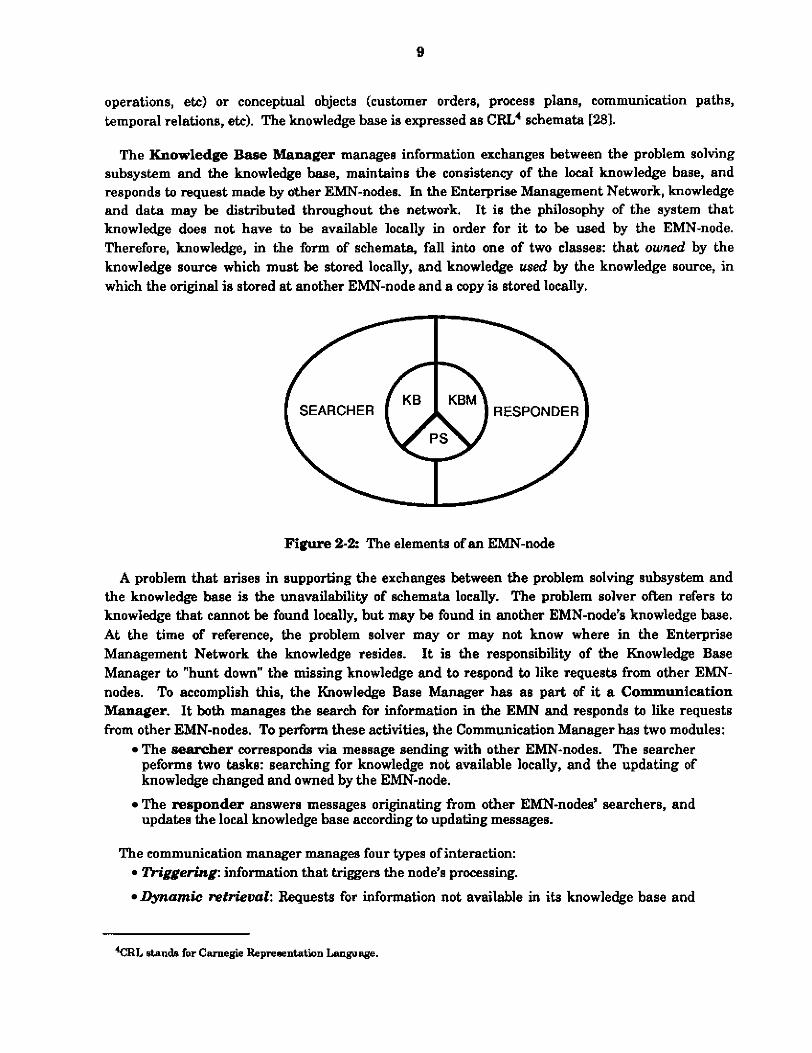
Each EMN-node consists ofthe following subsystems3 (figure 2-2): Problem Solving Subsystem,
Knowledge Base,
Knowledge Base Manager, and Communication Manager.
The Problem Solving Subsystem represents all the rules and functions which allow the EMN- node to solve any problems related to its domain. The local execution cycle is triggered either by the internal transactions generated during local problem solving, or by external events forwarded to the EMN-node by the Communication Manager.
Each EMN-node contains a locally maintained Knowledge Base to support its problem solving. It is composed of entities (or objects) which may be either physical objects (products, resources,
9
operations, ete) or conceptual objects (customer orders, process plans, communication paths, temporal relations, ete). The knowledge base is expressed as C E 4 schemata [281.
The Knowledge Base Manager manages information exchanges between the problem solving subsystem and the knowledge base, mainta ins the consistency of the local knowledge base, and responds to request made by other EMN-nodes. In the Enterprise Management Network, knowledge and data may be distributed throughout the network. It is the philosophy of the system that knowledge does not have to be available locally in order for it to be used by the EMN-node. Therefore, knowledge, in the form of schemata, fall into one of two classes: that owned by the knowledge source which must be stored locally, and knowledge used by the knowledge source, in which the original is stored a t another EMN-node and a copy is stored locally.
Figure 2-2: The elements ofan EMN-node
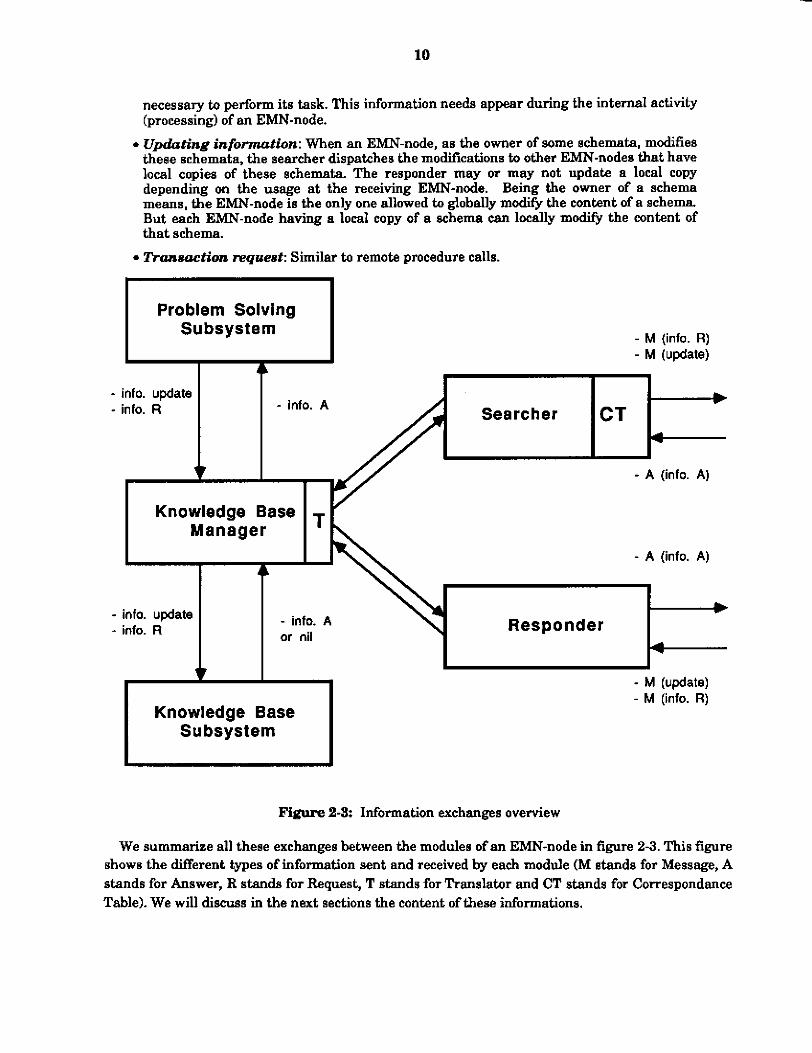
A problem that arises in supporting the exchanges between the problem solving subsystem and the knowledge base is the unavailability of schemata locally. The problem solver often refers to knowledge that cannot be found locally, but may be found in another EMN-node's knowledge base. At the time of reference, the problem solver may or may not know where in the Enterprise Management Network the knowledge resides. It is the responsibility of the Knowledge Base Manager to "hunt down'' the missing knowledge and to respond to like requests from other EMN- nodes. To accomplish this, the Knowledge Base Manager has as part of it a Communication Manager. It both manages the search for information in the EMN and responds to like requests from other EMN-nodes. To perform these activities, the Communication Manager has two modules:
The d e r corresponds via message sending with other EMN-nodes. The searcher peforms two tasks: searching for knowledge not available locally, and the updating of knowledge changed and owned by the EMN-node.
The responder answers messages originating from other EMN-nodes' searchers, and updates the local knowledge base according to updating messages.
The communication manager manages four types of interaction: Wggering information that triggers the node's processing.
Dynamic retriew2 Requests for information not available in its knowledge base and
.-
Problem Solving Subs yste rn
l o
- M (info. R) - M (update)
- info. update - info. R
Figure 2-3: Information exchanges overview
We summarize all these exchanges between the modules of an EMN-node in figure 23. This figure shows the Meren t types of information sent and received by each module (M stands for Message, A stands for Answer, R stands for Request, T stands for Ranslator and CT stands for Correspondance Table). We will discuss in the next sections the content of these informations.
&
+ CT - info. A
Searcher 4
v - A (info. A)
- info. update - info. R
b - info. A Responder or nil
4
Knowledge Base Subsystem
- M (info. R)
11
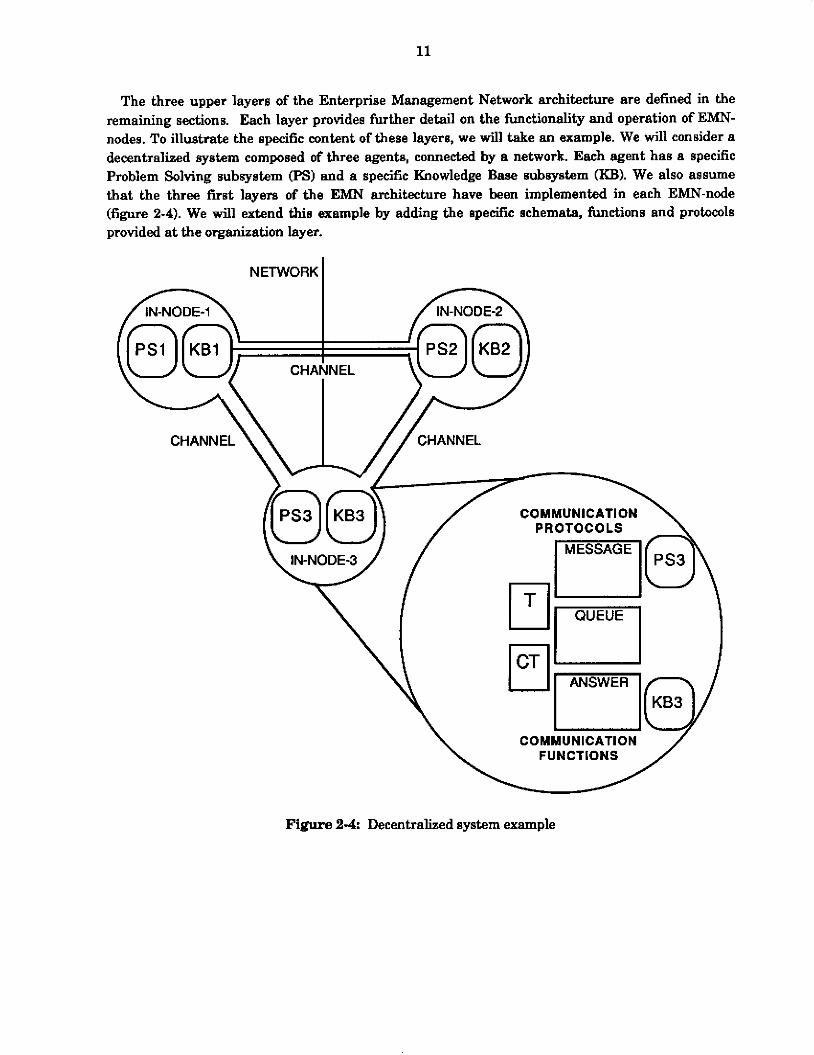
The three upper layers of the Enterprise Management Network architecture are defined in the remaining sections. Each layer provides further detail on the functionality and operation of EMN- nodes. To illustrate the specific content of these layers, we will take an example. We will consider a decentralized system composed of three agents, connected by a network. Each agent has a specific Problem Solving subsystem (PSI and a specific Knowledge Baae subsystem (KB). We also assume that the three first layers of the EMN architecture have been implemented in each Em-node (figure 2-4). We will extend this example by adding the specif= schemata, functions and protocols provided a t the organization layer.
NETWORK
COMMUNICATION PROTOCOLS
COMMUNICATION FUNCTIONS
Figure 2-4: Decentralized system example

12
3. Organization Layer The Organization Layer provides the primitives that define an agent's goals, roles, responsibilities
and authority in an organization. These primitives are used to support distributed problem solving, that is the definition of both structure and the support of different methods of coordination, and to determine to whom information is to be communicated automatically.
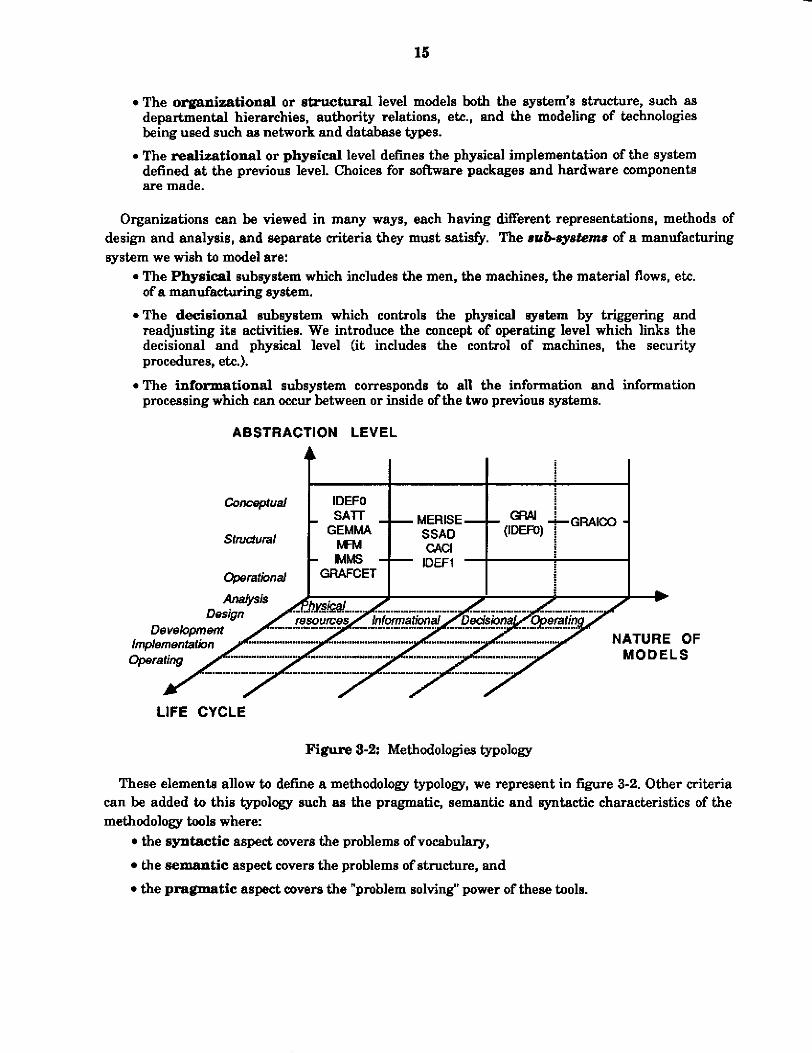
Our approach to modeling an organization is to start with its structure [321. The three main aspecta are:
mPfiyeical: all the physical resources of the organization, such as the machines, the personnel, the tools, etc. Decisional: all activities related to the control of the physical system which need a decision to be taken. The main caracteristic of these activities is the possibility of multiple choices.
ZnformationuI: the control ofthe physical activities by the decisional system is done by exchanging information between them. Information exchanges are also present in each systems. We include in the informational system all the information processing such as the Material Requirement Planning.
We add to thii structural information, the lines of authority, goals, roles and responsibilities of each organizational entity. The model is then further retined with the information flows that are necessary to support decision making, and the temporal horizon over which decision are to be made or actions performed.
Our modeling methodolcgy utilizes the GRAl [ll, 361 and GIM 136,371 graphical modeling tools as a means of s p e c i ~ n g an organizations. The advantages of using such graphical taols are in the clarity of the conceptualization of the real environment. They provide a strict formalism of the different systems we intend to model. These models, once created, will allow abetter understanding of what the inter-actions and hierarchical links are.
The interactive graphical specification of organization is automatically translated into the underlying organization, information, and network layer schemata and protocols. These schemata allow the definition of links and inter-actions between the E"-nodes. Mechanism are defined to complete, using the content of these schemata, the communication schema, to create channels and decision frames, to define, using the informational links, what are the updating sequences and potential users of the information. In addition, the hierarchical structure of EMN-nodes will be deiined through the hierarchy of decision frame we deiine in the organizational model. This hierarchy will be used at the coordination layer to define coordination and negotiation protocoles.
In figure 3-1, we define the different sequences and functionalities supported by the Organization Layer of the EMN architecture. Starting from a specific enterprise, the first step performed at the Organization Layer is to build, using a graphical editor, a model of the organization of this enterprise. This model uses both GRAl and GIM modeling formalisms. The GRAI model structures a manufacturing organization according to a deeision point of view. It defines the production management of a manufacturing organization. The GIM model supports the data modeling. It
~
6CM. CRAI-IDEM-MERISE or GRAI Integrnted M & a & l ~ hnn been mated in our PhD thesis1361 and in the Eumpeen ESPRIT Pmjed 418 Open CAM Syxtem [E, 361
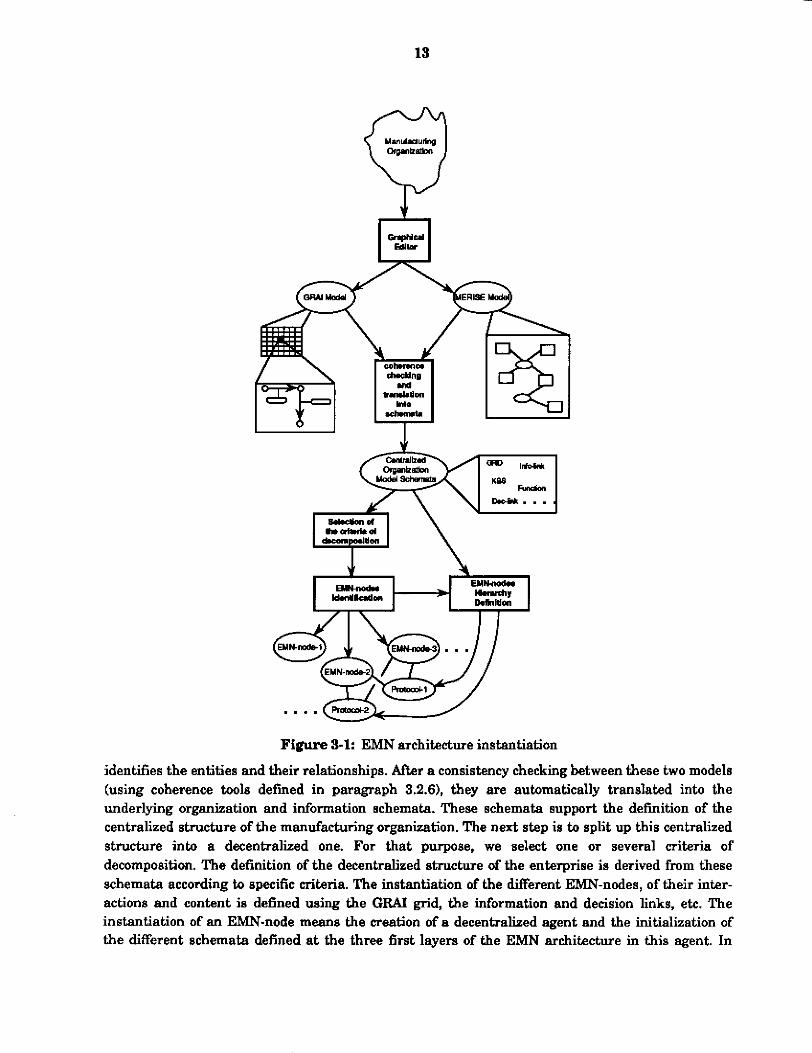
Figure 3-1: EMN architecture instantiation
identifies the entities and their relationships. ARer a consistency checking between these two models (using coherence tools defmed in paragraph 3.2.6), they are automatically translated into the underlying organization and information schemata. These schemata support the defmition of the centralized structure of the manufacturing organization. The next step is to split up this centralized structure into a decentralized one. For that purpose, we select one or several criteria of decomposition. The definition of the decentralized structure of the enterprise is derived from these schemata according to specific criteria. The instantiation of the different EMN-nodes, of their inter- actions and content is defined using the GRAl grid, the information and decision links, etc. The instantiation of an =-node means the creation of a decentralized agent and the initialization of the different schemata defined a t the three first layers of the EMN architecture in this agent. In

14
addition, the used, shared and owned information specific to this EMN-node are identified, the channels between this new EMN-node and the already existing ones are created. Then, the hierarchy and interactions between this new EMN-node and the already existing ones are identified and the corresponding coordination and negotiation protocols are applied to support the distributed problem solving among the different EMN-nodes. The definition of the EMN-nodes and their interactions are determined using both GR4I and GIM models. After d e f d g one or several criteria of decomposition, we can derive using the different rules specified in paragraph 3.2.2 the structure of the decentralized production management system of a speeific organization. This structure is also supported by schemata we present in section 3.3. The negotiation and coordination protocols are defined a t the coordination layer. But their application is determined by the interactions identified a t the organization layer.
In this section, we define the concept of a modeling tool. Then, we present the modeling tools of the GRAI and GIM methods and their application to defiie the structure of the organizational model. In the last part, we present the schemata to support the implementation of this organization layer.
3.1 Modeling tool selection Modeling is a difficult task, the domain we intend to model is complex. The goal of modeling is not
to simplify but to better represent the complexity in order to support analysis 1301. Simon suggests analyzing a problem by splitting it up into "action and goals" 1421. Titli suggests decomposing and aggregating hierachically a structure in order to identify modules and analyse their inter-actions [491. We have selected the GRAI methodology for modeling organizations. Our choice is based on
an existing classification [35,151 of the current methods and tools which use the following criteria: What aspeck of the ~ystem modification life cycle is supported by the methodology,
What abstractions of the system the methodologv is able to model, and
What types of subsystems can be modeled.
For our purposes, we can ignore the life cycle modeling criterion6.
The complexity of a manufacturing organization is great, thereby precluding its modeling in complete detail. Consequently. a methodology must support the modeling of an organization a t different levels of abstraction. Three abstraction levels have been identified
*The conceptual level defines a system in terms of entities, activities, and their relationships.
%I mdi@q an og&tian, them PIB five reoognieed phesea that m&e up the syatem lire q c h Annly.i. phsre: we study the uituatinn ol the existing nyntem and we try to deri ita inconajntenciea. The
m Dee.i@pe&htiom phase: the functional specitieatious, the basic fremeworh und the general behaviour of the
Development pham baaed on the d m b a made at the p r i m a dep, this pham mOeBllU the t&tnieal cboieea
Implementdon *e: integration and adaptation of the ptotrpc in itn real enuimnment.
Opereting phare: utiliiatian, m n h l and reudjustment ofthe implemented aystem.
Canstrainta andpnh fan dm defined
futur system are Qfned.
and the realisation of the pmtatyp of the lutur my&m
15
ConcspPoal IDEFO
SfrUcrUral ME!4ISE-- - S A l l __
GEMMA SSAD hFM w
IDEFI - MMS -- operational -CET
i
a i
i
i
Y G R A W - ( I D W )
8
Figure 3-2 Methodologies typology
These elements allow to defhe a methodology typology, we represent in figure 3-2. Other criteria can be added to this typology such as the pragmatic, semantic and ~yntactic characteristics of the methodology tools where:
the syntactic aspect covers the problems of vocabulary,
the semantic aspect covers the problems of structure, and the pragmatic aspect covers the "problem solvinp" power of these tools.
16
3.2 Enterprise Modeling In this section, we define the content and use of the tools used to acquire the description of the
organizational model of the Enterprise Management Network (EMN) architecture. The first graphical tools we describe are the GRAI [ll, 361 tools. Then we define the data modeling tool ofthe MEFUSE method [47,481 which uses the entityhelationship model originaly created by Chen El. These two models span both aspects of problem solving and knowledge: the GRAI model describes the enterprise’s decision making processes and supporting knowledge, and the MERISE data modeling tools define the data structure used in the decision processes. In the last part of this section we propose two coherence tools to support the integration of both GRAI and GIM models.
3.2.1 The GRAI Methodology
Filter \
Raw material
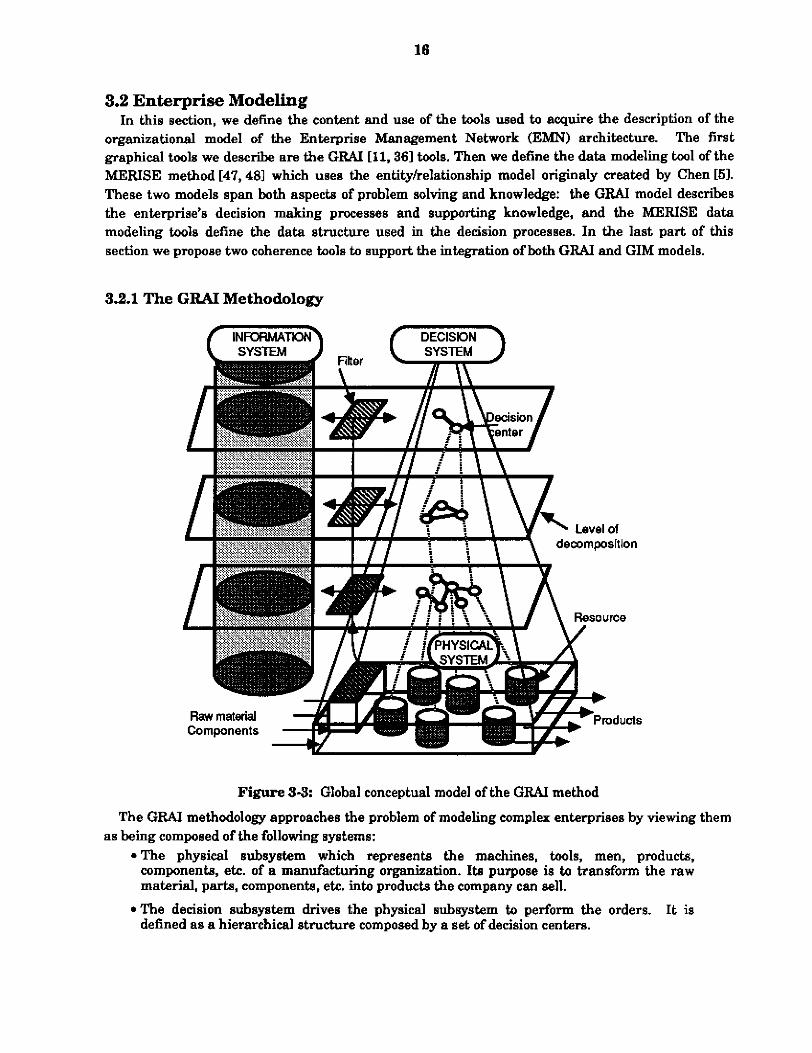
Figure 33: Global conceptual model of the GRAI method
The GRAI methodology approaches the problem of modeling complex enterprises by viewing them as being composed of the following systems:
*The physical subsystem which represents the machines, tools, men, products, components, etc. of a manufacturing organization. Its purpose is to transform the raw material, parts, componenta, etc. into products the company can sell.
It is defined as a hierarchical structure composed by a set of decision centers.
*The decision subsystem drives the physical subsystem to perform the orders.
17
*The informational subsystem is the link between the two previous subsystems. All information exchanged, manipulated, transformed, created, etc. are part of this subsystem.
Figure 3-3 provides a graphical depiction of an enterprise's systems from the GRAI perspective.
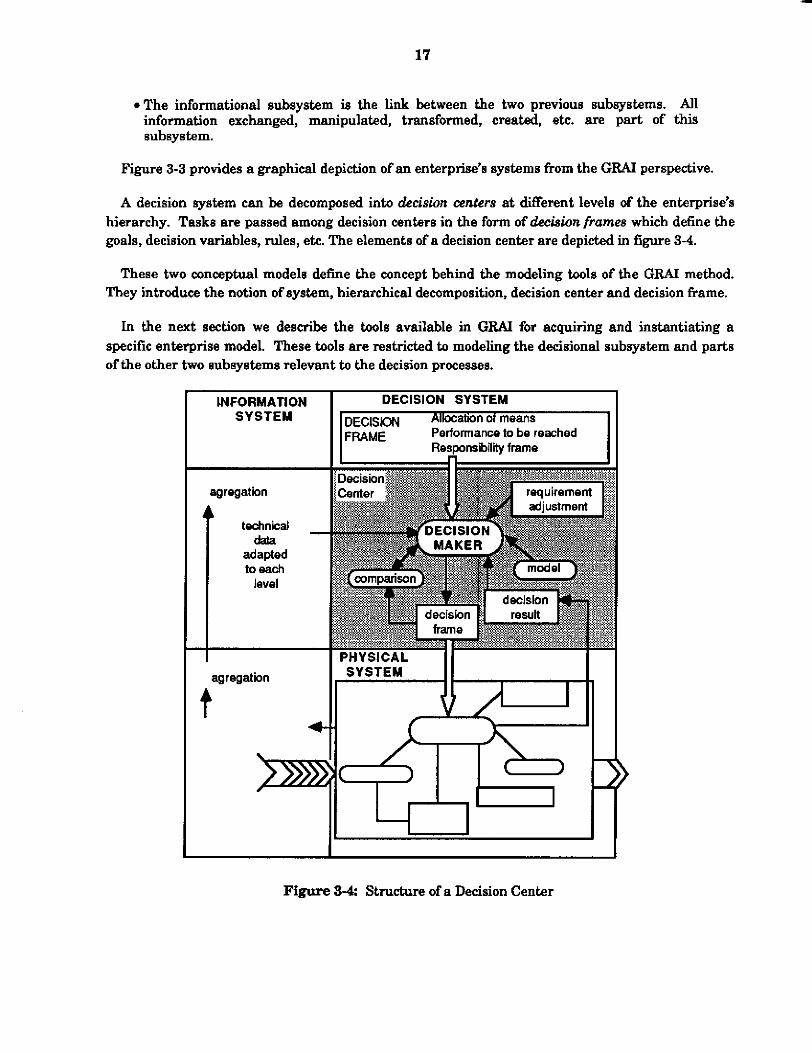
A decision system can be decomposed into deciswn centers at different levels of the enterprise's hierarchy. Tasks are passed among decision centers in the f m ofdecision frames which define the goals, decision variables, rules, ete. The elements of a decision center are depicted in figure 3-4.
These two conceptual models defme the concept behind the modeling tools of the GRAI method. They introduce the notion of system, hierarchical decomposition, decision center and decision frame.
In the next section we describe the tools available in GRAl for acquiring and instantiating a specific enterprise model. These tools are restricted to modeling the decisional subsystem and parts of the other two subsystems relevant to the decision processes.
INFORMATION DECISION SYSTEM SYSTEM DECISION Allocation of means
ResporrPbili frame FWME Performance to be reached
agregatbn SYSTEM II
t I e- - d
I
Figure 34: Structure of a Decision Center

1s
32.1.1 The GRAI method modeling tools GRAI has two graphical tools for modeling decision subsystems: GRAI grid and GRAI nets. The
GRAI grid (figure 3-5) provides a hierarchical representation of decision activities that spans the entire decision system. The grid has two axes:
The horizontal axis indicates the funCtiOM of a production management system. For
The vertical axis defies a temporal decomposition of these functions, defined by two
*The Horizon which is the duration of which a decision is valid (for example,
* The Period is the time aRer which you revise your decision (for example, I make a
example, planning, purchasing, supply, quality control, engineering, etc.
parameters:
establishing a budget for one year => H = 1 year).
schedule for the week and I readjust it every day => H = 1 week, P = 1 day).
Figure 3-5: GRAI grid
Each "box" in the grid defines a decision center (for example, "to make the Master schedule", "to make the schedule", "to define the supplying parameters". etc.). Decision centers can be linked as follows:
*The information link, d r a m with a single arrow, represents the transmision of information between two decision centers (for example, the engineering decision center provides the process plan to the scheduling decision center).
The decision frame, drawn with a double arrow, defines the goal, decision variables and rules transmission. It defines the hierarchical task allocation link between two decision centers.
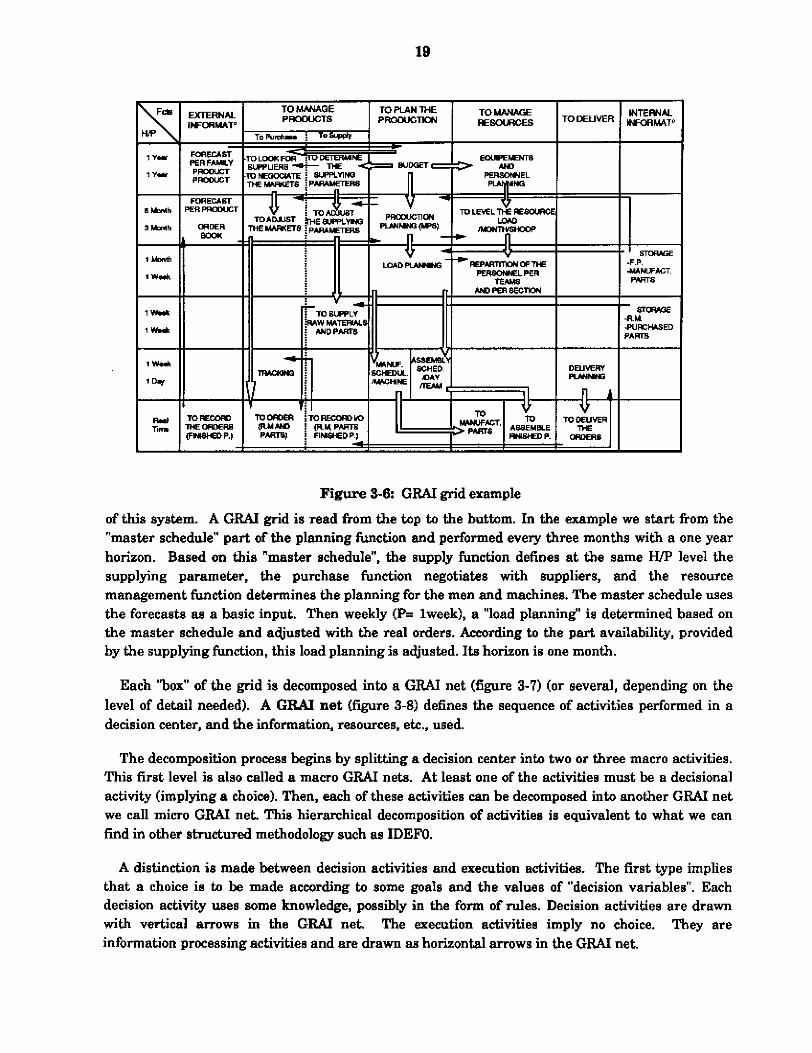
Figure 3-6 is an example of a GFW grid. In this example, four decision levels are defined (1 year, 3 months), (1 month, 1 week), (2 weeks, 1 day) and Real time. Four different functions have been taken into account: to purchase, to supply, to plan and to manage resources. The two columns: internal information and external infomation are just information supports providing knowledge about the source of information used by the Production Management System and which are not part
19
Figure 3-8: GRAI grid example
of this system. A GRAl grid is read from the top to the buttom. In the example we start from the "master schedule" part of the planning function and performed every three months with a one year horizon. Based on this "master schedule", the supply function defines a t the same HE' level the supplying parameter, the purchase function negotiates with suppliers, and the resource management function determines the planning for the men and machines. The master schedule uses the forecasts as a basic input. Then weekly (P= lweek), a "load planning" is determined based on the master schedule and adjusted with the real orders. According to the part availability, provided by the supplying function, this load planning is adjusted. Its horizon is one month.
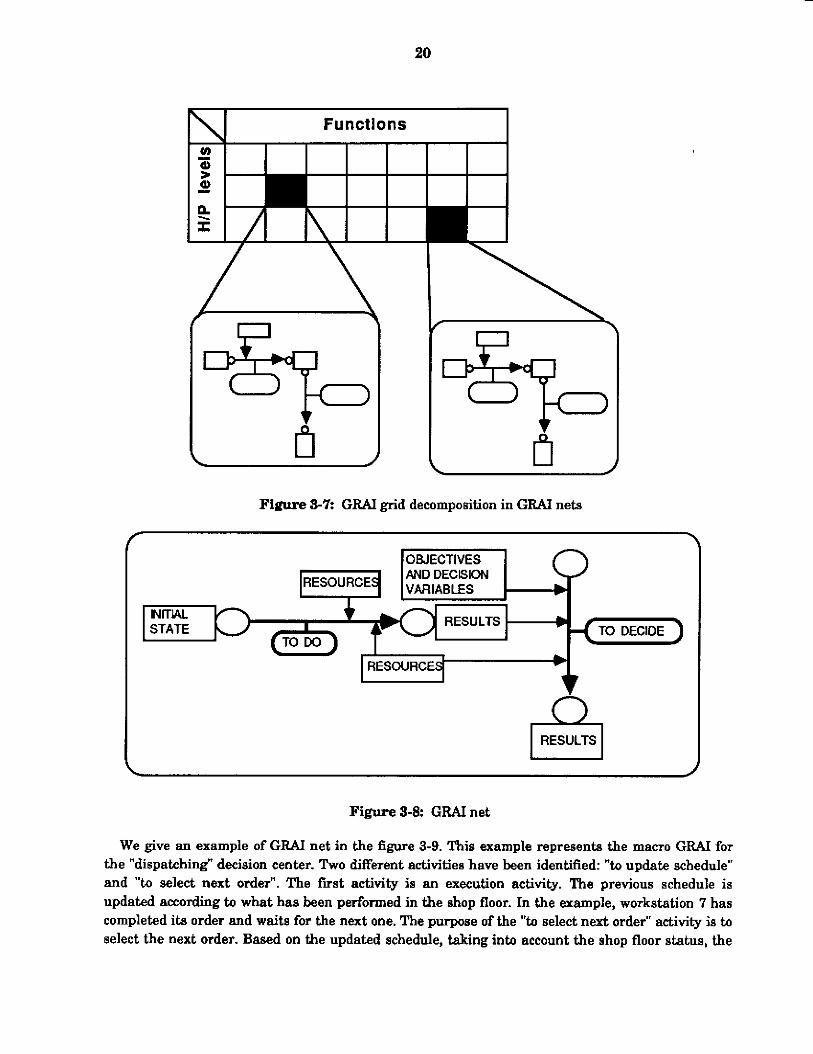
Each 'box" of the grid is decomposed into a GRAI net (figure 3-7) (or several, depending on the level of detail needed). A GRAI net (figure 3-8) defines the sequence of activities performed in a decision center, and the information, resources, etc., used.
The decomposition process begins by splitting a decision center into two or three macro activities. This first level is also called a macro GRAI nets. At least one of the activities must be a decisional activity (implying a choice). Then, each of these activities can be decomposed into another GRAI net we call micro GRAI net. This hierarchical decomposition of activities is equivalent to what we can find in other structured methodology such as IDEFO.
A distinction is made between decision activities and execution activities. The first type implies that a choice is to be made according to some goals and the values of "decision variables". Each decision activity uses some knowledge, possibly in the form of rules. Decision activities are drawn with vertical arrows in the GRAI net. They are information processing activities and are drawn as horizontal arrows in the GRAI net.
The execution activities imply no choice.
20
I Functions
Figure 3-7: GRAI grid decomposition in GRAI nets
OBJECTIVES
VARIABLES IREsoURCES( AND D E C E M
4 b RESULTS NlML STATE
b
v PI RESULTS
Figure 3-8: GRAI net
We give an example of GRAI net in the figure 3-9. This example represents the macro GRAI for the "dispatching" decision center. T w o different activities have been identified: "to update schedule" and "to select next order". The fwst activity is an execution activity. The previous schedule is updated according to what has been performed in the shop floor. In the example, workstation 7 has completed ita order and waits for the next one. The purpose of the "to select next order" activity is to select the next order. Based on the updated schedule, taking into account the shop floor status, the
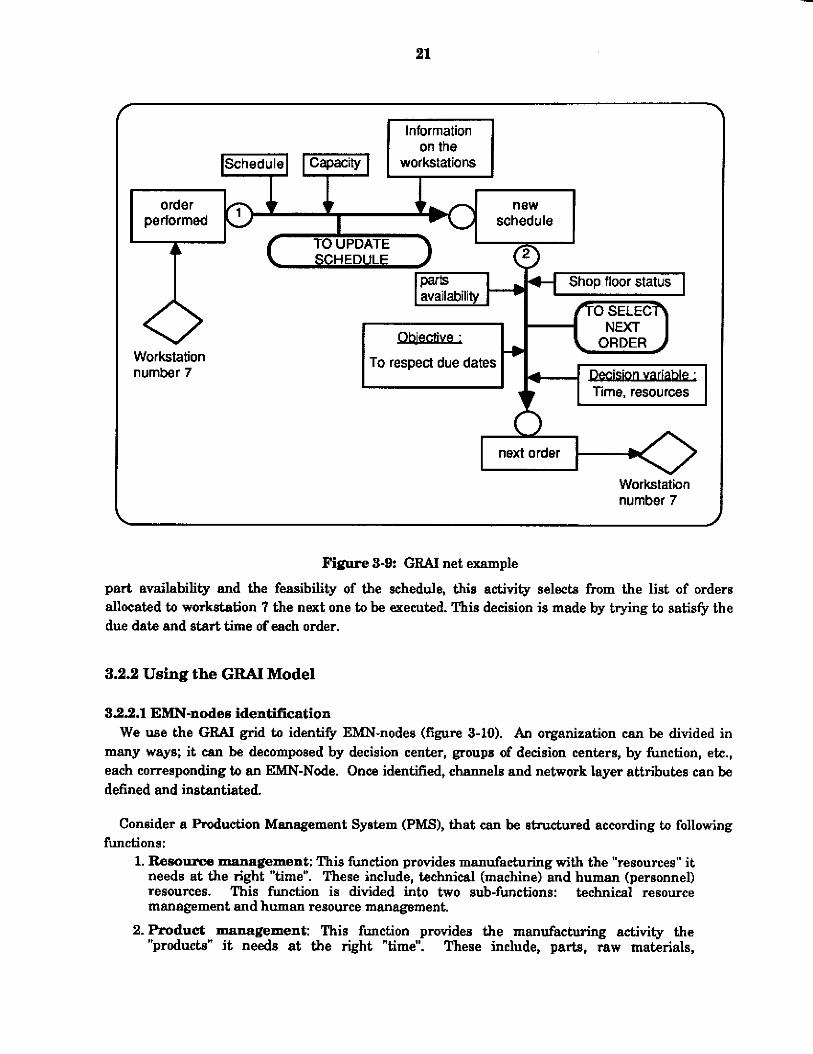
Information
Workstation number 7
- c c new schedule
order performed
1 TO UPDATE SCHEDULE
parts Shop floor status availability
/To SELEC-
1- . . To respect due dates -@
4 lime, resources
next order
Workstation number 7
Figure 3-9: GRAI net example
part availability and the feasibility of the schedule, this activity selects from the list of orders allocated to workstation 7 the next one to be executed. This decision is made by trying to satisfy the due date and start time of each order.
3.2% Using the GRAI Model
322.1 EMN-nodes identification We use the GRAI grid to identify EMN-nodes (figure 3-10). An organization can be divided in
many ways; it can be decomposed by decision center, groups of decision centers, by function, etc., each corresponding to an =-Node. Once identiiied, channels and network layer attributes can be defined and instantiated.
Consider a Pduct ion Management System (PMS), that can be structured according to following functions:
1. Resource management: This function provides manufacturing with the “resources” i t needs at the right ”time”. These include, technical (machine) and human (personnel) resources. This function is divided into two sub-functions: technical resource management and human resource management.
2.Product management: This function provides the manufacturing activity the “productis” it needs at the right “time”. These include, parts, raw materials,

22
components, etc. that are used, manufactured, supplied, etc. This function is divided into 2 sub-functions:
Supply: Determine the needed quantity of "products" and the date of this need for
Purchase: Acquire needed products from suppliers.
the manufacturing activity.
3. Planning function: This function synchronizes manufacturing activities. It plans and schedules the production of the "products" using ''resources" of good quantity and at the right "time".
Functions I
Figure 3-10: EMN-nodes identification using the organizational model
All these functions are performed at three levels: Strategic (S): which defines the objectives of the function,
Tactical rr): which establish plans according to the objectives,
Operational (0): which applies plans and readjusts them according to perturbations.
Additional functions include maintenance, quality control, distribution, design, etc.
According to this functional decomposition and the three identified decision levels, each function or sub-function can be split up into several activities. For example if we decompose the planning function we C M identify six main activities:
The first activity performed in the planning function is to do Production PhMhg. Production planning forecasts customer demand and determines the manufacturing activities required to satisfy them, including budgets and capital investments.
Master Production Scheduling (MS) refmes the Production Plan in more detail over a shorter horizon, with specific products and using firm orders. This is used 88 input to Material Requirement Planning (MRP). The MRP system produces three plans:
a supply plan which is given to the supply function,
23
a subcontracting plan which is given to the purchasing function and
a manufacturing plan which is given to the planning function.
With the manufacturing plan, a Load Plan (LP) is developed by comparing mand against the theoretical capacity of the resources. In situations where demand exceeds capacity, load levelling is peformed in order to create a feasible plan. Leveling can be achieved by subcontracting, moving activities backward or forward in time, adding capacity through overtime, etc.
Given a load plan, Scheduling sequenws the activities using detailed information about setup and run times, tooling and personnel requirements, etc. Once sequencing is completed, jobs are dispatched to the factory floor and schedules are adjusted in light of unplanned for events that may occur, such as machines failures.
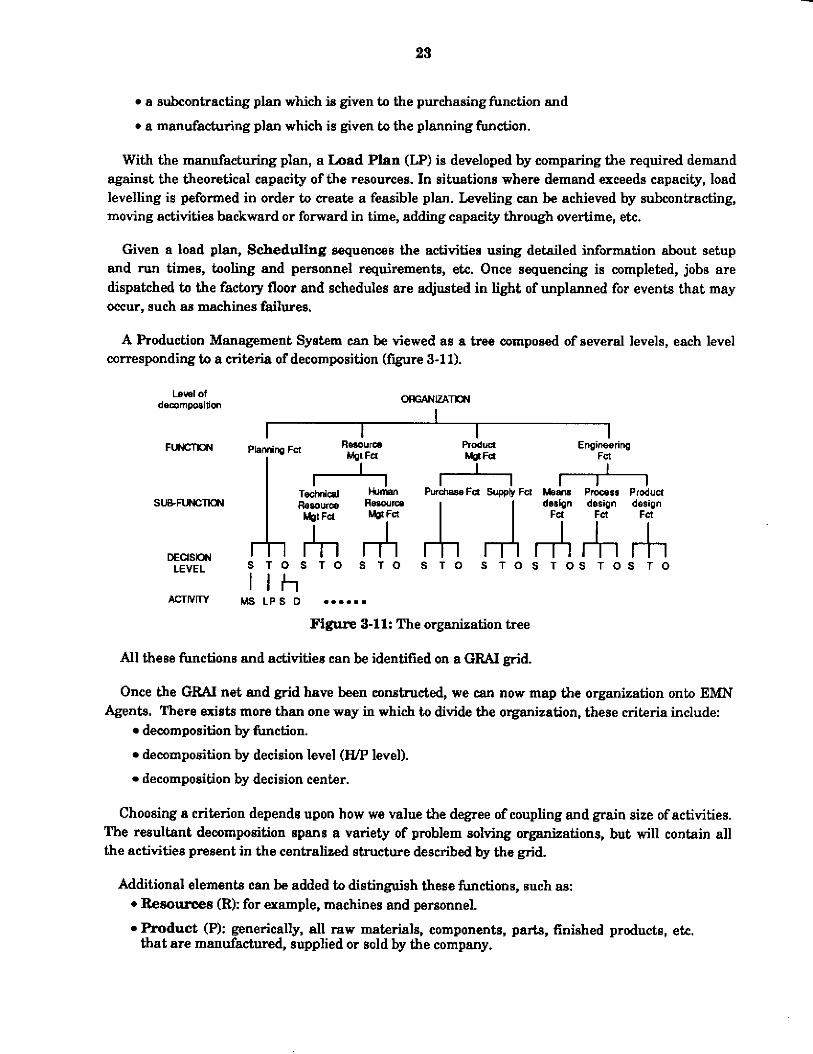
A Production Management System can be viewed as a tree composed of several levels, each level corresponding to a criteria of decomposition (fwre 3-11).
LSWI Of demfnwltion oKaNK4m
I I I I I
FUJCTM Plemin.Fct R & " m PrAUa Ecgineericg
~ & d Human PuchaseFu SupphrFcl k&m Pmosss Product ~ s o u r c a WJ Rewumn A J A A A deaipn deskn desiQn
DEc(sm S T O S T O S T O S T O S T O S T O S T O S T O LEVEL
I I h A C T W W Ms L P S D .e....
Figure 3-11: The organization tree
All these functions and activities can be identified on a GRAI grid.
Once the GRAl net and grid have been constructed, we mn now map the organization onto EMN
1, Agents. There exists more than one way in which to divide the organization, these criteria include:
decomposition by function.
decomposition by decision level (WP level).
decomposition by decision center.
Choosing a criterion depends upon how we value the degree of coupling and grain size of activities. The resultant decomposition spans a variety of problem solving organizations, but will contain all the activities present in the centralized structure described by the grid.
Additional elements c a n be added to distinguish these functions, such as: 4 Resources (R): for example, machines and personnel.
Product (p): generically, all raw materials, components, parts, finished products, etc. that are manufactured, supplied or sold by the company.
24
Time (T): such as duration, due date, starting date, etc.
For example, the three main functions of a PMS can be distinguished as follows:
and quantity. So, the elements manipulated by this h c t i o n are P and T.
time and capacity. So, the elements manipulated by this h c t i o n are Rand T.
right time. So, the elements manipulated by this function are P, R and T.
The Product Management function provides products to manufacturing a t the right time
The Resource Management function provides resources to manufacturing at the right
The Planning function synchronizes the production of products with the resources a t the
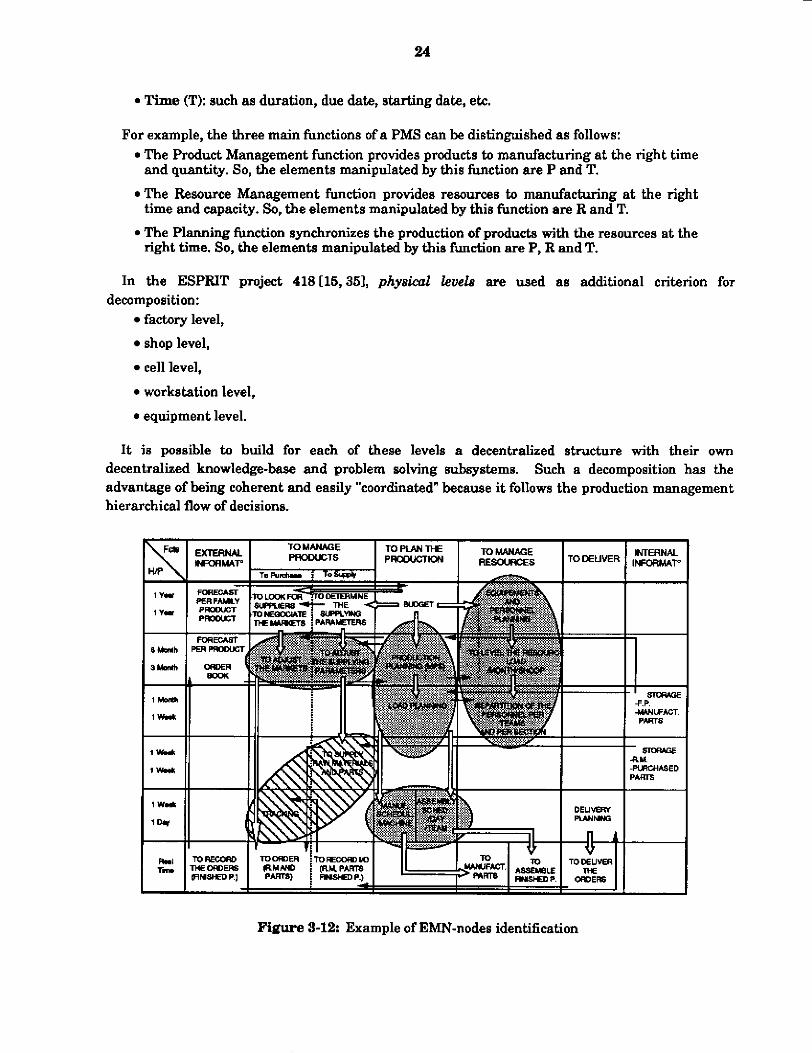
In the ESPRIT project 418[15,351, physiml lewb are used as additional criterion for decomposition:
factory level,
shop level,
cell level,
workstation level,
equipment level.
I t is possible to build for each of these levels a decentralized structure with their own decentralized knowledge-base and problem solving Bubsystems. Such a decomposition has the advantage of being coherent and easily "coordinated" because it follows the production management hierarchical flow of decisions.
-smw€ RU. PLRWMED URTS
Figure 3-12: Example of EMN-nodes identification

25
As we can see, a wide variety of criteria is available to define the hierarchical structure of a manufacturing system. The selection of a criterion is the key issue for identifying the EMN-nodes of our structure (figure 3-12).
3.2.22 EMN-nod- hierarchy and inter-actions identification The GRAI grid specifies the links between decision centars of a manufacturing organization. As
the smaller grain size for the definition of the EMN-nodes is the decision center, we c a n easily make the correspondance between decision center links and EMN links.
The GRAl grid defines two link types: The information links, and
the decision links. The information link defines the information exchanges between decision centers (figure 3-13). Using this aspecta, we can derive the owner, the user and the shared information. The origin of the information link can be defined as the information owner and the destination as the information user. By analyzing all these links, we can easily derive the content of the communication schema, defmed a t the data layer, for each different EMN-nodes. This derivation will be supported by some Lisp functions which will, using the schemata supporting the organizational model, complete the different slots of the communication schema of all the different EMN-nodes. Consistency checking will be also ensured.
\ information exchanged c owner Figure 3-13 Identification ofthe information exchanges
The decision link defines the hierarchy of decision centers (figure 3-14). A decision frame or decisional link between two decision centers (or EMN-nodes in case of direct correspondance) defines the transmission of goals and decisional variables from one decision center to another. A decision frame is used as a platform to support decision activities. They define the decision centers hierarchy. In addition, elements such as goal, decision rules, responsibility, etc. are specified.

1 L Servant Master
Figure 3-14: EMN-node hierarchy identification
We use these links to define the hierarchy of EMN-nodes once these EMN-nodes have been identified on the GRAI grid. These links allow to establish between pairs of Em-nodes the type of inter-action i t exists between them. According to this type, we can select a negotiation protocol, defmed at the Coordination layer, to support the distributed problem solving between EMN-nodes.
Figure 3-15 MSP type identification
We have identified three diff'erent type of inter-actions between EMN-nodes on a GRAI grid *The MSP (Master-Servant Protocol): when we have a decision frame between two
decision centers which are in the same function but at different levels of decision (figure 3-15). This type of relation c a n be identified as a global goal transmission between two EMN-nodes of the system. The "servant" performs its activity based on the

27
IN-node Figure- S-16: SPP type identification
Master
Figure 3-17: Mup type identification
decision-fmme it receives from the “master”. This decision-frame contains the goals and plans to follow. The interaction is mainly unidirectional (from the ”master” to the ”servant”). The “servant” only sends feedback to the “mastef.
*The SFT (Same-Power Protocol): when two decision centers are at the same level of decision but in diRerent functions and linked by an information link (figure 3-16). This is the more complex type of relation. In that case, the EMN-nodes have to cooperate because they are performing an antagonistic task. The goals of their activities can be different but they are manipulating common resourcw. Aa an example, we c a n refer to [13,33,27,10, 19,12,3,4,43,46,451 for a more complete description and study of
coordination and negotiation mechanisms. Based on this literature, we will propose different protocols a t the coordination layer, to support this aspect of coordination and negotiation of antagonistic EMN-nodes.
28
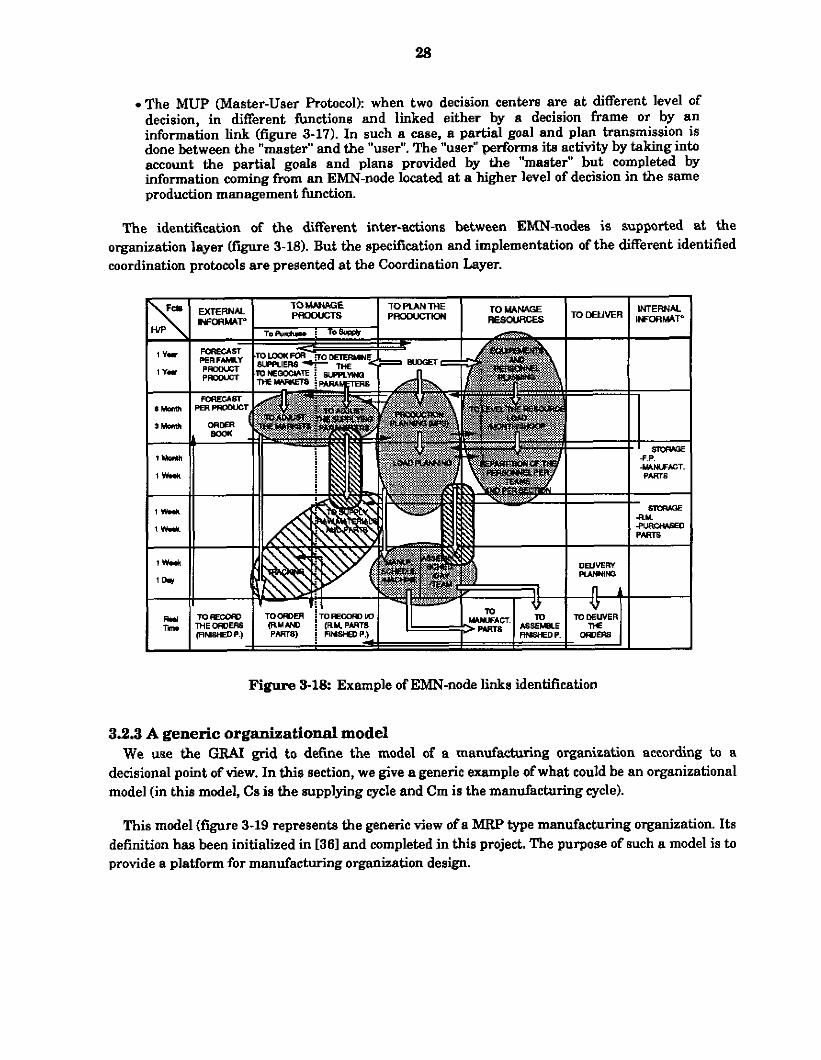
-The MUP (Master-User Protocol): when two decision centers are a t different level of decision, in different functions and linked either by a decision frame or by an information link (figure 3-17). In such a case, a partial goal and plan transmission is done between the "master" and the "user". The "user" performs it8 ac t idy by taking into account the partial goals and plans provided by the "master" but completed by information coming from an EMN-node located at a higher level of decision in the same production management function.
The identification of the different inter-actions between Em-nodes is supported at the organization layer figure 3-18). But the specification and implementation of the different identified coordination protocols are presented at the Coordination Layer.
Figure. 5-1% Example of J3MN-node links identification
33.3 A generic organizational model We use the GRAI grid t o define the model of a manufacturing organization according to a
decisional point of view. In this section, we give a generic example of what could be an organizational model (in this model, Cs is the supplying cycle and Cm is the manufaduring cycle).
This model (fmre 3-19 represents the generic view of a MRP type manufacturing organization. Its definition has been initialized in [361 and completed in this project. The purpose of such a model is to provide a platform for manufacturing organization design.

Figure 3-19 Organizational model: decisional point of view
3.2.4 The MERISE data modeling tools The MERISE methodology uses entity/relationship model for data modeling. Data analysis is a
methodology which links together the analysis offunctions and data in an integrated and structured model. In this section, we deiine the concept of entityhelationship model to build a Conceptual Data Model (CDM). Then, we introduce the Logical Data Model (LDM) derived from the CDM using some translation rules we defme.
324.1 Entities and entity types The building block upon which all the entity analysis is based, is called an entity. An entity is
"anything relevant to the enterprise about which information could be or is kept". An entity represents data but is not itself a data. For instance, a drilling machine exists as a machine but its capability, number of tool, availability and so on are just characteristics which may or may not be represented as data A second term used in entity analysis is entity type (figure 3-20). An entity type covers all entities relevant to the enterprise, which have a given common definition.
We UUI determine several types of entity type: *real entity types: these are tangible objects or things, such aa machines, p p l e ,
activity entity types: these are activities of interest to the enterprise, about which data buildings, etc.
could be kept, for instance: accident, inquiries, etc.

30
entity name this is an optional part
[identifying name]
{propriety type name)
Figure 3-u): The entity content
conceptual entity types: a business can invent or use purely conceptual entity types, both intangible and in some cases unique to the business, which might be: employment, cost center, shop order, etc.
33.43 Kelationship A rehationship is "an association between two or more entities which is of interest to the
enterprise". Anything that shows or sharpens a connection between two or more entities may be thought of as a relationship.
The associated entities may be of one or two types, but not more than two. A relationship type comprises "all the relationship occurences which fit a given definition" (figure 3-21). A relationship type does not denote direction. If one were to draw a parallel between relationship types and language the relationship type would be the verb and the two entity types the subject and predicate nominative noun In language these are reversible using a different verb constmetion (active and passive). In other words we could just as easily have reversed the relationship type to read and mean exactly the same thing.
Relationship type
{propriety type name} card min, card max card min, card max
Figure 3-21: The relationship content
We can introduce the concept of degree in relationship. This concept is called cardinality. It exists several possibilities of expression to describe this degree. We present the three main found
One to one: one entity of one entity type may have that relation type with one entity of
One to many: one entity of one entity type may have that relation type with one or more
Many to many: many entities of one entity type may have that relation type with one or
another or the same entity type,
entities of another or the same entity type,
more entity of another or the same entity type.

31
name name ~
32.43 The MERISE data models
has determined three different models corresponding to the level of details: There exists one model per abstraction level and per life cycle step. For “data analysis”, MERISE
The Conceptual Data Model (CDM) (figure 3-22),
The Log id Data Model (LDM) (figure 3-24),
The Physical Data Model (PDM).
To build the O M model we use the entity/relationship model ( f w r e 3-22). The first step consists in determining a list of the vocabulary used within the company. Then we compare all these “words“ between them to exclude all the synonymous, ...
/ Relationshiptype name
name J
name ./
entity-type name
Figure 3-22 The entityhelationship model
The list of purified vocabulary represents the list of the entity-types (example: the entity-type workstation). For each entity-type we determine the attributes which allow to specify the content of the entity-type (example: the attributes of the entity-type workstation can be: name, capacity, identification, ... ). The second step is the determination of the relationship between each entity. We establish a list of links and we give to each one a name. This list corresponds to the list of the relationship-type.
Manu orders Identification Priority Due date Article reference
Parts list
Route
Article mde
Date Description
Figure 3-23: Example of CDM

32
With these two lists, we build the first draft of the CDM. We indicate for each link the cardinality of the relation. Then step by step, the final version of the CDM (example: figure 3-23) is built and adjusted. The MERISE methodology provides some rules to build the first draft and to revise the CDM. In addition, a methodology step by step is also define.
The LDM is a modification and adaption of the CDM according to the technological constraints on data base or files. The LDM is an adaptation of the CDM to the existing technology in term of data bases and knowledge bases. At this level we make the choiees for the future structure of the data system. We have several possible choices according tn the existing technology: relational data bases, hierarchical, network, object, ...
SET TYPE 1 RECORD TYPE
Member
Figure 3-24: The Logical Data model
Once we get the final version of the CDM, a choice is made in the data base type we are going to use for this specific implementation. According to this choice, the LDM is build derived from the CDM. If we select for example a CODASYL Data base type we have to modi6 the CDM according to some rules (figure 3-24) t o build the corresponding LDM (see translation rules for MERISE-CDM into MERISE-LDM in the next section).
The PDM corresponde to the realization of data base. It is in fact the implementation of the data bases according to the specification defined in the LDM.
32.4.4 Translation rules for MERISE-CDM into MERISE-LDM The conceptual model has a too rich formalism to be translated into a data definition language of a
data base management system. We have to fit this conoeptual model according to the computer constraints without losing the signification of this model. To reach this objective, some formalism must be used to translate the CDM into the LDM.
The concepts of this logical internal formalism are: the field It is the smallest part of a named data (we can compare the field to a small file
the m r d : It is a named collection, without repetition of one or many field types (we part),
can compare the record to a file),

33
the set It is a qualified relation between a record type which is declared as set master and a record type which i u declared as member. It is a binary functional relation (we c a n compare a set to a data processing pointer).
The translation from an entity formalism structure to an equivalent structure in logical internal formalism is completely algorithmic. It is not a reversible translation. The translation rules are:
Rule 1:
Property: each property (or attribute) in the CDM becomes a field in the LDM.
Rule 2
I n d i v i d d each entity type in the CDM becomes a record type in the LDM.
Rule 3:
Binary relation 0,n-0,l or lp-0,l: all binary relations O,n-0,1 or 1.n-0.1 in the CDM become an optional set type in the LDM.
u Entity
0 Relation
Entity 4 Entity relationship
description
Record
Optional set R
Record
internal logical description
34
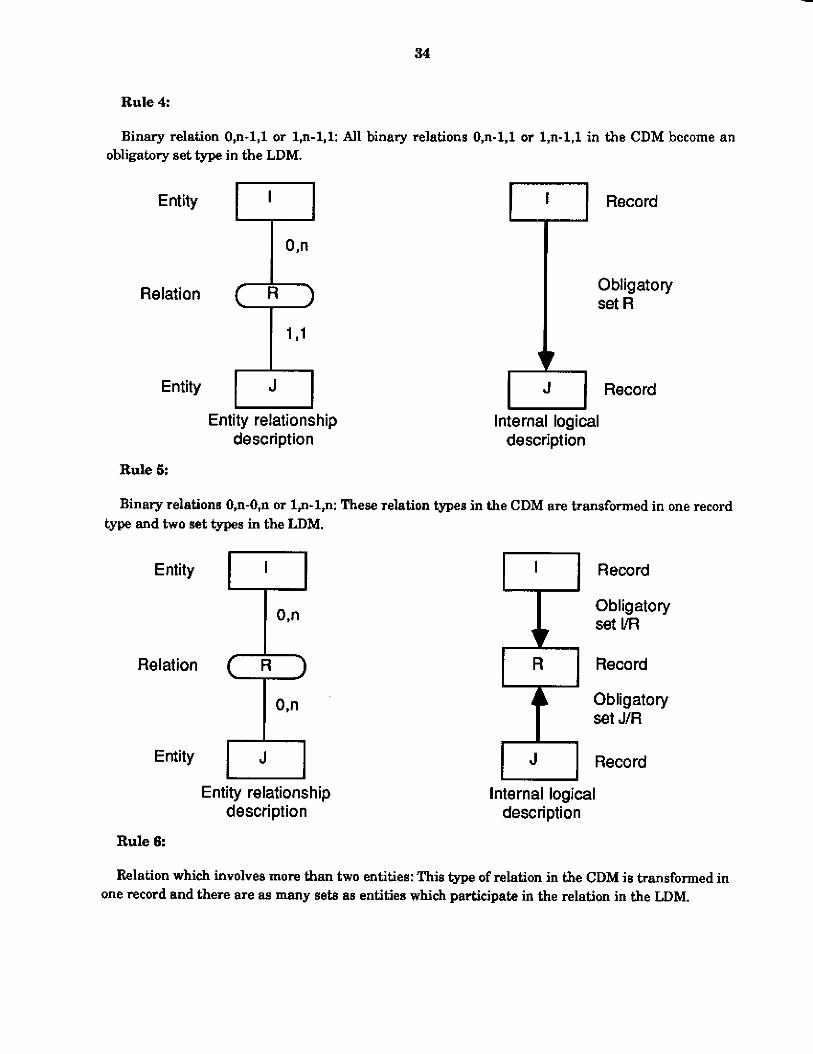
Rule 4:
Binary relation 0,n-1,l or 1,n-1,l: All binary relations 0,n-1,1 or 1,n-1,l in the CDM become an obligatory set type in the LDM
0 Entity
I 'I1
Entity
Entity relationship description
Record
Record
Internal logical description
Obligatory set R
Binary relations 0,n-0,n or la-1,n: These relation types in the CDM are transformed in one record type and two set types in the LDM.
Record
I OJl
0 Relation
Entity
Entity relationship description
Rule 6
Obligatory 1 Record
Obligatory set J/R
Record
Internal logical description
Relation which involves more than two entities: This type of relation in the CDM iS transformed in one record and there are as many sets as entities which participate in the relation in the LDM.

35
7 Entity Obligatory set I/R record
Relation
- J K J K I
-
Entity relationship description Internal logical description
3.2.5 A generic data model supporting a manufacturing organization In this section, we define a generic data model, using the entityhelationship modeling tool, which
can support manufacturing organization. This model is dedicated to the job shop type of manufacturing process. Based on this model, the decentralized subsystems can be derived. W e give an example of derivation for the supplying function.
Figure 3-25: Organizational model: data point of view

36
Figure 3-26 The supplying function conceptual data model
Figure 3-21: The logical data model derivation

37
The supplying function example (figure 3-26) shows the domain covered by this activity on the integrated model. Based on this domain, we defme the submodel derived (figure 3-27). This submodel needs to be a u s t e d in term of coherence, consistency and completeness. In figure 3-27, we adjust the conceptual submodel defmed as the basis of the logical data model of the supplying function. In figure 3-28, using the translation rules presented in the previous section, we determine the logical data model of the supplying function (in this example, we use the CODASYL standard).
Figure 3-28: The supplying function l o g i d data model
3.2.6 Coherence tools The two models we defme in the previous sections model a manufacturing organization according
different points of view. As they will both support the defmition of the corresponding decentralized system, they should be coherent. For that purpose, in this paragraph, we define two different coherence tools which ensure the mutual consistency of the GIM data model and of the GRAI decisional model:
The Dahkocess coherence tool, and
The F'roeessData coherence tool.
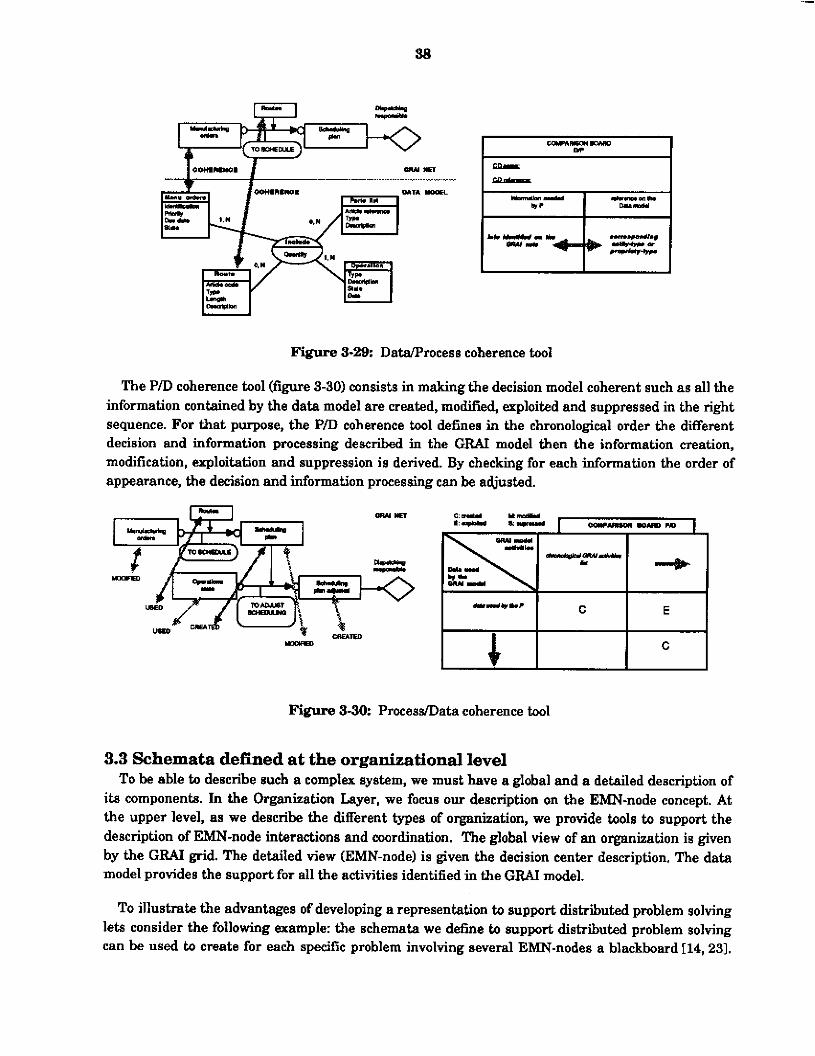
The D/P coherence tool (figure 3-29) consists in making the data model complete and coherent using the decisional model. The data model c ~ n t a i n ~ the entities and relationships which are supposed to be necessary for the running of the decision system. The D/P coherence tool creates for each decision process an external data model which represents the information necessary for that specific decision process. Then it checks the existence of all the entities and relationships of this external data model into the internal one (the GIM data model). This mechanism is applied to all the decision processes.
. - I - I
Figure 5-29: DaWrocess coherence tool
The P/D coherence tool (figure 3-30) consists in making the decision model coherent such as all the information contained by the data model are created, modified, exploited and suppressed in the right sequence. For that purpose, the P/D coherence tool defines in the chronological order the different decision and information processing described in the GR4I model then the information creation, modification, exploitation and suppression is derived. By checking for each information the order of appearance, the decision and information processing can be a4justed.
Figure 3-30: Procesflata coherence tool
3.3 Schemata defined at the organizational level To be able to describe such a complex system, we must have a global and a detailed description of
ita components. In the Organization Layer, we focus our description on the EMN-node concept. At the upper level, as we describe the different trpes of organization, we provide tools to support the description of EMN-node interactions and coordination. The global view of an organization is given by the GRAl grid. The detailed view (EMN-node) is given the decision center description. The data model provides the support for all the activities identified in the GRAI model,
To illustrate the advantages of developing a representation to support distributed problem solving lets consider the following example: the schemata we define to support distributed problem solving can be used to create for each specific problem involving several EMN-nodes a blackboard 114,231.

39
For example, if a problem to be solved involves three different Em-nodes, they will all have a local blackboard dedicated to that problem. Each time one of the three agents will modify something in its local blackboard, modifications (or updates) will be sent to the two other blackboards (of the two other EMN-nodes). Each EMN-node will have one blackboard per antagonistic task and among the decentralized system, for a specific antagonistic task, there will be a8 many blackboards as involved ET”-nodes (figure 3-31). These blackboards can be build according to the organization model and data model we define at this layer. The updating mechaniim will support the adjustment of the shared blackboard data structure.
Figure 5-31: Example of task decomposition
In the previous paragraph and in figure 331, we define coordination and negotiation protocol as a basis for our distriiuted problem solving architecture, this in addition with the schemata describing the decentralized organization and the task blackboards. These protocols can be viewed as generic rules to follow for negotiating and coordinating decentralized EMN-nodes. These protocols should be general and must cover a class of problems instead of being too precise and restrictive. Our idea for the coordination layer is to define generic protocols which can allow agents to start working and to add learning mechanisns so that the protocols can be impmved during their execution. As an example of generic protocol, we can refer to [441. In this paper, a protocol for distributed scheduling system is presented Distributed scheduling k a process carried out by a group of agents each of which has (a) limited knowledge of the environment, (b) limited knowledge of the constraints and intentions of other agents, and (c) limited number and amount of resources that are required to produce a system solution. Some of these resources may be shared among many agents. Global system solutions are arrived at by interleaving of local computations and information exchange among the agents. There is no single agent with a global system view.
The multi-agent communication protocol is as follows: I. Each agent determines rquired resources by checking t b proceaa plana for the orders it has to
schedule. It sands a message to each monitoring agent (as npecified in a table of monitoring agent) informing it that it wi l l be umng shared reBsourcea.
11. Each agent ca ldatea its demand pmiile for the resourcan (local andsharedl that it needs.
40
111. Each agent determines whether itrr new demand prdles differ significantly fmm the ones it sent previously for shared resources. If its demand has changed, an agent will send it to the monitoring agent.
aggregde demand to all agents which share the re80urce7. IV. The monitoring agent combines all agent demnde when they a n received and communicates the
V. Each agent uses the mwt recent aggregate demand it has received to find @ most critical remudtime-interval pair and its mwt critical activity (the one with the greatest demand on this re8ouI'ce for this time interval). Since agents in genaral need to we a resource for different time intervals, the most critical activity and time interval for a resource Hill in general ba different for different agents. The agent onnmunicates this reservation requsst to the r e m e ' s monitoring agent and awaits a response.
VI. The monitoring agent. upon receiving these reservation requests, check# the resource calendar for resourc~ availability. There are two oases:
1.If the resouroe is available for the requested time interval, the monitoring agent (a) communicates "Reservation OK" to the requesting agent, (b) marks the reservation on the r e m m calendar, and (c) mmmunicates the resewation to all mncerned agents (i.e. the agents that had Bent positive demands on the resource).
2. If the resource had already been reserved for the requested interval, the request is denied. The agent whaee rques t was denied will then attempt to substitute another reserration, if any others are feasible, or otherwise perform backjumping.
VII. Upon receipt of a massage indicating its request WBB granted, an agent will perform consistency checking to determine whether any constraint violations have occurred If nom are detected, the agent pm~eeds to step lI. Otherwise, backjumping occurs with undoing of reservations until a search state is reached which does not cause mnstraint violations. Any reservations which were undone during this phase am communicated to the monitor for distribution to other agents. ARer a consistent state is reached, the agent pmceeds to step 11.
The system terminates when all activities of all agents have been scheduled Backtracking, with this version of the protocol, is based on the following design decisions: 1) Once an agent has been granted a reservation, this reservation is not automatically undone when some other agent who had to backtrack now needs the reserration. This can lead to situations where one agent solves i t6 local scheduling problem but the other agent cannot due to unresolvable constraint violations. 2) If an agent backtracks, it frees up resources but the reservation of other agents on these resources remain as they were. This policy may result in non-optimal reservation for other agents since it denies the other agents greater opportuniiy to take advantage of the canceled reservations of the backtracking agent, but it results in less computationally intensive performance.
At the Organization Layer, we must structure an organization. The grid schema supports such a description. It partially specifies the decision center, the modules, the data-modules and the links between them. The distinction is made between decisional and informational links. Both are supported by schemata. The grid provides the global view ofthe organization we want to structure. This model will be the basis in the definition of the decentralized EMN-nodes. The granularity of this model is the decision center. This graphical tool produced from the GRAI method[361, supported by a Bchema, describes the main characteristic8 of the decision system of this specific organization. It shows the l inks between the EMN-nodes, as well as those with the environment of the system. It provides a decisional and global description of the organization.

41
Description
Schema3-1: Grid
Value: typestring* Restriction:
Grid SLOT I FACET I VALUE
Goals
Has-modules
I Value: typestring I Name Restriction: I
Value: type goal*
Value: type decision-center* Restriction:
Restriction:
I Is-a I Restriction: I model I
Restrktion. Decision-levels
Restriction: Decision-centers
Restriction: Decisional-links Value:
Restriction: Informational-links Value:
Restriction:
type strine
type Oloriwdperiod~
type decision-center-name*
type decision-frame*
type informational-link*
The x-axis of the GRAI grid is composed by a set of functions. Each function can be described by an instance of the schema 3-2. This schema defines the goals and decision centers composition of each function. In addition, a description of the purpose of each function is provided.
SchemaS-2 Function
Function SLOT I FACET I VALUE
Value: -string I Name 1 Restriction: I
The y-axis of the GRAI grid is defined by a set of decision levels. A decision level is a pair (horizon, period). We describe each decision level by an instance of the schema 3-3. Each decision level schema includes the value of the pair WP and also an identifier which is generaly determined according to the following rules:
Each decision level is identified by a multiple of 10.
The decision levels are classifled by decreasing period. At equivalent period, the decision levels are classified by decreasing horizon.
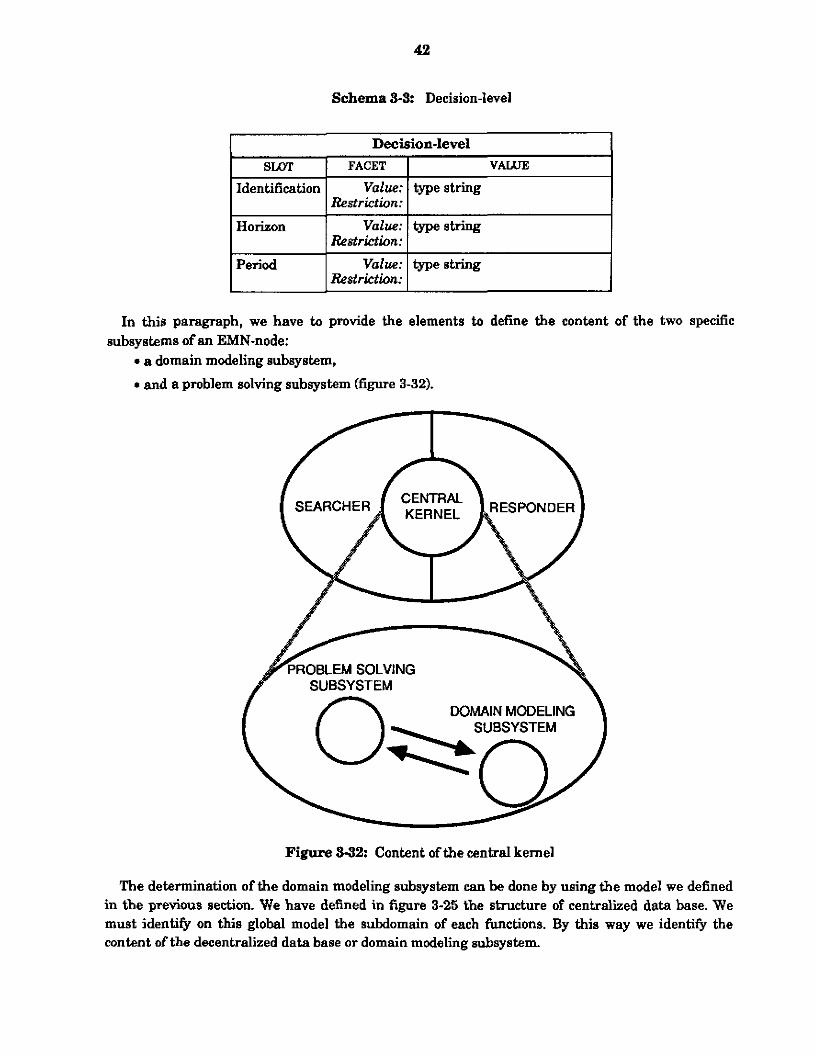
Schema 3-3 Decision-level
SLOT FACET
Identification Value: Restriction:
Horizon Value: Restriction:
Period Value: Restriction:
VALUE type string
-string
typestring
I SEARCHER .f
ROBLEM SOLVING SUBSYSTEM
DOMAIN MODELING SUBSYSTEM
Figure 5-32: Content ofthe central kernel
The determination of the domain modeling subsystem can be done by using the model we defined in the previous section. We have defined in figure 3-25 the structure of centralized data base. We must identify on this global model the subdomain of each functions. By this way we identify the content of the decentralized data base or domain modeling subsystem.

43
To complete this work we must reorganize the elements of the subdomain (figures 3-26, 3-27 and 3-28 shows an example for the supplying function) to have the "best" and more efficient organization in a decentralized utilization.
For the problem solving subsyatem, we have to build in the same way a decentralized structure able to have an autonomous running and capability to react to the perturbations related to the subdomain.
We can start our description with the centralized process model (figure 3-19) and to define the subdomain. We have to identie the elements of the decentralized problem solving subsystem. We must have a hierarchical decomposition to be able to respect the coordination aspect of an EMN- node. We have seen previously that several criteria can be used to split up such a global structure into a set of decentralized elemenb. To follow the hierarchical view of the grid, we can split up the problem solving subsystem into several hierarchical levels (figure 3-33).
DECISION DECISION DEClSlON DECISION CENTER CENTER CENTER CENTER
ACTlVrrY ACTWrrY ACTlVllY
Figure 33% Problem-solving hierarchical levels
For each of these elements, we can build a schema defining their charasteristics and content. The first element is the function. A function represents a column of the grid (figure 3-25). A function is composed of several decision centers. A decision center is a 'box'' of the grid. It is in fact the intersection of a h c t i o n and a decision level (WP level). A decision center can be split up into several activities. Each activity can be define as an object. We can identify two kind of activities: the decision activities and the execution activities.
A decision activity implies a choice. This choice is done according to some rules or knowledge rules. For each choice, we have to respect a local-goal and our choice is done by determining the value of decision variables.
An execution activity is a calculus, an information processing we can define by an algorithm.
All these elements (EMN-nodes, Function, Decision center, Activity, Decision activity and execution activity) are objects. For all these objects, we can build a schema. If we want to implement this structure into knowledge craft, we must identify the schemata of auch a structure. Figure 3-34 provides an overview of these schemata.
The basic element of the organization level is the EMN-node. As an EMN-node is responsible for a specific task, we represent it as a decision center. The concept of decision center comes from the
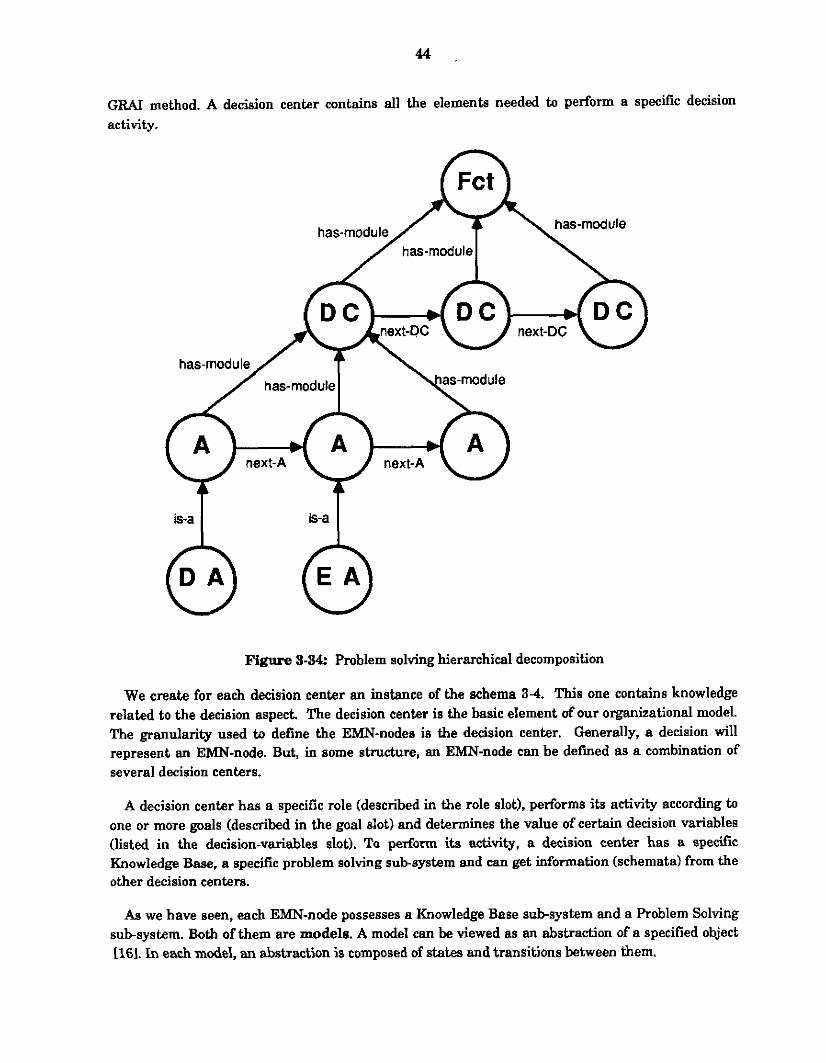
44
GRAI method. A decision center mntains all the elements needed to perform a specific decision activity.
has-module
/ has-modulel
Figure 3-54: Problem solving hierarchical decomposition
We create for each decision center an instance of the schema 3-4. “ h i 8 one contains knowledge related to the decision aspect. The decision center is the basic element of our organizational model. The granularity used to define the EMN-nodes i8 the decision center. Generally, a decision will represent an EMN-node. But, in some structure, an EMN-node can be defmed as a combination of several decision centers.
A decision center has a specific role (described in the role slot), performs its activity according to one or more goals (described in the goal slot) and determines the value of certain decision variables (listed in the decision-variables slot). To perform its activity, a decision center has a specific Knowledge Base, a specific problem solving subsystem and can get information (schemata) from the other decision centers.
As we have seen, each EMN-node possesses a Knowledge Base subsystem and a Problem Solving subsystem. Both of them are models. A model can be viewed as an abstraction of a specified object [IS]. In each model, an abstraction is composed of states and transitions between them.
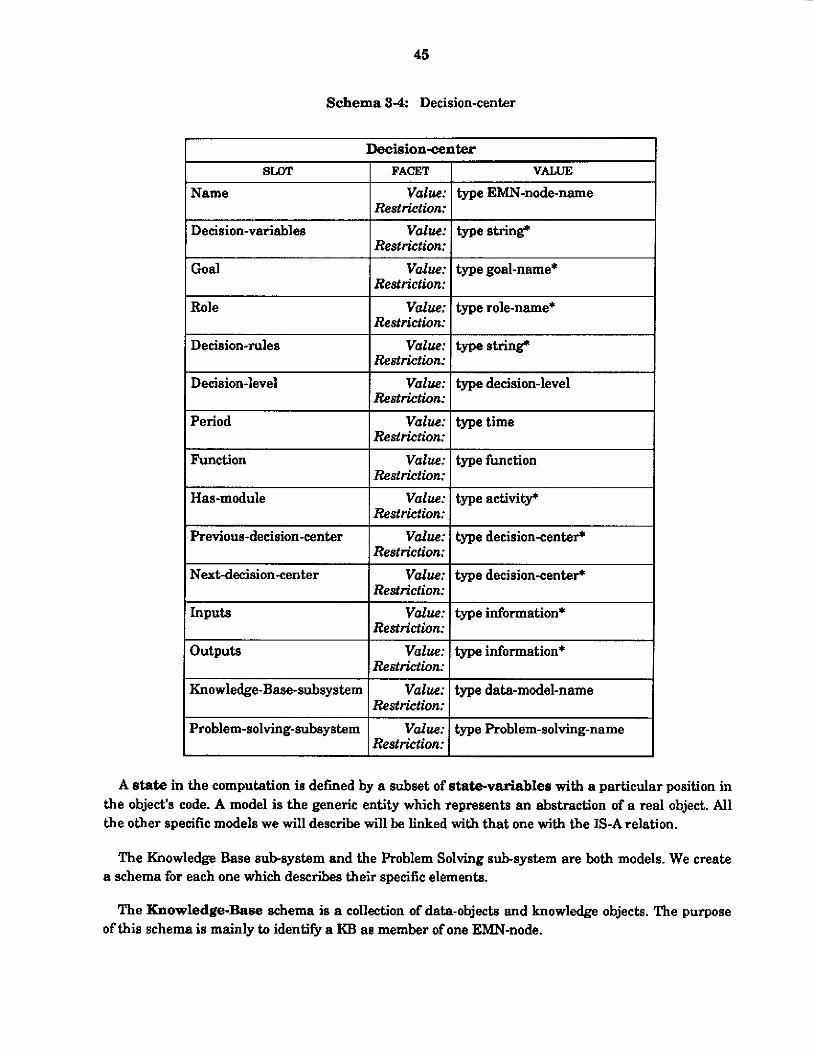
45
Schema 5-4: Decision-center
Problem-solving-subsystem Valrre: type Problem-solving-name Restriction:
A state in the computation in defmed by a subset of statevariables with a particular position in the object’s code. A model is the generic entity which represents an abstraction of a real object. All the other specific models we will describe will be linked with that one with the IS-A relation.
The Knowledge Base sub-system and the Problem Solving sub-system are both models. We create a schema for each one which describes their specific elements.
The Knowledge-Base schema is a collection of data-objecb and knowledge objects. The purpose of this schema is mainly to identify a KB as member of one EMN-node.

46
I Is-a I Restriction: I model
Schema 3-5: Model
I
Model 8 M T I FACET I VALUE I
I Name I value: typestring Restriction: I
Value: typestring I Restriction: I I Value: typestring Restriction: I Value: type string I Abstraction Restriction:
Schema 3-6: Knowledge-Base
Knowledge-Base SLOT I F A W I VALUE
I Name 11s-a I Restriction: I model I
I I Value: type knowledgeobject* 1 Knowledge-objects I Restriction:
Each knowledge-object is also described by a schema which defines its content, attributes and relations with the other knowledge-objects. The Knowledgeobject schema describes a specific piece of data or a specific piece of knowledge in an EMN-node (We can identify this piece of data as a schema or as a rule).
Schema 3-7: Knowledge-object
Knowledgeobject SLOT I FACET I VALUE 1 Value: typestring I Name Restriction: I
Value: typestring' I Description I Restriction: I 1 Attributes I Vdue: type (name, value [, value, ... I)* Restriction:
I Value: type (knowledge-obj ect-name, cardinaliQ+* I For the problem solving subsystem, we use the first schema: Problem-solving. This schema IS-A
model, and it describes the procedures specific to an EMN-node. Each procedure is also defined as a
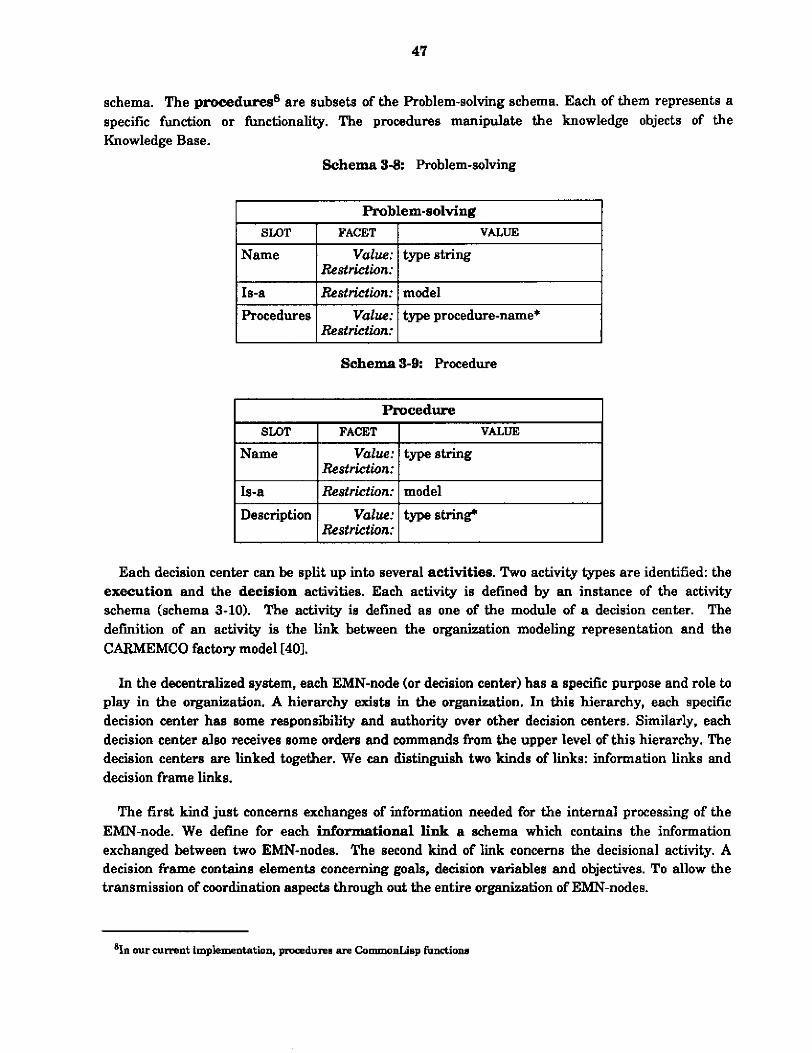
47
Is-a Procedures
schema. The procedures* are subsets of the Problem-solving schema. Each of them represents a
specific function or functionality. The procedures manipulate the knowledge objects of the Knowledge Base.
Schema 3-8: Problem-solving
Restriction: model
Restriction: Value: type procedure-name*
I Problem-solving I 1 S M T I FACET I VALUE I I Value: typestring I Name Restriction: I
Schema 3-B hocedure
Pmcedure VALUE I
Is-a I Restriction: I model I
Each decision center can be split up into several activities. Twa activity types are identified: the execution and the decision activities. Each activity is defined by an instance of the activity schema (schema 3-10). The activity is defmed as one of the module of a decision center. The defmition of an activity is the link between the organization modeling representation and the CARMEMCO factory model C401.
In the decentralized system, each EMN-node (or decision center) has a specific purpose and role to play in the organization. A hierarchy exists in the organization. In t h i g hierarchy, each specific decision center has some responsiiility and authority over other decision centers. Similarly, each decision center also receives some orders and commands from the upper level of this hierarchy. The decision centers are linked together. We can distinguish two kinds of links: information links and deeision frame l inks.
The first kind just concerns exchanges of information needed for the internal processing of the EMN-node. We define for each informational Link a schema which contains the information exchanged between two EMN-nodes. The second kind of link concerns the decisional activity. A decision frame contains elements concerning goals, decision variables and objectives. To allow the transmission of coordination aspects through out the entire organization of =-nodes.

48
Name
Input
output
Description
Previous-activity
Next-activity
Schema 3-10 Activity
Value: typestring
Value: typedata*
Value: type data'
Value: typestring*
Value: type activity*
Value: type activity*
Restriction:
Restriction:
Restriction:
Restriction:
Restriction:
Restriction:
Activity SUYE I FACET I VALUE I
Algorithm Value: typestrinp Restriction:
Schema 3-11: Decision-activity
Decision-activity SUYE I FACET I VALUE
I Name Value: type string I Restriction: I
Decision-variables Restriction:
Schema 3-12: Execution-activity
Execution-activity SLOT I FACET I VALUE
I Name Restriction: I is-a I Restriction: I activity I
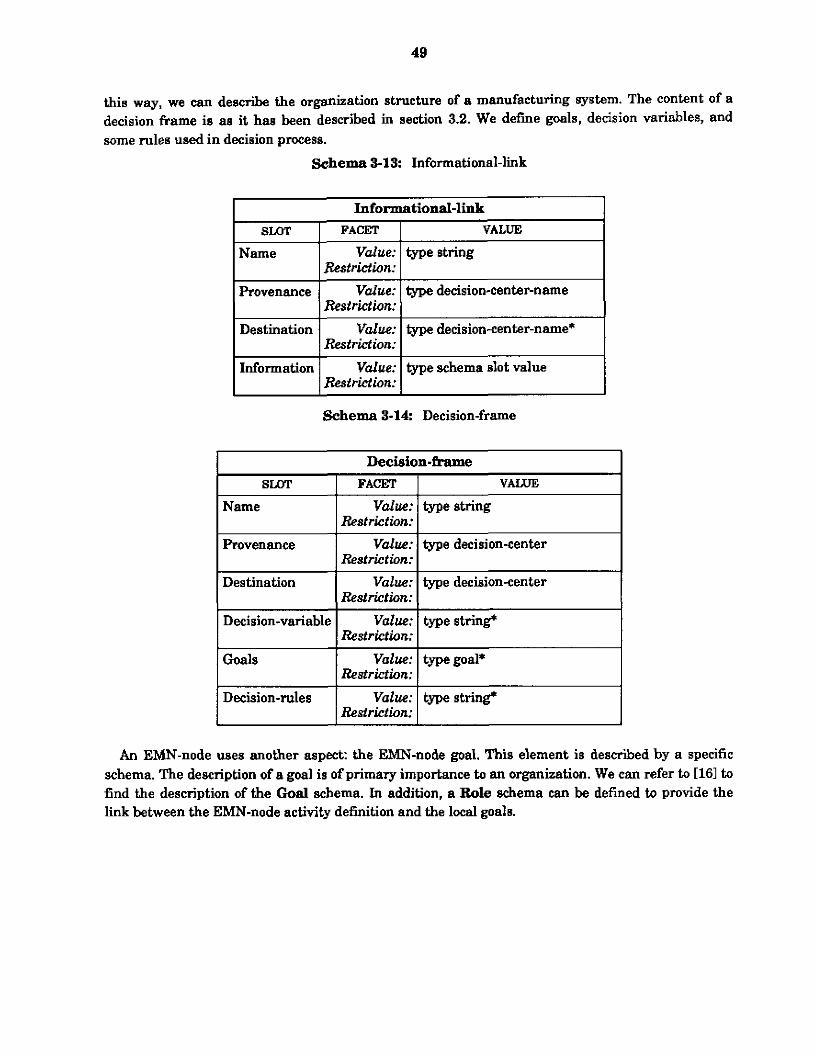
49
SMT FACET
this way, we can describe the organization structure of a manufactuting system. The content of a decision frame is as it has been described in section 3.2. We define goals, decision variables, and some rules used in decision process.
Schema 3-15: Informational-link
VALUE
Informational-link
Name
Provenance
Destination
Value: typestring
Value: type decision-center-name
Value: type decision-center-name*
Restriction:
Restriction:
Restriction:
Name
PrOVenanW
Destination
Decision-variable
Goals
Decision-rules
I Information I Value: I type schema slot value I
Value: typestring
Value: type decision-center
Value: type decision-center
Value: type string*
Value: type goal*
Value: type str ing
Restriction:
Restriction:
Restriction:
Restriction:
Restriction:
Resirktion:
Schema 3-14: Decision-frame
Decision-frame s m I FACET I VALVE
An EMN-node uses another aspect: the --no& goal. This element is described by a specific schema. The description of a goal is of primary importance to an organization. We can refer to [161 to find the description of the Goal schema. In addition, a Role schema can be defined to provide the link between the EMN-node activity definition and the local goals.
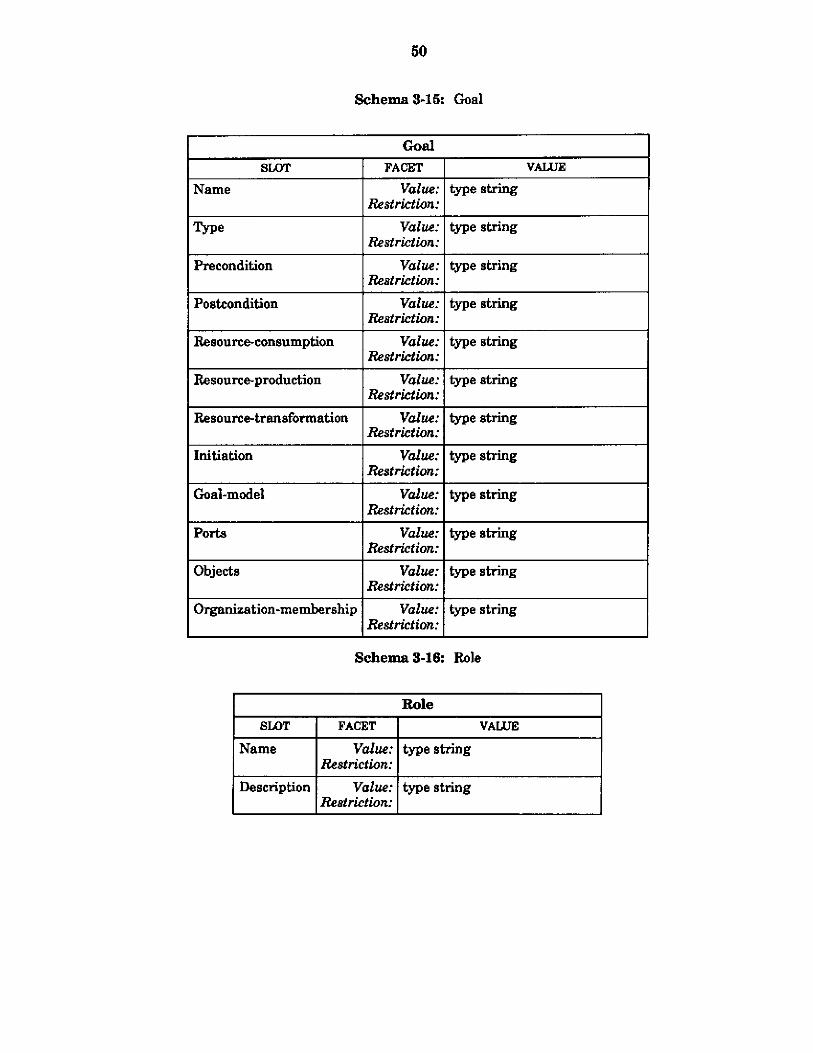
50
Name
Description
Schema3-15: Goal
Value: type string
Value: type string Restriction:
Restriction:
SLOT
Name
Type
Precondition
Postcondition
Resource-consumption
Resource-production
Resource-transformation
Initiation
Goal-model
Ports
Objects
Organization-membership
Goal FACET I VALUE
Value: typestring Restriction:
Value: typestring Restriction:
Value: typestring Restriction:
Value: typestring Restriction:
Value: typestring Restriction:
Value: typeatring Restriction:
Restriction: Value: typestring
Restriction: I
Restriction:
SchemaS-16 Role
Role SLOT I FACET I VAWE

51
3.4 Example In this example, we define the hierarehied structure of the planning function. The figure 3-35
provides a global view of this structure and establishes the link between the generic schemata defined in the previous section and their instantiation for the planning function.
Figure SSS: Problem solving hierarchical decomposition example
Then, we define the content of some schemata part of this hierarchical structure. We present the content of the load planning decision center. We detailed its content by defining two of its activities: "to-deted-problems" and "to-solve-problems".
( PLa"ING-E"CTION INSTANCE: S'unction
DESCRIPTION: B A S I C - m S : P a d R and T GMLS: to satisfy due-date and delay of the customers FRIENDS : 1 - Rasource-ldanagsment function
NAME: P l a n n i n g to synchronize the manufacturing activity
2 - Product-Management function 3 - Engineering function
BAS-MODULES: PP, MPS, LP, S, AS, D. 1
PI?: Production Plan blpS: Master Production Schedule Ip: Load Planning S: Schedule AS: Adjust Schedule D: Dispatch
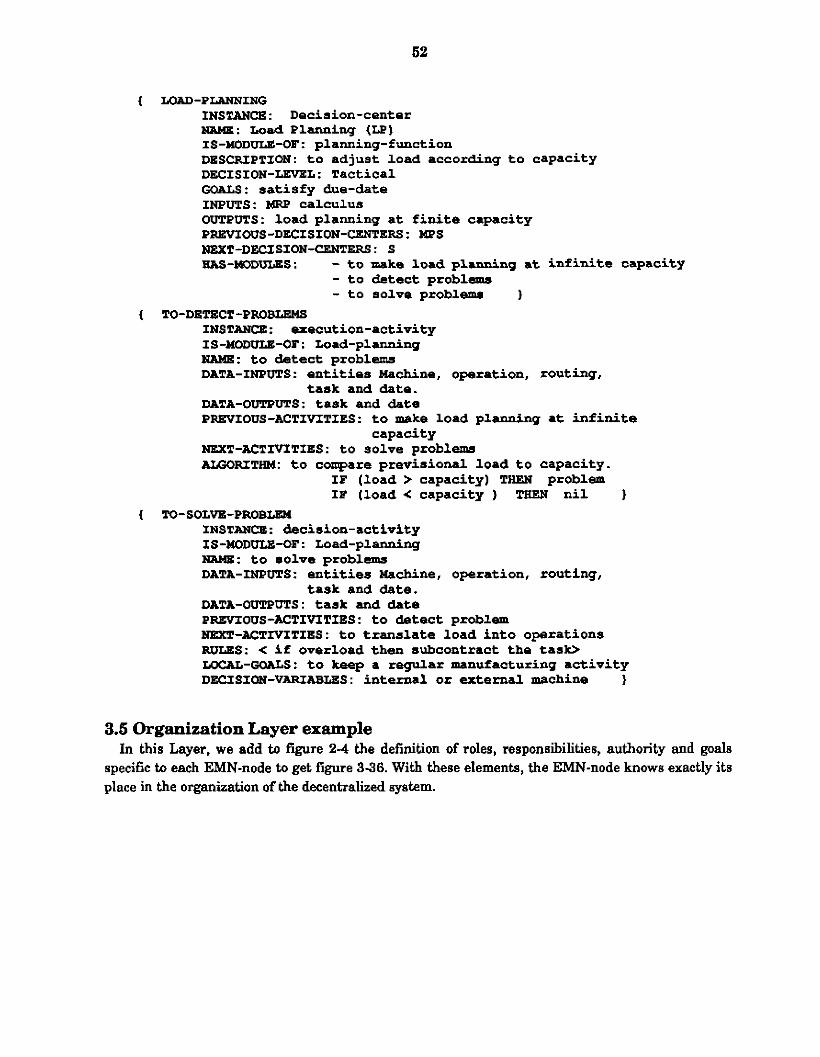
( --PLANNING INSTANCE: Decision-center -: LoadPlanning (LP) IS-MODUI.E-OF: planning-function D E S ~ P T I O N : to adjust load according to capacity DECISION-LEVEL: Tactical GQALS: satisfy due-date INPUTS: lQcp calculus OUTPUTS: load planuing at finite capacity PREVIOUS-DECISION-CENTERS: ldpS NEXT-DECISION-CENTERS : S BAS-WD-S : - to make load planning at infinite capacity
- to detect problem8 - to solve problarm )
( TO-DETECT-PROBLEMS INSTANCE: erecution-activity IS-bIODULE-OP: Load-planning HA14g: to detect problems DATA-INPUTS: entities &chine, operation, routing,
task and date. DATA-OUTPUTS: task and date PREVIOUS-ACTIVITIES: to make load pl- at infinite
capacity NEXT-ACTIVITIES: to solve problems IUI;ORITHld: to compare previsional load to Capacity.
IF (load 7 capacity) THEN problem IP (load < capacity ) THEN nil 1
( TO-SOLVE-PROBLpd( INSTANCE: decision-activity
HAMg: to solve problema DATA-INPUTS: entities Machine, operation, routing,
task and date. DATA-OUTPUTS: task and date
~XT-ACTMTIES: to translate load into operations IIULES: < if overload then subcontract the t a s D LOCAL-MIILS: to keep a regular manufacturing activity DECISION-VARIABLES: internal OX external machine I
IS-MODWLE-OF: Load-planning
PREVIOUS-ACTIVITIES: to detect probla
3.5 Organization Layer example In this Layer, we add to figure 2-4 the definition of roles, responsibilities, authority and goals
specific to each EMN-node to get figure 3-36. With these elements, the I?"-node knows exactly its place in the organization of the decentralized syskm.
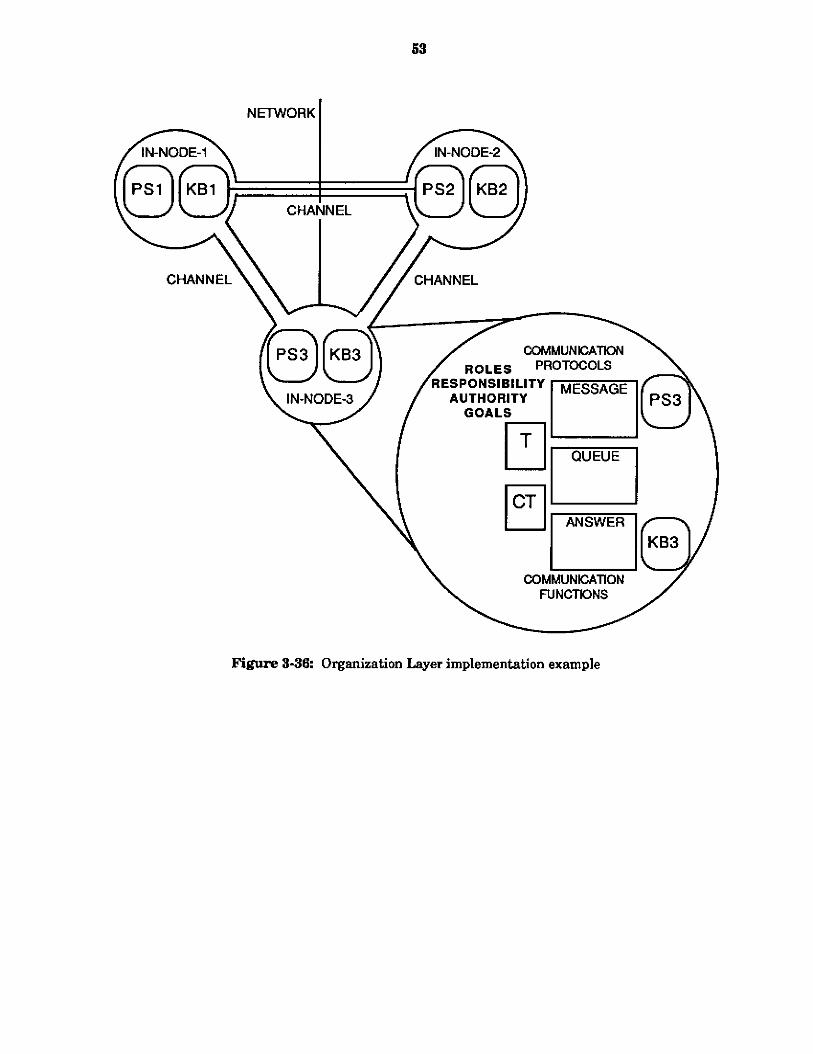
Figure 3-36 Organization Layer implementation example

54
4. Conclusion The Enterprise Management Network is designed to facilitate the integration of heterogeneous
functions distributed geographically. Integration is supported by having the network first play a more active role in the accessing and communication of information, and second by providing the appropriate protmols for the distribution, coordination and negotiation of tasks and outcomes.
As described in this paper, the Organization Layer plays a central role in the EMN architecture. It is the connection between a real manufacturing environment and its implementation as a multi- agents system. This layer is also a platform for the negotiation and coordination activities between antagonistic EMN-nodes. The different mechanisms defined in the three first layers of the architecture provide the support for distributed knowledge base but also for all types of communication. They are instantiated according to the EMN-nodes identified a t the Organization layer. In addition, the organization model provides conceptual links betwen the EMN-nodes and identifies interactions between them in order to make them solve antagonistic problems. The resolution of distributed problem solving is done by applying the coordination and negotiation protocols defined at the Coordination Layer according to the identified EMN-node interactions on the organization model. The schemata we define a t this layer are the main elements to support distributed problem solving. The way we intend to use them is presented a t the Coordination Layer.

55
Acknowledgement We would like to thank the CORTES and CARMEMCO project members which have contributed
through their comments to the development of this Enterprise Management Network Architecture.
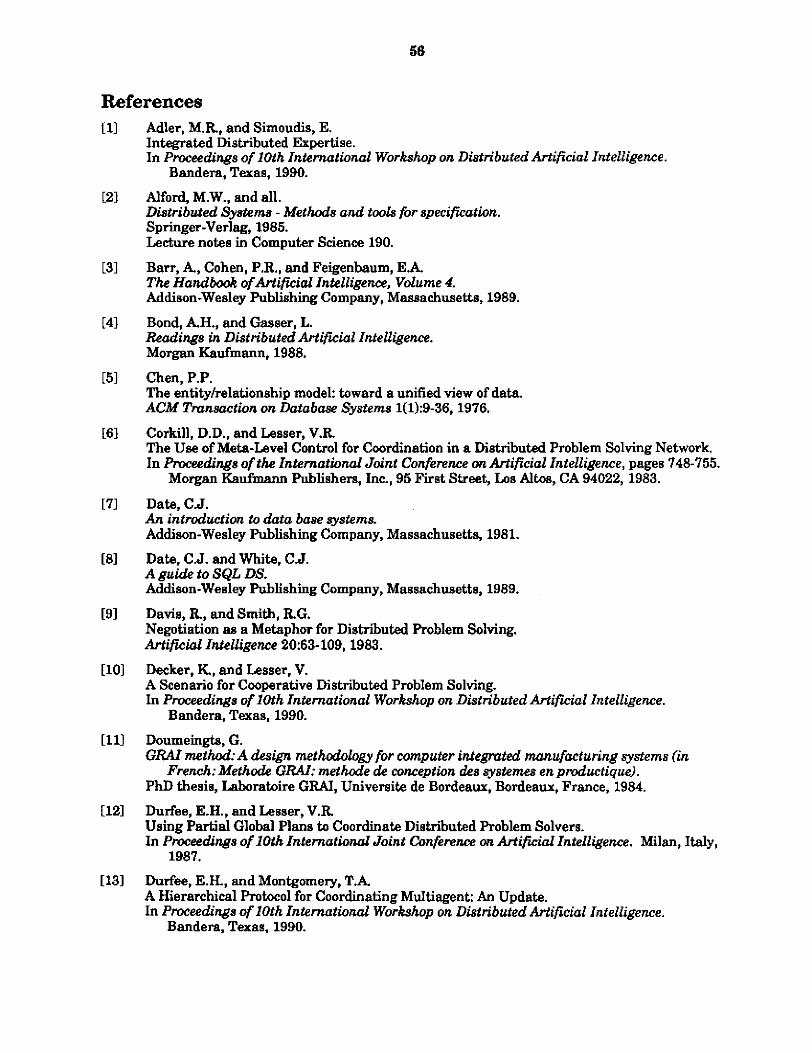
56
References Adler, M.R., and Simoudis, E. Integrated Distributed Expertise. In Proceedings of loth International Workshop on Distributed Artificial Intelligence.
Alford, M.W., and all. Distributed Systems - Methods and t& for specification. Springer-Verlag, 1985. Lecture notes in Computer Science 190.
Barr, A, Cohen, P.R., and Feigenbaum, E A The Handbwk ofArtificia1 Intelligence, Volume 4. Addison-Wesley Publishing Company, Massachusetts, 1989.
Bond, AH., and Gasser, L. Rendings in DistributedArtifi'iiuI Intelligence. Morgan Kaufmann, 1988.
Chen, P.P. The entity/relationship model: toward a unified view of data. ACM Tmnsaction on Database Systems 1(1):9-36,1976.
Corkill, D.D., and Lesser, V.R The Use of Meta-Level Control for Coordination in a Distributed Problem Solving Network. In Proceedings of the Intenrational Joint Conference OR Artificial Intelligence, pages 748-755.
Date, C.J. An introduction io data base systems. Addison-Wesley Publishing Company, Massachusetts, 1981.
Date, CJ. and White, C J. Aguide to SQL DS. Addison-Wesley Publishing Company, Massachusetts, 1989.
Davis, R, and Smith, RG. Negotiation as a Metaphor for Distributed Problem Solving. ArtifiiaJ Intelligence 20:63-109,1983.
Decker, K, and Lesser, V. A Scenario for Cooperative Distributed Problem Solving. In Pmceedings of loth International Workshop on Distributed Artif'iial Intelligence.
Bandera. Texas, 1990.
Doumeingts, G. GRAI method: A design methodology for computer integrated manufacturing systems (in
PhD thesis, Laboratoire G M , Universite de Bordeaux, Bordeaux, France, 1984.
Durfee, E.H., and Lesser, V.R. Using Partial Global Plans to Coordinate DiHtributed Problem Solvers. In Pmcedings of 10th Internatwnal Joint Conference on Artifiid Intelligence. Milan, Italy,
Durfee, E.H., and Montgomery, T.A. A Hierarchical Protocol for Coordinating Multiagent An Update. In Proceedings of 10th International Workshop on Distributed Artificial Intelligence.
Bandera, Texas, 1990.
Morgan Kaufmann Publishers, Inc., 95 First Street, Los Altos, CA 94022,1983.
French: Methode G W : meihade de conception des 8ystemes en pductique).
1987.
Bandera, Texas, 1990.
67
[171
[I81
[I91
[201
[221
Engelmore, R., and Morgan, T. Black bwrd Systems. Addison-Wesley, 1988.
Erkes, K, and Clark, M. Pub& do&n rep02 number 1. Technical Report, ESPRIT Project 418, Open CAM System, April 1987.
Fox, M.S. Organization Sfructui-ing: Designing Lorge, Compler Sofiware. Technical Report CMUcS79-155, Computer Science Depadment, Carnegie Mellon
Fox, M.S. An Organizational View of Distributed Systems. IEEE Transactions on Systems, Man, and Cybernetics SMC-ll(l):70-80,1981.
University, 1979.
Fox, M.S., and Sycara, K Overview of the CORTES projeet: a Constraint Based Approach to Production Planning,
Scheduling and Control.
Operations Management. , May, 1990. Proceedings of the Fourth Internutionul Conference on Expert Systems in Production and
Submitted for publication.
Gasser, L, and Huhns, M.N. Distributed ArtifKial Intelligence, Volume II. F'itman Publishing BC Morgan Kaufmann Publishers, 1989.
Gasser, L, Braganza, C., and Herman, N. MACE: A Flexible Testbed for Distributed AI Research. In Michael N. Huhns (editor), Disfributedhffiial InfeUigence, chapter 5, pages 285-310.
Hayes-roth, F. Towards a framework for distriiuted AI.
Pitman Publishing BE Morgan Kaufinann Publishers, 1987.
1980 In: Randy DaviB Ed, Report on the workshop on distributed AI, SIGART Newsletter.
F. Hayes-Roth and V.R Lesser. Focus of Attention in a Distributed Logic Speech Understanding System. In Promdings ofthe Iniernational Joint Conference on Arfificial InieUigence, pages 27-35.
Hayes-Roth, B. A Blackboard Architecture for Control. Artifmial Intelligence 26,1985.
Huhns, M.N. Distributed Artifkid Intelligence. Pitman Publishing BC Morgan Kaufmann Publishers, 1987.
Huhns, M.N., Bridgeland, M.L., and Ami, N.V. A DAI Communication Aide. In Proceedings of 10th International Workshop on Distributed Artificial Intelligence.
Bandera, Texas, 1990.
Hynynen, NJ . A framework for coordination in distributedproductim management. PhD thesis, Acta Polytechnica Sandinavica, Helsinky, Finland, 1988.
1977.
68
1271
[28l
[291
L301
[3 11
1321
[331
[341
[351
[361
[371
[381
[391
[401
Klein, M. Supporting Conflict Resolution in Cooperative Design Systems. In Proceedings of 10th International Workshop on Distributed Artificial Intelligence.
Knowledge Craj? Camegie Group Inc, Five PPG place, Pittsburgh PA 15222,1985.
Bandera, Texas, 1990.
Lesser, V.R Cooperative Distributed Problem Solving and Organization Self-Design. SIGARTNewsletier :46, October, 1980.
Meleze, J. Appmhes systemiques des organisatwm. Pans, Editions hommes et techniques, 1979.
Mullender, S. Distributed System. ACM Press, New York, N.Y., 1989.
Panse, R CIM-OSA - A vendor independent CIM architecture. In Proceedings of CIMCON '90, pages 177-196. Gaithersburgh, MD 20899,1990.
Parunak, H.V.D. Toward a Formal Model of Inter-Agent Control. In Pmedings of loth International Workshop on Distributed Artificial Intelligence.
Ram, S., Carlson, D., and Jones, k Distributed Knowledge Based Systems for Computer Integrated Manufacturing. In Proceedings ofCIMCON '90, pages 334352. Gaithersburgh, MD 20899,1990.
Raboam, M., Doumeingts, G., Dittman, K, and Clark, M Public domain report number 2. Technical Report, ESPRIT Project 418, Open CAM System, October 1987.
Roboam, M. Rqerence ncwIelp wd analysis methodologies integmtion for the design of manufacturing
systems (in French: Mcdeles de reference et integmtion des methodes d'annlyse pour lo conceptwn des systemes de pruduction).
Bandera, Texas, 1990.
PhD thesis, Laboratoire GRAI, Universite de Bordeaux, Bordeaux, France. 1988.
Raboam, M., Zanettin, M., and Pun, L. GM-IDEFO-MERISE (GIM): integrated methodology to analyse and design manufacturing
In Computer-Integmted Manufacturing Systems, Volume 2 Number 2, pages 82-98. PO box
Fhboam, M., Fox, M.S., and Sycara, K Enterprise Management Network Architecture - Distributed Knowledge Base support. Technical Report CMU-RI-TR-90-21, CIMDS, Camegie Mellon University, Pittsburgh, PA,
Fhboam, M., and Fox, M.S. Distributed communication eyatem: user manual. Technical Report, CIMDS, Carnegie Mellon University, Pittsburgh, PA, 1990.
Sathi, A, Fox, M.S., and Greenberg, M. Representation of Activity Knowledge for Project Management. IEEE, Tmnsoctions on Pattern analysis and Machine Intelligence : 531-552,1985.
systems.
63, Westbury house, Bury street, Guilford, GU2 5BH, UK, 1989.
1990.

1451
Simon, H.A Model of man. John Wiley, 1957.
Simon, H.A The science ofthe artificial. Cambridge, Massachuasets, The MIT Press, 1969.
Sycara, K Resolving Goal Conflicts via Negotiation. In Proceedings ofthe Seventh National Conference on Artificial Intelligence IAAAT-881. 1988.
Sycara, K., Roth, S., Sadeh, N., and Fox, M.S. Distributed hoduction Control. In Pmceedings ofthe Fourth International Conference on Expert Systems in Production and
Sycara, K and Roboam, M. Intelligent Information Infrastructure for Group Decision and Negotiation Support of
In Pmceedinga ofthe 24th Hawaii International Conference on System Sciences. 1991,
Negotiation Planning: An AI Approach. European Journal of Operational Research (46):216-234,1990.
Tardieu, H., Rochfeld, A, and Colletti, R. La methale Merise, principes et orctils. Paris, Le8 editions $Organisation, 1983.
Tardieu, H., W e l d , A, Colletti, R., Panet, G.. and Vahee G. La methale Merise, demai-che etpmtiques. Paris, Les editions #Organisation, 1985.
atli, A. M y s e et commande des systemes complexes, Todouse, Cepadues Editions, 1979.
Operations Management. 1990.
Concurrent Engineering.
Sycara, K.