Enterprise Anti-Virus Protection - Dennis Technology Labs
19
Enterprise Anti-Virus Protection JULY - SEPTEMBER 2012 Dennis Technology Labs www.DennisTechnologyLabs.com This report aims to compare the effectiveness of anti-malware products provided by well-known security companies. The products were exposed to internet threats that were live during the test period. This exposure was carried out in a realistic way, closely reflecting a customer’s experience. These results reflect what would have happened if a user was using one of the products and visited an infected website. EXECUTIVE SUMMARY Products tested Kaspersky Endpoint Security for Windows McAfee VirusScan, HIPs and SiteAdvisor Microsoft System Center Endpoint Protection Symantec Endpoint Protection Trend Micro OfficeScan and Intrusion Defense Firewall A wide range of protection is available to enterprise-level organizations. Products from major international vendors protected against between 80 to 99 per cent the threats used. The Symantec and Kaspersky products were the strongest, while Microsoft’s enterprise anti-malware product was the least effective. Blocking malicious sites based on reputation is an effective approach. The products that prevented users from visiting the malicious sites in the first place gained a significant advantage. If the malware can’t download onto the victim’s computer then the anti-malware software faces less of an ongoing challenge. Some anti-malware programs are too harsh when evaluating legitimate software Microsoft’s product was the only one to handle all of the legitimate software correctly. Symantec Endpoint Protection came second, warning against installing two applications. Trend Micro’s product was the harshest, warning against one program and actively blocking 14. Which was the best product? The most accurate program was Symantec Endpoint Protection, which scored nearly maximum points in this test. It is the only product to win a AAA award. Kaspersky Endpoint Security for Windows comes second, winning an A award. A combination of McAfee’s VirusScan, HIPs and SiteAdvisor modules achieved a C award. Simon Edwards, Dennis Technology Labs, 12 th October 2012
Transcript of Enterprise Anti-Virus Protection - Dennis Technology Labs

Enterprise Anti-Virus Protection
JULY - SEPTEMBER 2012
Dennis Technology Labs
www.DennisTechnologyLabs.com
This report aims to compare the effectiveness of
anti-malware products provided by well-known
security companies.
The products were exposed to internet threats
that were live during the test period. This
exposure was carried out in a realistic way, closely
reflecting a customer’s experience.
These results reflect what would have happened if
a user was using one of the products and visited an
infected website.
EXECUTIVE SUMMARY
� Products tested
� Kaspersky Endpoint Security for Windows
� McAfee VirusScan, HIPs and SiteAdvisor
� Microsoft System Center Endpoint Protection
� Symantec Endpoint Protection
� Trend Micro OfficeScan and Intrusion Defense
Firewall
� A wide range of protection is available to enterprise-level organizations.
Products from major international vendors protected against between 80 to 99 per cent the threats used.
The Symantec and Kaspersky products were the strongest, while Microsoft’s enterprise anti-malware
product was the least effective.
� Blocking malicious sites based on reputation is an effective approach.
The products that prevented users from visiting the malicious sites in the first place gained a significant
advantage. If the malware can’t download onto the victim’s computer then the anti-malware software
faces less of an ongoing challenge.
� Some anti-malware programs are too harsh when evaluating legitimate software
Microsoft’s product was the only one to handle all of the legitimate software correctly. Symantec Endpoint
Protection came second, warning against installing two applications. Trend Micro’s product was the
harshest, warning against one program and actively blocking 14.
� Which was the best product?
The most accurate program was Symantec Endpoint Protection, which scored nearly maximum points in
this test. It is the only product to win a AAA award. Kaspersky Endpoint Security for Windows comes
second, winning an A award. A combination of McAfee’s VirusScan, HIPs and SiteAdvisor modules
achieved a C award.
Simon Edwards, Dennis Technology Labs, 12th October 2012

Enterprise Anti-Virus Protection, July - September 2012 Page 2 of 19
CONTENTS
Executive summary .................................................................................................................................................................... 1
Contents ....................................................................................................................................................................................... 2
1. Total Accuracy Ratings ......................................................................................................................................................... 3
2. Protection Ratings ................................................................................................................................................................. 5
3. Protection Scores .................................................................................................................................................................. 7
4. Protection Details .................................................................................................................................................................. 8
5. False Positives ......................................................................................................................................................................... 9
6. The Tests ............................................................................................................................................................................... 13
7. Test Details ........................................................................................................................................................................... 14
8. Conclusions ........................................................................................................................................................................... 17
Appendix A: Terms Used ....................................................................................................................................................... 18
Appendix B: FAQs .................................................................................................................................................................... 19
Document version 1.1. Edited 17th October 2012: Corrected test period dates and one false positive result
for Kaspersky Endpoint Security for Windows.
Document version 1.2. Edited 18th October: Removed data for Symantec .Cloud; removed SMB table from
false positive results; replaced SMB table for Protection Details with the correct Enterprise table.
Enterprise Anti-Virus Protection, July - September 2012 Page 3 of 19
1. TOTAL ACCURACY RATINGS
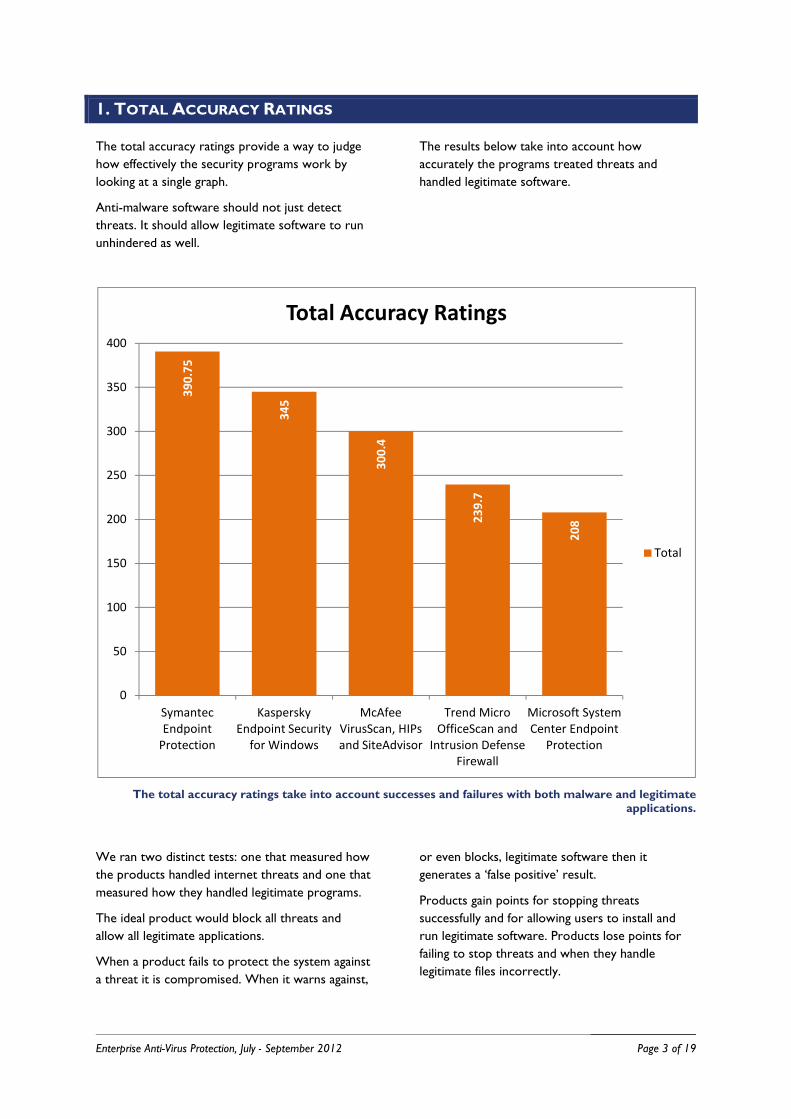
The total accuracy ratings provide a way to judge
how effectively the security programs work by
looking at a single graph.
Anti-malware software should not just detect
threats. It should allow legitimate software to run
unhindered as well.
The results below take into account how
accurately the programs treated threats and
handled legitimate software.
The total accuracy ratings take into account successes and failures with both malware and legitimate applications.
We ran two distinct tests: one that measured how
the products handled internet threats and one that
measured how they handled legitimate programs.
The ideal product would block all threats and
allow all legitimate applications.
When a product fails to protect the system against
a threat it is compromised. When it warns against,
or even blocks, legitimate software then it
generates a ‘false positive’ result.
Products gain points for stopping threats
successfully and for allowing users to install and
run legitimate software. Products lose points for
failing to stop threats and when they handle
legitimate files incorrectly.
39
0.7
5
34
5
30
0.4
23
9.7
20
8
0
50
100
150
200
250
300
350
400
Symantec
Endpoint
Protection
Kaspersky
Endpoint Security
for Windows
McAfee
VirusScan, HIPs
and SiteAdvisor
Trend Micro
OfficeScan and
Intrusion Defense
Firewall
Microsoft System
Center Endpoint
Protection
Total Accuracy Ratings
Total
Enterprise Anti-Virus Protection, July - September 2012 Page 4 of 19
Each product then receives a final rating based on
its performance in each of the ‘threat’ and
‘legitimate software’ tests.
The following results show a combined accuracy
rating, taking into account each product’s
performance with both threats and non-malicious
software.
There is a maximum possible score of 400 and a
minimum of -1,000.
See 5. False Positives on page 9 for detailed results
and an explanation on how the false positive
ratings are calculated.
TOTAL ACCURACY RATINGS
Product Total Accuracy Rating
Symantec Endpoint Protection 390.75
Kaspersky Endpoint Security for Windows 345
McAfee VirusScan, HIPs and SiteAdvisor 300.4
Trend Micro OfficeScan and Intrusion Defense Firewall 239.7
Microsoft System Center Endpoint Protection 208
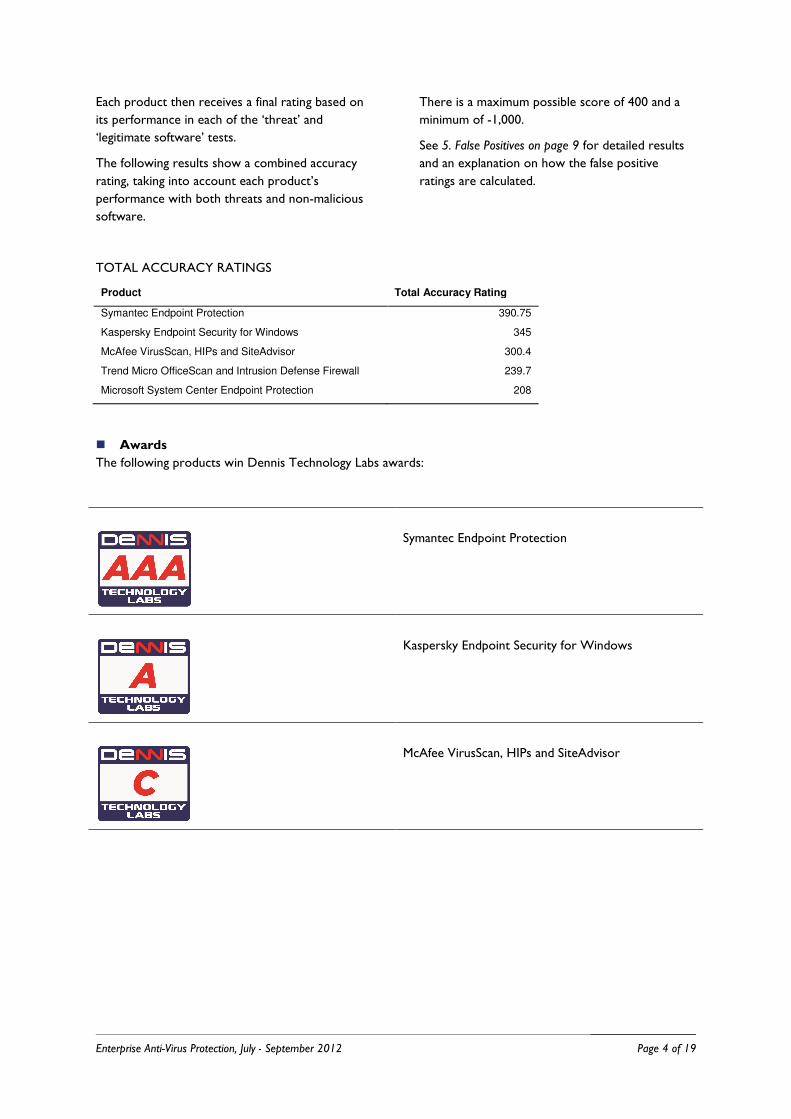
� Awards
The following products win Dennis Technology Labs awards:
Symantec Endpoint Protection
Kaspersky Endpoint Security for Windows
McAfee VirusScan, HIPs and SiteAdvisor
Enterprise Anti-Virus Protection, July - September 2012 Page 5 of 19
2. PROTECTION RATINGS
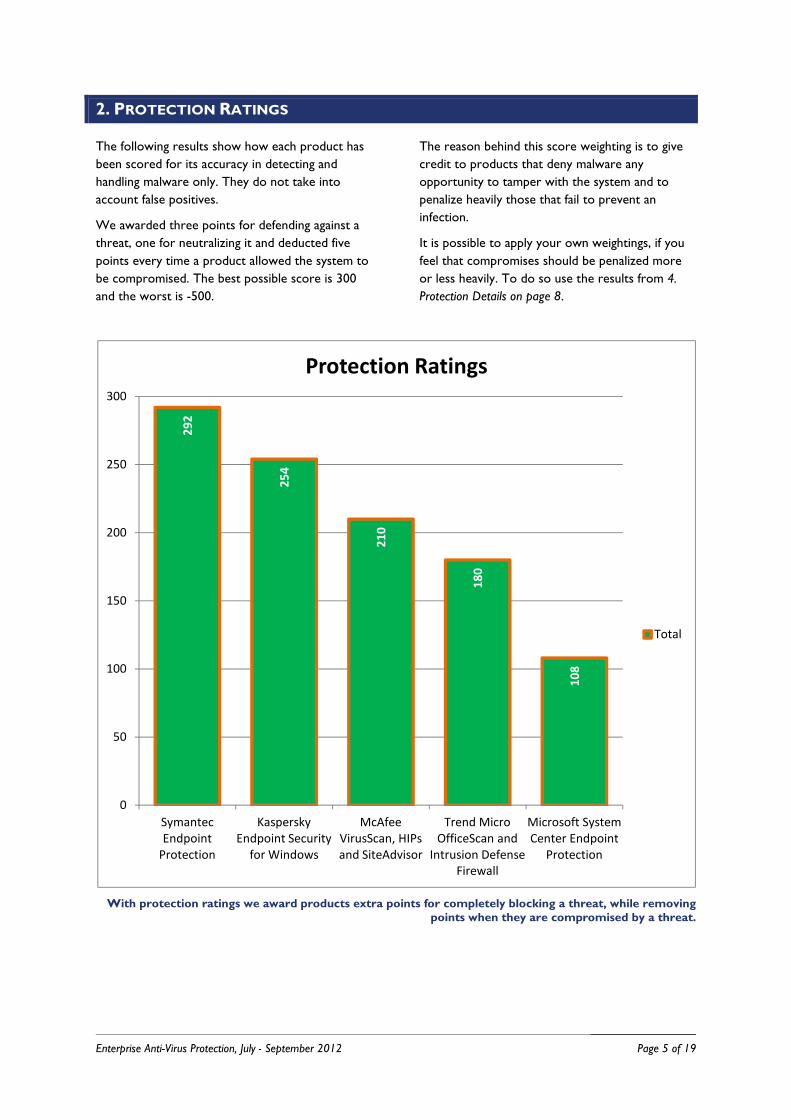
The following results show how each product has
been scored for its accuracy in detecting and
handling malware only. They do not take into
account false positives.
We awarded three points for defending against a
threat, one for neutralizing it and deducted five
points every time a product allowed the system to
be compromised. The best possible score is 300
and the worst is -500.
The reason behind this score weighting is to give
credit to products that deny malware any
opportunity to tamper with the system and to
penalize heavily those that fail to prevent an
infection.
It is possible to apply your own weightings, if you
feel that compromises should be penalized more
or less heavily. To do so use the results from 4.
Protection Details on page 8.
With protection ratings we award products extra points for completely blocking a threat, while removing points when they are compromised by a threat.
29
2
25
4
21
0
18
0
10
8
0
50
100
150
200
250
300
Symantec
Endpoint
Protection
Kaspersky
Endpoint Security
for Windows
McAfee
VirusScan, HIPs
and SiteAdvisor
Trend Micro
OfficeScan and
Intrusion Defense
Firewall
Microsoft System
Center Endpoint
Protection
Protection Ratings
Total
Enterprise Anti-Virus Protection, July - September 2012 Page 6 of 19
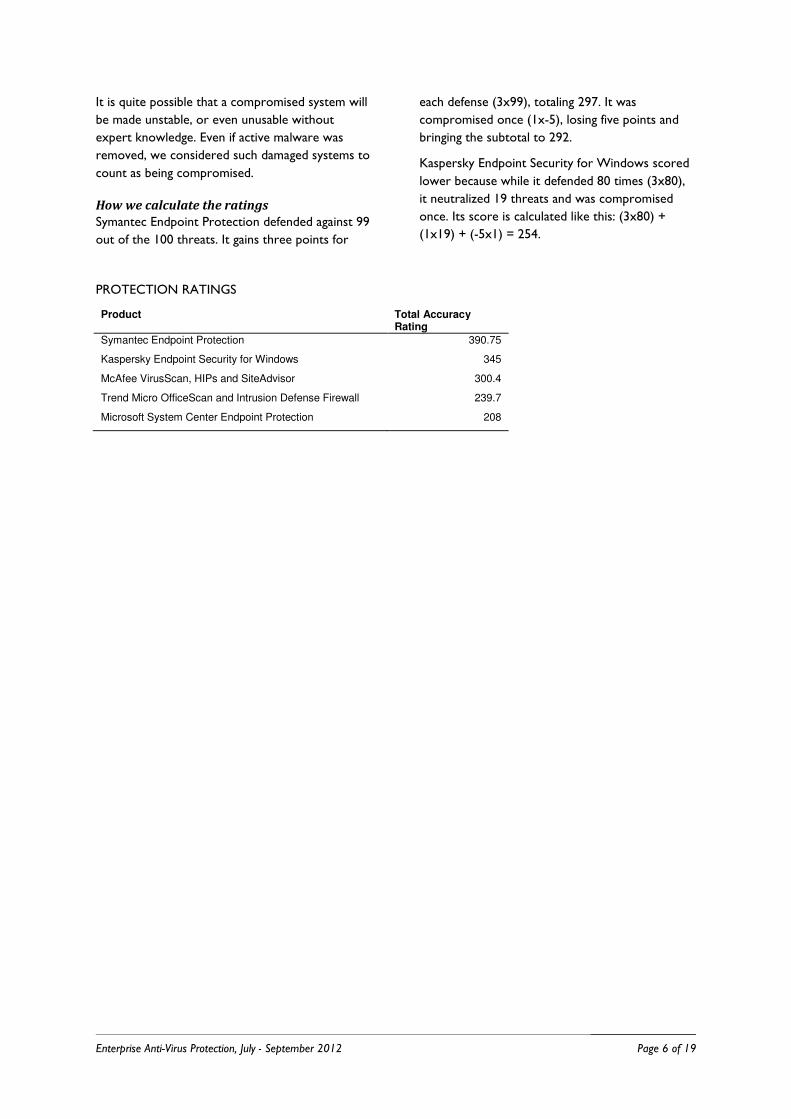
It is quite possible that a compromised system will
be made unstable, or even unusable without
expert knowledge. Even if active malware was
removed, we considered such damaged systems to
count as being compromised.
How we calculate the ratings
Symantec Endpoint Protection defended against 99
out of the 100 threats. It gains three points for
each defense (3x99), totaling 297. It was
compromised once (1x-5), losing five points and
bringing the subtotal to 292.
Kaspersky Endpoint Security for Windows scored
lower because while it defended 80 times (3x80),
it neutralized 19 threats and was compromised
once. Its score is calculated like this: (3x80) +
(1x19) + (-5x1) = 254.
PROTECTION RATINGS
Product Total Accuracy Rating
Symantec Endpoint Protection 390.75
Kaspersky Endpoint Security for Windows 345
McAfee VirusScan, HIPs and SiteAdvisor 300.4
Trend Micro OfficeScan and Intrusion Defense Firewall 239.7
Microsoft System Center Endpoint Protection 208
Enterprise Anti-Virus Protection, July - September 2012 Page 7 of 19
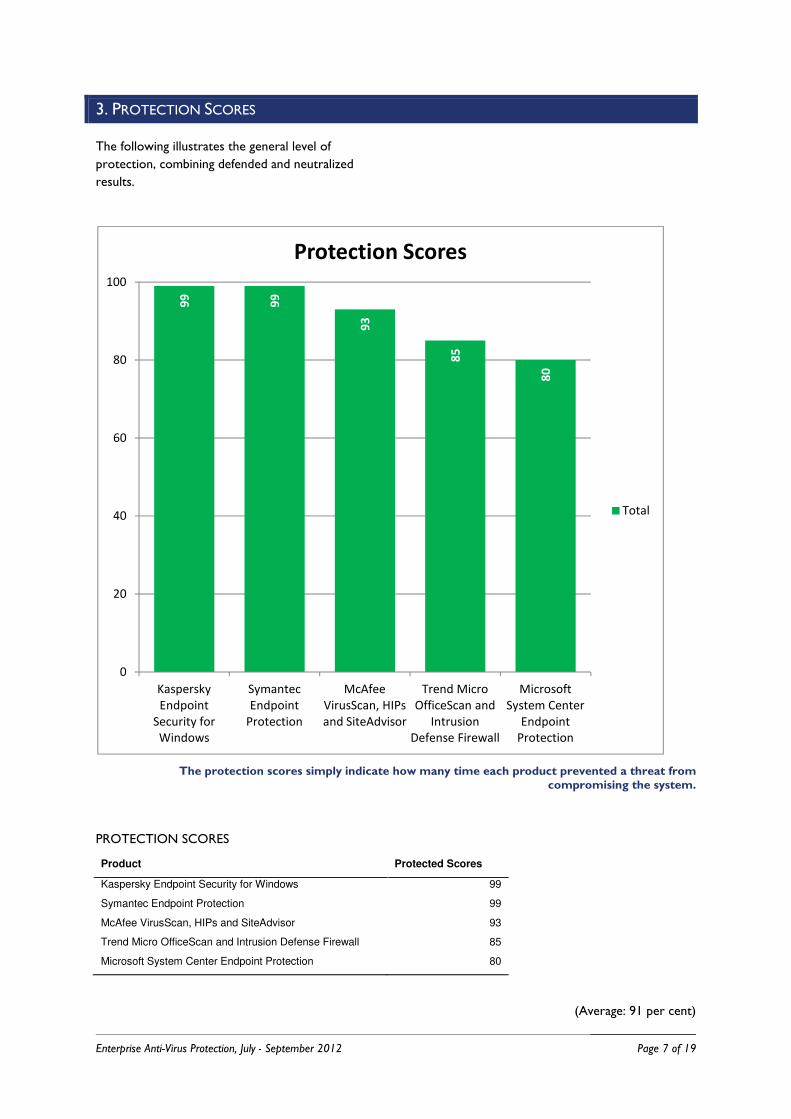
3. PROTECTION SCORES
The following illustrates the general level of
protection, combining defended and neutralized
results.
The protection scores simply indicate how many time each product prevented a threat from compromising the system.
PROTECTION SCORES
Product Protected Scores
Kaspersky Endpoint Security for Windows 99
Symantec Endpoint Protection 99
McAfee VirusScan, HIPs and SiteAdvisor 93
Trend Micro OfficeScan and Intrusion Defense Firewall 85
Microsoft System Center Endpoint Protection 80
(Average: 91 per cent)
99
99
93
85
80
0
20
40
60
80
100
Kaspersky
Endpoint
Security for
Windows
Symantec
Endpoint
Protection
McAfee
VirusScan, HIPs
and SiteAdvisor
Trend Micro
OfficeScan and
Intrusion
Defense Firewall
Microsoft
System Center
Endpoint
Protection
Protection Scores
Total

Enterprise Anti-Virus Protection, July - September 2012 Page 8 of 19
4. PROTECTION DETAILS
The security products provided different levels of
protection. When a product defended against a
threat, it prevented the malware from gaining a
foothold on the target system. A threat might have
been able to exploit or infect the system and, in
some cases, the product neutralized it either after
the exploit ran or later. When it couldn’t the
system was compromised.
The products are ordered according to their Defended and Compromised results, and then alphabetically. For overall protection scores see 3. Protection Scores on page 7.
PROTECTION DETAILS
Product Sum Defended Sum Neutralized Sum Compromised
Symantec Endpoint Protection 99 0 1
Kaspersky Endpoint Security for Windows 80 19 1
McAfee VirusScan, HIPs and SiteAdvisor 76 17 7
Trend Micro OfficeScan and Intrusion Defense Firewall 85 0 15
Microsoft System Center Endpoint Protection 64 16 20
0
20
40
60
80
100
Symantec
Endpoint
Protection
Kaspersky
Endpoint Security
for Windows
McAfee
VirusScan, HIPs
and SiteAdvisor
Trend Micro
OfficeScan and
Intrusion
Defense Firewall
Microsoft System
Center Endpoint
Protection
Protection Details
Sum Compromised Sum Neutralized Sum Defended
Enterprise Anti-Virus Protection, July - September 2012 Page 9 of 19
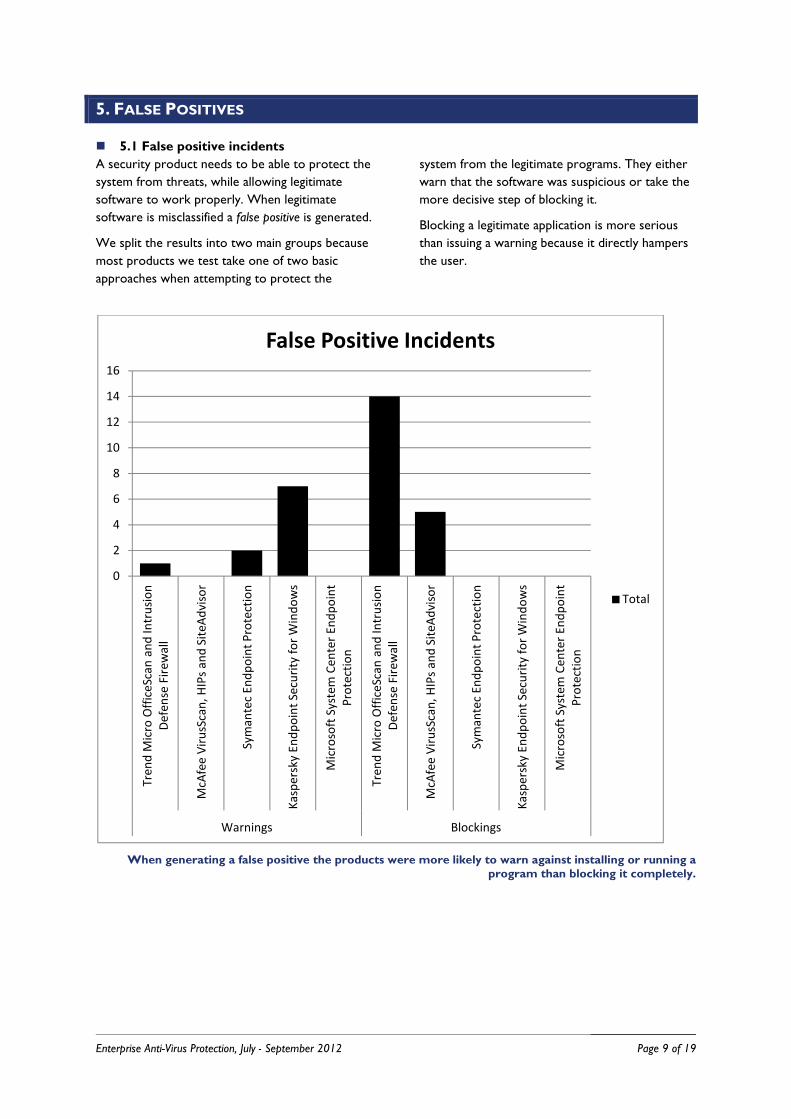
5. FALSE POSITIVES
� 5.1 False positive incidents
A security product needs to be able to protect the
system from threats, while allowing legitimate
software to work properly. When legitimate
software is misclassified a false positive is generated.
We split the results into two main groups because
most products we test take one of two basic
approaches when attempting to protect the
system from the legitimate programs. They either
warn that the software was suspicious or take the
more decisive step of blocking it.
Blocking a legitimate application is more serious
than issuing a warning because it directly hampers
the user.
When generating a false positive the products were more likely to warn against installing or running a program than blocking it completely.
0
2
4
6
8
10
12
14
16
Tre
nd
Mic
ro O
ffic
eS
can
an
d I
ntr
usi
on
De
fen
se F
ire
wa
ll
McA
fee
Vir
usS
can
, H
IPs
an
d S
ite
Ad
vis
or
Sy
ma
nte
c E
nd
po
int
Pro
tect
ion
Ka
spe
rsk
y E
nd
po
int
Se
curi
ty f
or
Win
do
ws
Mic
roso
ft S
yst
em
Ce
nte
r E
nd
po
int
Pro
tect
ion
Tre
nd
Mic
ro O
ffic
eS
can
an
d I
ntr
usi
on
De
fen
se F
ire
wa
ll
McA
fee
Vir
usS
can
, H
IPs
an
d S
ite
Ad
vis
or
Sy
ma
nte
c E
nd
po
int
Pro
tect
ion
Ka
spe
rsk
y E
nd
po
int
Se
curi
ty f
or
Win
do
ws
Mic
roso
ft S
yst
em
Ce
nte
r E
nd
po
int
Pro
tect
ion
Warnings Blockings
False Positive Incidents
Total

Enterprise Anti-Virus Protection, July - September 2012 Page 10 of 19
FALSE POSITIVE INCIDENTS
False Positive Type Product Total
Warnings Trend Micro OfficeScan and Intrusion Defense Firewall 1
McAfee VirusScan, HIPs and SiteAdvisor 0
Symantec Endpoint Protection 2
Kaspersky Endpoint Security for Windows 7
Microsoft System Center Endpoint Protection 0
Blockings Trend Micro OfficeScan and Intrusion Defense Firewall 14
McAfee VirusScan, HIPs and SiteAdvisor 5
Symantec Endpoint Protection 0
Kaspersky Endpoint Security for Windows 0
Microsoft System Center Endpoint Protection 0
� 5.2 Taking file prevalence into account
The prevalence of each file is significant. If a
product misclassified a common file then the
situation would be more serious than if it failed to
detect a less common one. That said, it is usually
expected that anti-malware programs should not
misclassify any legitimate software.
The files selected for the false positive testing
were organized into five groups: Very High Impact,
High Impact, Medium Impact, Low Impact and Very
Low Impact.
These categories were based on download
numbers as reported by sites including
Download.com at the time of testing. The ranges
for these categories are recorded in the table
below:
FALSE POSITIVE PREVALENCE CATEGORIES
Impact categoryImpact categoryImpact categoryImpact category PrevalencePrevalencePrevalencePrevalence (downloads in the previous week)(downloads in the previous week)(downloads in the previous week)(downloads in the previous week)
Very High Impact >20,000
High Impact 1,000 – 20,000
Medium Impact 100 – 999
Low Impact 25 – 99
Very Low Impact < 25
Enterprise Anti-Virus Protection, July - September 2012 Page 11 of 19
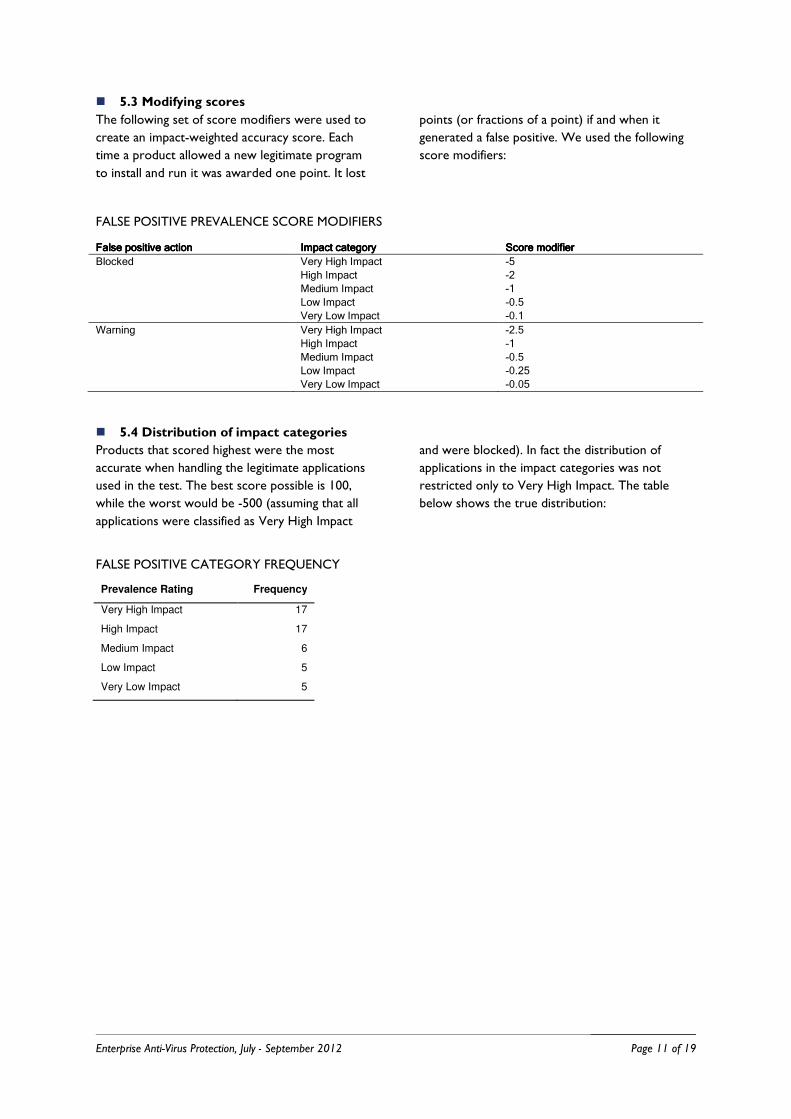
� 5.3 Modifying scores
The following set of score modifiers were used to
create an impact-weighted accuracy score. Each
time a product allowed a new legitimate program
to install and run it was awarded one point. It lost
points (or fractions of a point) if and when it
generated a false positive. We used the following
score modifiers:
FALSE POSITIVE PREVALENCE SCORE MODIFIERS
False positive actionFalse positive actionFalse positive actionFalse positive action Impact categoryImpact categoryImpact categoryImpact category Score modifierScore modifierScore modifierScore modifier
Blocked Very High Impact -5
High Impact -2
Medium Impact -1
Low Impact -0.5
Very Low Impact -0.1
Warning Very High Impact -2.5
High Impact -1
Medium Impact -0.5
Low Impact -0.25
Very Low Impact -0.05
� 5.4 Distribution of impact categories
Products that scored highest were the most
accurate when handling the legitimate applications
used in the test. The best score possible is 100,
while the worst would be -500 (assuming that all
applications were classified as Very High Impact
and were blocked). In fact the distribution of
applications in the impact categories was not
restricted only to Very High Impact. The table
below shows the true distribution:
FALSE POSITIVE CATEGORY FREQUENCY
Prevalence Rating Frequency
Very High Impact 17
High Impact 17
Medium Impact 6
Low Impact 5
Very Low Impact 5

Enterprise Anti-Virus Protection, July - September 2012 Page 12 of 19
� 5.5 False positive ratings
Combining the impact categories with weighted scores produces the following false positive accuracy ratings.
When a product misclassified a popular program it faced a stronger penalty than if the file was more obscure.
FALSE POSITIVE RATINGS
Product Accuracy Rating
Microsoft System Center Endpoint Protection 100
Symantec Endpoint Protection 98.75
Kaspersky Endpoint Security for Windows 91
McAfee VirusScan, HIPs and SiteAdvisor 90.4
Trend Micro OfficeScan and Intrusion Defense Firewall 59.7
0
20
40
60
80
100
Microsoft
System Center
Endpoint
Protection
Symantec
Endpoint
Protection
Kaspersky
Endpoint
Security for
Windows
McAfee
VirusScan, HIPs
and SiteAdvisor
Trend Micro
OfficeScan and
Intrusion
Defense Firewall
False Positive Ratings
Total

Enterprise Anti-Virus Protection, July - September 2012 Page 13 of 19
6. THE TESTS
� 6.1 The threats
Providing a realistic user experience was important
in order to illustrate what really happens when a
user encounters a threat on the internet.
For example, in these tests web-based malware
was accessed by visiting an original, infected
website using a web browser, and not downloaded
from a CD or internal test website.
All target systems were fully exposed to the
threats. This means that any exploit code was
allowed to run, as were other malicious files, They
were run and permitted to perform exactly as they
were designed to, subject to checks made by the
installed security software.
A minimum time period of five minutes was
provided to allow the malware an opportunity to
act.
� 6.2 Test rounds
Tests were conducted in rounds. Each round
recorded the exposure of every product to a
specific threat. For example, in ‘round one’ each of
the products was exposed to the same malicious
website.
At the end of each round the test systems were
completely reset to remove any possible trace of
malware before the next test began.
� 6.3 Monitoring
Close logging of the target systems was necessary
to gauge the relative successes of the malware and
the anti-malware software. This included recording
activity such as network traffic, the creation of files
and processes and changes made to important
files.
� 6.4 Levels of protection
The products displayed different levels of
protection. Sometimes a product would prevent a
threat from executing, or at least making any
significant changes to the target system.
In other cases a threat might be able to perform
some tasks on the target (such as exploiting a
security vulnerability or executing a malicious
program), after which the security product would
intervene and remove some or all of the malware.
Finally, a threat may be able to bypass the security
product and carry out its malicious tasks
unhindered. It may even be able to disable the
security software.
Occasionally Windows' own protection system
might handle a threat while the anti-virus program
ignored it. Another outcome is that the malware
may crash for various reasons.
The different levels of protection provided by each
product were recorded following analysis of the
log files.
If malware failed to perform properly in a given
incident, perhaps because of the very presence of
the security product, rather than any specific
defending action that the product took, the
product was given the benefit of the doubt and a
Defended result was recorded.
If the test system was damaged, becoming hard to
use following an attempted attack, this was
counted as a compromise even if the active parts
of the malware had eventually been removed by
the product.
� 6.5 Types of protection
All of the products tested provided two main
types of protection: real-time and on-demand.
Real-time protection monitors the system
constantly in an attempt to prevent a threat from
gaining access.
On-demand protection is essentially a ‘virus scan’
that is run by the user at an arbitrary time.
The test results note each product’s behavior
when a threat is introduced and afterwards. The
real-time protection mechanism was monitored
throughout the test, while an on-demand scan was
run towards the end of each test to measure how
safe the product determined the system to be.
Manual scans were run only when a tester
determined that malware had made an interaction
with the target system. In other words, if the
security product claimed to block the attack at the
initial stage, and the monitoring logs supported this
claim, the case was considered closed and a
Defended result was recorded
Enterprise Anti-Virus Protection, July - September 2012 Page 14 of 19
7. TEST DETAILS
� 7.1 The targets
To create a fair testing environment, each product
was installed on a clean Windows XP Professional
target system. The operating system was updated
with Windows XP Service Pack 3 (SP3), although
no later patches or updates were applied.
We test with Windows XP SP3 and Internet
Explorer 7 due to the high prevalence of internet
threats that rely on this combination. The
prevalence of these threats suggests that there are
many systems with this level of patching currently
connected to the internet.
Additionally, the aim is to test the security product
and not the protection provided by keeping
systems completely up to date.
A selection of legitimate but old software was pre-
installed on the target systems. These posed
security risks, as they contained known
vulnerabilities. They included out of date versions
of Adobe Flash Player and Adobe Reader.
A different security product was then installed on
each system. Each product’s update mechanism
was used to download the latest version with the
most recent definitions and other elements.
Due to the dynamic nature of the tests, which
were carried out in real-time with live malicious
websites, the products' update systems were
allowed to run automatically and were also run
manually before each test round was carried out.
The products were also allowed to 'call home'
should they be programmed to query databases in
real-time. Some products might automatically
upgrade themselves during the test. At any given
time of testing, the very latest version of each
program was used.
Target systems used identical hardware, including
an Intel Core 2 Duo processor, 1GB RAM, 160GB
hard disk and DVD-ROM drive. Each was
connected to the internet via its own virtual
network (VLAN) to avoid cross-infection of
malware.
� 7.2 Threat selection
The malicious web links (URLs) used in the tests
were not provided by any anti-malware vendor.
They were picked from lists generated by Dennis
Technology Labs’ own malicious site detection
system, which uses popular search engine
keywords submitted to Google. It analyses sites
that are returned in the search results from a
number of search engines and adds them to a
database of malicious websites.
In all cases, a control system (Verification Target
System - VTS) was used to confirm that the URLs
linked to actively malicious sites.
Malicious URLs and files are not shared with any
vendors during the testing process.
� 7.3 Test stages
There were three main stages in each individual
test:
1. Introduction
2. Observation
3. Remediation
During the Introduction stage, the target system
was exposed to a threat. Before the threat was
introduced, a snapshot was taken of the system.
This created a list of Registry entries and files on
the hard disk. The threat was then introduced.
Immediately after the system’s exposure to the
threat, the Observation stage is reached. During this
time, which typically lasted at least 10 minutes, the
tester monitored the system both visually and
using a range of third-party tools.
The tester reacted to pop-ups and other prompts
according to the directives described below (see
7.5 Observation and intervention on page 15).
In the event that hostile activity to other internet
users was observed, such as when spam was being
sent by the target, this stage was cut short.
The Observation stage concluded with another
system snapshot. This ‘exposed’ snapshot was
compared to the original ‘clean’ snapshot and a
report generated. The system was then rebooted.
The Remediation stage is designed to test the
products’ ability to clean an infected system. If it
defended against the threat in the Observation stage
then we skipped it. An on-demand scan was run
on the target, after which a ‘scanned’ snapshot was

Enterprise Anti-Virus Protection, July - September 2012 Page 15 of 19
taken. This was compared to the original ‘clean’
snapshot and a report was generated.
All log files, including the snapshot reports and the
product’s own log files, were recovered from the
target.
In some cases the target may become so damaged
that log recovery is considered impractical. The
target was then reset to a clean state, ready for
the next test.
� 7.4 Threat introduction
Malicious websites were visited in real-time using
the web browser. This risky behavior was
conducted using live internet connections. URLs
were typed manually into the browser.
Web-hosted malware often changes over time.
Visiting the same site over a short period of time
can expose systems to what appear to be a range
of threats (although it may be the same threat,
slightly altered to avoid detection).
Also, many infected sites will only attack a
particular IP address once, which makes it hard to
test more than one product against the same
threat.
In order to improve the chances that each target
system received the same experience from a
malicious web server, we used a web replay
system.
When the verification target systems visited a
malicious site, the page’s content, including
malicious code, was downloaded, stored and
loaded into the replay system. When each target
system subsequently visited the site, it received
exactly the same content.
The network configurations were set to allow all
products unfettered access to the internet
throughout the test, regardless of the web replay
systems.
� 7.5 Observation and intervention
Throughout each test, the target system was
observed both manually and in real-time. This
enabled the tester to take comprehensive notes
about the system’s perceived behavior, as well as
to compare visual alerts with the products’ log
entries.
At certain stages the tester was required to act as
a regular user. To achieve consistency, the tester
followed a policy for handling certain situations,
including dealing with pop-ups displayed by
products or the operating system, system crashes,
invitations by malware to perform tasks and so on.
This user behavior policy included the following
directives:
1. Act naively. Allow the threat a good
chance to introduce itself to the target by
clicking OK to malicious prompts, for
example.
2. Don’t be too stubborn in retrying blocked
downloads. If a product warns against
visiting a site, don’t take further measures
to visit that site.
3. Where malware is downloaded as a Zip
file, or similar, extract it to the Desktop
then attempt to run it. If the archive is
protected by a password, and that
password is known to you (e.g. it was
included in the body of the original
malicious email), use it.
4. Always click the default option. This
applies to security product pop-ups,
operating system prompts (including
Windows firewall) and malware
invitations to act.
5. If there is no default option, wait. Give
the prompt 20 seconds to choose a
course of action automatically.
6. If no action is taken automatically, choose
the first option. Where options are listed
vertically, choose the top one. Where
options are listed horizontally, choose the
left-hand one.
� 7.6 Remediation
When a target is exposed to malware, the threat
may have a number of opportunities to infect the
system. The security product also has a number of
chances to protect the target. The snapshots
explained in 7.3 Test stages on page 14 provided
information that was used to analyze a system’s
final state at the end of a test.
Before, during and after each test, a ‘snapshot’ of
the target system was taken to provide
information about what had changed during the
exposure to malware. For example, comparing a
snapshot taken before a malicious website was
visited to one taken after might highlight new
entries in the Registry and new files on the hard
disk.
Enterprise Anti-Virus Protection, July - September 2012 Page 16 of 19
Snapshots were also used to determine how
effective a product was at removing a threat that
had managed to establish itself on the target
system. This analysis gives an indication as to the
levels of protection that a product has provided.
These levels of protection have been recorded
using three main terms: defended, neutralized, and
compromised. A threat that was unable to gain a
foothold on the target was defended against; one
that was prevented from continuing its activities
was neutralized; while a successful threat was
considered to have compromised the target.
A defended incident occurs where no malicious
activity is observed with the naked eye or third-
party monitoring tools following the initial threat
introduction. The snapshot report files are used to
verify this happy state.
If a threat is observed to run actively on the
system, but not beyond the point where an on-
demand scan is run, it is considered to have been
neutralized.
Comparing the snapshot reports should show that
malicious files were created and Registry entries
were made after the introduction. However, as
long as the ‘scanned’ snapshot report shows that
either the files have been removed or the Registry
entries have been deleted, the threat has been
neutralized.
The target is compromised if malware is observed
to run after the on-demand scan. In some cases a
product might request a further scan to complete
the removal. We considered secondary scans to
be acceptable, but continual scan requests may be
ignored after no progress is determined.
An edited ‘hosts’ file or altered system file also
counted as a compromise.
� 7.7 Automatic monitoring
Logs were generated using third-party applications,
as well as by the security products themselves.
Manual observation of the target system
throughout its exposure to malware (and
legitimate applications) provided more information
about the security products’ behavior.
Monitoring was performed directly on the target
system and on the network.
Client-side logging
A combination of Process Explorer, Process
Monitor, TcpView and Wireshark were used to
monitor the target systems. Regshot was used
between each testing stage to record a system
snapshot.
A number of Dennis Technology Labs-created
scripts were also used to provide additional
system information. Each product was able to
generate some level of logging itself.
Process Explorer and TcpView were run
throughout the tests, providing a visual cue to the
tester about possible malicious activity on the
system. In addition, Wireshark’s real-time output,
and the display from the web proxy (see Network
logging, below), indicated specific network activity
such as secondary downloads.
Process Monitor also provided valuable
information to help reconstruct malicious
incidents. Both Process Monitor and Wireshark
were configured to save their logs automatically to
a file. This reduced data loss when malware caused
a target to crash or reboot.
In-built Windows commands such as 'systeminfo'
and 'sc query' were used in custom scripts to
provide additional snapshots of the running
system's state.
Network logging
All target systems were connected to a live
internet connection, which incorporated a
transparent web proxy and a network monitoring
system. All traffic to and from the internet had to
pass through this system.
Further to that, all web traffic had to pass through
the proxy as well. This allowed the testers to
capture files containing the complete network
traffic. It also provided a quick and easy view of
web-based traffic, which was displayed to the
testers in real-time.
The network monitor was a dual-homed Linux
system running as a transparent router, passing all
web traffic through a Squid proxy.
An HTTP replay system ensured that all target
systems received the same malware as each other.
It was configured to allow access to the internet
so that products could download updates and
communicate with any available ‘in the cloud’
servers..
Enterprise Anti-Virus Protection, July - September 2012 Page 17 of 19
8. CONCLUSIONS
� Where are the threats?
The threats used in this test were genuine, real-life
threats that were infecting victims globally at the
same time as we tested the products. In almost
every case the threat was launched from a
legitimate website that had been compromised by
an attacker.
The types of infected or malicious sites were
varied, which demonstrates that effective anti-virus
software is essential for those who want to use
the web using a Windows PC.
Most threats installed automatically when a user
visited the infected webpage. This infection was
often invisible to a casual observer.
� Where does protection start?
There were a significant number of compromises
in this test, as well as a relatively large number of
neutralizations.
The strongest products blocked the site before it
was even able to deliver its payload. The weakest
tended to handle the threat after it had started to
interact with the target system.
� Sorting the wheat from the chaff
Kaspersky Endpoint Security and Symantec
Endpoint Protection scored highest in terms of
malware protection.
Symantec’s product comes top overall because it
blocked more threats than Kaspersky’s software.
In a simultaneous test Kaspersky’s consumer
software blocked more threats than did its
enterprise product.
Kaspersky Labs claims that this disparity is due to a
bug discovered as a result of the Dennis
Technology Labs test and adds that this issue has
now been addressed.
The fix was issued via the standard update process
and does not require a system restart or any other
user action.
Anti-malware products need to be able to
distinguish between malicious and non-malicious
programs. This is where the Microsoft product
shone. It was the only one to allow the installation
and use of all legitimate applications without any
warning messages.
Symantec Endpoint Protection scored strongly
overall, not only because it blocked threats but
because it allowed nearly all of the legitimate
applications to install and run.
The McAfee and Kaspersky products came a close
joint-second, but Trend Micro OfficeScan and
Intrusion Defense Firewall made harsh judgments
on legitimate applications. While it only warned
against one program, it actively blocked 14 others.
� Anti-virus is important (but not a
panacea)
This test shows that even with a relatively small
sample set of 100 threats there is a significant
difference in performance between the anti-virus
programs. Most importantly, it illustrates this
difference using real threats that were attacking
real computers at the time of testing.
The average protection level of the tested
products is 91 per cent (see 3. Protection Scores on
page 7), which is a significant value for two
reasons. First, it is very close to the average figures
published in previous sponsored Dennis
Technology Labs reports over the years. Second, it
is much lower than some detection results
typically quoted in anti-malware marketing
material.
The presence of anti-malware software can be
seen to decrease the chances of a malware
infection even when the only sites being visited are
proven to be actively malicious. That said, not one
product produced a 100 per cent protection rate,
while only one generated zero false positive
results.

Enterprise Anti-Virus Protection, July - September 2012 Page 18 of 19
APPENDIX A: TERMS USED
Compromised Malware continues to run on an infected system, even after an on-demand scan.
Defended Malware was prevented from running on, or making changes to, the target.
False Positive A legitimate application was incorrectly classified as being malicious.
Introduction Test stage where a target system is exposed to a threat.
Neutralized Malware or exploit was able to run on the target, but was then removed by the security product.
Observation Test stage during which malware may affect the target.
On-demand (protection) Manual ‘virus’ scan, run by the user at an arbitrary time.
Prompt
Questions asked by software, including malware, security products and the operating system. With security products, prompts usually appear in the form of pop-up windows. Some prompts don’t ask questions but provide alerts. When these appear and disappear without a user’s interaction, they are called ‘toasters’.
Real-time (protection) The ‘always-on’ protection offered by many security products.
Remediation Test stage that measures a product’s abilities to remove any installed threat.
Round Test series of multiple products, exposing each target to the same threat.
Snapshot Record of a target’s file system and Registry contents.
Target Test system exposed to threats in order to monitor the behavior of security products.
Threat A program or other measure designed to subvert a system.
Update Code provided by a vendor to keep its software up to date. This includes virus definitions, engine updates and operating system patches.

Enterprise Anti-Virus Protection, July - September 2012 Page 19 of 19
APPENDIX B: FAQS
� This test was unsponsored.
� The test rounds were conducted between 27th July 2012 and 24th August 2012 using the most up to date
versions of the software available on any given day.
� All products were able to communicate with their back-end systems over the internet.
� The products selected for this test were chosen by Dennis Technology Labs.
� Samples were located and verified by Dennis Technology Labs.
� Products were exposed to threats within 24 hours of the same threats being verified. In practice there
was only a delay of up to three to four hours.
� Details of the samples, including their URLs and code, were provided to partner vendors only after the
test was complete.
� The sample set comprised 100 actively-malicious URLs and 100 legitimate applications.
Do participating vendors know what samples are used, before or during the test?
No. We don’t even know what threats will be used until the test starts. Each day we find new ones, so it is
impossible for us to give this information before the test starts. Neither do we disclose this information until
the test has concluded.
What is the difference between a vendor and a partner vendor?
Partner vendors contribute financially to the test in return for a preview of the results, an opportunity to
challenge results before publication and the right to use award logos in marketing material. Other participants
first see the results on the day of publication and may not use award logos for any purpose.
Do you share samples with the vendors?
Partner vendors are able to download all samples from us after the test is complete.
Other vendors may request a subset of the threats that compromised their products in order for them to
verify our results. The same applies to client-side logs, including the network capture files. There is a small
administration fee for the provision of this service.
What is a sample?
In our tests a sample is not simply a set of malicious executable files that runs on the system. A sample is an
entire replay archive that enables researchers to replicate the incident, even if the original infected website is
no longer available. This means that it is possible to reproduce the attack and to determine which layer of
protection is was able to bypass. Replaying the attack should, in most cases, produce the relevant executable
files. If not, these are usually available in the client-side network capture (pcap) file.