Ensuring Cyber-Security in Hydroelectric Dam through … · Ensuring Cyber-Security in...
36
Ensuring Cyber-Security in Hydroelectric Dam through a novel SIEM system Cesario Di Sarno a,* , Alessia Garofalo b , Ilaria Matteucci c , Marco Vallini d a University of Naples “Parthenope”, Dep. of Engineering, Naples, Italy E-mail: {[email protected]} b COSIRE Group, Aversa, Italy E-mail: {[email protected]} c Istituto di Informatica e Telematica, CNR, Pisa, Italy E-mail: [email protected] d Politecnico di Torino, Dip. di Automatica ed Informatica, Torino, Italy E-mail: [email protected] Abstract In the last few years, one of the main research challenges is related to Critical In- frastructure Protection. Security Information and Event Management (SIEM) systems are widely used to cope with this challenge. However, such systems cur- rently present several limitations. In this paper, we propose an enhanced SIEM system which is able to i) resolve conflicts among security policies, ii) discover unauthorized network data paths in order to reconfigure network devices, and iii) provide an intrusion and fault tolerant storage system that ensures integrity and unforgeability of stored events. The enhanced SIEM system is illustrated on a hydroelectric dam as case study. In particular, we considered an attack model that affects different parts of the IT infrastructure belonging to the hy- droelectric dam. The attack model is used to build the setup of the enhanced SIEM system and to show as the proposed system is able to detect and react to the considered attack. Keywords: Security Information and Event Management; SIEM; Decision Support System; Resilient Event Storage; Hydropower Dam. * Corresponding author Email address: [email protected] (Cesario Di Sarno ) Preprint submitted to Journal of L A T E X Templates February 10, 2016
Transcript of Ensuring Cyber-Security in Hydroelectric Dam through … · Ensuring Cyber-Security in...
Ensuring Cyber-Security in Hydroelectric Damthrough a novel SIEM system
Cesario Di Sarnoa,∗, Alessia Garofalob, Ilaria Matteuccic, Marco Vallinid
aUniversity of Naples “Parthenope”, Dep. of Engineering, Naples, ItalyE-mail: {[email protected]}
bCOSIRE Group, Aversa, ItalyE-mail: {[email protected]}
cIstituto di Informatica e Telematica, CNR, Pisa, ItalyE-mail: [email protected]
dPolitecnico di Torino, Dip. di Automatica ed Informatica, Torino, ItalyE-mail: [email protected]
Abstract
In the last few years, one of the main research challenges is related to Critical In-
frastructure Protection. Security Information and Event Management (SIEM)
systems are widely used to cope with this challenge. However, such systems cur-
rently present several limitations. In this paper, we propose an enhanced SIEM
system which is able to i) resolve conflicts among security policies, ii) discover
unauthorized network data paths in order to reconfigure network devices, and
iii) provide an intrusion and fault tolerant storage system that ensures integrity
and unforgeability of stored events. The enhanced SIEM system is illustrated
on a hydroelectric dam as case study. In particular, we considered an attack
model that affects different parts of the IT infrastructure belonging to the hy-
droelectric dam. The attack model is used to build the setup of the enhanced
SIEM system and to show as the proposed system is able to detect and react to
the considered attack.
Keywords: Security Information and Event Management; SIEM; Decision
Support System; Resilient Event Storage; Hydropower Dam.
∗Corresponding authorEmail address: [email protected] (Cesario Di Sarno )
Preprint submitted to Journal of LATEX Templates February 10, 2016
1. Introduction
Department of Homeland Security (DHS) defines Critical Infrastructures as
follows: “Critical infrastructure are the assets, systems, and networks, whether
physical or virtual, so vital to the United States that their incapacitation or de-
struction would have a debilitating effect on security, national economic security,
national public health or safety, or any combination thereof” [1]. Therefore, the
protection of these infrastructures must be carefully considered to avoid disas-
ters. For this purpose, DHS has identified sixteen different Critical Infrastruc-
tures that need to be monitored and protected [2]. The study performed by
“Industrial Control Systems Cyber Emergency Response Team” (ICS-CERT) 1
highlighted that energy sectors - dams included - are the most attractive tar-
gets for cyber-attacks. Recently, several daily journal report about the U.S.
intelligence agency traced back a cyber intrusion performed by China govern-
ment into a database containing sensitive information of the USA government.
Specifically, the database stored vulnerabilities of major dams in the United
States that can be exploited to perform a future cyber attack against the US
electrical power grid.
Security Information and Event Management (SIEM) systems are an emerg-
ing technology used to improve Critical Infrastructure Protection. In particu-
lar, a SIEM system is designed to analyze security information provided from
monitored infrastructure to discover security breaches. Currently, SIEM sys-
tems lack several important features that allow to improve cyber-security of a
Critical Infrastructure. Such features are: the capability to detect and solve a
conflict between security policies that are both activated at the same time but
that allow different actions; a technique to identify and control all allowed net-
work data paths existing within the monitored infrastructures; a secure storage
system designed to ensure integrity and unforgeability of stored data.
In this paper we proposed an enhanced SIEM system that overcomes these
1https://ics-cert.us-cert.gov
2
limitations by integrating two new components: a Decision Support System and
a Resilient Event Storage system. The enhanced SIEM system is customized for
a specific Critical Infrastructure. In particular, an attack model was designed
to affect different parts of the IT infrastructure belonging to the hydroelectric
dam. The attack model is used to show as the cyber-security of monitored
infrastructure is improved by using the enhanced SIEM system.
The paper is structured as follows: Section 2 discusses about the state of
the art and the limitations of SIEM systems available today and it provides
details about other existing works in literature. Section 3 describes the proposed
architecture by detailing each new component belonging to the enhanced SIEM
system. Section 4 presents the hydroelectric dam scenario and details a specific
attack model considered against this infrastructure. Section 5 describes the
enhanced SIEM system setup for the scenario described and how the SIEM is
used to detect and react to the attack model considered. Finally, Section 6
draws the conclusion of the paper.
2. State of the Art and limitations of SIEM systems
McAfee’s report 2 states that SIEM systems are widely used to perform real-
time monitoring and control of a Critical Infrastructure. SIEM [3] solutions are a
combination of the formerly heterogeneous product categories of Security Infor-
mation Management (SIM) and Security Event Management (SEM). SEM sys-
tems are focused on the aggregation of data into a manageable amount of infor-
mation with the help of which security incidents can be dealt with immediately,
whereas SIMs primarily focus on the analysis of historical data in order to im-
prove the long term effectiveness and efficiency of cyber security mechanisms [4].
SIEM technology aggregates event data produced by security devices, network
infrastructures, as well as IT systems and applications. The data sources that
feed a SIEM system are log entries generated by devices/components installed
2http://goo.gl/i9ZDdx
3
within the infrastructure to be monitored e.g., routers, servers, applications.
Different protocols, e.g., Syslog, SNMP, OPSEC, can be used to transfer logs
from data sources to SIEM. If a component/device does not support these pro-
tocols an “Agent” is required to translate (or normalize) source log data to a
format known to the SIEM. Also, each “Agent” can perform a filtering activity
to avoid sending unnecessary data in order to reduce the required network band-
width, storage space and SIEM processing resources. Of course, it is not easy
to establish if a data is important or not when it is analyzed by “Agent”. In
fact a data could become very interesting in subsequent processing steps. Each
“Agent” outputs events containing gathered data. Such events are sent to the
Correlator that performs complex security analysis to discover known attacks
signatures. If an attack is detected the “Correlator” generates an alarm con-
taining information about the occurred security breach. The events/alarms are
saved within a storage system. Gartner Report [5] provides an overview about
widely adopted SIEM technologies and the report focuses on their strengths
and weaknesses. The most widely used SIEM systems today are OSSIM 3 and
Prelude 4.
A weakness of SIEM systems is that they lack several features for Critical
Infrastructure Protection. In particular, three limits have been identified:
1) SIEMs allow to define security policies – e.g., OSSIM SIEM allows to
map a risk value to each event and defines a set of actions corresponding to
the estimated risk – but they do not allow to solve a policies conflict when it
is raised. In critical infrastructure monitoring many policies are required to
avoid misbehaviour: thus, what does happen whether some policies generate a
conflict? How is it possible to take a decision when two policies are in conflict?
This is a issue deeply studied in the literature about policy-based access con-
trol system. Indeed, several mechanisms and conflict resolution strategies have
been developed. In [6], the authors propose a strategy for conflict resolution,
3AlienVault: OSSIM Project - http://www.alienvault.com/open-threat-exchange/projects4https://www.prelude-siem.org
4
based on the prioritization of the most specific privacy policy customized for
the e-health domain. In [7], the authors present a OrBAC -based methodology
to manage conflicts occurring among permissions and prohibitions. Work in [8]
defines and reviews policy conflicts, discussing the various precedence relation-
ships that can be established between policies to allow inconsistent policies to
coexist within the system and presenting a conflict analysis tool which forms
part of a role based management framework. In [9], the authors investigate pol-
icy conflict resolution in pervasive environments by referring to quite standard
strategies, i.e., role hierarchies override and obligation precedence. Work in [10]
considers attributes related to subject, object, and environment grouping them
under a unique label context. A conflict resolution strategy is proposed that
prioritizes authorization rules according to the specificity of the context as a
whole. In [11], four different strategies based on the evaluation of the role of the
requester for solving conflicts are considered. However, none of these approaches
has been integrated in a SIEM architecture.
2) Critical Infrastructure monitoring is performed by deploying communica-
tion networks that enable the exchange of information between the monitored
facilities and the control systems. In order to avoid specific connections from
external networks towards the internal ones, security policies pose strong limi-
tations to data flows. For instance, an operation of sensor firmware re-writing
can only be done from specific hosts in a permitted LAN, where privileged ac-
counts exist and limited access to domain experts is allowed. SIEM systems
lack a methodology to identify and control all possible data paths existing in
the monitored infrastructures. OSSIM SIEM, for example, allows to perform
few actions to control the monitored scenario as sending an email containing
an alarm to the system administrator or executing a specific command. The
identification of permitted and denied traffic among network entities is known
in literature as network reachability analysis. During past years, several works
based on dynamic (by using network tools e.g., ping) or static (by using device
configurations, e.g., router or firewall configuration) approaches have been pro-
posed. Some works rely on graph-based representation to model routing and
5
filtering aspects of computer networks. The work [12] proposes a unified model
to analyse static reachability based on two views: a graph to describe a network
physical topology, where edges are network links and nodes are routers; a graph
to model the routing process, where nodes are routing processes and edges are
adjacencies that implement a routing policy. The composition of these views
makes possible to evaluate the reachability by combining the routing policies,
which govern the distribution of routers, with packet filter policies, that identify
which packet can traverse a link. In [13], the authors propose a model where the
network is represented by using a state machine. The transitions between states
depend on packet header, packet location (i.e., device) and policy semantics.
In particular, the semantics of access control policies is represented by using
Binary Decision Diagrams (BDDs). Then, Computation Tree Logic (CTL) and
symbolic model checking are adopted to identify future and past states of a par-
ticular packet. This approach makes possible to represent network configuration
(considering access control policies) useful to identify security violations (e.g.,
backdoors and broken IPsec tunnels). Again, as for conflicts analysis, none of
these works has been integrated as part of a SIEM architecture.
3) SIEMs generate alarms when attack signatures are detected. Alarms are
stored along with related events in storage media, e.g., databases. Information
contained in the alarms can be used for forensic purposes in order to discover
the attacker’s identity and get details on the attack execution. Thus, the in-
tegrity and unforgeability of alarms are two requirements that must be ensured
to consider them as valid evidence. Today, only few commercial SIEMs ensure
these requirements through modules that sign the alarms with cryptography
algorithms, such as RSA or DES. Typically the signing module is not designed
to be resilient to attacks against the module itself that generates signed records.
In this work we consider the approach proposed in [14] where threshold cryptog-
raphy is used to build a storage system resilient both to faults and intrusions.
6
3. Enhanced SIEM Architecture
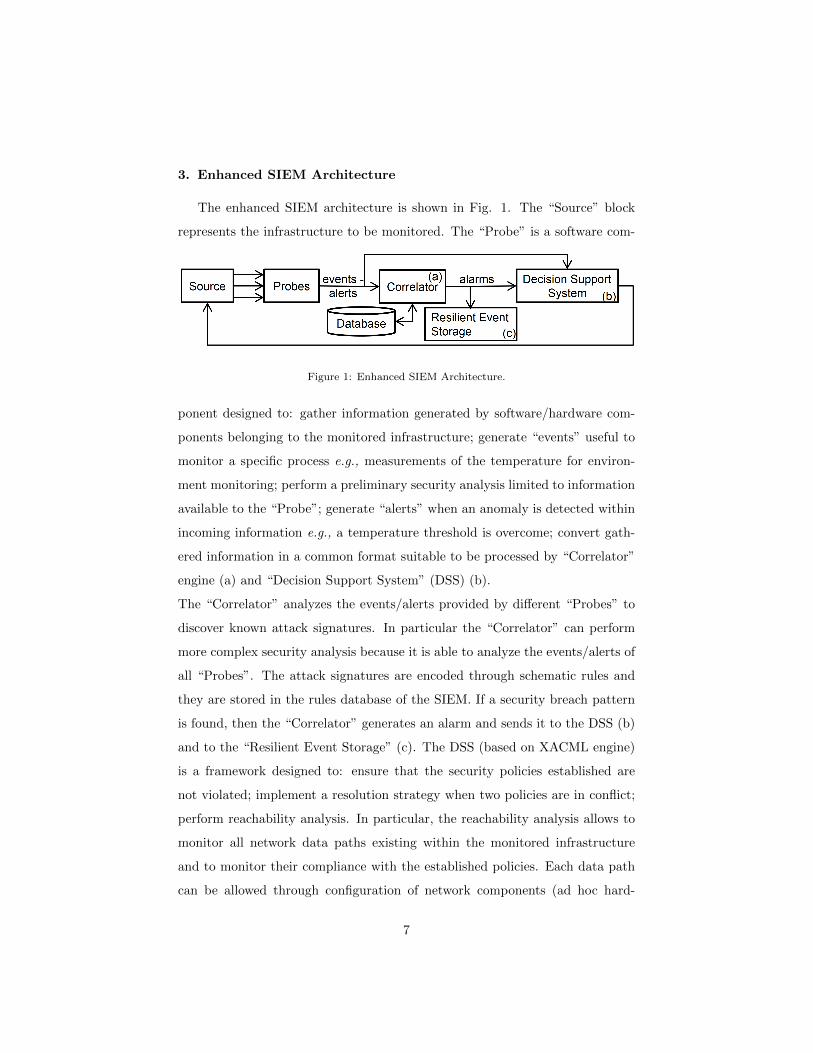
The enhanced SIEM architecture is shown in Fig. 1. The “Source” block
represents the infrastructure to be monitored. The “Probe” is a software com-
Figure 1: Enhanced SIEM Architecture.
ponent designed to: gather information generated by software/hardware com-
ponents belonging to the monitored infrastructure; generate “events” useful to
monitor a specific process e.g., measurements of the temperature for environ-
ment monitoring; perform a preliminary security analysis limited to information
available to the “Probe”; generate “alerts” when an anomaly is detected within
incoming information e.g., a temperature threshold is overcome; convert gath-
ered information in a common format suitable to be processed by “Correlator”
engine (a) and “Decision Support System” (DSS) (b).
The “Correlator” analyzes the events/alerts provided by different “Probes” to
discover known attack signatures. In particular the “Correlator” can perform
more complex security analysis because it is able to analyze the events/alerts of
all “Probes”. The attack signatures are encoded through schematic rules and
they are stored in the rules database of the SIEM. If a security breach pattern
is found, then the “Correlator” generates an alarm and sends it to the DSS (b)
and to the “Resilient Event Storage” (c). The DSS (based on XACML engine)
is a framework designed to: ensure that the security policies established are
not violated; implement a resolution strategy when two policies are in conflict;
perform reachability analysis. In particular, the reachability analysis allows to
monitor all network data paths existing within the monitored infrastructure
and to monitor their compliance with the established policies. Each data path
can be allowed through configuration of network components (ad hoc hard-
7
ware/software). If the DSS discovers a misconfiguration, it performs a control
action on the monitored “Source”, e.g., a discovered and unauthorized data
path is closed by modifying firewalls’ rules. In this paper we call: “DSS-Solver”
the DSS part that implements the policies conflict detection and resolution;
“DSS-Analyzer” the DSS part that performs reachability analysis. The alarms
generated and stored by the “Correlator” can be used as evidence of cyber-
crime; for this purpose, their integrity and unforgeability must be guaranteed.
The “Resilient Event Storage” is an intrusion and fault tolerant facility designed
to ensure these two requirements even if some components are compromised by
an attack.
3.1. Probes and Correlation Process
The “Probe” module is a software component designed to process incoming
data and to perform security analysis. In particular, each “Probe” is installed
in a specific location of the infrastructure to be monitored and it can operate in
two ways: passive, if the host/device is already designed to generate and send
logs - in that case, the “Probe” processes and analyzes incoming logs; active,
if the component does not generate logs - in that case, the “Probe” actively
gathers information e.g., sniffing and analyzing network traffic of the monitored
host/device. The purpose of a “Probe” is to generate both events and alerts
useful for monitoring purposes. Events are messages containing information
about the measurements of key indicators. The key indicators are parameters
defined by an expert of the monitored infrastructure and their purpose is to al-
low infrastructure monitoring. The alerts are messages containing information
about an anomaly detected e.g., a threshold previously defined for a specific
key indicator is overcome. Events/alerts generated by different “Probes” have
a common format that can be processed by both “Correlator” and DSS com-
ponents. The usage of a common message format allows to normalize the logs
generated by heterogeneous hardware/software components.
In Figure 1, “Correlator” engine is a software component that allows to de-
tect specific attacks signatures within events/alerts flow received by different
8
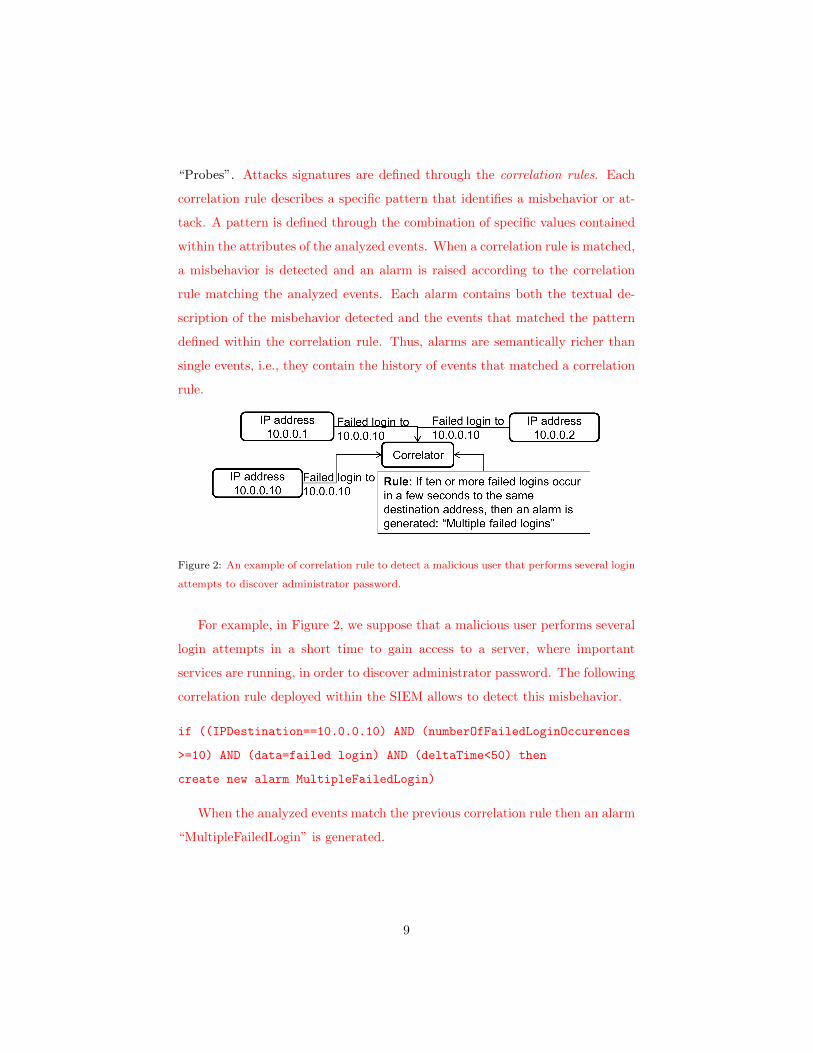
“Probes”. Attacks signatures are defined through the correlation rules. Each
correlation rule describes a specific pattern that identifies a misbehavior or at-
tack. A pattern is defined through the combination of specific values contained
within the attributes of the analyzed events. When a correlation rule is matched,
a misbehavior is detected and an alarm is raised according to the correlation
rule matching the analyzed events. Each alarm contains both the textual de-
scription of the misbehavior detected and the events that matched the pattern
defined within the correlation rule. Thus, alarms are semantically richer than
single events, i.e., they contain the history of events that matched a correlation
rule.
Figure 2: An example of correlation rule to detect a malicious user that performs several login
attempts to discover administrator password.
For example, in Figure 2, we suppose that a malicious user performs several
login attempts in a short time to gain access to a server, where important
services are running, in order to discover administrator password. The following
correlation rule deployed within the SIEM allows to detect this misbehavior.
if ((IPDestination==10.0.0.10) AND (numberOfFailedLoginOccurences
>=10) AND (data=failed login) AND (deltaTime<50) then
create new alarm MultipleFailedLogin)
When the analyzed events match the previous correlation rule then an alarm
“MultipleFailedLogin” is generated.
9
3.2. Decision Support System
The DSS includes two main functionalities: i) a customized policies con-
flict resolution strategy (DSS-Solver), which allows to solve conflicts occurring
among different XACML-based policies that can be applied at the same time
but they allow conflicting actions; ii) a reachability analysis (DSS-Analyzer)
that is able to discover unauthorized network access and allows to re-define net-
work configurations. In addition to the functionalities that we detailed below,
the DSS is also composed of other components as, e.g., a repository containing
both high level and configuration policies for security analysis.
3.2.1. DSS-Solver
Once the Correlator detects a possible attack, i.e., arises an alarm, some
decisions have to be taken in order to preserve security and functionality of the
system under attack. The kind of decision to be taken depends on specified
policies for each component of the considered complex system.
Let us consider that XACML-based policies expressed in terms of subject,
object (or resource), action, and environment (the element of the policy) that are
specified through their attributes. According to their effect, policies are divided
into two main classes: Authorization, that express the actions that a subject is
allowed to perform on an object within an environment and Prohibition, that
express the actions that a subject is not allowed to perform on an object within
an environment. Note that the above assumptions are not restrictive. For
example, XACML 5 relies on similar assumptions.
Hence, we consider a security policy as a set of rules that are evaluated
for each access request. Their purpose is to decide whether a given subject is
allowed to perform a given action on a given resource in a given environment.
Policy rules include conditions on the value of elements’ attributes to determine
which rule can be applied to each access request.
Security policies expressed in this way may conflict one another. We say
5https://goo.gl/K7WBcg
10
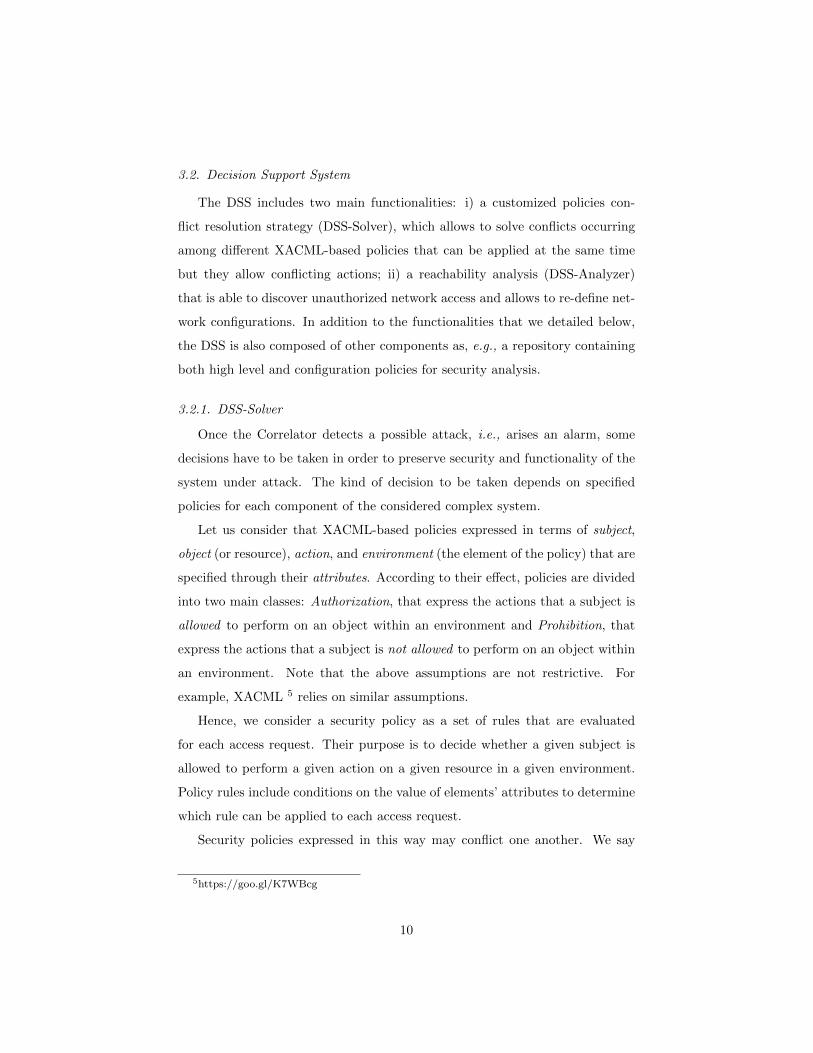
Figure 3: AHP Hierarchy for Policy Conflict Resolution.
that two policies are in conflict when they are going to be contemporaneously
applied for allowing (or not allowing) the access to some resources.
XACML introduces Combining algorithms to solve conflicts that could arise
among rules in a policy and among policies in a policy set. Standard combining
algorithms are: Deny-Overrides, Permit-Overrides, First-Applicable, and Only-
One-Applicable. Furthermore, XACML allows to define customized combining
algorithms. Hence, we describe an algorithm, AHPPolicyCombiningAlgorithm,
based on the Analytic Hierarchy Process (AHP) [15]. This is a multi-criteria
decision making technique, which has been largely used in several fields of study.
Given a decision problem, a hierarchy is built (see Figure 3) where, at the
bottom different alternatives can be chosen to reach a goal that is on the top of
the hierarchy. AHP returns the most relevant alternative with respect to a set
of criteria, second level of the hierarchy. This approach requires to subdivide
a complex problem into a set of sub-problems, equal in number to the chosen
criteria, and then it computes the solution by properly merging all the local
solutions for each sub-problem. As shown in the hierarchy depicted in Figure 3,
our goal is ranking conflicting policies that are the alternatives of the AHP
hierarchy. Note that, in the figure we consider a conflict among two policies
but the alternatives may be more than two. We consider as criteria (second
group of boxes starting from the top of the hierarchy in Figure 3) the specificity
of an element of a policy. Being elements defined through their attributes,
the specificity of each element is defined in terms of the attributes used for its
11
definition. Roughly speaking, attribute a1 of element e is more specific than
attribute a2 of the same element if a condition on this attribute is likely to
identify a more homogeneous and/or a smaller set of entities within e.
AHP allows to further refine each criterion in sub-criteria, by considering
the attributes that identify each element. Examples of attribute for the subject
are: the Identification Number (ID), his/her own Role, the organization he/she
belongs to. Note that the set of considered attributes depends on the chosen
scenario. In Section 4 we will customize this method to the Hydroelectric Dam
scenario and we will show the customized hierarchy used to solve a specific
conflict raised within the considered scenario.
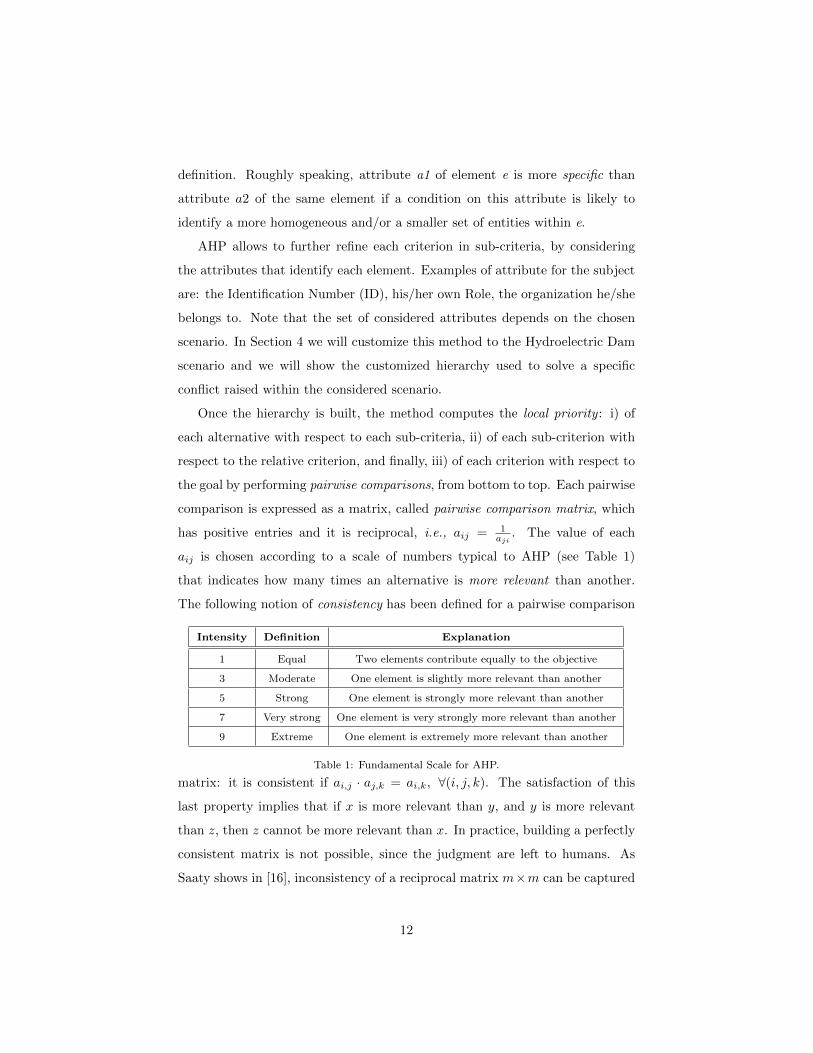
Once the hierarchy is built, the method computes the local priority : i) of
each alternative with respect to each sub-criteria, ii) of each sub-criterion with
respect to the relative criterion, and finally, iii) of each criterion with respect to
the goal by performing pairwise comparisons, from bottom to top. Each pairwise
comparison is expressed as a matrix, called pairwise comparison matrix, which
has positive entries and it is reciprocal, i.e., aij = 1aji
. The value of each
aij is chosen according to a scale of numbers typical to AHP (see Table 1)
that indicates how many times an alternative is more relevant than another.
The following notion of consistency has been defined for a pairwise comparison
Intensity Definition Explanation
1 Equal Two elements contribute equally to the objective
3 Moderate One element is slightly more relevant than another
5 Strong One element is strongly more relevant than another
7 Very strong One element is very strongly more relevant than another
9 Extreme One element is extremely more relevant than another
Table 1: Fundamental Scale for AHP.
matrix: it is consistent if ai,j · aj,k = ai,k, ∀(i, j, k). The satisfaction of this
last property implies that if x is more relevant than y, and y is more relevant
than z, then z cannot be more relevant than x. In practice, building a perfectly
consistent matrix is not possible, since the judgment are left to humans. As
Saaty shows in [16], inconsistency of a reciprocal matrix m×m can be captured
12
by the so called Consistency Index: CI = λmax−mm−1 , where λmax is the maximum
eigenvalue of M . For a consistent matrix CI = 0, whilst a matrix is considered
semi-consistent if CI < 0.1. If this last condition does not hold, then the
comparison values must be re-evaluated.
Hereafter, let us consider the hierarchy in Figure 3, where we consider only
two policies in conflict. We firstly calculate local priorities of each alternative
(2 in our case) with respect to each sub-criteria, by performing k 2x2 pairwise
comparison matrices, where k is the number of sub-criteria (in our case, k=9).
Matrices are built according to the presence of the attributes in the policies.
Given that aij is the generic entry of one of these matrices:
i) Policy1 and Policy2 contain (or do not contain) attribute A: then a12 =
a21 = 1;
ii) if only Policy1 contains A, than a12 = 9, and a21 = 19 ;
iii) if only Policy2 contains A, than a12 = 19 , and a21 = 9.
Once a comparison matrix has been defined, the local priorities are the
normalized eigenvector associated with the largest eigenvalue of such matrix [15].
Then, moving up in the hierarchy, we quantify how sub-criteria are relevant with
respect to the correspondent criterion. Hence, we evaluate how the attributes
are relevant to identify the subject, the object, and the environment: e.g.,
referring to the subject, ID is more relevant than Role and Organization. Role
and Organization have the same relevance.
Finally, we quantify how the three criteria are relevant for achieving the goal
of solving conflicts. The global priority is calculated as a weighted summation
of the local priorities previously calculated. In particular, local priorities are
calculated as pairwise comparisons between entities at one level of the hierarchy
with respect to the entities at the upper level, i.e., , i) of alternatives with
respect to sub-criteria; ii) of sub criteria with respect to criteria, and iii) of
criteria with respect to the goal. The resulting formula for the calculation of
13
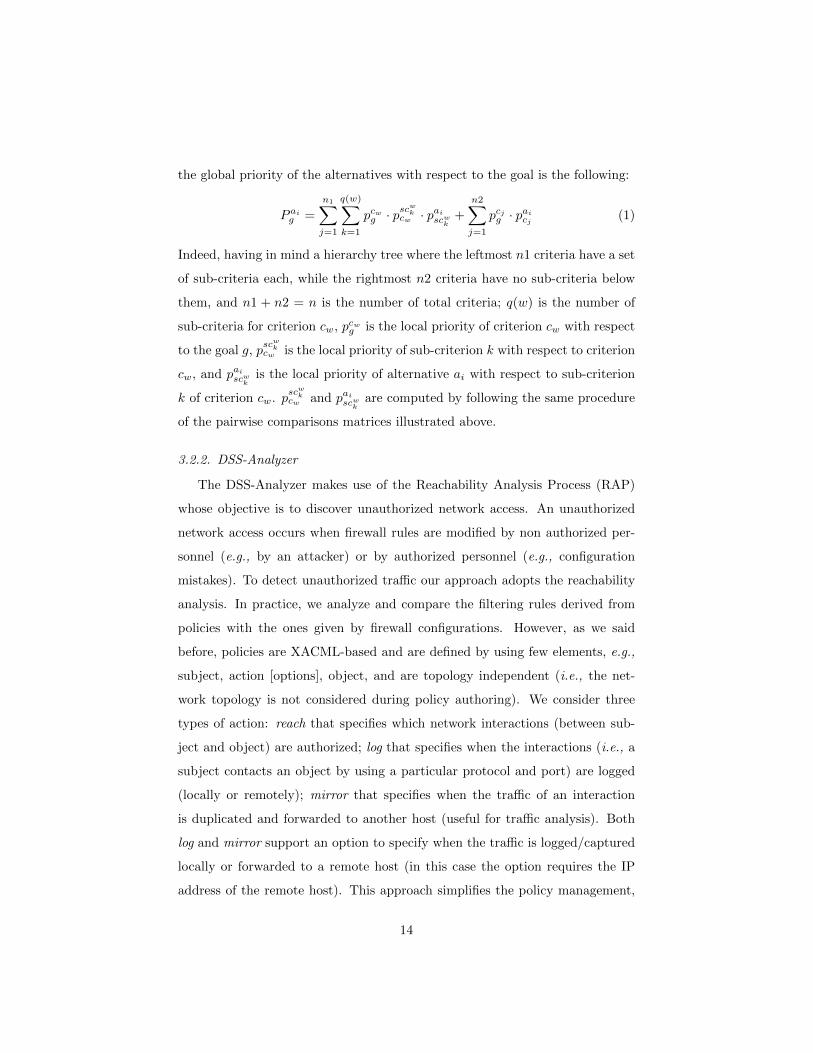
the global priority of the alternatives with respect to the goal is the following:
P aig =
n1∑j=1
q(w)∑k=1
pcwg · pscwkcw · paiscwk +
n2∑j=1
pcjg · paicj (1)
Indeed, having in mind a hierarchy tree where the leftmost n1 criteria have a set
of sub-criteria each, while the rightmost n2 criteria have no sub-criteria below
them, and n1 + n2 = n is the number of total criteria; q(w) is the number of
sub-criteria for criterion cw, pcwg is the local priority of criterion cw with respect
to the goal g, pscwkcw is the local priority of sub-criterion k with respect to criterion
cw, and paiscwkis the local priority of alternative ai with respect to sub-criterion
k of criterion cw. pscwkcw and paiscwk
are computed by following the same procedure
of the pairwise comparisons matrices illustrated above.
3.2.2. DSS-Analyzer
The DSS-Analyzer makes use of the Reachability Analysis Process (RAP)
whose objective is to discover unauthorized network access. An unauthorized
network access occurs when firewall rules are modified by non authorized per-
sonnel (e.g., by an attacker) or by authorized personnel (e.g., configuration
mistakes). To detect unauthorized traffic our approach adopts the reachability
analysis. In practice, we analyze and compare the filtering rules derived from
policies with the ones given by firewall configurations. However, as we said
before, policies are XACML-based and are defined by using few elements, e.g.,
subject, action [options], object, and are topology independent (i.e., the net-
work topology is not considered during policy authoring). We consider three
types of action: reach that specifies which network interactions (between sub-
ject and object) are authorized; log that specifies when the interactions (i.e., a
subject contacts an object by using a particular protocol and port) are logged
(locally or remotely); mirror that specifies when the traffic of an interaction
is duplicated and forwarded to another host (useful for traffic analysis). Both
log and mirror support an option to specify when the traffic is logged/captured
locally or forwarded to a remote host (in this case the option requires the IP
address of the remote host). This approach simplifies the policy management,
14
e.g., the undefined interactions are prohibited as default and policy conflicts are
avoided (only some anomalies must be addressed, e.g., equivalent rules). On the
contrary, firewall rules are represented by using a common format (source IP
address, source port, destination IP address, destination port, protocol, action,
[options]) and depend on network topology, i.e., where the firewall is placed in
the network and which set of hosts protects. Therefore, policies must be trans-
formed into a concrete format (this operation must be executed for each filtering
device of the network) before performing reachability analysis. RAP, by using
a set of rules and an inference engine, drives the process to detect unauthorized
network access. At the beginning, or when policies are modified, RAP starts
the refinement to generate the set of rules for filtering devices. This process
is organized by a set of Policy refinement tasks where policies and system de-
scription are analyzed and a graph-based network topology representation is
generated. In particular, during the policy analysis, the anomalies (e.g., redun-
dancy) are detected and addressed. System description (represented as XML)
contains hosts (and related information, e.g., IP addresses), capabilities (e.g.,
packet filter), services and network topology. Network analysis task identifies
the set of firewalls to enforce each policy, i.e., it discovers, on the graph-based
representation, the network paths (that include at least a firewall) between the
subject and the object of a policy. Since the default action of a firewall is to
deny all traffic, each firewall contained in a path must be configured to permit
the policy traffic. Hence, for each firewall a set of filtering rules is generated
to enforce the policies. When it does not exist at least a firewall to implement
the policy, it is not enforceable. This typically occurs when subject and ob-
ject belong to the same subnet and their traffic does not traverse any firewall.
Therefore any type of traffic between subject and object is permitted, poten-
tially creating a security breach. This situation is managed by the module that
logs the security issue and saves it into the internal models repository. Once
the refinement process is completed, RAP performs the reachability analysis
evaluating the filtering rules, the ones generated by the previous process (gen-
erated rules) and the ones deployed into firewalls (deployed rules). This activity
15
is organized in the following phases:
I. Translation: for each deployed rule, the fields, structured as firewall specific
statements are translated in the common format organized as follow: srcIP, src-
Port, dstIP, dstPort, action, [options] where srcIP, dstIP are a single IP address
or a range; srcPort, dstPort are a single port or a range of ports; action is one
of “accept” (used when the destination is the current device), “accept/forward”
(used when the destination is not the current device and the traffic must be
forwarded), “log”, “mirror”; option (available for log and mirror actions) is in
the form: “local”, “local interface”, “remote IP”. Where “local interface” iden-
tifies the destination interface for log or mirrored traffic. Since firewalls have
different features and language specific statements, to translate the rule set from
a particular device to the common format we need to define a set of adapters.
The adapter-based approach simplifies the flexibility of this module and its ex-
tensibility;
II. Expansion: for each generated and deployed rule (the ones obtained after
translation), the fields that contain ranges (IP addresses, ports, etc. ) are ex-
panded by considering network description (i.e., the hosts and services defined
into the system description) and creating new rules. Let’s consider the rule r1 as
srcIP:192.168.0.1, srcPort:*, dstIP:192.168.10.10, dstPort:80,443, proto:TCP,
action:accept, where the destination IP address refers to a host that offers a
web service on ports 80 and 443. The expansion phase transforms r1 into rules
r1, 1 and r1, 2: the former to match the port 80 and the latter to match the port
443. The same approach is followed for the IP addresses expressed as subnets.
Before applying expansion operation, deployed rules are analyzed to detect and
address anomalies;
III. Composition: the objective of this phase is to create the reachability
matrices. Each firewall i has two rule sets, one for generated rules (Rg,i)
and another for deployed rules (Rd,i). We introduce the equivalent rule set
for the firewall i (Re,i) that contains both generated and deployed rules, i.e.,
Re,i = Rg,i∪Rd,i. Considering the Re,i we create two partitions: the former con-
tains source IP address and port fields (SIP,port) and the latter the destination
16

IP address, port, protocol, action and option (DIP,port,proto,action,option), where
option is applicable only to “log” and “mirror” actions, otherwise is null. A
two-dimensional reachability matrix for a firewall i (Mi) has SIP,port as row and
DIP,port,proto,action,option as column. Therefore, the equivalent rule set (Re,i) has
rules with four types of action: “accept”, “accept/forward”, “log”, and “mir-
ror”. To simplify further analysis (e.g., the comparison among rules with the
same action) we organize the rule set into four matrices, one for each action
type. More in details, the composition phase, for each firewall i:
1. creates four matrices for generated rules: Mg,a,i (contains rules with ac-
cept action), Mg,af,i (contains rules with accept/forward action), Mg,l,i
(contains rules with log action) and Mg,m,i (contains rules with mir-
ror action). Each matrix contains the SIP,port individuals as rows and
DIP,port,proto,action,option as columns. For “accept” and “accept/forward”
the option is set to “null”;
2. creates four matrices for deployed rules: similarly to the previous step,
this generates Md,a,i, Md,af,i, Md,l,i and Md,m,i;
3. computes Mg,a,i, Mg,af,i, Mg,l,i, Mg,m,i: for each rule r of Re,i, i.e., r ∈
Re,i: if r is part of Rg,i rules, i.e., r ∈ Rg,i, sets 1 for corresponding row
and column, otherwise 0;
4. computes Md,a,i, Md,af,i, Md,l,i, Md,m,i: for each rule r of Re,i, i.e., r ∈
Re,i: if r is part of Rd,i rules, i.e., r ∈ Rd,i, sets 1 for corresponding row
and column, otherwise 0.
IV. Analysis: this phase compares reachability property of generated with de-
ployed rules. For each firewall i, we compute:
1. Mρ,a,i = Mg,a,i −Md,a,i for “accept” rules;
2. Mρ,af,i = Mg,af,i −Md,af,i for “accept/forward” rules;
3. Mρ,l,i = Mg,l,i −Md,l,i for “log” rules;
4. Mρ,m,i = Mg,m,i −Md,m,i for “mirror” rules.
If Mρ,x,i = 0 (where x stands for a, af , l or m) i.e., when all the elements are
equal to 0, the reachability for deployed and generated rules is the same for a
17
particular action. When Mρ,a,i,Mρ,af,i,Mρ,l,i,Mρ,m,i are equal to 0 no security
issue is identified. Otherwise (Mρ,x,i 6= 0) at least an element is equal to 1 or
−1. In the first case the corresponding rule is not deployed into the firewall.
Therefore, the firewall configuration drops a packet that must be permitted by
the policy. This situation is reported as an anomaly. Otherwise (equal to −1)
the corresponding rule is enforced by the firewall configuration but it is prohib-
ited by the policy. In this situation, the firewall contains a misconfiguration and
RAP logs it as security issue.
In particular, when an element (i.e., a rule) of Mρ,a,i or Mρ,af,i is equal to
1 a misconfiguration or an attacker blocks a particular traffic (removing the re-
lated firewall rule), that is authorized by the policy but dropped by the firewall.
On the contrary (−1), a rule is added or modified (when no rule was removed
or added but at least one field is modified) to permit a particular traffic. The
values of Mρ,l,i are useful to detect when logging rules are removed, modified
or added to track some traffic. The deletion of logging rules is a typical ap-
proach to masquerade attacks, removing evidence to increase the complexity
of forensic analysis. Similarly, the modification of a logging rule (e.g., chang-
ing the remote IP of the logging server) could be useful to redirect log traffic,
e.g., sending data to a different server that discards traffic instead of perform-
ing analysis, or to a malicious endpoint to track network traffic. The insertion
of a new logging rule otherwise can be considered as a misconfiguration or an
attack to gain information on network communications. Traffic mirroring and
related rules, represented by matrix Mρ,m,i, is a functionality typically used to
perform analysis on network content (e.g., to be analyzed by an Intrusion De-
tection System). Similarly, to logging, the network content could be redirected
to a malicious endpoint (e.g., to capture sensitive data) or suppressed by an at-
tacker to avoid analysis (e.g., to detect traffic anomalies). Finally, RAP reports
detected issues (i.e., anomalies, security issues) and proposes a remediation,
i.e., a list of suggestions on how to modify the firewall rules or where to install
a filtering device (e.g., personal firewall) to enforce the policy.
18
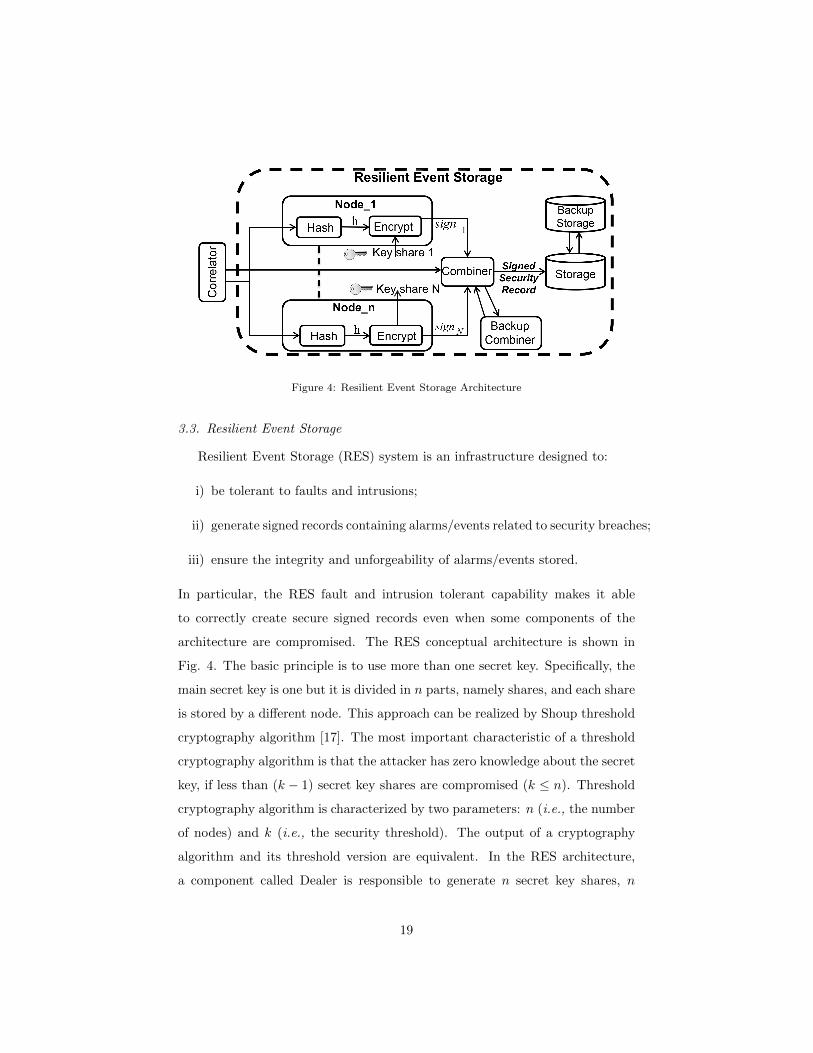
Figure 4: Resilient Event Storage Architecture
3.3. Resilient Event Storage
Resilient Event Storage (RES) system is an infrastructure designed to:
i) be tolerant to faults and intrusions;
ii) generate signed records containing alarms/events related to security breaches;
iii) ensure the integrity and unforgeability of alarms/events stored.
In particular, the RES fault and intrusion tolerant capability makes it able
to correctly create secure signed records even when some components of the
architecture are compromised. The RES conceptual architecture is shown in
Fig. 4. The basic principle is to use more than one secret key. Specifically, the
main secret key is one but it is divided in n parts, namely shares, and each share
is stored by a different node. This approach can be realized by Shoup threshold
cryptography algorithm [17]. The most important characteristic of a threshold
cryptography algorithm is that the attacker has zero knowledge about the secret
key, if less than (k − 1) secret key shares are compromised (k ≤ n). Threshold
cryptography algorithm is characterized by two parameters: n (i.e., the number
of nodes) and k (i.e., the security threshold). The output of a cryptography
algorithm and its threshold version are equivalent. In the RES architecture,
a component called Dealer is responsible to generate n secret key shares, n
19
verification key shares and one verification key from a main secret key. This
component is not shown in Figure 4 because it is used only in the initialization
phase. After Dealer has generated the keys, it sends each secret key share to
each node whereas n verification key shares and the verification key are sent to
the Combiner. Each verification key share is used to check the correctness of
each signature share generated by each node with its own secret key share. The
verification key is used to check the correctness of complete signature generated
when the Combiner puts together the signature shares provided by nodes. Input
data to the RES architecture are provided by SIEM “Correlator” (Figure 1)
because the alarms contain information about a security breach and they need
to be stored in secure way. The incoming alarm is sent to all nodes and to
the Combiner component. Then, each node computes a hash function of the
received alarm. This function returns a digest for this alarm, represented by h
in Figure 4. Finally, each node encrypts the digest h with the secret key share
and it generates a signature share that is sent to the Combiner. When the
Combiner receives at least k signature shares (from nodes) for the same alarm
it can assemble all partial signatures in order to generate a complete signature.
Then the Combiner verifies the complete signature through the verification key.
If the verification process fails, the Combiner verifies the correctness of each
signature share using the corresponding verification key share. When the node
that sent the wrong signature share is discovered it is flagged as corrupted. Next
time, if new signature shares are available for the same alarm, the Combiner uses
the already validated signature shares and the new signature shares to create
a new set of k signature shares. Then the Combiner generates a new complete
signature and repeats the verification process. If the verification process is
successful this time, then the complete signature, the original alarm and the
identifiers of corrupted nodes are stored in a storage system. To improve the
intrusion and fault tolerance of RES, replication and diversity are employed in
the media storage and the Combiner component.
20

4. Case Study: Hydroelectric Dam
The architecture proposed in previous sections was used to monitor and
control a hydroelectric dam as an example of Critical Infrastructure monitoring.
The purpose of a hydroelectric dam (Figure 5 (a)) is to feed the power grid as
any common generator. The process that allows the generation of hydropower
is the following: - the reservoir is fed by a river; - a certain amount of water
contained in the reservoir flows through more than one penstock and such flow
moves a turbine; - the turbine is connected to an alternator that converts the
mechanical energy into electrical energy; - the electrical energy is injected in a
transmission line of the power grid.
The power generated by hydroelectric dam mainly depends on two quanti-
ties: the water flow rate Q provided to the turbine through the penstocks and
the difference between water level (meters) in the reservoir and water level in
the turbine ∆h. The complete expression used to calculate the power generated
by turbine rotation is described in Expression 2:
P = ρ ∗ η ∗ g ∗∆h ∗Q (2)
where: ρ is the water density (103Kgm3 ), η is the efficiency of the turbine; g
is the gravitational constant (10ms2 ). If we suppose that ∆h is a constant in
Expression 2, then we obtain that the power is only a function of the water flow
rate Q. With this assumption it is possible to increase the power generated by
increasing Q. The upper bound of the water flow rate that feeds the turbine
is related to the penstocks geometry or/and turbine features. The dependency
between water flow rate and the generic penstock geometry is described by the
Hazen-Williams Equation 3:
Q1.852 =∆h ∗ c1.852 ∗ d4.8704
l ∗ 10.675(3)
where: l is the length of penstock in meters; c is the penstock roughness co-
efficient; d is the inside penstock diameter (meters). The hydroelectric plant
turbine is designed considering a function of three parameters: ∆h, n, i.e., the
21
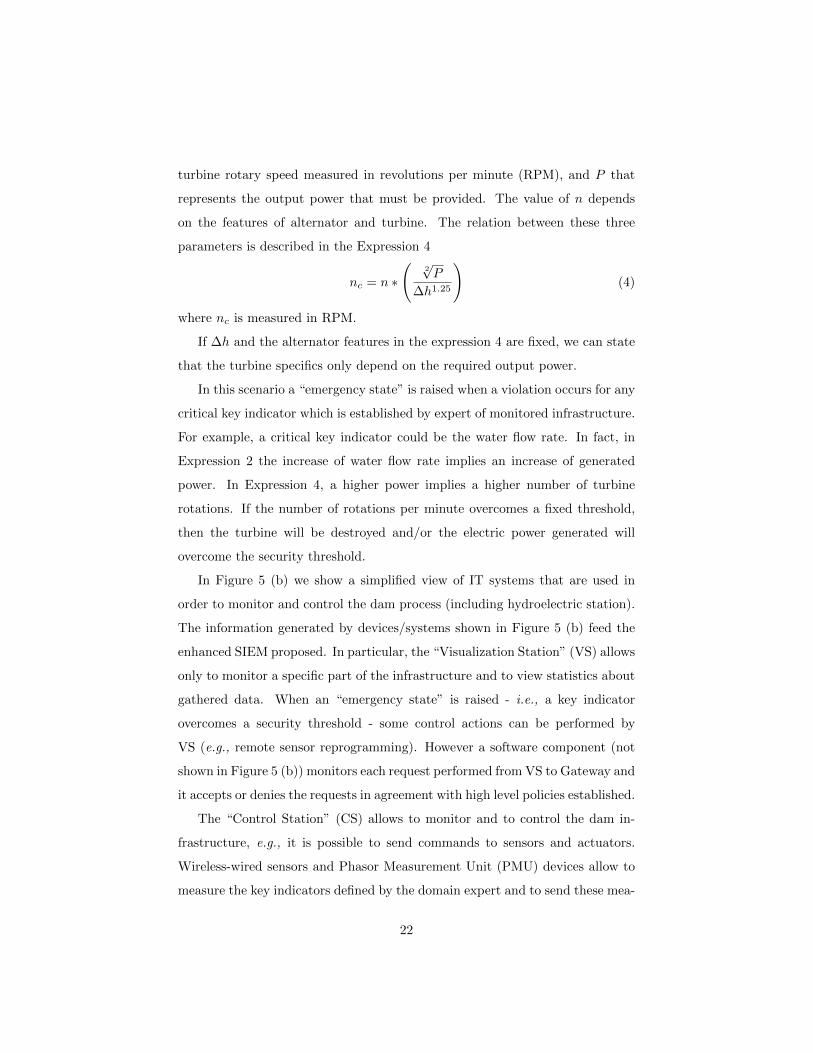
turbine rotary speed measured in revolutions per minute (RPM), and P that
represents the output power that must be provided. The value of n depends
on the features of alternator and turbine. The relation between these three
parameters is described in the Expression 4
nc = n ∗
(2√P
∆h1.25
)(4)
where nc is measured in RPM.
If ∆h and the alternator features in the expression 4 are fixed, we can state
that the turbine specifics only depend on the required output power.
In this scenario a “emergency state” is raised when a violation occurs for any
critical key indicator which is established by expert of monitored infrastructure.
For example, a critical key indicator could be the water flow rate. In fact, in
Expression 2 the increase of water flow rate implies an increase of generated
power. In Expression 4, a higher power implies a higher number of turbine
rotations. If the number of rotations per minute overcomes a fixed threshold,
then the turbine will be destroyed and/or the electric power generated will
overcome the security threshold.
In Figure 5 (b) we show a simplified view of IT systems that are used in
order to monitor and control the dam process (including hydroelectric station).
The information generated by devices/systems shown in Figure 5 (b) feed the
enhanced SIEM proposed. In particular, the “Visualization Station” (VS) allows
only to monitor a specific part of the infrastructure and to view statistics about
gathered data. When an “emergency state” is raised - i.e., a key indicator
overcomes a security threshold - some control actions can be performed by
VS (e.g., remote sensor reprogramming). However a software component (not
shown in Figure 5 (b)) monitors each request performed from VS to Gateway and
it accepts or denies the requests in agreement with high level policies established.
The “Control Station” (CS) allows to monitor and to control the dam in-
frastructure, e.g., it is possible to send commands to sensors and actuators.
Wireless-wired sensors and Phasor Measurement Unit (PMU) devices allow to
measure the key indicators defined by the domain expert and to send these mea-
22
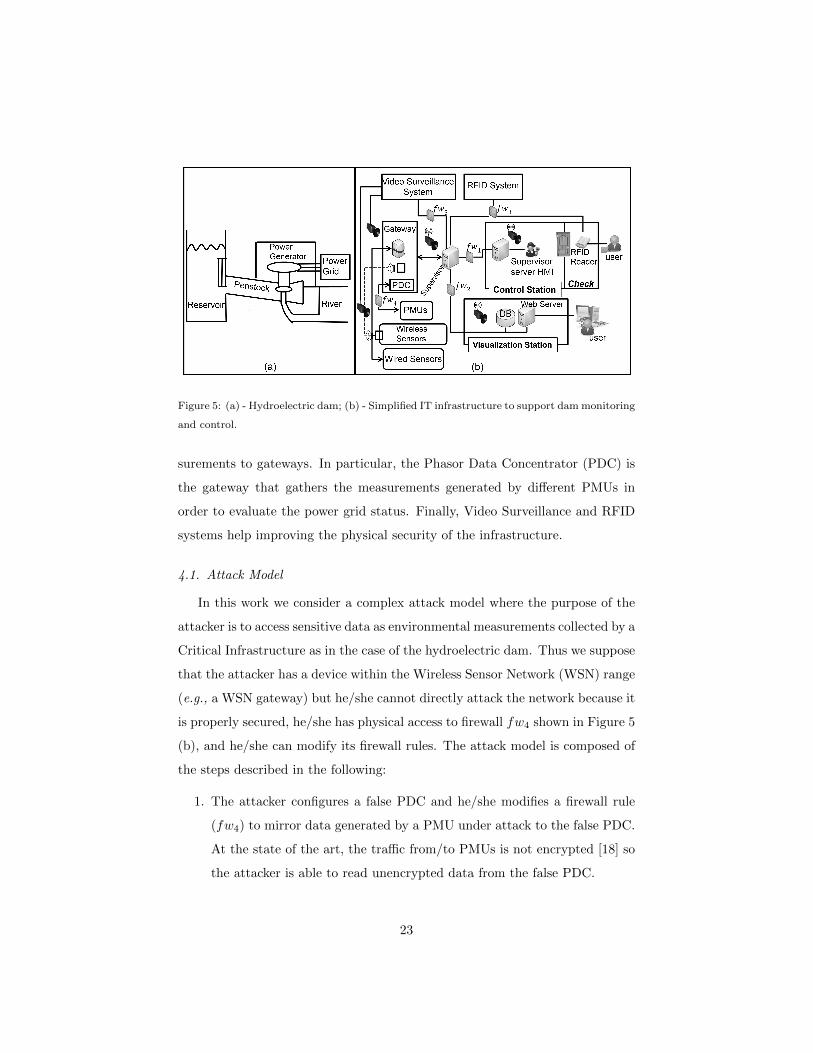
Figure 5: (a) - Hydroelectric dam; (b) - Simplified IT infrastructure to support dam monitoring
and control.
surements to gateways. In particular, the Phasor Data Concentrator (PDC) is
the gateway that gathers the measurements generated by different PMUs in
order to evaluate the power grid status. Finally, Video Surveillance and RFID
systems help improving the physical security of the infrastructure.
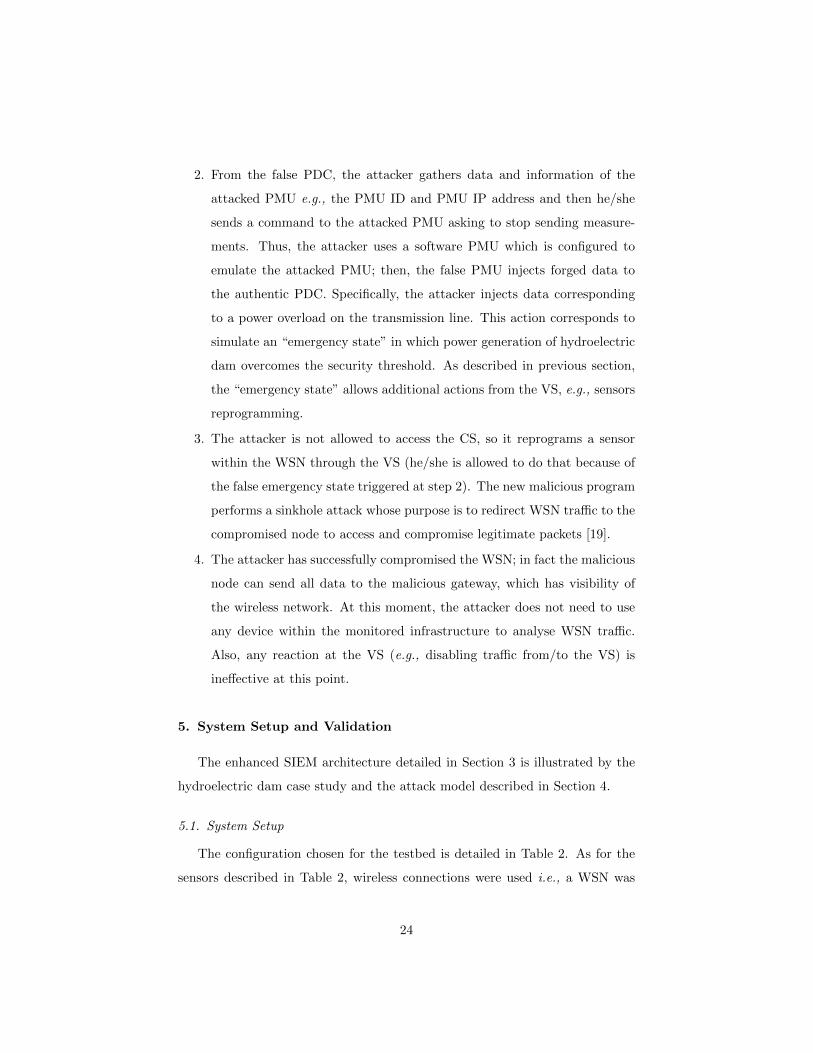
4.1. Attack Model
In this work we consider a complex attack model where the purpose of the
attacker is to access sensitive data as environmental measurements collected by a
Critical Infrastructure as in the case of the hydroelectric dam. Thus we suppose
that the attacker has a device within the Wireless Sensor Network (WSN) range
(e.g., a WSN gateway) but he/she cannot directly attack the network because it
is properly secured, he/she has physical access to firewall fw4 shown in Figure 5
(b), and he/she can modify its firewall rules. The attack model is composed of
the steps described in the following:
1. The attacker configures a false PDC and he/she modifies a firewall rule
(fw4) to mirror data generated by a PMU under attack to the false PDC.
At the state of the art, the traffic from/to PMUs is not encrypted [18] so
the attacker is able to read unencrypted data from the false PDC.
23
2. From the false PDC, the attacker gathers data and information of the
attacked PMU e.g., the PMU ID and PMU IP address and then he/she
sends a command to the attacked PMU asking to stop sending measure-
ments. Thus, the attacker uses a software PMU which is configured to
emulate the attacked PMU; then, the false PMU injects forged data to
the authentic PDC. Specifically, the attacker injects data corresponding
to a power overload on the transmission line. This action corresponds to
simulate an “emergency state” in which power generation of hydroelectric
dam overcomes the security threshold. As described in previous section,
the “emergency state” allows additional actions from the VS, e.g., sensors
reprogramming.
3. The attacker is not allowed to access the CS, so it reprograms a sensor
within the WSN through the VS (he/she is allowed to do that because of
the false emergency state triggered at step 2). The new malicious program
performs a sinkhole attack whose purpose is to redirect WSN traffic to the
compromised node to access and compromise legitimate packets [19].
4. The attacker has successfully compromised the WSN; in fact the malicious
node can send all data to the malicious gateway, which has visibility of
the wireless network. At this moment, the attacker does not need to use
any device within the monitored infrastructure to analyse WSN traffic.
Also, any reaction at the VS (e.g., disabling traffic from/to the VS) is
ineffective at this point.
5. System Setup and Validation
The enhanced SIEM architecture detailed in Section 3 is illustrated by the
hydroelectric dam case study and the attack model described in Section 4.
5.1. System Setup
The configuration chosen for the testbed is detailed in Table 2. As for the
sensors described in Table 2, wireless connections were used i.e., a WSN was
24
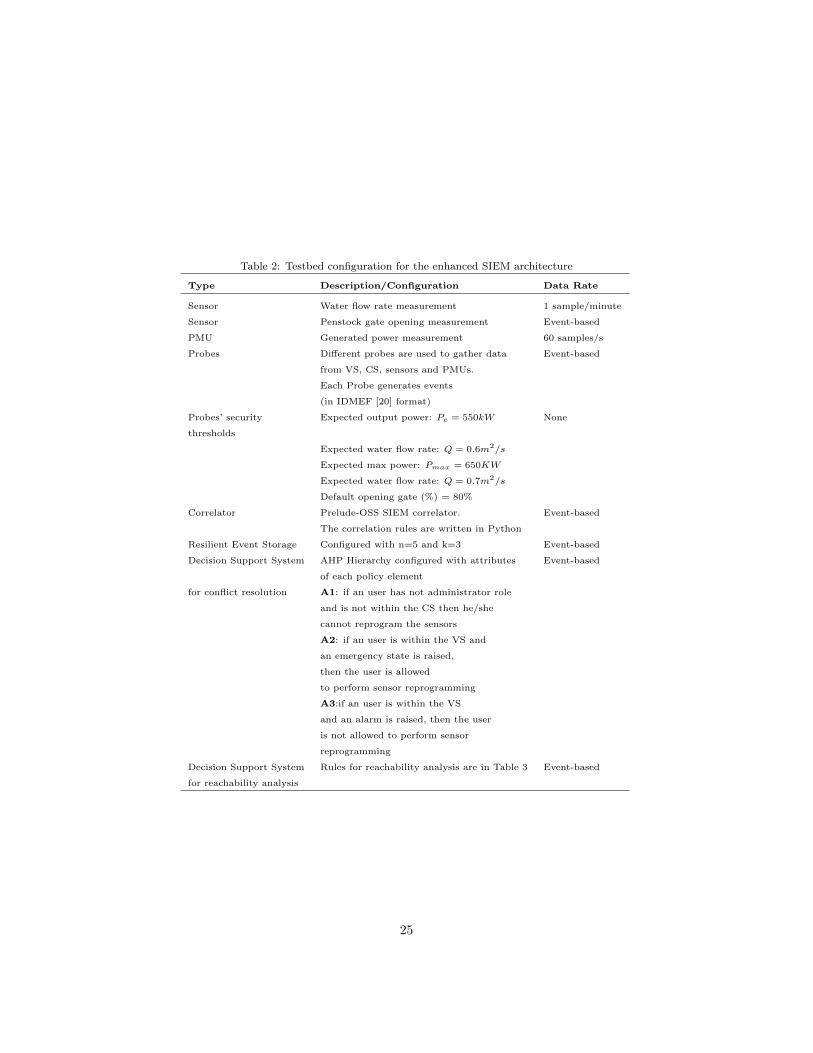
Table 2: Testbed configuration for the enhanced SIEM architecture
Type Description/Configuration Data Rate
Sensor Water flow rate measurement 1 sample/minute
Sensor Penstock gate opening measurement Event-based
PMU Generated power measurement 60 samples/s
Probes Different probes are used to gather data Event-based
from VS, CS, sensors and PMUs.
Each Probe generates events
(in IDMEF [20] format)
Probes’ security Expected output power: Pe = 550kW None
thresholds
Expected water flow rate: Q = 0.6m2/s
Expected max power: Pmax = 650KW
Expected water flow rate: Q = 0.7m2/s
Default opening gate (%) = 80%
Correlator Prelude-OSS SIEM correlator. Event-based
The correlation rules are written in Python
Resilient Event Storage Configured with n=5 and k=3 Event-based
Decision Support System AHP Hierarchy configured with attributes Event-based
of each policy element
for conflict resolution A1: if an user has not administrator role
and is not within the CS then he/she
cannot reprogram the sensors
A2: if an user is within the VS and
an emergency state is raised,
then the user is allowed
to perform sensor reprogramming
A3:if an user is within the VS
and an alarm is raised, then the user
is not allowed to perform sensor
reprogramming
Decision Support System Rules for reachability analysis are in Table 3 Event-based
for reachability analysis
25
chosen. This is because physical deploy of wired sensors on dams is a very
difficult task e.g., to use wired connections, hundreds of meters-long Ethernet
cables should be physically deployed on such an hostile environment as a dam. A
wired connection for sensors would cause a number of issues both for deployment
and maintenance, instead both tasks are much easier when a WSN is used.
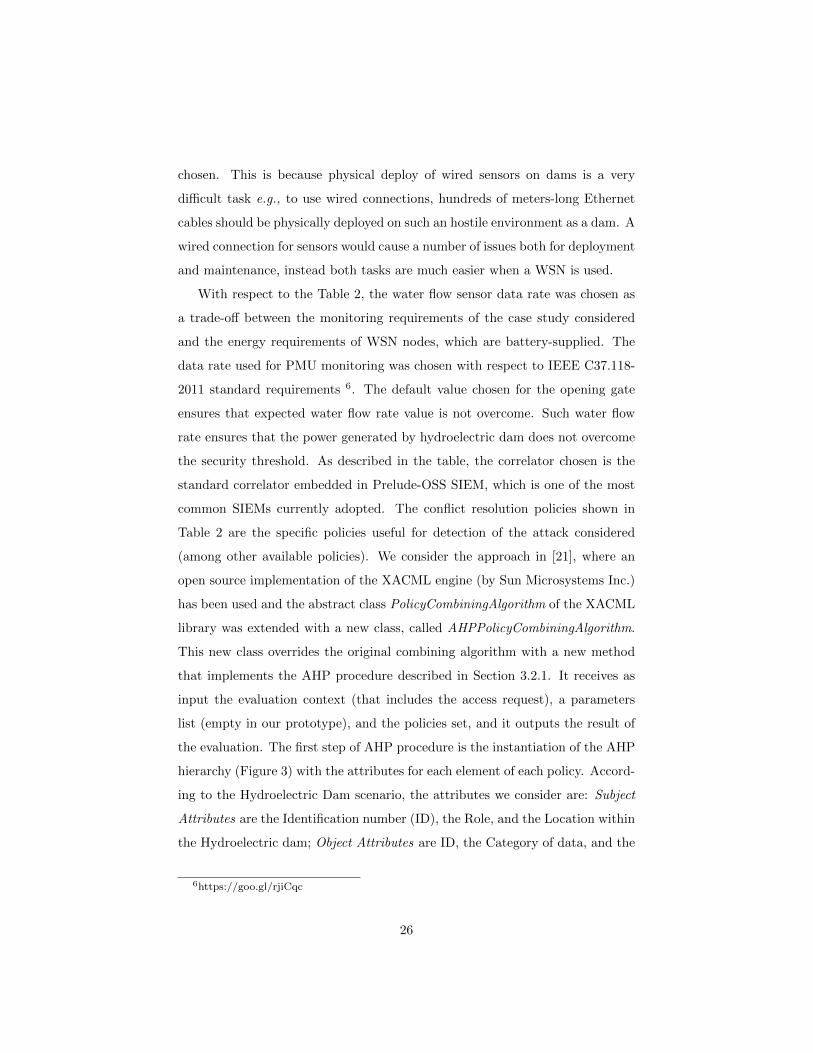
With respect to the Table 2, the water flow sensor data rate was chosen as
a trade-off between the monitoring requirements of the case study considered
and the energy requirements of WSN nodes, which are battery-supplied. The
data rate used for PMU monitoring was chosen with respect to IEEE C37.118-
2011 standard requirements 6. The default value chosen for the opening gate
ensures that expected water flow rate value is not overcome. Such water flow
rate ensures that the power generated by hydroelectric dam does not overcome
the security threshold. As described in the table, the correlator chosen is the
standard correlator embedded in Prelude-OSS SIEM, which is one of the most
common SIEMs currently adopted. The conflict resolution policies shown in
Table 2 are the specific policies useful for detection of the attack considered
(among other available policies). We consider the approach in [21], where an
open source implementation of the XACML engine (by Sun Microsystems Inc.)
has been used and the abstract class PolicyCombiningAlgorithm of the XACML
library was extended with a new class, called AHPPolicyCombiningAlgorithm.
This new class overrides the original combining algorithm with a new method
that implements the AHP procedure described in Section 3.2.1. It receives as
input the evaluation context (that includes the access request), a parameters
list (empty in our prototype), and the policies set, and it outputs the result of
the evaluation. The first step of AHP procedure is the instantiation of the AHP
hierarchy (Figure 3) with the attributes for each element of each policy. Accord-
ing to the Hydroelectric Dam scenario, the attributes we consider are: Subject
Attributes are the Identification number (ID), the Role, and the Location within
the Hydroelectric dam; Object Attributes are ID, the Category of data, and the
6https://goo.gl/rjiCqc
26
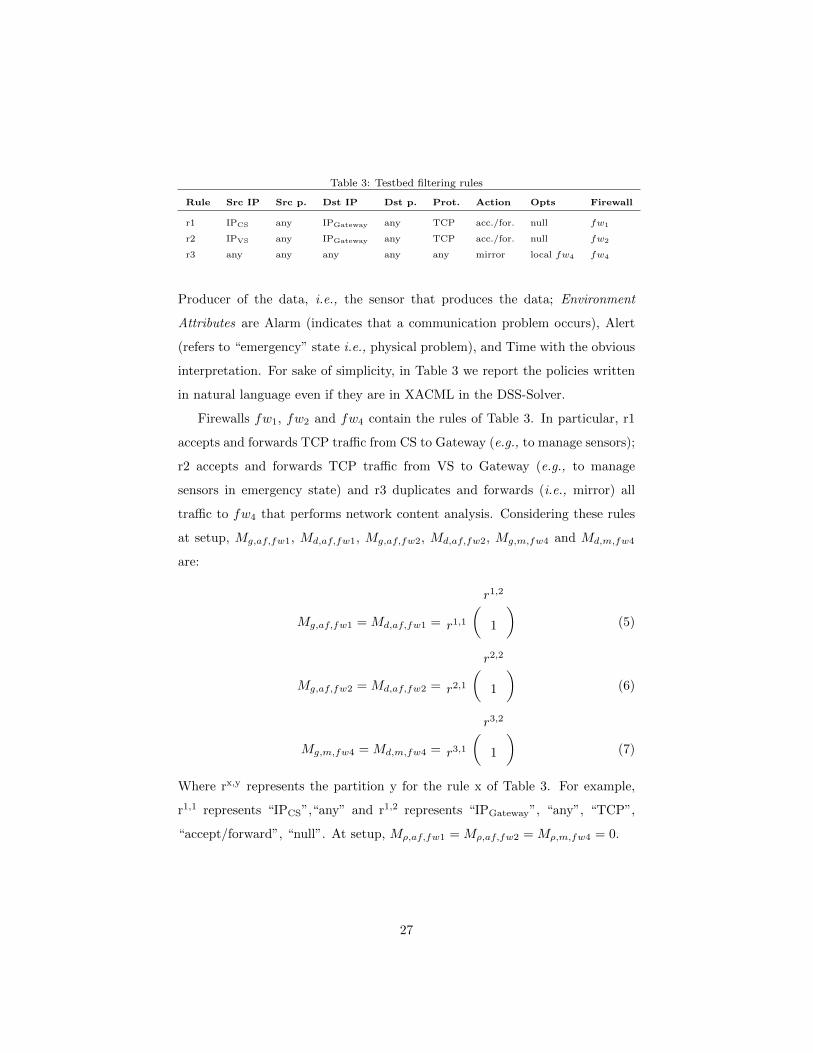
Table 3: Testbed filtering rules
Rule Src IP Src p. Dst IP Dst p. Prot. Action Opts Firewall
r1 IPCS any IPGateway any TCP acc./for. null fw1
r2 IPVS any IPGateway any TCP acc./for. null fw2
r3 any any any any any mirror local fw4 fw4
Producer of the data, i.e., the sensor that produces the data; Environment
Attributes are Alarm (indicates that a communication problem occurs), Alert
(refers to “emergency” state i.e., physical problem), and Time with the obvious
interpretation. For sake of simplicity, in Table 3 we report the policies written
in natural language even if they are in XACML in the DSS-Solver.
Firewalls fw1, fw2 and fw4 contain the rules of Table 3. In particular, r1
accepts and forwards TCP traffic from CS to Gateway (e.g., to manage sensors);
r2 accepts and forwards TCP traffic from VS to Gateway (e.g., to manage
sensors in emergency state) and r3 duplicates and forwards (i.e., mirror) all
traffic to fw4 that performs network content analysis. Considering these rules
at setup, Mg,af,fw1, Md,af,fw1, Mg,af,fw2, Md,af,fw2, Mg,m,fw4 and Md,m,fw4
are:
Mg,af,fw1 = Md,af,fw1 =
( r1,2
r1,1 1
)(5)
Mg,af,fw2 = Md,af,fw2 =
( r2,2
r2,1 1
)(6)
Mg,m,fw4 = Md,m,fw4 =
( r3,2
r3,1 1
)(7)
Where rx,y represents the partition y for the rule x of Table 3. For example,
r1,1 represents “IPCS”,“any” and r1,2 represents “IPGateway”, “any”, “TCP”,
“accept/forward”, “null”. At setup, Mρ,af,fw1 = Mρ,af,fw2 = Mρ,m,fw4 = 0.
27
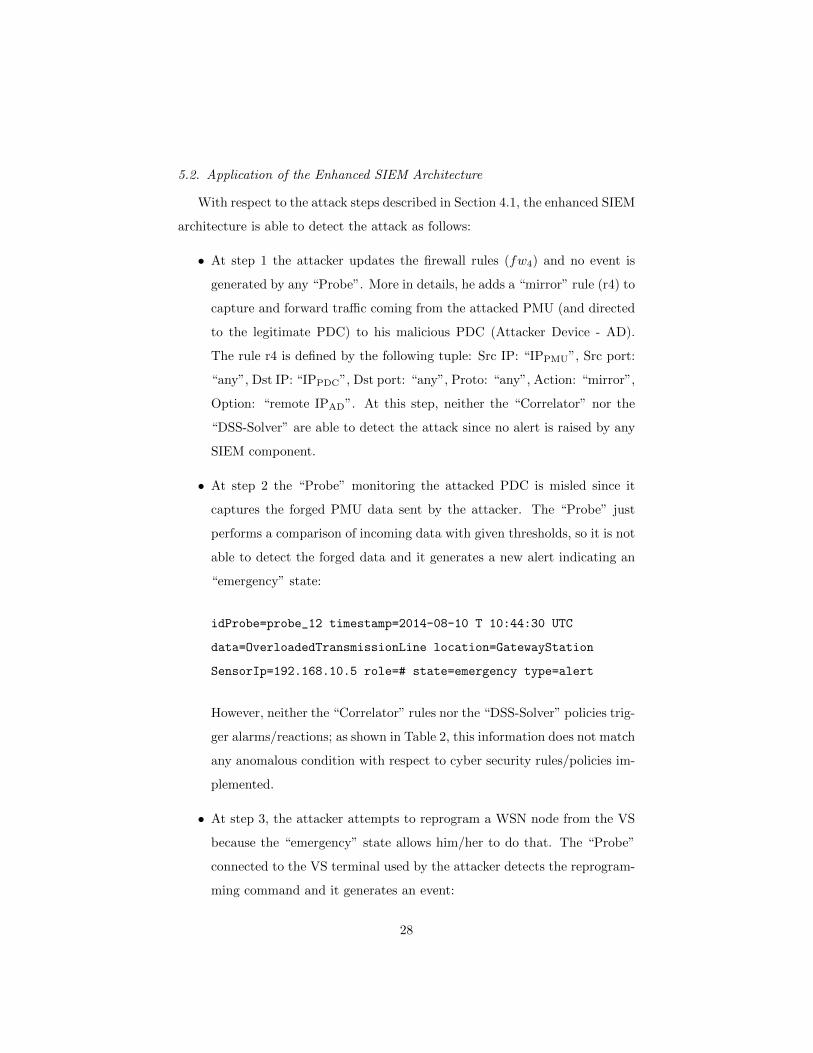
5.2. Application of the Enhanced SIEM Architecture
With respect to the attack steps described in Section 4.1, the enhanced SIEM
architecture is able to detect the attack as follows:
• At step 1 the attacker updates the firewall rules (fw4) and no event is
generated by any “Probe”. More in details, he adds a “mirror” rule (r4) to
capture and forward traffic coming from the attacked PMU (and directed
to the legitimate PDC) to his malicious PDC (Attacker Device - AD).
The rule r4 is defined by the following tuple: Src IP: “IPPMU”, Src port:
“any”, Dst IP: “IPPDC”, Dst port: “any”, Proto: “any”, Action: “mirror”,
Option: “remote IPAD”. At this step, neither the “Correlator” nor the
“DSS-Solver” are able to detect the attack since no alert is raised by any
SIEM component.
• At step 2 the “Probe” monitoring the attacked PDC is misled since it
captures the forged PMU data sent by the attacker. The “Probe” just
performs a comparison of incoming data with given thresholds, so it is not
able to detect the forged data and it generates a new alert indicating an
“emergency” state:
idProbe=probe_12 timestamp=2014-08-10 T 10:44:30 UTC
data=OverloadedTransmissionLine location=GatewayStation
SensorIp=192.168.10.5 role=# state=emergency type=alert
However, neither the “Correlator” rules nor the “DSS-Solver” policies trig-
ger alarms/reactions; as shown in Table 2, this information does not match
any anomalous condition with respect to cyber security rules/policies im-
plemented.
• At step 3, the attacker attempts to reprogram a WSN node from the VS
because the “emergency” state allows him/her to do that. The “Probe”
connected to the VS terminal used by the attacker detects the reprogram-
ming command and it generates an event:
28
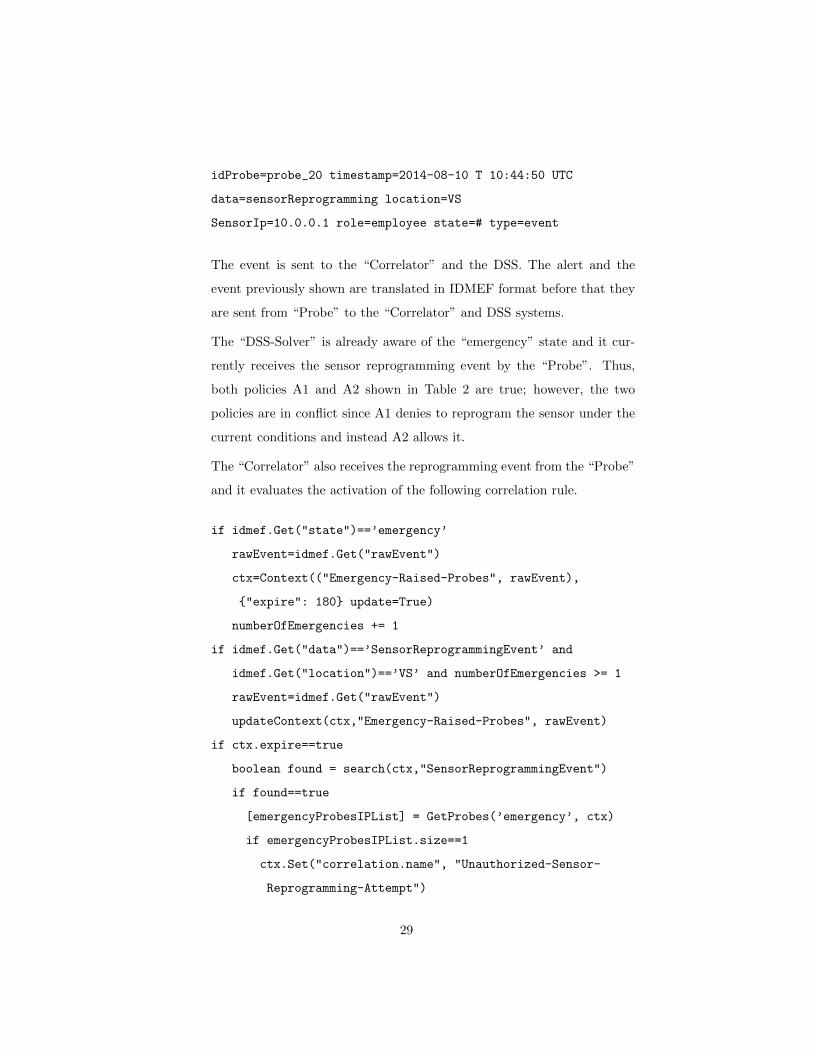
idProbe=probe_20 timestamp=2014-08-10 T 10:44:50 UTC
data=sensorReprogramming location=VS
SensorIp=10.0.0.1 role=employee state=# type=event
The event is sent to the “Correlator” and the DSS. The alert and the
event previously shown are translated in IDMEF format before that they
are sent from “Probe” to the “Correlator” and DSS systems.
The “DSS-Solver” is already aware of the “emergency” state and it cur-
rently receives the sensor reprogramming event by the “Probe”. Thus,
both policies A1 and A2 shown in Table 2 are true; however, the two
policies are in conflict since A1 denies to reprogram the sensor under the
current conditions and instead A2 allows it.
The “Correlator” also receives the reprogramming event from the “Probe”
and it evaluates the activation of the following correlation rule.
if idmef.Get("state")==’emergency’
rawEvent=idmef.Get("rawEvent")
ctx=Context(("Emergency-Raised-Probes", rawEvent),
{"expire": 180} update=True)
numberOfEmergencies += 1
if idmef.Get("data")==’SensorReprogrammingEvent’ and
idmef.Get("location")==’VS’ and numberOfEmergencies >= 1
rawEvent=idmef.Get("rawEvent")
updateContext(ctx,"Emergency-Raised-Probes", rawEvent)
if ctx.expire==true
boolean found = search(ctx,"SensorReprogrammingEvent")
if found==true
[emergencyProbesIPList] = GetProbes(’emergency’, ctx)
if emergencyProbesIPList.size==1
ctx.Set("correlation.name", "Unauthorized-Sensor-
Reprogramming-Attempt")
29
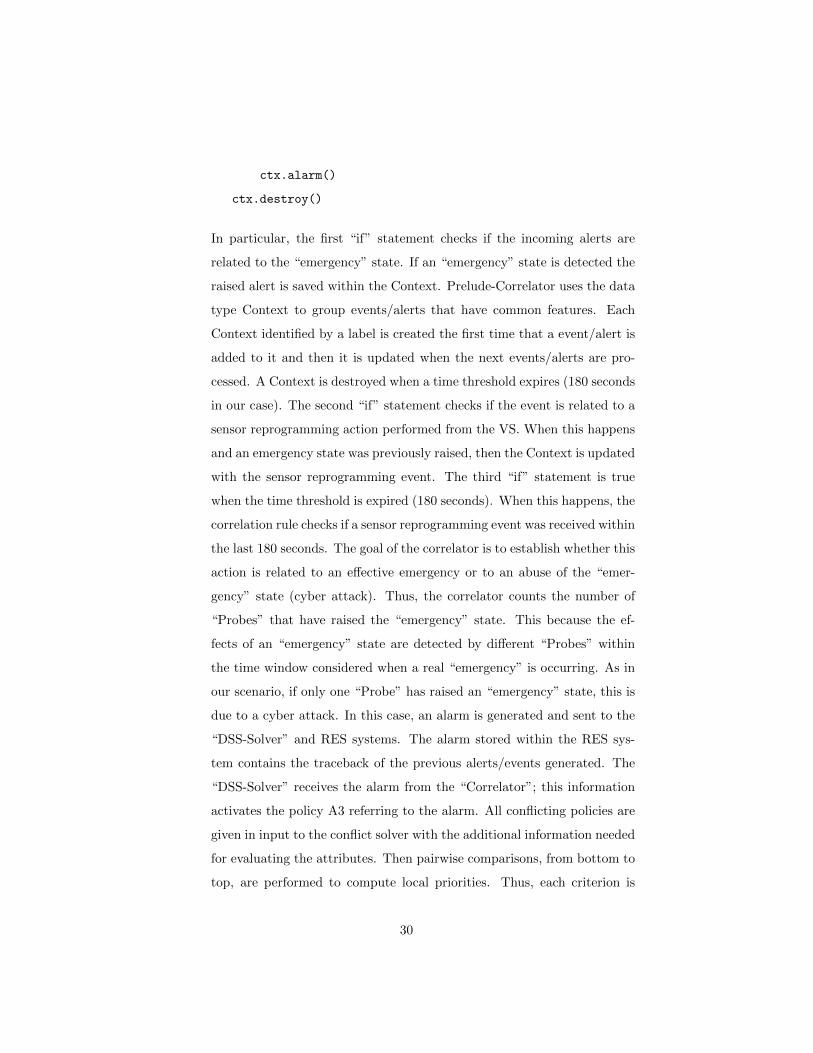
ctx.alarm()
ctx.destroy()
In particular, the first “if” statement checks if the incoming alerts are
related to the “emergency” state. If an “emergency” state is detected the
raised alert is saved within the Context. Prelude-Correlator uses the data
type Context to group events/alerts that have common features. Each
Context identified by a label is created the first time that a event/alert is
added to it and then it is updated when the next events/alerts are pro-
cessed. A Context is destroyed when a time threshold expires (180 seconds
in our case). The second “if” statement checks if the event is related to a
sensor reprogramming action performed from the VS. When this happens
and an emergency state was previously raised, then the Context is updated
with the sensor reprogramming event. The third “if” statement is true
when the time threshold is expired (180 seconds). When this happens, the
correlation rule checks if a sensor reprogramming event was received within
the last 180 seconds. The goal of the correlator is to establish whether this
action is related to an effective emergency or to an abuse of the “emer-
gency” state (cyber attack). Thus, the correlator counts the number of
“Probes” that have raised the “emergency” state. This because the ef-
fects of an “emergency” state are detected by different “Probes” within
the time window considered when a real “emergency” is occurring. As in
our scenario, if only one “Probe” has raised an “emergency” state, this is
due to a cyber attack. In this case, an alarm is generated and sent to the
“DSS-Solver” and RES systems. The alarm stored within the RES sys-
tem contains the traceback of the previous alerts/events generated. The
“DSS-Solver” receives the alarm from the “Correlator”; this information
activates the policy A3 referring to the alarm. All conflicting policies are
given in input to the conflict solver with the additional information needed
for evaluating the attributes. Then pairwise comparisons, from bottom to
top, are performed to compute local priorities. Thus, each criterion is
30
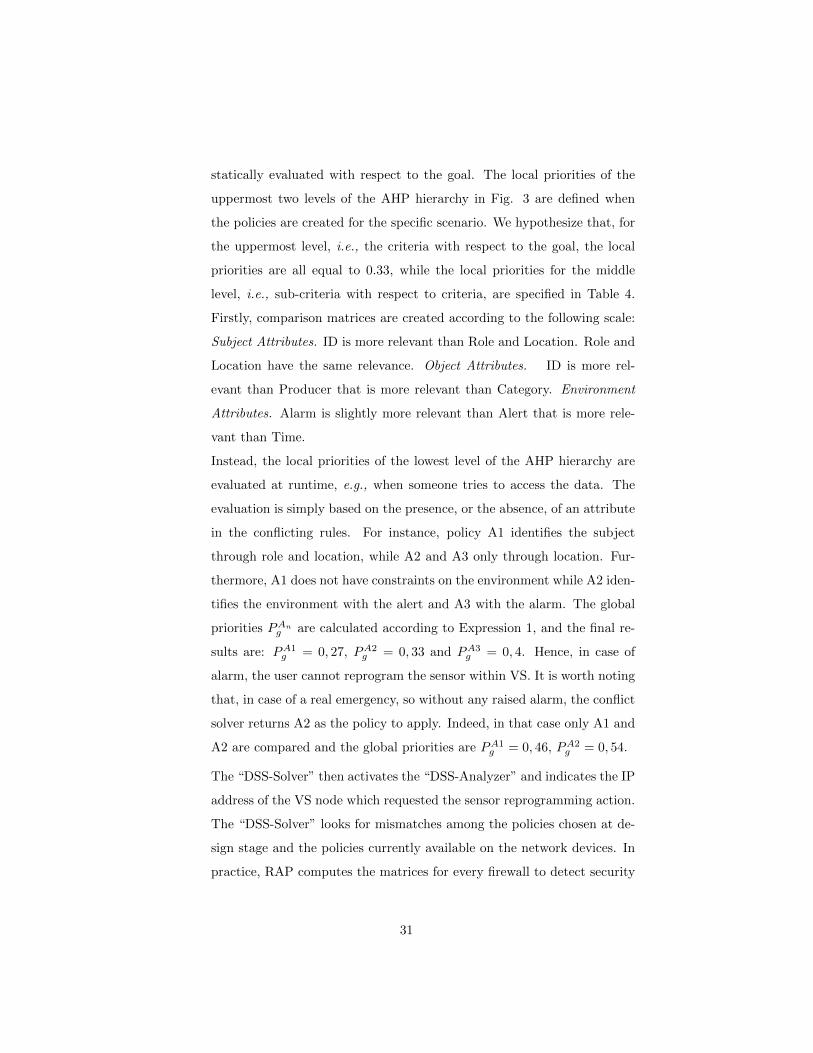
statically evaluated with respect to the goal. The local priorities of the
uppermost two levels of the AHP hierarchy in Fig. 3 are defined when
the policies are created for the specific scenario. We hypothesize that, for
the uppermost level, i.e., the criteria with respect to the goal, the local
priorities are all equal to 0.33, while the local priorities for the middle
level, i.e., sub-criteria with respect to criteria, are specified in Table 4.
Firstly, comparison matrices are created according to the following scale:
Subject Attributes. ID is more relevant than Role and Location. Role and
Location have the same relevance. Object Attributes. ID is more rel-
evant than Producer that is more relevant than Category. Environment
Attributes. Alarm is slightly more relevant than Alert that is more rele-
vant than Time.
Instead, the local priorities of the lowest level of the AHP hierarchy are
evaluated at runtime, e.g., when someone tries to access the data. The
evaluation is simply based on the presence, or the absence, of an attribute
in the conflicting rules. For instance, policy A1 identifies the subject
through role and location, while A2 and A3 only through location. Fur-
thermore, A1 does not have constraints on the environment while A2 iden-
tifies the environment with the alert and A3 with the alarm. The global
priorities PAng are calculated according to Expression 1, and the final re-
sults are: PA1g = 0, 27, PA2
g = 0, 33 and PA3g = 0, 4. Hence, in case of
alarm, the user cannot reprogram the sensor within VS. It is worth noting
that, in case of a real emergency, so without any raised alarm, the conflict
solver returns A2 as the policy to apply. Indeed, in that case only A1 and
A2 are compared and the global priorities are PA1g = 0, 46, PA2
g = 0, 54.
The “DSS-Solver” then activates the “DSS-Analyzer” and indicates the IP
address of the VS node which requested the sensor reprogramming action.
The “DSS-Solver” looks for mismatches among the policies chosen at de-
sign stage and the policies currently available on the network devices. In
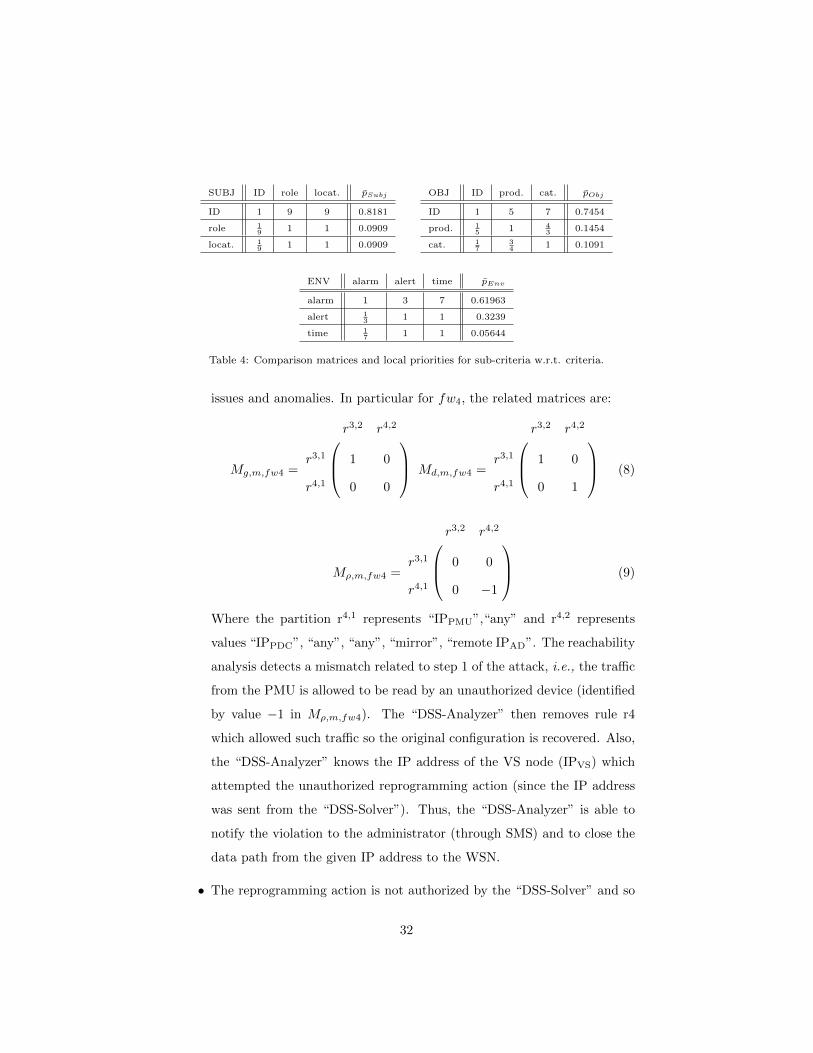
practice, RAP computes the matrices for every firewall to detect security
31
SUBJ ID role locat. p̄Subj
ID 1 9 9 0.8181
role 19 1 1 0.0909
locat. 19 1 1 0.0909
OBJ ID prod. cat. p̄Obj
ID 1 5 7 0.7454
prod. 15 1 4
3 0.1454
cat. 17
34 1 0.1091
ENV alarm alert time p̄Env
alarm 1 3 7 0.61963
alert 13 1 1 0.3239
time 17 1 1 0.05644
Table 4: Comparison matrices and local priorities for sub-criteria w.r.t. criteria.
issues and anomalies. In particular for fw4, the related matrices are:
Mg,m,fw4 =
r3,2 r4,2
r3,1 1 0
r4,1 0 0
Md,m,fw4 =
r3,2 r4,2
r3,1 1 0
r4,1 0 1
(8)
Mρ,m,fw4 =
r3,2 r4,2
r3,1 0 0
r4,1 0 −1
(9)
Where the partition r4,1 represents “IPPMU”,“any” and r4,2 represents
values “IPPDC”, “any”, “any”, “mirror”, “remote IPAD”. The reachability
analysis detects a mismatch related to step 1 of the attack, i.e., the traffic
from the PMU is allowed to be read by an unauthorized device (identified
by value −1 in Mρ,m,fw4). The “DSS-Analyzer” then removes rule r4
which allowed such traffic so the original configuration is recovered. Also,
the “DSS-Analyzer” knows the IP address of the VS node (IPVS) which
attempted the unauthorized reprogramming action (since the IP address
was sent from the “DSS-Solver”). Thus, the “DSS-Analyzer” is able to
notify the violation to the administrator (through SMS) and to close the
data path from the given IP address to the WSN.
• The reprogramming action is not authorized by the “DSS-Solver” and so
32
the malicious code cannot be injected in the WSN by the attacker; the
attack is not successful and the unauthorized action was also notified to
the administrator. Step 4 of the attack is not reached since the attack is
not successful.
6. Conclusion and Future Works
In this paper we provided an enhanced SIEM system to deal with cyber se-
curity problems in a Critical Infrastructure. We discussed about the limitations
of the existing SIEM systems and we proposed a new enhanced SIEM system
with the following functionalities: i) a “DSS-Solver” that is able to solve con-
flicts between policies when they are raised; ii) a “DSS-Analyzer” that allows
both to discover unauthorized IT network data paths and to reconfigure net-
work devices when misconfigurations/anomalies occur; iii) a “RES” that allows
to ensure integrity and unforgeability of stored data. Also we considered a hy-
droelectric dam as application scenario in which an attack model is performed
against this Critical Infrastructure. In particular, we detailed the setup of the
proposed system and we performed a step-by-step analysis that shows the ca-
pability of enhanced SIEM to detect and react to the considered attack. For
the future, we plan to perform an extensive experimental campaign in order to
analyze the effectiveness of the proposed solution. In particular, we will address
the management of false positives events in order to increase the accuracy of
the proposed methodology.
Acknowledgment
This work has been partially supported by the TENACE PRIN Project
(n. 20103P34XC) funded by the Italian Ministry of Education, University and
Research.
This research work was developed when Alessia Garofalo was at the Depart-
ment of Engineering, University of Naples “Parthenope”.
33
References
[1] Department of Homeland Security, What is critical infrastructure?
URL http://goo.gl/xmJZsI
[2] Department of Homeland Security, Presidential Policy Directive – Critical
Infrastructure Security and Resilience (2013).
URL https://goo.gl/KqJuR7
[3] D. Carr, Security Information and Event Management, Baseline, no. 47, p.
83, 2005.
[4] A. Williams, Security information and event management technologies, Sil-
iconindia Tehcnical Report, 2006 Vol. 10-1, pp 34-35.
[5] M. Nicolett, M. Kavanagh, Magic Quadrant For SIEM, Gartner Technical
Report, 2011, Last Access: 29/01/2016.
URL http://goo.gl/2upsI4
[6] I. Matteucci, P. Mori, M. Petrocchi, Prioritized execution of privacy poli-
cies, in: Data Privacy Management and Autonomous Spontaneous Security,
7th International Workshop, DPM 2012, and 5th International Workshop,
SETOP 2012, Pisa, Italy, September 13-14, 2012. Revised Selected Papers,
2012, pp. 133–145. doi:10.1007/978-3-642-35890-6_10.
URL http://dx.doi.org/10.1007/978-3-642-35890-6_10
[7] F. Cuppens, N. Cuppens-Boulahia, M. B. Ghorbel, High level conflict man-
agement strategies in advanced access control models, Electr. Notes Theor.
Comput. Sci. 186 (2007) 3–26.
[8] E. C. Lupu, M. Sloman, Conflicts in policy-based distributed systems man-
agement, IEEE Trans. Softw. Eng. 25 (6) (1999) 852–869.
[9] E. Syukur, Methods for policy conflict detection and resolution in pervasive
computing environments, in: WWW05, ACM, 2005, pp. 10–14.
34
[10] A. Masoumzadeh, M. Amini, R. Jalili, Conflict detection and resolution
in context-aware authorization, in: Security in Networks and Distributed
Systems, IEEE, 2007, pp. 505–511.
[11] N. Dunlop, J. Indulska, K. Raymond, Methods for conflict resolution in
policy-based management systems, in: Enterprise Distributed Object Com-
puting, IEEE, 2003, pp. 98–109.
[12] G. G. Xie, J. Zhan, D. A. Maltz, H. Zhang, A. Greenberg, G. Hjalmtysson,
J. Rexford, On static reachability analysis of ip networks, in: in Proc. IEEE
INFOCOM, 2005.
[13] E. Al-Shaer, W. Marrero, A. El-Atawy, K. Elbadawi, Network configura-
tion in a box: towards end-to-end verification of network reachability and
security, in: ICNP 2009, 2009, pp. 123–132.
[14] M. Afzaal, C. Di Sarno, L. Coppolino, S. D’Antonio, L. Romano, A re-
silient architecture for forensic storage of events in critical infrastructures,
in: Proceedings of the 2012 IEEE 14th International Symposium on High-
Assurance Systems Engineering, HASE ’12, IEEE Computer Society, Wash-
ington, DC, USA, 2012, pp. 48–55. doi:10.1109/HASE.2012.9.
URL http://dx.doi.org/10.1109/HASE.2012.9
[15] T. L. Saaty, A scaling method for priorities in hierarchical structures, Jour-
nal of Mathematical Psychology 15 (3) (1977) 234–281.
[16] T. L. Saaty, How to make a decision: The analytic hierarchy process,
European Journal of Operational Research 48 (1) (1990) 9 – 26, desicion
making by the analytic hierarchy process: Theory and applications.
doi:http://dx.doi.org/10.1016/0377-2217(90)90057-I.
URL http://www.sciencedirect.com/science/article/pii/
037722179090057I
[17] V. Shoup, Practical threshold signatures, in: Proceedings of EURO-
CRYPT’00, LNCS, 2000, pp. 207–220.
35
[18] V. Pappu, M. Carvalho, P. Pardalos, Optimization and Security Challenges
in Smart Power Grids - Section 4.5, Energy Systems, Springer, 2013.
URL https://books.google.it/books?id=Jnm8BAAAQBAJ
[19] L. Coppolino, S. D’Antonio, A. Garofalo, L. Romano, Applying data mining
techniques to intrusion detection in wireless sensor networks, in: Proceed-
ings of the 2013 Eighth International Conference on P2P, Parallel, Grid,
Cloud and Internet Computing, 3PGCIC ’13, IEEE Computer Society,
Washington, DC, USA, 2013, pp. 247–254. doi:10.1109/3PGCIC.2013.43.
URL http://dx.doi.org/10.1109/3PGCIC.2013.43
[20] H. Debar, D. Curry, B. Feinstein, The Intrusion Detection Message Ex-
change Format (IDMEF), RFC 4765 (Experimental) (March 2007).
URL http://www.ietf.org/rfc/rfc4765.txt
[21] A. Lunardelli, I. Matteucci, P. Mori, M. Petrocchi, A Prototype for Solving
Conflicts in XACML-based e-Health Policies, in: CBMS, IEEE, 2013, pp.
449–452.
36