Ensuring A Sustainable Future: An Energy Management ... · Ensuring a Sustainable Future: An Energy...
113
Ensuring a Sustainable Future: An Energy Management Guidebook for Wastewater and Water Utilities JANUARY 2008
Transcript of Ensuring A Sustainable Future: An Energy Management ... · Ensuring a Sustainable Future: An Energy...

Ensuring a Sustainable Future: An Energy Management Guidebook for Wastewater and Water Utilities
JANUARY 2008

FOREWORD.................................................................................................................................................................1
OVERVIEW............................................................................................................................................................2 to 4
How This Guidebook is Organized.....................................................................................................................5 to 9
Characterization of Your UtilityCrosswalk of Plan-Do-Check-Act Approach
PLANSESSION 1: Getting Ready..............................................................................................................................10 to 18
Module 1: Establish your utility’s energy improvement goalsModule 2: Secure and maintain management commitment, involvement, and visibilityModule 3: Choose an energy “fenceline”Module 4: Establish energy improvement program leadership Module 5: Secure and maintain employee buy-inModule 6: Communicate results
SESSION 2: Assessing Current Energy Baseline Status.............................................................................19 to 33
Module 1: Benchmark energy efficiency informationModule 2: Conduct an energy assessment or baseline audit Module 3: Review legal and other requirements and establish a compliance baseline
SESSION 3: Establishing an Energy Vision and Priorities for Improvement.............................................34 to 43
Module 1: Develop an energy policyModule 2: Identify activities and operations that consume energyModule 3: Prioritize activities/operations and potential energy improvement efforts
SESSION 4: Identifying Energy Objectives and Targets..............................................................................44 to 50
Module 1: Establish energy objectives and targetsModule 2: Define performance indicators
DOSESSION 5: Implementing Energy Improvement Programs and Building a
Management System to Support Them..........................................................................................................51 to 62
Module 1: Develop action plans to implement energy improvements Module 2: Develop management system ‘operating controls’ to support energy improvements
CHECK & ACTSESSION 6: Monitoring and Measuring Your Energy Improvement Management Programs..................63 to 71
Module 1: Review what you currently monitor and measure for energy Module 2: Determine what else you need to monitor and measure for your priority energy improvement operations Module 3: Develop a plan for maintaining the efficiency of energy equipment Module 4: Review the progress of your energy targetsModule 5: Implement actions to adjust or correct when you are not progressing toward your energy goalsModule 6: Monitor/reassess compliance status
SESSION 7: Maintaining Your Energy Improvement Programs..................................................................72 to 76
Module 1: Continue to align energy goals with business/operational goalsModule 2: Apply lessons learnedModule 3: Expand involvement of management and staffModule 4: Communicate success
CONCLUSION............................................................................................................................................................77
Resources/Tools........................................................................................................................................................78
APPENDICES
Table of Contents

FOREWORD
Providing wastewater and drinking water service to citizens requires energy—and a lot of it. The twin problems ofsteadily rising energy costs and climate change have therefore made the issue of energy management one of the mostsalient issues facing wastewater and water utilities today. Energy management is also at the heart of efforts across theentire sector to ensure that utility operations are sustainable in the future. More and more utilities are realizing that asystematic approach for managing the full range of energy challenges they face is the best way to ensure that theseissues are addressed on an ongoing basis in order to reduce climate impacts, save money, and remain sustainable.Working closely with a number of utilities and others, the Office of Water at the U.S. Environmental Protection Agency(EPA) is proactively addressing this issue by developing this Energy Management Guidebook for Wastewater and WaterUtilities that provides a systematic approach to reducing energy consumption and energy cost.
This Guidebook was specifically written to provide water and wastewater utility managers with a step-by-step method,based on a Plan-Do-Check-Act management system approach, to identify, implement, measure, and improve energyefficiency and renewable opportunities at their utilities.
To accomplish these objectives, water and wastewater practitioners with experience in implementing energy efficiencyimprovements played a major role in developing the Guidebook, serving as Steering Committee members, along withEPA staff. Their experiences and insights were instrumental in the development of this guide.
U.S. EPA Project Officer
Jim HorneOffice of Wastewater ManagementWashington, DC
Steering Committee Members
Bob BoisEnvironmental Compliance OfficerSpringvale Water Treatment PlantNatick, Massachusetts
Katie JordanEnvironmental/Safety SpecialistOsram Sylvania Products Inc. Hillsborough, New Hampshire
Andy KricunDeputy Executive DirectorCamden County Municipal Utilities Authority (CCMUA)Camden, New Jersey
Jim NewtonEnvironmental Program ManagerKent County Public Works DepartmentDover, Delaware
Tom PedersenVice PresidentCamp Dresser & McKeeCambridge, Massachusetts
Mark YoungExecutive DirectorRegional Wastewater UtilityLowell, Massachusetts
Anne LeibyU.S. EPA Region 1
Gina SnyderU.S. EPA Region 1
EPA also would like to thank the followingindividuals that provided comments throughoutthe Guidebook’s development:
Linda Benevides Massachusetts Executive Office of Energy andEnvironmental Affairs
Leah BoweU.S. EPA Region 1
Catherine HatcherU.S. EPA, ENERGY STAR
Jean HolbrookU.S. EPA Region 1
Jackie LeClairU.S EPA Region 1
Jason TurgeonU.S. EPA Region 1
Madeline SnowUniversity of Massachusetts - Lowell
Global Environment & Technology Foundation
1
THIS GUIDEBOOK WAS DEVELOPED UNDER CONTRACT NUMBER GS-10F-0337M WITH THE OFFICE OF WASTEWATER MANAGEMENT AT THE U.S.ENVIRONMENTAL PROTECTION AGENCY

2
As a water or wastewater utility manager, you are facing unprecedented challenges that include ever increasing:� Public expectations for holding rates/taxes while maintaining service standards.� Population shifts/increases.� Number and complexity of regulatory requirements.� Maintenance and replacement of aging systems/infrastructure.� Concerns about security and emergency preparedness.� Changing work force demographics.� Challenges in managing personnel, operations, and budgets.
Overlaying all these issues are steadily rising energy costs for your utility. Dealing with these rising costs will requireutilities to better manage their energy consumption and identify areas for improvement. Water and wastewater utilityenergy consumption is generally on the order of 30-60% of a city’s energy bill.1
The graphs below further illustrate the challenges faced by the water and wastewater utility industry. The first illustratesthe trend in electricity costs/kWh in New England from 1990 to 2007 and second characterizes operational energy usefrom a National Association of Clean Water Agencies (NACWA) survey of water and wastewater utilities.2
Ensuring a Sustainable Future: AN ENERGY MANAGEMENT GUIDEBOOK
FOR WASTEWATER AND WATER UTILITIES
Data from Energy Information Administration, “The Current and Historical Monthly Retail Sales, Revenues and Average Revenue per Kilowatt hour by State and bySector,” EIA-826. Available online at http://www.eia.doe.gov/cneaf/electricity/page/sales_revenue.xls.
T. Jones, “Water-Wastewater Committee: Program Opportunities in the Municipal Sector: Priorities for 2006,” presentation to CEE June Program Meeting, June 14, 2006,Boston, MA. Available online at http://www.cee1.org/cee/mtg/6-06_ppt/jones.pdf.
1 –
2 –
1990
0.0
2.0
4.0
6.0
8.0
10.0
12.0
14.0
1991
1992
1993
1994
1995
1996
1997
1998
1999
2000
2001
2002
2003
2004
2005
2006
2007
In-plant pumping
38%
Aeration
26%
Effluent reuse
pumping
25%
Other
11%
New England Average Industrial Electricity Rate
(April of each year, from EIA)
National Association of Clean Water Agencies (NACWA)
Survey of Energy Use 47 Respondents used 2.1 billion kWh of electricity
Co
st,
Year
/kW
h
3
Energy represents the largest controllable cost of providing water or wastewater services to the public. Most facilitieswere designed and built when energy costs were not a major concern. With large pumps, drives, motors, and otherequipment operating 24 hours a day, water and wastewater utilities can be among the largest individual energy usersin a community.
In addition, a review of a facility’s energy performance may also identify other areas for operational improvements andcost savings such as labor, chemicals, maintenance, and disposal costs. Finally, a thorough assessment of a facility’senergy performance may alert managers to other issues. An unexplained increase in energy consumption may beindicative of equipment failure, an obstruction, or some other problem within facility operations.
Given these challenges, it is imperative for water and wastewater utilities to investigate implementing systematicprograms to minimize energy usage and cost, without sacrificing performance.
The purpose of this Energy Management Guidebook is to demonstrate to utility managers that it makes sound business andenvironmental sense to utilize a management system approach to optimize energy conservation efforts. Specifically, thisGuidebook will present a management system approach for energy conservation, based on the successful Plan-Do-Check-Act process, that enables utilities to establish and prioritize energy conservation targets (Plan), implement specificpractices to meet these targets (Do), monitor and measure energy performance improvements and cost savings (Check),and periodically review progress and make adjustments to energy programs (Act). The Guidebook will also provide reallife examples of water and wastewater utilities who have already realized significant benefits through use of an energymanagement program and provide a step-by-step process to show how to achieve the same benefits for your utility.
Similar to an operations plan, the Guidebook goes through the steps that a facility would take to understand their energyuse and set reduction goals, take actions, and make progress on achieving energy reduction targets.
By making a commitment to saving energy at your water or wastewater utility, you will also help maintain the confidenceof the public in the operations providing community services. In addition, by capitalizing on energy savingopportunities, a municipality or county utility can exert some control over rising costs for ratepayers of utility servicesas well as free up resources for other civic investments such as schools, police, or fire protection.
“A plan-do-check-act process is good for business and good for the environment. We can't do much about the weather and theoutside factors that drive bulk energy costs but we can commit to competitive volume purchases of energy and to employ energyconservation efforts to effectively hold down the ever increasing costs and impacts of fossil fuel-based energy usage. This processcan help identify energy conservation opportunities.”
Bob BoisSpringvale Water Treatment PlantNatick, Massachuse�s
“Energy production and usage have many areas of impact. Energy production is a major source of environmental impact andincludes impacts to air and water pollution and the depletion of natural resources. Energy usage takes costs from a facility’sbudget that could be be�er spent on employee wages/benefits or to stabilize a utility’s rate. A well thought out and implementedenergy management program will minimize the energy production and usage impacts and strengthen the position of yourutility.”
Andy KricunCamden County Municipal Utility AuthorityCamden, New Jersey
“Controlling our energy use saves money and creates budget capacity.”
James L. JutrasWater Quality SuperintendentEssex Junction, Vermont

4
There are 60,000 community drinking
water systems in the U.S.
Majority of energy use: pumping.
Energy use affected by: water source,
quality, storage, elevation, distance,
age, and process.
Major processes: production, treatment
(disinfection), and distribution.
Drinking Water and
Wastewater Utility Energy
There are 15,000 wastewater systems,
including 6,000 Publicly Owned
Treatment Works (POTWs) in the U.S.
Majority of energy use: treatment
process (aeration) and pumping.
Energy use affected by: population,
influent loading, effluent quality,
process type, size, and age.
Major processes: collection systems
(sewers and pumping stations),
wastewater treatment (primary,
secondary, and/or tertiary/advanced),
bio-solids processing, disposal, or re-
use.
Water and wastewater industries account
for an estimated 75 billion kWh of overall
U.S. electricity demand.
Drinking water and wastewater systems
in the U.S. spend about $4 billion a year
on energy to pump, treat, deliver, collect,
and clean water.
Energy efficiency investments often have
outstanding rates of return and can
reduce costs at a facility by 5%, 10%,
25%, or more.
Loads expected to increase by 20% in
next 15 years due to increased
populations and more stringent
regulations.
Energy costs for water and wastewater
can be 1/3 of a municipality's total energy
bill.
If drinking water and wastewater systems
reduce energy use by just 10% through
cost-effective investments, collectively
they could save approximately $400
million and 5 billion kWh annually.
Drinking Water UtilityWastewater Utility
*
*
*
*
*
*
*
*
*
*
*
*
*
*
Note: Total kWh of all MA Industrial Sectors equals 9,602,457,000.
Total estimated annual emissions from energy consumption at Massachusetts wastewater and water facilities4
• 957, 138 CO2 (tons)• 4,190,045 SO2 (tons)• 1,415,471 NOx (pounds)
Estimated kWh/Mgal kWh Water and Wastewater as% of all MA industrial
sectors
Costs
Wastewater treatment(not includingdistribution)
1,750 707,735,000 1.3% $91,439,362
Water treatment anddistribution estimated
1,500 386,137,500 0.74% $49,888,965
Totals for MA Water andWastewater Utilities
3,250 1,093,872,500 2.1% $141,328,327
Total Estimated Annual Electricity Consumption - Wastewater and Water Treatment Facilities in
Massachusetts3
MassDEP, 9/07. It should be noted that some states are exploring ways to integrate energy efficiency, renewable energy, and green building into State Revolving Fundsthat provide low-interest loans for wastewater and drinking water projects. See the work that MassDEP is doing to promote the integration of renewable energy andenergy conservation into new or upgraded construction projects at http://www.mass.gov/dep/energy.htm.
Ibid.See http://www.eere.energy.gov/industry/saveenergynow/partners/results.cfm for a list of industrial energy efficiency improvements; several case studies discuss returnon investment, often identifying measures with payback of 1-4 years. Some individual measures, such as changing incandescent lights to compact fluorescent, often have arate of return of 100% or more. An example of a wastewater utility implementing a comprehensive package of improvements for a similar return on investment is theMetropolitan Syracuse Wastewater Treatment Plant in Onondaga County, NY. See http://www.nrel.gov/docs/fy06osti/38076.pdf. The payback period was 13 months.
3-
4-
5-
FAST FACTS5
Note: Reduction in greenhouse gases can also be realized through improvements inenergy efficiency. The U.S. Climate Technology Cooperation Gateway website’s(http://www.usctcgateway.net/tool) Greenhouse Gas Equivalencies Calculator isdesigned to enable users to quickly and easily translate greenhouse gas reductionsfrom units that are typically used to report reductions (e.g., metric tons of carbondioxide equivalent) into terms that are easier to conceptualize (e.g., equivalentnumber of cars not driven for one year).

5
Now that you have some information on energy costs and the potential energy efficiency savings for your water orwastewater utility, you may be asking:
* What resources are available for me as a utility manager interested in pursuing energy efficiency at my facility?
* How do I set and measure energy efficiency and renewable energy targets? * Are there tools available to help me set and achieve energy goals? * How do I align my energy goals with current programs already in place such as health and safety or
quality programs, Capacity, Management, Operations, and Maintenance (CMOM), and/or asset managementplans?
This Energy Management Guidebook will help you answer these and many other questions by taking you through the stepsnecessary to set, manage, and achieve energy efficiency goals for your utility through the development andimplementation of a focused energy management program. These management programs can help you documentannual energy savings, decrease air emissions, and earn a return on their capital investment. The steps outlined in theGuidebook are replicable and based on a Plan-Do-Check-Act process that will assist you in:
1. Benchmarking and tracking monthly and annual energy use; 2. Identifying and prioritizing energy operations and issues that can increase efficiency; 3. Identifying energy efficiency objectives and targets;4. Defining the performance indicator(s) to use to measure progress towards your
energy targets;5. Establishing energy management programs (i.e., action plans to meet your goals);6. Monitoring and measuring the performance of your established target(s);7. Documenting and communicating success; and8. Reviewing your progress periodically and making adjustments as necessary.
As you begin to make the important decisions for your utility on energy efficiency and renewable opportunities, keepin mind that there are a number of resources and management tools that are available to you as a water and wastewaterutility manager. This Guidebook will define and link you to those resources and tools, as well as identify how you canalign your energy efficiency plans with current management programs and tools that you use or may be implementingat your utility.
Throughout this Guidebook, you will see step-by-step sessions, modules, and exercises along with real life examples fromwater and wastewater organizations, so that you can successfully implement energy efficiency and renewable goals foryour utility. Each module will define objectives, provide an overview of the main concepts, have the user completeexercises where applicable, and finally review the important takeaways specific to each module.
This Guidebook has been developed with significant input from water and wastewater utility professionals like you. Theyface the same energy challenges and are committed to addressing these issues based on the step-by-step approachdescribed in the Guidebook.
Thank you for taking the first steps toward improved energy management at your utility.
Jim HorneOffice of Wastewater ManagementU.S. EPA
2
How This Guidebook is Organized

6
You'll find the following icon symbols in each session:
Keys to Success indicates important takeaways to successful energy managementimplementation as identified by water and wastewater practitioners.
Consider This highlights a point or concept important to energy managementimplementation.
Reminders are key points to keep in mind.
Moving to the Next Session identifies key concepts for the next session and signals t the end of the current session.
TIP! identifies an important concept.

7
If this characterizes your situation... Then focus on: Use these tools:
“We are starting to think about ways to improve energymanagement but don’t know where to start.”
Developing an energymanagement program
Portfolio Manager Overview(http://www.energystar.gov/index.cfm?c=evaluate_performance.bus_portfoliomanager); EPA’s PerformanceTrack (www.epa.gov/perftrac/);Session 1: Getting Ready
“We have completed the benchmarking tool and want to setpriorities for energy improvement efforts.”
Conducting an energy audit Session 2: Assessing Current EnergyBaseline Status; Session 3:Establishing an Energy Vision andPriorities for Improvement
“We are a member of EPA’s Performance Track Program,committed to reduce energy consumption and reducegreenhouse gas emissions.”
Establishing targets; developingaction plans; measuring andmonitoring results; evaluatingprogress; aligning program withoperational goals
Portfolio Manager Overview(http://www.energystar.gov/index.cfm?c=evaluate_performance.bus_portfoliomanager); Greenhouse GasEquivalencies Calculator(http://www.epa.gov/cleanenergy/energy-resources/calculator.html.);Session 3: Establishing an EnergyVision and Priorities for Improvement;Session 4: Identifying EnergyObjectives and Targets
“We are using ENERGY STAR’s Portfolio Manager and haveidentified specific areas for improvement.”
Establishing targets; developingaction plans
Session 3: Establishing an EnergyVision and Priorities for Improvement;Session 4: Identifying EnergyObjectives and Targets
“We have completed an energy audit and want to set priorities forenergy improvement efforts.”
Prioritizing activities;establishing targets
Session 3: Establishing an EnergyVision and Priorities for Improvement
“We have implemented some great energy improvement projectsbut they don’t necessarily:• connect to each other,• get managed as well as they could be,• measure for results, and/or• have procedures or systems to ensure they continue.”
Measuring and monitoringresults; evaluating progress;aligning program withoperational goals
Portfolio Manager(https://www.energystar.gov/istar/pmpam/); Session 5: ImplementingEnergy Improvement Programs andBuilding a Management System toSupport Them; Session 6: Monitoringand Measuring Your EnergyImprovement Management Programs
Not sure how this Guidebook can help you? Review the table below to see what statement best characterizes your utility’ssituation and find out what you should focus on and with what tools. Sessions referred to in the table below can be foundin this Guidebook.
Characterization of your Utility

Session 1 8
If this characterizes your situation... Then focus on: Use these tools:
“We are part of an EPA, state, regional or municipal program toreduce energy consumption greenhouse gas emissions.”
Assessing emission footprint Portfolio Manager(https://www.energystar.gov/istar/pmpam/); NEPOOL emission factors(www.iso-ne.com); Session 6:Monitoring and Measuring YourEnergy Improvement ManagementPrograms; Session 7: MaintainingYour Energy Improvement Programs
“We have ideas or proposals for energy improvements includingrenewables.”
Developing action plans,identifying resources
Portfolio Manager(https://www.energystar.gov/istar/pmpam/); NEPOOL emission factors(www.iso-ne.com); DSIRE(www.dsireusa.org); Session 1:Getting Ready; Session 3:Establishing an Energy Vision andPriorities for Improvement; Session 4:Identifying Energy Objectives andTargets
“We have an asset management system and want to look at waysto improve energy management.”
Reviewing Crosswalk Tablepage 9; Incorporating energyaspects into the managementsystem
Session 1: Getting Ready; Session 2:Assessing Current Energy BaselineStatus
“We are developing an Environmental Management System andwant to incorporate energy improvements into its development.”
Reviewing Crosswalk Tablepage 9; Incorporating energyaspects into the managementsystem
U.S. EPA’s PEER Center(www.peercenter.net); Session 3:Establishing an Energy Vision andPriorities for Improvement
“We have a functioning Environmental Management System andwant to add in energy improvements and/or renewables.”
Reviewing Crosswalk Tablepage 9; Incorporating energyaspects into the managementsystem
DSIRE (www.dsireusa.org); Session 4: Identifying EnergyObjectives and Targets; Session 5:Implementing Energy ImprovementPrograms and Building aManagement System to SupportThem
“We have IS0 14001 certification and want to add in energyimprovements and/or renewables.”
Reviewing Crosswalk Tablepage 9; Incorporating energyaspects into the managementsystem
EPA’s Performance Track(www.epa.gov/perftrac/); Session 3:Establishing an Energy Vision andPriorities for Improvement; Session 4:Identifying Energy Objectives andTargets; Session 5: ImplementingEnergy Improvement Programs andBuilding a Management System toSupport Them
“We have set energy targets and want to measure performanceand communicate our results.”
Measuring and monitoringresults; evaluating progress;developing communicationstrategy
Session 6: Monitoring and MeasuringYour Energy ImprovementManagement Programs; Session 7:Maintaining Your EnergyImprovement Programs

9
Guidebook Section ENERGY STAR Asset Management ISO 14001 EnvironmentalManagement Systems
ANSI/MSE 2000: A ManagementSystem for Energy
I. Getting Ready Step 1: MakeCommitment
Make a commitment (e.g.,establish a policy) anddetermine assetmanagement planningneeds and preparemanagement and staffthrough early and on-goingcommunication and training
Make a commitment (e.g.,establish a policy) anddetermine environmentalmanagement planningneeds and preparemanagement and staffthrough early and on-goingcommunication and training
4.0 Management Systems forEnergy5.0 Management Responsibility5.1 Management Commitment5.3 Strategic Planning5.4 Responsibility and Authority
2. Assessing Current v Energy Baseline Status
Step 2: AssessPerformance
Step 1: Taking an inventoryof assets
4.3.1 EnvironmentalAspects and Impacts4.3.2 Legal and OtherRequirements4.5.2 Evaluation ofCompliance
6.0 Energy Management Planning6.1 Energy Profile6.2 External information6.3 Energy Assessment
3. Energy Vision andPriorities for Improvement
Step 1.3: Institutean Energy Policy
Step 1: Taking an inventoryof assetsStep 2: Prioritizing assets
4.2 Environmental Policy4.3.1 EnvironmentalAspects and Impacts
5.2 Energy Policy
4. Objectives and Targets Step 3: Set Goals 4.3.3 Objectives andTargets and EnvironmentalManagement Programs
5. Energy Improvement a Management Plans
Step 4: CreateAction Plan Step 5: ImplementAction Plan
Step 3: Developing anasset management planStep 4: Implementing anasset management plan
4.3.3 Objectives andTargets and EnvironmentalManagement Programs4.4.1 Resources, Roles,Responsibility, andAuthority4.4.2 Training, Awareness,Competence4.4.3 Communication4.4.6 Operational Control4.4.7 EmergencyPreparedness andResponse
7.0 Implementation and Operation7.1 Purchasing7.2 Facility, Equipment, andProcess Control7.3 Energy management projects7.4 Control of outsourced energyservices7.5 Communication7.6 Training, Competence, andAwareness
6. Monitoring anda Measuring
Step 6: EvaluateProgress
Step 5: Reviewing andrevising asset managementplans
4.5.1 Monitoring andMeasuring4.5.2 Evaluation ofCompliance4.5.3 Nonconformanceand Corrective Action andPreventive Action 4.5.5 EMS Audits4.6 Management Review
8.0 Checking and Evaluation9.0 Management Review
7. Maintaining Energy a Improvement
Programs
Step 7: RecognizeAchievements
The Plan-Do-Check Act approach in this Guidebook corresponds to the guidelines or other approaches such as ENERGYSTAR. This means that if you are already using another process, this Guidebook will support your efforts as well as give youadditional tools and assistance in focusing on energy improvements.
Crosswalk of Plan-Do-Check-Act Approach

Session 1 10
SESSION 1: Getting Ready
You may be eager to plunge directly into starting energy programs, but beforeyou do, it is important that you prepare your utility for the effort. Take the timeto lay the foundation for energy improvement programs using a systematicPlan-Do-Check-Act management system approach. Investing the time andeffort now will make a difference later on.
To successfully implement programs that improve energy efficiency,conservation, and use of alternative or renewable sources of energy, you willneed to:
1. Establish your utility’s energy improvement goals;
2. Secure and maintain management commitment, involvement, and
visibility;
3. Choose an energy “fenceline”;
4. Establish energy improvement program leadership;
5. Secure and maintain employee buy-in; and
6. Communicate results.
First let’s review a few terms that you will need to understand.
Energy Program Manager: The person who has the responsibility andmanagement authority for implementing your energy improvement programsfrom start to finish.
Energy Improvement Goal: A quantifiable energy efficiency objective that yourutility has made a decision to achieve.
Energy Fenceline: The scope of your operations where you will focus yourenergy improvement goals and where they will be implemented. For example,across all utility operations, within a particular operation (e.g. biosolids), or forone utility component (e.g. pumps).
Energy Team: A core team made up of individuals at your facility that will helpfacilitate and implement energy improvement programs. These are the peoplewithin your utility with knowledge of utility processes and energy usage andwill help communicate the importance of energy improvement to utility staff.
Generally, the Energy Team is composed of employees from various levels andfunctions who will assist in the design, implementation, and evaluation of yourenergy improvement programs. The Energy Team is made up of employeesand staff who are closest to the actual work in the operations of your scope orfenceline and who can bring a huge amount of institutional expertise andoperational experience that is critical to a strong energy improvement program.
The Energy Team plays an important leadership role in planning, delegatingtasks, establishing deadlines, collecting and evaluating work, and providingtraining, guidance, and assistance as needed. The Energy Program Managerheads the Team, and together they become the organization’s energy expertsand champions.
Keys to Success
� Management commitmentand support
� Active and meaningfulengagement of staff
� Ability to build on existingprocesses and projects
� Effective leader and team
� Balancing the need for ‘quickhits’ with longer term
changes
� Communication of
meaningful results

Session 1 11
Energy Team members should possess the following qualities:
• Knowledge of their operational and functional areas,
• Good communication and listening skills,
• Enthusiasm and commitment, and
• Respect and trust by employees and managers.
You may be able to use existing teams or groups that have been created in yourutility or municipality. Some organizations enlist volunteers for their team,others delegate and assign members. Keep in mind that the Energy Team needsthe authority as well as the responsibility to drive energy improvementprograms and support their implementation.
Working as a Team There are many ways to start work as an Energy Team. Try these trainingexercises to build an effective Energy Team within your organization.
• Identify and make a list of all the policies, standard operating procedures, and/or training related to energy currently in place inyour utility.
• Identify and list all the management systems or programs your utility has developed [e.g., CMOM, Asset Management, National Biosolids Partnership].
• Identify and list all the energy projects your utility is currently undertaking.

Session 1, Module 1 12
MODULE 1: Establish Your Utility’s Energy Improvement Goals
Module Objective: Identify how to align energy improvement goals with your current management, operations, and/ormaintenance plans and policies.
In developing energy improvement programs, take the time to understand how they fit in with your utility’s mission,goals, and strategic direction. Does your utility, board of directors, municipality, rate-payers, and general public want to:
* Reduce (control) energy costs by reducing/controlling energy use?
* Set an example for other public entities?
* Demonstrate leadership in sustainability or energy conservation initiatives and do the right thing for the environment?
* Help your state or community implement its Climate Change Action Plan and contribute to reducing greenhouse gas generation and other air pollution?
* Increase the use of renewable energy and alternative fuels, leading towards energy independence from foreign fuel sources?
* Enhance the utility’s or municipality’s public image?
If the answer to any of these questions is “yes,” you’re on the right path to identifying energy improvement goals that willalign with your utility’s objectives and plans.
Also, you may want to check to see if your community has a Climate Change Action Plan (http://www.iclei.org/index.php?id=1387®ion=NA) and coordinate your activities with the municipal lead orcommittee that is implementing the plan.
CONSIDER THIS... Ensure that your energy improvement goals align with and build on your current and/or planned utilitymanagement programs and plans.

Session 1, Module 2 13
MODULE 2: Secure and Maintain Management Commitment, Involvement,
a and Visibility
Module Objective: To learn how to obtain and sustain managementsupport for your energy improvement goals.
One of the most important steps in planning energy improvementprograms is to gain top management’s commitment and support. It iscritical that commitment and support comes from both local (municipal)leadership and your organization’s top and middle management as wellas the union leaders. In fact, experience has shown that publicorganizations who attempt to implement energy improvement programswithout top management support are unsuccessful.
During your preliminary discussions with management, you'll wantthem to clarify their specific goals and expectations. Find out what reallymotivates decision makers. Is it cost savings? Avoiding rate increases?Other pressures or aspirations?
Confirm that senior managers at your utility understand:
• The implementation strategy and schedule you are using,
• The estimated direct labor commitment involved,
• When, how, and what to communicate to employees on a regular basis, and
• How your energy program aligns with current management plans and programs.
Role of management:
• Demonstrate real commitment to energy improvements,
• Provide appropriate responsibility and authority designations, and
• Ensure that operators are recognized for their efforts and contributions.
CONSIDER THIS...Every organization implementing a new energy initiative or a management program has come to the sameconclusion about management—visibility, commitment, and involvement are the keys to success. Be sure yourenergy improvement programs include regular and frequent dialogue with management. They are more likelyto stay visible and involved if they have regular updates about the benefits and improvements your energyprograms are providing your utility.
Just like the rest of the employees,
senior managers will need training
to increase their awareness and
understanding. Short, frequent sessions that
address managers’ concerns and provide
examples of the benefits other utilities have
realized in energy improvement programs are
the most successful ways to keep management
up-to-date, interested, and involved.
Remember

Session 1, Module 3 14
MODULE 3: Choose an Energy “Fenceline”
Module Objective:To learn how to determine which operations andprocesses will be the focus of your energy improvement programs (i.e.,your “fenceline”).
You may not want to work on all energy opportunities in all buildings,locations, processes, and/or operations at once. Which ones shouldyou work on first?
Consider selecting one operation or department as an energy pilot,gaining confidence and experience as you develop improvementprograms. Personnel in the original fenceline can then become mentors,trainers, or leaders as new areas of the organization implement energyimprovement programs.
Example Energy Fencelines for Water and Wastewater Utilities:
Once top management has confirmed the fenceline selection, it's time to pay a visit to the managers and supervisors in yourenergy fenceline divisions. You'll certainly want to include all types of employees (e.g., union stewards, contractors,temporary staff) in your discussions right from the start. The time you invest now in promoting awareness, understanding,and buy-in, especially among managers and supervisors, will be time saved later in the process.
Questions to Consider When Selecting Your Fenceline:1) Which of your operations consumes the most energy use and costs the most?
2) Which operations might get results that could be replicated to other operations?
3) Which of your operations has the most receptive management? Line supervisors? Employees?
4) Is there any place in the system where you are losing energy to gravity?
5) Where could you get some quick improvements and create success stories to share?
CONSIDER THIS...Your energy improvement program scope or fenceline should be manageable so that people don’t getoverwhelmed or paralyzed, but noteworthy enough to document and build on success.
The Fenceline Golden Rule: Don’t bite off more than you can chew.
Water Supply or Wastewater Operations:
• Collection
• Treatment
• Distribution
Aspect of Operations:
• Pumping
• Sludge handling
• Heating, ventilation, air conditioning
(all buildings or a subset of buildings)
• Lighting
(all buildings or a subset of buildings)
Departments:
• Administration
• Electrical maintenance
• Structural maintenance
• Mechanical maintenance
Remember the rule: keep it super
simple (KISS). Starting with
smaller, more manageable operations
(or redundant operations), then expanding and
transferring the lessons learned and knowledge to
other departments is an option for your utility and
a good way to build momentum.
Remember

Session 1, Module 4 15
6 - To review a useful guide on team building from King County, WA, follow this link: (http://www.resourcesaver.com/file/toolmanager/CustomO73C230F53915.pdf)
MODULE 4: Establish Energy Improvement Program Leadership
Module Objective: To establish effective leadership for energy improvement programs.
Selecting an Energy Program ManagerFor any initiative or program to be successful, you need a person who iseffective at leading projects, someone who can take the responsibility andbe trusted with the authority for developing, implementing, andmaintaining your energy improvement programs. This person must havethe designated authority from management to get the job done and havea level of management authority themselves – this is pivotal to drive thesuccess of your energy programs.6
You have all been members of a team at some point in time. You may also havebeen the leader of a project or team. Leading initiatives and programs requires:
• Knowledge of operations,
• Good project management, organizational, and communication skills,
• Trust and respect of staff,
• Commitment and enthusiasm, and
• The ability to listen to others who have different perspectives and ideas.
Your Energy Program Manager will assume new responsibilities in addition toexisting ones. Be sure the Energy Program Manager and town and/or plantmanagement understand the scope of the work, including the number of hoursyou expect will be involved. All will need to be willing at times to redistributesome responsibilities to others in the organization.
In addition to typical project manager responsibilities, the Energy Program Manager will:
• Build and lead the Energy Team,
• Plan the project and implementation schedule,
• Gather, organize, and disseminate information,
• Delegate tasks and establish deadlines,
• Facilitate top management visibility and involvement,
• Obtain cross-functional support and buy-in, and
• Regularly meet and communicate with top management about the benefits and status of implementation.
“Leadership comes in many forms and atdifferent times. Be prepared to jump onit when it raises its head.”
Bob Bois
Springvale Water Treatment PlantNatick, Massachuse�s
Your water or wastewater utility
may already have managers and
staff that understand energy issues
and are leaders in managing teams
and programs. It is extremely beneficial to have
senior management designate one or two people
from these groups to become leaders in
developing and managing your energy
programs.
Remember
TIP!An Energy Team can include
people from across your utility
or municipal departments (e.g.,
engineering, finance, human resources,
operations, municipal electric
department, etc.) and include members
from all levels of the organization.
Members can even be pulled in from
operations outside the scope of the
fenceline. If your municipality already
has an energy team or committee,
connect with them.

Session 1, Module 4 16
Apply Your KnowledgeSit down with your Energy Team and fill out the table below to identify and document energy programs and informationthat your utility has implemented.
Worksheet of Previously Implemented and Planned Energy Improvement Projects
CONSIDER THIS...Your energy improvement program scope or fenceline should be significant enough to document successand build on that success and momentum, but manageable enough that people don’t get overwhelmed orparalyzed. It’s important to keep things moving, so remember to remain flexible and fluid. Keep it supersimple. The management system approach relies on checking and acting to continually review your work,so there will be many opportunities along the way to make improvements and course corrections.
Energy Use[type]
Projectscompleted
Results ($, gallons,
kWh,normalized if
possible)
Who did youcommunicate
results to?
Were there associated
SOPs, training,records?
Currentactivities in
planning
How will you measure
results?
Who couldyou
communicateresults to?
What SOPs,training andrecords willbe needed?

Session 1, Module 5 17
MODULE 5: Secure and Maintain Employee Buy-In
Module Objective: Establish employee buy-in for your energy improvement programs.
The same methods that you used for gaining management support can beapplied to gaining employee buy-in.
Get key employees involved early and often. It’s important to getemployee support from the beginning through ongoing, consistent, andopen dialogue. Employees should understand what the organizationwants to accomplish through its energy improvement programs. Thiscan go a long way toward gaining support and answering the questions“what’s in it for me” and “what will be required of me?” Communicateand ask employees for their interests and concerns during the planningstages and throughout implementation.
Ultimately, your organization will want to institutionalize energyconservation, efficiency, and energy renewable efforts and create anatmosphere or culture where looking for energy improvement opportunities becomes business as usual.
Ideas for building a team approach and involving employees from thevery beginning include:
• Holding a kick-off meeting and inviting top management (this helps everyone see this effort as a priority).
• Talking this effort up with employees, union stewards, middle managers, 2nd shifters, etc.
• Spending time talking with your operators and plant staff.
• Having one-on-one conversations with team members can identify their needs, concerns, and problem areas.
• Asking employees on the front-line what changes they might like to see in their operations as a result of this effort.
• Posting signs and information on bulletin boards in lunch-rooms and near coffee and copy machines to familiarize staff with energy issues.
• Advertising early successes to keep management and employees aware and interested.
CONSIDER THIS...Employee dialogue, buy-in, and involvement will help ensure that your efforts to improve energy efficiency arerealistic, practical, and add value.
“It is important to identify how eachperson’s fulfillment of their individual roleconnects to the utility’s ability to realize theoverall goals of the program. It is criticalthat everyone understands why it isimportant for them to do things in a certainway and how that contributes to the utility’soverall success. That, I have found, is thebest way to get employee buy-in, becausethey take ownership in the process.”
Andy Kricun
Camden County Municipal Utility Authority
Camden, New Jersey
Involving a cross section ofemployees from departmentsacross the organization early in
program planning is the best way topromote short and long-term commitmentthroughout the organization. Plus, it’s agreat way to gain support and ensure buy-in for your energy improvement programsand the management system that supportsthem.
Remember
Session 1, Module 6 18
MODULE 6: Communicate Results
Module Objective: To learn effective ways to communicate your energy improvement goals.
People are too often hesitant to communicate the status of an effort untilsomething “big” happens or they have achieved huge results. Make thetime to communicate the status of the efforts to develop energyimprovement programs, including small milestones, quick updates, orfindings. As an example, the Energy Team could package andcommunicate its initial inventory of energy projects (from the exercise onpage 16) and use the communication as an opportunity to confirm thatall current projects have been captured.
Mark your calendar to make sure that you are communicating something every month at a minimum, and preferably twice a month.
CONSIDER THIS...Communicate your energy improvement goals frequently with staff. This will help ensure involvement and buy-in to your goals.
Session 1 Resources & ToolsPublic Entity EMS Resource Center: http://www.peercenter.netEMS Handbook for Wastewater Utilities: http://www.peercenter.net/ewebeditpro/items/O11F10698.pdfENERGY STAR Challenge Toolkit: http://www.energystar.gov/index.cfm?c=implement_plan.communication_plan
Moving to the Next SessionIn Getting Ready, you developed the key to early success for any energy program initiative: identification and alignmentof goals with your utility’s or municipality’s overall management strategy. Frequent communication and involvementof management and staff builds credibility and ensures senior management visibility and commitment throughout theprogram. Having established a communications process should ensure that the team will be getting feedback andcontinued resources to do its job.
In the next Session, the Energy Team, with the help of utility staff, will begin to determine your utility’s current energyprogram status by benchmarking your utility and conducting an energy audit and compliance review to baseline data.
“It’s important to be flexible, to listen,and adapt to the needs of staff and theorganization.”
Bob BoisSpringvale Water Treatment PlantNatick, Massachusetts
Session 2 19
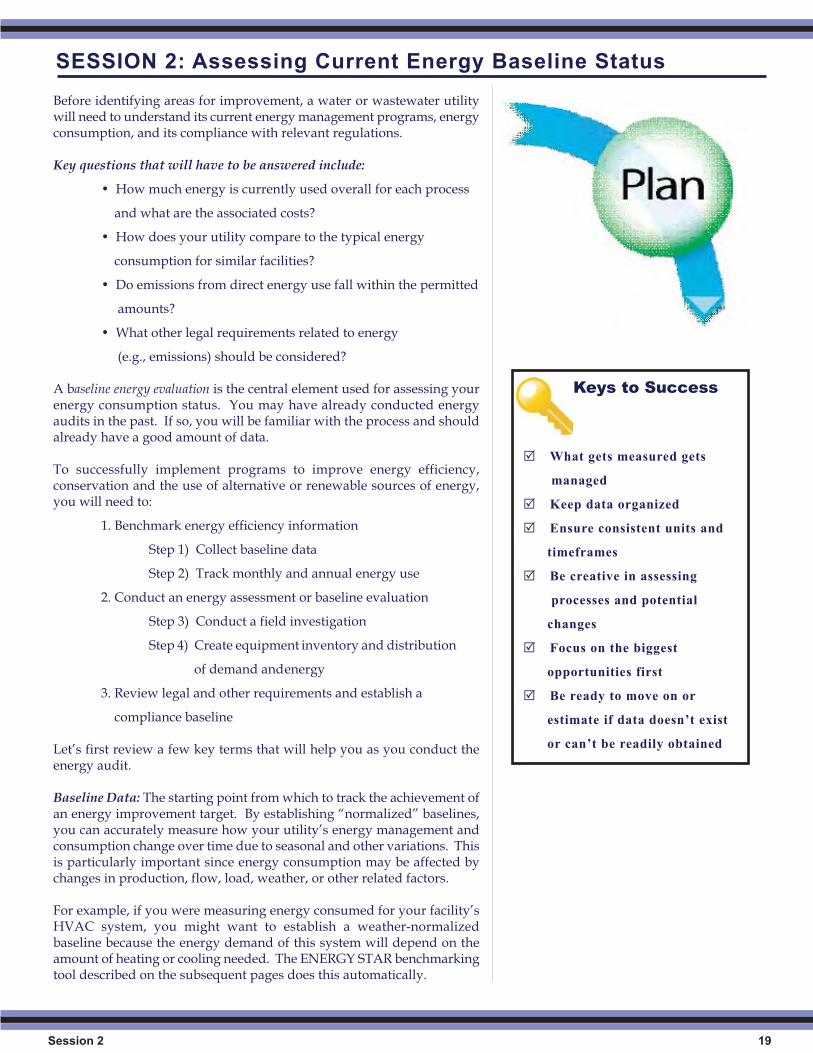
Before identifying areas for improvement, a water or wastewater utilitywill need to understand its current energy management programs, energyconsumption, and its compliance with relevant regulations.
Key questions that will have to be answered include:
• How much energy is currently used overall for each process
and what are the associated costs?
• How does your utility compare to the typical energy
consumption for similar facilities?
• Do emissions from direct energy use fall within the permitted
amounts?
• What other legal requirements related to energy
(e.g., emissions) should be considered?
A baseline energy evaluation is the central element used for assessing yourenergy consumption status. You may have already conducted energyaudits in the past. If so, you will be familiar with the process and shouldalready have a good amount of data.
To successfully implement programs to improve energy efficiency,conservation and the use of alternative or renewable sources of energy,you will need to:
1. Benchmark energy efficiency information
Step 1) Collect baseline data
Step 2) Track monthly and annual energy use
2. Conduct an energy assessment or baseline evaluation
Step 3) Conduct a field investigation
Step 4) Create equipment inventory and distribution
of demand andenergy
3. Review legal and other requirements and establish a
compliance baseline
Let’s first review a few key terms that will help you as you conduct theenergy audit.
Baseline Data: The starting point from which to track the achievement ofan energy improvement target. By establishing “normalized” baselines,you can accurately measure how your utility’s energy management andconsumption change over time due to seasonal and other variations. Thisis particularly important since energy consumption may be affected bychanges in production, flow, load, weather, or other related factors.
For example, if you were measuring energy consumed for your facility’sHVAC system, you might want to establish a weather-normalizedbaseline because the energy demand of this system will depend on theamount of heating or cooling needed. The ENERGY STAR benchmarkingtool described on the subsequent pages does this automatically.
Keys to Success
� What gets measured gets
managed
� Keep data organized
� Ensure consistent units and
timeframes
� Be creative in assessing
processes and potential
changes
� Focus on the biggest
opportunities first
� Be ready to move on or
estimate if data doesn’t exist
or can’t be readily obtained
SESSION 2: Assessing Current Energy Baseline Status

Session 2 20
For pumps and other treatment equipment, consider comparing your energyuse per million gallons of water treated to normalize your data.
For more information on normalizing data, review EPA’s Choosing aNormalizing Factor Basis and Performance Track’s Normalization Guidance(http://www.epa.gov/perftrac/apps/normalization.htm).
Design Specifications: A pump, fan, motor, or other system is designed todraw a given amount of electricity and do a corresponding amount of work.Design specifications provide this information. By comparing the powerdraw and the actual performance to the design specifications, you can see ifyour system is working as it should.
Energy Conservation: A general term for measures to reduce energyconsumption. Energy efficiency, most often used to mean achieving the sameresults with less energy or getting the most out of every watt includes manytypes of technologies. Other types of energy conservation measures mightinclude eliminating or changing certain processes or behavioral changes thatdo not involve a technology solution (e.g., turning off lights).
Energy Audit: A procedure undertaken to assess the current energyperformance and to identify opportunities for energy savings. An equipmentaudit focuses on one type of system, such as pumps, HVAC systems, orlighting. A process audit refers to wastewater treatment processes andfocuses on either one sub-set (such as aeration) or the overall treatmentprocess. A walk-though audit provides an initial and very general overviewof opportunities.
Intermittent Process: Many systems and processes do not run continuouslybut rather only at specific times. In some cases, processes can be scheduledto run during the night-time hours when grid power demand is low.
Load Profile: A variation of your energy demand over time that can be usedto plan how much power a facility will need to generate at any given time.While most end users consume more power during the daytime, some userssuch as water utilities can shift high-energy demand processes to off-peakhours.

Session 2, Module 1 21
MODULE 1: Benchmark Energy Efficiency Information
Module Objective: To compare your energy performance to similar utilities.
Information on comparable wastewater treatment utilities is likely to be available through ENERGY STAR’s BenchmarkingTool (see text box). Local utilities of similar size and design are excellent points of comparison. Broadening the search,one can find several resources discussing the “typical” energy consumption across the U.S. for a water or wastewaterutility of a particular size and design.
Some utilities will have an inherently higher or lower energydemand due to factors beyond their control. For example, largerplants will, in general, have a lower energy demand per milliongallons treated due to economies of scale. A plant that is largerelative to its typical load is going to have a higher energy demandper million gallons treated. Some secondary treatment processesrequire greater energy consumption than others. Still,benchmarking allows a rough estimate of the utility’s relativeenergy performance. Benchmarking of individual components isalso useful. A survey of one’s peers may identify what level ofperformance can realistically be expected from, say, a combinedheat and power system or a specific model of methane-fueledmicroturbine.
Apply Your KnowledgeUsing EPA’s Portfolio Manager, track energy use over time andcompare your utility to others in your region and across the nation.EPA’s energy performance rating, which is accessible onlinethrough Portfolio Manager (see below), will rate the energyefficiency of your wastewater treatment plant on a scale from 1 to100. EPA’s energy performance rating is normalized for locationand the impacts of year-to-year weather variations. The ratingsystem also allows you to manage facility flow rate, level oftreatment, and other operating characteristics.
In addition to tracking and rating energy use, Portfolio Managerallows you to measure and track energy costs and carbon emissionsassociated with the operation of your plant over time.
Establish a user account in Portfolio Manager• Go to http://www.energystar.gov/benchmark and login. If you do not already have a
user account in Portfolio Manager, click the New User link on the login page and follow the instructions.
• Portfolio Manager allows you to import facility data into Portfolio Manager using a downloadable Excel template. This minimizes manual data entry of large sets of facility data. This Excel-based upload template (sample next page) is also useful as you gather and track your monthly energy use and costs. After downloading the import template, carefully review the instructions as well as the Tips for a SuccessfulImport. Make sure your data is complete, particularly with regard to data that is required by Portfolio Managerfor rating purposes. When you have populated the import template, send it to [email protected] andupon review, your data will be uploaded into your account.
• To allow other organizations access to your portfolio with either read-only or administrative rights, you can share facility access with your Portfolio Manager account.
ENERGY STAR Criteria for Operating Characteristics for Wastewater Treatment Plant Requirements• Average daily wastewater flow in MGD ≥ 0.6
• Average influent BOD5 (biological oxygen demand) level 30 ≤ mg/liter ≤ 1000
• Average effluent BOD5 (mg/liter) level ≥ 0
The ENERGY STAR program,
administered by the U.S. Environmental
Protection Agency (EPA) has developed an
Energy Benchmarking Tool for Wastewater
Utilities along with a series of Best
Practices. These are available at
www.energystar.gov/benchmark. For water
utilities, the ability to measure and track
energy use, energy cost, and carbon
emission and corresponding reductions will
be available in 2008.
Several reports on wastewater utility
energy demand have been developed for
the California Energy Commission
(http://www.energy.ca.gov/process/water/).
The American Water Works Association
(AWWA) Research Foundation has also
developed a guide to Best Practices for
Energy Management
(http://www.awwarf.org/research/topicsand
projects/execSum/2621B.aspx).
•
•
•
Available Resources forBenchmarking

Session 2, Module 1 22
The template below provides an example of energy data from a wastewater utility that can be uploaded and tracked usingthe Portfolio Manager tool.
Sample Portfolio Manager Upload Template
CONSIDER THIS...Benchmarking can be useful, but no two utilities are ever exactly the same. You’ll have somecharacteristics that affect your relative performance and are beyond a utility’s control.
STEP 1: Collect Baseline Data Step Objective: To learn how to identify, locate, and assemble theinformation that can help you determine what you’ll need to improveyour energy performance.
The first step in collecting baseline data for your utility is to determinewhat data you already have available. At a minimum, have one full yearof monthly data for consumption of electricity, natural gas, and otherfuels – if you can get three years of data, even better. However, if youdon’t have data going this far back, use what you have or can easilycollect. In addition, if you can get the data at daily or hourly intervals,you may be able to identify a wider range of energy opportunities.
Facility Name Energy MeterID
Energy Type Start Date End Date EnergyConsumption
Energy Cost
Wastewater E223-455 Electricity 2/1/2007 2/28/2007 83,489 kWh $3,520
Wastewater E223-455 Electricity 1/1/2007 1/31/2007 83,826 kWh $3,580
Wastewater E223-455 Electricity 12/1/2006 12/31/2006 83,456 kWh $3,485
Wastewater E223-455 Electricity 11/1/2006 11/30/2006 83,623 kWh $3,259
Wastewater E223-455 Electricity 10/1/2006 10/31/2006 83,518 kWh $3,325
Wastewater E223-455 Electricity 9/1/2006 9/30/2006 83,794 kWh $3,450
Wastewater E223-455 Electricity 8/1/2006 8/31/2006 83,725 kWh $3,440
Wastewater E223-455 Electricity 7/1/2006 7/31/2006 83,676 kWh $3,250
Wastewater E223-455 Electricity 6/1/2006 6/30/2006 80,942 kWh $3,350
ENERGY STAR’s Portfolio
Manager can help your water or
wastewater treatment plant track
and assess energy consumption
across your entire utility. Follow this link
(http://www.energystar.gov/ia/business/govern
ment/wastewater_fs.pdf) to view an ENERGY
STAR Water and Wastewater Focus Fact
Sheet.
Remember

Session 2, Module 1 23
STEP 1 Continued...
Here are several data elements to document and track for your utility in order to review energy improvementopportunities.
• Water and/or wastewater flows are key to determining your energy performance per gallon treated. For drinking water, the distance of travel and number of pumps are also key factors.
• Electricity data includes overall electricity consumption (kWh) as well as peak demand (kW) and load profiles if available.
• Other energy data includes purchases of diesel fuel, natural gas, or other energy sources including renewables.
• Design specifications can help you identify how much energy a given process or piece of equipment should be using.
• Operating schedules for intermittent processes will help you make sense of your load profile and possibly plan an energy-saving or cost-saving alternative.
Keep in mind that energy units may vary. For example, captured methane orpurchased natural gas may be measured in 100 cubic feet (Ccf) or millions ofBritish Thermal Units (MMBTU). Develop a table like the one below todocument and track your data needs.
Note: * Methane capture will apply only to plants that digest their sludge. * * Collecting this type of data may provide you with a future renewable fuel source that could serve as a potential feedstock for biodieseland some locations can use it to generate electricity on site.
Data Need Units
Wastewater flow MGD
Electricity consumption kWh
Peak demand kW
Methane capture *MMBTU
Microturbine generation kWh
Natural gas consumed MMBTU
Fuel oil consumed Gallons
Diesel fuel consumed Gallons
Design specifications N/A
Operating schedules N/A
Grease trap waste collected* * Gallons
Other (based on your utility) TBD
Tools to Collect Baseline DataThere are many software programsfor energy tracking (also known asutility management, energyaccounting, or utility accounting).Some of these programs can acceptautomatic data entry directly fromyour utility. ENERGY STARPortfolio Manager is useful not onlyfor tracking your energy data, butalso for comparing to similarfacilities.
Remember your existing accountingsystem may already be trackingenergy costs.
Keep units consistent!
Remember

Session 2, Module 1 24
STEP 1 Continued...
Consider any other quantities that you’ll want to measure. Is there anything you would add to the list on the previouspage? Select units that your Energy Team is comfortable with and that your data is typically available in. If the data isreported using the wrong units, you may have some conflicting or confusing results.
Units by themselves are not that informative; to be placed in proper context, they need to be associated with an intervalof time. Therefore, for the next step add another column to your table: “Desired Frequency of Data.”
Remember, while knowing your utility’s energy consumption per month is useful, knowing it in kWh per day is better.With hourly consumption data, you can develop a “load profile” or a breakdown of your energy demand during the day.If your load profile is relatively flat, or if your energy demand is greater in the off-peak hours (overnight and earlymorning) than in the peak hours (daytime and early evening), your utility may qualify for special pricing plans from yourenergy provider.
Typically, water and wastewater utilities have a predictable diurnal variation. Usage is most heavy during the earlymorning, lags during the afternoon, has a second, less intensive peak in the early evening, and hits the lowest pointovernight. Normally, energy use for water and wastewater utilities could be expected to follow a pattern of water flows.However, this effect can be delayed by the travel time from the sources, through the collection system, to the plant, or bystorage tanks within the distribution system to customers. A larger system will have varying travel times, whereas asmaller system will have lower variability. Moreover, this effect can be totally eliminated if the plant has an equalizationtank.
If your utility is paying a great deal of money for peak demand charges, you might consider the capital investment of anequalization tank. Demand charges can be significant for wastewater utilities, as they are generally about 25% of theutility’s electricity bill.7
Adding a column for Desired Frequency of Data, the updated table would look like this:
Data Need Units Desired Frequency of Data
Wastewater flow Million gallons Daily
Electricity consumption kWh Hourly if possible or daily if not
Peak demand kW Monthly (if electric utility bills for peak monthlydemand)
Methane capture MMBTU Monthly
Microturbine generation kWh Monthly
Natural gas consumed MMBTU Monthly
Fuel oil consumed Gallons Monthly
Diesel fuel consumed Gallons Monthly
Design specifications N/A N/A
Operating schedules N/A N/A
Water Environment Federation (1997), Energy Conservation in Wastewater Treatment Facilities, Water Environment Federation, Manual of Practice No. MFD-2, Alexandria,VA.
7-

Session 2, Module 1 25
STEP 1 Continued...
Next, determine how you will collect baseline data. Energy data is recorded by your energy provider (e.g. electric utility,natural gas utility, or heating oil company). A monthly energy bill contains the total consumption for that month, as wellas the peak demand. In some cases, your local utilities will record the demand on every meter for every fifteen-minuteinterval of the year. Similar data may be available if you have a system at your utility that monitors energy performance.Sources of energy data include the following:
• Monthly energy bills vary in detail but all contain the most essential elements. The scope of the analysis is in this case limited to a collection of one or more meters. If different systems are all on one meter, the fenceline must be defined to include all of the systems.
• The energy provider may be able to provide more detailed information. It will still be limited to meters (and not broken out by sub-systems behind the meters), but it may include greater resolution of hourly or quarter-hourly energy demand.
• An energy management program (e.g., Supervisory Control and Data Acquisition - SCADA) automatically tracks energy data, often with sub-meters to identify the load on individual components. If sucha system is in place at your utility, you will have a large and detailed data set on hand.
Other data needs may also have a range of sources. Design specifications for equipment may be in manuals at your utilitybut you may still need to contact the manufacturers for specific items. Add a column for “Data Source” and “Availability”in your table.
Your energy provider can, in addition to providing raw data, offer you extensive expertise on energy-saving technologies,practices, and programs as well as contractors who can help you implement certain types of improvements. It isrecommended that you meet early and often with your energy provider as you seek to improve your energy performance.
ExampleSuppose that your utility has readily accessible data for its wastewater flow, microturbine generation, most of its designspecifications, and its operating schedules. The Energy Team has a contact at the electric utility that can provide detailedinformation on electricity consumption and demand as well as a contact at the natural gas utility. No heating oil is usedand diesel fuel consumption is negligible so these rows are removed. However, the utility doesn’t have a reliable recordof exactly how much methane is captured by its system. In this example, the table will look as follows.
Data Need Units Desired Frequency ofData
Data Source Availability of Data
Wastewater flow Million gallons Daily Pump records On-hand
Electricity consumption kWh Hourly if possible, daily ifnot
Electric utility and SCADA Contact at utility
Peak demand kW Monthly (if electric utilitybills for peak monthlydemand)
Electric utility Contact at utility
Methane capture MMBTU Monthly Plant Internal
Microturbine generation kWh Monthly Meter attached to unit On-hand
Natural gas consumed MMBTU Monthly Natural gas utility Contact at utility
Design specifications N/A N/A Equipment manuals,nameplate ratings
Most on-hand, some willhave to contactmanufacturer
Operating schedules N/A N/A Plant handbook On-hand

Session 2, Module 1 26
STEP 1 Continued...
Without data on methane capture however, the utility will be unable to determine the microturbine’s efficiency. They’llknow how much electricity is produced but not how much fuel goes into the system in the form of methane. Althoughthis calculation may be important, you can revisit it at a later time, when more data becomes available.
Normalized BaselinesRemember, to accurately measure how your utility performance is changing over time, establish “normalized” baselineswhere appropriate. Normalized baselines will measure your energy performance changes rather than changes inproduction, customer demand, or other non-environmental related factors.
Utility Case Study: Village of Essex Junction Wastewater Treatment Facility (Appendix A)The Village of Essex Junction, Vermont, with the support of Efficiency Vermont, has successfully implementedmicroturbine technology at its 2.0 million gallons per day (MGD) average-flow, municipal wastewater treatment facility,and has firsthand information on its financial benefits. To review more information on how Essex Junction reduced energyand achieved cost savings from installing two microturbines at their 2.0 MGD wastewater utility, go to Appendix A.
Apply Your KnowledgeDevelop energy baseline data using the blank tables in Appendix B. Consider your list of data needs. Where will you lookto find the information you need? Is the data readily available or will you have to do some digging?
Once the data collection has been completed, your Energy Team will develop a final table, changing “Desired Frequencyof Data” to “Frequency of Data.” Also, since all of the data is now on-hand, you can remove the “Accessibility” columnand our example table would look like this.
CONSIDER THIS...More information can be helpful, but only to a point. Keep your data organized and don’t get overwhelmedor stuck looking for minor details. Be ready to move on and estimate if data doesn’t exist or can’t be easilyobtained. Remember that the systems that use the most energy will have the greatest impact on your baselineand often have the greatest potential for energy savings.
Data Need Units Frequency of Data Source
Wastewater flow Million gallons Daily Pump records
Electricity consumption kWh Hourly Electric utility
Peak demand kW Monthly Electric utility
Methane capture MMBTU Monthly New gas meter attached to unit
Microturbine generation kWh Monthly Electric meter attached to unit
Natural gas consumed MMBTU Monthly Natural gas utility
Design specifications N/A N/A Equipment manuals, nameplateratings
Operating schedules N/A N/A Plant handbook

Session 2, Module 1 27
STEP 2: Track Monthly and Annual Energy Use
Step Objective: To learn how to conduct a preliminary analysis to look for trends in energy data.
Now that you have your data, take a look at it and see what patterns emerge. Determine the energy demand per gallonof water or wastewater treated and see if this has changed over the baseline period. If you have annual energyconsumption data for the last few years, then that can be analyzed for trends as well. Are there changes attributable to thereplacement or installation of some piece of equipment? Are there seasonal variations in energy demand and in energycost? What about daily variations?
Putting the data into graphical form may help your utility perceive any trends and may be particularly helpful forpresenting results to those outside of the Energy Team. Make one graph of average daily energy consumption over timeand one graph of energy consumption per gallon of water or wastewater treated. You may also want to make a third graphof energy costs over time, including purchased fuels as well as electricity. In addition, if greenhouse gas emissions (GHG)are a consideration for your utility or municipality, you may want to take this time to track your energy-related GHGemissions (direct emissions from fuel use and indirect emissions from energy).
Below is an example table indicating how you can track your monthly energy consumption. You can measure energyusage in kWh per day or kWh per month; just remember to be consistent. Consider using the same time unit as you usefor treated water or wastewater flow so that you can see your energy demand per gallon treated. In the tables below, daysare used as the increment.
2006 EnergyConsumption
Average DailyConsumption (kWh)
Peak Demand (kW) Cost (¢/kWh) Daily Flow (million gallons)
January
February
March
April
May
June
July
August
September
October
November
December

Session 2, Module 1 28
STEP 2 Continued...
Apply Your KnowledgeUse the table on the previous page – or a similar one based on your needs – to document and track the monthly andannual energy use at your utility.
You may also wish to track overall energy demand per gallon of water or wastewater treated, especially if non-electricityenergy sources such as natural gas play a significant role in your treatment process. In this case, you will need a metricthat allows you to combine electricity and natural gas into a single measurement. Cost (in dollars) is one option, but costis heavily influenced by external market forces. Energy can be expressed in scientific units, such as megajoules (MJ) orBritish Thermal Units (BTU), and it is possible to convert electricity, natural gas, and other fuel consumption into theseunits. Alternatively, you can track each energy source separately. Be advised that this may give a misleading picture ofenergy performance if you changed from one energy source to another such as replacing a natural gas heating system witha ground-source heat pump powered by electricity).8
If you have the data, tracking annual energy consumption can show long-term trends. Here is an example tracking table.
CONSIDER THIS...Look for unusual trends in energy data and seek explanations.9 Rising energy expenditures may be due torising electricity prices, increased water flow, unusually cold winters, or equipment failures. All of whichcan decrease your energy efficiency. Present your results in a way that conveys an explanation. In addition,remember that specific analysis of energy and energy-related data is a key activity in developing an effectiveenergy management program.
Year Average Daily Consumption(kWh)
Peak Demand (kW) Cost (¢/kWh in 2007) Daily Flow (million gallons)
2000
2001
2002
2003
2004
2005
2006
The Portfolio Manager tool will accept any unit and produce a normalized energy source intensity figure in kbtu/million gallons.
ENERGY STAR’S Benchmarking tool will use zip code and weather data to normalize for heating and cooling degree days.
8 -
6
9-

MODULE 2: Conduct an Energy Assessment or Baseline Audit
Module Objective: To learn the basics of conducting an energy audit.
The energy audit is an essential step in energy conservation and energy management efforts. Your utility or municipalitymay have had an energy audit or energy program review conducted at some point. If so, find the final report and haveyour Energy Team review it. How long did the process take? Who participated in it—your team, the electric utility,independent contractors? What measures were suggested to improve energy efficiency? What measures were actuallyimplemented and did they meet expectations? Were there lessons learned from the process that should be applied tofuture audits? In addition, if your facility’s previous energy audit had recommended measures, determine if they are stillviable.
In many cases, electric utilities offer audits as part of their energy conservation programs. Independent energy servicecompanies also provide these services. An outside review from an electric utility or an engineering company can provideuseful input but it is important to ensure that any third party is familiar with water and wastewater systems.
Some energy audits focus on specific types of equipment such as lighting, HVAC, or pumps. Others look at the processesused and take a more systematic approach. Audits focused on individual components, as well as in-depth process audits,will include testing equipment. For example, in conducting the baseline energy audit, the Energy Team may compare thenameplate efficiency of a motor or pump to its actual efficiency.
In a process approach, a preliminary walk-through audit is often used as a first step to determine if there are likely to beopportunities to save energy. If such opportunities exist, then a detailed process audit is conducted. This may includeauditing the performance of the individual components as well as considering how they work together as a whole. Muchlike an environmental management system initial assessment that reviews current status of regulatory requirements,training, communication, operating conditions, and current practices and processes, a preliminary energy audit or energyprogram review will provide your utility with a baseline of what your energy consumption is at that point in time.
Once you have collected your utility’s baseline data and tracked monthly and annual energy use, there are two additionalsteps to completing your energy assessment or baseline energy audit:
Step 3) Conduct a Field InvestigationStep 4) Create an Equipment Inventory and Distribution of Demand and Energy
For Your InformationStates often maintain programs to assist municipalities and local agencies with energy management. For example, theMassachusetts Division of Energy Resources (DOER) has an Energy Audit Program to support municipal wastewaterdistricts. The Audit Program provides each project participant with a list of energy conservation projects, their costs, andestimated energy savings. For more information, visit DOER’s Energy Grant informational website athttp://www.mass.gov/doer/pub_info/grant-eap.pdf).
Several other states have similar programs. California has had remarkable success in funding energy audits at municipalwastewater utilities. For example, an energy audit of the Eureka, California water and wastewater system cost the state$15,800 and the identified capital improvements cost $56,800. However, the annual savings were $91,900 and theimprovements reduced the city’s electricity bill by 34%.10
At the federal level, the U.S. Department of Energy offers free 1-day walkthroughs for smaller facilities through its SaveEnergy Now Program (http://www1.eere.energy.gov/industry/saveenergynow).
Session 2, Module 2 29
California Energy Commission (1990), The Second Report to the Legislature on Programs Funded Through Senate Bill 880, Sacramento, CA, cited in Water EnvironmentFederation (1997), Energy Conservation in Wastewater Treatment Facilities, Water Environment Federation, Manual of Practice No. MFD-2, Alexandria, VA.
10 -

Session 2, Module 2 30
STEP 3: Conduct a Field InvestigationThe field investigation is the heart of an energy audit. It will include obtaining information for an equipment inventory,discussing process operations with the individuals responsible for each operation, discussing the impacts of specific energyconservation ideas, soliciting ideas from your Energy Team, and identifying the energy profiles of individual systemcomponents. The Electric Power Research Institute (EPRI) recommends evaluating how each process or piece ofequipment could otherwise be used. For example, it might be possible for a given system to be replaced or complementedfor normal operation by one of lower capacity; to run fewer hours; to run during off-peak hours; to employ a variable speeddrive; and/or to be replaced by a newer or more efficient system. Depending on the situation, one or more of thesechanges might be appropriate.
STEP 4: Create Equipment Inventory and Distribution of Demand and Energy This is a record of your facility’s equipment, equipment names, nameplate horsepower (if applicable), hours of operationper year, measured power consumption, and total kilowatt-hours (kWh) of electrical consumption per year. Other criteriasuch as age may also be included. In addition, different data may be appropriate for other types of systems such asmethane-fired combined heat and power systems.
You may find that you already have much of this information in your maintenance management system (if applicable).A detailed approach for developing an equipment inventory and identifying the energy demand of each piece ofequipment is provided in the 1997 book Energy Conservation in Wastewater Treatment Facilities: Manual of Practice No. MFD-2, Water Environment Federation. The basics are presented here, but readers are encouraged to review the Manual of Practicefor a more thorough explanation.
Example utility equipment inventories and the relevant energy data to collect could include the following.
Motors and Related Equipment
• Start at each motor control center (MCC) and itemize each piece of equipment in order as listed on the MCC.
• Itemize all electric meters on MCCs and local control panels.
• Have a qualified electrician check the power draw of each major piece of equipment.
Pumps
• From the equipment manufacturer’s literature, determine the pump’s power ratio
(this may be expressed in kW/mgd).
• Multiply horsepower by 0.746 to obtain kilowatts.
• Compare the manufacturer’s data with field-obtained data.
Aeration Equipment
• Power draw of aeration equipment is difficult to estimate and should be measured.
• Measure aspects related to biological oxygen demand (BOD) loading, food-to-microorganism ratio, and
oxygen-transfer efficiency (OTE). Note that OTE levels depend on type and condition of aeration equipment.
Actual OTE levels are often considerably lower than described in the literature or in manufacturers’ materials.

Session 2, Module 2 31
STEP 4 Continued...
Below is an equipment inventory example for pumps:
Utility Case Study: Camden County (New Jersey) Municipal Utilities Authority (CCMUA)By carefully reviewing their plant operations, the CCMUA developed a computerized system that shaved the peaks byavoiding simultaneous use of energy-intensive process units and staggering the use, thereby minimizing the peak chargefrom the energy company.
Apply Your KnowledgeUsing the table above as an example, complete equipment inventoryworksheets for your utility using the blank equipment inventoryworksheets (or similar ones based on your needs) in Appendix C.
Although you can use the inventory worksheets in Appendix C, in practice,you might find that you use several different types of inventory methods,depending on the types of equipment that you are examining. Try to lookat each process or piece of equipment from a fresh perspective. Why iseach process run a certain way? Is it a stated requirement? Is it the bestway? Is it just tradition? Consider how processes interact with each otherand look at the overall system. Also, consider having a third party (e.g.,local energy utility) work with the Energy Team as you conduct your fieldinvestigation for a fresh perspective and review of your energyconsumption and management.
Resources & ToolsNew England Power Pool (NEPOOL) has the emission factors for the NewEngland grid. The 2005 report is available at: http://www.iso-ne.com/genrtion_resrcs/reports/emission/2005_mea_report.pdf. Checkyour states website for information related to your locality.
Pump Designation Installed Nameplate Rating Hours of OperationPer Year
Measured PowerConsumption
kWh per Year
Pump #1 1992 200 horsepower 2,000 200 kW 400,000
Pump #2 1994 150 horsepower 4,000 120 kW 480,000
Pump #3 1995 80 horsepower 4,000 70 kW 280,000
Pump #4 2002 40 horsepower 5,000 32 kW 160,000
ENERGY STAR’s Benchmarking Tool will give estimates of reduction of CO2 usage based on national averages but won't provide an initial baseline. 11 -
Determining your utility’s carbonfootprint is also a method ofestablishing a baseline. Carbonemissions are affected by energy
consumption (electricity, natural gas, and fueloil) as well as by process emissions such asmethane. If your municipality or state requiresyou to participate in a determination of a carbonfootprint or if you have a goal of reducinggreenhouse gas emissions, you may need toknow some conversion factors. Yourmunicipality or state should be able to tell youwhat sort of methodology they use to assessemissions from electricity. Marginal emissionsfactors consider what sort of resource will bedispatched to meet increased load or cut back torespond to decreased load. Grid averageemission factors assign an equal portion of theoverall emissions to each kWh consumed.11
Remember

Session 2, Module 3 32
MODULE 3: Review Legal and Other Requirements and Establish a Compliance
Baseline
Module Objective: To identify legal and other requirements that affect your operations and your compliance status.
There are additional metrics for a utility to review besides what has been covered thus far. One of the most importantaspects is compliance with legal and other requirements. While this is a fundamental goal for any utility, theserequirements can also significantly affect the nature and scope of your energy management program.
What are the requirements that utilities must follow? A few examples are:
• Attaining a certain quality of discharged effluent or treated water,
• Maintaining a stated degree of reliability,
• Having capacity to handle unusually large flows or demands,
• Ensuring worker safety,
• Environmental monitoring and reporting and documenting compliance, and
• Limiting air pollutant emissions based on permitted amounts.
Municipalities could apply additional (“other”) requirements, such as:
• Limiting growth in costs of energy, chemicals, and/or labor,
• Enacting load reductions during times of peak power demand (since grid reliability is a concern), and
• Limiting or reducing greenhouse gas emissions (direct and indirect).
Apply Your KnowledgeMake a list of your most relevant requirements. Then, for each one, ask the following:
• What is required of our facility?
• What agency or entity has enacted this requirement?
• Is our understanding of this requirement current and accurate?
• Do the relevant agencies consider our utility to be fully in compliance?
• Do we consider our utility to be fully in compliance? What could we do to better achieve
compliance?
• How does this requirement affect the scope or type of energy conservation measures that we may
consider? Does it encourage or discourage specific types of measures?
• Are we in compliance? If yes, what will we have to do to maintain that status? If not, what can we do to
achieve compliance?
In the example table on the next page, a wastewater utility has a combined heat and power system that is permitted fornitrous oxides (NOx) emissions. The utility gathered the information as part of their legal and other requirements reviewon NOx emissions.

Session 2, Module 3 33
Apply Your KnowledgeUsing the example table above and the blank regulatory requirements table in Appendix D, fill in the information foryour utility.
Note: New energy generation systems will often have a number of regulatory mandates. Air emission permittingrequirements may limit the use of on-site generation unless the system is exceptionally clean. Demands for systemreliability may place limitations on the use of on-site generation. Interconnection protocols require close cooperation withthe energy provider to ensure that the generator is properly aligned with the grid.
CONSIDER THIS...Consider how the energy improvements you will prioritize may affect your compliance status. Also, considerwhether the improvements will create additional regulating requirements of their own.
Session 2 Resources & ToolsENERGY STAR’s Benchmarking Tool:(http://www.energystar.gov/index.cfm?c=evaluate_performance.bus_portfoliomanager)ENERGY STAR’s Portfolio Manager: (https://www.energystar.gov/istar/pmpam/)For more information on auditing protocols, use this link(http://cfpub.epa.gov/compliance/resources/policies/incentives/auditing/).Converting your energy use to greenhouse gas:http://www.cleanerandgreener.org/resources/pollutioncalculator.htmCarbon Dioxide Emissions from the Generation of Electric Power in the United States:http://www.eia.doe.gov/cneaf/electricity/page/co2_report/co2report.html Greenhouse Gas Equivalency Calculator:http://www.usctcgateway.net/tool
Moving to the Next SessionIn Assessing Current Energy Baseline Status, you developed baseline data, conducted an energy audit, completed somebenchmarking, and did a review of legal and other compliance requirements. This information will be used in the nextsessions to determine your utility’s potential priority energy improvements.
Requirement Name: NOx Emissions
Requirement Our combined heat and power (CHP) system is permitted at a rate of 200 pounds of NOx peryear.
Relevant agencies (federal, state, local) State Department of Environment Quality,contact ______________ email ________________ phone # __________________
Effective date of requirement including revisiondate(s) as applicable
Date _______________
Are applicable regulations changing or beingupdated?
Yes, the state is changing regulations due to CAIR rule but we expect no change in ourpermitted amount as it is a very small rate per MWh.
Are we in compliance according to agencies? Yes, emissions are slightly under our permitted amount.
Could we improve our performance? Possibly, because NOx is a precursor to ground-level ozone, which causes urban smog, wewould like to reduce emissions if possible. We are looking at changing the fuel/air mix toreduce emissions. Another option is to evaluate the cost of verified retrofit technologies.
How does this affect the proposed energyconservation measures?
Measures to improve the plant’s energy efficiency would enable us to stay under our permittedamount even if the flow rates increase.
Are we in compliance? Yes, however, if the electricity demand continues to grow as flow rates increase, our emissionswould surpass the cap and we would need a new permit.

Session 3 34
Now that you have secured management’s commitment, selected anenergy program manager to put an Energy Team together, benchmarkedyour utility, and completed an Energy Audit, it is time to decide whatenergy improvement priorities to work on first.
In this session, you will:
1. Develop an energy policy.
2. Identify activities and operations that consume energy, using information from your Energy Audit (equipment inventoryworksheets) and other data collection efforts you completed inSession 2.
3. Prioritize activities/operations and potential energy improvement efforts.
Let’s first review a few key terms that will help you as you establish anEnergy Vision and Priorities for Improvement.
Energy Policy: An organization's formal statement defining its intentionsand principles in relation to its overall management of energy resources.It provides a framework for action and setting specific energyimprovement goals and milestones.
Energy Fenceline: The scope of your operations where you will focus yourenergy improvement goals and where they will be implemented. Forexample, your fenceline may include all of your operations, be within aparticular operation (e.g., biosolids), include particular utility components(e.g., pumps), or a particular building.
Continual Improvement: The process of ongoing efforts to improve. It isthe basic principle of the Plan-Do-Check-Act approach.
Keys to Success
� Align your energy policy with
your utility goals
� Involve employees in the
energy review process
� Remember the Keep It Super
Simple (KISS) Rule
� Communicate status
regularly and frequently
� Document recurring
processes and how decisions
are made
SESSION 3: Establishing an Energy Vision and Priorities for
Improvement

Session 3, Module 1 35
MODULE 1: Develop an Energy Policy
Module Objective: To learn how to develop a strong Energy Policy.
An Energy Policy is your utility’s statement of commitment to improveits use and management of energy resources. It should include acommitment to continual improvement and compliance. Signed by topmanagement, the Energy Policy provides a vision for the entire utilityand serves as a foundation document for energy improvementmanagement programs. Everyone, including contractors and vendors,should understand the policy and what is expected of them in order toachieve your energy goals. Use your Energy Policy as a framework forplanning, action, and continual improvement.
The Energy Policy should also include a commitment to explore and increase the use of renewable fuels or renewableenergy technology. Renewable resources not only can improve the environmental impacts of a utility’s activities, theirappropriate use can also save money.
As you develop your Energy Policy, ensure that it is consistent with other strategic business priorities you may haveestablished through strategic plans or other similar efforts. Don’t make the mistake of having your Energy Policy “existin a vacuum.” For example, you may have already embarked on a major effort to improve the management of your capitalassets through a formal asset management program, or your municipality’s or facility’s master planning document mayalready have goals on water conservation or energy use that you can incorporate. These types of programs make use ofmany of the same tools and data gathering efforts, so it makes sense to reflect these commitments in your Energy Policyto become part of your improvement and management programs.
Have a focus meeting with your Energy Team to brainstorm what should be included in your Policy. Designate a coupleof Energy Team members to draft the text of the Energy Policy. Get input from top management and seek input fromemployees. Also, review your current business or level of service commitments and/or organizational and energy goals.It is important that your policy reflect your organizational culture and that it is appropriate to all levels of your operationsand services.
Methods used to communicate your Energy Policy:
• Posting the Energy Policy at various sites throughout your utility (e.g., in lunchrooms) so there is a visual reminder of the statement and its importance;
• Using paycheck stuffers, identification badges, and/or wallet cards, so that employees can carry the EnergyPolicy with them;
• Incorporating the Energy Policy into existing training opportunities and materials;
• Referring to the Energy Policy at staff or all-hands meetings; and
• Posting the Energy Policy on the facility’s Internet/Intranet site.
After you’ve received input, finalize your Policy by having top management sign, date, post, and communicate it toemployees. Make sure that all employees understand the Energy Policy and how it relates to their work. The policyshould also be communicated to vendors and contractors as they may also have a role in meeting your energy improvementgoals.
Apply Your KnowledgeDevelop an Energy Policy for your utility, building on current program policies (e.g., asset management, environmental)already in place.
CONSIDER THIS...Keep your Energy Policy simple. A simple policy written with specific expectations provides employees witha straight-forward and realistic view of your commitments to energy improvements.
Avoid developing an Energy Policy
that is vague or so generic that it
could apply to any organization.
Your Energy Policy should be specific to the
goals your utility wants to accomplish.
Remember

Session 3, Module 2 36
MODULE 2: Identify Activities and Operations that Consume Energy
Module Objective: To learn how to identify the activities and operations at your utility that consume energy.
This module will help you define your utility's energy "footprint" (i.e., how your operations and activities affect energy use)and develop measurable goals for energy improvements. This process can be challenging and requires focus andteamwork. However, this is the opportunity for your utility to:
1. Take a hard look at your individual operations and activities.
2. Identify how these positively and negatively affect energy use.
3. Better understand the unique role that each of you, individually and collectively, play in managing your utility’s energy consumption. The result of this effort will be a list of activities and operations you can use to decide where to invest time, effort, and resources.
Following the step-by-step approach will make it manageable and you will quickly realize the benefits of this approach.
STEP 1: Pull Together Information Previously CollectedReview information from your previously planned and implemented energy improvement project, baseline information,energy audits, and any other additional sources that might be useful in developing this concise list of activities andoperations.
STEP 2: Develop a List of Activities and OperationsEmployees within your energy fenceline will most likely be the best source of information as you develop a list of activitiesand operations, where they are located, the type of energy used, and the current use and costs. The table below will serveas a helpful example as your utility’s Energy Team begins populating a table with activities and operations specific toyour facility.
Example List of Activities and Operations
Activity Operation or Location Type of Energy Used Current Use and Costs
Heating, Ventilation, and AirConditioning (HVAC)
Operations Building (Heating) Natural Gas • 150 MMBTU/year• $1,500/year
Operations Building (Cooling,Ventilation)
Electricity • 10,000 kWh/year• $1,000/year
Lighting Operations Building Electricity • 24,000 kWh/year (4 kWh/ft2, 6,000 ft2) • $2,400/year
Vehicle Use Service Trucks Diesel Fuel • 1,000 gallons/year• $2,500/year
Equipment
Pump #1 Treatment Building Electricity • 400,000 kWh/year• $40,000/year
Pump #2 Treatment Building Electricity • 480,000 kWh/year• $48,000/year
Pump #3 Treatment Building Electricity • 280,000 kWh/year• $28,000/year
Pump #4 Treatment Building Electricity • 160,000 kWh/year• $16,000/year

Session 3, Module 2 37
Apply Your KnowledgeUsing the table on the previous page as an example and the blank table in Appendix E, work with your Energy Team andcomplete a list of activities and operations, their locations, the type of energy they use, and the current use and costs forenergy at your utility.
Typical Water and Wastewater High-Use Energy Operations and Associated Potential Energy Saving
Measures12
Appendix F outlines additional energy saving information for typical water and wastewater equipment and systemsincluding motors, pumps, aeration systems, lighting, and HVAC.
CONSIDER THIS... Keep the level of detail meaningful without getting stuck in too many details. It is more important to compilea reasonable list with relevant information in order to make decisions about what energy consuming activitiesand operations your utility should focus on first.
High Energy Using Operations Energy Saving Measures
Pumping • Reduce load• Manage load• Water to wire efficiency• Pump selection• Motor and drive selection• Automated control
Aeration • Fine bubble• Improved surface aerators• Premium motors• High efficiency motor drive• Blower Variable Frequency Drives (VFDs)• Automatic DO control
Dewatering • Replace vacuum systems • Premium motors• VFDs for plant water pump
Lighting • Motion sensors• T5 low and high bay fixtures• Pulse start metal halide• Indirect fluorescent• Super efficient T8s• Comprehensive control for large buildings
Heating, Ventilation, Air Conditioning (HVAC) • Water source heat pumps• Prescriptive incentives for RTUs• Custom incentives for larger units• Low volume fume hood• Occupancy controls• Heat pump for generator oil sump
An Overview of Utility Efficiency Programs, Massachusetts Electric, NEWEA Conference, 2004.12-

Session 3, Module 3 38
MODULE 3: Prioritize Activities/Operations and Potential Energy
Improvement Efforts
Module Objective: To develop a method to prioritize energy improvements.
You’ve created a large list of activities and operations where energy efficiency could be improved. Don’t worry, you donot have to make all the improvements at once. The next step of the process is to prioritize the list to identify a manageablenumber of improvements that are the most important to your utility.
You can narrow your list of activities and operations to focus on what is most significant by:
1. Defining a group of criteria that help focus on your energy goals and developing a scoring system;
2. Applying the criteria to each of the energy related-activities or operations to achieve a total rank or number; and
3. Establishing a threshold score above which an activity or operation will become a priority for energy improvement.
STEP 1: Define Criteria to Prioritize Opportunities for Energy ImprovementsExperience has shown that a simple system for developing prioritiesgenerates the same results as a more complex one, but in a muchshorter period of time and with more satisfied team members. Thereis not a magic number in terms of how many criteria you should use;it really depends on what factors are important within your utilityand what allows you to simply and effectively rank opportunities forenergy improvements. Refer back to your Energy Policy for ideaswhen selecting your criteria.
For energy issues, criteria might include:
• Current or projected costs;
• Feasibility of efficiency projects or the use of renewable sources;
• Potential for energy use reduction;
• Availability of funding;
• Existing need for equipment upgrade;
• Renewable source of energy, particularly for facilities in states that are pushing for climate change mitigation
( e.g., Massachusetts and Connecticut);
• Return on investment;
• Regulatory requirement; and
• Support of other priorities (e.g., asset management goals).
Apply your KnowledgeWork with your Energy Team to select approximately four or five criteria for your utility.
Criterion 1: __________________________________ Criterion 2: __________________________________Criterion 3: __________________________________ Criterion 4: __________________________________Criterion 5: __________________________________
Criteria can be variable. Develop
the unique and individual
combination of criteria that will
work best for your water or wastewater
utility.
Remember

Session 3, Module 3 39
STEP 2: Decide How to Use the CriteriaOnce you have selected your criteria for ranking your energy activitiesand operations, apply the criteria to each of the entries on your list usinga quantitative ranking method. A simple 1 for low impact; 3 for mediumimpact; and 5 for high impact works well and avoids long discussionsabout the difference between a 2 and 3 or a 3 and 4. Remember thatyour evaluation of the energy impact is based on your expertise andexperience. It is basically an educated guess.
Take the time to document the process you used to determine yourpotential energy improvement priorities. This can be as simple as amemo that outlines the process that was used or as formal as amanagement system procedure. Documenting how you developedyour priorities will help you support requests for resources and will alsohelp in the future when the process is repeated.
Remember, this is a subjective analysis. Make sure that when you finishyour scoring, you do a reality check with staff that work within yourenergy fenceline to verify that your selected operations and activitiesare feasible priorities.
See the examples on the next two pages.
TIP!
If rate of return is one of thefactors in deciding what to work
on first, consider using ENERGY STAR’sfinancial evaluation tools (financial valuecalculator, building upgrade value calculator,cash flow opportunity calculator, etc.) athttp://www.energystar.gov/index.cfm?c=assess_value.financial_tools.
Documenting procedures and
processes captures your utility’s
institutional knowledge and allows
for continual improvement at your utility.
Remember

Activity Operation or Location Type ofEnergy
CurrentCosts
Ranking Criteria to Set Priorities (Examples only)
Current/ProjectedCosts1= L3= M5= H
Feasibility ofEnergyEfficiencyProjects1= notfeasible3= feasible5= Veryfeasible
Feasibility ofAlternative,Renewablesources?1= L3= M5= H
Costs toimplement1= H3= M5= L
Availabilityof Funding1=Capitalfundsrequired3=potentialor notknown5=Fundingoptionsavailable
Rate ofReturn onInvestment 1= Morethan___years3= ___years5= Lessthan____years
Regulated?0=No3=Yes5=Yes andcomplianceissues exist
TotalScore
Heating,Ventilation,
and AirConditioning
Operations Building (Heating) Natural Gas $1,500/year 1 3 1 3 1 1 0 10
Operations Building (Cooling,Ventilation)
Electricity $1,000/year 1 3 1 3 1 1 0 10
Lighting
Operations Building Electricity $3,000/yr 1 5 1 1 5 5 0 18
Vehicle Use
Service Trucks Diesel Fuel $2,500/yr 1 5 1 3 1 1 3 15
Service Trucks Diesel Fuel $2,500/yr 1 1 5 3 3 1 3 17
Equipment
Pump #1 Electricity $40,000/yr 5 3 1 3 1 3 3 19
Pump #2 Electricity $48,000/yr 5 3 1 3 1 1 3 17
Example of Energy Priority Ranking Table
Se
ss
ion
3, M
od
ule
34
0

Activity Operation or Location Type ofEnergy
CurrentCosts
Ranking Criteria to Set Priorities (Examples only)
Current/ProjectedCosts1= L3= M5= H
Feasibility ofEnergyEfficiencyProjects1= notfeasible3= feasible5= Veryfeasible
Feasibility ofAlternative,Renewablesources?1= L3= M5= H
Costs toimplement1= H3= M5= L
Availabilityof Funding1=Capitalfundsrequired3=potentialor notknown5=Fundingoptionsavailable
Rate ofReturn onInvestment 1= Morethan___years3= ___years5= Lessthan____years
Regulated?0=No3=Yes5=Yes andcomplianceissues exist
TotalScore
Equipment Pump #1 Electricity $40,000/yr 5 3 1 3 1 3 3 19
Lighting Operations Building Electricity $3,000/yr 1 5 1 1 5 5 0 18
Vehicle Use Service Trucks Diesel Fuel $2,500/yr 1 1 5 3 3 1 3 17
Equipment Pump #2 Electricity $48,000/yr 5 3 1 3 1 1 3 17
Vehicle Use Service Trucks Diesel Fuel $2,500/yr 1 5 1 3 1 1 3 15
Heating,Ventilation
and AirConditioning
Operations Building (Heating) Natural Gas $1,500/year 1 3 1 3 1 1 0 10
Operations Building (Heating) Electricity $1,000/year 1 3 1 3 1 1 0 10
Example: Now, sort from highest to lowest score to determine the potential priority energy improvements.
Se
ss
ion
3, M
od
ule
34
1

Session 3, Module 3 42
STEP 3: Establish a Threshold Score
In the example on the previous pages, the total score was 19 for pump#1. What does this score mean? Once you’ve determined all yourpotential priority energy improvements and their associated scores forthe operations/activities, you will need to establish a priority thresholdbased on what your organization can reasonably manage. For instance,anything with a total score of 18 and above could be considered anenergy management priority in the example above.
Keep in mind that your utility has the flexibility, consistent with itsbusiness, technical, legal, operational, and stakeholder concerns andrequirements to set what it considers to be a priority threshold value forenergy management.
Utility Case Study: Renewable Opportunities inAnaerobic DigestionIf biogas is available from anaerobic digestion, the gas produced is primarily composed of methane, which can be used torun an engine generator or microturbine. In a combined heat and power (or cogeneration) system, waste heat can becaptured and used to provide for space heating, sludge drying, or other needs. The fuel source is basically wastewater –a renewable resource – and a facility that employs this technology may be eligible to sell “green power credits” to a broker.13
Water and wastewater utilities have excellent opportunities for energy generation from renewable sources. There arenumerous case studies of wastewater utilities installing energy generation systems based on methane capture. A numberof these are included in Appendix G. For further information, see the December 2006 EPA report, Opportunities for andBenefits of Combined Heat and Power at Wastewater Treatment Facilities.14
Cogeneration from wastewater-derived methane has several advantages including:• Utilizing a renewable resource;• Minimizing greenhouse gas emissions;15
• Creating efficiency by utilizing heat that would otherwise be wasted;• Locating the electricity production at the point of demand (distributed generator); and• Reducing peak demand, easing the load on the electric utility’s transmission and distribution system.
Such a system might benefit from incentives designed to support renewable energy, cogeneration, distributed generation,or energy efficiency. Two good directories of incentive programs are DSIRE, the Database of State Incentives for RenewableEnergy,16 and the EPA’s Combined Heat and Power Partnership Funding Resources page.17
Utility Case Study: Renewable Opportunities in Wind TurbinesSmall wind turbines have been installed at wastewater facilities in Saco, ME; Bellevue, OH; Dimondale, MI; and Browning,MT. Photovoltaic (PV) systems of all sizes have been installed at wastewater treatment plants, producing electricity fromsunlight. The 14.5-kW system in Charlemont, MA is of modest size, about three to four times the size of a large householdPV system. Wastewater facilities have also seen many of the nation’s largest PV arrays, including the 500-kW system inSomerset, NJ, the 520-kW system in Oroville, CA, and the 770-kW system in Yuba City, AZ.
In addition, the Atlantic County, New Jersey Utility Authority (ACUA) has a wind farm project and has implemented anumber of other alternative energy projects, including geothermal and solar. To review ACUA’s alternative energy projects,use this link (http://www.acua.com/acua/content.aspx?id=486).
See http://www.eere.energy.gov/greenpower/markets/certificates.shtml?page=0 for a list of vendors of “Renewable Energy Credits”; some such vendors may be willingto buy the credits resulting from a renewable energy project at a wastewater facility.
Available online at http://www.epa.gov/chp/documents/wwtf_opportunities.pdf.The CO2 emissions from the CHP system contribute much less to global warming than the biogas would produce if vented.
13-
14 -
15 -
Each energy activity or operationthat is identified as a priority(i.e., a total score equal to or over
your determined threshold) will requiresome kind of operational or equipmentcontrol measure, training, recordkeepingand other relevant required managementpractice.
Remember, this is a continuous process, soyou don’t need to be perfect the first timearound!
Remember
http://www.dsireusa.org http://www.epa.gov/chp/funding/index.html
16 -17 -

Session 3, Module 3 43
Apply Your Knowledge Use the tables on pages 40 and 41 as examples and the blank one in Appendix H. Determine your most important (priority)energy improvement opportunities for the fenceline energy activities and operations of your utility.
CONSIDER THIS...Keep It Super Simple [KISS] Don’t have too many criteria or over analyze. A very complicated scoring system will discourage those involved and make this process more difficult than necessary. Your rankings are more of an educated assessment rather than a mathematical computation.
Session 3 Resources & ToolsEMS Handbook for Wastewater Utilities: http://www.peercenter.net/toolkit/Step_By_Step.cfmEMS Aspects Identification and Prioritization Workbook: http://www.peercenter.net/toolkit/Aspects.cfmTo try an EPA biodiesel calculator to determine the emissions benefits of switching to alternative fuels, use this linkhttp://www.epa.gov/otaq/retrofit/techlist-biodiesel.htmSolar Photovoltaic Installation FAQs: http://www.mass.gov/doer/pub_info/solar-tip.pdfSolar Photovoltaic Site Selection Survey: http://mass.gov/doer/programs/renew/renew.htmMassachusetts Division of Energy Resources (DOER) Renewable Energy Programs:http://www.mass.gov/envir/Sustainable/documents/pv_site_selection_survey.docMassachusetts Technology Collaborative, Small Renewables Initiative:http://www.masstech.org/renewableenergy/small_renewables.htm Massachusetts Technology Collaborative, Large Onsite Renewables Initiative:http://masstech.org/renewableenergy/large_renewables.htm
Moving to the Next SessionIn Establishing an Energy Vision and Priorities for Improvement, you crafted an Energy Policy, developed a list of energy-consuming activities and operations, and identified energy improvement priorities. In the next Session, you will establishenergy improvement goals, objectives, and targets for the priority energy improvement opportunities that scored abovethe threshold you established.

Session 4 44
You have now assembled your team, evaluated your energyperformance, and identified priority areas for improvement. The nextsteps are to set objectives and establish targets to measure yourprogress. These targets can relate to activities – such as your progressin implementing energy conservation measures – or to the results youachieve from these measures.
In this session, you will:
1. Establish energy objectives and targets.
2. Define performance indicators.
Let’s first review a few key terms that will help as you develop yourenergy objectives and targets.
Objective: The internal goal your utility establishes to improve itsenergy performance. Example: reduce facility energy use.
Target: A measurable performance requirement that arises from yourobjective. Example: reduce utility energy use by 25% from 2006 levelsby 2011.
Performance Indicator: What exactly you will measure to evaluate andverify performance improvements in relation to a specific target. Forexample, measuring electricity cost or consumption per gallon ofwastewater treated ($ or kWh/gallon). Performance indicators can beadjusted to meet specific management needs or as necessary to ensureprogress toward reaching specific energy targets.
Keys to Success
� Align utility objectives and
targets with your energy
policy
� Communicate objectives and
targets to staff
� Identify energy improvement
targets that can be measured
� Measure early and often
SESSION 4: Identify Energy Objectives and Targets

Session 4, Module 1 45
MODULE 1: Establish Energy Objectives and Targets
Module Objective: To learn how to set objectives and targets for your priority energy activities and operations.
Your utility may have many energy improvement goals. However, youmay find that you can’t do everything all at once and that some types ofenergy improvement goals may work towards one objective at theexpense of another. For example, purchasing green power may increasecost, but decrease greenhouse gas (GHG) emissions. While all of theobjectives may seem appealing, it’s best to start with a limited number sothat you can focus your efforts, get experience, and track, document, andverify results.
Although there are a number of example objectives and targets fromwater and wastewater facilities that have implemented energyimprovement programs, there are no standard energy objectives andtargets that make sense for all utilities in all locations. Your objectives andtargets should reflect what your utility does, how well it is currentlyperforming, and what it wants to achieve.
A water or wastewater utility might have the following example energy objectives:
• Reduce energy cost;
• Reduce petroleum consumption;
• Reduce peak energy demand;
• Reduce GHG emissions;
• Improve reliability;
• Increase use of renewable fuels;
• Evaluate the installation or improve performance of renewable energy technologies; and
• Reduce vehicle fuel use.
What do you hope to accomplish in the next few years? Set energy targets that are realistic enough to get accomplished yetsignificant enough to get noticed and motivate change. Remember that your ability to measure and document progresstowards your targets is important.
In the example from Session 3, the utility’s priority fencelineactivities/operations had a total sigficance score of 18 for equipment(pump #1) and a score of 19 for lighting (operations building). Asdetailed in Module 3 of Session 3, these measures scored higher than theHVAC systems, vehicle use, and other pumps and equipment. Pump #1and lighting were therefore identified as potential focus areas wheregoals could be set based on factors such as capital cost, payback period,GHG emissions, and other factors that are important to your utility andyour Energy Policy.
What objectives and targets do pump #1 and lighting support? Whilethey will likely reduce peak electricity demand and reduce GHGemissions, the selection of these energy improvement opportunities wasbased on the goal of reducing overall energy cost – an important driver for utilities. The utility determines that, byestablishing a normalized baseline first, these energy improvement opportunities can be implemented, along with certainoperational changes, within 12 months and achieve a 10% overall reduction in energy costs.
Baseline data is the starting point from
which to track the achievement of an
energy objective. “Normalized”
baselines accurately measure how
your utility’s energy consumption could change
over time due to seasonal and other variations.
Normalized baselines will take into account how
your energy consumption may be affected by
changes in flow, load, or other related factors.
Remember
“Sometimes behavior-based targets (e.g.,learning a systems-based managementapproach) are not the biggest gains inperformance measures related to your targets,but they are very important in terms ofculture change and should be considered.”
Donna AdamsWastewater DivisionEugene, Oregon

Session 4, Module 1 46
Below is an example of an energy improvement objective and target that a utility could select – based on Session 3’sexamples of pump #1 and lighting as potential priority areas for energy improvement. In addition, a utility could considerincreasing renewable energy sources as an opportunity. Therefore, a renewable energy objective and target has beenincluded as a potential longer-term opportunity in the example.
Apply your KnowledgeNow choose energy improvement objectives and targets for your utility with staff and your Energy Team using theObjective and Target worksheet provided in Appendix I.
Utility Case Study: Kent County, Delaware Wastewater – Renewable EnergyThe Kent County Department of Public Works (KCDPW) operates a 16 MGD wastewater treatment plant that treats mostof the wastewater in the county with over sixty pump stations and nearly 70 miles of gravity sewer and force main, andmanagement of county-owned buildings. The wastewater that enters the Kent County regional system comes from fivemunicipal contract users and seven significant industrial users. Operations serve 70% of the county’s population.
KCDPW has a certified ISO 14001 and OHSAS 18001 Environmental, Health, and Safety Management System (EHS-MS),as well as a National Biosolids Partnership certification.As part of their EHS-MS, Kent County committed to:
• Reducing energy usage by 20% from 2002 levels; and• Reviewing renewable energy alternatives (e.g., wind).
Kent County started with some easy fixes (e.g., swapping lights to more energy efficient alternatives and replacing olderpumps and other assets with more energy efficient models). Additionally, their action plan included researching energyalternatives and new technologies that could help them accomplish their targets.
Researching and Implementing New Energy TechnologiesAt a regional conference, Kent County saw a technology that guaranteed a 15% reduction in energy costs by reducing thenumber of air blowers needed in the treatment process. Kent County, atthe time, used about 4 MW of power to consistently run 4-5 air blowersin their process, and their energy costs were about $10,000-20,000 permonth. The process adds fine bubble diffused air to one of two parallelbasins to provide oxygen for the microorganisms. The prior processrelied on a dissolved oxygen meter at the end of the basin to allow theoperators to control the number of air blowers feeding the basin. Thissystem was highly inefficient and was reactive to conditions in the basins.The new system automatically measures the amount of oxygen beingreleased from the basin using floating hoods and feeds this informationto an automatic control system. With the new technology Kent Countynow runs 2-2 ½ air blowers rather than 4-5 before the technology, analmost 50% reduction in their energy requirements.Within a year, Kent County has recouped the cost of the technology(about $100,000).
Objective and Target Timeframe
Reduce overall energy cost by 10% by 2009 12 months
Increase energy purchased or generated from renewable energy sources by 10% by 2012 4 years
Focus your energy goals on areas
that will have the most impact on
your energy footprint and your water
or wastewater operations. You may
want to review your priority energy
improvement impacts and the Energy Policy
that your utility drafted before you finalize your
goals.
Remember

Session 4, Module 1 47
Creating an Energy Park of Renewable Energy Sources Kent County began to investigate four renewable energy alternatives: wind, biomass, solar, and hydroelectric power. Theutility’s senior executive saw some wind powered utilities in Germany and believed that they would work at the KentCounty facility. They hired a consultant to conduct wind studies in 2003 and determined that the turbines would beoperational with winds at 9 miles per hour. The study cited a lack of on-site wind data and suggested that additional datawas required and that with certain energy credits, the facility would be feasible. The utility installed a wind monitoringsystem on a 115 foot tall radio tower located at the facility in 2004. The studies showed that at 115 feet the winds were at8 ½ to 9 miles per hour – marginally sufficient. Further studies were ordered at 200 feet and projections indicate that thewind energy has the potential to provide about 60% of the facility’s energy needs. Wind towers will be installed in theenergy park at the facility sometime before the end of 2010 if the additional wind survey proves that there is sufficient windavailable at the 200 foot level to support turbines. The cost of the wind installation is $10-12 million which does not includeany maintenance costs. The utility does not anticipate any additional capital costs. However, since delivery of theequipment is several years out there may be an inflation factor that has not been considered. The actual cost to the countywill depend upon what available grants they can obtain.
Currently, biomass stabilization processes at the facility use limeaddition with heat drying to produce a quality Class A biosolidscontaining 60% solids. The facility is investigating the use of anaerobicdigestion of fats, greases, and the utility’s sludge to create methane gaswhich would then be used in the fuel cells to create sufficient energyproduction to account for about one third of the utility’s energy needs.The estimated cost of the system would be $3-5 million.
The facility is working with a contractor to design and build thecombined system. Under the proposed agreement, the contractorwould design, build, and operate the renewable energy park and chargethe county for the electricity generated. In order to reduce the unit costof electricity, the county will pay $3-5 million to the contractor over thenext 3 years. In addition, the county will charge the FOG haulers atreatment fee to help offset the costs. The remaining 80% will be paid to
the contract, with the utility repaying over a 20-year period. After that the utility will own the wind turbines. It is estimatedthat the life expectancy of the turbine is greater than 30 years. The cost of electricity to be paid by the county will includethe recovery of the capital expenses, the facility operations and maintenance, and the profit for the energy company. Theactual costs will be determined as each new unit comes on line. .
“The energy projects are an outgrowth of thefacility’s EHS-MS. The main goal of ourEHS-MS is to reduce the environmentalfootprint of the facility. Energy usage andgeneration are key components of this effort.”
Jim NewtonEnvironmental Program ManagerKent County Public Works DepartmentDover, Delaware

Session 4, Module 1 48
1. Current source energy per flow;2. Annual energy cost;3. Baseline and current performance rating;4. Adjusted energy reduction; and5. Pounds of carbon emissions reduced over time.
Factors to consider in setting objectives and targets:• Ability to control;• Ability to track/measure;• Cost to track/measure;• Progress reporting; and• Linkages to your Energy Policy.
CONSIDER THIS... Start with one or two manageable energy objectives and targets that you will be able to monitor. The best targets are those that can be measured and that are meaningful to employees. Communicate your objectives and targets to staff. Make sure everybody knows what you seek to accomplish and by when.
Apply your KnowledgeOnce your utility has determined the energy objectives and targets, use EPA’s Portfolio Manager to calculate reductionsin energy cost, consumption, and emissions and to track progress towards your goals. Results from EPA’s energyperformance rating system can help facility managers make decisions about commissioning equipment, changingoperations and maintenance procedures, and investing in future energy efficiency projects. Organizations have learned thatEPA’s rating provides valuable information to managers at all levels, empowering them to make sound decisions aboutenergy management.
The following summary table is from ENERGY STAR’s Portfolio Manager and contains examples for three samplewastewater treatment plants showing:

Session 4, Module 2 49
Target Performance Indicator Data Source
Reduce overall energy cost by 10% by 2009 Pump #1: Electricity consumption per gallon ofwater or wastewater treated (kWh per gallon)
Lighting: kWh per square foot/year
Automatic Energy Management System
Increase energy purchased or generated fromrenewable energy sources by 10% by 2012
Solar or wind energy purchased or generated pergallon of water or wastewater treated (kWh/gallon)
Energy Consumption Invoices/energy meter
MODULE 2: Define Performance Indicators
Module Objective: To learn how to measure progress towards your energy targets.
As noted previously, energy improvements lend themselves to quantitative measurement. Your electricity bill, natural gasbill, or similar invoices and data sources provide a ready reference for energy consumption, peak demand, and energy cost.
Energy performance indicators will include the measured quantity, a unit, and, if applicable, a time interval. For example,a utility might use one or more of the following performance indicators for energy at their facility:
• Electricity consumption, in kWh per month;
• Peak electricity demand, in kW;
• Natural gas, in therms per month;
• Energy cost, in dollars per month;
• Electricity consumption per gallon of water or wastewater treated (kWh per gallon); and
• Energy cost or consumption per gallon of water or wastewater treated ($ or kBTU/MGD).
Performance Indicators: Measuring Your ProgressWhen you establish quantifiable objectives and targets you may first need to establish a (normalized) baseline. This baselineserves as the starting point from which you will measure your progress. For example, you may measure your equipment’selectricity use (for motors, pumps, fans, and the like) in kilowatt-hours per million gallons treated (kWh/MG) for eachmonth. Or, you may use “weather normalization” to adjust your HVAC energy demand each year. If your facility hasincreased in size, you may have increased energy demand for lighting, HVAC, and other loads. You can also “normalize”your demand to the size of your facility, defining your energy use per square foot for these loads.
ENERGY STAR’s Benchmarking Tool, (http://www.energystar.gov/index.cfm?c=evaluate_performance.bus_portfoliomanager),is designed to handle this situation. For example, if your building footprint changes, how would you enter the changewithout losing data? ENERGY STAR’s Benchmarking Tool and its training components can help you answer thisquestion and others.
ENERGY STAR offers plant energy performance indicators (EPIs) toenable energy managers to evaluate the energy efficiency of their plantsrelative to that of the industry.
Do you have all the data and information to set an energy target andestablish an applicable, measurable performance indicator? If not,what level of effort is necessary to define the baseline data you require?You may find that no baseline data exist. If so, do not let this stop youfrom moving forward. Set a plan to determine your baseline as a firststep.
Apply Your KnowledgeFollowing the examples below and the blank performance indicatorworksheet in Appendix I and complete the information that you will need to determine an applicable performanceindicator to measure progress toward the energy targets that you set in Session 4, Module 1. Include where you can findthe information (i.e., data source).
Following the examples from previous Sessions, a utility could develop the following worksheet:
Don’t hesitate to be ambitious in selecting your
energy objectives and targets.
Many organizations have found that
improvements in energy efficiency
offer great potential for cost savings
and continued improvement even
after the “low-hanging fruit” has been collected.
Also, remember to try and use data you already
collect and can count when establishing your
energy performance indicators.
Remember

Session 4, Module 2 50
Automatic Energy Management SystemsThe worksheet on the previous page notes “automatic energy management system” as a potential data source for electricity consumption. “Energy management system” in this usage does not mean a set of practices, but rathera system of hardware and software that is used to track and manage energy consumption. It may include a set of sub-meters, a connection to the main utility meter, controls for certain systems, and a program to display energyconsumption and adjust certain parameters. These systems vary considerably in their complexity and capabilitybut many facilities use some systems of this type. Supervisory Control and Data Acquisition (SCADA) systems in particular are widely used to help utilities reduce energy costs and save money.
SCADA systems can be used to optimize system performance, adjust for time-of-day electrical rates, and warn ofmechanical problems. They can be programmed to respond to changing conditions, make it easier to monitor andcontrol a water or wastewater system, and provide comprehensive information to the utility managers.
SCADA systems can be very cost-effective as seen by the following examples from water utilities.18
• Fresno, CA estimates the annual savings from its SCADA system at $725,000. The system was installed for a cost of $3.2 million, giving it a simple payback period of 4.4 years.
• The California Water Service Company installed a SCADA system in its Westlake District at a cost of $100,000,for annual savings of $47,000, a simple payback period of 2.1 years.
Even if a utility already has a SCADA system, additional functionality could improve its performance, or a newersystem might offer the potential for additional cost savings.
Below are additional examples of energy performance indicators for your utility Energy Team to consider.
CONSIDER THIS...Make sure that your performance indicators are meaningful given the context in which you operate. Ifchanges in your energy cost are driven largely by external market forces and not by changes in your energyconsumption, then energy cost might not be a metric that properly conveys your progress on energymanagement.
Session 4 Resources & ToolsENERGY STAR’s Portfolio Manager: (https://www.energystar.gov/istar/pmpam/)ENERGY STAR Plant Energy Performance Indicators (EPIs):(http://www.energystar.gov/index.cfm?c=in_focus.bus_industries_focus)
Moving to the Next Session In Identifying Energy Objectives and Targets, you selected objectives and targets you want to achieve for your priority energy-consuming activities and operations. In the next session, you will establish action plans or energy improvementmanagement programs to meet your objectives and targets. These will include the specific tasks needed to reach yourenergy goals, staff responsible for accomplishing the tasks, the resources required, and a timeline for implementation. Inaddition, you will determine what you have in place and what is needed to control or manage your priority operations.
National Renewable Energy Laboratory, Cities Cut Water System Energy Costs, document DOE/CH10093-262, February 1994.18 -
Target Performance Indicator Data Source
Reduce peak electricity demand by 10% from2006 levels
Peak electricity demand (kW) Automatic Energy Management System,SCADA
Increase share of biodiesel to 20% of fuelpurchases
Biodiesel purchased (gallons per month) anddiesel fuel purchased (gallons per month)
Energy Consumption Invoices
Increase on-site generation from microturbineby 20% from 2006 levels
Electricity generation (kWh/month) Meter on microturbine
Reduce electricity demand per gallon treatedby 10% from 2006 levels
Electricity consumption per gallon ofwastewater treated (kWh/gallon)
Automatic energy management system (kWh),pump records (gallons treated)

Session 5 51
Now that your utility has established energy objectives and targets toidentify what they would like to accomplish for energy improvement, itis time to take action to implement energy improvement priorities andbuild an infrastructure of training, communication, and managementsystem controls.
In this session you will:
1. Develop action plans to implement energy improvements.
2. Develop management system operating control (e.g. training, communication, records, system procedures) tosupport energy improvements.
Let’s first review a few key terms that will help as you implement yourenergy improvement programs.
Energy Improvement Management Program: A structured program witha set of specific identifiable actions providing the direction for energyobjectives and targets to be tracked and accomplished. Your programplan should assign responsibilities, tasks, timeframes, and resources(who, what, by when and how much) for achieving your objectives andtargets.
Operating Controls: Documents that specify the way to execute a certainactivity or operation. Operating controls are assigned to activities andoperations involving priority energy improvement opportunities and aredocumented through the use of work instructions, standard operatingprocedures (SOPs), manuals, and programs. Examples of where thesecontrols are used would include HVAC, equipment maintenance,calibration, and automatic lighting.
Keys to Success
� Build on what has worked in
the past but promote creative
thinking about new and
innovative approaches
� Develop meaningful measures
to assess and communicate
progress
� Communicate what you are
doing, what you need, and
the results
� Use energy improvements to
motivate and inspire
� Support energy
improvements with training
and procedures to help
support and reach your
energy goals
SESSION 5: Implementing Energy Improvement Programs and
Building a Management System to Support Them

Session 5, Module 1 52
MODULE 1: Develop Action Plans To Implement Energy Improvements
Module Objective: To learn how to develop Energy Improvement Management Programs.
Action plans or Energy Improvement Management Programs are“roadmaps” that define how your utility intends to reach its energyimprovement objectives and targets. They describe how yourorganization will translate its goals into concrete action plans so thatenergy objectives and targets are achieved.
In this module, you will:
Step 1. Establish Energy Improvement Management Programs.
Step 2. Get top management commitment and approval.
Step 3. Communicate your objectives and targets and Energy Improvement Management Programs.
Step 1: Establish Energy Improvement Management ProgramsNow that you have set energy objectives and targets (in Session 4), how will you achieve them and accomplish your goals?Your plan should be to:
1. List the individual tasks (What: Step-by-step guide of what individual activities will be undertaken to meet your energy improvement objectives and targets).
2. Assign responsibility for achieving energy improvement goals (Who: Assign all levels of staff responsibility for both the overall plan and for the individual tasks). Make sure you communicate and confirmthis with the managers and staff in responsible areas.
3. Establish deadlines for individual target tasks (When: Set intermediate deadlines for your plans). Incorporatingdeadlines give those responsible a sense that this is important and needs to be accomplished in a timely manner.
4. Estimate staff time and costs * (How much: Confirm with managers that the resources [financial and staff time] are consistent with what was described in the approved budget.) Are there other direct costs for materials? Equipment? Outside services?
* Note: Estimating your staff time and resources is an optional step. Management may want to understand the resource commitmentbefore approving your objectives and targets. Many organizations therefore incorporate this information in their written plans.
Let’s use our lighting and pumps energy improvement objectives and target examples (below from Session 4) to outlinethe step-by-step approach to develop an Energy Improvement Management Program.
The table on the next page presents an Energy Improvement Management Program developed as an example to increasethe efficiency of a utility’s lighting and pumps. The table on page 54 shows an example of an Energy ImprovementManagement Program with increasing renewable energy sources as the objective.
Objective Target Timeframe
Reduce Energy Cost Reduce overall energy cost by 10% by 2009 12 months
Increase energy purchased or generated fromrenewable energy sources
Increase energy purchased or generated fromrenewable energy sources by 10% by 2012
4 years
Refer back to the Typical High UseEnergy Operations and TheirAssociated Potential Energy SavingMeasures Table (pages 40-41) to
help you develop potential objectives and targetsand subsequent Energy ImprovementManagement Program.
Remember

Session 5, Module 1 53
Energy Improvement Priority Activities/Operations: Lighting and pumpsObjective: Reduce Energy CostTarget: Reduce overall energy cost by 10% by 2009 Start Date: January 1, 2008Completion Date: January 30, 2009Energy Improvement Management Program Lead: Jones
*Note: The pump #1 and lighting examples identified as priority areas for energy improvement in Session 3 become tasks (i.e., replace pump#1 and install automatic lighting) in our target to reach a 10% reduction in energy costs by 2009.
Tasks Staff Timeline Estimated Time (Person Hours or FTEs)
Estimated Costs(e.g., equipment)
Task: Establish month-to-month normalizedbaseline data on energy use and cost for (calendar year) 2008Deliverable: Monthly report of gross andnormalized energy consumption and cost19
Jones January 1 toDecember 31, 2008
8 hours to establishnormalization protocol; 1hour per month to update
Task: Post 2008 monthly energyconsumption data in public areaDeliverable: Spreadsheet
Smith Each month’s data posted within 30days of end of month; complete2008 data posted by 01/30/09
2 hours (10 minutes permonth)
Install Automatic Lighting Controls in Operations Building *
Task: List of electrical contractors withrecommendations Deliverable: Annotated memo
Purchasing(Anderson)
By January 15, 2008 4 hours
Task: Issue RFQDeliverable: RFQ
Contracts(Grant)
By January 31, 2008 4 hours
Task: Review responses to RFQDeliverable: Memo with contractors ranked
Contracts(Grant)
Responses due by February 21,2008; review complete by March 7,2008
8 hours
Task: Enlist contractorDeliverable: Signed contract with electrician
Contracts(Grant)
By March 15, 2008 4 hours
Task: Install automatic lighting controls Deliverable: Installed system
Johnson By April 30, 2009 4 hours $3,000 capital cost(estimated)
Replace Pump # 1 with more efficient pump*
Task: Determine optimal pump size usingPSAT software toolDeliverable: Memo, with analysis reviewedby engineering
Engineering(Clark)
By January 31, 2008 32 hours
Task: Research pump manufacturers Deliverable: Annotated memo
Purchasing By February 28, 2008 8 hours
Task: Purchase pump(s)Deliverable: Completed transaction
Purchasing By April 15, 2008 20 hours $60,000(estimated)
Task: Install replacement pump(s)Deliverable: Installed pump(s)
Engineering(Taylor)
By May 31, 2008 20 hours
Monitor, measure, and communicate 2009data on energy cost from 2008 baseline
Task: Present current status relative to target10% reductionDeliverable: Presentation to staff on year-to-year change in energy costs
Jones January 31, 2008 12 hours
ENERGY STAR’s Benchmarking Tool19-

Session 5, Module 1 54
Energy Improvement Priority Activities/Operations: Utility wideObjective: Increase energy from renewable energy sourcesTarget: Increase energy purchased from renewable energy sources by 10% by 2012Start Date: January 1, 2008Completion Date: January 30, 2012Energy Improvement Management Program Lead: Smith
Provide a reality check on your plans with line managers, department heads, and supervisors whose operational staffand management are involved.
• Are the appropriate staff members responsible?• Does the timing conflict with other operational priorities?• Do the tasks seem logical and sufficient to accomplish the target?
Now that you have drafted your utility’s Energy Improvement Management Programs, you need to get top management’scommitment and approval and communicate your objectives and targets and programs to utility staff.
Step 2: Get Top Management’s Commitment and ApprovalTop management needs to ensure that your EnergyImprovement Management Programs are integrated with other organizational goals and are consistent with theoverall mission of your utility or municipality. Managementalso needs to know what the efforts of achieving these goalswill cost in terms of staff time and capital expenditures, thelength of time needed to accomplish this effort, how it willinterface with periods of high operational priority, and whowill be involved in the tasks. This information will help topmanagement prepare and approve budgets for the projectsand assign project managers.
Tasks Staff Timeline Estimated Time (Person Hours or FTEs)
Estimated Costs (e.g.,equipment)
Task: Establish baseline information onexisting purchases of renewable energyas a percent of 2007 overall purchases
Deliverable: Memo or spreadsheet
Smith By January 8, 2008 4 hours
Task: Identify potential sources ofrenewable energy and makerecommendations
Deliverable: Memo
Smith, Jones By February 8, 2008 12 hours
Task: Adopt recommendation(s) andpurchase renewable energy
Deliverable: Contracts to purchaserenewable energy
Jones First purchase by April 15, 2008
20 hours Cost premium of no greaterthan 1.5 cents per kWh
Task: Monitor, measure, andcommunicate on 2009 purchases as apercent of annual 2009 purchases
Deliverable: Presentation to staff
Jones January 31, 2009 20 hours
Refer back to the Typical Water and
Wastewater High-Use Energy Operations and
Associated Potential Energy Saving Measures
table (page 37) to help you develop potential
objectives and targets and subsequent Energy
Improvement Management Programs.
Remember

Session 5, Module 1 55
Step 3: Communicate Your Objectives and Targets and Energy Improvement ManagementProgramsCommunicate your objectives and targets and action plans to employees, suppliers, contractors, and externalstakeholders. Open communication will increase buy-in of your energy goals and what you are trying to accomplish. Inaddition, communication of your goals and plans will keep the utility’s energy improvements on everyone’s radar andensure that your organization is on the path to continuous improvement.
Involving Contractors and Temporary StaffOn-site contractors and temporary staff may work in areas in which objectives and targets have been set.Communicating your objectives and targets and Energy Improvement Management Programs to contractors and temporary staff is important and can get you needed buy-in on what you are trying to accomplish. Also, keep in mindthat your suppliers can help you in meeting your objectives and targets (e.g., by providing information on more energyefficient technology or equipment and/or opportunities for renewable energy).
Apply Your KnowledgeUsing the objectives and targets developed by the Energy Team and the example Energy Improvement ManagementPrograms on pages 53 and 54, develop action plans for your water or wastewater utility. Attached in Appendix J is ablank Energy Improvement Management Program table that you can use with your Energy Team.
CONSIDER THIS... Begin with one or two objectives and targets and make sure they are attainable and feasible for your utility.Your utility can build on the original objectives and targets once you have experience and buy-in from staff onimplementing energy improvements. Don’t forget to report progress regularly as you move toward your goal!

Session 5, Module 2 56
MODULE 2: Develop Management System ‘Operating Controls’ to Support
Energy Improvements
Module Objective: To learn how to review, identify, and implement operating controls for your priority energymanagement activities and operations.
You’ve just completed an energy efficiency review of your utility,established objectives and targets, and set up energy action plans toimplement your targets. So what’s next?
Remember from Session 3, Module 3 – for every energy activity oroperation you determine to be a priority (above the threshold youestablished in the example – pump #1 and lighting), your utility willneed to verify current controls (e.g., records, procedures, training) orimplement new or additional controls to manage your priority energyissues.
Operating controls include:
• Training;
• Communication;
• Controlling documents and managing records; and
• Work instructions/SOPs and operations/equipment manuals for energy improvements.
TRAININGWhy train employees about energy management and your utility’s efforts to improve efficiency and reduce cost?
• Every employee can have potential impacts on energy demand and use; and
• Any employee can identify positive ways in which to improve energy management.
To improve your energy management training and awareness, include the following steps.
Step 1. Assess energy management training needs, develop the training, and integrate energy training with currenttraining and methods your utility already has in place.
Step 2. Conduct energy management training and document and maintain training records.
Step 3. Develop a system procedure/plan for maintaining energy management training and awareness and/or integrate into ongoing and future training plans.
Assessing energy management training needs — ask yourself:
• What activities affect our utility’s demand and use of energy?
• What activities involve an identified priority for energy improvements?
• What types of training do we currently conduct for these areas?
• Can energy management roles/responsibilities/controls be included in this training?
• Can we tweak current training material or ask our training provider to include energy issues or do we
need to develop new materials?
• How do we currently maintain training records?
Build on what you have in placeand what currently works. Do youhave an existing training procedureor plan? Or do you do a lot of on-
the-job training? If so, build your energymanagement training on what you have. Ifyou rely on an outside provider, contact themto see what they are doing in terms ofincluding energy topics in their programs.
Remember

Session 5, Module 2 57
STEP 1: Assess Energy Management Training NeedsTraining relating to energy improvements should be tailored to the different needs of employees and to various levels or functions in your utility. Who needs to receive energy management training at your facility? In assessing training needs for your utility, consider both general and specific needs. For example:
• “What broad understanding of energy issues does a particular employee need?”
• “What operating controls associated with energy management affect their daily work, and what happens if
they aren’t followed?”
• “What type of training does the employee currently receive?”
STEP 2: Conduct, Document, and Maintain Training RecordsJust like any other training you conduct, you should document and maintain (for verification purposes) your energy management training. Consider how you currently track training and participation.
Energy Management and CompetenceImplementing and maintaining energy management improvements at your utility may mean that employees incertain jobs, particularly operations that affect or are associated with energy need to have a combination of education, training, and experience to do their day-to-day tasks and ensure that your utility is meeting its energymanagement commitments. Make sure you maintain records of their experience and training (e.g., certifications,education, and previous job records) just as you would any other verifiable training records at your utility.
STEP 3: Develop a Training Plan/Procedure and/or Integrate Energy Management
Training and Awareness into Current Training PlansWhen you’re satisfied that your process for implementing an energy management training program is sufficient, document what you want to doin your current training plans/programs. This will help ensure that your employees stay current with your organization’s energy controls and commitmentsnow and in the future.
COMMUNICATIONProactive communication is crucial for the effective implementation of your utility’s energy management program and goals.
The actions in this portion include:
Step 1. Determine what energy issues need to be communicated internally and externally.
Step 2. Determine who has an interest and who has a potential to influence your energy management goals.
Step 3. Develop internal and external communications plans.
STEP 1: Determine What Energy Issues Need to be Communicated Internally and
ExternallyA good place to start in developing a communication strategy is to look at how your utility currently communicates messages internally and externally and to whom. How do managers currently get information toemployees and receive information and communication back from employees? Leverage effective strategies thatare already in place, especially those that are familiar to personnel such as an emergency communications plan.
Most organizations already have some type oftraining in place before they beginimplementing energy management programs.Build off your existing training procedures andplans.
Remember
Session 5, Module 2 58
Internal Communication Vehicles:
• Employee meetings
• Environmental, health, and safety training
• Working lunches
• Newsletters
• Pay stub inserts
• Intranet postings
• Bulletin boards
• “Tool box” meetings
Once you have an internal communication strategy in place, the next step is to determine your external communication strategy and with whom you are currently communicating. As an organization that regularly reports to the public, you probably already have external stakeholders that you communicate with, including citycommissioners or town boards, local citizens and citizen groups, the mayor or town manager, local energy utilities,contractors and vendors, and regulatory agencies.
It will benefit your utility to have a proactive internal and external communication program. Reach out internallyas well as to key external stakeholders about why you have chosen to implement energy management programsand what you want to achieve.
Common Water and Wastewater Utility External Interested Parties (i.e. Stakeholders):
• Local citizen/community groups
• Regulatory agencies
• Energy advisory groups
• Local officials
• Contractors and vendors
• Energy utilities
Internally Communicate Your:
• Energy Policy
• ENERGY STAR benchmarking results
• Energy audit results
• Energy improvement priorities
• Energy Improvement Management Programs
• Objectives and targets
• Energy savings progress and success stories
Externally Communicate Your:
• Energy Policy
• ENERGY STAR benchmarking results
• Energy audit results
• Energy improvement priorities
• Energy objectives and targets
• Requirements to suppliers and contractors
• Annual reports including energy highlights and successes
(e.g., Drinking Water Consumer Confidence Report)
Most organizations have some type ofcommunication process in place before theybegin implementing energy managementprograms. Build off your existingcommunication vehicles and plans.
Remember

Session 5, Module 2 59
STEP 2: Determine Who has an Interest and Who has the Potential to Influence Your
Energy Management GoalsOnce you’ve determined your current audience, identify additional external stakeholders or new methods of communicating by determining: who potentially has a vested interest and who potentially has an effect on energy management improvements. In determining what to communicate to your external interested parties, your organization will need to assess the extent to which your strategy will be proactive. Ask:
• What is your current level of public acceptance?
• What are your external stakeholders’ concerns?
• Have you had public relations issues in the past that require certain strategies or cautions?
• Since communication is most effective when it’s a two-way dialogue, what type of input from them would
interest you most and be most useful?
• What will be the return on investment of a proactive approach?
STEP 3: Develop Internal and External Communications PlansWhen you've determined what and to whom you will communicate, integrate the information with your current communication plans and procedures. For help with your communications plan(s), review U.S. EPA’s “Gettingin Step: A Guide for Conducting Watershed Outreach Campaigns” using the following link: (www.epa.gov/owow/watershed/outreach/documents/getnstep.pdf).
CONTROLLING DOCUMENTS AND MANAGING RECORDSHave you ever come across a document (e.g., a policy, procedure) and found that you couldn’t tell whether it was current, revised, approved, or obsolete? If your utility wants to make sure that everyone is working from themost current and approved documents, then documents must be “controlled” and records managed so that theycan be easily located, periodically reviewed, updated as needed, and removed when obsolete and replaced withcurrent versions.
The steps to manage your documents and records include:
Step 1. Review current document control and records procedures.
Step 2. Develop a format and procedure(s) for controlling documents and managing records.
STEP 1: Review Current Document Control and Records ProceduresReview what procedures/systems you have in place to controldocuments and manage records and those that will work bestfor your utility, including:
• Will a paper or electronic process or maybe a combination
of both, work best?
• Who has the responsibility and authority for creating and
revising documents?
• Which documents should be controlled so to ensure that
employees refer to the correct version?
• Does your organization currently employ a standard
document format and numbering system?
TIP!What’s the difference between adocument and a record?
Documents are written instrumentsused to keep a management system functioning.These may be revised or changed as yourmanagement system develops.
Records provide evidence or proof thatthe organization is actually implementing themanagement system as designed and theprocedures and work instructions are beingcarried out.

Session 5, Module 2 60
STEP 2: Develop a Format and Procedure(s) for Controlling Documents and Managing
Records When you've developed a process for managing and controlling your documents and records, integrate that process with your current systems. Identify and assign responsibility for preparing documents associated with your utility’s energy management programs and procedures, making necessary changes, and ensuring that documents are kept current. In other words, your utility should have a clearly defined system that designates authority for review and approval of documentation at various levels.
Records Management Check
• Have you identified what records need to be maintained?
• Have you determined the period of time necessary for retaining your records?
• How are your records stored and retrieved (electronic vs. hard copy)?
• Are you maintaining all the records needed to support your utility’s energy improvement priorities?
• Are records easily accessible?
For samples of Document Control and Records procedure(s) from water and wastewater facilities, use this link (http://www.peercenter.net/ewebeditpro/items/O11F10697.pdf) and refer to Section VIII. Also, additional procedures from utilities can be found here: http://www.peercenter.net/sector/wastewater/emstoolbox.cfm, under sample Environmental Management System (EMS)Documentation.
WORK INSTRUCTIONS/SOPs AND OPERATIONS/EQUIPMENT MANUALS FOR ENERGY
IMPROVEMENTSOperating ControlsDocuments that specify the way to execute a certain activity or operation are considerd operating controls. Operating controls are assigned to activities and operations involving priority energy improvement opportunitiesand are documented through the use of work instructions, standard operating procedures (SOPs), manuals, andother programs. Examples include HVAC, equipment maintenance and calibration procedures, and automatic lightingand equipment documents or programs.
Achieving energy management improvements requires managing or “controlling” the utility’s operations associated with your utility’s energy improvement priorities, objectives and targets, and regulatory requirements.What are your operating controls and how do you document them? You probably already have procedures, workinstructions, permits, maintenance manuals, and similar in place for many of your operations and services.
The following steps will allow your organization to determine which energy operations should be covered bydocumented procedures and work instructions and how those operations should be controlled.
The steps to manage your energy improvement operations include:
Step 1. Review, improve, or draft energy specific operating controls.
Step 2. Review maintenance and calibration requirements.
Step 3. Check operating controls.
Step 4. Communicate operating controls.
STEP 1: Review, Improve, or Draft Energy Specific Operating ControlsOnce you have a list of operations and services that require documented operating controls, look at what you already have in place to manage these activities. Do your current procedures reflect what is actually being doneat your facility? How do you control the operations now and are the controls adequate? Can the employees, whose work the procedures describe, easily understand them? What improvements to the current procedures dothey suggest?

Session 5, Module 2 61
One method to consider when developing or modifying your operating controls is to have someone observe a taskbeing conducted. The person would write down the steps, photograph key meters, valves, etc., and put togetherthe operating control (or work instruction) in written form. The writer should ask: Why are we doing the task inthat particular way? Has the work instruction been reviewed by everyone who completes the task? This will allow the best practices to be used and ensure that all shifts will perform the task in the same way.
STEP 2: Review Maintenance and Calibration RequirementsOnce you have identified operations that require control and have documented your procedures and work instructions, determine the maintenance and calibration requirements for these operations and services, and thendocument and maintain these records. Don’t ignore the maintenance manuals that come with your energy and energy related equipment (e.g., HVAC or pump manuals).
Review the maintenance activities you are currently conducting. Are they sufficient? Timely? Preventive or reactive? Some organizations place critical monitoring equipment under a special calibration and preventive maintenance program. This can help to ensure accurate monitoring and make your employees aware of which instruments are most critical for energy monitoring purposes.
STEP 3: Check Operating Controls About two or three months after you have documented and implemented your operating controls, check if theyare working according to your plan. Here are some questions to focus on:
• Have you identified all operations and activities associated with energy improvement priorities?
• Are these operations and activities under control through programs, documented procedures, work
instructions, etc.?
• Have you communicated and trained your employees, suppliers, vendors, and contractors on applicable
procedures, work instructions, and policies?
• What benefits/improvements are you experiencing?
• What adjustments need to be made?
STEP 4: Communicate Operating ControlsReview your energy-related documented procedures and work instructions with all applicable employees. Discussing your procedures with the people who will implement them will help secure buy-in. Alsoremember to communicate operating controls with applicable vendors, contractors, suppliers, and temporarystaff.
Examples of energy operations and services that may require operating controls:
• Equipment/tool calibration;
• Pump maintenance; and
• Management of contractors.
For many types of water and wastewater equipment, operating controls make a real difference in energy consumption. For example, pumps and motors are most efficient at particular settings.
Note: As you update or develop homeland security and/or incident response and emergency preparedness andresponse plans, procedures for potential power failures could also be developed. Consider what connections theseprocedures might have with energy improvement programs.

Session 5, Module 2 62
CONSIDER THIS...Build your energy plans, programs, and documentation on what you already have in place.Employees closest to the operations needing control should be involved in developing improved workinstructions and SOPs.
For examples of operating controls for energy operations, review Appendix K.
Session 5 Resources & ToolsEMS Handbook for Wastewater Utilities: http://www.peercenter.net/toolkit/Step_By_Step.cfm
Moving to the Next SessionIn Implementing Energy Improvement Programs and Building a Management System to Support Them, you completed actionplans for your energy objectives and targets and developed operating controls for the energy activities that youdetermined were priorities. In the next session, you will measure the progress of your energy targets, establish periodicenergy audits, a corrective action program, and a process to continually review legal and other requirements and yourenergy goals with management.

Session 6 63
So far, you’ve identified your current status on energy performance,identified priority areas for improvement, set objectives and targets, anddeveloped energy action plans or Energy Management ImprovementPrograms. You have also put procedures, work instructions, operatingcontrols, and training in place to ensure that your priority energyimprovements are managed.
The next step is to monitor and measure your progress in meeting yourenergy objectives and targets and assess your compliance toward meetingyour regulatory requirements. Monitoring and measuring allows you totrack your performance and improve efficiency by managing what you do.The results of your objectives and targets and other efforts are easier todemonstrate when current and reliable performance data are available andreferenced against a defined baseline. This data can help you demonstratethe value of your energy management activities to top management andto other vested parties such as utility staff and your local community.
In this Session on Monitoring and Measuring, you will develop ways to:
1. Review what you currently monitor and measure for energy.
2. Determine what else you need to monitor and measure for
your priority energy improvement operations.
3. Develop a plan for maintaining the efficiency of energy
equipment.
4. Review the progress of your energy targets.
5. Implement actions to adjust or correct when you are not
progressing toward your energy goals.
6. Monitor/Reassess compliance status.
Let’s first review a few key terms that will help as you determine what tomonitor and measure for energy targets.
Key Characteristic: An element of an energy target, operation, or activitythat can be measured or evaluated for energy performance.
Performance Indicator: What exactly you will measure to evaluate andverify performance improvements in relation to a specific target. Forexample, measuring the direct and indirect emissions of carbon dioxide(CO2) per year from established baselines to check the progress in meetingyour target of 25% CO2 reduction from 2006 levels.
SESSION 6: Monitoring and Measuring Your Energy Improvement
Management Programs
Keys to Success
� Make sure the data you collect is
useful and has meaning for what
you want to accomplish
� Hold regular progress reviews of
the Energy Improvement
Management Programs to ensure
you are on track to meet your
targets
� Communicate the status and
progress of your energy targets
to staff, management, and other
stakeholders

Session 6, Module 1 64
MODULE 1: Review What you Currently Monitor and Measure for Energy
Module Objective: To review the energy and energy-related data and information you currently collect.
In Session 2, you identified your current status on energy consumption and energy performance. This required identifyinga number of data elements and sources. In Session 4, you established energy targets and identified performance indicatorsthat could be used to measure your progress. Therefore, you’ve compiled many of the methods and tools you’ll need tomonitor and measure your energy management progress.
Apply Your KnowledgeUsing the example below and the blank worksheet in Appendix L to document what you are currently measuring and fromwhere you obtain this data. Refer back to Session 2 as applicable.
A water or wastewater utility might want to record the following:
CONSIDER THIS...When you have two sources for data, list both. It can be useful to cross-check your data.
Data Element Units Data Source
Overall electricity consumption kWh per month Utility bills, Automatic Energy ManagementSystem
Peak electricity demand kW Utility bills, Automatic energy managementsystem
Electricity demand by system(HVAC, lighting, pumps, other)
kWh per day Automatic Energy Management System
Wastewater treated Million gallons per day Pump records
Natural gas consumption Million BTU per month Utility bills
Methane captured Million BTU per month Combined Heat and Power (CHP) system
Electricity generated kWh per month CHP system
Steam supplied Million BTU per month CHP system
NOx Emissions Pounds per day CEM on CHP system
Gasoline purchased Gallons per month Energy Consumption Invoices
Diesel fuel purchased Gallons per month Energy Consumption Invoices
Biodiesel fuel purchased Gallons per month Energy Consumption Invoices

Session 6, Module 2 65
Module 2: Determine What Else you Need to Monitor and Measure for
Your Priority Energy Improvement Operations
Module Objective: To determine what data your utility will need to collect to achieve its energy targets and to manageenergy improvements.
Information collected by monitoring and measuring your key energy issues can help you determine what you need andanswer the questions:
• Is your energy improvement program being carried out as planned?
• Is your utility achieving its energy commitments and its objectives and targets?
• What information is most valuable?
Look back at your energy objectives and targets and energy plans from Sessions 4 and 5. What energy data andinformation needs to be collected for you to achieve your energy targets? What are the key characteristics of the operationsand related equipment and how do you measure these characteristics to ensure proper energy performance?
Referring back to the pump (#1) and lighting energy opportunity examples, let’s make a sample list of the operatingcontrols, key characteristics, monitoring and measurement methods, and calibration needs for operating and maintainingpumps and lighting.
Energy-RelatedOperation
Energy-RelatedImpacts
Operational Controls Key Characteristicsof Operation or
Activity
Monitoring orMeasurement
Methods
Equipment & SystemCalibration Needs
Operate andMaintain Utility Pumps
Overall energy cost($)
Electricityconsumption (kWh)
Peak electricitydemand (kW)
Pump maintenancemanual
Time-of-day pricing
Pump schedule(operations deferredto off-peak hourswhen possible)
Float settings
Energy (kWh) permillion gallons
Load profile
Cost of energy($/kWh)
Peak demand charges($/kW)
Track energyconsumption
Track volume pumped
Note changes inelectricity cost
Calculate kWh/MG
Chart daily andmonthly load profile
Monthly energy report
Flow meters
Electric Meters
SCADA
Lighting forOperations Building
Overall energy cost($)
Electricityconsumption (kWh)
Automatic lightingcontrol system
Work instructions onturning off unneededtask lighting
Work instructions onlimiting overrides ofautomatic controls
Energy (kWh) permonth
Cost of energy($/kWh)
Track energyconsumption
Note changes inelectricity cost
Include in monthlyenergy report
Automatic lightingcontrol system

Session 6, Module 2 66
Apply Your KnowledgeUsing the sample table on the previous page and the blank worksheet in Appendix M, draft a list of the operating controls,key characteristics, monitoring and measurement methods, and calibration needs for the priority energy opportunitiesyour Energy Team came up with in Session 3.
CalibrationCalibration of your systems is an extremely important aspect of maintenance. Your equipment may have calibration procedures set bythe manufacturer that must be followed. You may need to documentcalibration requirements and dates for equipment that affect yourtargets or your compliance requirements. Example of calibratedequipment could include flow, pH, chlorine monitors, or thermostatsused by the HVAC system. Make sure a regular schedule is in place tocalibrate the equipment and make sure you retain your calibrationrecords. Remember, some equipment may be calibrated off-site, somake sure the vendor supplies you with a copy of the records.
Think about what elseyou might want to monitor and measure. Your performance indicatorshelp you measure progress towards your energy goals and help youdemonstrate compliance with legal and other requirements.
In the course of establishing the tasks needed to meet your energy goals,you may have identified additional data needs. Add those as applicableas well. For example, reducing NOx emissions may not be a priorityobjective if your utility is well below its limit but you need to monitor andmeasure the quantity of NOx as a regulatory parameter.
Review the worksheet below for example utility requirements, theirassociated performance indicators, and potential data sources.
CONSIDER THIS...If you are going to spend the time and resources to collect information, make sure that it is useful andmeaningful to your utility.
Requirement Performance Indicator Data Source
Keep NOx emissions under 1 ton per ozoneseason
NOx emissions (lbs per ozone season) Continuous Emission Monitor on CHP system
Ensure fewer than 5 power outages of onehour or more each year
Number of power outages exceeding one hour Automatic Energy Management System
Ensure fewer than 3 unscheduled service callsfor CHP system per year
Service calls for CHP system Energy Consumption Invoices
Don't forget about the maintenance
manuals that come with your energy
operations equipment. They may
contain calibration and/or
measurement methods for your equipment. In
addition, your equipment may have calibration
procedures set by the manufacturer, and often
equipment comes with annual maintenance
provided by the vendor.
Remember
“Monitoring and measurement takes thepulse of an organization. Their applicationcan be the most important tools in amanager's toolbox with regard to se�inggoals, objectives and targets, and improvingoverall operations.”
Rick BickerstaffCommissioners of Public WorkCharleston, South Carolina

Session 6, Module 3 67
MODULE 3: Develop a Plan for Maintaining the Efficiency of Energy Equipment
Module Objective: To ensure that energy-related equipment is properly maintained.
Energy equipment can be a substantial investment for your organization. A methane capture system feeding a combinedheat and power system, a back-up generator, and an automatic energy management system are significant capitalinvestments. Proper maintenance can ensure that these systems operate smoothly and reliably. Neglecting maintenancecan lead to system failures and possibly dangerous situations. The details of the necessary maintenance will vary fromsystem to system but will typically be provided by the vendor.
For your energy equipment or system, note the following.
• Who is responsible for maintenance? With new equipment, does the vendor provide maintenance for the
first year?
• What is the schedule of maintenance actions?
• Are all the necessary resources available for maintenance (e.g., fuel, spare parts, filters, etc.)?
• Are there specific outside contractors brought in to perform maintenance, or is there a process for
finding such contractors?
• Is performance evaluated on a regular basis?
• Where are the maintenance records and performance evaluations of the equipment or system recorded?
Energy equipment performance will vary depending on what type of system is included. For example, performanceindicators for a back-up engine generator might include the following:
• Start-up time;
• Fuel consumption;
• Electricity generation; and/or
• NOx emissions.
For an energy system maintenance check, an example performance indicator for an automatic energy management system(meters and a software program) would be very different and might include the following:
• Degree of agreement with utility meters;
• Number of manual adjustments/overrides needed to automatic controls; and
• Number of technical support calls needed in past quarter.
CONSIDER THIS...Proper energy equipment and system preventive maintenance can save repair costs and improve performanceand reliability.

Session 6, Module 4 68
MODULE 4: Review the Progress of your Energy Targets
Module Objective: To develop a plan for regular, periodic reviews of your Energy Improvement Management Programs.
You now have the information you need to measure progress and use the information in regular, periodic reviews of yourEnergy Improvement Management Programs. This will help you get a clear picture of your performance and progressrelative to your established energy targets.
In developing your review plan, consider the following.
• When is the review conducted?
• How is progress measured?
• Who is responsible for the review? Are they sufficiently trained?
• What will be done with the outcome of the review?
The bullets below provide a sample method for a utility to periodically review the progress of their energy targets.
• Review your Energy Improvement Management Programs within six months after initial implementation.
• Assess your energy targets using the performance indicators you developed for each task in the Energy
Improvement Management Programs.
• The status and progress of each task can be reported by the applicable staff listed in your plans.
• Use the outcome of the review as a scorecard for each target indicating the progress, the next steps, and any
corrective actions recommended.
Apply Your KnowledgeUsing the example Energy Improvement Management Programs Progress Review* on the next page and the blankworksheet in Appendix N, sit down with your Energy Team and develop a Progress Scorecard based on the energytarget(s) you set with your utility in Sessions 4 and 5.
* Note: Your utility may wish to consider a different method to evaluate the energy target’s performance.
Conducting Periodic Energy AuditsConducting a periodic energy audit is another type of review orstatus check you could consider for your energy managementplans and programs. Remember from Session 2 that youconducted a baseline energy audit for your utility. Withperiodic, follow-up energy audits, you can have a clear beforeand after characterization of your energy managementactivities. This is particularly important if you are installing anumber of new systems or changing operational practices.Remember, you’ll want to ensure that you actually achieve orexceed the energy savings you set out to accomplish. Not everyperiodic review needs to be a full-scale energy audit, but auditsshould be a regular part of assessing your performance.
“I wish we had documented costs and costsavings earlier. Measuring and monitoringare the most important things you can showrate payers and tax payers the actual moneyyou have saved.”
Mark YoungDirector, Lowell Regional Wastewater UtilityLowell, MA
TIP!It is sometimes beneficial to consider a thirdparty performance contract to implementsome or all of your energy-related initiatives.
A useful tool to see if you are a good candidate forguaranteed energy performance can be found at:http://www.energyservicescoalition.org/resources/5steps.htm.

Session 6, Module 4 69
Energy Improvement Management Programs Sample Progress Review Table
What do you do if your utility progress report or energy audit status check shows that your energy targets are notperforming as intended? In this case, first determine the reason or cause of why the targets are off course, and thenimplement a corrective action to get your energy target back on course. The subsequent module and Session will providefurther information on this topic.
CONSIDER THIS... You’ve put a lot of effort into developing your Energy Improvement Management Programs and collectingthe necessary information to monitor and measure your performance and progress towards your energytargets. Regular reviews will make sure these efforts will pay off. In addition, have regular checks on theprogress of your energy objectives and targets and report the results to top management and staff.
Objective Reduce Energy Costs
Target for 12/31/08 Reduce overall energy cost by 10% from 2006 levels by 2009
Status at 12/31/07 Energy cost reduced by 6% from 2006 levels
Tasks Identified Install automatic lighting controls
Replace pump #1
Replace windows and improve insulation around doors
Increase CHP generation by 10%
Evaluate potential for participation in demand response program
Tasks Accomplished Automatic lighting controls installed
Replaced windows and improved insulation around doors
Increased CHP generation by 12%
Observations New pump purchased but not yet installed due to contractor delays
Better insulation allows for down-sizing of HVAC system – which is in need of replacement
Efficiency of pump from ABC judged to be not compatible with operational and energy efficiency requirements
Corrective Actions Needed Have purchasing review pump suppliers to find pump with appropriate operational and energy efficiencyrequirements
Next Steps Replace HVAC system with ground-source heat pump
Session 6, Module 5 70
MODULE 5: Implement Actions to Adjust or Correct When You Are Not
Progressing Toward Your Energy Goals
Module Objective: To identify measures to meet energy targets when current efforts are not as successful as originallyplanned.
If you have set ambitious targets, it’s possible that one or more may not have been attained by the time the review isconducted. Weather patterns, electricity markets, contractor schedules, budget cycles, and other factors may haveprevented your utility from achieving everything you set out to accomplish. Use the review to identify why your targetwas not met and what can be done to achieve that target in the future. The following are some helpful questions to pose.
Was the target realistic?An overly ambitious target may be simply unattainable. If a utility set a goal of reducing energy expenditures, but faceda “perfect storm” of increasing energy prices, increasing volume of water treated, and a particularly cold winter, even themost ambitious energy management program may be unable to provide a net reduction in energy costs. If yourorganization did everything it set out to do but couldn’t meet the target, consider revising the target based on thisinformation.
Were the identified tasks sufficient to achieve the target?Your organization may have identified tasks to meet the target and accomplished all of these tasks but yet did not achievethe target. For example, a utility’s target may have been to reduce peak energy demand by 20 kW and the identifiedmeasures are estimated to provide that peak reduction. Some measures have uncertain benefits that are estimated basedon experience of similar organizations. Once implemented, the actual demand reduction may turn out to be 17 kW. Theutility may have done almost everything right, but the identified tasks were insufficient to meet the target. The utility canresolve to add in extra measures next time for a margin of error.
Were some tasks not completed?A likely reason for targets being unmet is that one or more tasks was not completed. There may be any number of reasonsfor this. The team responsible for that task should be prepared to explain the reasons for the delay or omission. Was thetask deemed not feasible? Were there delays due to factors beyond the organization’s control? Was the original estimateon the timing of the task unrealistic?
Did anything change?As mentioned above, wet and dry flows, weather patterns, electricity markets, contractor schedules, budget cycles,personnel changes, and other factors may affect how your utility attempts to achieve its energy goals.
Once you’ve identified why the targets have not been met, identify an appropriate response. This may include revisingthe targets, modifying the task list, or providing additional resources to the team implementing a specific task.
If all of your targets have been met with relative ease, take time to applaud your efforts, and then consider setting moreambitious targets for the next phase of your energy management program.
CONSIDER THIS...There will be “lessons learned” throughout the process of setting targets and identifying tasks. Listen to yourEnergy Team as they discuss any difficulties encountered.

Session 6, Module 6 71
MODULE 6: Monitor/Reassess Compliance Status
Module Objective: To learn how to check your compliance with your energy-related legal requirements.
You evaluated your compliance with legal and other requirements in Session 2. Since your energy targets could involvesome changes to your equipment or operations, it is important to repeat this evaluation at regular intervals.
It’s time to check if reducing your energy consumption has affected your compliance requirements. From the example, didinstalling a new pump, installing automated lighting, or utilizing renewables affect your compliance requirements? Referback to Session 2, Module 6 and the compliance baseline review you conducted. Ask the following questions once you’veimplemented your energy improvement programs.
• How has compliance been affected by your energy conservation measures?
• Have any regulations been affected? If so, which one(s)?
• Is the regulation up-to-date?
• Are we still in compliance according to all pertinent agencies?
• Do we expect to remain in compliance?
• Are there opportunities to go beyond compliance?
CONSIDER THIS...Priorities may shift with new budget cycles or new regulations. While energy management will be beneficialto your utility and your community, the scope of measures that you are able to employ may shift withchanging requirements.
Session 6 Resources & ToolsENERGY STAR’s Portfolio Manager: (https://www.energystar.gov/istar/pmpam/)
Moving to the Next SessionIn Monitoring and Measuring Your Energy Improvement Management Programs, you determined what you currently do as wellas need to do to monitor and measure and develop an equipment maintenance plan. You also developed a way toregularly review progress, take corrective action if needed, monitor compliance, and communicate progress. In the nextand final session, you will learn to effectively maintain your energy improvement programs by continuing to align energygoals with your utility’s priorities, apply lessons learned, expand involvement of management and staff, and ultimatelycommunicate success.

Session 7 72
In this Guidebook, we have demonstrated that it makes good operationaland business sense to utilize a systematic approach to optimize yourenergy efficiency and conservation efforts. Through a replicable Plan-Do-Check-Act approach, the Guidebook has provided step-by-step Sessions andmodules necessary to translate and prioritize your energy improvementareas and cost savings opportunities into achievable, quantifiable targets.This Guidebook has also provided real life examples and case studies fromwater and wastewater utilities that have already realized the benefits ofsetting and achieving energy improvement goals. In addition, don’t forgetabout the energy tools and resources provided throughout the Guidebookand the utility practitioners who have experience in systematic approachesand in implementing successful energy improvement programs.
In this session you will:
1. Continue to align your energy goals with business/operational
goals.
2. Apply lessons learned.
3. Expand involvement of management and staff.
4. Communicate success.
SESSION 7: Maintaining Your Energy Improvement Programs
Keys to Success
� Communicate energy
achievements and build on
successes
� Encourage further staff
involvement
� Aligning energy goals with
operational objectives and
mission

Session 7, Module 1 73
MODULE 1: Continue to Align Energy Goals with Business/Operational Goals
Module Objective: To align your energy efficiency and energy cost savings goals with your current or planned businessand operational systems/programs.
As your utility plans and implements its energy improvement opportunities, it is important to ensure that your energygoals are aligned with your organization’s overall business and operational management practices. Here are somequestions you may wish to consider at each of your energy program reviews.
• Have our priority objectives changed?
• Has the business or policy environment changed in such a way that the targets need revision?
• Have new resources or funding assistance programs become available that would support setting additional
objectives or targets?
• In terms of setting targets and identifying tasks for energy performance, do we feel that our current process is
sound and efficient?
As an example, consider the replacement of aged infrastructure at your utility through an asset management program. Ifyou choose to replace older pumps with newer, more energy efficient ones through an energy management program, thisaligns well with your asset management goals.
Utility Case Study: Lowell, MA Regional Wastewater UtilityThe following is an example of activities Lowell Regional Wastewater District implemented over time to meet businessand operational goals.
• Installed motion sensors and have achieved payback of $20,000/year.
• Adopted purchasing and bidding procedures to specify that when equipment needs to be replaced, it will be
replaced with energy efficient equipment.
• Installed energy efficient pump motors (VFDs) with payback of 2 years, estimated annual energy costs savings
of $145,538; lifetime reduction of 953 tons of CO2, 2 tons of SO2, and 1 ton of NOx.
• Currently exploring potential for on-site generation of energy using effluent flow and microturbines.
• Currently directing consultants who are developing a comprehensive upgrade plan to incorporate energy
efficient systems and equipment early and throughout the planning process.
For examples of how Camden County (New Jersey) Municipal Utility Authority has reduced their energy consumption,review Appendix O.Other examples can be found at:(http://www.nyserda.org/Programs/Environment/muniwaterwwtTDDComplete.asp) to view a series of water andwastewater utility case studies from the New York State Energy Research and Development Authority.
CONSIDER THIS...By aligning your energy improvement opportunities with your utility’s business/operational goals, yourutility will focus its attention on the priorities that matter most to facility management and the localcommunity.
“Energy management investment is an asset management toolthat provides daily operational savings with increased processcontrol.”
James L. JutrasWater Quality SuperintendentEssex Junction, Vermont

Session 7, Module 2 74
MODULE 2: Apply Lessons Learned
Module Objective: To successfully apply what you’ve learned through implementation of your utility’s energy targetsand the examples from your utility peers that have successfully developed energy improvement programs.
Throughout this Guidebook, there are energy tools and resources, as well as case studies and working examples of energyimprovements from water and wastewater utilities that can further assist you as you plan, prioritize, and implement yourutility’s energy objectives and targets. Keep the following lessons, provided by water and wastewater utilities, in mindas you develop the energy goals for your utility.
• Communicate success, including the progress of your energy improvement targets, early and often to help
motivate management and employees to the benefits of your energy programs.
• Clearly define roles and responsibilities for energy management.
• Remember the KISS rule. Keep the methods to review your priority energy improvement opportunities straight
forward and flexible. Remember, this process is not set in stone. If you do not feel the criteria selected are
right or the analysis is working as intended, make a change.
• Choose targets that are realistic and quantifiable and that come from your “low hanging fruit” or quick win
energy improvement opportunities.
• Contact water and wastewater treatment facilities that have implemented energy improvement programs and
benefit from their knowledge. Members of the Steering Committee that participated in the development of this
Guidebook are eager to share their insights as well.
CONSIDER THIS...Build on the successes and learn from the plans and procedures that did not work that well when developingand maintaining your utility’s energy plans, programs, and goals.
Session 7, Module 3 75
MODULE 3: Expand Involvement of Management and Staff
Module Objective: To learn how to expand the involvement of utility staff in planning and implementing EnergyImprovement Management Programs.
Regardless of the size of your utility or the scope of your energyfenceline, it is easy to allow energy improvement programs to become“Steve’s” or “Megan’s” or “the Energy Team’s” program. If aparticular person or group writes your energy managementplans/procedures, does all the training, and is responsible forimplementing most of your energy objectives and targets, whathappens if Steve or Megan or some members of your Energy Teammove on? The investment your utility has made in your energyimprovement program could be in jeopardy.
One solution that has proven successful is to expand the involvement of management and staff at your utility. Not onlyshould your Energy Team be cross-functional, with representation from across the utility, but you should also havedifferent levels of staff involved including management on your Energy Team. Management’s input is critical to thesuccess of your energy improvement goals and will help ensure buy-in and commitment from your entire staff.
In addition, transferring the experience and knowledge throughout your utility will help capture and maintain institutionalknowledge of the energy program as utility staff retire or move on to other locations and positions. Your incorporationof energy efficiency/conservation maintenance, calibration, and other requirements into your training programs will alsohelp keep your energy improvement programs going strong.
Remember, recognizing the accomplishments of individuals or teams is a key to sustaining support and momentum.Rewarding effort sets the example for what constitutes success and helps motivate employees through increased jobsatisfaction. To review a few ideas for ways to recognize personnel for their efforts, use this linkhttp://www.energystar.gov/index.cfm?c=recognize_achievements.internal_recognition.
CONSIDER THISInvolving management and staff from all levels and functions will deepen the experience and knowledge basefor your energy programs. Continue to communicate the message indicating the importance of energy goalsfrom top management to operations and throughout your utility.
Your Energy Team and other cross-
functional teams can also help the
integration of your energy programs
into other utility systems such as environmental,
quality assurance, conservation, security, or
asset management.
Remember

Session 7, Module 4 76
MODULE 4: Communicate Success
Module Objective: To communicate the on-going successes of your utility’s energy management plans.
Now that you’ve developed your utility’s Energy Improvement Management Programs, make sure that your employees,your management, and your community know what you want to accomplish with regard to energy improvement and howyou’re doing against your goals.
You may wish to consider attending conferences sponsored by the U.S. Environmental Protection Agency (EPA), by theWater Environment Federation (WEF), the American Water Works Association (AWWA) or participating on their energycommittees. The National Association of Clean Water Agencies (NACWA) is another organization involved in promotingsustainable infrastructure. Through these and other trade associations, you can share the benefit of your experiences withyour peers and in turn learn from their experiences.
The ENERGY STAR Program, supported by the U.S. Department of Energy and U.S. EPA, is one opportunity fordemonstrating superior performance in energy management. In addition, many states have a municipal energy challengethat you can join and enter your water or wastewater treatment plant to reduce your energy consumption. Also, yourelectric or gas utility may have a program for recognizing peak demand reductions in the summer months. There are alsomany entities that recognize organizations that reduce greenhouse gas emissions.
CONSIDER THIS...Remember, employees and external stakeholders respond best to information that is meaningful to them.Putting energy performance information in a form that is relevant to each internal and external stakeholderwill increase the likelihood they will act on the information.

77
CONCLUSION
Energy production and energy use can impact your utility in many areas of operation. Energy production is a majorsource of environmental impact that affects air quality, water quality, the depletion of natural resources, and climatechange, while energy usage takes costs from a facility’s budget that could be better spent on employee wages/benefits orto stabilize utility rates. A well thought out and implemented Plan-Do-Check-Act process will conserve energy, reduceor avoid costs, and reduce the depletion of non-renewable sources of energy as well as minimize the energy productionand usage impacts, strengthening the position of the utility.
As you utilize the information in this Guidebook for your water and wastewater utility, remember the following.
• Energy production and use affects air quality, water quality, the depletion of natural resources, and the
generation of greenhouse gases that contribute to climate change.
• Wastewater and water utilities’ challenges in meeting energy needs and costs are increasing.
• Every dollar spent on energy is a dollar that it is not available for employee wages/benefits or to stabilize utility
rates.
• Proactively and systematically looking for ways to reduce energy consumption and costs is a critical part of
managing operations.
• Tools and resources are available for utilities interested in conserving energy, reducing costs, and increasing
the use of renewable sources of energy.
• Many utilities have had great success in improving their energy management but the most effective are those
that integrate energy projects into a sustainable Plan-Do-Check-Act process.
• A better managed, more efficient utility enjoys an improved image, position, and relationships with regulatory
agencies as well as tax or rate payers.

78
RESOURCES/TOOLS
Best Practices for Energy Management, AWWA Research Foundation, 2003.
The Cleaner and Greener Emission Reduction Calculator
Combined Heat and Power Partnership; U.S. EPA
Energy Audit Manual for Water/Wastewater Facilities, published by EPRI, 1994.
Energy Conservation in Wastewater Treatment Facilities - MOP FD-2, published by WEF, hardcover, 1997.
ENERGY STAR’s Benchmarking Tool
ENERGY STAR’s Portfolio Manager
ENERGY STAR Guidelines for Energy Management
EPA's National Environmental Performance Track Program: www.epa.gov/performancetrack
Opportunities for and Benefits of Combined Heat and Power at Wastewater Treatment Facilities, by Eastern Research Group forEPA, April 2007. Very good on CHP options.
Roadmap for the Wisconsin Municipal Water and Wastewater Industry; funded through Focus on Energy, this roadmapaddresses four key areas of concern that industry representatives have identified: energy use and supply, aging plants andinfrastructure, sustainable water supply, and waste-product reuse.
Roadmap to Energy in the Water and Wastewater Industry, ACEEE, 2005; focused on what industry stakeholders think wouldbenefit them.
Wastewater Management Fact Sheet: Energy Conservation, U.S. EPA, July 2006; discusses energy audits, renewable energy,and other options.
Water & Sustainability (Volume 4): U.S. Electricity Consumption for Water Supply & Treatment – the Next Half Century, EPRITopical Report, March 2002.
Water-Energy Relationship, CEC staff paper, June 2005. This document focuses more on water treatment but has a fairamount of (California-specific) material on energy demands for wastewater treatment, including figures of kWh permillion gallons. This document also has a great list of references.
Watergy: Taking Advantage of Untapped Energy and Water Efficiency Opportunities in Municipal Water Systems, Alliance toSave Energy, 2002. Very much its own sort of management approach, with case studies from all over the world.
APPENDICES
Ensuring a Sustainable Future: An Energy Management Guidebookfor Wastewater and Water Utilities

SESSION 2: Appendices
Appendix A
Utility Case Study: Essex Junction, Vermont Wastewater Treatment Facility
Turning Methane into Money: Cost-Effective Methane Co-Generation Using Microturbines at a
Small Wastewater Plant -- Paper

Efficiency Vermont was created by the Vermont Legislature and the Vermont Public Service Board to help all Vermonters save energy, reduce energy costs, strengthen the economy and protect Vermont's environment. Efficiency Vermont is currently operated by Vermont Energy Investment Corporation (VEIC), an independent non-profit organization under contract to the Vermont Public Service Board. VEIC is a Vermont based organization, founded in 1986.
Energy efficiencyupgrade costs $303,000
$37,000
About 7 years
$555,000
Village of Essex Junction Wastewater Treatment Facility
The solution: Use waste methane gas that is already collected on-site to generate electricity, thereby reducing the need for commercial energy.
Project Summary
The need: To reduce operating costs of the wastewater treatment facility.
Project Facts
Estimated first year utility bill savings
Energy efficiency investment payback (after incentives paid) Estimated lifetime customer savings (15 years)
www.efficiencyvermont.com
In an effort to cut operating expenses and keep wastewater rates stable, the Village of Essex Junction partnered with Efficiency Vermont, Northern Power Systems, and Hallam Associates, Inc. to incorporate methane-fueled co-generation using microturbine technology into the wastewater treatment process. Methane-fueled co-generation has been implemented at many large wastewater facilities in the United States, but is often not considered cost effective for smaller plants. The Essex Junction facility is the first of its kind in New England, confirming the viability of small-scale application of this process.
While treating wastewater, the waste sludge is processed in an anaerobic digestion tank, meaning the tank has no oxygen. This part of the process stabilizes the sludge and reduces its volume. Methane gas is produced from the anaerobic digestion. In the past, the methane gas was collected and burned in a flare. Now, methane-fueled co-generation allows nearly 100% of the methane to be used as fuel for two microturbines that generate electricity. The heat emitted from this process is then captured and used to heat the anaerobic digestion tanks.
Methane-fueled co-generation is a method of producing electricity and creating usable heat that enables the facility to save energy and money. It is also a great example of renewable and distributed generation efforts.
The Village of Essex Junction and Efficiency Vermont were honored with a 2003 Vermont Governor’s Award for Environmental Excellence and Pollution Prevention.
Owner:Village of Essex Junction (802) 878-6943 Design/Build: Northern Power Systems Waitsfield, VT (802) 496-2955 Engineer: Hallam Associates, Inc. South Burlington, VT (802) 658-4891 (802) 496-2955
Additional Funding Support:Biomass Energy Resource Center Montpelier, VT (802) 223-7770 NativeEnergy Charlotte, VT (800) 924-6826 United States Department of Energy http://www.energy.gov
Project Partners
Essex Junction, VT

Turning Methane into Money: Cost-Effective Methane Co-Generation Using Microturbines at a Small Wastewater Plant
Gillian Eaton, Vermont Energy Investment Corporation
James L. Jutras, Village of Essex Junction, Vermont ABSTRACT
Application of microturbines for methane-fueled combined heat and power generation represents an innovative, renewable energy technology. While methane-based co-generation has been widely implemented at large wastewater facilities, it is generally not considered to be cost-effective for smaller plants. The Village of Essex Junction, with the support of Efficiency Vermont, has successfully implemented microturbine technology at its 2.0 million gallon per day (MGD) average-flow, municipal wastewater treatment facility, and can provide firsthand information on its financial benefits. The Essex Junction facility design is 3.3 MGD with flows at 2.0 MGD.
The Essex Junction co-generation project installed two, 30 kilowatt (kW) microturbines that combust waste methane gas to generate electricity. Waste heat from the microturbines is used to maintain 100-degree Fahrenheit temperatures for the site’s anaerobic digestion process. Total system efficiency of electricity and heat generation is greater than 80%. With nearly 100% use of its waste methane, the facility now saves approximately 412,000kilowatt-hours (kWh) (36% of annual usage) and $37,000in electricity costs per year. As a result, more than 600,000 pounds of carbon dioxide emissions from power plants will be prevented because of this project.
The Essex Junction project is the first of its kind at a small New England wastewater facility. Similar projects could likely be implemented at 5-15% of the nation’s 16,000 publicly-owned wastewater treatment facilities. Efforts to expand methane-based co-generation at wastewater facilities would yield significant energy savings, while also supporting pollution prevention, renewable energy, and distributed generation efforts. This paper will describe the benefits of methane-fueled microturbine co-generation, provide lessons learned from the experience of a 2.0 MGD facility, and show the cost-effectiveness of this innovative technology. Introduction The Village of Essex Junction, Efficiency Vermont, and other project partners were able to leverage each other’s technical and financial resources to complete a project that will help Essex Junction’s rate payers for years to come. While many municipalities are struggling with maintaining infrastructure in the face of increasing costs, there are innovative and effective ways to increase efficiency, conserve energy resources, and reduce operating costs. Methane-fueled microturbine co-generation provides such an opportunity at Essex Junction.
The Village of Essex Junction is in northwestern Vermont with a land area of 4.6 square miles and a population of approximately 8,700 people. It is located approximately 10 miles from Burlington, Vermont, which is the State’s largest city with 38,000 people. Both

Essex Junction and Burlington are in Vermont’s most populous county, Chittenden County, which is home to approximately 100,000 residents. The total population of Vermont is roughly 620,000. Given the small size and rural nature of the state, it is difficult for individual municipalities to cover the cost of large projects with high initial capital costs and maintain user rate stability (even when projects achieve long-term operating cost reductions). Efficiency Vermont, the nation’s first energy efficiency utility, was created by the Vermont legislature and the Vermont Public Service Board in 1999 to help all Vermonters save energy, reduce energy costs, and protect Vermont’s environment. Efficiency Vermont is operated by Vermont Energy Investment Corporation, an independent, non-profit organization under contract to the Vermont Public Service Board. Efficiency Vermont administers virtually all system-wide, electric-ratepayer funded energy efficiency at a statewide level. The Efficiency Vermont contract is a multi-year, competitively bid, performance-based contract that includes a great deal of freedom and flexibility to achieve clearly specified, quantitative energy savings. While commercial and industrial customers have access to prescriptive incentives for simple efficiency measures1, the large majority of electric energy savings are achieved through custom projects and services. Typical services that may be provided by Efficiency Vermont include project-specific technical assistance (e.g., electric and cost savings analyses, economic analyses, technical recommendations, etc.), education and training, and financial incentives. Anaerobic Digestion and Methane Methane is produced as a by-product of a process known as anaerobic (i.e., without oxygen) digestion, which decomposes organic material. At wastewater plants, anaerobic digestion is used to stabilize wastewater sludge, reduce sludge volume, and eliminate pathogens. Volume reduction of sludge results in smaller disposal quantities and lower disposal costs. The methane generated from anaerobic digestion at wastewater facilities is typically considered a “waste.” In fact, methane gas can be a troublesome waste since it is also a “greenhouse gas” that contributes to global warming. Most wastewater plants with anaerobic digestion are required to collect the resulting methane gas and burn it (usually with a flare), rather than letting it discharge directly to the atmosphere, in order to control and reduce the emission of greenhouse gases2. Many do burn a portion for heating the digester.
Based on information collected by the US EPA in its Clean Watersheds Needs Survey in 2000, there are approximately 16,000 public wastewater facilities in the U.S., referred to as publicly owned treatment works (POTWs). Anaerobic digestion is a process that is used at roughly 20% of these POTWs (EPA 2003a). Many of these facilities use their waste methane gas as a fuel to provide process heat for the anaerobic digesters, which are typically maintained at 95 degrees Fahrenheit; the rest is often flared. Few use the methane to generate electricity on-site. In fact, the possibility of using methane gas to produce electricity is mentioned only briefly in the Water Environment Federation (WEF) 2003 edition of
1 Prescriptive incentives are currently available to Vermont businesses from Efficiency Vermont for some lighting products, LED traffic signals, vending machine controllers, energy star transformers, some refrigeration equipment, premium efficient motors, and “tier 2” air conditioning units. 2 The by-products of methane combustion are carbon dioxide and water. Although carbon dioxide is also a greenhouse gas, it is 20 times less effective at trapping heat than methane.

Wastewater Treatment Plant Design, and then indicated only for “larger treatment plants.” (Vesilind et al. 2003, 15-1)
Methane is a renewable energy source, specifically, a biofuel. As a fuel, methane contains approximately half the energy content of natural gas on a per unit basis. That is, a cubic foot of waste methane gas typically has 500-600 British Thermal Units (Btu), whereas a cubic foot of natural gas contains 1,000-1,100 Btu. Essex Junction Wastewater Facility Background The Village of Essex Junction upgraded its Wastewater Treatment Facility (WWTF) in 1985 to a secondary conventional activated sludge plant with advanced treatment using mesophilic anaerobic digestion. The Village constructed its new plant to serve a “tri-town” area in Vermont that includes the Village of Essex Junction, the Town of Essex, and the Town of Williston. The WWTF has a design flow of 3.3 million gallons per day (MGD) and an average flow of 2.0 MGD. Although a plant of this size is considered small by national standards, the Essex Junction WWTF is one of the ten largest municipal wastewater plants in the state of Vermont.
As a municipal wastewater facility, the Essex Junction WWTF is challenged to meet its budget needs without increasing sewer rates. Building budget capacity when much of the WWTF’s annual operating budget consists of fixed costs that escalate with inflation is a difficult objective, but one that the WWTF pursues vigorously. Of the WWTF’s $750,000 annual operating budget, 90.5% is made up of only five categories.
Figure 1: Major Budget Categories for WWTF annual operating budget
Electric power demand for the WWTF is typically between 120-240kW. Prior to co-generation, electric usage was approximately 1,100,000 kWh each year, representing approximately $100,000 in annual electric utility costs. As with most municipalities, the WWTF is the most energy intensive facility it owns and operates.
Overhead
ChemicalsElectric
Maintenance
Sludge Mgmt.
Balance • Staffing /Overhead –
4 FTEs (37%) • Sludge Management
(23%) • Chemicals (13%) • Electricity (12.5%) • Maintenance (5%)
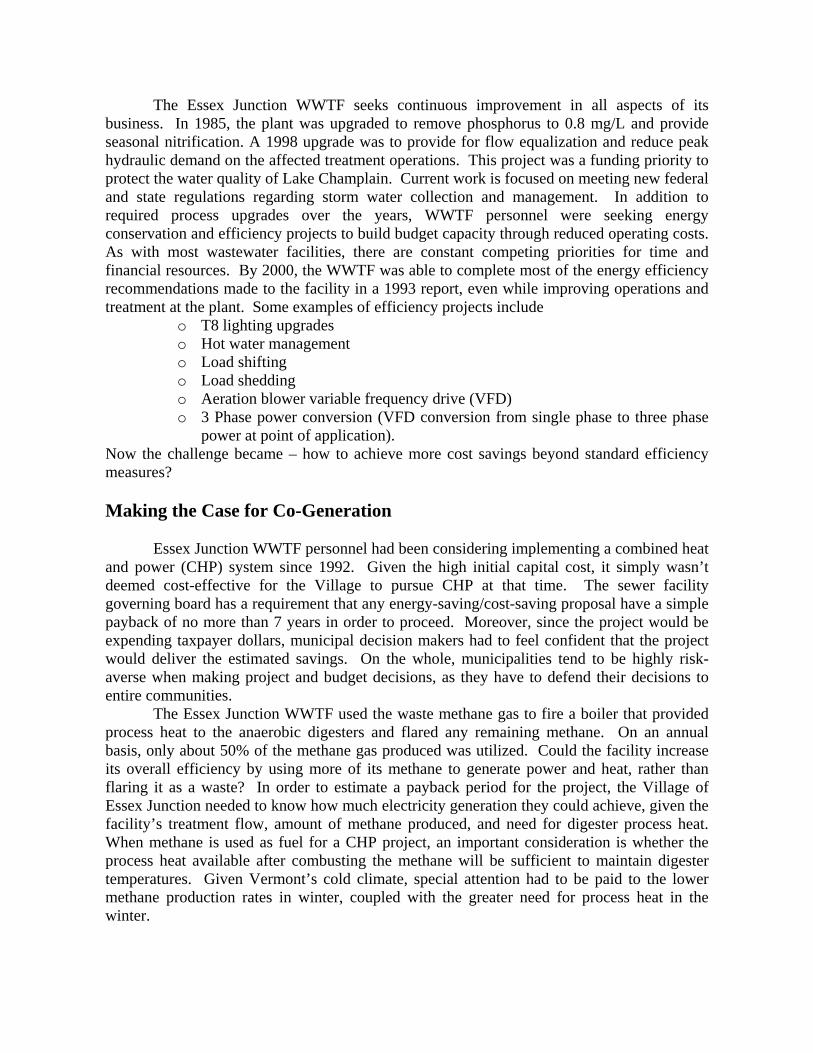
The Essex Junction WWTF seeks continuous improvement in all aspects of its business. In 1985, the plant was upgraded to remove phosphorus to 0.8 mg/L and provide seasonal nitrification. A 1998 upgrade was to provide for flow equalization and reduce peak hydraulic demand on the affected treatment operations. This project was a funding priority to protect the water quality of Lake Champlain. Current work is focused on meeting new federal and state regulations regarding storm water collection and management. In addition to required process upgrades over the years, WWTF personnel were seeking energy conservation and efficiency projects to build budget capacity through reduced operating costs. As with most wastewater facilities, there are constant competing priorities for time and financial resources. By 2000, the WWTF was able to complete most of the energy efficiency recommendations made to the facility in a 1993 report, even while improving operations and treatment at the plant. Some examples of efficiency projects include
o T8 lighting upgrades o Hot water management o Load shifting o Load shedding o Aeration blower variable frequency drive (VFD) o 3 Phase power conversion (VFD conversion from single phase to three phase
power at point of application). Now the challenge became – how to achieve more cost savings beyond standard efficiency measures? Making the Case for Co-Generation
Essex Junction WWTF personnel had been considering implementing a combined heat and power (CHP) system since 1992. Given the high initial capital cost, it simply wasn’t deemed cost-effective for the Village to pursue CHP at that time. The sewer facility governing board has a requirement that any energy-saving/cost-saving proposal have a simple payback of no more than 7 years in order to proceed. Moreover, since the project would be expending taxpayer dollars, municipal decision makers had to feel confident that the project would deliver the estimated savings. On the whole, municipalities tend to be highly risk-averse when making project and budget decisions, as they have to defend their decisions to entire communities. The Essex Junction WWTF used the waste methane gas to fire a boiler that provided process heat to the anaerobic digesters and flared any remaining methane. On an annual basis, only about 50% of the methane gas produced was utilized. Could the facility increase its overall efficiency by using more of its methane to generate power and heat, rather than flaring it as a waste? In order to estimate a payback period for the project, the Village of Essex Junction needed to know how much electricity generation they could achieve, given the facility’s treatment flow, amount of methane produced, and need for digester process heat. When methane is used as fuel for a CHP project, an important consideration is whether the process heat available after combusting the methane will be sufficient to maintain digester temperatures. Given Vermont’s cold climate, special attention had to be paid to the lower methane production rates in winter, coupled with the greater need for process heat in the winter.

The WWTF hired an engineer to perform initial design work, cost estimates, and feasibility analyses. One of the first questions to consider was what type of electric generator to use: engine, microturbine, fuel cell, etc. While engines were considered, the microturbine was a preferred alternative since municipal personnel wanted to be sure that emissions from any new system would be at least as “clean” as existed before installation of the system. The basic plan for the system was to combust collected methane in a microturbine to generate electricity. The waste heat from the combustion would then be used to provide process heat to the anaerobic digesters. The 18-year old dual-fuel boiler currently used for process heat would be kept as a backup heating source. Figure 2 shows the system process.
Figure 2: Essex Junction methane-fueled cogeneration preliminary design process diagram
Wastewater Plant Anaerobic Digester
During initial investigations, it became clear that methane-fueled cogeneration at a facility the size of Essex Junction was not typical. In fact, no such system existed in New England. The closest, similar facility was in Lewiston, NY. During conversations with Lewiston plant personnel, and a site visit to the Lewiston facility, a variety of “lessons learned” were discussed and incorporated into initial design work. In particular, the issue of siloxanes was raised. Siloxanes are silica-based compounds, typically found in shampoo, that can glassify when subjected to high temperatures. Glassified materials can reduce the effectiveness of heat exchangers, and can create imbalance in microturbines, potentially causing failure. It was determined that a siloxane removal strategy would need to be part of any cogeneration system. As knowledge grew regarding all the required elements for a successful cogeneration project, the estimated initial capital cost grew. In order to meet the 7-year payback requirement from the sewer board, it became critical to identify additional funding sources and leverage outside resources. The local electric utility was supportive of the
(Methane Produced)
Cool Sludge
Microturbine (Combustion of Methane)
Heat Exchanger(Air-to-liquid)
Existing Boiler (for backup heat via
direct flare of methane)
Exhaust Gas
(~522oF) Hot
Water
Cool Water
Exhaust Gas
(~135oF)
Methane
Electricity
Storage Tank Methane Methane Compressor,then Dryer (1,000 gal)
Heat Exchanger (liquid-to-liquid)
existing
Warm Sludge
Hot Water
Existing

project since reduced demand from the WWTF would assist in a transmission and distribution (T&D) constrained area. Unfortunately, there was no funding available from them. Efficiency Vermont was able to commit funding to the project, and help with economic and savings analyses. Efficiency Vermont also helped to “spread the word” about the project, soliciting additional support for it. Ultimately, a project team was put together with 5 different funding sources; a creative solution that made this project a reality.
Project Design, Contractor Selection, and Construction
Preliminary design work was performed by a local engineer. The focus of the effort was to determine if implementation of CHP would be cost-effective for the WWTF, given the existing electric rate structure, capital costs, and the required maximum payback period. The initial basis of design included the following components:
o Two – 30 kW micro-turbines o Continuous generation for 1 microturbine o Additional peak shaving for 2nd microturbine o Natural gas and methane blending option o 3 Phase 480 volt generation o Operate parallel to the utility, reduce purchased electricity o UL 1741 protection for voltage & Grid
Although the municipality had completed initial design work, the RFP was structured to allow for alternate designs. It included a large amount of information for potential bidders in order to solicit the best possible performanceand allowed a bidder to propose a system based on the preliminary design, or to propose an alternate design. The RFP was written such that the selected contractor would enter into a performance-based, design/build contract. In order to generate quality system designs, the following facility background information was provided in the RFP:
o The WWTF generates an average of 30,300 cu.ft./day of methane o The facility’s methane has a typical energy content of 520 btu/cu.ft.
Additional RFP content included system requirements and evaluation priorities. o The system should emit no additional pollutants(i.e., SOx, NOx, methane)
compared to the current practice of flaring methane o The system must remove siloxanes to protect equipment operation and life
(e.g., heat exchanger, microturbines) o The electrical system interconnect must meet utility requirements and safety
protocols (e.g., no power feed onto grid during power outages) o Generated power must be line-synchronized with grid-supplied power to
maintain power quality. o The system must not exceed facility maximum allowed noise levels, based on
nearby residences and neighborhood park. o The system must be highly reliable and require minimal maintenance that can
be performed by facility personnel at reasonable cost. o The system must meet all relevant permit and other federal, state and local
requirements

Bids came in more than $90,000 higher than expected (low bid cost of $275,000 v. estimated cost of $184,000). The higher initial cost meant that the project did not meet the sewer facility governing board 7-year payback requirement to move forward. Many projects may have simply been abandoned at this point. The key difference in the Essex Junction project is that project champions actively solicited additional financial support in order to make the project a reality. Efficiency Vermont increased its incentive offer from $25,000 to $40,000. Other key contributors also stepped forward. The Vermont-based Biomass Energy Resource Center (BERC) committed $25,000 toward the project. Another Vermont-based organization, NativeEnergy offered $10,000 toward the carbon credits that would be created from the project as a result of onsite generation and the reduction in demand for power plant generation. The Department of Energy, Region 1 provided $5,000 toward the project to assure data collection and dissemination, so that other facilities could benefit from the knowledge gained from the Essex Junction experience. And negotiations with the low bidder, Vermont-based company Northern Power Systems, provided important technical insight to optimize system performance while containing costs. Without the financial support and personal dedication of all of these organizations, and especially the commitment of Essex Junction personnel, the WWTF’s methane-fueled cogeneration system would not have materialized.
The final, installed system is based on a design/build approach with performance standards and includes the following characteristics.
o 480 Volt – 3 Phase Power o 3% Maximum Voltage Distortion o 5% Maximum Harmonics Distortion, and compliance with IEEE 519-1992 o Full compliance with IEEE interconnect standards o Dual-fuel microturbines (with natural gas/methane blending capability)
Start-Up and Ongoing Operations
Project start up included several activities prior to “going live” with the system. The local electric utility was subcontracted to perform the electrical installation. This ensured that all utility requirements were met during the installation. An area of some difficulty was enabling a smooth transition from methane-fueled cogeneration to natural gas-fueled cogeneration and back again. Although a dual fuel microturbine was specified, the actual control and sequencing of switching from one fuel source to another was not a trivial matter. Contractor personnel ultimately developed a successful proprietary protocol that provided methane/natural gas blending during transitions from one fuel to the other without fuel fault to the generators. Another activity included the need to update the supervisory control and data acquisition (SCADA) system with new screen views and monitoring/control capabilities. Computer programming was necessary to integrate the monitor and control functions with the actual equipment. Recent condensation and cooling work has built on initial system, pre-compression moisture removal capabilities.
Preliminary design work estimated that the level of methane generated at the WWTF would be sufficient to operate two 30kW microturbines an average of approximately 40 total hours each day. Since installation of the system in October 2003, there has been sufficient methane generation to run the two microturbines 48 total hours each day. One reason for consistently high methane production is that, prior to the cogeneration installation, the WWTF

had its two anaerobic digesters cleaned to ensure proper process heating and to maximize methane gas generation. These extra 8 hours of run time each day represent more than 80,000 kWh of electricity each year. And now that methane is a valuable energy resource for the WWTF, it is monitored and managed more carefully than when it was simply a waste by-product. In addition, the WWTF has also now installed two utility-grade sub-meters to more definitively document the net power generation and net purchased power. Results To date, all aspects of the cogeneration system have operated as well or better than anticipated, with the exception of the methane compressors (These are the compressors that raise the 0.5 pounds per square inch (psi) methane to 100 psi prior to drying and combustion in the microturbines.). Over the first year of operation, the system achieved 90% reliability. While actual maintenance costs for the siloxane removal system (filter media, etc.) are lower than anticipated, the compressor maintenance cost is presently anticipated to be higher. The presence of moisture in the compressors has been the single largest reason for equipment downtime and failure to date. An effective strategy for moisture removal from methane and keeping moisture out of the methane compressors is key to successful system operation and maximizing system run time. When a compressor is not working, the down time has a direct impact on the daily electrical generation and subsequent facility cost savings. Table 1 provides information on the power demand from the electric utility after startup of the 60kW of microturbines. One item of interest is that the facility power factor decreased since installation of the microturbines. Facility personnel are working to pinpoint the cause and ensure that plant-wide power factors remain above 90% to avoid power factor penalty fees from the electric utility. Table 2 compares pre-installation cost estimates and post-installation actual costs.
Table 1: Facility Power Information Before and After System Installation Before
(Oct 2002 –Sept 2003)
After Oct 2003-Sept 2004)
On Peak Demand 134-235 kW 110-215 kW3
Off Peak Demand 130-226 kW 94-226 kW4
Monthly Avg. Usage 93,000 kWh 61,000 kWh Power Factor 96 87
3 Oct 2003 value is 215 kW. With out start up month 203 kW is maximum 4 Oct 2003 value is 226 kW. With out start up month 190 kW is maximum

Table 2: Estimated and Actual Project Payback Analysis
Pre-Construction (estimates) Post-Construction (actuals) System capital cost $184,000 $303,000 Incentives and grants $25,000 $80,000 Net customer cost $159,000 $223,000 Electric generation 396,000 kWh/yr 412,000 kWh/yr Electric cost savings $26,600/yr5 $37,000/yr6
Maintenance costs $3,700/yr $4,000/yr Net annual savings $22,900 $33,000 Payback without incentives
8.0 yrs 9.2 yrs
Payback with incentives
6.9 yrs 6.8 yrs
Figure 3 illustrates the amount of on-site electrical generation compared to purchased electricity at the WWTF.
Figure 3: Electric usage at the Essex Junction WWTF
Essex Junction, VT Methane CHP (monthly data)
0
20000
40000
60000
80000
100000
120000
140000
Oct-03
Nov-03
Dec-03
Jan-04
Feb-04
Mar-04
Apr-04
May-04
Jun-04
Jul-04Aug-04
Sep-04
month
kWh
utility meter
turbine est.
turbine metered
plant total
5 Demand rate savings were not included in original estimates to be conservative 6 Actual blended rate of electricity Oct 2003-Sept 2004 $0.09/kWh

Recommendations to Other Facilities For those facilities that may be interested in implementing a CHP project, there are several things to keep in mind while designing and installing a system. The first step is to talk with others who are involved in CHP operations. Their experiences and lessons learned can prove vital for project success. They can also provide input on whether you should pursue a performance-based, design/build project, or cost plus materials for installation of an engineered system. For those who use a design/build request for proposals (RFP) based on performance requirements, it is important to specify the outcomes you require and provide potential bidders data to use for design purposes. For instance, the chemical composition of the methane gas should be analyzed, including Btu content, chemical content, and moisture content, and this information should be provided with the RFP. Assumptions should be stated regarding methane production rates, weather/temperature conditions, indoor v. outdoor siting (and/or maximum noise levels), historical electric kWh and kW quantities, electric rate structure, interconnect requirements, permit requirements, and power quality requirements. When evaluating bid proposals, include a knowledgeable engineer on the review team to assist in “fatal flaw analysis,” so that significant issues or omissions can be caught as early as possible. The RFP should also require that the following items are clearly identified for proposed systems.
o Process for siloxane removal from methane o Process for moisture removal from methane o Life expectancy of compressors and microturbines o Warrantees and service obligations/protocols o Dual-fuel capability (methane and natural gas), including blending options o Total kWh generated, parasitic loads, net kWh generation o Sequencing strategy (e.g., base load constant operation, peak shaving, etc.) o Equipment efficiency and total system efficiency o Anticipated maintenance and related costs o Emissions/ air quality o Material costs associated with backup (i.e., spare) equipment to be kept on
hand (e.g., extra compressor) Beyond technical considerations, probably the most important requirement is to have
project “champions” that will advocate for the project throughout the many obstacles that are sure to arise. The Essex Junction project had many! Without champions who are committed to overcome implementation barriers, many projects that are cost-effective will not secure funding, community support, and decision-maker approval.
Conclusions The Essex Junction WWTF’s methane-fueled microturbine CHP installation was presented with a 2003 Vermont Governor’s Award for Environmental Excellence and Pollution Prevention. These awards are given for projects that reduce or eliminate the generation of pollutants and wastes at the source. Selection criteria include benefits to the environment, use of innovative approaches, economic efficiency, and the ability of an activity to serve as a model for other efforts. Awardees were recognized as having “chosen to see the world of possibilities and achieved excellence in pursuit of a preferred future.”

The project is noteworthy and successful for numerous reasons. o The facility now uses nearly 100% of a former “waste” as fuel. This waste
was only about 50% utilized before. o The Essex Junction community is now using a renewable energy source to
reduce costs and prevent pollution. o A small municipality has been able to implement innovative microturbine
technology while maintaining community confidence and rate stability. o Implementation of distributed generation reduces power demand and helps
ensure power availability in a local electric utility T&D constrained area. o The facility, and its ratepayers, are saving 40% off their electric bills each year. o Many other wastewater facilities can install similar systems and achieve
similar results. Of the 16,000 POTWs in the country, approximately 20% of these facilities use anaerobic
digestion, and roughly 1,100 use anaerobic digestion and have average flows of 2 MGD or more. In addition to POTWs, there are also industrial and private wastewater facilities for which CHP would be applicable and cost-effective. By recognizing that methane-fueled microturbines can be cost-effective at small wastewater plants, and not just larger facilities, an entire new segment of the wastewater market is now open to distributed generation opportunities. For efficiency organizations, and other potential funding sources, this is what you can do to facilitate implementation of wastewater CHP projects. Show that it’s been done before to reduce the perception of taxpayer risk. Understand the economic requirements of your customer (e.g., payback requirements, ROI requirements, etc.). Provide funding when possible. Help the facility find other funding sources. Spread the news to generate support and excitement for the project. Let others know about your experience. The technology continues to improve, the costs continue to come down, and methane can mean money for wastewater facilities. References [EPA] U.S. Environmental Protection Agency, 2003a. Clean Watersheds Needs Survey
(CWNS) 2000 Process Report. Available online: http://cfpub.epa.gov/cwns/process.cfm
[EPA] U.S. Environmental Protection Agency, 2003b. Clean Watersheds Needs Survey
(CWNS) Report to Congress. Available online: http://www.epa.gov/owm/mtb/cwns/2000rtc/toc.htm
Vesilind, P.A. et. al., ed. 2003. Wastewater Treatment Plant Design, Alexandria, Virg.: Water
Environment Federation. Bishop, J. 2004. “Digester Gas Unpopular as Power Fuel” Water Environment & Technology.
July. Allentown, City of. 2001. City of Allentown, Pennsylvania web site. Available online: www.allentownwater.org

Water and Wastewater Newsletter, Oct.8, 2001, TXU Energy Services, Available online: http://www.waterandwastewater.com/www_services/newsletter/october_8_2001.htm GHR Consulting Services Inc., 1993. Energy Analysis Study, Essex Junction Waste Water
Treatment Plant, May.
SESSION 2: Appendices Continued
Appendix B
Energy Baseline Data Tables
Data Element Units Data Source
Data Need Units Desired Frequency ofData
Data Source Accessibility

SESSION 2: Appendices Continued
Appendix C
Equipment Inventory Worksheets
Process or Equipment Nameplate HP orMeasured kW
Load Factor Hours of Operation PerYear
kWh/Year
Pump Designation Installed Nameplate Rating Hours of OperationPer Year
Measured PowerConsumption
kWh/Year

SESSION 2: Appendices Continued
Appendix D
Regulatory Requirements Table
Requirement Name:
Requirement
Relevant Agency
Is regulation up to date?
Are we in compliance according to agencies?
Could we improve our performance?
How does this affect the proposed energy conservation measures?
Do we expect to remain in compliance?

SESSION 3: Appendices
Appendix E
List of Activities and Operations Table
Activity Operation or Location Type of Energy Used Current Use and Costs
Activity 1
Activity 2
Activity 3
Activity 4
SESSION 3: Appendices Continued
Appendix F
Energy savings information for typical water and wastewater equipment and systems, including motors, pumps,aeration systems, lighting and HVAC
MotorsMotors represent a major capital investment, a recurring maintenance requirement, and a significant energy demand.Proper selection and proper maintenance will help reduce energy costs and improve reliability.
Motors are often available in standard and high-efficiency models. The difference in efficiency is greater for smaller motorsthan for larger ones,20 although even a 1-2% difference in efficiency can make a major difference in energy cost for a largemotor that is run continuously. The New England Interstate Water Pollution Control Commission recommends usinghigh-efficiency motors in all cases except for very small motors that are used frequently.21 The Commission alsorecommends incorporating power factor correction into all designs.
The Hampton Roads Sanitation District implemented an extensive motor policy in 1996. Some of the most importantelements are as follows:22
• Motors must meet or exceed the efficiency levels set by the Energy Policy Act of 1992;
• Efficiency is determined by test standards set by IEEE Standard 112-1984;
• Motors must be sized properly for load, with a service factor of 1.15;
• The guidelines specify 13 parameters to be noted, including horsepower, voltage, full load amps, speed,
maximum starts per hour and more; and
• When deciding to repair or replace an old motor, the District will purchase a new energy-efficient motor if the
simple payback period is 5 years or less, or if the cost of repair is more than 50% of the cost of a new energy-
efficient motor.
Proper maintenance can extend a motor’s lifetime and improve its energy efficiency. Motors should be operated as closeto nameplate voltage as practical; any deviation in voltage will impair efficiency. Connections and switches on all majorpower-driven equipment should be checked at least once per year.23 The major cause of motor failure is neglectedmaintenance of either mechanical or electrical components.
PumpsAlthough aeration is typically the largest single energy demand in a WWTP, influent pumping can also be a significantdemand, depending on site elevation and sewer elevation. Pumps operate nearly all the time and are often over-designed.Variable-frequency drives can improve pump efficiency.24
Ideally, a pump would always operate at or near its Best Efficiency Point, although varying system requirements maymake this impractical at times. Proper maintenance will keep a pump at or near its original design efficiency rating.Friction losses caused by piping components (such as valves) can increase the energy required for pumping and have asignificant impact on energy costs.25
Water Environment Federation (1997), Energy Conservation in Wastewater Treatment Facilities, Manual of Practice No. MFD-2, Alexandria, VA, 1997.
New England Interstate Water Pollution Control Commission (1998), Guides for the Design of Wastewater Treatment Works, Technical Report #16.
Water Environment Research Foundation (1999), Improving Wastewater Treatment Plant Operations Efficiency and Effectiveness, Project 97-CTS-1.
Water Environment Federation (1997), Energy Conservation in Wastewater Treatment Facilities, Manual of Practice No. MFD-2, Alexandria, VA, 1997.
Maine Department of Environmental Protection (2002), Bureau of Land & Water Quality, O&M Newsletter, February 2002.
J. Oliver and C. Putnam (1997), “Energy Efficiency: Learning How to Avoid Taking a Bath on Energy Costs,” WATER/Engineering and Management, July 1997.
23-
20-
21-
22-
24-
25-

SESSION 3: Appendices Continued
Appendix F Continued
Aeration SystemsAeration is typically the largest single energy user in the treatment process,26 typically ranging from 45% to 75% of thewastewater utility’s total electricity consumption.27 Like pumps, aeration equipment operates nearly all of the time.28
Possible energy-saving measures may include any of the following:
BlowersVariable and multiple staged single-speed blowersEfficient, properly-sized blowers operating at or near best efficiency pointUsing digester gas to fuel engine-driven blowers
Aeration SystemTwo-speed mechanical aerators where mechanical aeration is usedFine bubble diffusers where diffusion aeration is usedIn some cases, a combination of mechanical mixing and diffused aeration may be the most efficient
ControlsContinuous dissolved oxygen (DO) monitoring Lowest DO concentration consistent with stable operation and treatment objectivesAutomatically controlled variable air flow based on oxygen demand
The type of aeration impacts the energy demand. Energy Conservation in Wastewater Treatment Facilities, Manual ofPractice No. MFD-2 from the Water Environment Federation, includes a number of case studies on fine-pore diffusers. Ingeneral, the system improves Oxygen Transfer Efficiency (OTE), and often shows a significant economic advantage. A fewexamples are highlighted below:
• Glastonbury, CT switched from coarse-bubble diffusers to fine-pore diffusers. OTE improved from 4-4.5% to 6.5-7%. Blower energy savings resulted in a simple payback period of approximately 2 years, although this calculation does not include increased cleaning cost.
• Hartford, CT switched from a coarse-bubble spiral roll system to a fine-pore dome diffuser system, improvingOTE from 4.4% to 10%. Operating savings of $200,000 per year resulted in a simple payback period of less than3 years.
• Ridgewood, NJ switched from a coarse-bubble aeration system to a dome fine-pore aeration system, improvingOTE from 4.8% to 9.5%. The facility saw a 30% decrease in blower energy use (saving about 30 MWh per month), but increased maintenance resulted in the simple payback period being approximately 10 to 11 years.
In some cases, increased cleaning and maintenance costs extended the time required for fine-pore diffusers to repay theircost in energy savings; in other cases, cleaning costs had relatively little effect.
Control systems are particularly important. An accurate aeration control system can reduce plant energy consumption byas much as 25%, for a system payback of less than three years.29 Such a system requires accurate mass flow meters. Controlsystems can continuously and automatically adjust the air consumption to the optimal required amount, thereby reducingthe demand on blower motors.
New England Interstate Water Pollution Control Commission (1998), Guides for the Design of Wastewater Treatment Works, Technical Report #16.
EPRI Industrial Program (1993), “Energy-Efficient Aeration Systems for Wastewater Treatment,” Environment & Energy Management, Vol. 1, No. 3; WEF’s 1997 Manual ofPractice cites a very similar figure of 40-70% for activated-sludge WWTP facilities.
Maine Department of Environmental Protection (2002), Bureau of Land & Water Quality, O&M Newsletter, February 2002.
C. Hewitt (1996), “Programmable Aeration Control System Reduces Plant Energy Costs,” WATER/Engineering and Management, May 1996.
26-
27-
28-
29-

SESSION 3: Appendices Continued
Appendix F Continued
LightingLighting is a major category of energy consumption for commercial buildings. It is not as significant for industrial facilities– and a wastewater treatment plant is essentially an industrial facility – but it remains one of the energy costs most easilyaddressed. Fluorescent bulb technology has continued to improve, offering higher-quality lighting at lower energydemand than previous versions; if a facility has old fluorescent lights, newer versions can improve the work environmentand reduce energy costs. There exists a wealth of resources for information on energy-efficient lighting options, such asENERGY STAR’s Building Upgrade Manual.30
Lights that are on for most of the workday are the best candidates for replacement with new energy-efficient models. Formore intermittent loads, occupancy sensors may be a wise choice. These controls will switch off lights in unoccupiedrooms after a period of time, automatically turning them on again if a person enters the room. Suitable areas might includewarehouses, storage rooms, restrooms, small offices, lunch, copy, and utility rooms.31
Heating, Ventilation, and Air ConditioningHeating, ventilation, and air conditioning (HVAC) are similar to lighting in that they are not as relatively important asenergy demand for WWTPs as they are for typical commercial facilities, they are still a significant energy demand that canbe managed effectively.
Because HVAC is such a major energy user for commercial facilities, there are many resources and many contractors ableto improve the energy efficiency of a building’s HVAC system. Improving insulation, sealing leaks, properly sizing thesystem, and selecting an energy-efficient system (such as a ground-source heat pump) can help reduce energy costs andprovide a good return on investment.
U.S. Environmental Protection Agency (2004), ENERGY STAR Building Upgrade Manual, online at http://www.energystar.gov/ia/business/BUM.pdf. The section onlighting begins on page 48.
J. Null and J. Hoggard (1998), “Occupancy Sensors Can Lead to Savings,” Engineered Systems, July 1998.
30-
31-

SESSION 3: Appendices Continued
Appendix G
Case studies of wastewater utilities installing energy generation systems based on methane capture
Facility: Wastewater Treatment Facility, Town of Amherst, NYDaily Volume: 25 million gallonsImprovements Made: energy efficiency, methane captureImplemented: 2004Annual Savings: $500,000; 7.5 million kWhDescription: This project was implemented by Siemens Building Services, an energy service company. Typically, anenergy service company (ESCO) contracts with a facility owner to install energy efficiency improvements. The ESCO’scosts and fees are paid from the energy savings. In this case, the New York State Energy Research and DevelopmentAuthority (NYSERDA) also contributed to the costs of the improvements. The facility’s new system capturesapproximately 77,000 cubic feet of methane per day. This gas is used to run a compressor for oxygenating the wastestream. Other improvements included a heat recovery unit, an additional natural gas engine, a new control system, lightingdimmer switches, and high-efficiency motors. Source: NYSERDA press release: http://www.nyserda.org/Press_Releases/PressRelease.asp?i=55&d=2004
Facility: Wastewater Treatment Facility, Essex Junction, VTDaily Volume: 3.1 million gallons Improvements Made: Methane capture, microturbine generatorsImplemented: 2003Annual Savings: $37,000; 412,000 kWh, or about 36% of purchased electricityDescription: The facility’s anaerobic digester produces about 30,300 cubic feet of methane per day. Prior to 2003, thefacility captured approximately half of this and used it in a boiler to heat the digester. The remainder was flared. In 2003,the facility installed two 30-kW microturbines in a combined heat and power system. The methane is now used to producepower, and a heat recovery system channels waste heat from the electricity generation to warm the digester. The overallefficiency of the system is about 80%.Methane-based cogeneration is normally not cost-effective for a facility of relativelysmall size, like this one. However, with the assistance of state agencies, federal agencies, and non-governmentalorganizations, the facility was able to bring the cost down to the point where it met its own requirement of a seven-yearsimple payback period.Source:Northeast CHP Application Center: http://www.northeastchp.org/uploads/Essex%20Junction%20Project%20Profile.pdf
Facility: Wastewater Treatment Facility, Nashua, NHDaily Volume: 12.5 million gallonsImprovements Made: anaerobic digester, gas engineImplemented: 2001Annual Savings: $750,000 Description: The City of Nashua undertook a major project, adding a $9 to $10 million anaerobic digester to its wastewatertreatment facility. The system includes methane capture to fuel a 365-kW internal combustion engine generator. Theanaerobic digester reduces the sludge to a state where it can be used as compost. This lowers sludge disposal costs by over$1 million per year. The process also lowers chemical costs, purchased electricity costs, and other expenses. Even afteraccounting for the repayments to the state’s revolving loan fund (one source of financing for this project) and the O&Mexpenses on the digester, the net savings are $750,000 per year. Energy improvements were one part of the solution here.The overall cost savings far exceeded the energy savings alone.Sources: Presentation for APWA Congress & Exposition, September 15, 2004: https://www.apwa.net/meetings/congress/2004/handouts/documents/1001.pdf. Also see Waukesha Power Connection,Winter 2001, from www.dresser.com.

SESSION 3: Appendices Continued
Appendix G Continued
Case studies of wastewater utilities installing energy generation systems based on methane capture
Facility: Gloversville-Johnstown Joint Wastewater Treatment Facilities, NYDaily Volume: design capacity 13 million gallonsImprovements Recommended: Improvements to methane capture system and possible replacement of engine generatorsImplemented: 2004-2006Annual Savings: Potential savings: $175,000 for improvements to methane capture system; $21,000-166,000 forimprovements to or replacements of engine generatorsDescription: This facility already has an effective energy system in place. Methane is captured from an anaerobic digesterand used to power two 150-kW engine generators. NYSERDA made its recommendations in October 2004, and generationhas since increased from 1.3 million kWh to 1.8 million kWh. While the facility does not specify exactly whichimprovements were made, the incremental annual savings of 500,000 kWh would be about $75,000 per year. Current totalenergy generation represents 42% of the site’s energy consumption, for overall annual savings of $273,000. The anaerobicdigester produces about 4.1 million cubic feet of biogas per month (biogas is a mixture of methane, CO2, and other gases). Source: NYSERDA recommendations (October 2004) at http://www.nyserda.org/programs/Technical_Assistance/Success/Gloversville_Johnstown_WWTF.pdf, and facility’sannual report at http://www.g-jwastewater.com/annual-report.html.
Facility: Metropolitan Syracuse Wastewater Treatment Plant, Onondaga County, NYDaily Volume: 80 million gallonsImprovements Made: Process optimization, energy efficiency upgradesImplemented: 2004-2005Annual Savings: $207,500; 2.8 million kWh and 270 MMBTU of natural gasDescription: This is a very large wastewater facility. Improvements beginning in 2004 included retrofitting pumps,changing some operational processes, maximizing waste gas usage, and installing new equipment. Best practices toolsdeveloped by the U.S. Department of Energy were used to assess potential areas of improvement. A wide range ofoperational changes were made in a systematic approach. A recently-installed biological aeration filtration system allowedthe facility to stop wastewater nitrification in the aeration tanks. This process change, combined with equipment upgrades,allowed the facility to reduce the number of 100-horsepower blowers from 21 to 13. In all, the improvements costapproximately $233,000, for a payback period of 13 months.Source: National Renewable Energy Laboratory at: http://www.nrel.gov/docs/fy06osti/38076.pdf.

Activity Operation or Location Type of Energy Used Current Use and Costs Criterion 1 Criterion 2 Criterion 3 Criterion 4 Criterion 5 Total Score
Activity 1
Activity 2
Activity 3
Activity 4
SESSION 3: Appendices Continued
Appendix H: Example of an Energy Priority Ranking Table

SESSION 4: Appendices
Appendix I
Objective and Target Worksheet
Performance Indicator Worksheet
Target Performance Indicator Data Source
Objective Target Timeframe

SESSION 5: Appendices
Appendix J
Energy Improvement Management Program Table
Tasks Staff Timeline
Task:
Deliverable:
Task:
Deliverable:
Task:
Deliverable:
Task:
Deliverable:
Task:
Deliverable:
Task:
Deliverable:
Task:
Deliverable:
Estimated Time (Person Hours or FTEs)
Estimated Costs(e.g., equipment)

SESSION 5: Appendices Continued
Appendix K
Examples of Operating Controls for Energy Operations
Opportunity for Energy Improvement Associated Operations Examples of Operating Controls
NOx Emissions CHP system • Note values from Continuous EmissionsMonitor (CEM) on system• Compare measured rate to power output onsystem meter – should be less than 0.5pounds per MWh
Methane Emissions Anaerobic Digestion • Check valves and pipe fittings for leaks everyweek• Compare measured generation from systemto estimated methane content of sludge –should be 13,000 BTU per kWh• Track system generation as a function ofsludge volume
Electricity Consumption Lighting • Ensure that automatic lighting control systemis working as designed – note any manualoverrides• Turn off task lighting when not in use
Electricity Consumption HVAC • Replace filters every 3 months• Calibrate system every 3 months – measureoutlet temperature and compare to systemsettings• Clean area around air intakes every 6months• Clean evaporator and condenser coils every6 months• Note any manual overrides to settings – try tominimize if possible
Electricity Consumption Computers • Activate power-saving features on allcomputers; screensavers to activate after 5minutes, screen to standby after 10 minutes,hard disks to standby after 2 hours• Communicate that employees are to shutdown computers when leaving

SESSION 6: Appendices
Appendix L
Table to document what you are currently measuring and from where you obtained this data
Data Element Units Data Source

SESSION 6: Appendices Continued
Appendix M
List of the operational controls, key characteristics, monitoring and measurement methods, and calibration needs for the priority energy opportunities
Energy-RelatedOperation
Energy-RelatedImpacts
OperationalControls
Key Characteristicsof Operation or
Activity
Monitoring andMeasurement
Methods
Equipment andSystem Calibration
Needs

SESSION 6: Appendices Continued
Appendix N
Energy Improvement Management Programs Progress Review Worksheet
Objective
Target date
Status at (6 months)
Tasks Identified
Tasks Accomplished
Observations
Corrective Actions Needed
Next Steps

SESSION 7: Appendices
Appendix O
Utility Case Study: Camden County Municipal Utility Authority (CCMUA)
The Camden County Municipal Utilities Authority (CCMUA) operates an 80 million gallon per day (MGD) secondary, pureoxygen activated sludge wastewater treatment plant in Camden, NJ. It also operates a regional interceptor system with 100miles of sewer, ranging in size from 24 inches in diameter to 96 inches, 25 pumping stations, ranging in size from 1 MGDto 54 MGD, and 16 metering stations.
In 1999, the CCMUA implemented an Environmental Management System (EMS) in order to optimize its environmentalperformance and minimize its costs. The results were excellent. As part of its Management System, the CCMUA soughtto reduce energy consumption and, correspondingly, energy costs, using the systematic, continuous improvement processinherent to an EMS. Specifically, the CCMUA looked at every function/process that used a significant amount of energyand attempted to implement projects that would reduce energy consumption and energy costs. The following is a list ofsome of the most important energy reduction projects undertaken, to date:
1) Elimination of Infiltration/Inflow: Infiltration/Inflow (I/I), the leaking of groundwater and rainfall into a sewercollection system, results in unnecessary increases in pumping and treatment costs. In addition, water is wasted. Simplyput, when one gallon of sewage is mixed with one gallon of clean groundwater through infiltration, two gallons of sewagemust now be pumped and treated. Eliminating I/I through repair of leaky lines, especially those in the vicinity of highgroundwater tables, grouting of leaky manholes, implementation of watertight manhole covers, can significantly reduceI/I and thereby reduce energy costs. (It also reduces the potential for flooding and overflows, which have their owneconomic and social costs).
The CCMUA's strategy was to meter member municipalities for both dry weather and wet weather flow. When significantdifferences were noted, the municipality was charged with the responsibility to undertake a trackback analysis to identifythe major sources of I/I within their system and to take steps, via a best management practices approach, to reduce I/Icorrespondingly.
2) Elimination of Pump Stations via Direct Connections: In a system like the CCMUA's, where smaller municipal collectionsystems connect into a larger regional interceptor system that then conveys the total flow to a regional treatment plant, therewere several opportunities to eliminate municipal pumping stations and connect them directly into the regional sewersystem. The CCMUA was able to eliminate over 20 pumping stations that were pumping right past its regional sewersystem to the main collection point for the municipality and then that same flow would be pumped right back to the samepoint. By allowing the municipal pump station to tie into the regional system right there, the station could be eliminated,as was the double pumping, thereby resulting in reduced energy costs, and reduced operations and maintenance costs forthe municipality.
3) Optimization of Primary Sedimentation Tanks: The main driving force for a primary sedimentation tank is the force ofgravity, as the solids/sediment settle to the bottom of the tank where they are collected as primary sludge. Conversely,the secondary system is much more energy intensive, especially pure oxygen activated sludge plants like the CCMUA's,Philadelphia's, and many other large cities where space is at a premium. Therefore, since the CCMUA' goal is to maximizesolids removal prior to discharge to the receiving water body, it optimized the operations and maintenance of its primarysedimentation tanks in order to maximize the percentage of solids removed via the primary sedimentation tanks using thefree force of gravity as the removal agent, rather than the costly, energy intensive secondary aeration process.

SESSION 7: Appendices Continued
Appendix O Continued
Utility Case Study: Camden County Municipal Utility Authority (CCMUA)
4) Heating loops: The use of heating loops and heat exchangers is well known in water and wastewater treatment plants,and other facilities as well, capturing excess heat from process units and reusing said heat downstream in other processes.The CCMUA has just completed the design of a heating loop that will capture excess heat from large natural gas enginesand preserve it for use elsewhere in the plant.
5) Use of energy efficient equipment/lighting: There are many examples throughout many industries of more energyefficient equipment and lighting. The CCMUA realized savings of about $100,000 per year when it switched light bulbsthroughout the plant to a more efficient brand. Also, checking energy usage on a regular basis can identify under-performing equipment, such as pumps that may need new wear rings, or may be on the verge of failure.
6) Retrofitting of diesel vehicles to use ultra low sulfur fuel: The CCMUA obtained an EPA grant to retrofit its dieselvehicles to use ultra low sulfur fuel. Although there was no operational cost savings realized through this project, theCCMUA was able to reduce sulfur emissions from its diesel vehicles by over 95%, without any capital expenditurewhatsoever.
7) Use of catalytic converter to reduce NOx and CO emissions: Similarly, the CCMUA installed catalytic converters on bothof its large natural gas engines, thereby reducing NOx and CO emissions from those engines by over 90%. Since thisenabled the CCMUA to remain below the Title V threshold, the result was a significant net savings in operational andpermitting costs.
The Camden County (NJ) Municipal Utilities Authority used its EMS to implement several projects that reduced energyconsumption and, correspondingly, reduced its energy costs. In accordance with an EMS' systematic approach that strivestoward continual improvement, the CCMUA is continuing to look for additional opportunities to reduce its energyconsumption.