ENSO PHENOMENON AND 30 50 DAY VARIABILITY IN THE ...The characteristics of 30-50 day variability in...
15
INTERNATIONAL JOURNAL OF CLIMATOLOGY, VOL. 13,837-851 (1993) 55r.57 7.321.35:551.513.7 :551.553.21(94) ENSO PHENOMENON AND 30_50 DAY VARIABILITY IN THE AUSTRALIAN SUMMER MONSOON RAINFALL RAMASAMY SUPPIAH CSIRO Diuision of Atmospheric Research, PMB No. I, Mordialloc, Victoria 3195, Australia Receiued2 September 1992 Accepted 25 February 1993 ABSTRACT The characteristics of 30-50 day variability in the Australian summer monsoonrainfall has been investigated by using station rainfall data. In particular, the influenceof the El Nifio/Southern Oscillation (ENSO) phenomenon on the Australiansummer monsoon rainfall is analysed. Results of the power spectrum analysis indicate statistically significant peaksin the 30 50day band during anti-ENSOevents in the north-central, and north and eastcoastregions. The spectral analysis alsoreveals a statistically significant peak in this band during ENSO events in the inland desert and north and eastcoastregions. Filtered rainfall values show an eastward propagation pattern during anti-ENSO events, whereasENSO events demonstrate a pattern characteristic of a standing oscillation and sometimes a westward propagationpattern.The present study also suggests some tendency for the 30-50 day oscillation to be phase-locked to the seasonal cycleofthis region. The phaseJocking phenomenon is also observed in the daily meansealevelpressure at Darwin, which is very clear during the anti-ENSO events. KEy woRDs El Nifro/Southern Oscillation (ENSO) phenomenon 3G-50 day osc.illation Australian monsoon rainfall Annual cycle and phaseJocking INTRODUCTION The intraseasonal or the 30-50 day oscillationwasfirst discovered in the zonal wind field in the Indian and tropicalPacific Oceans by Maddenand Julian(197L,1972). This oscillation displays a markedseasonality, and it is strong over the Australian regionduring the Southern Hemisphere summer (Madden, 1986). The maximumcloudzone associated with the Indian summer monsoon from June to September moves over the Indonesian-north Australian regionduring the Southern Hemisphere summer monthsthat encompass the Australian summer monsoon season. This seasonal eastward shift is tightly phase-locked with the annual cycle and hasbeen documented in mean sea-level pressure, outgoing longwave radiation (OLR),clouds, and rainfall(Meehl, 1987). Furthermore, a positive relationship hasbeen established between the Indian summer monsoonrainfalland the Australian summer monsoon rainfall(Gregory, 1991) and its onset dates (Joseph et al., l99I). Vincent et al. (I99I) have reported that the 30-50 day oscillation is essentially absentin the Southern Hemisphere during the winter months. The Australian summer monsoon onset, whichwasdefined by the first occurrence of the westerly wind at 850 hPa at Darwin,occurs sometimes between lateDecember andmid-January. Theretreat of themonsoon is associated with the onset of easterly winds sometime in March (Troup, 1961; Holland, 1986; McBride, 1987; Hendon and Liebmann,l990a; Suppiah, 1992). Continuous heavy rainfall in themonsoon region is associated with the onset and active periods of monsoon circulations. In general, the Australian summer monsoon gives more than 70 per cent of the annual rainfall to the Australian tropics and significantlyinfluences the agricultural practices of this area(Mollah et al., 1991). Winter months are dry in this region. The presence of the 30-50day oscillation and its eastward propagation in the OLR in the Southern Hemisphere havebeen reported in previous studies (Lau and Chan, 1985; Lau and Peng, 1987; Murakami 0899-841 8/931080837-1 s$ 1 2.s0 @ 1993 by the Royal Meteorological Society
Transcript of ENSO PHENOMENON AND 30 50 DAY VARIABILITY IN THE ...The characteristics of 30-50 day variability in...
INTERNATIONAL JOURNAL OF CLIMATOLOGY, VOL. 13, 837-851 (1993) 55r.57 7.321.35:551.513.7 :551.553.21(94)
ENSO PHENOMENON AND 30_50 DAY VARIABILITY IN THEAUSTRALIAN SUMMER MONSOON RAINFALL
RAMASAMY SUPPIAH
CSIRO Diuision of Atmospheric Research, PMB No. I, Mordialloc, Victoria 3195, Australia
Receiued 2 September 1992Accepted 25 February 1993
ABSTRACT
The characteristics of 30-50 day variability in the Australian summer monsoon rainfall has been investigated by usingstation rainfall data. In particular, the influence of the El Nifio/Southern Oscillation (ENSO) phenomenon on theAustralian summer monsoon rainfall is analysed. Results of the power spectrum analysis indicate statistically significantpeaks in the 30 50 day band during anti-ENSO events in the north-central, and north and east coast regions. Thespectral analysis also reveals a statistically significant peak in this band during ENSO events in the inland desert andnorth and east coast regions. Filtered rainfall values show an eastward propagation pattern during anti-ENSO events,whereas ENSO events demonstrate a pattern characteristic of a standing oscillation and sometimes a westwardpropagation pattern. The present study also suggests some tendency for the 30-50 day oscillation to be phase-locked tothe seasonal cycle ofthis region. The phaseJocking phenomenon is also observed in the daily mean sealevel pressure atDarwin, which is very clear during the anti-ENSO events.
KEy woRDs El Nifro/Southern Oscillation (ENSO) phenomenon 3G-50 day osc.illation Australian monsoon rainfall Annual cycleand phaseJocking
INTRODUCTION
The intraseasonal or the 30-50 day oscillation was first discovered in the zonal wind field in the Indian andtropical Pacific Oceans by Madden and Julian (197L,1972). This oscillation displays a marked seasonality,and it is strong over the Australian region during the Southern Hemisphere summer (Madden, 1986). Themaximum cloud zone associated with the Indian summer monsoon from June to September moves over theIndonesian-north Australian region during the Southern Hemisphere summer months that encompass theAustralian summer monsoon season. This seasonal eastward shift is tightly phase-locked with the annualcycle and has been documented in mean sea-level pressure, outgoing longwave radiation (OLR), clouds, andrainfall (Meehl, 1987). Furthermore, a positive relationship has been established between the Indian summermonsoon rainfall and the Australian summer monsoon rainfall (Gregory, 1991) and its onset dates (Josephet al., l99I). Vincent et al. (I99I) have reported that the 30-50 day oscillation is essentially absent in theSouthern Hemisphere during the winter months.
The Australian summer monsoon onset, which was defined by the first occurrence of the westerly wind at850 hPa at Darwin, occurs sometimes between late December and mid-January. The retreat of the monsoon isassociated with the onset of easterly winds sometime in March (Troup, 1961; Holland, 1986; McBride, 1987;Hendon and Liebmann,l990a; Suppiah, 1992). Continuous heavy rainfall in the monsoon region is associatedwith the onset and active periods of monsoon circulations. In general, the Australian summer monsoon givesmore than 70 per cent of the annual rainfall to the Australian tropics and significantly influences theagricultural practices of this area (Mollah et al., 1991). Winter months are dry in this region.
The presence of the 30-50 day oscillation and its eastward propagation in the OLR in the SouthernHemisphere have been reported in previous studies (Lau and Chan, 1985; Lau and Peng, 1987; Murakami
0899-841 8/931080837-1 s$ 1 2.s0@ 1993 by the Royal Meteorological Society

838 R. SUPPIAH
et a1.,1986; Knutson and Weickmann,1987; Karoly, 1989; Kuhnel, 1989). Hartmann and Gross (1988) havealso observed a 40-50 day peak in the rainfall spectrum at some stations in the Indonesian sector during theSouthern Hemisphere summer season. Based on north Australian rainfall and Darwin 850 hPa wind datafrom 1952 to 1982, Holland (1986) has suggested that the active and break periods of the monsoon occur witha periodicity of 40 days. The active and break periods at the 850 hPa and 100 hPa winds at some Australianstations have been linked to the 40-50.day oscillation (McBridge, 1987). The active (break) phase of theAustralian summer monsoon is associated with strong (weak) monsoon circulation and above (below) normalrainfall over tropical Australia.
Recently, Hendon and Liebmann (1990a,b) have reported a statistically significant spectral peak at the40-50 day periodicity in the 850 hPa wind at Darwin but not in the spectral analysis of an area-averagedrainfall of tropical Australia. However, their study indicated a strong coherent relationship between the850 hPa wind at Darwin and north Australian rainfall in low-frequency oscillations, greater than 20 days (seeFig.2(c) of Hendon and Liebmann, 1990b). In an earlier study, Hendon and Liebmann (1990a) alsoemphasized the link between the 30-50 day oscillation in the Indian-west Pacific oceans and the onset of theAustralian monsoon. In a recent paper, Rutledge et al. (1992) have shown a clear 30-50 day oscillation inconvective available potential energy (CAPE) during the 1988-1989 summer season, which shows a closerelationship with rainfall and westerly winds at 850 hPa at Darwin.
The absence of a statistically significant peak in the rainfall data may be caused by two factors: (i) the arrivaltime and the amplitude of the 30-50 day oscillation at any station in the tropics could vary in the interannualtime-scale associated with ENSO phenomenon, since a link between the ENSO phenomenon and the 30-50day oscillation has been suggested by Lau and Chan (1986). The influence of the ENSO phenomenon on theAustralian climate is well documented in previous studies (McBride and Nicholls, 1983; Pittock, 1984; Allan,1991 and references therein). The influence of ENSO phenomenon on the Australian climate and the linkbetween ENSO phenomenon and the 30-50 day oscillation mentioned above suggest a need to study thecombined influences of these phenomena in the summer monsoon rainfall. In general, Australian droughts areassociated with ENSO events (periods of significantly warmer than normal sea-surface temperature (SST) inthe eastern Pacific and cooler than normal SST in the eastern Indian and western Pacific Oceans) and floodsare linked to anti-ENSO events (opposite to ENSO events). (ii) Averaging a large longitudinal area over theAustralian tropics (the Australian tropics north of 20'S) could mask the dominance of the 30-50 dayoscillation at a particular station as the signal has a tendency to propagate eastwards (Madden and Julian,1971,1972, and others). To overcome these difficulties, small area-averaged rainfall values or station rainfalldata could be used. The computation of small area-averaged rainfall regions is a difficult task in northernAustralia where few longer record stations exist, particularly in the central and western parts of tropicalAustralia. This becomes more difficult if we attempt to composite many ENSO and anti-ENSO events.Therefore, in this study station rainfall data have been used.
This study investigates the presence of the 3G-50 day oscillation in the Australian summer monsoonrainfall and its links to extremes of the ENSO phenomenon (ENSO and anti-ENSO events). First,descriptions ofthe nature ofrainfall data and the computational procedure are given. Second, the presence ofthe 3G-50 day oscillation in rainfall variability and its contribution to mean, ENSO, and anti-ENSOconditions and phase propagations are discussed with the aid of power spectra and filtering methods. Finally,based on recent observational studies, a plausible explanation for the difference in spatial and temporalpatterns between ENSO and anti-ENSO events is given.
RAINFALL DATA AND COMPUTATIONAL PROCEDURE
Daily rainfall data for 242 days starting from 1 September have been chosen for 55 stations in the area north of25'S. Daily rainfall data have been obtained from the National Climate Centre, Bureau of Meteorology,Melbourne. This specific period was chosen because the Australian tropics receives most of its rainfallbetween October and March (Gentilli, 1971). Another reason is to look at the contrasting rainfall propagationpatterns between ENSO and anti-ENSO events with reference to a fixed calendar date, September 1.Locations of stations are depicted in Figure 1 and stations names, longitudes, and latitudes are given in

ENSO AND AUSTRALIAN MONSOON RAINFALL
Figure 1. Locations of stations used in this study. The numbers in this figure correspond to the number in the first column in Table I
Table I. Some stations have discontinuities in their records. To compile a longer record, rainfall data from the
nearest station were used. The distance between these stations is less than 10 km. Combined stations' daily
rainfall data sets were compared and tested for overlapping periods wherever possible. After combining the
records during the instrumental record period, only years with complete records were used in this analysis.
Table I also gives information about the total number of years used to calculate the mean rainfall. Hovmoller
diagrams for individual years from 1910 have been prepared to analyse the rainfall propagation in the time-
scale of the 30-50 day period across tropical Australia.Based on the Southern Oscillation Index (SO! (Tahiti-Darwin, a measure of ENSO, and anti-ENSO
events) (Ropelewski and Jones, 1987; Kiladis andDiaz,1989; Allan et al.,l99l) and eastern Equatorial Pacific
sea-surface temperature (Pan and Oort, 1990),29 ENSO andZ2anti-ENso events have been selected and are
listed in Table II. Details about the total number of ENSO and anti-ENSO years used at each station aregiven in Table I. It is worth mentioning that all ENSO events do not always display the same physical
characteristics. which result in considerable differences in spatial and temporal rainfall patterns. The
characteristics of anti-ENSO events also differ from one eyent to another. Furthermore, the arrival date of the
30-50 day oscillation also varies on the interannual time-scales. However, composite pictures are essential in
order to examine possible phase-locking of this oscillation to the seasonal cycle in this region. Mean daily
rainfall values for each day of the year have been calculated for all available years, ENSO, and anti-ENSOyears. As an example, daily rainfall values at Darwin for mean, anti-ENSO, and ENSO conditions are given in
Figure 2. In this figure the standard error of the mean is also shown.Since there is a clear wet season in this region (Gentilli, 1971; Nicholls, 1984), the seasonal cycles were
obtained by fitting polynomial curves to daily rainfall values. The phase of the seasonal cycle in rainfall in this
region indicates a maximum during the period from December to March (between 92 and 212 days from
September 1) in the Australian tropics, which agrees well with the previous study made by Horel (1982}
However, the amplitude of the seasonal cycle varies considerably between ENSO and anti-ENSO events' The
high-frequency fluctuations are dominant in the daily rainfall series, particularly for ENSO and anti-ENSO
.onditionr. This is partly because of the small number of years used in the composite analysis. Therefore, a
3-day running mean filtering technique was applied to the time series before calculating the contribution of
the 30-50 day oscillation to total rainfall variability.power spectrum (Blackman and Tukey, 1958) analysis was used to detect periodicities in the rainfall series'
As a next step, the contribution of the 30-50 day oscillation to rainfall variability was calculated for each
station. Then the contributions of 30-50 day oscillation for all available years, ENSO, and anti-ENSO have
been interpolated spatially at 6km resolution by using the procedure given by Hutchinson and Bischof(1983). Thi same interpolaiion procedure was applied to mean rainfall data for long-term values, ENSO, and
anti-ENSO events to show the contrasting spatial patterns in total rainfall amounts. The Butterworth filter
technique (recursive filter) was rlsed to show the 30-50 day oscillation in rainfall variability and propagations
in zonal and meridional directions.
839
.12 22' zst tA
14. ioao48

Table I. List of rainfall stations,-including station number, station name, longitude and latitude co-ordinates, total numberof years used to calculate the mean, and total number of years to conJtruct ENSO and anti-ENSO composites
No. Stationnumber
Station nameYears
Longitude ("8) Latitude ('s) Total ENSO Anti-ENSO
12J
4J
6
89
10l l12l 3t415t6l718t9202L2223242526272829303 132J J
343536J I
3839404l4243444546474849505 152535455
r28.07128.55r22.14118.38117.08130.52133'03131.00r32.t6137.29137.55t35.57133.25t34.lr133'53r33.54141.55143.12t42.t3t4t.53144.05r39'52139.33140.31142.r5t41.45t4l'04143.33r44.12143.08145.45r45.12145.23r45.34145.23146'01146.46148.15147.25r49.32t46.t6146.15146.07145.t7144.t7146.57r45'28138.07138.19143.02r39.21139.54r42.39r52.24150.28
15.2516.3017-5720.2320'46t2'2512.1916.2414.2920.0220.5718.3917.2319.3821.3223.4910.3613.5710.3512.3816.0018.3317.4520.4018.1220'3917.4018.1820.5r20.4416.5315.27r7.2316.2316.2918.1619.1520.0119.3122'2120.0524.5323.3623.3323'2621.5724.2619.5521.3722.2325.5422.5525.2624'4823.23
85808377I4
1 1 874
10310180849677
10010610680988476
10067
10374
101729697
10184
10298
10181I J
103102t02759898
r0284
1039478
10298979888
10399t )
r02
l 71 5t61 51522l4202 l1 5t6t 8t62 l2222t620t71 520l l20172 lt4t9t920t72 l202Lt6L42l2 l2 l1 520202 lt62 lt9l62l20t920192L20132 l
1005 Wyndham2001 Argyle Downs3003 Broome4032 Port Headland4035 Roebourne14015 Darwin14042 Oenpelli14825 Victoria River Downs14902 Katherine15005 Avon Downs15019 Lake Nash15085 Brunette Downs15086 Newcastle Waters15087 Tennant Creek15525 Barrow Creek15590 Alice Springs27003 Booby Island27005 Coen27022 Thursday Island27042 Weipa28004 Palmerville29001 Augustus Downs29004 Burketown29008 Cloncurry29012 Croydon29025 Julia Creek29041 Normanton30018 Georgetown30024 Hughenden30045 Richmond31011 Cairns31016 Cooktown31029 Herberton31037 Low Isles31055 Mossman South32004 Cardwell32040 Townsville33007 Bowen33035 Ayr33065 St Lawrence34002 Charters Towers35069 Tambo35256 Jericho36007 Barcaldine36031 Longreach36047 Twin Hills36143 Blackall37010 Camooweal37043 Urandangie37051 Winton38002 Birdsville38003 Boulia38024 Windorah39037 Fairymead39083 Rockhampton
222020t9t729t92525202L2219252727202419182518241825t72424262026242620t9262626t9242426202424t9252424242226251926

ENSO AND AUSTRALIAN MONSOON RAINFALL 841
Table II. ENSO and anti-ENSO years used in the composite analysis. The ENSO and anti-ENSO events include theperiod from 1 September of the yeir to 31 April of the following year. For example the years should be read as 1877-1878
and so on.
ENSO years
Anti-ENSO years
1877, 1880, 1884, 1888, 1891, 1896, 1899,1902,1939, 1941,1946,1951,1953, 1957, 1963, 1965,
1886, 1889, 1892, 1898,1903, 1906, 1908, 1916,1955, 1964, 19'70, 19'73,1975 and 1988
1905, 191 1, 1913, 1918, 1923, 1925, 1930, 1932,1969, 1972, 1976, 1982 and 1986
'9?{, D24, t928,1931,1933,1938, t942, L949,
t c
EE
d -
dtr
2 0
EE r s
d
(r
5
EE
E
cr
;1o
2 5
anti-ENS0
02 0
Days from September 1
Figure2. Eleven-dayrunningmeans(solidlines)ofcompositedailyrainfaltatDarwinformean(118years)(a),anti-ENSO(22years)(b),und ENSO (29 years) (c) conditions. The standard error ofthe mean ofeach condition is also smoothed and given by dashed lines. Note
the difference in the vertical scale for anti-ENSO conditions in (b)
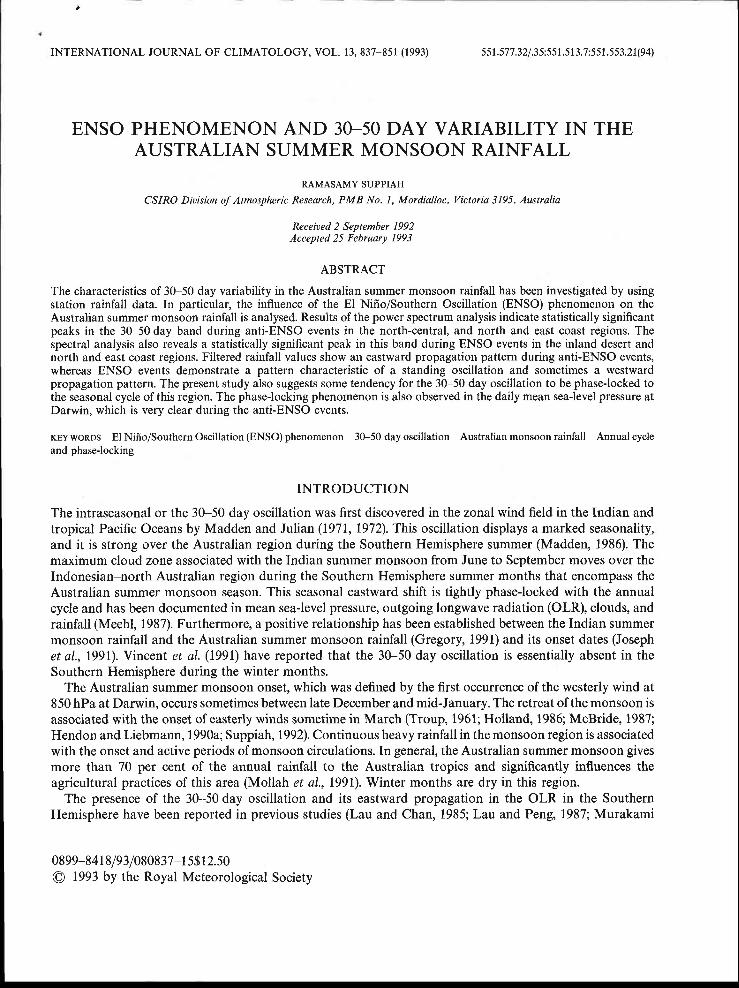
The rainfall anomaly patterns for anti-ENSO minus mean and for ENSO minus mean reveal that manyparts of the Australian tropics receive above normal rainfall during anti-ENSO events and below normal
rainfall during ENSO events. The rainfall pattern for anti-ENSO minus ENSO in Figure 3 also supports this
view. The observed rainfall differences pattern agrees well with earlier observational studies (McBride andNicholls, 1983; Pittock,1984; Allan, 1991). The difference is clear in northern and eastern parts of tropicalAustralia as the t-test values exceed the 95 per cent confidence level over these areas. However, the south-
western part of the study area receives more rainfall during ENSO events, though this change is not
statistically significant and may vary over different epochs (Pittock, 1984; Allan,l99l).
842 R. SUPPIAH
Figure 3. Rainfall difference between anti-ENSO and ENSO events. The shaded areas are above the 95 per cent level according to at-test. Rainfall values in millimetres
Dally zonal wind components at 850 hPa and mean sea-level pressure at Darwin from 1960 to 1989 havealso been used to explain the link between the tropical 30-50 day oscillation and its phaseJockingphenomenon to the seasonal cycle.
RESULTS OF THE POWER SPECTRUM ANALYSIS
Figure 4 displays the results of the power spectrum analysis for three stations. In this figure, Darwin, Boulia,and Mossman represent the north-cenfial part, the inland desert region, and the east coast of tropicalAustralia, respectively. It is evident that a statistically significant peak in the 3G-50 day band arisesparticularly for anti-ENSO conditions in north-central and in the northern part of east coast. The inlanddesert region does not indicate a peak in this band. Spectral analyses for mean conditions at the north-centraland northern part of the east coast also indicate a peak at the 30-50 day band but it does not reach thestatistically significant level. The spectral peak at the 3G-50 day period tends to shift towards longer periodduring ENSO events in the north central and east coast regions. However, inland stations indiiate astatistically significant peak at the 3G-50 day period during ENSO events. Results of spectral analyses alsoshow shorter periodicities around 10 and 20 days, particularly during the ENSO and anti-ENSO events.These periodicities may arise, at least in part, because of averaging a small number of years, as shown inTable I, and from the noisy nature of tropical rainfall data. Apart from these, some synoptic-scale weatherdisturbances can be expected to be responsible for producing such high-frequency oscillations in the temporalrainfall variability. However, in this paper, attention will be focused on the low-frequency oscillation, which iscentred on the 30-50 day time-scale, as this oscillation has usually been considered as a separatephenomenon.
CONTRIBUTION OF 30_50 DAY VARIABILITY TO TOTAL RAINFALL VARIATIONS ANDPHASE PROPAGATIONS
Figure 5(a-c) shows the contributions of the 3G-50 day variability to total rainfall variabilities for mean, anti-ENSO, and ENSO conditions. Under average conditions, the contribution of the 30-50 day variability tototal rainfall variability ranges ftom2L25 per cent in the northern half of the Australian tropics to 10-l2percent in the inland desert region. The overall contribution to total rainfall becomes less (niarly half of ihepresent values) if we include the high-frequency oscillations, which include the periodicities less than 20 days.Therefore, the contribution of this oscillation is calculated based on filtered values. The contribution of the30-50 day oscillation is relatively smaller than the seasonal cycle, which accounts for about 40 per cent of thetotal rainfall variability. However, the changes in the amplitude of this 30-50 day oscillation associated withextreme events of the ENSO phenomenon could result in drastic changes in temporal and spatial rainfallpatterns. Owing to the influence of the ENSO phenomenon, marked differences can be seen in thecontribution of the 30-50 d,ay vafiability to total rainfall variability between anti-ENSO and ENSO events.During anti-ENSO events, the contribution varies from 10 per cent to 25 per cent between the northern coasts

ENSO AND AUSTRALIAN MONSOON RAINFALL 843
Mean anti-ENS0 ENSOo . ! 4
o . l 2
6 0 . 1 0oo
€ o.oeU
I 0 . 06
ooo 0 . 0 4
o .o2
0 . 0 0
0 .0E
0 . 0 6
0 .08
0 . 0 6
0 .04
o .o2
0 .00
0 .08
0 .o6
0.0/+
0 .o2
0 .00
0 .08
0 .06
0 . 0 4
0 .02
0 .00
0 . 1 4
o . l 2
0 . 1 0
0 .08
0 .06
0 .04
0 .02
0 .00
0 .0E
0 .06
0 .04
0 .02
0 .00
o . t 2
0 . 1 0
0 .08
0 . 0 6
0.0,+
o .o2
0 .00
4 A 1 2
B o u l i o
L
E o u l i o B o u l i o
o
E
co
0.0,+
o.o2
0 .00
o . t 2
0 . r 0
4 8 l 2 4 8 1 2 ,f8 t 2
3 0 .08oE
u 0 . 0 6o
o
& o.o+v1
o.o2
0 .00 1 8 1 2 5 4 2
Pe r i od i n Doys4 8 1 2 5 4 2
Pe r i od i n Doys
Figure 4. Results of the spectrum analysis of daily mean rainfall for all years (mean), anti-ENSO, and ENSO conditions for Darwin,Bo-ulia, and Mossman. These stations represent the north-central part, the inland region, and the east coast region, respectively. Theupper and lower dotted curves depict the 95 per cent and 5 per cent confidence levels and the dashed curve shows the red noise. The
30-50 day band is shown by two vertical lines
P e r i o d i n D o y s

844 R. SUPPIAH
Figure 5. Contribution of the 30-50 day oscillation to total rainfall variability for (a) mean, (b) anti-ENSO, and (c) ENSO conditions.Contributions are in per cent. Areas greater than 18 per cent are shaded
and inland desert region, showing greater contributions in the north-central part and on the north-east coastof tropical Australia. A more striking feature is the greater contribution during anti-ENSO events in thenorth-central part (top end). The inland desert region receives relatively less contribution. Total rainfallreceived during anti-ENSO events is also greater than during ENSO events. In contrast, ENSO eventsindicate a complex pattern of contribution. The overall contribution across northern Australia yaries frombelow 16 per cent to 20 per cent during ENSO events, showing an increase along the northern and easterncoasts and in the inland desert region.
The Butterworth filter technique is used to suppress the periodicity below 30 days and above 50 days.Filtered time series along north-south (Darwin-Victoria River Downs-Alice Springs), north-west-south-east(Darwin-Brunette Downs-Longreach), and west-east (Darwin-Weipa) transects for composite anti-ENSOand ENSO events are illustrated in Figures 6-8. These figures demonstrate the behaviour of the monsoonrainfall with a period of 30-50 days and also indicate the strong influence of the global scale 3G-50 oscillationover the Australian monsoon region described in previous studies (Madden and Julian, 1971,1972). This cycleis associated apparently wit\the active and break period of the monsoon rainfall. This is also in agreementwith those results of previous studies (Holland, 1986; Hendon and Liebmann, 1990a,b). It is noteworthy thatthe filtered rainfall series also demonstrate irregularities in their amplitudes of this oscillation between anti-ENSO and ENSO events. In particular, rainfall variations during the ENSO indicate longer periodicities withless amplitude whereas rainfall variations during anti-ENSO events show a somewhat a regular 30-50 dayoscillation.

ENSO AND AUSTRALIAN MONSOON RAINFALL 845
E
E
oE
q
E
2 . 5
2 . O
1 . 5
1 . 0
0 .5
0 0- 0 . 5
-2 .O
2 5
2 .O
1 . 5
1 0
0 . 5
0 0- 0 5
- 1 . 0- 1 5
- 2 . O
t
c
o
E
ENSO( b )
- D o r w i n. - - - V i c t o r i o R . 0 .. . . . A l ; c e S p . i n g s
60 120 1 80 240
Doys f rom September t
Figure 6. Filtered rainfall for (a) anti-ENSO and (b) ENSO events along the north-south transect connecting Darwin, Victoria RiverDowns, and Alice Springs. Arrows in the upper panel indicate the rainfall propagation
2 . 5
2 . O
1 . 5
1 0
0 . 5
0 0- 0 5
- 1 . 0
- 1 5
- 2 5
2 . O
1 . 5
1 . 0
0 . 5
0 .0- 0 . 5- 1 0
0 60 120 180 240
Doys f r om Sep tember I
Figure 7. Same as in Figure 6 but for the north-west-south-east transect linking Darwin, Brunette Downs, and Longreach
EEq
oE
EE
o
oE
o n t i - ENSO( o )
- o o r w i n. - - - V i c t o r i o R D ,- . " A l i c e S p r i n q s
\.
t . i.,,
l ., {
on t i - ENSO( o )
I
- o o r w i n. - - - B r u n e t t 6 D o w n s. . . . L O n 9 r e o c h

846 R. SUPPIAH
ENSO( b )
_ o o . * i n. - - - l V e i p o
6 0 t 2 0 1 8 0 2 4 0
D o y s f r o m 5 6 p t e m b e r 1
Figure 8. Same as in Figure 6 but for the east-west transect between Darwin and Weipa
Figures 6-8 also indicate zonal and meridional propagations in rainfall variability during the monsoonseason throughout tropical Australia. Arrows in the upper panels of these figures show the rainfallpropagations. It is evident that during anti-ENSO events, a systematic propagation in the zonal and.meridional directions in rainfall pattern is noticed throughout the monsoon season. These propagations aredue to high rainfall amounts associated with the strong monsoon activity and greater amplification of the30-50 day oscillation. In addition, the larger amplitude of this oscillation persists throughout the season, andtherefore, the influence of this oscillation is noticed south of 20'S. In contrast, the ENSO events do notindicate a clear propagation in rainfall during the monsoon season. In particular, the amplitude of thisoscillation is small during the middle part of the monsoon season. Rainfall during ENSO events shows a sloweastward propagation or a pattern characteristic of a standing oscillation. Sometimes it shows a westwardpropagation. Such ENSO conditions are clearly seen in the lower panel of Figure 8. Rainfall variabilityduring ENSO events also shows the amplification of the 30-50 day oscillation at the end of the monsoonseason in the inland desert region and in the east coast stations. This amplification is evident in the lowerpanels of Figures G8. Results of spectral analyses for ENSO rainfall composites reported in the previoussection also indicate a statistically significant peak at the 3G-50 day band in these regions. Furthermore,filtered rainfall data sqggest a fast eastward propagatory pattern during anti-ENSO events and a sloweastward or a standing oscillation during ENSO events over the Australian tropics. Sometimes this oscillationshows a westward propagation during ENSO events. An analysis of individual year rainfall also shows thecontrast in the amplitude and propagation of rainfall between ENSO and antiENSO years.
The relationship between the 30-50 day oscillation and the Australian summer monsoon onset has beensuggested by Hendon and Liebmann (1990a, b). The major peak in the temporal pattern of rainfall variationsin the 30-50 day time-scale occurs in relation to the monsoon onset. This oscillation, however, showssignificant differences in persistence between ENSO and anti-ENSO events after the occurrence of a majorpeak in rainfall in the 3G-50 day time-scale. The major peak in the 30-50 day time-scale in rainfall occurs withthe monsoon onset. Composite rainfall in relation to the major peak for ENSO and anti-ENSO at Darwin inFigure 9 indicates that this oscillation tends to be stronger and persistent throughout the season after themajor peak during anti-ENSO events, while it is weak during ENSO events.
EE
op
oE
2 . 5
2 .O
1 . 5
1 . 0
0 5
0 .0- 0 . 5- 1 . 0- 1 . 5
- 2 0
- 2 - 5
2 . 5
2 0
1 5
1 . 0
0 . 5
o 0
- 1 . 0- 1 . 5
- 2 0
- 2 5
EE
o
oE

ENSO AND AUSTRALIAN MONSOON RAINFALL 847
E
EE
E< - 0 5
2 0
t 5
1 , 0
0 5
0 0
- 0 5
- l 0
- 1 5
- 2 0
D o r r i n
- - € N S O
- o n i i - E N s o
- 9 0 - 6 0 - 5 0 0 3 0 6 0 9 0
D o y s t . o m t h e p e o k ( 0 )
Figure 9. Composite rainfall for ENSO and anti-ENSO events in relation to the maximum peak in the 30-50 day oscillation betweenlate November and late Januarv
l 0
- - - E N S O_ o n t i _ E N s o
60 120 1 80
Doys f rom S€ptember I
240
Figure 10. Composite filtered rainfall for ENSO and anti-ENSO events at Boulia
5
o
@
1 0 1 4
1 0 1 2
1 0 1 0
1 008
1 006
1 004
Doys f rom September 1
Figure I 1. Variations of daily mean seaJevel pressure for mean, ENSO, and anti-ENSO condition at Darwin. Daily mean sealevelpressure values have been smoothed by an ll-day running mean
The amplitude modulation of the 30-50 day oscillation in rainfall varies between the ENSO and anti-ENSO events. The amplitude of the 30-50 day oscillation is large oyer north-central and north-western partsof tropical Australia during anti-ENSO events. This large amplitude, however, appears to be dominant overthe eastern part and inland regions around Boulia during ENSO events, as shown in Figure 10. The amplitudemodulation of the 30-50 day oscillation over these regions could be linked to the eastward shift of the majoractive convection zone from the Indonesian region during ENSO svents. Analyses of cloud cover forindividual years from 1979 to 1983 (Kuhnel, 1989) and OLR fuom 1974 to 1980 (Lau and Chan, 1986) showsuch displacements in the location of the major convection zone.
Results of daily mean sea-level pressure data for mean, ENSO, and anti-ENSO conditions at Darwin areshown in Figure 11. The long-term mean values were constructed from 29 years of data (196G-1989). TheENSO composite in this figure includes the latest seven events and the anti-ENSO composite consists of the

848 R. SUPPIAH
o
0
!
=4
b
I
0
oor" ,ro- ' ' r !0,"-0", I to 24o
Figure 12. Relationship between 850-hPa wind and rcinfall at Darwin for the period 1961-1990. Mean rainfall and zonal windcomponents have been smoothed by an 1l-day running mean
latest five events in the Table II. On average conditions, pressure variations at Darwin show a gradualdecrease towards the monsoon season and the prevalence of a weak 30-50 day oscillation. This pattern ofvariation differs considerably between ENSO and anti-ENSO events. During ENSO events, relatively higherpressure before and during the monsoon season is noticed with no remarkable fluctuations. During anti-ENSO years, pressure variations indicate lower pressure with marked 3G-50 day periodicity. Furthermore,the 30-50 day oscillation in daily mean sea-level pressure is also phase-locked to the\seasonal cycle, and inparticular, this phenomenon is very clear during the anti-ENSO events.
The 3G-50 day oscillation has a random characteristic in its arrival date and its amplitude modulation.However, the presence of this oscillation irl the composite summer wet season rainfall in relation to a calendardate suggests a weak phaseJocking to the seasonal cycle at least during the extreme phases of the ENSO cycle.An analysis of the relationships between zonal wind components at Darwin and rainfall in Figure 12 indicatesa positive relationship, which in turn shows a link between the intraseasonal oscillation described by Maddenand Julian (1971,1972) and the Australian summer monsoon rainfall. Hendon and Liebmann (1990a,b) havealso noticed a strong coherence relationship between 850 hPa wind at Darwin and north Australian rainfallin the period greater than 20 days. Moreover, the signal of 3G-50 day oscillation in zonal wind is large over theSouth China Sea during the months from June to September (Tanaka, 1992) and it appears over the TimorSea during the months from November to March (Suppiah, 1991).
In general, the largest amplitude with the 30-50 day periodicity in the rainfall variability occurs in relationto the onset of the monsoon. However, a relatively smaller peak appears preceding the monsoon onset. Theoccurrences of these peaks suggest that the bimodal rainfall pattern described by Nicholls (1984) may beassociated with the passage of the 3G-50 day oscillation over this area. This pre-monsoon onset peak in thetemporal variation of rainfall is relatively larger during anti-ENSO events and smaller during ENSO events.However, further investigation is needed on this aspect.
\ DISCUSSION
Based on the phaseJocking of the ENSO phenomenon to the annual cycle, and the phase-locking of the3G-50 day oscillation to the seasonal cycle, a plausible explanation is given for contrasting rainfall patterns onthe intraseasonal time-scale. As reported in previous studies (Murakami and Sumi, 1982; Allan, 1983;McBride, 1983), an enhanced monsoon trough is located inland and so, under stronger monsoon conditions,gives more rainfall to the land area. In weaker monsoon conditions, the monsoon trough is located moreequatorward and gives rainfall only to coastal regions. More rainfall is received along the monsoon troughdue to enhanced convective activity during the monsoon season. A significant amount of rainfall is alsoreceived from tropical cyclones and monsoon depressions. The pattern for anti-ENSO conditions inFigure 5(b) shows that this greater contribution of the 30-50 day oscillation to rainfall variability region islocated just north of the climatological position of the monsoon trough. The monsoon trough or the shear lineis located more poleward over the western part (near 20oS over the Pilbara heat low region) and more

ENSO AND AUSTRALIAN MONSOON RAINFALL
equatorward over eastern (near 15"S over Queensland) tropical Australia. Moreover, this maximumcontribution region could be related to the location of the monsoon trough near the surface, as the trough hasa northward slope in its vertical structure. During ENSO events, the contribution of the 30-50 day oscillationto rainfall variability indicates two important regions, one of which comprises the northern and eastern coastsand the other the inland desert region. The larger contribution along the coast may be linked to the moreequatorward location of the monsoon trough, associated in most of the cases with a weak monsoon. The otherlarger contribution in the inland desert region may be related to late season rainfall at the end of the monsoonseason. The poleward shift of the monsoon trough toward inland tropical Australia at the end of the seasonand its sudden retreat during ENSO events can be seen in daily weather maps. As a consequence of the arrivalof the monsoon trough at the end of the monsoon season the 30-50 day oscillation amplifies the rainfallvariability, particularly in the inland desert region. This behaviour is shown by an example of rainfallvariability at an inland station, Boulia, in Figure 10.
As mentioned previously, temporal variations of rainfall during anti-ENSO events indicate systematiczonal and meridional propagations, but ENSO years reveal slow eastward propagation or a patterncharacteristic of a standing oscillation or westward propagation. The contrasting patterns in propagationmay be linked to the phase-locking of the ENSO phenomenon to the annual cycle, as described by Rasmussonand Carpenter (1982), and the phaseJocking of the 3G-50 day oscillation to the seasonal cycle found in thisstudy. As demonstrated in previous studies (Rasmusson and Carpenter, 1982, and others), the majorconvective zone, which is usually located over the Indonesian-North Australian region, moves into thecentral equatorial Pacific during ENSO events. This major convective zone is located over theIndonesian-north Australian region during anti-ENSO events. Based on the strong relationship between theSOI and ruinfall, Nicholls and Wong (1990) have also suggested that the ENSO phenomenon amplifiesrainfall variability in the region it affects. As a link between the ENSO phenomenon and the 30-50 dayoscillation, Lau and Chan (1986) have observed an amplification of the 30-50 day oscillation and enhancedconvection over the Indonesian-North Australian region during 197+1975, an anti-ENSO year. They havealso noticed amplification of the 30-50 day oscillation in the central Pacific during the 1982-1983 ENSOevent. Both the 3G-50 day oscillation and the ENSO phenomenon display an eastward propagation and arephased-locked to the seasonal cycle, with the former having a fast eastward propagation mode and the latter aslow eastward propagation mode. It is likely that during an anti-ENSO event there is a greater amplification-and enhanced eastward propagation of the 30-50 day oscillation over the Indonesian-north Australianregion. Results from daily mean sea-level pressure data at Darwin in Figure 11 also show greateramplification of the 30-50 day oscillation during anti-ENSO events over this region.
During ENSO events, stronger amplification of the 30-50 day oscillation and enhanced convection tend tooccur over the central and eastern Pacific regions, with reduced convection over the Indonesian-northAustralian area. The observational results based on OLR data (Murakami et al.,1986) and the rainfall patternpresented in this study both suggest slow zonal and meridional propagations or a pattern characteristic ofastanding oscillation and westward propagation over the Australian region during ENSO years. Filteredrainfall in Figure 8(b) suggests that this oscillation is stronger over Weipa during ENSO events and alsoindicates the dominance of this oscillation in the eastern part of Australia.
CONCLUSIONS
A study of temporal rainfall variations during the summer monsoon season in the Australian tropics hasrevealed some interesting results. Although the 30-50 day oscillation in OLR, wind components, and in theAustralian summer monsoon rainfall has been described previously, this study has documented the presenceof a statistically significant peak in the rainfall variability that indicates considerable differences between anti-ENSO and ENSO events. During anti-ENSO events, the 30-50 day oscillation is particularly dominant overthe northern half of the Australian tropics throughout the monsoon season. The contribution of thisoscillation to total rainfall variability gradually decreases toward the inland desert region. However, duringENSO events, this oscillation is dominant in northern coastal stations throughout the monsoon season. Theoscillation also influences the inland desert regions, where it is amplified at the end of the monsoon season.
849

850 R. SUPPIAH
The dominance of this oscillation during the Australian monsoon season in the composite rainfall suggeststhat the 3G-50 day oscillation is to some extent phaseJocked to the seasonal cycle in this region. Such phase-locking phenomenon has also been found in daily mean sea-level pressure at Darwin. This phenomenon isvery clear during anti-ENSO events.
Under mean conditions, eastward and southward propagations have been noticed in rainfall variability.However, a marked difference in rainfall propagations has been found between anti-ENSO and ENSO events.In particular, a systematic propagation of rainfall rapidly eastward and southward is a feature of anti-ENSOyears. However, ENSO years indicate slow propagations in both eastward and southward directions, or apattern characteristic of a standing oscillation or westward propagation.
The 30-50 day oscillation in the Australian summer monsoon rainfall seems to be linked with character-istics of the ENSO phenomenon and the seasonal cycle in this region. Further investigation of this link wouldbe desirable.
Further studies are necessary to capture the 30-50 day oscillation during the period preceding theAustralian monsoon season, preferably in south-east Asia and the tropical Indian Ocean. In addition, theidentification of precursors of the extreme phases of the ENSO phenomenon is very important, given that theyare associated with contrasting patterns in the dominance of the 3G-50 day oscillation in Australian summermonsoon rainfall.
ACKNOWLEDGEMENTS
I would like to thank Drs A. B. Pittock, R. J. Allan, A. C. Hirst and P. H. Whetton for their constructivecomments. Russell Stringer, Bureau of Meteorology, Darwin, kindly provided daily wind and mean sea-levelpressure data. This work has been funded by the Federal Department of Arts, Sport, Environment andTerritories and by the Northern Territory and Western Australian governments.
REFERENCES
Allan, R. J. 1983.'Monsoon and teleconnections variability over Australasia during the southern hemisphere summers of 1973-'17', Mon.Wea. Reu., ll0, ll3-142.
Allan, R. J. 1991. 'Australasia', in Glantz, M., Katz, R. W. and Nicholls, N. (eds), Teleconnections Linking Worlilwiile Climatic Anomalies,Cambridge University Press, Cambrid ge, pp. 7 3-120.
Allan, R. J., Nicholls, N., Jones, P. D. and Butterworth, I. J. 1991.'A further extension of the Tahiti-Darwin SOI, early ENSO events andDarwin pressure', J. Climate, 4, 743-749.
Blackman, R. B. and Tukey, J. W. 1958. The Measurement of Power Specta, Dover Publications, New York, 190 pp.Gentilli, J. 1971. 'Dynamics of the Australian troposphere', in Gentilli, I. (ed.), Climates of Australia anil N ew Zealanil, World Suruey of
Climatology, Vol. 13, Elsevier, Amsterdam, pp. 53-117Gregory, S. 1991. 'Interrelationships between Indian and northern Australian summer monsoon rainfall values', Int. J. Climatol., ll,
55-62.Hartmann, D. L. and Gross, J. R. 1988. 'Seasonal variability of the 40-50 day oscillation in wind and rainfall in the tropics', J . Atmos. Sci.,
45,2680-2702.Hendon, H. and Liebmann, B. 1990a.'A composite study of the Australian summer monsoon', J. Atmos.9ci.,47,2227-2240.Hendon, H. and Liebmann, B. 1990b.'The intraseasonal (30-50 day) oscillation of the Australian summer monsoon', J. Afmos.9ci.,47,
2909-2923.Holland, G. J. 1986. 'Interannual variability of the Australian summer monsoon at Darwin:, 1952-1982', Mon. Wea. Reo.,ll{, 594-6M.Horel, J. D. 1982.'On the annual cycle of the tropical Pacific atmosphere and ocean', Mon. Wea. Reu., lI0, 1863-1878.Hutchinson, M. F. and Bischof, R. J. 1983. 'A new method for estimating the spatial distribution of mean seasonal and annual rainfall
applied to the Hunter Valley, New South Wales', Aust. Meteorol. Mag.,3l, 179-184.Joseph, P. V., Liebmann, B. and Hendon, H. H. 1991. 'Interannual variability of the Australian summer monsoon: possible influence of
Indian summer monsoon and ENSO', J. Climate,4, 529-538.Karoly, D. J. 1989. 'Low frequency variations of the southern hemisphere circulation', Proceeilings, Thiril lnternational Conference on
Southern Hemisphere Meteorology anil Oceanograplry, Buenos Aires, pp. 105-109.Kiladis, G. N. and Diaz,H. F. 1989.'Global climatic anomalies associated with extremes in the southern oscillation', J. Climate,2,
1069-1090.Knutson, T. R. and Weickmann, K. M. 1987. '30-60 day atmospheric oscillations: composite life cycles of convection and circulation
anomalies', Mon. Wea. Reu.,ll5, 1407-1436.Kuhnel, I. 1989.'Spatial and temporal variations in Australo-Indonesian region cloudiness', Int. J. ClimatoL, 9, 395-405.Lau, K. M. and Chan, P. H. 1985. 'Aspects of the 40-50 day oscillation during northern winter as inferred from outgoing longwave
radiation'. Mon. Wea. Reu.. 113. 1889-1909.

ENSO AND AUSTRALIAN MONSOON RAINFALL 851
Lau, K. M. and Chan, P. H. 1986. 'The 40-50 day oscillation and the El Niffo/Southern Oscillation: a new perspective', Bull. Am.Meteorol. Soc., 6il, 533-534.
Lau, K. M. and Peng, L. 1987. 'Origin of low-frequency (intraseasonal) oscillations in the tropical atmosphere. Part 1: basic theory',J. Atmos. Sci, 44,950-970.
Madden, R. A. 1986. 'Seasonal variation of the 4G-50 day oscillation in the tropics', J. Atmos. Sci., 43, 3138-3158.Madden, R. A. and Julian, P. R. 1971.'Detection of a 40-50 day oscillation in the zonal wind in the tropical Pacific', J. Atmos.Sci.,28,
't02_708.
Madden, R. A. and Julian, P. R. 19'12. 'Description of global-scale circulation cells in the tropics with a 40-50 day period', J . Atmos. Sci.,29, tl09-1123.
McBride, L L. 1983.'Satellite observations of the southern hemisphere monsoon during winter MONEX', Tellus,35A, 189-197.McBride, J. L. 1981. 'The Australian summer monsoon', in: Chang, C. P. and Krishnamurti, T. N. (eds.), Monsoon Meteorology, Oxford
University Press, Oxford, pp. 203-231.McBride, J. L. and Nicholls, N. 1983.'Seasonal relationships between Australian rainfall and the southern oscillation', Mon. Wea. Reu.,
111.1998-2004.Meehl, G. A. 1987.'The annual cycle and interannual variability in the tropical Pacific and Indian Ocean Regions', Mon. Wea. Reo.,ll5,
27-50.Mollah, W. S., De Launey, W. and Haynes, M. A. 7991.'Long-term characteristics of seasonal rainfall at Katherine, Northern Territory',
Aust. Geogr. Stuil., 29, 7 l-92.Murakami, T., Chen, L-X, Xie, A. and Shrestha, M. L. 1986. 'Eastward propagation of 3G-60 day perturbations as revealed from outgoing
longwave radiation data', J. Atmos. Sci.,43,961-9'll.Murakami, T. and Sumi, A. 1982. 'Southern hemisphete summer monsoon circulation during the 1978-79 WMONEX. Part II: onset,
active and break monsoons', J. Meteorol. Soc. Jpn.,601 649-670.Nicholls, N. 1984. 'A system for predicting the onset of the north Australian wet-season', J. Climatol., 4, 425435.Nichoffs, N. and Wong, K. K. 1990. 'Dependence of rainfall variability on mean rainfall, latitude, and the Southern Oscillation',
J. Climate,3, 163-170.Pan, H. Y. and Oort, A. H. 1990.'Correlation analyses between sea surface temperature anomalies in the eastern equatorial Pacific and
the world ocean', Climate Dyn.,4, 191105.Pittock, A. B. 1984. 'On the reality, stability and usefulness of southern hemisphere teleconnections', Aust. Meteorol. Mag,32, 7 5-82.Rasmusson, E. M. and Carpenter,T. 1982. 'Variations in tropical sea surface temperatffe and surface wind fields associated with the
Southern Oscillation', M on. ll'ea. Reu., ll0, 35+384.Ropelewski, C. F. and Jones, P. D.1987. 'An extension of the Tahiti-Darwin southern oscillation index', Mon. Wea. Reu.,115,21611165.Rutledge, S. A., Williams, E. R. and Keenan, T. D. 1992.'The Down-Under Doppler and Electricity Experiment (DUNDEE): overview
and preliminary results', Ball. Am. Meteorol. Soc,73,3-16.Suppiah, R. 1991.'Intraseasonal variations of Australian summer monsoon rainfall during ENSO and anti-ENSO episodes (extended
abstract)', Conference on Agricultural Meteorology, lT-19 July, Melbourne, pp. 28-31.Suppiah, R. 1992.'The Australian summer monsoon: a review'. Prog. Phys. Geogr., 16,283-318.Tanaka, M. 1992. 'Intraseasonal oscillation and the onset and retreat of the summer monsoon over east, southeast Asia and the western
Pacific regions using GMS high cloud amount data'. J. Meteorol. Soc. Jpn.,70,613-629.Troup, A. J. 1961. 'Variations in upper tropospheric flow associated with the onset of Australian summer monsoon', Indian J. Meteorol.
Geophys.,12, 217-230.Vincent, D. G., Sperling, T., Fink, A., Zube, S. and Speth, P. 1991. 'Intraseasonal oscillation of convective activity in the tropical southern
hemisphere: May 1984-April 1986', J. Climate,4,40-53.