
Enrollment - CMU · Headcount Enrollment by College, Level ... all data used for the student...
52
Enrollment
Transcript of Enrollment - CMU · Headcount Enrollment by College, Level ... all data used for the student...

Enrollment
Table of Contents
EnrollmentIntroduction
Headcount Summaries by College, Status, Gender, Citizenship, Race, and LevelHeadcount Enrollment
by College, Department, Level, and Statusby College, Department, Level, and Genderby College, Department, Level, and Class
FTE Enrollment by College, Department, Level, and ClassHeadcount Enrollment
by Location of Study, Home College, Level, and Status by Location of Study, Home College, Level, and Genderby Location of Study, Home College, Level, and Class
FTE Enrollment by Location of Study, Home College, Level, and ClassHeadcount and FTE Enrollment by College, Status, and LevelHeadcount Enrollment by College, Level, Gender, and Minority StatusHeadcount Enrollment by College, Department, Citizenship, Race, and Gender
UndergraduateMaster'sDoctoral
Headcount Enrollment by College, Department, Citizenship, Residency, and GenderUndergraduateMaster'sDoctoral
Headcount Enrollment by Continent, Country of Citizenship, and LevelUndergraduate U.S. Citizens and Permanent Residents, by Region and State of ResidenceUndergraduate International Students, by Continent and Country of CitizenshipGraduate U.S. Citizens and Permanent Residents, by Region and State of ResidenceGraduate International Students, by Continent and Country of CitizenshipHeadcount Enrollment by College, Department, Status, and Gender
UndergraduateMaster'sDoctoral
Undergraduate Additional Major Enrollmentby Additional Major College and Departmentby College, Department, Citizenship, Race, and Gender
Undergraduate Headcount of Students with Additional Majors by Citizenship, Race, and Gender

Students
Data Sources:
Unless otherwise noted, all data used for the student section of this book are from the Student Information System (SIS). Enrollment summaries include headcounts and fulltime equivalency (FTE) totals for all students actively enrolled at Carnegie Mellon as of the last fiscal day of September. Degree summaries include degrees awarded during an entire academic year.
Other Sources:
Admission Activity: Undergraduate Admission Office
Athletics: Department of Athletics
National Average SAT Scores: www.collegeboard.org
Post-graduation Data: Career and Professional Development Center
Study Abroad: Office of International Education
Undergraduate Research: Undergraduate Research Office
Definitions:
Student Levels:
Undergraduate: Students enrolled as firstyear, sophomore, junior, senior, or fifthyear students
Graduate: Students enrolled in Master's or Doctoral programs
Other: Students who are not enrolled in a university degree program
Citizenship and Race Categories:
International: Students who are neither citizens nor permanent residents of the United States, regardless of the country in which their Carnegie Mellon University program is located
US Citizens and Permanent Residents self-identify from among these categories: American Indian, Asian, Black, Hispanic, Pacific Islander, and White
Multiracial: Students who identify as more than one race are reported as multiracial (minority) if any race is American Indian, Black, or Hispanic; and multiracial (majority) if no race is American Indian, Black, or Hispanic
Minority: Students who identify as American Indian, Black, or Hispanic are reported as minority students
Female and Minority Students: These counts are not mutually exclusive; for example, a Hispanic female is counted as both a female and a minority
Enrollment by Location of Study: These tables contain the enrollment of students by their physical location of study for all of Carnegie Mellon’s Middle States approved branch campuses, additional locations, and other instructional sites. This classification differs from others in the Enrollment section in that it categorizes students by their location, rather than by their home college/department. For example, a student who has a home college of Qatar, but who is studying at the Pittsburgh campus on the last fiscal day of September will be classified as location of Pittsburgh, PA and home college of Qatar.
Academic Year (Degrees Awarded): Includes three semesters in the following order: fall, spring, and summer
Branch Campuses: Includes students enrolled at Carnegie Mellon University in Qatar and Silicon Valley
Headcount: Each student, full or parttime, is counted once
Full-time Equivalent (FTE): Each fulltime student is counted once; parttime students are counted based on the percentage of fulltime tuition paid
Undeclared: Student is enrolled in that college but has not yet declared a major
ENR-1
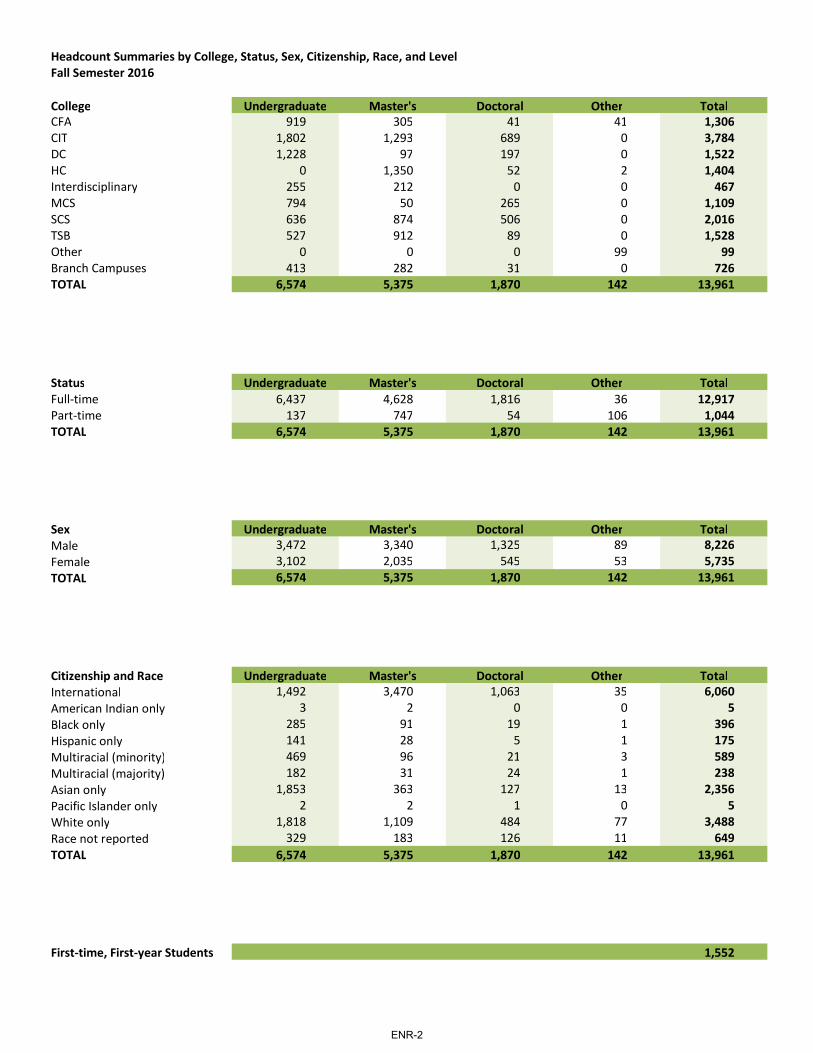
Headcount Summaries by College, Status, Sex, Citizenship, Race, and Level Fall Semester 2016
College Undergraduate Master's Doctoral Other TotalCFA 919 305 41 41 1,306CIT 1,802 1,293 689 0 3,784DC 1,228 97 197 0 1,522HC 0 1,350 52 2 1,404Interdisciplinary 255 212 0 0 467MCS 794 50 265 0 1,109SCS 636 874 506 0 2,016TSB 527 912 89 0 1,528Other 0 0 0 99 99Branch Campuses 413 282 31 0 726TOTAL 6,574 5,375 1,870 142 13,961
Status Undergraduate Master's Doctoral Other TotalFulltime 6,437 4,628 1,816 36 12,917Parttime 137 747 54 106 1,044TOTAL 6,574 5,375 1,870 142 13,961
Sex Undergraduate Master's Doctoral Other TotalMale 3,472 3,340 1,325 89 8,226Female 3,102 2,035 545 53 5,735TOTAL 6,574 5,375 1,870 142 13,961
Citizenship and Race Undergraduate Master's Doctoral Other TotalInternational 1,492 3,470 1,063 35 6,060American Indian only 3 2 0 0 5Black only 285 91 19 1 396Hispanic only 141 28 5 1 175Multiracial (minority) 469 96 21 3 589Multiracial (majority) 182 31 24 1 238Asian only 1,853 363 127 13 2,356Pacific Islander only 2 2 1 0 5White only 1,818 1,109 484 77 3,488Race not reported 329 183 126 11 649TOTAL 6,574 5,375 1,870 142 13,961
Firsttime, Firstyear Students 1,552
ENR-2

Headcount Enrollment by College, Department, Level, and Status Fall Semester 2016
Undergraduate Master's Doctoral Other TotalCollege Department FT PT T FT PT T FT PT T FT PT T FT PT TCFA Architecture 250 12 262 65 8 73 23 6 29 0 0 0 338 26 364
Art 148 5 153 16 0 16 0 0 0 0 0 0 164 5 169Design 149 4 153 47 3 50 11 1 12 0 0 0 207 8 215Drama 214 4 218 68 1 69 0 0 0 0 0 0 282 5 287Music 118 3 121 93 4 97 0 0 0 34 7 41 245 14 259Studentdefined Major 2 0 2 0 0 0 0 0 0 0 0 0 2 0 2Undeclared 8 2 10 0 0 0 0 0 0 0 0 0 8 2 10TOTAL 889 30 919 289 16 305 34 7 41 34 7 41 1,246 60 1,306
CIT Biomedical Engineering 0 0 0 75 4 79 33 1 34 0 0 0 108 5 113Chemical Engineering 223 3 226 87 5 92 90 0 90 0 0 0 400 8 408Civil and Environmental Engineering 87 0 87 178 2 180 59 2 61 0 0 0 324 4 328Electrical and Computer Engineering 545 7 552 313 12 325 234 5 239 0 0 0 1,092 24 1,116Engineering and Public Policy 0 0 0 0 0 0 75 4 79 0 0 0 75 4 79Information and Communication Tech 0 0 0 60 1 61 0 0 0 0 0 0 60 1 61Information Networking Institute 0 0 0 228 1 229 0 0 0 0 0 0 228 1 229Interdisciplinary 0 0 0 60 5 65 0 0 0 0 0 0 60 5 65Materials Science and Engineering 104 0 104 50 1 51 74 2 76 0 0 0 228 3 231Mechanical Engineering 410 6 416 203 8 211 105 5 110 0 0 0 718 19 737Undeclared 416 1 417 0 0 0 0 0 0 0 0 0 416 1 417TOTAL 1,785 17 1,802 1,254 39 1,293 670 19 689 0 0 0 3,709 75 3,784
DC Center for Neural Basis of Cognition 0 0 0 0 0 0 16 1 17 0 0 0 16 1 17Economics 67 1 68 0 0 0 0 0 0 0 0 0 67 1 68English 56 6 62 45 9 54 33 0 33 0 0 0 134 15 149History 28 3 31 0 0 0 17 2 19 0 0 0 45 5 50Institute for Politics and Strategy 33 0 33 0 0 0 0 0 0 0 0 0 33 0 33Interdisciplinary 207 6 213 0 0 0 0 0 0 0 0 0 207 6 213Modern Languages 4 1 5 8 0 8 10 0 10 0 0 0 22 1 23Philosophy 24 3 27 10 0 10 24 0 24 0 0 0 58 3 61Psychology 113 3 116 0 0 0 28 0 28 0 0 0 141 3 144Social and Decision Sciences 98 0 98 0 0 0 18 0 18 0 0 0 116 0 116Statistics 189 2 191 25 0 25 45 3 48 0 0 0 259 5 264Undeclared 382 2 384 0 0 0 0 0 0 0 0 0 382 2 384TOTAL 1,201 27 1,228 88 9 97 191 6 197 0 0 0 1,480 42 1,522
HC Creative Enterprise 0 0 0 110 3 113 0 0 0 0 0 0 110 3 113Health Care Policy 0 0 0 35 0 35 0 0 0 0 0 0 35 0 35Heinz General 0 0 0 0 10 10 6 0 6 0 2 2 6 12 18Information Security Policy and Mgmt 0 0 0 57 0 57 0 0 0 0 0 0 57 0 57Information Systems 0 0 0 469 0 469 19 0 19 0 0 0 488 0 488
ENR-3
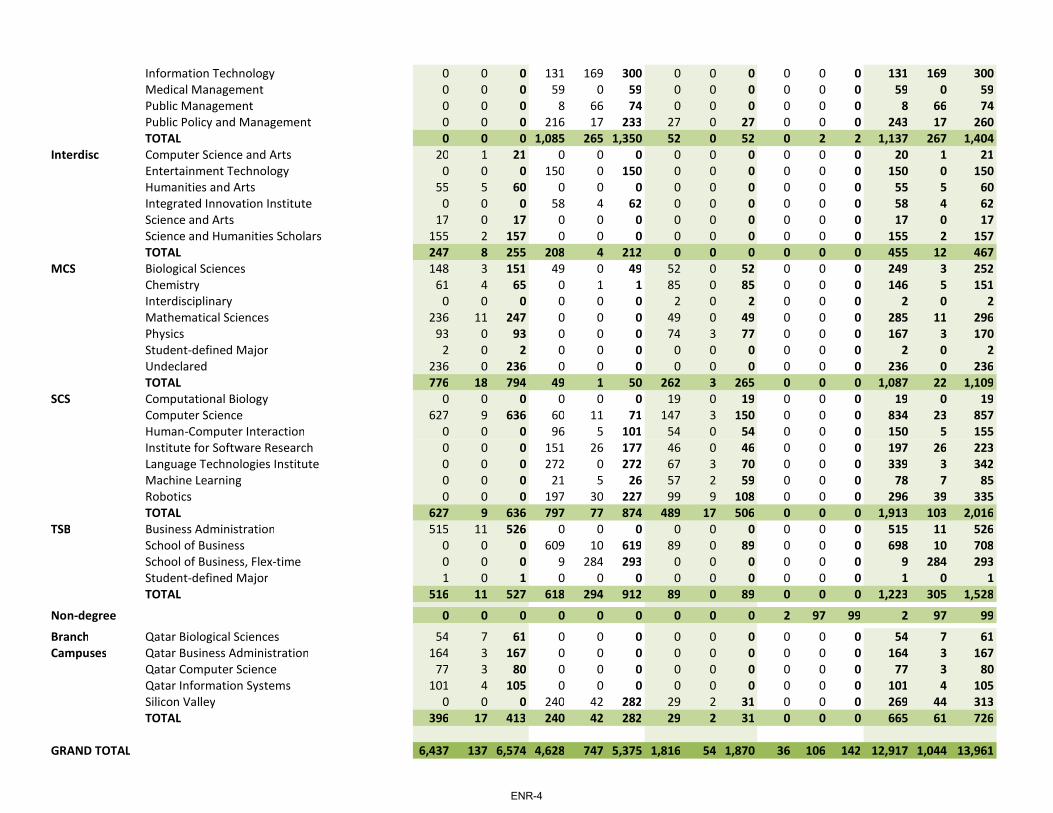
Information Technology 0 0 0 131 169 300 0 0 0 0 0 0 131 169 300Medical Management 0 0 0 59 0 59 0 0 0 0 0 0 59 0 59Public Management 0 0 0 8 66 74 0 0 0 0 0 0 8 66 74Public Policy and Management 0 0 0 216 17 233 27 0 27 0 0 0 243 17 260TOTAL 0 0 0 1,085 265 1,350 52 0 52 0 2 2 1,137 267 1,404
Interdisc Computer Science and Arts 20 1 21 0 0 0 0 0 0 0 0 0 20 1 21Entertainment Technology 0 0 0 150 0 150 0 0 0 0 0 0 150 0 150Humanities and Arts 55 5 60 0 0 0 0 0 0 0 0 0 55 5 60Integrated Innovation Institute 0 0 0 58 4 62 0 0 0 0 0 0 58 4 62Science and Arts 17 0 17 0 0 0 0 0 0 0 0 0 17 0 17Science and Humanities Scholars 155 2 157 0 0 0 0 0 0 0 0 0 155 2 157TOTAL 247 8 255 208 4 212 0 0 0 0 0 0 455 12 467
MCS Biological Sciences 148 3 151 49 0 49 52 0 52 0 0 0 249 3 252Chemistry 61 4 65 0 1 1 85 0 85 0 0 0 146 5 151Interdisciplinary 0 0 0 0 0 0 2 0 2 0 0 0 2 0 2Mathematical Sciences 236 11 247 0 0 0 49 0 49 0 0 0 285 11 296Physics 93 0 93 0 0 0 74 3 77 0 0 0 167 3 170Studentdefined Major 2 0 2 0 0 0 0 0 0 0 0 0 2 0 2Undeclared 236 0 236 0 0 0 0 0 0 0 0 0 236 0 236TOTAL 776 18 794 49 1 50 262 3 265 0 0 0 1,087 22 1,109
SCS Computational Biology 0 0 0 0 0 0 19 0 19 0 0 0 19 0 19Computer Science 627 9 636 60 11 71 147 3 150 0 0 0 834 23 857HumanComputer Interaction 0 0 0 96 5 101 54 0 54 0 0 0 150 5 155Institute for Software Research 0 0 0 151 26 177 46 0 46 0 0 0 197 26 223Language Technologies Institute 0 0 0 272 0 272 67 3 70 0 0 0 339 3 342Machine Learning 0 0 0 21 5 26 57 2 59 0 0 0 78 7 85Robotics 0 0 0 197 30 227 99 9 108 0 0 0 296 39 335TOTAL 627 9 636 797 77 874 489 17 506 0 0 0 1,913 103 2,016
TSB Business Administration 515 11 526 0 0 0 0 0 0 0 0 0 515 11 526School of Business 0 0 0 609 10 619 89 0 89 0 0 0 698 10 708School of Business, Flextime 0 0 0 9 284 293 0 0 0 0 0 0 9 284 293Studentdefined Major 1 0 1 0 0 0 0 0 0 0 0 0 1 0 1TOTAL 516 11 527 618 294 912 89 0 89 0 0 0 1,223 305 1,528
Nondegree 0 0 0 0 0 0 0 0 0 2 97 99 2 97 99
Branch Qatar Biological Sciences 54 7 61 0 0 0 0 0 0 0 0 0 54 7 61Campuses Qatar Business Administration 164 3 167 0 0 0 0 0 0 0 0 0 164 3 167
Qatar Computer Science 77 3 80 0 0 0 0 0 0 0 0 0 77 3 80Qatar Information Systems 101 4 105 0 0 0 0 0 0 0 0 0 101 4 105Silicon Valley 0 0 0 240 42 282 29 2 31 0 0 0 269 44 313TOTAL 396 17 413 240 42 282 29 2 31 0 0 0 665 61 726
GRAND TOTAL 6,437 137 6,574 4,628 747 5,375 1,816 54 1,870 36 106 142 12,917 1,044 13,961
ENR-4

Headcount Enrollment by College, Department, Level, and Sex Fall Semester 2016
Undergraduate Master's Doctoral Other TotalCollege Department M F T M F T M F T M F T M F TCFA Architecture 118 144 262 33 40 73 13 16 29 0 0 0 164 200 364
Art 34 119 153 8 8 16 0 0 0 0 0 0 42 127 169Design 52 101 153 11 39 50 7 5 12 0 0 0 70 145 215Drama 98 120 218 27 42 69 0 0 0 0 0 0 125 162 287Music 62 59 121 47 50 97 0 0 0 23 18 41 132 127 259Studentdefined Major 1 1 2 0 0 0 0 0 0 0 0 0 1 1 2Undeclared 6 4 10 0 0 0 0 0 0 0 0 0 6 4 10TOTAL 371 548 919 126 179 305 20 21 41 23 18 41 540 766 1,306
CIT Biomedical Engineering 0 0 0 41 38 79 15 19 34 0 0 0 56 57 113Chemical Engineering 102 124 226 63 29 92 58 32 90 0 0 0 223 185 408Civil and Environmental Engineering 42 45 87 105 75 180 45 16 61 0 0 0 192 136 328Electrical and Computer Engineering 405 147 552 201 124 325 195 44 239 0 0 0 801 315 1,116Engineering and Public Policy 0 0 0 0 0 0 56 23 79 0 0 0 56 23 79Information and Communication Tech 0 0 0 44 17 61 0 0 0 0 0 0 44 17 61Information Networking Institute 0 0 0 161 68 229 0 0 0 0 0 0 161 68 229Interdisciplinary 0 0 0 46 19 65 0 0 0 0 0 0 46 19 65Materials Science and Engineering 49 55 104 40 11 51 50 26 76 0 0 0 139 92 231Mechanical Engineering 299 117 416 182 29 211 87 23 110 0 0 0 568 169 737Undeclared 238 179 417 0 0 0 0 0 0 0 0 0 238 179 417TOTAL 1,135 667 1,802 883 410 1,293 506 183 689 0 0 0 2,524 1,260 3,784
DC Center for Neural Basis of Cognition 0 0 0 0 0 0 11 6 17 0 0 0 11 6 17Economics 43 25 68 0 0 0 0 0 0 0 0 0 43 25 68English 15 47 62 15 39 54 17 16 33 0 0 0 47 102 149History 12 19 31 0 0 0 12 7 19 0 0 0 24 26 50Institute for Politics and Strategy 12 21 33 0 0 0 0 0 0 0 0 0 12 21 33Interdisciplinary 124 89 213 0 0 0 0 0 0 0 0 0 124 89 213Modern Languages 2 3 5 5 3 8 2 8 10 0 0 0 9 14 23Philosophy 14 13 27 7 3 10 18 6 24 0 0 0 39 22 61Psychology 29 87 116 0 0 0 10 18 28 0 0 0 39 105 144Social and Decision Sciences 45 53 98 0 0 0 10 8 18 0 0 0 55 61 116Statistics 105 86 191 11 14 25 32 16 48 0 0 0 148 116 264Undeclared 186 198 384 0 0 0 0 0 0 0 0 0 186 198 384TOTAL 587 641 1,228 38 59 97 112 85 197 0 0 0 737 785 1,522
HC Creative Enterprise 0 0 0 32 81 113 0 0 0 0 0 0 32 81 113Health Care Policy 0 0 0 14 21 35 0 0 0 0 0 0 14 21 35Heinz General 0 0 0 6 4 10 2 4 6 1 1 2 9 9 18Information Security Policy and Mgmt 0 0 0 38 19 57 0 0 0 0 0 0 38 19 57Information Systems 0 0 0 243 226 469 10 9 19 0 0 0 253 235 488
ENR-5
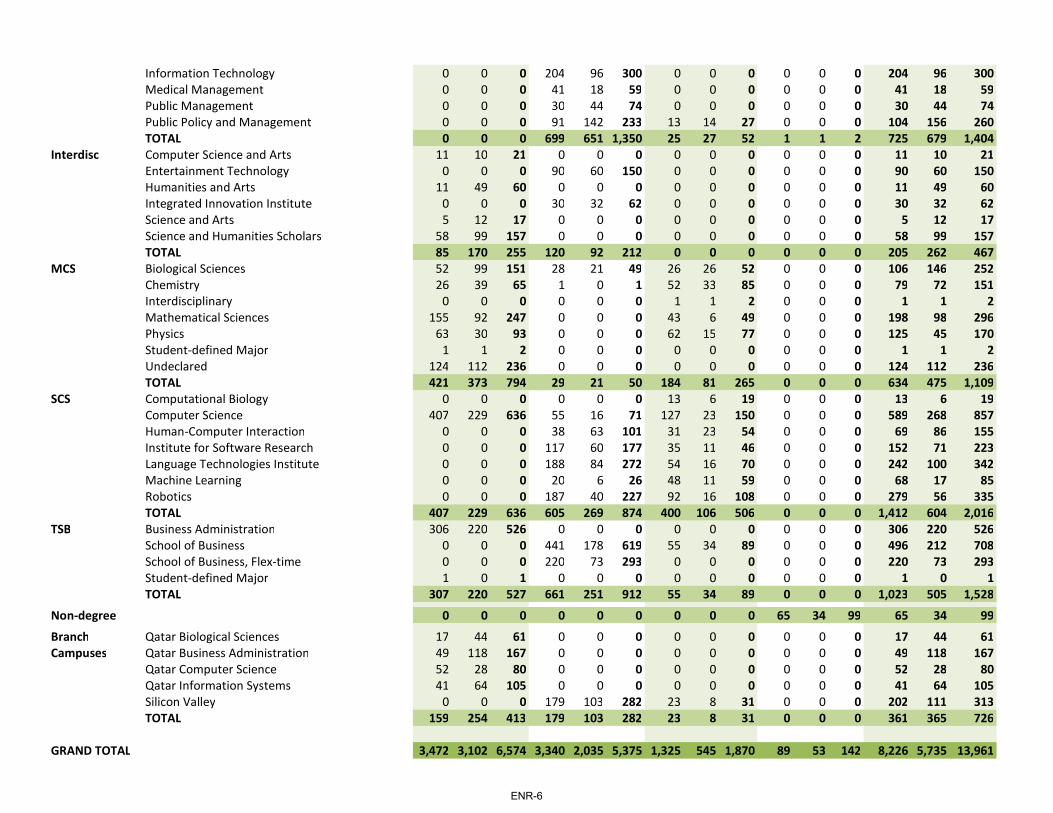
Information Technology 0 0 0 204 96 300 0 0 0 0 0 0 204 96 300Medical Management 0 0 0 41 18 59 0 0 0 0 0 0 41 18 59Public Management 0 0 0 30 44 74 0 0 0 0 0 0 30 44 74Public Policy and Management 0 0 0 91 142 233 13 14 27 0 0 0 104 156 260TOTAL 0 0 0 699 651 1,350 25 27 52 1 1 2 725 679 1,404
Interdisc Computer Science and Arts 11 10 21 0 0 0 0 0 0 0 0 0 11 10 21Entertainment Technology 0 0 0 90 60 150 0 0 0 0 0 0 90 60 150Humanities and Arts 11 49 60 0 0 0 0 0 0 0 0 0 11 49 60Integrated Innovation Institute 0 0 0 30 32 62 0 0 0 0 0 0 30 32 62Science and Arts 5 12 17 0 0 0 0 0 0 0 0 0 5 12 17Science and Humanities Scholars 58 99 157 0 0 0 0 0 0 0 0 0 58 99 157TOTAL 85 170 255 120 92 212 0 0 0 0 0 0 205 262 467
MCS Biological Sciences 52 99 151 28 21 49 26 26 52 0 0 0 106 146 252Chemistry 26 39 65 1 0 1 52 33 85 0 0 0 79 72 151Interdisciplinary 0 0 0 0 0 0 1 1 2 0 0 0 1 1 2Mathematical Sciences 155 92 247 0 0 0 43 6 49 0 0 0 198 98 296Physics 63 30 93 0 0 0 62 15 77 0 0 0 125 45 170Studentdefined Major 1 1 2 0 0 0 0 0 0 0 0 0 1 1 2Undeclared 124 112 236 0 0 0 0 0 0 0 0 0 124 112 236TOTAL 421 373 794 29 21 50 184 81 265 0 0 0 634 475 1,109
SCS Computational Biology 0 0 0 0 0 0 13 6 19 0 0 0 13 6 19Computer Science 407 229 636 55 16 71 127 23 150 0 0 0 589 268 857HumanComputer Interaction 0 0 0 38 63 101 31 23 54 0 0 0 69 86 155Institute for Software Research 0 0 0 117 60 177 35 11 46 0 0 0 152 71 223Language Technologies Institute 0 0 0 188 84 272 54 16 70 0 0 0 242 100 342Machine Learning 0 0 0 20 6 26 48 11 59 0 0 0 68 17 85Robotics 0 0 0 187 40 227 92 16 108 0 0 0 279 56 335TOTAL 407 229 636 605 269 874 400 106 506 0 0 0 1,412 604 2,016
TSB Business Administration 306 220 526 0 0 0 0 0 0 0 0 0 306 220 526School of Business 0 0 0 441 178 619 55 34 89 0 0 0 496 212 708School of Business, Flextime 0 0 0 220 73 293 0 0 0 0 0 0 220 73 293Studentdefined Major 1 0 1 0 0 0 0 0 0 0 0 0 1 0 1TOTAL 307 220 527 661 251 912 55 34 89 0 0 0 1,023 505 1,528
Nondegree 0 0 0 0 0 0 0 0 0 65 34 99 65 34 99
Branch Qatar Biological Sciences 17 44 61 0 0 0 0 0 0 0 0 0 17 44 61Campuses Qatar Business Administration 49 118 167 0 0 0 0 0 0 0 0 0 49 118 167
Qatar Computer Science 52 28 80 0 0 0 0 0 0 0 0 0 52 28 80Qatar Information Systems 41 64 105 0 0 0 0 0 0 0 0 0 41 64 105Silicon Valley 0 0 0 179 103 282 23 8 31 0 0 0 202 111 313TOTAL 159 254 413 179 103 282 23 8 31 0 0 0 361 365 726
GRAND TOTAL 3,472 3,102 6,574 3,340 2,035 5,375 1,325 545 1,870 89 53 142 8,226 5,735 13,961
ENR-6

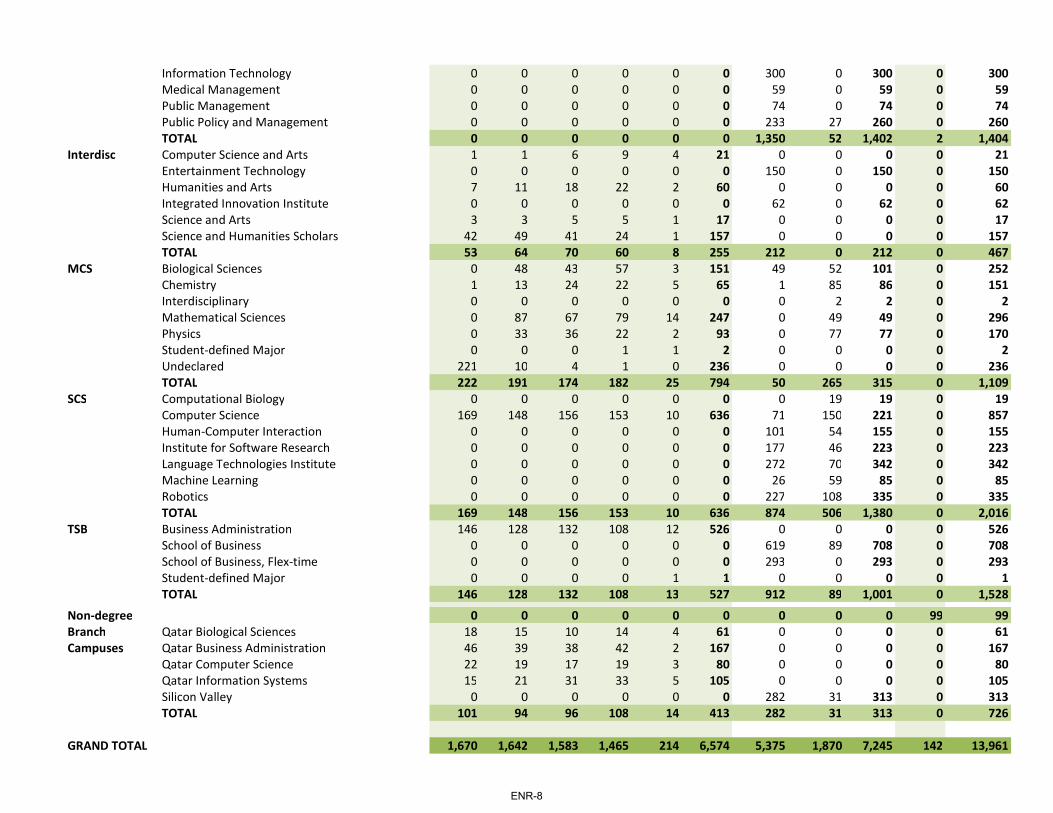
Headcount Enrollment by College, Department, Level, and Class Fall Semester 2016
Undergraduate Graduate Other TotalCollege Department FY Soph Jr Sr 5th Yr Total Master's Doctoral TotalCFA Architecture 73 59 46 38 46 262 73 29 102 0 364
Art 53 41 30 24 5 153 16 0 16 0 169Design 40 33 46 33 1 153 50 12 62 0 215Drama 56 56 51 54 1 218 69 0 69 0 287Music 28 39 28 23 3 121 97 0 97 41 259Studentdefined Major 0 0 0 2 0 2 0 0 0 0 2Undeclared 0 2 5 2 1 10 0 0 0 0 10TOTAL 250 230 206 176 57 919 305 41 346 41 1,306
CIT Biomedical Engineering 0 0 0 0 0 0 79 34 113 0 113Chemical Engineering 0 70 85 65 6 226 92 90 182 0 408Civil and Environmental Engineering 0 20 40 22 5 87 180 61 241 0 328Electrical and Computer Engineering 0 192 177 161 22 552 325 239 564 0 1,116Engineering and Public Policy 0 0 0 0 0 0 0 79 79 0 79Information and Communication Tech 0 0 0 0 0 0 61 0 61 0 61Information Networking Institute 0 0 0 0 0 0 229 0 229 0 229Interdisciplinary 0 0 0 0 0 0 65 0 65 0 65Materials Science and Engineering 0 31 38 33 2 104 51 76 127 0 231Mechanical Engineering 0 183 100 119 14 416 211 110 321 0 737Undeclared 406 6 2 2 1 417 0 0 0 0 417TOTAL 406 502 442 402 50 1,802 1,293 689 1,982 0 3,784
DC Center for Neural Basis of Cognition 0 0 0 0 0 0 0 17 17 0 17Economics 2 13 21 28 4 68 0 0 0 0 68English 0 14 21 21 6 62 54 33 87 0 149History 0 3 8 14 6 31 0 19 19 0 50Institute for Politics and Strategy 0 10 8 12 3 33 0 0 0 0 33Interdisciplinary 58 52 55 46 2 213 0 0 0 0 213Modern Languages 0 0 2 2 1 5 8 10 18 0 23Philosophy 0 5 7 13 2 27 10 24 34 0 61Psychology 1 20 49 43 3 116 0 28 28 0 144Social and Decision Sciences 0 8 41 41 8 98 0 18 18 0 116Statistics 1 42 90 56 2 191 25 48 73 0 264Undeclared 261 118 5 0 0 384 0 0 0 0 384TOTAL 323 285 307 276 37 1,228 97 197 294 0 1,522
HC Creative Enterprise 0 0 0 0 0 0 113 0 113 0 113Health Care Policy 0 0 0 0 0 0 35 0 35 0 35Heinz General 0 0 0 0 0 0 10 6 16 2 18Information Security Policy and Mgmt 0 0 0 0 0 0 57 0 57 0 57Information Systems 0 0 0 0 0 0 469 19 488 0 488
ENR-7
Information Technology 0 0 0 0 0 0 300 0 300 0 300Medical Management 0 0 0 0 0 0 59 0 59 0 59Public Management 0 0 0 0 0 0 74 0 74 0 74Public Policy and Management 0 0 0 0 0 0 233 27 260 0 260TOTAL 0 0 0 0 0 0 1,350 52 1,402 2 1,404
Interdisc Computer Science and Arts 1 1 6 9 4 21 0 0 0 0 21Entertainment Technology 0 0 0 0 0 0 150 0 150 0 150Humanities and Arts 7 11 18 22 2 60 0 0 0 0 60Integrated Innovation Institute 0 0 0 0 0 0 62 0 62 0 62Science and Arts 3 3 5 5 1 17 0 0 0 0 17Science and Humanities Scholars 42 49 41 24 1 157 0 0 0 0 157TOTAL 53 64 70 60 8 255 212 0 212 0 467
MCS Biological Sciences 0 48 43 57 3 151 49 52 101 0 252Chemistry 1 13 24 22 5 65 1 85 86 0 151Interdisciplinary 0 0 0 0 0 0 0 2 2 0 2Mathematical Sciences 0 87 67 79 14 247 0 49 49 0 296Physics 0 33 36 22 2 93 0 77 77 0 170Studentdefined Major 0 0 0 1 1 2 0 0 0 0 2Undeclared 221 10 4 1 0 236 0 0 0 0 236TOTAL 222 191 174 182 25 794 50 265 315 0 1,109
SCS Computational Biology 0 0 0 0 0 0 0 19 19 0 19Computer Science 169 148 156 153 10 636 71 150 221 0 857HumanComputer Interaction 0 0 0 0 0 0 101 54 155 0 155Institute for Software Research 0 0 0 0 0 0 177 46 223 0 223Language Technologies Institute 0 0 0 0 0 0 272 70 342 0 342Machine Learning 0 0 0 0 0 0 26 59 85 0 85Robotics 0 0 0 0 0 0 227 108 335 0 335TOTAL 169 148 156 153 10 636 874 506 1,380 0 2,016
TSB Business Administration 146 128 132 108 12 526 0 0 0 0 526School of Business 0 0 0 0 0 0 619 89 708 0 708School of Business, Flextime 0 0 0 0 0 0 293 0 293 0 293Studentdefined Major 0 0 0 0 1 1 0 0 0 0 1TOTAL 146 128 132 108 13 527 912 89 1,001 0 1,528
Nondegree 0 0 0 0 0 0 0 0 0 99 99Branch Qatar Biological Sciences 18 15 10 14 4 61 0 0 0 0 61Campuses Qatar Business Administration 46 39 38 42 2 167 0 0 0 0 167
Qatar Computer Science 22 19 17 19 3 80 0 0 0 0 80Qatar Information Systems 15 21 31 33 5 105 0 0 0 0 105Silicon Valley 0 0 0 0 0 0 282 31 313 0 313TOTAL 101 94 96 108 14 413 282 31 313 0 726
GRAND TOTAL 1,670 1,642 1,583 1,465 214 6,574 5,375 1,870 7,245 142 13,961
ENR-8

FTE Enrollment by College, Department, Level, and Class Fall Semester 2016
Undergraduate Graduate Other TotalCollege Department FY Soph Jr Sr 5th Yr Total Master's Doctoral TotalCFA Architecture 73.0 59.0 46.0 33.9 40.0 251.9 71.0 23.6 94.6 0 346.5
Art 53.0 40.8 27.5 24.0 4.0 149.3 16.0 0 16.0 0 165.3Design 40.0 33.0 44.0 32.5 1.0 150.5 48.9 11.1 60.0 0 210.5Drama 56.0 56.0 51.0 50.0 1.0 214.0 68.0 0 68.0 0 282.0Music 28.0 39.0 27.0 22.9 3.0 119.9 94.3 0 94.3 39.8 253.9Studentdefined Major 0 0 0 2.0 0 2.0 0 0 0 0 2.0Undeclared 0 1.9 5.0 2.0 1.0 9.9 0 0 0 0 9.9TOTAL 250.0 229.7 200.5 167.2 50.0 897.4 298.2 34.7 332.9 39.8 1,270.1
CIT Biomedical Engineering 0 0 0 0 0 0 77.8 33.1 110.9 0 110.9Chemical Engineering 0 70.0 85.0 63.6 5.5 224.1 88.7 90.0 178.7 0 402.8Civil and Environmental Engineering 0 20.0 40.0 22.0 5.0 87.0 178.8 59.3 238.1 0 325.1Electrical and Computer Engineering 0 191.9 176.3 159.5 20.3 548.0 320.1 235.4 555.5 0 1,103.5Engineering and Public Policy 0 0 0 0 0 0 0 75.4 75.4 0 75.4Information and Communication Tech 0 0 0 0 0 0 60.9 0 60.9 0 60.9Information Networking Institute 0 0 0 0 0 0 228.3 0 228.3 0 228.3Interdisciplinary 0 0 0 0 0 0 62.7 0 62.7 0 62.7Materials Science and Engineering 0 31.0 38.0 33.0 2.0 104.0 50.8 74.3 125.1 0 229.1Mechanical Engineering 0 182.0 97.8 118.0 14.0 411.8 207.4 105.7 313.1 0 724.8Undeclared 406.0 6.0 2.0 1.8 1.0 416.8 0 0 0 0 416.8TOTAL 406.0 500.9 439.1 397.9 47.8 1,791.7 1,275.4 673.2 1,948.6 0 3,740.3
DC Center for Neural Basis of Cognition 0 0 0 0 0 0 0 16.7 16.7 0 16.7Economics 2.0 13.0 21.0 27.8 4.0 67.8 0 0 0 0 67.8English 0 14.0 19.0 19.8 4.4 57.2 49.6 33.0 82.6 0 139.7History 0 3.0 8.0 13.3 4.9 29.2 0 17.3 17.3 0 46.4Institute for Politics and Strategy 0 10.0 8.0 12.0 3.0 33.0 0 0 0 0 33.0Interdisciplinary 58.0 52.0 52.0 44.9 2.0 208.9 0 0 0 0 208.9Modern Languages 0 0 1.0 2.0 1.0 4.0 8.0 10.0 18.0 0 22.0Philosophy 0 5.0 7.0 11.9 1.3 25.2 10.0 24.0 34.0 0 59.2Psychology 1.0 20.0 47.9 42.0 3.0 113.9 0 28.0 28.0 0 141.9Social and Decision Sciences 0 8.0 41.0 41.0 8.0 98.0 0 18.0 18.0 0 116.0Statistics 1.0 42.0 89.5 55.1 2.0 189.6 25.0 46.6 71.6 0 261.2Undeclared 261.0 117.3 5.0 0 0 383.3 0 0 0 0 383.3TOTAL 323.0 284.3 299.4 269.8 33.6 1,210.1 92.6 193.5 286.1 0 1,496.2
HC Creative Enterprise 0 0 0 0 0 0 111.5 0 111.5 0 111.5Health Care Policy 0 0 0 0 0 0 35.0 0 35.0 0 35.0Heinz General 0 0 0 0 0 0 1.9 6.0 7.9 0.5 8.4Information Security Policy and Mgmt 0 0 0 0 0 0 57.0 0 57.0 0 57.0Information Systems 0 0 0 0 0 0 469.0 19.0 488.0 0 488.0
ENR-9

Information Technology 0 0 0 0 0 0 194.2 0 194.2 0 194.2Medical Management 0 0 0 0 0 0 59.0 0 59.0 0 59.0Public Management 0 0 0 0 0 0 35.7 0 35.7 0 35.7Public Policy and Management 0 0 0 0 0 0 225.2 27.0 252.2 0 252.2TOTAL 0 0 0 0 0 0 1,188.4 52.0 1,240.4 0.5 1,240.9
Interdisc Computer Science and Arts 1.0 1.0 5.8 9.0 4.0 20.8 0 0 0 0 20.8Entertainment Technology 0 0 0 0 0 0 150.0 0 150.0 0 150.0Humanities and Arts 7.0 11.0 15.0 22.0 0.3 55.3 0 0 0 0 55.3Integrated Innovation Institute 0 0 0 0 0 0 60.5 0 60.5 0 60.5Science and Arts 3.0 3.0 5.0 5.0 1.0 17.0 0 0 0 0 17.0Science and Humanities Scholars 42.0 49.0 41.0 22.8 1.0 155.8 0 0 0 0 155.8TOTAL 53.0 64.0 66.8 58.8 6.3 248.9 210.5 0 210.5 0 459.4
MCS Biological Sciences 0 48.0 42.9 56.6 2.8 150.3 49.0 52.0 101.0 0 251.3Chemistry 1.0 13.0 23.9 21.9 3.9 63.7 0.5 85.0 85.5 0 149.1Interdisciplinary 0 0 0 0 0 0 0 2.0 2.0 0 2.0Mathematical Sciences 0 87.0 66.7 76.7 12.2 242.6 0 49.0 49.0 0 291.5Physics 0 33.0 36.0 22.0 2.0 93.0 0 74.4 74.4 0 167.4Studentdefined Major 0 0 0 1.0 1.0 2.0 0 0 0 0 2.0Undeclared 221.0 10.0 4.0 1.0 0 236.0 0 0 0 0 236.0TOTAL 222.0 191.0 173.5 179.2 21.8 787.5 49.5 262.4 311.9 0 1,099.4
SCS Computational Biology 0 0 0 0 0 0 0 19.0 19.0 0 19.0Computer Science 169.0 148.0 155.3 150.4 9.0 631.7 67.7 147.3 215.0 0 846.7HumanComputer Interaction 0 0 0 0 0 0 98.5 54.0 152.5 0 152.5Institute for Software Research 0 0 0 0 0 0 163.8 46.0 209.8 0 209.8Language Technologies Institute 0 0 0 0 0 0 272.0 67.4 339.4 0 339.4Machine Learning 0 0 0 0 0 0 24.8 58.0 82.8 0 82.8Robotics 0 0 0 0 0 0 222.6 100.2 322.8 0 322.8TOTAL 169.0 148.0 155.3 150.4 9.0 631.7 849.5 491.9 1,341.4 0 1,973.1
TSB Business Administration 146.0 128.0 128.0 106.0 8.9 516.9 0 0 0 0 516.9School of Business 0 0 0 0 0 0 614.0 89.0 703.0 0 703.0School of Business, Flextime 0 0 0 0 0 0 200.0 0 200.0 0 200.0Studentdefined Major 0 0 0 0 1.0 1.0 0 0 0 0 1.0TOTAL 146.0 128.0 128.0 106.0 9.9 517.9 814.0 89.0 903.0 0 1,420.9
Nondegree 0 0 0 0 0 0 0 0 0 34.1 34.1Branch Qatar Biological Sciences 18.0 15.0 10.0 13.1 3.0 59.1 0 0 0 0 59.1Campuses Qatar Business Administration 46.0 39.0 38.0 41.8 0.8 165.6 0 0 0 0 165.5
Qatar Computer Science 22.0 19.0 17.0 19.0 1.9 78.9 0 0 0 0 78.9Qatar Information Systems 15.0 21.0 31.0 32.7 2.3 102.0 0 0 0 0 102.1Silicon Valley 0 0 0 0 0 0 260.3 29.7 290.0 0 290.0TOTAL 101.0 94.0 96.0 106.6 8.1 405.7 260.3 29.7 290.0 0 695.6
GRAND TOTAL 1,670.0 1,639.9 1,558.7 1,435.9 186.3 6,490.8 5,038.5 1,826.4 6,864.9 74.3 13,430.1
ENR-10
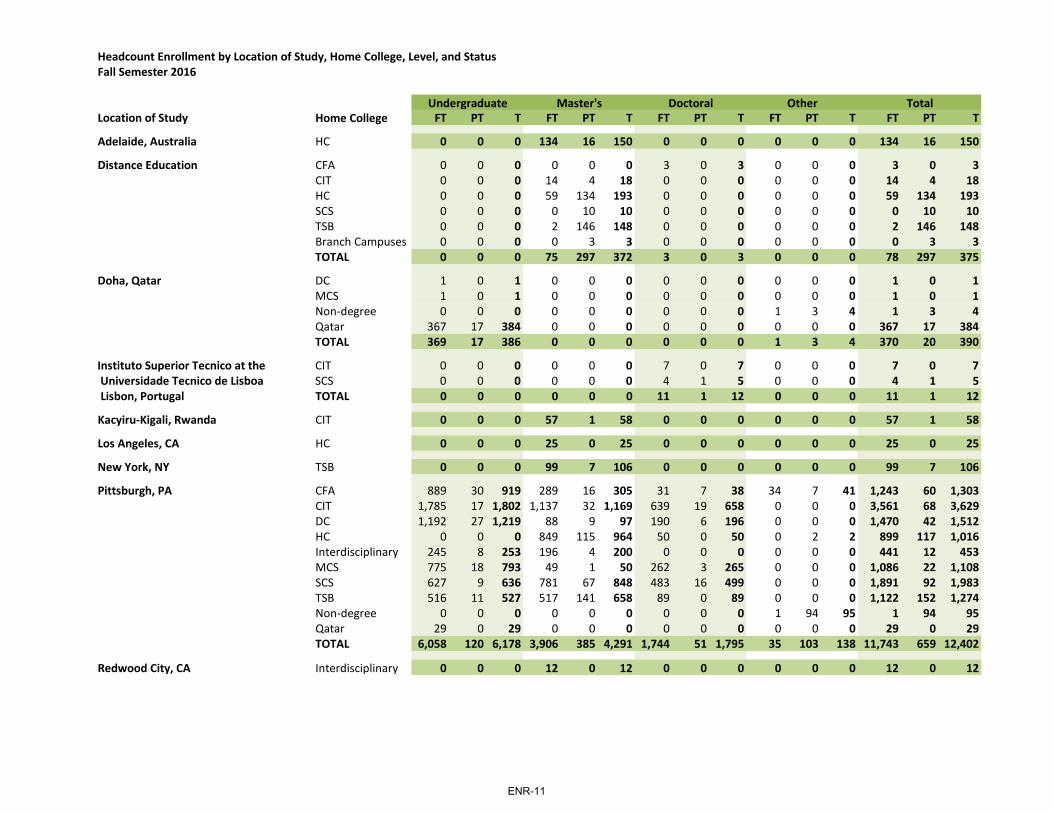
Headcount Enrollment by Location of Study, Home College, Level, and Status Fall Semester 2016
Undergraduate Master's Doctoral Other TotalLocation of Study Home College FT PT T FT PT T FT PT T FT PT T FT PT T
Adelaide, Australia HC 0 0 0 134 16 150 0 0 0 0 0 0 134 16 150
Distance Education CFA 0 0 0 0 0 0 3 0 3 0 0 0 3 0 3CIT 0 0 0 14 4 18 0 0 0 0 0 0 14 4 18HC 0 0 0 59 134 193 0 0 0 0 0 0 59 134 193SCS 0 0 0 0 10 10 0 0 0 0 0 0 0 10 10TSB 0 0 0 2 146 148 0 0 0 0 0 0 2 146 148Branch Campuses 0 0 0 0 3 3 0 0 0 0 0 0 0 3 3TOTAL 0 0 0 75 297 372 3 0 3 0 0 0 78 297 375
Doha, Qatar DC 1 0 1 0 0 0 0 0 0 0 0 0 1 0 1MCS 1 0 1 0 0 0 0 0 0 0 0 0 1 0 1Non‐degree 0 0 0 0 0 0 0 0 0 1 3 4 1 3 4Qatar 367 17 384 0 0 0 0 0 0 0 0 0 367 17 384TOTAL 369 17 386 0 0 0 0 0 0 1 3 4 370 20 390
Instituto Superior Tecnico at the CIT 0 0 0 0 0 0 7 0 7 0 0 0 7 0 7 Universidade Tecnico de Lisboa SCS 0 0 0 0 0 0 4 1 5 0 0 0 4 1 5Lisbon, Portugal TOTAL 0 0 0 0 0 0 11 1 12 0 0 0 11 1 12
Kacyiru‐Kigali, Rwanda CIT 0 0 0 57 1 58 0 0 0 0 0 0 57 1 58
Los Angeles, CA HC 0 0 0 25 0 25 0 0 0 0 0 0 25 0 25
New York, NY TSB 0 0 0 99 7 106 0 0 0 0 0 0 99 7 106
Pittsburgh, PA CFA 889 30 919 289 16 305 31 7 38 34 7 41 1,243 60 1,303CIT 1,785 17 1,802 1,137 32 1,169 639 19 658 0 0 0 3,561 68 3,629DC 1,192 27 1,219 88 9 97 190 6 196 0 0 0 1,470 42 1,512HC 0 0 0 849 115 964 50 0 50 0 2 2 899 117 1,016Interdisciplinary 245 8 253 196 4 200 0 0 0 0 0 0 441 12 453MCS 775 18 793 49 1 50 262 3 265 0 0 0 1,086 22 1,108SCS 627 9 636 781 67 848 483 16 499 0 0 0 1,891 92 1,983TSB 516 11 527 517 141 658 89 0 89 0 0 0 1,122 152 1,274Non‐degree 0 0 0 0 0 0 0 0 0 1 94 95 1 94 95Qatar 29 0 29 0 0 0 0 0 0 0 0 0 29 0 29TOTAL 6,058 120 6,178 3,906 385 4,291 1,744 51 1,795 35 103 138 11,743 659 12,402
Redwood City, CA Interdisciplinary 0 0 0 12 0 12 0 0 0 0 0 0 12 0 12
ENR-11
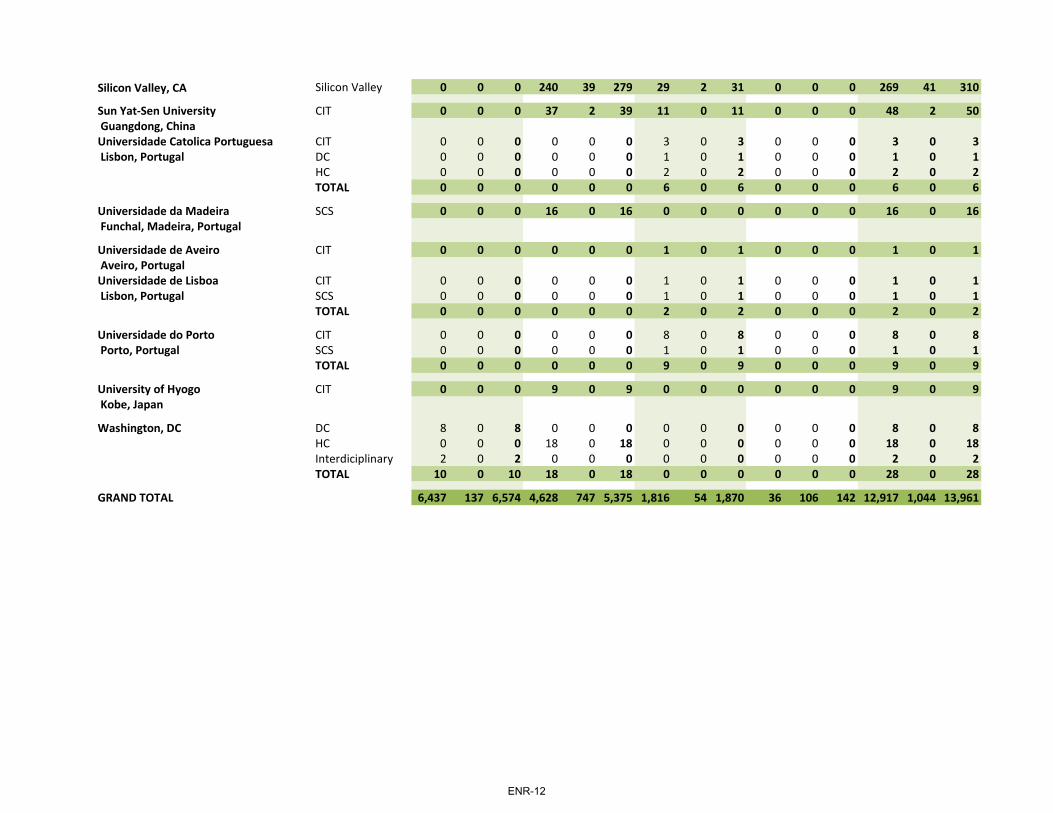
Silicon Valley, CA Silicon Valley 0 0 0 240 39 279 29 2 31 0 0 0 269 41 310
Sun Yat‐Sen University CIT 0 0 0 37 2 39 11 0 11 0 0 0 48 2 50 Guangdong, ChinaUniversidade Catolica Portuguesa CIT 0 0 0 0 0 0 3 0 3 0 0 0 3 0 3 Lisbon, Portugal DC 0 0 0 0 0 0 1 0 1 0 0 0 1 0 1
HC 0 0 0 0 0 0 2 0 2 0 0 0 2 0 2TOTAL 0 0 0 0 0 0 6 0 6 0 0 0 6 0 6
Universidade da Madeira SCS 0 0 0 16 0 16 0 0 0 0 0 0 16 0 16 Funchal, Madeira, Portugal
Universidade de Aveiro CIT 0 0 0 0 0 0 1 0 1 0 0 0 1 0 1 Aveiro, PortugalUniversidade de Lisboa CIT 0 0 0 0 0 0 1 0 1 0 0 0 1 0 1 Lisbon, Portugal SCS 0 0 0 0 0 0 1 0 1 0 0 0 1 0 1
TOTAL 0 0 0 0 0 0 2 0 2 0 0 0 2 0 2
Universidade do Porto CIT 0 0 0 0 0 0 8 0 8 0 0 0 8 0 8 Porto, Portugal SCS 0 0 0 0 0 0 1 0 1 0 0 0 1 0 1
TOTAL 0 0 0 0 0 0 9 0 9 0 0 0 9 0 9
University of Hyogo CIT 0 0 0 9 0 9 0 0 0 0 0 0 9 0 9 Kobe, Japan
Washington, DC DC 8 0 8 0 0 0 0 0 0 0 0 0 8 0 8HC 0 0 0 18 0 18 0 0 0 0 0 0 18 0 18Interdiciplinary 2 0 2 0 0 0 0 0 0 0 0 0 2 0 2TOTAL 10 0 10 18 0 18 0 0 0 0 0 0 28 0 28
GRAND TOTAL 6,437 137 6,574 4,628 747 5,375 1,816 54 1,870 36 106 142 12,917 1,044 13,961
ENR-12
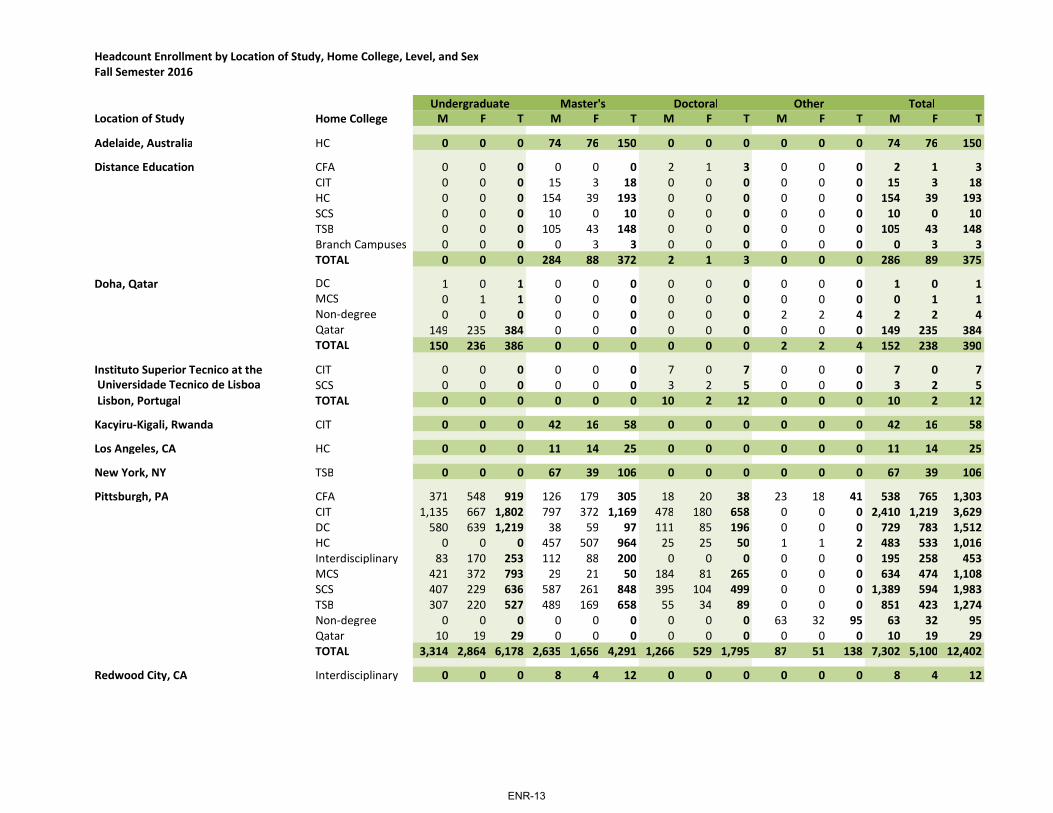
Headcount Enrollment by Location of Study, Home College, Level, and SexFall Semester 2016
Undergraduate Master's Doctoral Other TotalLocation of Study Home College M F T M F T M F T M F T M F T
Adelaide, Australia HC 0 0 0 74 76 150 0 0 0 0 0 0 74 76 150
Distance Education CFA 0 0 0 0 0 0 2 1 3 0 0 0 2 1 3CIT 0 0 0 15 3 18 0 0 0 0 0 0 15 3 18HC 0 0 0 154 39 193 0 0 0 0 0 0 154 39 193SCS 0 0 0 10 0 10 0 0 0 0 0 0 10 0 10TSB 0 0 0 105 43 148 0 0 0 0 0 0 105 43 148Branch Campuses 0 0 0 0 3 3 0 0 0 0 0 0 0 3 3TOTAL 0 0 0 284 88 372 2 1 3 0 0 0 286 89 375
Doha, Qatar DC 1 0 1 0 0 0 0 0 0 0 0 0 1 0 1MCS 0 1 1 0 0 0 0 0 0 0 0 0 0 1 1Nondegree 0 0 0 0 0 0 0 0 0 2 2 4 2 2 4Qatar 149 235 384 0 0 0 0 0 0 0 0 0 149 235 384TOTAL 150 236 386 0 0 0 0 0 0 2 2 4 152 238 390
Instituto Superior Tecnico at the CIT 0 0 0 0 0 0 7 0 7 0 0 0 7 0 7 Universidade Tecnico de Lisboa SCS 0 0 0 0 0 0 3 2 5 0 0 0 3 2 5 Lisbon, Portugal TOTAL 0 0 0 0 0 0 10 2 12 0 0 0 10 2 12
KacyiruKigali, Rwanda CIT 0 0 0 42 16 58 0 0 0 0 0 0 42 16 58
Los Angeles, CA HC 0 0 0 11 14 25 0 0 0 0 0 0 11 14 25
New York, NY TSB 0 0 0 67 39 106 0 0 0 0 0 0 67 39 106
Pittsburgh, PA CFA 371 548 919 126 179 305 18 20 38 23 18 41 538 765 1,303CIT 1,135 667 1,802 797 372 1,169 478 180 658 0 0 0 2,410 1,219 3,629DC 580 639 1,219 38 59 97 111 85 196 0 0 0 729 783 1,512HC 0 0 0 457 507 964 25 25 50 1 1 2 483 533 1,016Interdisciplinary 83 170 253 112 88 200 0 0 0 0 0 0 195 258 453MCS 421 372 793 29 21 50 184 81 265 0 0 0 634 474 1,108SCS 407 229 636 587 261 848 395 104 499 0 0 0 1,389 594 1,983TSB 307 220 527 489 169 658 55 34 89 0 0 0 851 423 1,274Nondegree 0 0 0 0 0 0 0 0 0 63 32 95 63 32 95Qatar 10 19 29 0 0 0 0 0 0 0 0 0 10 19 29TOTAL 3,314 2,864 6,178 2,635 1,656 4,291 1,266 529 1,795 87 51 138 7,302 5,100 12,402
Redwood City, CA Interdisciplinary 0 0 0 8 4 12 0 0 0 0 0 0 8 4 12
ENR-13

Silicon Valley, CA Silicon Valley 0 0 0 179 100 279 23 8 31 0 0 0 202 108 310
Sun YatSen University CIT 0 0 0 24 15 39 9 2 11 0 0 0 33 17 50 Guangdong, ChinaUniversidade Catolica Portuguesa CIT 0 0 0 0 0 0 3 0 3 0 0 0 3 0 3 Lisbon, Portugal DC 0 0 0 0 0 0 1 0 1 0 0 0 1 0 1
HC 0 0 0 0 0 0 0 2 2 0 0 0 0 2 2TOTAL 0 0 0 0 0 0 4 2 6 0 0 0 4 2 6
Universidade da Madeira SCS 0 0 0 8 8 16 0 0 0 0 0 0 8 8 16 Funchal, Madeira, Portugal
Universidade de Aveiro CIT 0 0 0 0 0 0 1 0 1 0 0 0 1 0 1 Aveiro, PortugalUniversidade de Lisboa CIT 0 0 0 0 0 0 1 0 1 0 0 0 1 0 1
SCS 0 0 0 0 0 0 1 0 1 0 0 0 1 0 1TOTAL 0 0 0 0 0 0 2 0 2 0 0 0 2 0 2
Universidade do Porto CIT 0 0 0 0 0 0 7 1 8 0 0 0 7 1 8 Porto, Portugal SCS 0 0 0 0 0 0 1 0 1 0 0 0 1 0 1
TOTAL 0 0 0 0 0 0 8 1 9 0 0 0 8 1 9
University of Hyogo CIT 0 0 0 5 4 9 0 0 0 0 0 0 5 4 9 Kobe, Japan
Washington, DC DC 6 2 8 0 0 0 0 0 0 0 0 0 6 2 8HC 0 0 0 3 15 18 0 0 0 0 0 0 3 15 18Interdiciplinary 2 0 2 0 0 0 0 0 0 0 0 0 2 0 2TOTAL 8 2 10 3 15 18 0 0 0 0 0 0 11 17 28
GRAND TOTAL 3,472 3,102 6,574 3,340 2,035 5,375 1,325 545 1,870 89 53 142 8,226 5,735 13,961
ENR-14
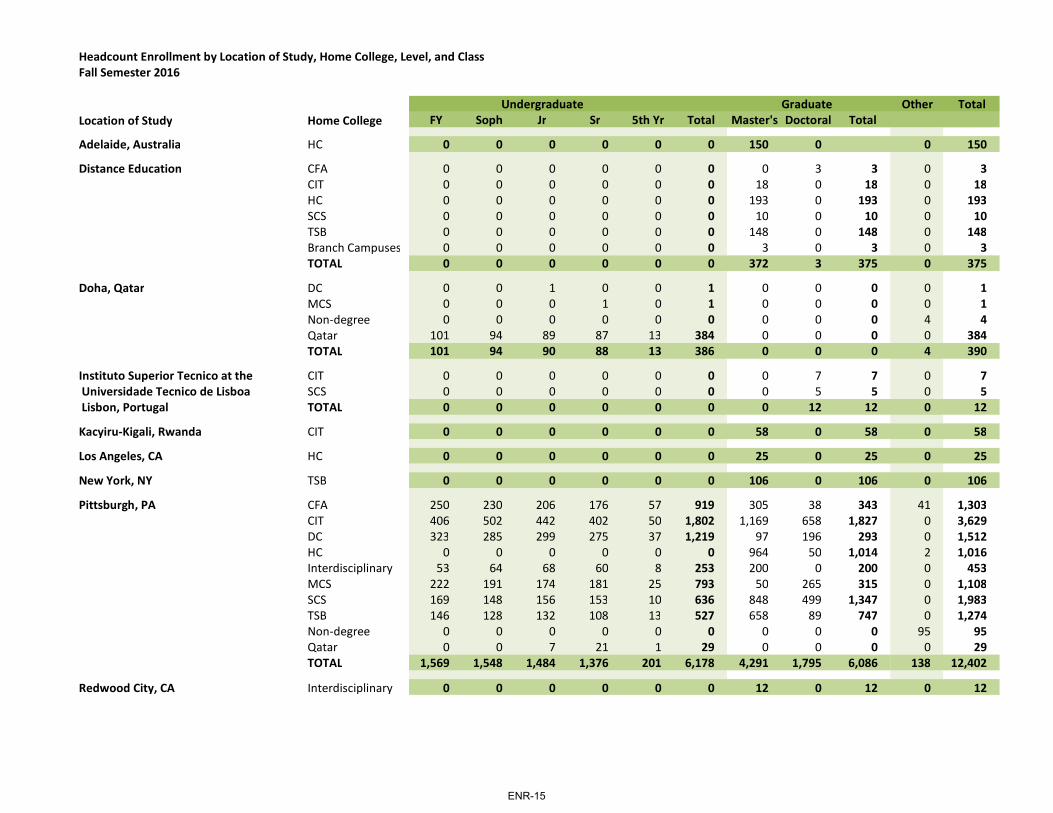
Headcount Enrollment by Location of Study, Home College, Level, and Class Fall Semester 2016
Undergraduate Graduate Other TotalLocation of Study Home College FY Soph Jr Sr 5th Yr Total Master's Doctoral Total
Adelaide, Australia HC 0 0 0 0 0 0 150 0 0 150
Distance Education CFA 0 0 0 0 0 0 0 3 3 0 3CIT 0 0 0 0 0 0 18 0 18 0 18HC 0 0 0 0 0 0 193 0 193 0 193SCS 0 0 0 0 0 0 10 0 10 0 10TSB 0 0 0 0 0 0 148 0 148 0 148Branch Campuses 0 0 0 0 0 0 3 0 3 0 3TOTAL 0 0 0 0 0 0 372 3 375 0 375
Doha, Qatar DC 0 0 1 0 0 1 0 0 0 0 1MCS 0 0 0 1 0 1 0 0 0 0 1Nondegree 0 0 0 0 0 0 0 0 0 4 4Qatar 101 94 89 87 13 384 0 0 0 0 384TOTAL 101 94 90 88 13 386 0 0 0 4 390
Instituto Superior Tecnico at the CIT 0 0 0 0 0 0 0 7 7 0 7 Universidade Tecnico de Lisboa SCS 0 0 0 0 0 0 0 5 5 0 5 Lisbon, Portugal TOTAL 0 0 0 0 0 0 0 12 12 0 12
KacyiruKigali, Rwanda CIT 0 0 0 0 0 0 58 0 58 0 58
Los Angeles, CA HC 0 0 0 0 0 0 25 0 25 0 25
New York, NY TSB 0 0 0 0 0 0 106 0 106 0 106
Pittsburgh, PA CFA 250 230 206 176 57 919 305 38 343 41 1,303CIT 406 502 442 402 50 1,802 1,169 658 1,827 0 3,629DC 323 285 299 275 37 1,219 97 196 293 0 1,512HC 0 0 0 0 0 0 964 50 1,014 2 1,016Interdisciplinary 53 64 68 60 8 253 200 0 200 0 453MCS 222 191 174 181 25 793 50 265 315 0 1,108SCS 169 148 156 153 10 636 848 499 1,347 0 1,983TSB 146 128 132 108 13 527 658 89 747 0 1,274Nondegree 0 0 0 0 0 0 0 0 0 95 95Qatar 0 0 7 21 1 29 0 0 0 0 29TOTAL 1,569 1,548 1,484 1,376 201 6,178 4,291 1,795 6,086 138 12,402
Redwood City, CA Interdisciplinary 0 0 0 0 0 0 12 0 12 0 12
ENR-15
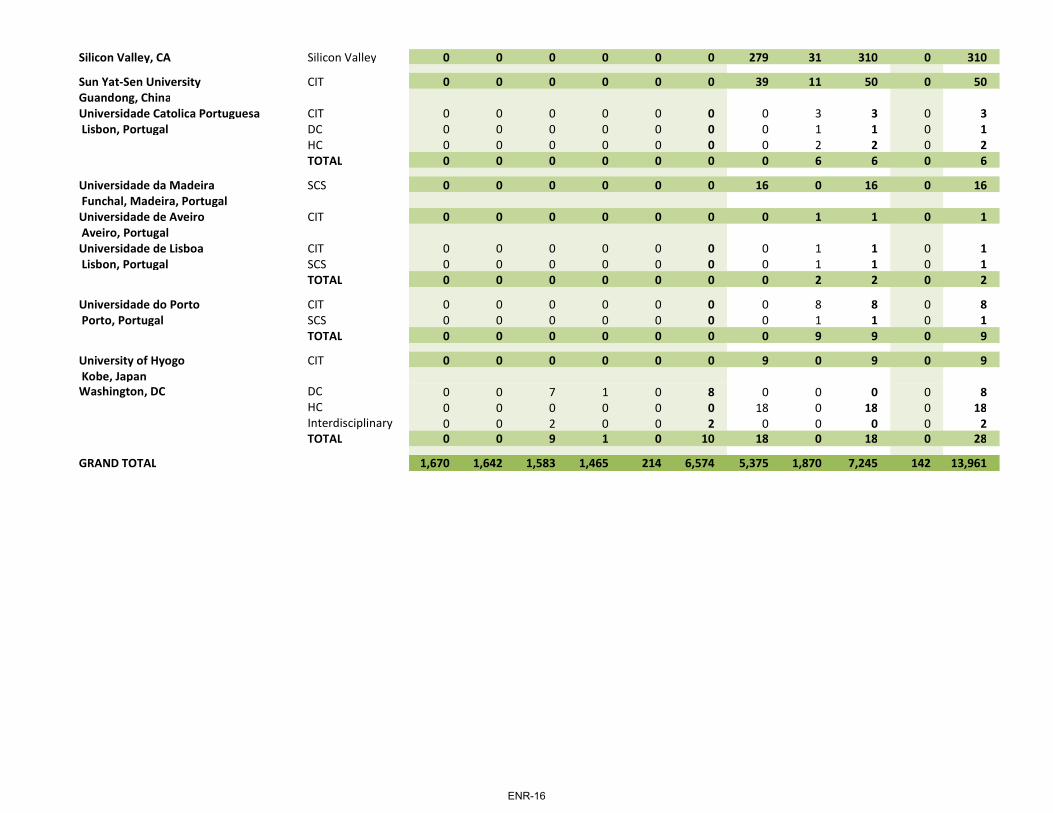
Silicon Valley, CA Silicon Valley 0 0 0 0 0 0 279 31 310 0 310
Sun YatSen University CIT 0 0 0 0 0 0 39 11 50 0 50Guandong, ChinaUniversidade Catolica Portuguesa CIT 0 0 0 0 0 0 0 3 3 0 3 Lisbon, Portugal DC 0 0 0 0 0 0 0 1 1 0 1
HC 0 0 0 0 0 0 0 2 2 0 2TOTAL 0 0 0 0 0 0 0 6 6 0 6
Universidade da Madeira SCS 0 0 0 0 0 0 16 0 16 0 16 Funchal, Madeira, PortugalUniversidade de Aveiro CIT 0 0 0 0 0 0 0 1 1 0 1 Aveiro, PortugalUniversidade de Lisboa CIT 0 0 0 0 0 0 0 1 1 0 1 Lisbon, Portugal SCS 0 0 0 0 0 0 0 1 1 0 1
TOTAL 0 0 0 0 0 0 0 2 2 0 2
Universidade do Porto CIT 0 0 0 0 0 0 0 8 8 0 8 Porto, Portugal SCS 0 0 0 0 0 0 0 1 1 0 1
TOTAL 0 0 0 0 0 0 0 9 9 0 9
University of Hyogo CIT 0 0 0 0 0 0 9 0 9 0 9 Kobe, JapanWashington, DC DC 0 0 7 1 0 8 0 0 0 0 8
HC 0 0 0 0 0 0 18 0 18 0 18Interdisciplinary 0 0 2 0 0 2 0 0 0 0 2TOTAL 0 0 9 1 0 10 18 0 18 0 28
GRAND TOTAL 1,670 1,642 1,583 1,465 214 6,574 5,375 1,870 7,245 142 13,961
ENR-16

FTE Enrollment by Location of Study, Home College, Level, and Class Fall Semester 2016
Undergraduate Graduate Other TotalLocation of Study Home College FY Soph Jr Sr 5th Yr Total Master's Doctoral Total
Adelaide, Australia HC 0 0 0 0 0 0 143.0 0 143.0 0 143.0
Distance Education CFA 0 0 0 0 0 0 0.0 3.0 3.0 0 3.0CIT 0 0 0 0 0 0 16.4 0 16.4 0 16.4HC 0 0 0 0 0 0 107.2 0 107.2 0 107.2SCS 0 0 0 0 0 0 4.2 0 4.2 0 4.2TSB 0 0 0 0 0 0 97.5 0 97.5 0 97.5Branch Campuses 0 0 0 0 0 0 1.5 0 1.5 0 1.5TOTAL 0 0 0 0 0 0 226.8 3.0 229.8 0 229.8
Doha, Qatar DC 0 0 1.0 0 0 1.0 0 0 0 0 1.0MCS 0 0 0 1.0 0 1.0 0 0 0 0 1.0Nondegree 0 0 0 0 0 0 0 0 0 2.4 2.4Qatar 101.0 94.0 89.0 85.6 7.1 376.7 0 0 0 0 376.7TOTAL 101.0 94.0 90.0 86.6 7.1 378.7 0 0 0 2.4 381.0
Instituto Superior Tecnico at the CIT 0 0 0 0 0 0 0 7.0 7.0 0 7.0 Universidade Tecnico de Lisboa SCS 0 0 0 0 0 0 0 4.1 4.1 0 4.1 Lisbon, Portugal TOTAL 0 0 0 0 0 0 0 11.1 11.1 0 11.1
KacyiruKigali, Rwanda CIT 0 0 0 0 0 0 57.9 0 57.9 0 57.9
Los Angeles, CA HC 0 0 0 0 0 0 25.0 0 25.0 0 25.0
New York, NY TSB 0 0 0 0 0 0 103.0 0 103.0 0 103.0
Pittsburgh, PA CFA 250.0 229.7 200.5 167.2 50.0 897.4 298.2 31.7 329.9 39.8 1,267.1CIT 406.0 500.9 439.1 397.9 47.8 1,791.7 1,153.8 642.2 1,796.0 0 3,587.6DC 323.0 284.3 291.4 268.8 33.6 1,201.1 92.6 192.5 285.1 0 1,486.2HC 0 0 0 0 0 0 895.2 50.0 945.2 0.5 945.7Interdisciplinary 53.0 64.0 64.8 58.8 6.3 246.9 198.5 0 198.5 0 445.4MCS 222.0 191.0 173.5 178.2 21.8 786.5 49.5 262.4 311.9 0 1,098.4SCS 169.0 148.0 155.3 150.4 9.0 631.7 829.3 485.7 1,315.0 0 1,946.8TSB 146.0 128.0 128.0 106.0 9.9 517.9 613.5 89.0 702.5 0 1,220.4Nondegree 0 0 0 0 0 0.0 0 0 0.0 31.7 31.7Qatar 0 0 7.0 21.0 1.0 29.0 0 0 0.0 0 29.0TOTAL 1,569.0 1,545.9 1,459.7 1,348.3 179.2 6,102.2 4,130.6 1,753.6 5,884.1 72.0 12,058.4
Redwood City, CA Interdisciplinary 0 0 0 0 0 0 12.0 0 12.0 0 12.0
ENR-17

Silicon Valley, CA Silicon Valley 0 0 0 0 0 0 258.8 29.7 288.5 0 288.5
Sun YatSen University CIT 0 0 0 0 0 0 38.3 11.0 49.3 0 49.3Guandong, ChinaUniversidade Catolica Portuguesa CIT 0 0 0 0 0 0 0 3.0 3.0 0 3.0 Lisbon, Portugal DC 0 0 0 0 0 0 0 1.0 1.0 0 1.0
HC 0 0 0 0 0 0 0 2.0 2.0 0 2.0TOTAL 0 0 0 0 0 0 0 6.0 6.0 0 6.0
Universidade da Madeira SCS 0 0 0 0 0 0 16.0 0 16.0 0 16.0 Funchal, Madeira, PortugalUniversidade de Aveiro CIT 0 0 0 0 0 0 0 1.0 1.0 0 1.0 Aveiro, PortugalUniversidade de Lisboa CIT 0 0 0 0 0 0 0 1.0 1.0 0 1.0 Lisbon, Portugal SCS 0 0 0 0 0 0 0 1.0 1.0 0 1.0
TOTAL 0 0 0 0 0 0 0 2.0 2.0 0 2.0
Universidade do Porto CIT 0 0 0 0 0 0 0 8.0 8.0 0 8.0 Porto, Portugal SCS 0 0 0 0 0 0 0 1.0 1.0 0 1.0
TOTAL 0 0 0 0 0 0 0 9.0 9.0 0 9.0
University of Hyogo CIT 0 0 0 0 0 0 9.0 0 9.0 0 9.0 Kobe, JapanWashington, DC DC 0 0 7.0 1.0 0 8.0 0 0 0 0 8.0
HC 0 0 0 0 0 0 18.0 0 18.0 0 18.0Interdisciplinary 0 0 2.0 0 0 2.0 0 0 0 0 2.0TOTAL 0 0 9.0 1.0 0 10.0 18.0 0 18.0 0 28.0
GRAND TOTAL 1,670.0 1,639.9 1,558.7 1,435.9 186.3 6,490.8 5,038.5 1,826.4 6,864.9 74.3 13,430.1
ENR-18
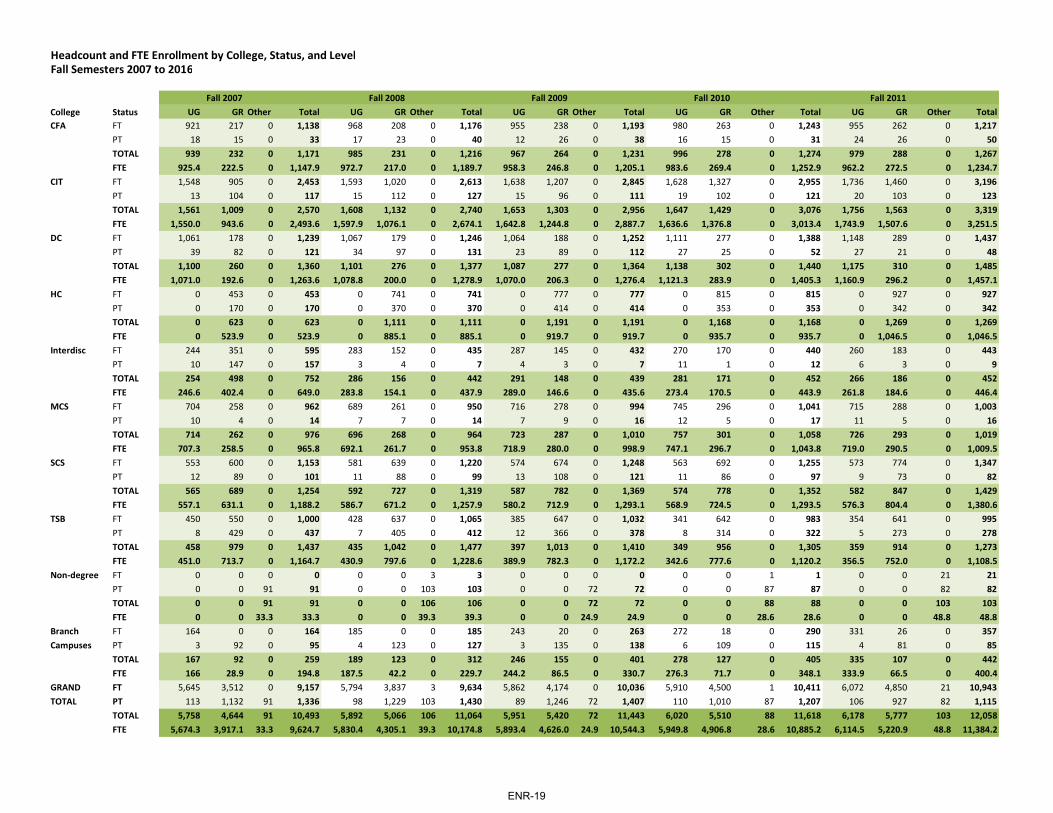
Headcount and FTE Enrollment by College, Status, and LevelFall Semesters 2007 to 2016
Fall 2007 Fall 2008 Fall 2009 Fall 2010 Fall 2011College Status UG GR Other Total UG GR Other Total UG GR Other Total UG GR Other Total UG GR Other TotalCFA FT 921 217 0 1,138 968 208 0 1,176 955 238 0 1,193 980 263 0 1,243 955 262 0 1,217
PT 18 15 0 33 17 23 0 40 12 26 0 38 16 15 0 31 24 26 0 50TOTAL 939 232 0 1,171 985 231 0 1,216 967 264 0 1,231 996 278 0 1,274 979 288 0 1,267FTE 925.4 222.5 0 1,147.9 972.7 217.0 0 1,189.7 958.3 246.8 0 1,205.1 983.6 269.4 0 1,252.9 962.2 272.5 0 1,234.7
CIT FT 1,548 905 0 2,453 1,593 1,020 0 2,613 1,638 1,207 0 2,845 1,628 1,327 0 2,955 1,736 1,460 0 3,196PT 13 104 0 117 15 112 0 127 15 96 0 111 19 102 0 121 20 103 0 123TOTAL 1,561 1,009 0 2,570 1,608 1,132 0 2,740 1,653 1,303 0 2,956 1,647 1,429 0 3,076 1,756 1,563 0 3,319FTE 1,550.0 943.6 0 2,493.6 1,597.9 1,076.1 0 2,674.1 1,642.8 1,244.8 0 2,887.7 1,636.6 1,376.8 0 3,013.4 1,743.9 1,507.6 0 3,251.5
DC FT 1,061 178 0 1,239 1,067 179 0 1,246 1,064 188 0 1,252 1,111 277 0 1,388 1,148 289 0 1,437PT 39 82 0 121 34 97 0 131 23 89 0 112 27 25 0 52 27 21 0 48TOTAL 1,100 260 0 1,360 1,101 276 0 1,377 1,087 277 0 1,364 1,138 302 0 1,440 1,175 310 0 1,485FTE 1,071.0 192.6 0 1,263.6 1,078.8 200.0 0 1,278.9 1,070.0 206.3 0 1,276.4 1,121.3 283.9 0 1,405.3 1,160.9 296.2 0 1,457.1
HC FT 0 453 0 453 0 741 0 741 0 777 0 777 0 815 0 815 0 927 0 927PT 0 170 0 170 0 370 0 370 0 414 0 414 0 353 0 353 0 342 0 342TOTAL 0 623 0 623 0 1,111 0 1,111 0 1,191 0 1,191 0 1,168 0 1,168 0 1,269 0 1,269FTE 0 523.9 0 523.9 0 885.1 0 885.1 0 919.7 0 919.7 0 935.7 0 935.7 0 1,046.5 0 1,046.5
Interdisc FT 244 351 0 595 283 152 0 435 287 145 0 432 270 170 0 440 260 183 0 443PT 10 147 0 157 3 4 0 7 4 3 0 7 11 1 0 12 6 3 0 9TOTAL 254 498 0 752 286 156 0 442 291 148 0 439 281 171 0 452 266 186 0 452FTE 246.6 402.4 0 649.0 283.8 154.1 0 437.9 289.0 146.6 0 435.6 273.4 170.5 0 443.9 261.8 184.6 0 446.4
MCS FT 704 258 0 962 689 261 0 950 716 278 0 994 745 296 0 1,041 715 288 0 1,003PT 10 4 0 14 7 7 0 14 7 9 0 16 12 5 0 17 11 5 0 16TOTAL 714 262 0 976 696 268 0 964 723 287 0 1,010 757 301 0 1,058 726 293 0 1,019FTE 707.3 258.5 0 965.8 692.1 261.7 0 953.8 718.9 280.0 0 998.9 747.1 296.7 0 1,043.8 719.0 290.5 0 1,009.5
SCS FT 553 600 0 1,153 581 639 0 1,220 574 674 0 1,248 563 692 0 1,255 573 774 0 1,347PT 12 89 0 101 11 88 0 99 13 108 0 121 11 86 0 97 9 73 0 82TOTAL 565 689 0 1,254 592 727 0 1,319 587 782 0 1,369 574 778 0 1,352 582 847 0 1,429FTE 557.1 631.1 0 1,188.2 586.7 671.2 0 1,257.9 580.2 712.9 0 1,293.1 568.9 724.5 0 1,293.5 576.3 804.4 0 1,380.6
TSB FT 450 550 0 1,000 428 637 0 1,065 385 647 0 1,032 341 642 0 983 354 641 0 995PT 8 429 0 437 7 405 0 412 12 366 0 378 8 314 0 322 5 273 0 278TOTAL 458 979 0 1,437 435 1,042 0 1,477 397 1,013 0 1,410 349 956 0 1,305 359 914 0 1,273FTE 451.0 713.7 0 1,164.7 430.9 797.6 0 1,228.6 389.9 782.3 0 1,172.2 342.6 777.6 0 1,120.2 356.5 752.0 0 1,108.5
Nondegree FT 0 0 0 0 0 0 3 3 0 0 0 0 0 0 1 1 0 0 21 21PT 0 0 91 91 0 0 103 103 0 0 72 72 0 0 87 87 0 0 82 82TOTAL 0 0 91 91 0 0 106 106 0 0 72 72 0 0 88 88 0 0 103 103FTE 0 0 33.3 33.3 0 0 39.3 39.3 0 0 24.9 24.9 0 0 28.6 28.6 0 0 48.8 48.8
Branch FT 164 0 0 164 185 0 0 185 243 20 0 263 272 18 0 290 331 26 0 357Campuses PT 3 92 0 95 4 123 0 127 3 135 0 138 6 109 0 115 4 81 0 85
TOTAL 167 92 0 259 189 123 0 312 246 155 0 401 278 127 0 405 335 107 0 442FTE 166 28.9 0 194.8 187.5 42.2 0 229.7 244.2 86.5 0 330.7 276.3 71.7 0 348.1 333.9 66.5 0 400.4
GRAND FT 5,645 3,512 0 9,157 5,794 3,837 3 9,634 5,862 4,174 0 10,036 5,910 4,500 1 10,411 6,072 4,850 21 10,943TOTAL PT 113 1,132 91 1,336 98 1,229 103 1,430 89 1,246 72 1,407 110 1,010 87 1,207 106 927 82 1,115
TOTAL 5,758 4,644 91 10,493 5,892 5,066 106 11,064 5,951 5,420 72 11,443 6,020 5,510 88 11,618 6,178 5,777 103 12,058FTE 5,674.3 3,917.1 33.3 9,624.7 5,830.4 4,305.1 39.3 10,174.8 5,893.4 4,626.0 24.9 10,544.3 5,949.8 4,906.8 28.6 10,885.2 6,114.5 5,220.9 48.8 11,384.2
ENR-19
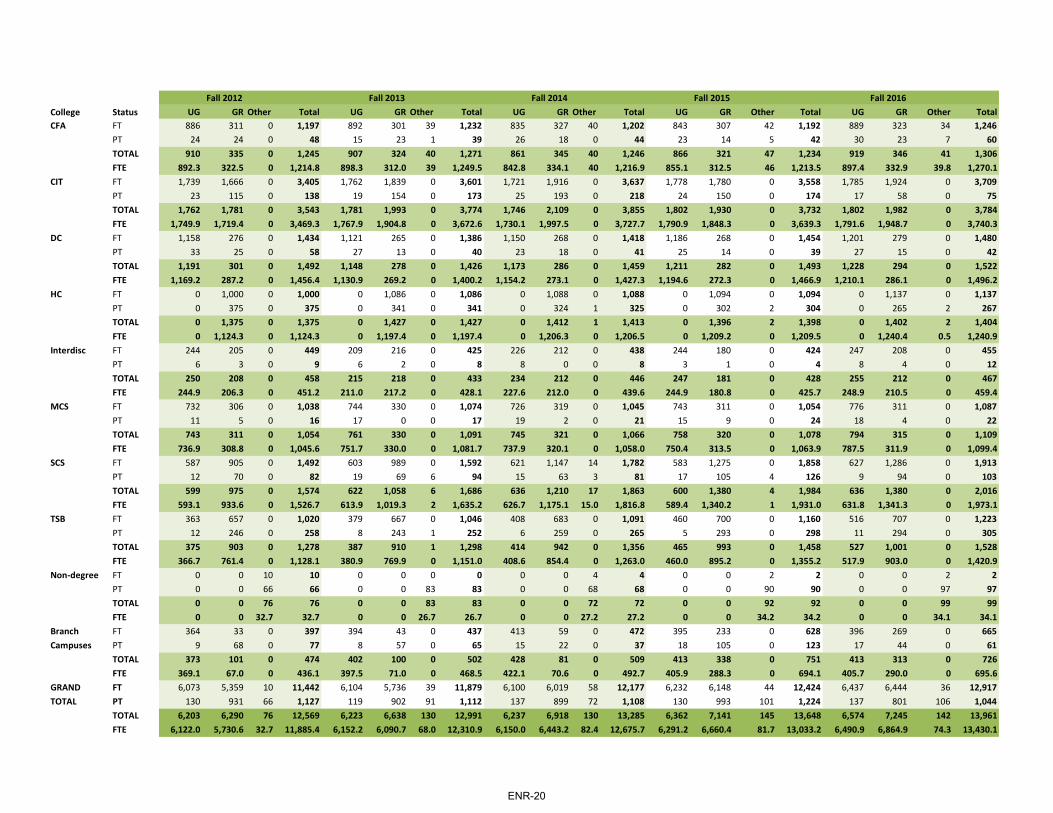
Fall 2012 Fall 2013 Fall 2014 Fall 2015 Fall 2016College Status UG GR Other Total UG GR Other Total UG GR Other Total UG GR Other Total UG GR Other TotalCFA FT 886 311 0 1,197 892 301 39 1,232 835 327 40 1,202 843 307 42 1,192 889 323 34 1,246
PT 24 24 0 48 15 23 1 39 26 18 0 44 23 14 5 42 30 23 7 60TOTAL 910 335 0 1,245 907 324 40 1,271 861 345 40 1,246 866 321 47 1,234 919 346 41 1,306FTE 892.3 322.5 0 1,214.8 898.3 312.0 39 1,249.5 842.8 334.1 40 1,216.9 855.1 312.5 46 1,213.5 897.4 332.9 39.8 1,270.1
CIT FT 1,739 1,666 0 3,405 1,762 1,839 0 3,601 1,721 1,916 0 3,637 1,778 1,780 0 3,558 1,785 1,924 0 3,709PT 23 115 0 138 19 154 0 173 25 193 0 218 24 150 0 174 17 58 0 75TOTAL 1,762 1,781 0 3,543 1,781 1,993 0 3,774 1,746 2,109 0 3,855 1,802 1,930 0 3,732 1,802 1,982 0 3,784FTE 1,749.9 1,719.4 0 3,469.3 1,767.9 1,904.8 0 3,672.6 1,730.1 1,997.5 0 3,727.7 1,790.9 1,848.3 0 3,639.3 1,791.6 1,948.7 0 3,740.3
DC FT 1,158 276 0 1,434 1,121 265 0 1,386 1,150 268 0 1,418 1,186 268 0 1,454 1,201 279 0 1,480PT 33 25 0 58 27 13 0 40 23 18 0 41 25 14 0 39 27 15 0 42TOTAL 1,191 301 0 1,492 1,148 278 0 1,426 1,173 286 0 1,459 1,211 282 0 1,493 1,228 294 0 1,522FTE 1,169.2 287.2 0 1,456.4 1,130.9 269.2 0 1,400.2 1,154.2 273.1 0 1,427.3 1,194.6 272.3 0 1,466.9 1,210.1 286.1 0 1,496.2
HC FT 0 1,000 0 1,000 0 1,086 0 1,086 0 1,088 0 1,088 0 1,094 0 1,094 0 1,137 0 1,137PT 0 375 0 375 0 341 0 341 0 324 1 325 0 302 2 304 0 265 2 267TOTAL 0 1,375 0 1,375 0 1,427 0 1,427 0 1,412 1 1,413 0 1,396 2 1,398 0 1,402 2 1,404FTE 0 1,124.3 0 1,124.3 0 1,197.4 0 1,197.4 0 1,206.3 0 1,206.5 0 1,209.2 0 1,209.5 0 1,240.4 0.5 1,240.9
Interdisc FT 244 205 0 449 209 216 0 425 226 212 0 438 244 180 0 424 247 208 0 455PT 6 3 0 9 6 2 0 8 8 0 0 8 3 1 0 4 8 4 0 12TOTAL 250 208 0 458 215 218 0 433 234 212 0 446 247 181 0 428 255 212 0 467FTE 244.9 206.3 0 451.2 211.0 217.2 0 428.1 227.6 212.0 0 439.6 244.9 180.8 0 425.7 248.9 210.5 0 459.4
MCS FT 732 306 0 1,038 744 330 0 1,074 726 319 0 1,045 743 311 0 1,054 776 311 0 1,087PT 11 5 0 16 17 0 0 17 19 2 0 21 15 9 0 24 18 4 0 22TOTAL 743 311 0 1,054 761 330 0 1,091 745 321 0 1,066 758 320 0 1,078 794 315 0 1,109FTE 736.9 308.8 0 1,045.6 751.7 330.0 0 1,081.7 737.9 320.1 0 1,058.0 750.4 313.5 0 1,063.9 787.5 311.9 0 1,099.4
SCS FT 587 905 0 1,492 603 989 0 1,592 621 1,147 14 1,782 583 1,275 0 1,858 627 1,286 0 1,913PT 12 70 0 82 19 69 6 94 15 63 3 81 17 105 4 126 9 94 0 103TOTAL 599 975 0 1,574 622 1,058 6 1,686 636 1,210 17 1,863 600 1,380 4 1,984 636 1,380 0 2,016FTE 593.1 933.6 0 1,526.7 613.9 1,019.3 2 1,635.2 626.7 1,175.1 15.0 1,816.8 589.4 1,340.2 1 1,931.0 631.8 1,341.3 0 1,973.1
TSB FT 363 657 0 1,020 379 667 0 1,046 408 683 0 1,091 460 700 0 1,160 516 707 0 1,223PT 12 246 0 258 8 243 1 252 6 259 0 265 5 293 0 298 11 294 0 305TOTAL 375 903 0 1,278 387 910 1 1,298 414 942 0 1,356 465 993 0 1,458 527 1,001 0 1,528FTE 366.7 761.4 0 1,128.1 380.9 769.9 0 1,151.0 408.6 854.4 0 1,263.0 460.0 895.2 0 1,355.2 517.9 903.0 0 1,420.9
Nondegree FT 0 0 10 10 0 0 0 0 0 0 4 4 0 0 2 2 0 0 2 2PT 0 0 66 66 0 0 83 83 0 0 68 68 0 0 90 90 0 0 97 97TOTAL 0 0 76 76 0 0 83 83 0 0 72 72 0 0 92 92 0 0 99 99FTE 0 0 32.7 32.7 0 0 26.7 26.7 0 0 27.2 27.2 0 0 34.2 34.2 0 0 34.1 34.1
Branch FT 364 33 0 397 394 43 0 437 413 59 0 472 395 233 0 628 396 269 0 665Campuses PT 9 68 0 77 8 57 0 65 15 22 0 37 18 105 0 123 17 44 0 61
TOTAL 373 101 0 474 402 100 0 502 428 81 0 509 413 338 0 751 413 313 0 726FTE 369.1 67.0 0 436.1 397.5 71.0 0 468.5 422.1 70.6 0 492.7 405.9 288.3 0 694.1 405.7 290.0 0 695.6
GRAND FT 6,073 5,359 10 11,442 6,104 5,736 39 11,879 6,100 6,019 58 12,177 6,232 6,148 44 12,424 6,437 6,444 36 12,917TOTAL PT 130 931 66 1,127 119 902 91 1,112 137 899 72 1,108 130 993 101 1,224 137 801 106 1,044
TOTAL 6,203 6,290 76 12,569 6,223 6,638 130 12,991 6,237 6,918 130 13,285 6,362 7,141 145 13,648 6,574 7,245 142 13,961FTE 6,122.0 5,730.6 32.7 11,885.4 6,152.2 6,090.7 68.0 12,310.9 6,150.0 6,443.2 82.4 12,675.7 6,291.2 6,660.4 81.7 13,033.2 6,490.9 6,864.9 74.3 13,430.1
ENR-20

Headcount Enrollment by College, Level, Sex, and Minority StatusFall Semesters 2007 to 2016
Fall 2007 Fall 2008 Fall 2009 Fall 2010 Fall 2011College Status Total Female Minority Total Female Minority Total Female Minority Total Female Minority Total Female MinorityCFA UG 939 508 113 985 541 111 967 540 106 996 543 115 979 554 120
Master's 198 97 12 199 110 9 235 129 5 252 134 9 266 152 14Doctoral 34 13 0 32 10 0 29 11 1 26 11 1 22 10 1Other 0 0 0 0 0 0 0 0 0 0 0 0 0 0 0TOTAL 1,171 618 125 1,216 661 120 1,231 680 112 1,274 688 125 1,267 716 135
CIT UG 1,561 412 157 1,608 431 182 1,653 475 220 1,647 497 238 1,756 518 281Master's 395 84 10 503 126 11 622 143 16 703 175 19 814 221 30Doctoral 614 166 23 629 175 25 681 181 25 726 192 31 749 194 31TOTAL 2,570 662 190 2,740 732 218 2,956 799 261 3,076 864 288 3,319 933 342
DC UG 1,100 485 155 1,101 529 158 1,087 551 163 1,138 584 197 1,175 616 210Master's 77 46 5 79 38 3 80 46 5 93 54 7 100 58 6Doctoral 183 91 4 197 95 5 197 90 5 209 94 6 210 94 8TOTAL 1,360 622 164 1,377 662 166 1,364 687 173 1,440 732 210 1,485 768 224
HC Master's 580 275 51 1,066 418 69 1,144 468 85 1,126 470 75 1,220 519 90Doctoral 43 12 1 45 14 1 47 15 2 42 15 3 49 17 2Other 0 0 0 0 0 0 0 0 0 0 0 0 0 0 0TOTAL 623 287 52 1,111 432 70 1,191 483 87 1,168 485 78 1,269 536 92
Interdisc UG 254 155 13 286 180 15 291 181 15 281 175 15 266 168 16Master's 487 135 21 138 42 3 148 43 4 171 46 4 186 59 4Doctoral 11 2 0 18 3 0 0 0 0 0 0 0 0 0 0TOTAL 752 292 34 442 225 18 439 224 19 452 221 19 452 227 20
MCS UG 714 312 53 696 299 56 723 311 71 757 331 88 726 285 87Master's 13 2 0 23 8 0 26 6 1 22 2 1 23 5 1Doctoral 249 81 6 245 80 6 261 87 8 279 91 8 270 82 8TOTAL 976 395 59 964 387 62 1,010 404 80 1,058 424 97 1,019 372 96
SCS UG 565 111 49 592 113 51 587 113 53 574 122 45 582 146 47Master's 281 60 6 314 66 6 348 74 8 357 85 7 408 86 5Doctoral 408 78 5 413 80 5 434 86 6 421 93 6 439 96 7Other 0 0 0 0 0 0 0 0 0 0 0 0 0 0 0TOTAL 1,254 249 60 1,319 259 62 1,369 273 67 1,352 300 58 1,429 328 59
TSB UG 458 172 38 435 182 37 397 169 36 349 151 31 359 135 45Master's 879 193 51 953 201 53 912 189 51 851 201 54 813 211 49Doctoral 100 32 0 89 29 0 101 37 1 105 38 1 101 32 1Other 0 0 0 0 0 0 0 0 0 0 0 0 0 0 0TOTAL 1,437 397 89 1,477 412 90 1,410 395 88 1,305 390 86 1,273 378 95
Nondegree 91 42 5 106 52 3 72 36 4 88 37 8 103 43 3
Branch UG 167 103 0 189 102 0 246 128 0 278 149 1 335 174 2Campuses Master's 92 19 4 123 27 7 155 26 7 127 6 6 107 18 7
TOTAL 259 122 4 312 129 7 401 154 7 405 155 7 442 192 9GRAND UG 5,758 2,258 578 5,892 2,377 610 5,951 2,468 664 6,020 2,552 730 6,178 2,596 808TOTAL Master's 3,002 911 160 3,398 1,036 161 3,670 1,124 182 3,702 1,173 182 3,937 1,329 206
Doctoral 1,642 475 39 1,668 486 42 1,750 507 48 1,808 534 56 1,840 525 58Other 91 42 5 106 52 3 72 36 4 88 37 8 103 43 3TOTAL 10,493 3,686 782 11,064 3,951 816 11,443 4,135 898 11,618 4,296 976 12,058 4,493 1,075
ENR-21
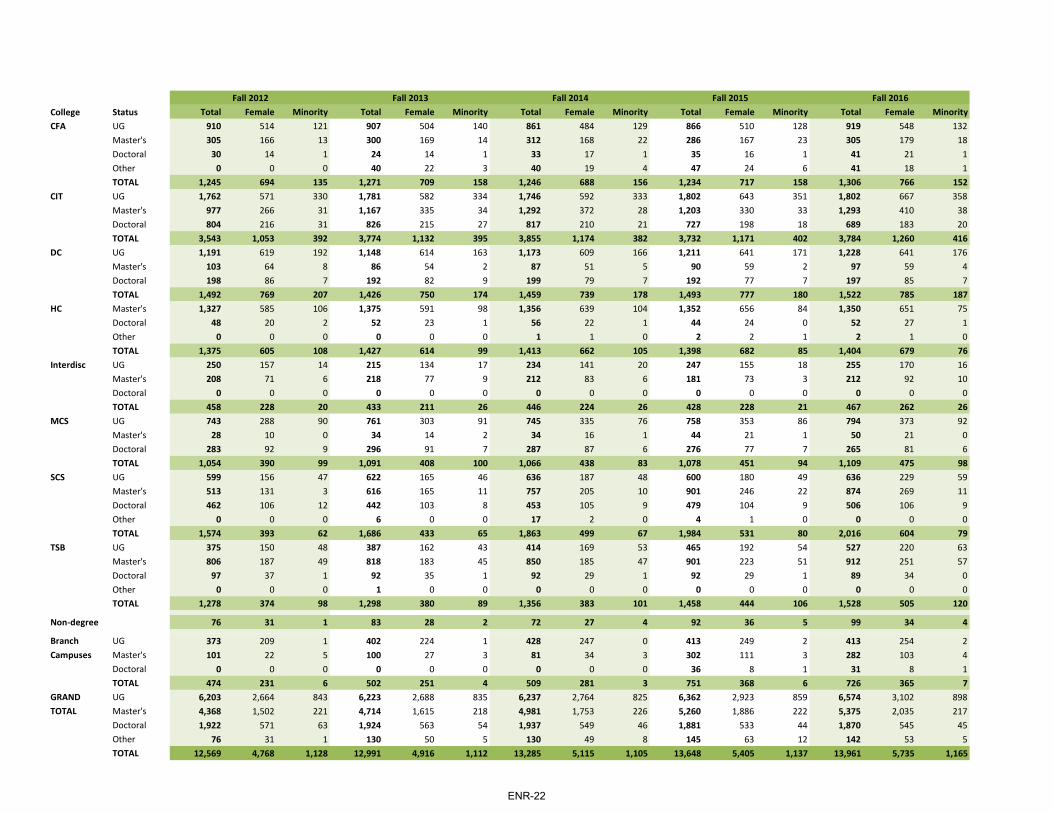
Fall 2012 Fall 2013 Fall 2014 Fall 2015 Fall 2016College Status Total Female Minority Total Female Minority Total Female Minority Total Female Minority Total Female MinorityCFA UG 910 514 121 907 504 140 861 484 129 866 510 128 919 548 132
Master's 305 166 13 300 169 14 312 168 22 286 167 23 305 179 18Doctoral 30 14 1 24 14 1 33 17 1 35 16 1 41 21 1Other 0 0 0 40 22 3 40 19 4 47 24 6 41 18 1TOTAL 1,245 694 135 1,271 709 158 1,246 688 156 1,234 717 158 1,306 766 152
CIT UG 1,762 571 330 1,781 582 334 1,746 592 333 1,802 643 351 1,802 667 358Master's 977 266 31 1,167 335 34 1,292 372 28 1,203 330 33 1,293 410 38Doctoral 804 216 31 826 215 27 817 210 21 727 198 18 689 183 20TOTAL 3,543 1,053 392 3,774 1,132 395 3,855 1,174 382 3,732 1,171 402 3,784 1,260 416
DC UG 1,191 619 192 1,148 614 163 1,173 609 166 1,211 641 171 1,228 641 176Master's 103 64 8 86 54 2 87 51 5 90 59 2 97 59 4Doctoral 198 86 7 192 82 9 199 79 7 192 77 7 197 85 7TOTAL 1,492 769 207 1,426 750 174 1,459 739 178 1,493 777 180 1,522 785 187
HC Master's 1,327 585 106 1,375 591 98 1,356 639 104 1,352 656 84 1,350 651 75Doctoral 48 20 2 52 23 1 56 22 1 44 24 0 52 27 1Other 0 0 0 0 0 0 1 1 0 2 2 1 2 1 0TOTAL 1,375 605 108 1,427 614 99 1,413 662 105 1,398 682 85 1,404 679 76
Interdisc UG 250 157 14 215 134 17 234 141 20 247 155 18 255 170 16Master's 208 71 6 218 77 9 212 83 6 181 73 3 212 92 10Doctoral 0 0 0 0 0 0 0 0 0 0 0 0 0 0 0TOTAL 458 228 20 433 211 26 446 224 26 428 228 21 467 262 26
MCS UG 743 288 90 761 303 91 745 335 76 758 353 86 794 373 92Master's 28 10 0 34 14 2 34 16 1 44 21 1 50 21 0Doctoral 283 92 9 296 91 7 287 87 6 276 77 7 265 81 6TOTAL 1,054 390 99 1,091 408 100 1,066 438 83 1,078 451 94 1,109 475 98
SCS UG 599 156 47 622 165 46 636 187 48 600 180 49 636 229 59Master's 513 131 3 616 165 11 757 205 10 901 246 22 874 269 11Doctoral 462 106 12 442 103 8 453 105 9 479 104 9 506 106 9Other 0 0 0 6 0 0 17 2 0 4 1 0 0 0 0TOTAL 1,574 393 62 1,686 433 65 1,863 499 67 1,984 531 80 2,016 604 79
TSB UG 375 150 48 387 162 43 414 169 53 465 192 54 527 220 63Master's 806 187 49 818 183 45 850 185 47 901 223 51 912 251 57Doctoral 97 37 1 92 35 1 92 29 1 92 29 1 89 34 0Other 0 0 0 1 0 0 0 0 0 0 0 0 0 0 0TOTAL 1,278 374 98 1,298 380 89 1,356 383 101 1,458 444 106 1,528 505 120
Nondegree 76 31 1 83 28 2 72 27 4 92 36 5 99 34 4
Branch UG 373 209 1 402 224 1 428 247 0 413 249 2 413 254 2Campuses Master's 101 22 5 100 27 3 81 34 3 302 111 3 282 103 4
Doctoral 0 0 0 0 0 0 0 0 0 36 8 1 31 8 1TOTAL 474 231 6 502 251 4 509 281 3 751 368 6 726 365 7
GRAND UG 6,203 2,664 843 6,223 2,688 835 6,237 2,764 825 6,362 2,923 859 6,574 3,102 898TOTAL Master's 4,368 1,502 221 4,714 1,615 218 4,981 1,753 226 5,260 1,886 222 5,375 2,035 217
Doctoral 1,922 571 63 1,924 563 54 1,937 549 46 1,881 533 44 1,870 545 45Other 76 31 1 130 50 5 130 49 8 145 63 12 142 53 5TOTAL 12,569 4,768 1,128 12,991 4,916 1,112 13,285 5,115 1,105 13,648 5,405 1,137 13,961 5,735 1,165
ENR-22
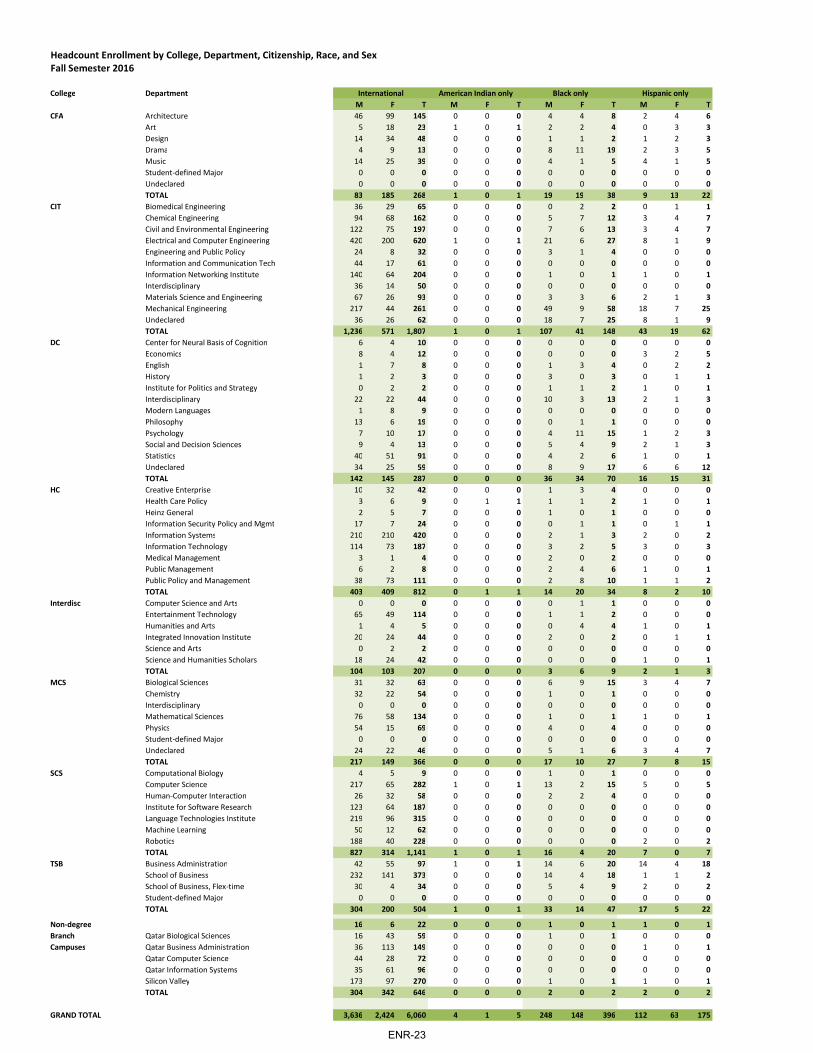
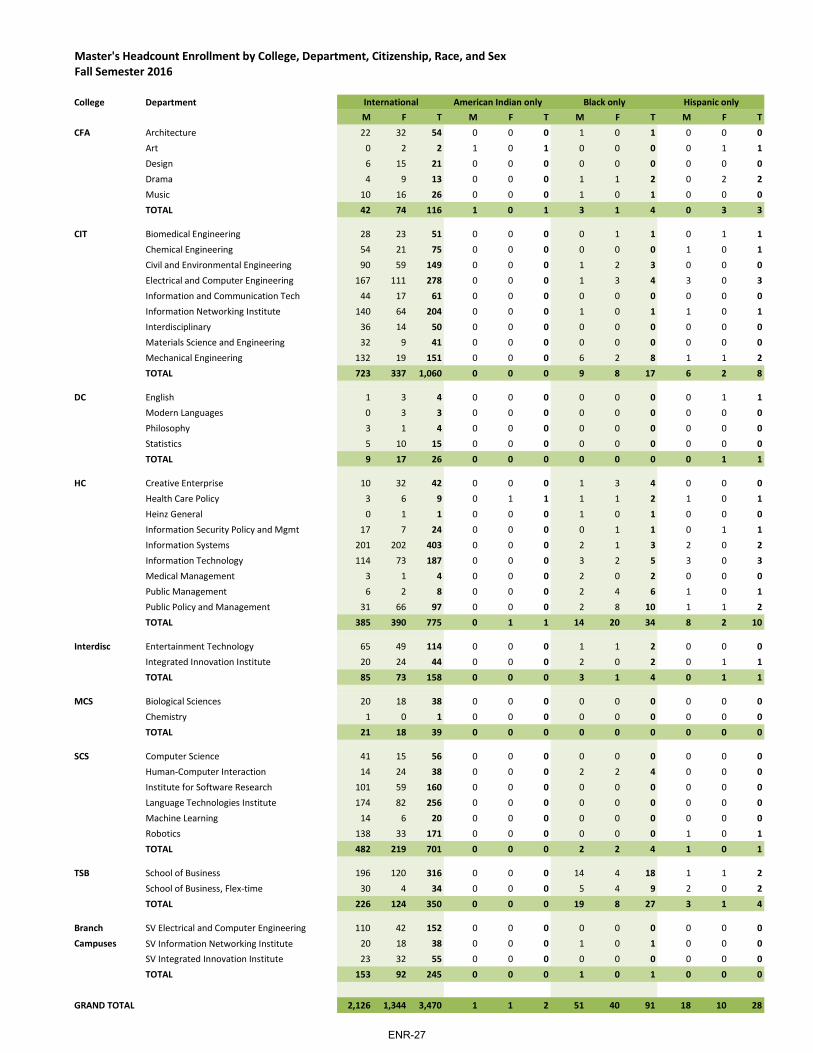
Headcount Enrollment by College, Department, Citizenship, Race, and SexFall Semester 2016
College DepartmentM F T M F T M F T M F T
CFA Architecture 46 99 145 0 0 0 4 4 8 2 4 6Art 5 18 23 1 0 1 2 2 4 0 3 3Design 14 34 48 0 0 0 1 1 2 1 2 3Drama 4 9 13 0 0 0 8 11 19 2 3 5Music 14 25 39 0 0 0 4 1 5 4 1 5Studentdefined Major 0 0 0 0 0 0 0 0 0 0 0 0Undeclared 0 0 0 0 0 0 0 0 0 0 0 0TOTAL 83 185 268 1 0 1 19 19 38 9 13 22
CIT Biomedical Engineering 36 29 65 0 0 0 0 2 2 0 1 1Chemical Engineering 94 68 162 0 0 0 5 7 12 3 4 7Civil and Environmental Engineering 122 75 197 0 0 0 7 6 13 3 4 7Electrical and Computer Engineering 420 200 620 1 0 1 21 6 27 8 1 9Engineering and Public Policy 24 8 32 0 0 0 3 1 4 0 0 0Information and Communication Tech 44 17 61 0 0 0 0 0 0 0 0 0Information Networking Institute 140 64 204 0 0 0 1 0 1 1 0 1Interdisciplinary 36 14 50 0 0 0 0 0 0 0 0 0Materials Science and Engineering 67 26 93 0 0 0 3 3 6 2 1 3Mechanical Engineering 217 44 261 0 0 0 49 9 58 18 7 25Undeclared 36 26 62 0 0 0 18 7 25 8 1 9TOTAL 1,236 571 1,807 1 0 1 107 41 148 43 19 62
DC Center for Neural Basis of Cognition 6 4 10 0 0 0 0 0 0 0 0 0Economics 8 4 12 0 0 0 0 0 0 3 2 5English 1 7 8 0 0 0 1 3 4 0 2 2History 1 2 3 0 0 0 3 0 3 0 1 1Institute for Politics and Strategy 0 2 2 0 0 0 1 1 2 1 0 1Interdisciplinary 22 22 44 0 0 0 10 3 13 2 1 3Modern Languages 1 8 9 0 0 0 0 0 0 0 0 0Philosophy 13 6 19 0 0 0 0 1 1 0 0 0Psychology 7 10 17 0 0 0 4 11 15 1 2 3Social and Decision Sciences 9 4 13 0 0 0 5 4 9 2 1 3Statistics 40 51 91 0 0 0 4 2 6 1 0 1Undeclared 34 25 59 0 0 0 8 9 17 6 6 12TOTAL 142 145 287 0 0 0 36 34 70 16 15 31
HC Creative Enterprise 10 32 42 0 0 0 1 3 4 0 0 0Health Care Policy 3 6 9 0 1 1 1 1 2 1 0 1Heinz General 2 5 7 0 0 0 1 0 1 0 0 0Information Security Policy and Mgmt 17 7 24 0 0 0 0 1 1 0 1 1Information Systems 210 210 420 0 0 0 2 1 3 2 0 2Information Technology 114 73 187 0 0 0 3 2 5 3 0 3Medical Management 3 1 4 0 0 0 2 0 2 0 0 0Public Management 6 2 8 0 0 0 2 4 6 1 0 1Public Policy and Management 38 73 111 0 0 0 2 8 10 1 1 2TOTAL 403 409 812 0 1 1 14 20 34 8 2 10
Interdisc Computer Science and Arts 0 0 0 0 0 0 0 1 1 0 0 0Entertainment Technology 65 49 114 0 0 0 1 1 2 0 0 0Humanities and Arts 1 4 5 0 0 0 0 4 4 1 0 1Integrated Innovation Institute 20 24 44 0 0 0 2 0 2 0 1 1Science and Arts 0 2 2 0 0 0 0 0 0 0 0 0Science and Humanities Scholars 18 24 42 0 0 0 0 0 0 1 0 1TOTAL 104 103 207 0 0 0 3 6 9 2 1 3
MCS Biological Sciences 31 32 63 0 0 0 6 9 15 3 4 7Chemistry 32 22 54 0 0 0 1 0 1 0 0 0Interdisciplinary 0 0 0 0 0 0 0 0 0 0 0 0Mathematical Sciences 76 58 134 0 0 0 1 0 1 1 0 1Physics 54 15 69 0 0 0 4 0 4 0 0 0Studentdefined Major 0 0 0 0 0 0 0 0 0 0 0 0Undeclared 24 22 46 0 0 0 5 1 6 3 4 7TOTAL 217 149 366 0 0 0 17 10 27 7 8 15
SCS Computational Biology 4 5 9 0 0 0 1 0 1 0 0 0Computer Science 217 65 282 1 0 1 13 2 15 5 0 5HumanComputer Interaction 26 32 58 0 0 0 2 2 4 0 0 0Institute for Software Research 123 64 187 0 0 0 0 0 0 0 0 0Language Technologies Institute 219 96 315 0 0 0 0 0 0 0 0 0Machine Learning 50 12 62 0 0 0 0 0 0 0 0 0Robotics 188 40 228 0 0 0 0 0 0 2 0 2TOTAL 827 314 1,141 1 0 1 16 4 20 7 0 7
TSB Business Administration 42 55 97 1 0 1 14 6 20 14 4 18School of Business 232 141 373 0 0 0 14 4 18 1 1 2School of Business, Flextime 30 4 34 0 0 0 5 4 9 2 0 2Studentdefined Major 0 0 0 0 0 0 0 0 0 0 0 0TOTAL 304 200 504 1 0 1 33 14 47 17 5 22
Nondegree 16 6 22 0 0 0 1 0 1 1 0 1Branch Qatar Biological Sciences 16 43 59 0 0 0 1 0 1 0 0 0Campuses Qatar Business Administration 36 113 149 0 0 0 0 0 0 1 0 1
Qatar Computer Science 44 28 72 0 0 0 0 0 0 0 0 0Qatar Information Systems 35 61 96 0 0 0 0 0 0 0 0 0Silicon Valley 173 97 270 0 0 0 1 0 1 1 0 1TOTAL 304 342 646 0 0 0 2 0 2 2 0 2
GRAND TOTAL 3,636 2,424 6,060 4 1 5 248 148 396 112 63 175
International American Indian only Black only Hispanic only
ENR-23

Headcount Enrollment by College, Department, Citizenship, and RaceFall Semester 2013
M F T M F T M F T M F T M F T M F T M F T10 8 18 6 6 12 39 37 76 2 0 2 46 33 79 9 9 18 164 200 364
7 6 13 0 4 4 7 32 39 0 0 0 17 51 68 3 11 14 42 127 1694 3 7 4 4 8 13 45 58 0 0 0 27 46 73 6 10 16 70 145 215
10 17 27 1 6 7 1 4 5 0 0 0 90 102 192 9 10 19 125 162 28714 9 23 2 0 2 15 12 27 0 0 0 75 76 151 4 3 7 132 127 259
0 0 0 0 0 0 0 0 0 0 0 0 1 1 2 0 0 0 1 1 22 1 3 0 0 0 1 2 3 0 0 0 2 1 3 1 0 1 6 4 10
47 44 91 13 20 33 76 132 208 2 0 2 258 310 568 32 43 75 540 766 1,3061 1 2 0 0 0 12 8 20 0 0 0 5 10 15 2 6 8 56 57 113
15 6 21 3 3 6 32 46 78 0 0 0 63 44 107 8 7 15 223 185 4087 6 13 1 4 5 13 19 32 0 0 0 33 16 49 6 6 12 192 136 328
37 3 40 13 4 17 145 61 206 0 0 0 132 25 157 24 15 39 801 315 1,1161 0 1 1 0 1 3 1 4 0 0 0 16 12 28 8 1 9 56 23 790 0 0 0 0 0 0 0 0 0 0 0 0 0 0 0 0 0 44 17 610 0 0 0 0 0 4 1 5 0 0 0 10 3 13 5 0 5 161 68 2290 0 0 0 0 0 3 0 3 0 0 0 6 5 11 1 0 1 46 19 654 3 7 1 2 3 17 25 42 0 1 1 44 27 71 1 4 5 139 92 231
41 15 56 14 4 18 60 32 92 0 0 0 151 48 199 18 10 28 568 169 73748 17 65 4 10 14 44 63 107 0 0 0 71 45 116 9 10 19 238 179 417
154 51 205 37 27 64 333 256 589 0 1 1 531 235 766 82 59 141 2,524 1,260 3,7840 0 0 0 0 0 0 0 0 0 0 0 4 0 4 1 2 3 11 6 175 2 7 0 2 2 17 8 25 0 0 0 9 5 14 1 2 3 43 25 682 4 6 2 2 4 1 10 11 0 0 0 22 53 75 18 21 39 47 102 1494 3 7 0 2 2 2 3 5 0 0 0 12 14 26 2 1 3 24 26 505 2 7 0 0 0 1 9 10 0 0 0 4 7 11 0 0 0 12 21 338 1 9 3 1 4 43 47 90 0 0 0 26 8 34 10 6 16 124 89 2131 0 1 1 1 2 1 1 2 0 0 0 5 3 8 0 1 1 9 14 230 1 1 0 1 1 4 4 8 0 0 0 16 9 25 6 0 6 39 22 617 2 9 0 6 6 7 32 39 0 0 0 10 37 47 3 5 8 39 105 1441 3 4 2 5 7 11 11 22 0 0 0 21 30 51 4 3 7 55 61 1165 5 10 4 4 8 40 37 77 0 0 0 42 11 53 12 6 18 148 116 264
10 15 25 5 7 12 57 71 128 0 0 0 51 52 103 15 13 28 186 198 38448 38 86 17 31 48 184 233 417 0 0 0 222 229 451 72 60 132 737 785 1,522
1 4 5 1 2 3 1 10 11 0 0 0 17 29 46 1 1 2 32 81 1131 2 3 0 0 0 2 4 6 0 0 0 6 7 13 0 0 0 14 21 350 0 0 0 0 0 0 0 0 0 0 0 6 3 9 0 1 1 9 9 182 0 2 0 1 1 1 0 1 0 0 0 17 9 26 1 0 1 38 19 571 0 1 1 0 1 6 12 18 0 0 0 26 12 38 5 0 5 253 235 4887 1 8 1 0 1 7 2 9 0 1 1 59 15 74 10 2 12 204 96 3002 1 3 1 0 1 6 4 10 0 0 0 23 10 33 4 2 6 41 18 591 1 2 0 0 0 0 2 2 0 0 0 15 33 48 5 2 7 30 44 742 5 7 0 0 0 6 8 14 0 0 0 48 57 105 7 4 11 104 156 260
17 14 31 4 3 7 29 42 71 0 1 1 217 175 392 33 12 45 725 679 1,4040 0 0 1 2 3 3 5 8 0 0 0 7 2 9 0 0 0 11 10 212 1 3 0 1 1 2 2 4 0 0 0 12 5 17 8 1 9 90 60 1501 2 3 0 1 1 1 16 17 0 0 0 7 18 25 0 4 4 11 49 601 1 2 0 0 0 0 1 1 0 0 0 4 4 8 3 1 4 30 32 621 0 1 1 1 2 1 2 3 0 0 0 2 6 8 0 1 1 5 12 172 3 5 5 2 7 11 38 49 0 0 0 18 25 43 3 7 10 58 99 1577 7 14 7 7 14 18 64 82 0 0 0 50 60 110 14 14 28 205 262 4676 2 8 0 6 6 18 47 65 0 0 0 37 35 72 5 11 16 106 146 2523 3 6 3 1 4 11 23 34 0 0 0 26 16 42 3 7 10 79 72 1510 0 0 0 0 0 0 0 0 0 0 0 0 1 1 1 0 1 1 1 2
13 2 15 3 2 5 40 19 59 0 0 0 56 17 73 8 0 8 198 98 29611 2 13 2 1 3 10 10 20 0 0 0 36 15 51 8 2 10 125 45 170
0 0 0 0 0 0 1 0 1 0 0 0 0 1 1 0 0 0 1 1 29 5 14 2 2 4 42 42 84 0 0 0 35 32 67 4 4 8 124 112 236
42 14 56 10 12 22 122 141 263 0 0 0 190 117 307 29 24 53 634 475 1,1090 0 0 0 0 0 2 0 2 0 0 0 0 0 0 6 1 7 13 6 19
36 3 39 11 7 18 153 133 286 0 0 0 125 47 172 28 11 39 589 268 8571 2 3 3 3 6 8 16 24 0 0 0 24 25 49 5 6 11 69 86 1551 1 2 1 0 1 11 2 13 0 0 0 13 2 15 3 2 5 152 71 2230 0 0 1 0 1 3 1 4 0 0 0 13 2 15 6 1 7 242 100 3422 0 2 1 0 1 7 1 8 0 0 0 7 3 10 1 1 2 68 17 854 1 5 3 1 4 20 4 24 0 0 0 51 8 59 11 2 13 279 56 335
44 7 51 20 11 31 204 157 361 0 0 0 233 87 320 60 24 84 1,412 604 2,01616 8 24 6 4 10 102 98 200 0 0 0 99 34 133 12 11 23 306 220 52613 2 15 4 1 5 61 15 76 0 0 0 162 44 206 9 4 13 496 212 708
8 3 11 1 2 3 38 20 58 1 0 1 124 39 163 11 1 12 220 73 2930 0 0 0 0 0 0 0 0 0 0 0 1 0 1 0 0 0 1 0 1
37 13 50 11 7 18 201 133 334 1 0 1 386 117 503 32 16 48 1,023 505 1,528
2 0 2 0 0 0 5 5 10 0 0 0 33 21 54 7 2 9 65 34 990 0 0 0 0 0 0 0 0 0 0 0 0 0 0 0 1 1 17 44 610 0 0 0 0 0 1 1 2 0 0 0 1 2 3 10 2 12 49 118 1670 0 0 0 0 0 1 0 1 0 0 0 1 0 1 6 0 6 52 28 800 0 0 0 0 0 2 0 2 0 0 0 0 0 0 4 3 7 41 64 1053 0 3 0 1 1 11 5 16 0 0 0 9 4 13 4 4 8 202 111 3133 0 3 0 1 1 15 6 21 0 0 0 11 6 17 24 10 34 361 365 726
401 188 589 119 119 238 1,187 1,169 2,356 3 2 5 2,131 1,357 3,488 385 264 649 8,226 5,735 13,961
Multiracial (majority)Multiracial (minority) Asian only Pacific Islander only White only Race not reported Total
ENR-24
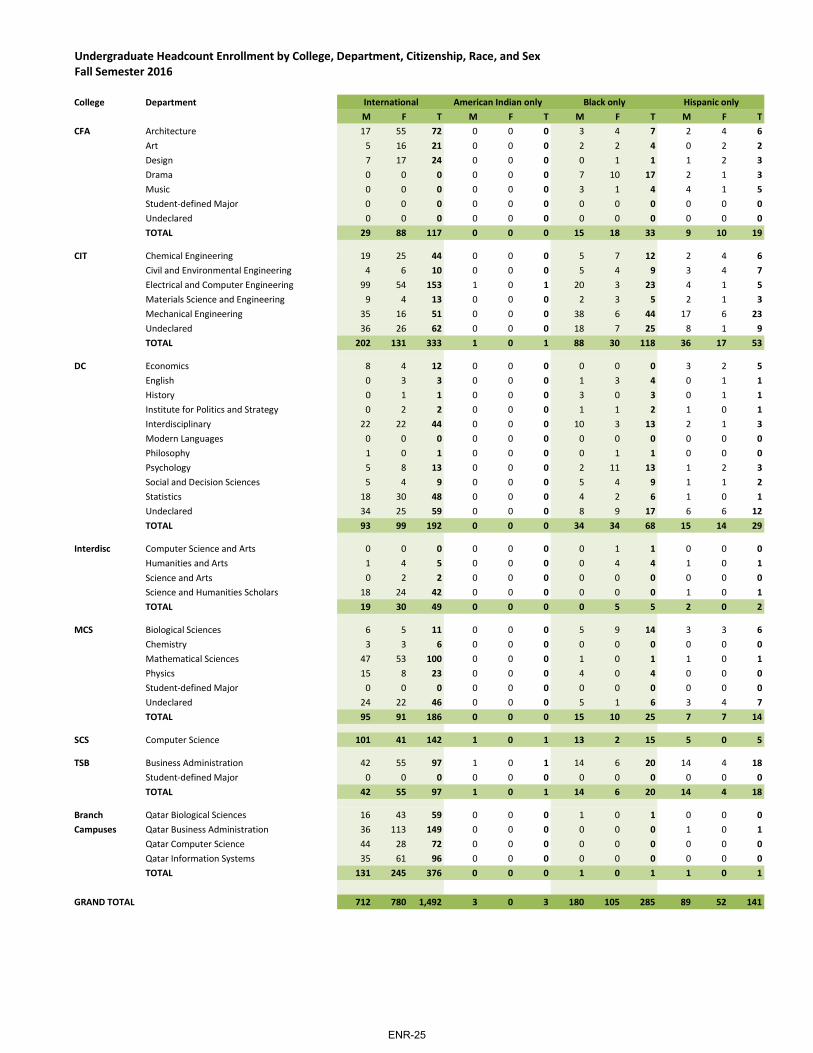
Undergraduate Headcount Enrollment by College, Department, Citizenship, Race, and Sex Fall Semester 2016
College Department International American Indian only Black only Hispanic onlyM F T M F T M F T M F T
CFA Architecture 17 55 72 0 0 0 3 4 7 2 4 6Art 5 16 21 0 0 0 2 2 4 0 2 2Design 7 17 24 0 0 0 0 1 1 1 2 3Drama 0 0 0 0 0 0 7 10 17 2 1 3Music 0 0 0 0 0 0 3 1 4 4 1 5Studentdefined Major 0 0 0 0 0 0 0 0 0 0 0 0Undeclared 0 0 0 0 0 0 0 0 0 0 0 0TOTAL 29 88 117 0 0 0 15 18 33 9 10 19
CIT Chemical Engineering 19 25 44 0 0 0 5 7 12 2 4 6Civil and Environmental Engineering 4 6 10 0 0 0 5 4 9 3 4 7Electrical and Computer Engineering 99 54 153 1 0 1 20 3 23 4 1 5Materials Science and Engineering 9 4 13 0 0 0 2 3 5 2 1 3Mechanical Engineering 35 16 51 0 0 0 38 6 44 17 6 23Undeclared 36 26 62 0 0 0 18 7 25 8 1 9TOTAL 202 131 333 1 0 1 88 30 118 36 17 53
DC Economics 8 4 12 0 0 0 0 0 0 3 2 5English 0 3 3 0 0 0 1 3 4 0 1 1History 0 1 1 0 0 0 3 0 3 0 1 1Institute for Politics and Strategy 0 2 2 0 0 0 1 1 2 1 0 1Interdisciplinary 22 22 44 0 0 0 10 3 13 2 1 3Modern Languages 0 0 0 0 0 0 0 0 0 0 0 0Philosophy 1 0 1 0 0 0 0 1 1 0 0 0Psychology 5 8 13 0 0 0 2 11 13 1 2 3Social and Decision Sciences 5 4 9 0 0 0 5 4 9 1 1 2Statistics 18 30 48 0 0 0 4 2 6 1 0 1Undeclared 34 25 59 0 0 0 8 9 17 6 6 12TOTAL 93 99 192 0 0 0 34 34 68 15 14 29
Interdisc Computer Science and Arts 0 0 0 0 0 0 0 1 1 0 0 0Humanities and Arts 1 4 5 0 0 0 0 4 4 1 0 1Science and Arts 0 2 2 0 0 0 0 0 0 0 0 0Science and Humanities Scholars 18 24 42 0 0 0 0 0 0 1 0 1TOTAL 19 30 49 0 0 0 0 5 5 2 0 2
MCS Biological Sciences 6 5 11 0 0 0 5 9 14 3 3 6Chemistry 3 3 6 0 0 0 0 0 0 0 0 0Mathematical Sciences 47 53 100 0 0 0 1 0 1 1 0 1Physics 15 8 23 0 0 0 4 0 4 0 0 0Studentdefined Major 0 0 0 0 0 0 0 0 0 0 0 0Undeclared 24 22 46 0 0 0 5 1 6 3 4 7TOTAL 95 91 186 0 0 0 15 10 25 7 7 14
SCS Computer Science 101 41 142 1 0 1 13 2 15 5 0 5
TSB Business Administration 42 55 97 1 0 1 14 6 20 14 4 18Studentdefined Major 0 0 0 0 0 0 0 0 0 0 0 0TOTAL 42 55 97 1 0 1 14 6 20 14 4 18
Branch Qatar Biological Sciences 16 43 59 0 0 0 1 0 1 0 0 0Campuses Qatar Business Administration 36 113 149 0 0 0 0 0 0 1 0 1
Qatar Computer Science 44 28 72 0 0 0 0 0 0 0 0 0Qatar Information Systems 35 61 96 0 0 0 0 0 0 0 0 0TOTAL 131 245 376 0 0 0 1 0 1 1 0 1
GRAND TOTAL 712 780 1,492 3 0 3 180 105 285 89 52 141
ENR-25
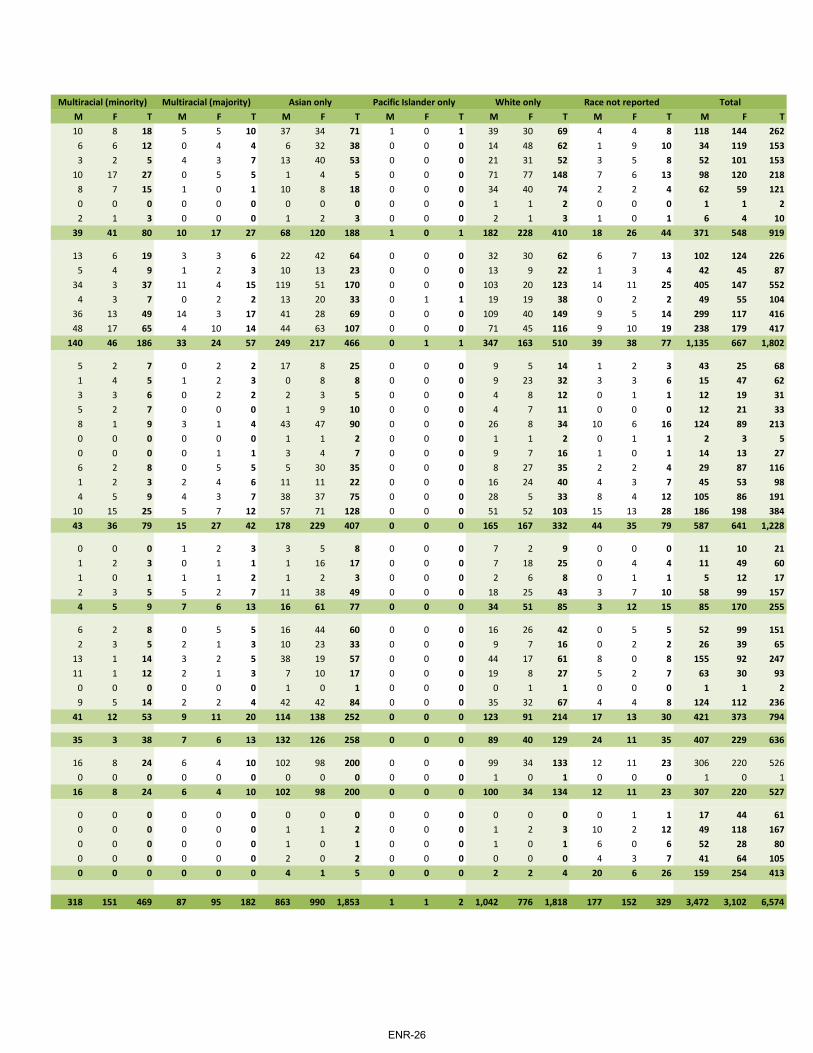
Multiracial (minority) Multiracial (majority) Asian only Pacific Islander only White only Race not reported TotalM F T M F T M F T M F T M F T M F T M F T10 8 18 5 5 10 37 34 71 1 0 1 39 30 69 4 4 8 118 144 262
6 6 12 0 4 4 6 32 38 0 0 0 14 48 62 1 9 10 34 119 1533 2 5 4 3 7 13 40 53 0 0 0 21 31 52 3 5 8 52 101 153
10 17 27 0 5 5 1 4 5 0 0 0 71 77 148 7 6 13 98 120 2188 7 15 1 0 1 10 8 18 0 0 0 34 40 74 2 2 4 62 59 1210 0 0 0 0 0 0 0 0 0 0 0 1 1 2 0 0 0 1 1 22 1 3 0 0 0 1 2 3 0 0 0 2 1 3 1 0 1 6 4 10
39 41 80 10 17 27 68 120 188 1 0 1 182 228 410 18 26 44 371 548 919
13 6 19 3 3 6 22 42 64 0 0 0 32 30 62 6 7 13 102 124 2265 4 9 1 2 3 10 13 23 0 0 0 13 9 22 1 3 4 42 45 87
34 3 37 11 4 15 119 51 170 0 0 0 103 20 123 14 11 25 405 147 5524 3 7 0 2 2 13 20 33 0 1 1 19 19 38 0 2 2 49 55 104
36 13 49 14 3 17 41 28 69 0 0 0 109 40 149 9 5 14 299 117 41648 17 65 4 10 14 44 63 107 0 0 0 71 45 116 9 10 19 238 179 417
140 46 186 33 24 57 249 217 466 0 1 1 347 163 510 39 38 77 1,135 667 1,802
5 2 7 0 2 2 17 8 25 0 0 0 9 5 14 1 2 3 43 25 681 4 5 1 2 3 0 8 8 0 0 0 9 23 32 3 3 6 15 47 623 3 6 0 2 2 2 3 5 0 0 0 4 8 12 0 1 1 12 19 315 2 7 0 0 0 1 9 10 0 0 0 4 7 11 0 0 0 12 21 338 1 9 3 1 4 43 47 90 0 0 0 26 8 34 10 6 16 124 89 2130 0 0 0 0 0 1 1 2 0 0 0 1 1 2 0 1 1 2 3 50 0 0 0 1 1 3 4 7 0 0 0 9 7 16 1 0 1 14 13 276 2 8 0 5 5 5 30 35 0 0 0 8 27 35 2 2 4 29 87 1161 2 3 2 4 6 11 11 22 0 0 0 16 24 40 4 3 7 45 53 984 5 9 4 3 7 38 37 75 0 0 0 28 5 33 8 4 12 105 86 191
10 15 25 5 7 12 57 71 128 0 0 0 51 52 103 15 13 28 186 198 38443 36 79 15 27 42 178 229 407 0 0 0 165 167 332 44 35 79 587 641 1,228
0 0 0 1 2 3 3 5 8 0 0 0 7 2 9 0 0 0 11 10 211 2 3 0 1 1 1 16 17 0 0 0 7 18 25 0 4 4 11 49 601 0 1 1 1 2 1 2 3 0 0 0 2 6 8 0 1 1 5 12 172 3 5 5 2 7 11 38 49 0 0 0 18 25 43 3 7 10 58 99 1574 5 9 7 6 13 16 61 77 0 0 0 34 51 85 3 12 15 85 170 255
6 2 8 0 5 5 16 44 60 0 0 0 16 26 42 0 5 5 52 99 1512 3 5 2 1 3 10 23 33 0 0 0 9 7 16 0 2 2 26 39 65
13 1 14 3 2 5 38 19 57 0 0 0 44 17 61 8 0 8 155 92 24711 1 12 2 1 3 7 10 17 0 0 0 19 8 27 5 2 7 63 30 93
0 0 0 0 0 0 1 0 1 0 0 0 0 1 1 0 0 0 1 1 29 5 14 2 2 4 42 42 84 0 0 0 35 32 67 4 4 8 124 112 236
41 12 53 9 11 20 114 138 252 0 0 0 123 91 214 17 13 30 421 373 794
35 3 38 7 6 13 132 126 258 0 0 0 89 40 129 24 11 35 407 229 636
16 8 24 6 4 10 102 98 200 0 0 0 99 34 133 12 11 23 306 220 5260 0 0 0 0 0 0 0 0 0 0 0 1 0 1 0 0 0 1 0 1
16 8 24 6 4 10 102 98 200 0 0 0 100 34 134 12 11 23 307 220 527
0 0 0 0 0 0 0 0 0 0 0 0 0 0 0 0 1 1 17 44 610 0 0 0 0 0 1 1 2 0 0 0 1 2 3 10 2 12 49 118 1670 0 0 0 0 0 1 0 1 0 0 0 1 0 1 6 0 6 52 28 800 0 0 0 0 0 2 0 2 0 0 0 0 0 0 4 3 7 41 64 1050 0 0 0 0 0 4 1 5 0 0 0 2 2 4 20 6 26 159 254 413
318 151 469 87 95 182 863 990 1,853 1 1 2 1,042 776 1,818 177 152 329 3,472 3,102 6,574
ENR-26
Master's Headcount Enrollment by College, Department, Citizenship, Race, and Sex Fall Semester 2016
College Department International American Indian only Black only Hispanic onlyM F T M F T M F T M F T
CFA Architecture 22 32 54 0 0 0 1 0 1 0 0 0Art 0 2 2 1 0 1 0 0 0 0 1 1Design 6 15 21 0 0 0 0 0 0 0 0 0Drama 4 9 13 0 0 0 1 1 2 0 2 2Music 10 16 26 0 0 0 1 0 1 0 0 0TOTAL 42 74 116 1 0 1 3 1 4 0 3 3
CIT Biomedical Engineering 28 23 51 0 0 0 0 1 1 0 1 1Chemical Engineering 54 21 75 0 0 0 0 0 0 1 0 1Civil and Environmental Engineering 90 59 149 0 0 0 1 2 3 0 0 0Electrical and Computer Engineering 167 111 278 0 0 0 1 3 4 3 0 3Information and Communication Tech 44 17 61 0 0 0 0 0 0 0 0 0Information Networking Institute 140 64 204 0 0 0 1 0 1 1 0 1Interdisciplinary 36 14 50 0 0 0 0 0 0 0 0 0Materials Science and Engineering 32 9 41 0 0 0 0 0 0 0 0 0Mechanical Engineering 132 19 151 0 0 0 6 2 8 1 1 2TOTAL 723 337 1,060 0 0 0 9 8 17 6 2 8
DC English 1 3 4 0 0 0 0 0 0 0 1 1Modern Languages 0 3 3 0 0 0 0 0 0 0 0 0Philosophy 3 1 4 0 0 0 0 0 0 0 0 0Statistics 5 10 15 0 0 0 0 0 0 0 0 0TOTAL 9 17 26 0 0 0 0 0 0 0 1 1
HC Creative Enterprise 10 32 42 0 0 0 1 3 4 0 0 0Health Care Policy 3 6 9 0 1 1 1 1 2 1 0 1Heinz General 0 1 1 0 0 0 1 0 1 0 0 0Information Security Policy and Mgmt 17 7 24 0 0 0 0 1 1 0 1 1Information Systems 201 202 403 0 0 0 2 1 3 2 0 2Information Technology 114 73 187 0 0 0 3 2 5 3 0 3Medical Management 3 1 4 0 0 0 2 0 2 0 0 0Public Management 6 2 8 0 0 0 2 4 6 1 0 1Public Policy and Management 31 66 97 0 0 0 2 8 10 1 1 2TOTAL 385 390 775 0 1 1 14 20 34 8 2 10
Interdisc Entertainment Technology 65 49 114 0 0 0 1 1 2 0 0 0Integrated Innovation Institute 20 24 44 0 0 0 2 0 2 0 1 1TOTAL 85 73 158 0 0 0 3 1 4 0 1 1
MCS Biological Sciences 20 18 38 0 0 0 0 0 0 0 0 0Chemistry 1 0 1 0 0 0 0 0 0 0 0 0TOTAL 21 18 39 0 0 0 0 0 0 0 0 0
SCS Computer Science 41 15 56 0 0 0 0 0 0 0 0 0HumanComputer Interaction 14 24 38 0 0 0 2 2 4 0 0 0Institute for Software Research 101 59 160 0 0 0 0 0 0 0 0 0Language Technologies Institute 174 82 256 0 0 0 0 0 0 0 0 0Machine Learning 14 6 20 0 0 0 0 0 0 0 0 0Robotics 138 33 171 0 0 0 0 0 0 1 0 1TOTAL 482 219 701 0 0 0 2 2 4 1 0 1
TSB School of Business 196 120 316 0 0 0 14 4 18 1 1 2School of Business, Flextime 30 4 34 0 0 0 5 4 9 2 0 2TOTAL 226 124 350 0 0 0 19 8 27 3 1 4
Branch SV Electrical and Computer Engineering 110 42 152 0 0 0 0 0 0 0 0 0Campuses SV Information Networking Institute 20 18 38 0 0 0 1 0 1 0 0 0
SV Integrated Innovation Institute 23 32 55 0 0 0 0 0 0 0 0 0TOTAL 153 92 245 0 0 0 1 0 1 0 0 0
GRAND TOTAL 2,126 1,344 3,470 1 1 2 51 40 91 18 10 28
ENR-27

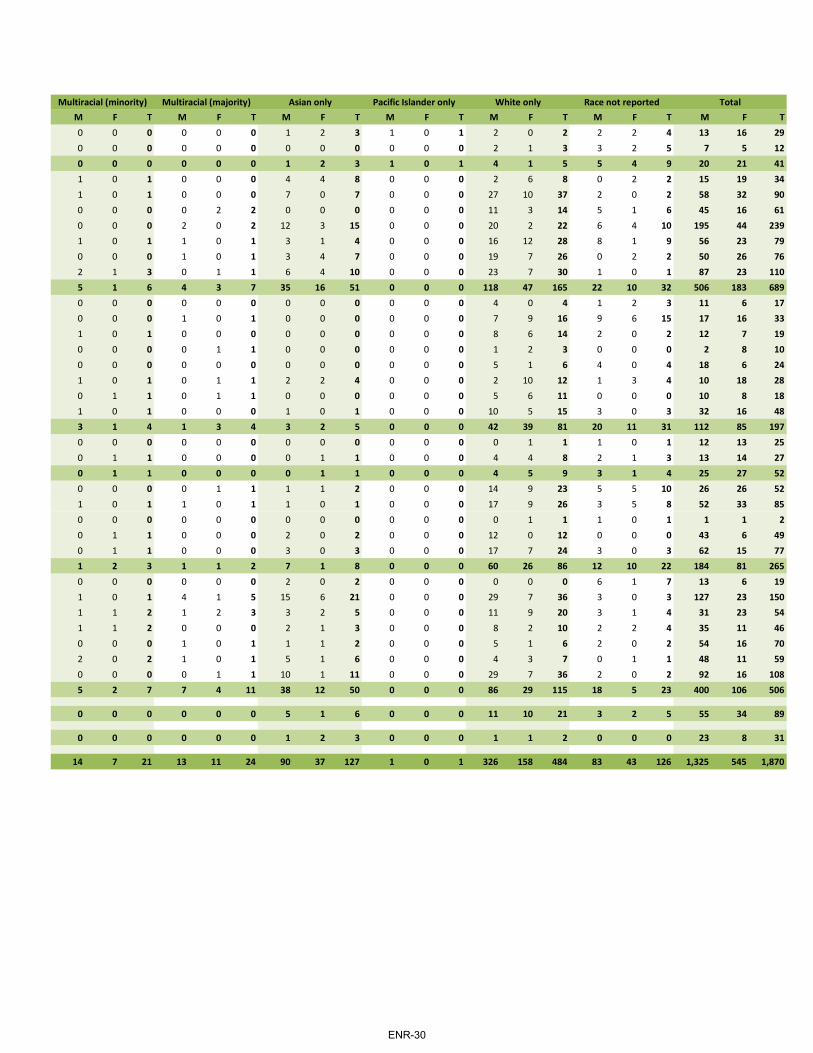
Multiracial (minority) Multiracial (majority) Asian only Pacific Islander only White only Race not reported TotalM F T M F T M F T M F T M F T M F T M F T0 0 0 1 1 2 1 1 2 0 0 0 5 3 8 3 3 6 33 40 731 0 1 0 0 0 1 0 1 0 0 0 3 3 6 2 2 4 8 8 161 1 2 0 1 1 0 5 5 0 0 0 4 14 18 0 3 3 11 39 500 0 0 1 1 2 0 0 0 0 0 0 19 25 44 2 4 6 27 42 695 2 7 0 0 0 4 2 6 0 0 0 26 29 55 1 1 2 47 50 977 3 10 2 3 5 6 8 14 0 0 0 57 74 131 8 13 21 126 179 305
0 1 1 0 0 0 8 4 12 0 0 0 3 4 7 2 4 6 41 38 791 0 1 0 0 0 3 4 7 0 0 0 4 4 8 0 0 0 63 29 922 2 4 0 0 0 3 6 9 0 0 0 9 4 13 0 2 2 105 75 1803 0 3 0 0 0 14 7 21 0 0 0 9 3 12 4 0 4 201 124 3250 0 0 0 0 0 0 0 0 0 0 0 0 0 0 0 0 0 44 17 610 0 0 0 0 0 4 1 5 0 0 0 10 3 13 5 0 5 161 68 2290 0 0 0 0 0 3 0 3 0 0 0 6 5 11 1 0 1 46 19 650 0 0 0 0 0 1 1 2 0 0 0 6 1 7 1 0 1 40 11 513 1 4 0 0 0 13 0 13 0 0 0 19 1 20 8 5 13 182 29 2119 4 13 0 0 0 49 23 72 0 0 0 66 25 91 21 11 32 883 410 1,293
1 0 1 0 0 0 1 2 3 0 0 0 6 21 27 6 12 18 15 39 541 0 1 1 0 1 0 0 0 0 0 0 3 0 3 0 0 0 5 3 80 1 1 0 0 0 1 0 1 0 0 0 2 1 3 1 0 1 7 3 100 0 0 0 1 1 1 0 1 0 0 0 4 1 5 1 2 3 11 14 252 1 3 1 1 2 3 2 5 0 0 0 15 23 38 8 14 22 38 59 97
1 4 5 1 2 3 1 10 11 0 0 0 17 29 46 1 1 2 32 81 1131 2 3 0 0 0 2 4 6 0 0 0 6 7 13 0 0 0 14 21 350 0 0 0 0 0 0 0 0 0 0 0 5 3 8 0 0 0 6 4 102 0 2 0 1 1 1 0 1 0 0 0 17 9 26 1 0 1 38 19 571 0 1 1 0 1 6 12 18 0 0 0 26 11 37 4 0 4 243 226 4697 1 8 1 0 1 7 2 9 0 1 1 59 15 74 10 2 12 204 96 3002 1 3 1 0 1 6 4 10 0 0 0 23 10 33 4 2 6 41 18 591 1 2 0 0 0 0 2 2 0 0 0 15 33 48 5 2 7 30 44 742 4 6 0 0 0 6 7 13 0 0 0 44 53 97 5 3 8 91 142 233
17 13 30 4 3 7 29 41 70 0 1 1 212 170 382 30 10 40 699 651 1,350
2 1 3 0 1 1 2 2 4 0 0 0 12 5 17 8 1 9 90 60 1501 1 2 0 0 0 0 1 1 0 0 0 4 4 8 3 1 4 30 32 623 2 5 0 1 1 2 3 5 0 0 0 16 9 25 11 2 13 120 92 212
0 0 0 0 0 0 1 2 3 0 0 0 7 0 7 0 1 1 28 21 490 0 0 0 0 0 0 0 0 0 0 0 0 0 0 0 0 0 1 0 10 0 0 0 0 0 1 2 3 0 0 0 7 0 7 0 1 1 29 21 50
0 0 0 0 0 0 6 1 7 0 0 0 7 0 7 1 0 1 55 16 710 1 1 2 1 3 5 14 19 0 0 0 13 16 29 2 5 7 38 63 1010 0 0 1 0 1 9 1 10 0 0 0 5 0 5 1 0 1 117 60 1770 0 0 0 0 0 2 0 2 0 0 0 8 1 9 4 1 5 188 84 2720 0 0 0 0 0 2 0 2 0 0 0 3 0 3 1 0 1 20 6 264 1 5 3 0 3 10 3 13 0 0 0 22 1 23 9 2 11 187 40 2274 2 6 6 1 7 34 19 53 0 0 0 58 18 76 18 8 26 605 269 874
13 2 15 4 1 5 56 14 70 0 0 0 151 34 185 6 2 8 441 178 6198 3 11 1 2 3 38 20 58 1 0 1 124 39 163 11 1 12 220 73 293
21 5 26 5 3 8 94 34 128 1 0 1 275 73 348 17 3 20 661 251 912
2 0 2 0 1 1 6 1 7 0 0 0 2 1 3 1 0 1 121 45 1660 0 0 0 0 0 1 0 1 0 0 0 1 0 1 0 0 0 23 18 411 0 1 0 0 0 3 2 5 0 0 0 5 2 7 3 4 7 35 40 753 0 3 0 1 1 10 3 13 0 0 0 8 3 11 4 4 8 179 103 282
66 30 96 18 13 31 228 135 363 1 1 2 714 395 1,109 117 66 183 3,340 2,035 5,375
ENR-28

Doctoral Headcount Enrollment by College, Department, Citizenship, Race, and Sex Fall Semester 2016
College Department International American Indian only Black only Hispanic onlyM F T M F T M F T M F T
CFA Architecture 7 12 19 0 0 0 0 0 0 0 0 0Design 1 2 3 0 0 0 1 0 1 0 0 0TOTAL 8 14 22 0 0 0 1 0 1 0 0 0
CIT Biomedical Engineering 8 6 14 0 0 0 0 1 1 0 0 0Chemical Engineering 21 22 43 0 0 0 0 0 0 0 0 0Civil and Environmental Engineering 28 10 38 0 0 0 1 0 1 0 0 0Electrical and Computer Engineering 154 35 189 0 0 0 0 0 0 1 0 1Engineering and Public Policy 24 8 32 0 0 0 3 1 4 0 0 0Materials Science and Engineering 26 13 39 0 0 0 1 0 1 0 0 0Mechanical Engineering 50 9 59 0 0 0 5 1 6 0 0 0TOTAL 311 103 414 0 0 0 10 3 13 1 0 1
DC Center for Neural Basis of Cognition 6 4 10 0 0 0 0 0 0 0 0 0English 0 1 1 0 0 0 0 0 0 0 0 0History 1 1 2 0 0 0 0 0 0 0 0 0Modern Languages 1 5 6 0 0 0 0 0 0 0 0 0Philosophy 9 5 14 0 0 0 0 0 0 0 0 0Psychology 2 2 4 0 0 0 2 0 2 0 0 0Social and Decision Sciences 4 0 4 0 0 0 0 0 0 1 0 1Statistics 17 11 28 0 0 0 0 0 0 0 0 0TOTAL 40 29 69 0 0 0 2 0 2 1 0 1
HC Information Systems 11 12 23 0 0 0 0 0 0 0 0 0Public Policy and Management 7 7 14 0 0 0 0 0 0 0 0 0TOTAL 18 19 37 0 0 0 0 0 0 0 0 0
MCS Biological Sciences 5 9 14 0 0 0 1 0 1 0 1 1Chemistry 28 19 47 0 0 0 1 0 1 0 0 0Interdisciplinary 0 0 0 0 0 0 0 0 0 0 0 0Mathematical Sciences 29 5 34 0 0 0 0 0 0 0 0 0Physics 39 7 46 0 0 0 0 0 0 0 0 0TOTAL 101 40 141 0 0 0 2 0 2 0 1 1
SCS Computational Biology 4 5 9 0 0 0 1 0 1 0 0 0Computer Science 75 9 84 0 0 0 0 0 0 0 0 0HumanComputer Interaction 12 8 20 0 0 0 0 0 0 0 0 0Institute for Software Research 22 5 27 0 0 0 0 0 0 0 0 0Language Technologies Institute 45 14 59 0 0 0 0 0 0 0 0 0Machine Learning 36 6 42 0 0 0 0 0 0 0 0 0Robotics 50 7 57 0 0 0 0 0 0 1 0 1TOTAL 244 54 298 0 0 0 1 0 1 1 0 1
TSB School of Business 36 21 57 0 0 0 0 0 0 0 0 0
Branch SV Electrical and Computer Engineering 20 5 25 0 0 0 0 0 0 1 0 1CampusesGRAND TOTAL 778 285 1,063 0 0 0 16 3 19 4 1 5
ENR-29
Multiracial (minority) Multiracial (majority) Asian only Pacific Islander only White only Race not reported TotalM F T M F T M F T M F T M F T M F T M F T0 0 0 0 0 0 1 2 3 1 0 1 2 0 2 2 2 4 13 16 290 0 0 0 0 0 0 0 0 0 0 0 2 1 3 3 2 5 7 5 120 0 0 0 0 0 1 2 3 1 0 1 4 1 5 5 4 9 20 21 411 0 1 0 0 0 4 4 8 0 0 0 2 6 8 0 2 2 15 19 341 0 1 0 0 0 7 0 7 0 0 0 27 10 37 2 0 2 58 32 900 0 0 0 2 2 0 0 0 0 0 0 11 3 14 5 1 6 45 16 610 0 0 2 0 2 12 3 15 0 0 0 20 2 22 6 4 10 195 44 2391 0 1 1 0 1 3 1 4 0 0 0 16 12 28 8 1 9 56 23 790 0 0 1 0 1 3 4 7 0 0 0 19 7 26 0 2 2 50 26 762 1 3 0 1 1 6 4 10 0 0 0 23 7 30 1 0 1 87 23 1105 1 6 4 3 7 35 16 51 0 0 0 118 47 165 22 10 32 506 183 6890 0 0 0 0 0 0 0 0 0 0 0 4 0 4 1 2 3 11 6 170 0 0 1 0 1 0 0 0 0 0 0 7 9 16 9 6 15 17 16 331 0 1 0 0 0 0 0 0 0 0 0 8 6 14 2 0 2 12 7 190 0 0 0 1 1 0 0 0 0 0 0 1 2 3 0 0 0 2 8 100 0 0 0 0 0 0 0 0 0 0 0 5 1 6 4 0 4 18 6 241 0 1 0 1 1 2 2 4 0 0 0 2 10 12 1 3 4 10 18 280 1 1 0 1 1 0 0 0 0 0 0 5 6 11 0 0 0 10 8 181 0 1 0 0 0 1 0 1 0 0 0 10 5 15 3 0 3 32 16 483 1 4 1 3 4 3 2 5 0 0 0 42 39 81 20 11 31 112 85 1970 0 0 0 0 0 0 0 0 0 0 0 0 1 1 1 0 1 12 13 250 1 1 0 0 0 0 1 1 0 0 0 4 4 8 2 1 3 13 14 270 1 1 0 0 0 0 1 1 0 0 0 4 5 9 3 1 4 25 27 520 0 0 0 1 1 1 1 2 0 0 0 14 9 23 5 5 10 26 26 521 0 1 1 0 1 1 0 1 0 0 0 17 9 26 3 5 8 52 33 850 0 0 0 0 0 0 0 0 0 0 0 0 1 1 1 0 1 1 1 20 1 1 0 0 0 2 0 2 0 0 0 12 0 12 0 0 0 43 6 490 1 1 0 0 0 3 0 3 0 0 0 17 7 24 3 0 3 62 15 771 2 3 1 1 2 7 1 8 0 0 0 60 26 86 12 10 22 184 81 2650 0 0 0 0 0 2 0 2 0 0 0 0 0 0 6 1 7 13 6 191 0 1 4 1 5 15 6 21 0 0 0 29 7 36 3 0 3 127 23 1501 1 2 1 2 3 3 2 5 0 0 0 11 9 20 3 1 4 31 23 541 1 2 0 0 0 2 1 3 0 0 0 8 2 10 2 2 4 35 11 460 0 0 1 0 1 1 1 2 0 0 0 5 1 6 2 0 2 54 16 702 0 2 1 0 1 5 1 6 0 0 0 4 3 7 0 1 1 48 11 590 0 0 0 1 1 10 1 11 0 0 0 29 7 36 2 0 2 92 16 1085 2 7 7 4 11 38 12 50 0 0 0 86 29 115 18 5 23 400 106 506
0 0 0 0 0 0 5 1 6 0 0 0 11 10 21 3 2 5 55 34 89
0 0 0 0 0 0 1 2 3 0 0 0 1 1 2 0 0 0 23 8 31
14 7 21 13 11 24 90 37 127 1 0 1 326 158 484 83 43 126 1,325 545 1,870
ENR-30
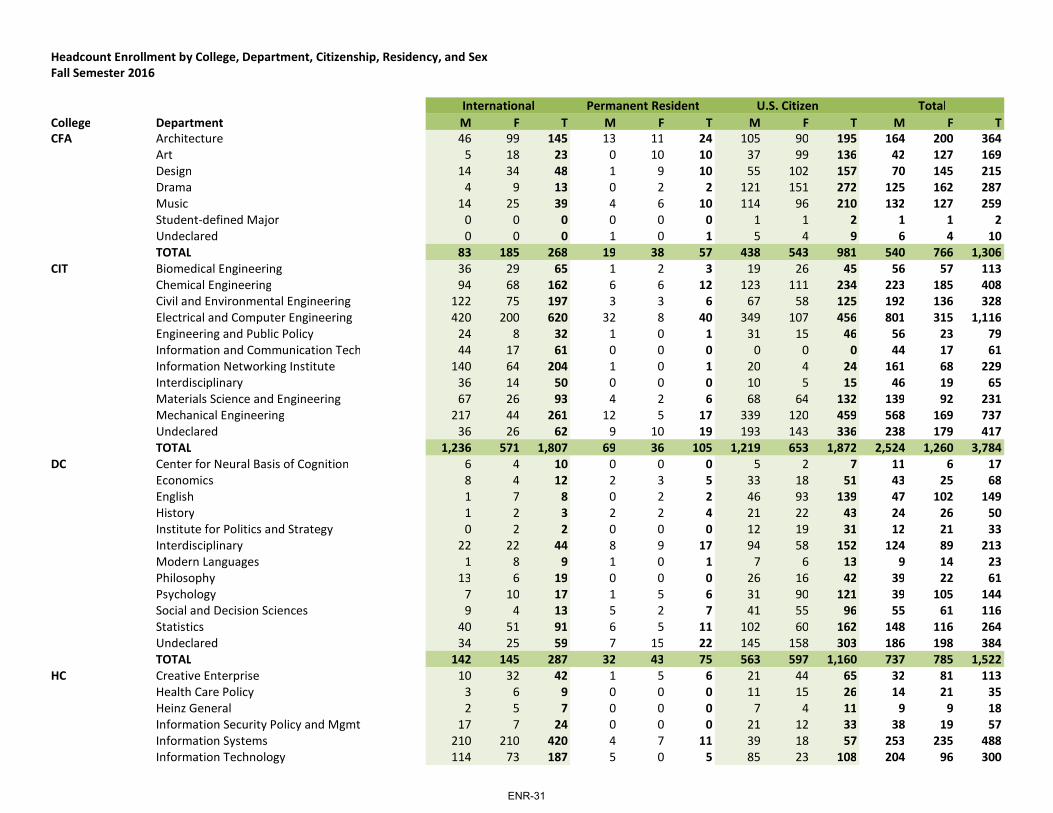
Headcount Enrollment by College, Department, Citizenship, Residency, and Sex
International Permanent Resident U.S. Citizen TotalCollege Department M F T M F T M F T M F TCFA Architecture 46 99 145 13 11 24 105 90 195 164 200 364
Art 5 18 23 0 10 10 37 99 136 42 127 169Design 14 34 48 1 9 10 55 102 157 70 145 215Drama 4 9 13 0 2 2 121 151 272 125 162 287Music 14 25 39 4 6 10 114 96 210 132 127 259Studentdefined Major 0 0 0 0 0 0 1 1 2 1 1 2Undeclared 0 0 0 1 0 1 5 4 9 6 4 10TOTAL 83 185 268 19 38 57 438 543 981 540 766 1,306
CIT Biomedical Engineering 36 29 65 1 2 3 19 26 45 56 57 113Chemical Engineering 94 68 162 6 6 12 123 111 234 223 185 408Civil and Environmental Engineering 122 75 197 3 3 6 67 58 125 192 136 328Electrical and Computer Engineering 420 200 620 32 8 40 349 107 456 801 315 1,116Engineering and Public Policy 24 8 32 1 0 1 31 15 46 56 23 79Information and Communication Tech 44 17 61 0 0 0 0 0 0 44 17 61Information Networking Institute 140 64 204 1 0 1 20 4 24 161 68 229Interdisciplinary 36 14 50 0 0 0 10 5 15 46 19 65Materials Science and Engineering 67 26 93 4 2 6 68 64 132 139 92 231Mechanical Engineering 217 44 261 12 5 17 339 120 459 568 169 737Undeclared 36 26 62 9 10 19 193 143 336 238 179 417TOTAL 1,236 571 1,807 69 36 105 1,219 653 1,872 2,524 1,260 3,784
DC Center for Neural Basis of Cognition 6 4 10 0 0 0 5 2 7 11 6 17Economics 8 4 12 2 3 5 33 18 51 43 25 68English 1 7 8 0 2 2 46 93 139 47 102 149History 1 2 3 2 2 4 21 22 43 24 26 50Institute for Politics and Strategy 0 2 2 0 0 0 12 19 31 12 21 33Interdisciplinary 22 22 44 8 9 17 94 58 152 124 89 213Modern Languages 1 8 9 1 0 1 7 6 13 9 14 23Philosophy 13 6 19 0 0 0 26 16 42 39 22 61Psychology 7 10 17 1 5 6 31 90 121 39 105 144Social and Decision Sciences 9 4 13 5 2 7 41 55 96 55 61 116Statistics 40 51 91 6 5 11 102 60 162 148 116 264Undeclared 34 25 59 7 15 22 145 158 303 186 198 384TOTAL 142 145 287 32 43 75 563 597 1,160 737 785 1,522
HC Creative Enterprise 10 32 42 1 5 6 21 44 65 32 81 113Health Care Policy 3 6 9 0 0 0 11 15 26 14 21 35Heinz General 2 5 7 0 0 0 7 4 11 9 9 18Information Security Policy and Mgmt 17 7 24 0 0 0 21 12 33 38 19 57Information Systems 210 210 420 4 7 11 39 18 57 253 235 488Information Technology 114 73 187 5 0 5 85 23 108 204 96 300
Fall Semester 2016
ENR-31

Medical Management 3 1 4 6 1 7 32 16 48 41 18 59Public Management 6 2 8 0 1 1 24 41 65 30 44 74Public Policy and Management 38 73 111 3 2 5 63 81 144 104 156 260TOTAL 403 409 812 19 16 35 303 254 557 725 679 1,404
Interdisc Computer Science and Arts 0 0 0 0 1 1 11 9 20 11 10 21Entertainment Technology 65 49 114 0 0 0 25 11 36 90 60 150Humanities and Arts 1 4 5 0 1 1 10 44 54 11 49 60Integrated Innovation Institute 20 24 44 0 0 0 10 8 18 30 32 62Science and Arts 0 2 2 0 0 0 5 10 15 5 12 17Science and Humanities Scholars 18 24 42 0 6 6 40 69 109 58 99 157TOTAL 104 103 207 0 8 8 101 151 252 205 262 467
MCS Biological Sciences 31 32 63 5 9 14 70 105 175 106 146 252Chemistry 32 22 54 5 6 11 42 44 86 79 72 151Interdisciplinary 0 0 0 0 0 0 1 1 2 1 1 2Mathematical Sciences 76 58 134 12 3 15 110 37 147 198 98 296Physics 54 15 69 1 0 1 70 30 100 125 45 170Studentdefined Major 0 0 0 0 0 0 1 1 2 1 1 2Undeclared 24 22 46 10 7 17 90 83 173 124 112 236TOTAL 217 149 366 33 25 58 384 301 685 634 475 1,109
SCS Computational Biology 4 5 9 0 0 0 9 1 10 13 6 19Computer Science 217 65 282 27 20 47 345 183 528 589 268 857HumanComputer Interaction 26 32 58 1 1 2 42 53 95 69 86 155Institute for Software Research 123 64 187 2 2 4 27 5 32 152 71 223Language Technologies Institute 219 96 315 3 1 4 20 3 23 242 100 342Machine Learning 50 12 62 2 1 3 16 4 20 68 17 85Robotics 188 40 228 2 0 2 89 16 105 279 56 335TOTAL 827 314 1,141 37 25 62 548 265 813 1,412 604 2,016
TSB Business Administration 42 55 97 20 18 38 244 147 391 306 220 526School of Business 232 141 373 15 6 21 249 65 314 496 212 708School of Business, Flextime 30 4 34 12 10 22 178 59 237 220 73 293Studentdefined Major 0 0 0 0 0 0 1 0 1 1 0 1TOTAL 304 200 504 47 34 81 672 271 943 1,023 505 1,528
Nondegree Qatar Biological Sciences 16 43 59 0 1 1 1 0 1 17 44 61Branch Qatar Business Administration 36 113 149 5 2 7 8 3 11 49 118 167Campuses Qatar Computer Science 44 28 72 3 0 3 5 0 5 52 28 80
Qatar Information Systems 35 61 96 5 2 7 1 1 2 41 64 105SV Electrical and Computer Engineering 130 47 177 2 1 3 12 5 17 144 53 197SV Information Networking Institute 20 18 38 0 0 0 3 0 3 23 18 41SV Integrated Innovation Institute 23 32 55 1 2 3 11 6 17 35 40 75TOTAL 304 342 646 16 8 24 41 15 56 361 365 726
GRAND TOTAL 3,636 2,424 6,060 272 234 506 4,318 3,077 7,395 8,226 5,735 13,961
ENR-32
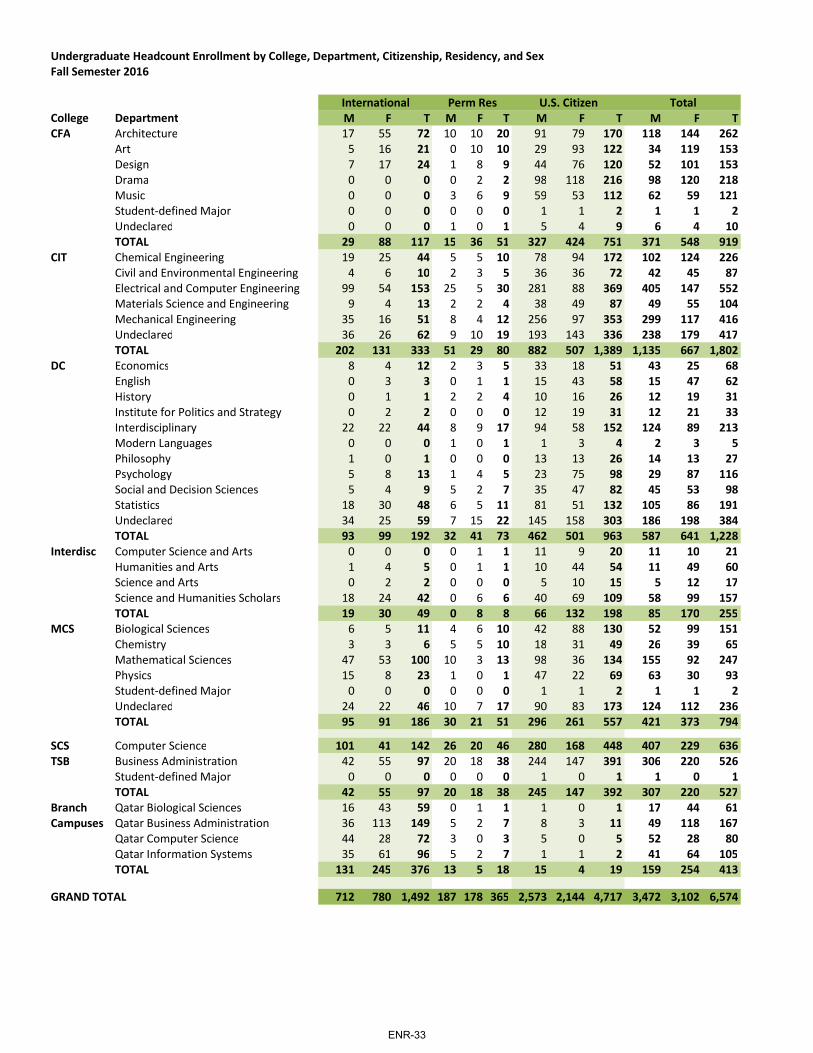
Undergraduate Headcount Enrollment by College, Department, Citizenship, Residency, and Sex Fall Semester 2016
International Perm Res U.S. Citizen TotalCollege Department M F T M F T M F T M F TCFA Architecture 17 55 72 10 10 20 91 79 170 118 144 262
Art 5 16 21 0 10 10 29 93 122 34 119 153Design 7 17 24 1 8 9 44 76 120 52 101 153Drama 0 0 0 0 2 2 98 118 216 98 120 218Music 0 0 0 3 6 9 59 53 112 62 59 121Studentdefined Major 0 0 0 0 0 0 1 1 2 1 1 2Undeclared 0 0 0 1 0 1 5 4 9 6 4 10TOTAL 29 88 117 15 36 51 327 424 751 371 548 919
CIT Chemical Engineering 19 25 44 5 5 10 78 94 172 102 124 226Civil and Environmental Engineering 4 6 10 2 3 5 36 36 72 42 45 87Electrical and Computer Engineering 99 54 153 25 5 30 281 88 369 405 147 552Materials Science and Engineering 9 4 13 2 2 4 38 49 87 49 55 104Mechanical Engineering 35 16 51 8 4 12 256 97 353 299 117 416Undeclared 36 26 62 9 10 19 193 143 336 238 179 417TOTAL 202 131 333 51 29 80 882 507 1,389 1,135 667 1,802
DC Economics 8 4 12 2 3 5 33 18 51 43 25 68English 0 3 3 0 1 1 15 43 58 15 47 62History 0 1 1 2 2 4 10 16 26 12 19 31Institute for Politics and Strategy 0 2 2 0 0 0 12 19 31 12 21 33Interdisciplinary 22 22 44 8 9 17 94 58 152 124 89 213Modern Languages 0 0 0 1 0 1 1 3 4 2 3 5Philosophy 1 0 1 0 0 0 13 13 26 14 13 27Psychology 5 8 13 1 4 5 23 75 98 29 87 116Social and Decision Sciences 5 4 9 5 2 7 35 47 82 45 53 98Statistics 18 30 48 6 5 11 81 51 132 105 86 191Undeclared 34 25 59 7 15 22 145 158 303 186 198 384TOTAL 93 99 192 32 41 73 462 501 963 587 641 1,228
Interdisc Computer Science and Arts 0 0 0 0 1 1 11 9 20 11 10 21Humanities and Arts 1 4 5 0 1 1 10 44 54 11 49 60Science and Arts 0 2 2 0 0 0 5 10 15 5 12 17Science and Humanities Scholars 18 24 42 0 6 6 40 69 109 58 99 157TOTAL 19 30 49 0 8 8 66 132 198 85 170 255
MCS Biological Sciences 6 5 11 4 6 10 42 88 130 52 99 151Chemistry 3 3 6 5 5 10 18 31 49 26 39 65Mathematical Sciences 47 53 100 10 3 13 98 36 134 155 92 247Physics 15 8 23 1 0 1 47 22 69 63 30 93Studentdefined Major 0 0 0 0 0 0 1 1 2 1 1 2Undeclared 24 22 46 10 7 17 90 83 173 124 112 236TOTAL 95 91 186 30 21 51 296 261 557 421 373 794
SCS Computer Science 101 41 142 26 20 46 280 168 448 407 229 636TSB Business Administration 42 55 97 20 18 38 244 147 391 306 220 526
Studentdefined Major 0 0 0 0 0 0 1 0 1 1 0 1TOTAL 42 55 97 20 18 38 245 147 392 307 220 527
Branch Qatar Biological Sciences 16 43 59 0 1 1 1 0 1 17 44 61Campuses Qatar Business Administration 36 113 149 5 2 7 8 3 11 49 118 167
Qatar Computer Science 44 28 72 3 0 3 5 0 5 52 28 80Qatar Information Systems 35 61 96 5 2 7 1 1 2 41 64 105TOTAL 131 245 376 13 5 18 15 4 19 159 254 413
GRAND TOTAL 712 780 1,492 187 178 365 2,573 2,144 4,717 3,472 3,102 6,574
ENR-33
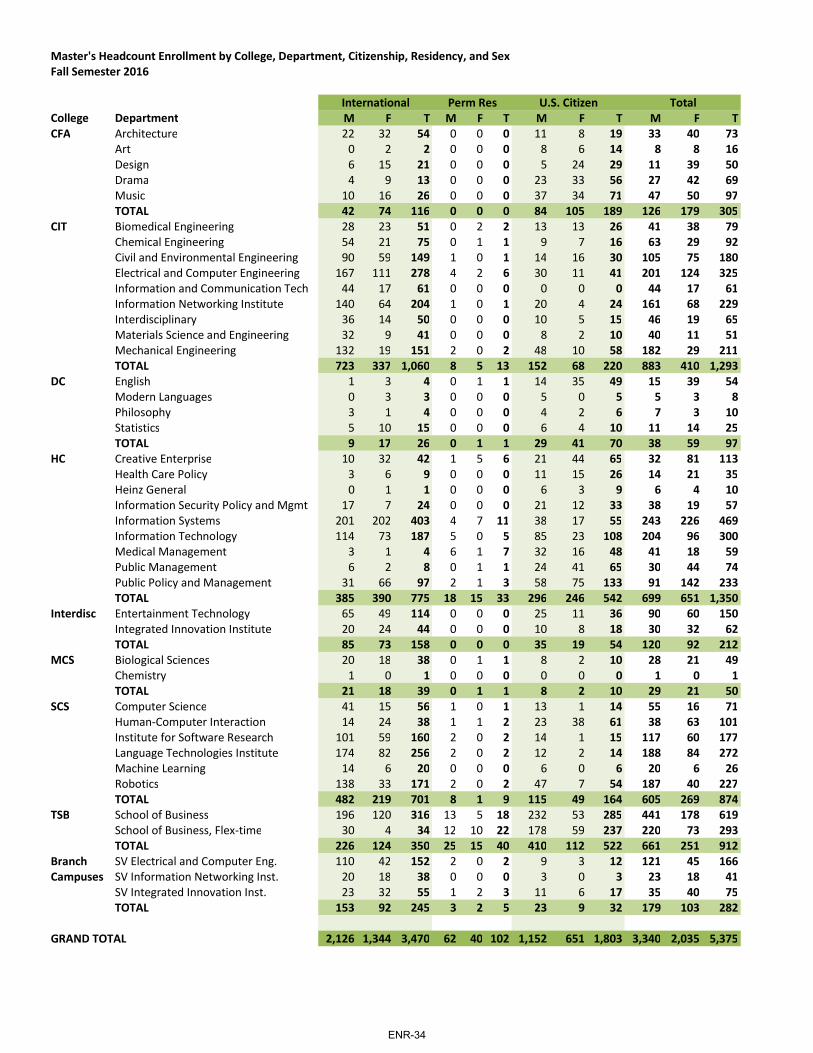
Master's Headcount Enrollment by College, Department, Citizenship, Residency, and Sex Fall Semester 2016
International Perm Res U.S. Citizen TotalCollege Department M F T M F T M F T M F TCFA Architecture 22 32 54 0 0 0 11 8 19 33 40 73
Art 0 2 2 0 0 0 8 6 14 8 8 16Design 6 15 21 0 0 0 5 24 29 11 39 50Drama 4 9 13 0 0 0 23 33 56 27 42 69Music 10 16 26 0 0 0 37 34 71 47 50 97TOTAL 42 74 116 0 0 0 84 105 189 126 179 305
CIT Biomedical Engineering 28 23 51 0 2 2 13 13 26 41 38 79Chemical Engineering 54 21 75 0 1 1 9 7 16 63 29 92Civil and Environmental Engineering 90 59 149 1 0 1 14 16 30 105 75 180Electrical and Computer Engineering 167 111 278 4 2 6 30 11 41 201 124 325Information and Communication Tech 44 17 61 0 0 0 0 0 0 44 17 61Information Networking Institute 140 64 204 1 0 1 20 4 24 161 68 229Interdisciplinary 36 14 50 0 0 0 10 5 15 46 19 65Materials Science and Engineering 32 9 41 0 0 0 8 2 10 40 11 51Mechanical Engineering 132 19 151 2 0 2 48 10 58 182 29 211TOTAL 723 337 1,060 8 5 13 152 68 220 883 410 1,293
DC English 1 3 4 0 1 1 14 35 49 15 39 54Modern Languages 0 3 3 0 0 0 5 0 5 5 3 8Philosophy 3 1 4 0 0 0 4 2 6 7 3 10Statistics 5 10 15 0 0 0 6 4 10 11 14 25TOTAL 9 17 26 0 1 1 29 41 70 38 59 97
HC Creative Enterprise 10 32 42 1 5 6 21 44 65 32 81 113Health Care Policy 3 6 9 0 0 0 11 15 26 14 21 35Heinz General 0 1 1 0 0 0 6 3 9 6 4 10Information Security Policy and Mgmt 17 7 24 0 0 0 21 12 33 38 19 57Information Systems 201 202 403 4 7 11 38 17 55 243 226 469Information Technology 114 73 187 5 0 5 85 23 108 204 96 300Medical Management 3 1 4 6 1 7 32 16 48 41 18 59Public Management 6 2 8 0 1 1 24 41 65 30 44 74Public Policy and Management 31 66 97 2 1 3 58 75 133 91 142 233TOTAL 385 390 775 18 15 33 296 246 542 699 651 1,350
Interdisc Entertainment Technology 65 49 114 0 0 0 25 11 36 90 60 150Integrated Innovation Institute 20 24 44 0 0 0 10 8 18 30 32 62TOTAL 85 73 158 0 0 0 35 19 54 120 92 212
MCS Biological Sciences 20 18 38 0 1 1 8 2 10 28 21 49Chemistry 1 0 1 0 0 0 0 0 0 1 0 1TOTAL 21 18 39 0 1 1 8 2 10 29 21 50
SCS Computer Science 41 15 56 1 0 1 13 1 14 55 16 71HumanComputer Interaction 14 24 38 1 1 2 23 38 61 38 63 101Institute for Software Research 101 59 160 2 0 2 14 1 15 117 60 177Language Technologies Institute 174 82 256 2 0 2 12 2 14 188 84 272Machine Learning 14 6 20 0 0 0 6 0 6 20 6 26Robotics 138 33 171 2 0 2 47 7 54 187 40 227TOTAL 482 219 701 8 1 9 115 49 164 605 269 874
TSB School of Business 196 120 316 13 5 18 232 53 285 441 178 619School of Business, Flextime 30 4 34 12 10 22 178 59 237 220 73 293TOTAL 226 124 350 25 15 40 410 112 522 661 251 912
Branch SV Electrical and Computer Eng. 110 42 152 2 0 2 9 3 12 121 45 166Campuses SV Information Networking Inst. 20 18 38 0 0 0 3 0 3 23 18 41
SV Integrated Innovation Inst. 23 32 55 1 2 3 11 6 17 35 40 75TOTAL 153 92 245 3 2 5 23 9 32 179 103 282
GRAND TOTAL 2,126 1,344 3,470 62 40 102 1,152 651 1,803 3,340 2,035 5,375
ENR-34
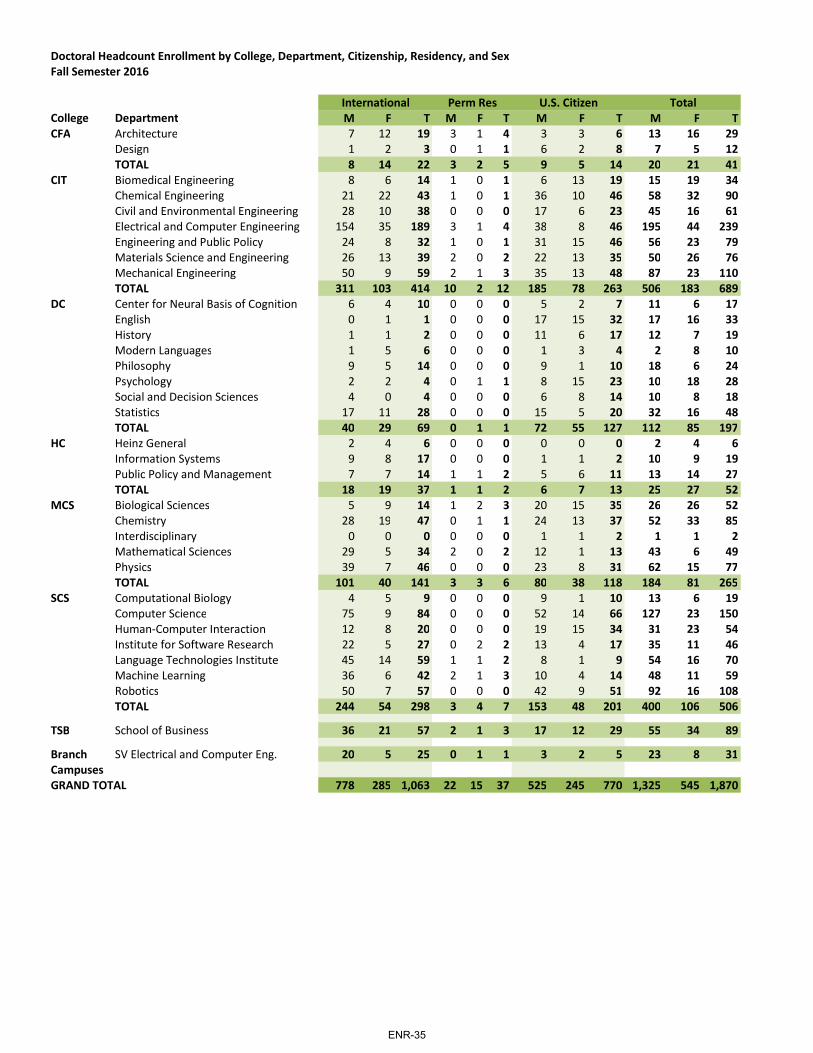
Doctoral Headcount Enrollment by College, Department, Citizenship, Residency, and Sex Fall Semester 2016
International Perm Res U.S. Citizen TotalCollege Department M F T M F T M F T M F TCFA Architecture 7 12 19 3 1 4 3 3 6 13 16 29
Design 1 2 3 0 1 1 6 2 8 7 5 12TOTAL 8 14 22 3 2 5 9 5 14 20 21 41
CIT Biomedical Engineering 8 6 14 1 0 1 6 13 19 15 19 34Chemical Engineering 21 22 43 1 0 1 36 10 46 58 32 90Civil and Environmental Engineering 28 10 38 0 0 0 17 6 23 45 16 61Electrical and Computer Engineering 154 35 189 3 1 4 38 8 46 195 44 239Engineering and Public Policy 24 8 32 1 0 1 31 15 46 56 23 79Materials Science and Engineering 26 13 39 2 0 2 22 13 35 50 26 76Mechanical Engineering 50 9 59 2 1 3 35 13 48 87 23 110TOTAL 311 103 414 10 2 12 185 78 263 506 183 689
DC Center for Neural Basis of Cognition 6 4 10 0 0 0 5 2 7 11 6 17English 0 1 1 0 0 0 17 15 32 17 16 33History 1 1 2 0 0 0 11 6 17 12 7 19Modern Languages 1 5 6 0 0 0 1 3 4 2 8 10Philosophy 9 5 14 0 0 0 9 1 10 18 6 24Psychology 2 2 4 0 1 1 8 15 23 10 18 28Social and Decision Sciences 4 0 4 0 0 0 6 8 14 10 8 18Statistics 17 11 28 0 0 0 15 5 20 32 16 48TOTAL 40 29 69 0 1 1 72 55 127 112 85 197
HC Heinz General 2 4 6 0 0 0 0 0 0 2 4 6Information Systems 9 8 17 0 0 0 1 1 2 10 9 19Public Policy and Management 7 7 14 1 1 2 5 6 11 13 14 27TOTAL 18 19 37 1 1 2 6 7 13 25 27 52
MCS Biological Sciences 5 9 14 1 2 3 20 15 35 26 26 52Chemistry 28 19 47 0 1 1 24 13 37 52 33 85Interdisciplinary 0 0 0 0 0 0 1 1 2 1 1 2Mathematical Sciences 29 5 34 2 0 2 12 1 13 43 6 49Physics 39 7 46 0 0 0 23 8 31 62 15 77TOTAL 101 40 141 3 3 6 80 38 118 184 81 265
SCS Computational Biology 4 5 9 0 0 0 9 1 10 13 6 19Computer Science 75 9 84 0 0 0 52 14 66 127 23 150HumanComputer Interaction 12 8 20 0 0 0 19 15 34 31 23 54Institute for Software Research 22 5 27 0 2 2 13 4 17 35 11 46Language Technologies Institute 45 14 59 1 1 2 8 1 9 54 16 70Machine Learning 36 6 42 2 1 3 10 4 14 48 11 59Robotics 50 7 57 0 0 0 42 9 51 92 16 108TOTAL 244 54 298 3 4 7 153 48 201 400 106 506
TSB School of Business 36 21 57 2 1 3 17 12 29 55 34 89
Branch SV Electrical and Computer Eng. 20 5 25 0 1 1 3 2 5 23 8 31CampusesGRAND TOTAL 778 285 1,063 22 15 37 525 245 770 1,325 545 1,870
ENR-35
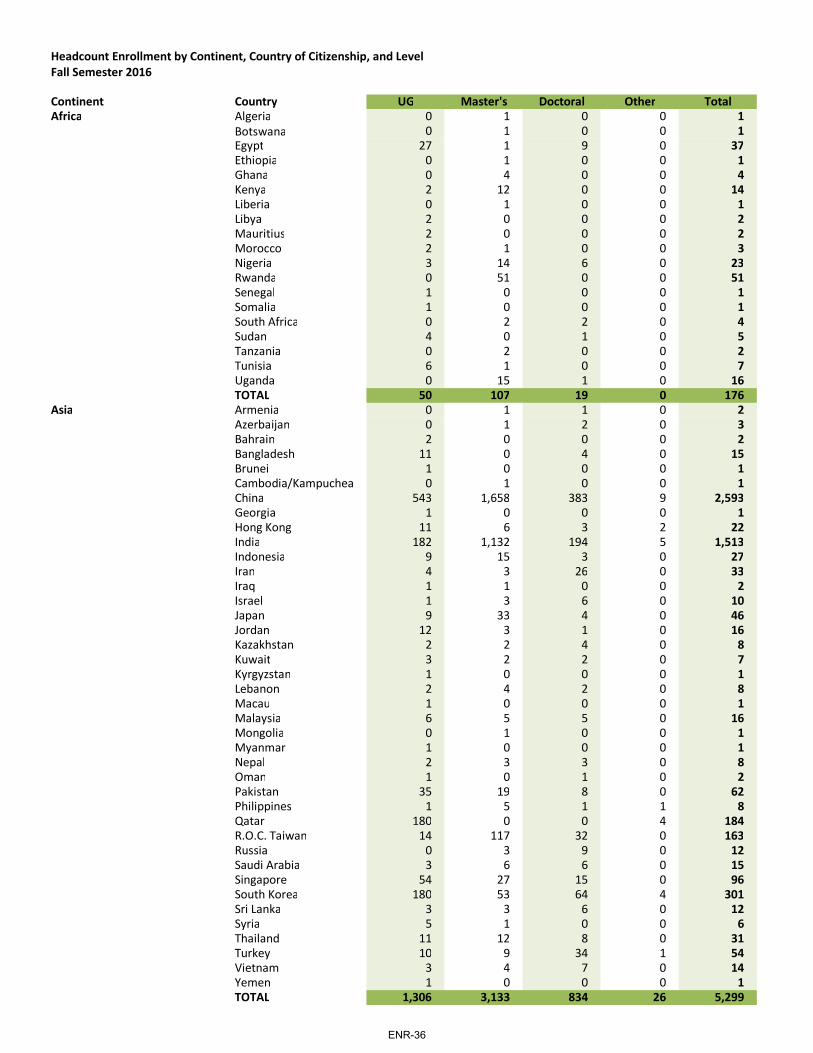
Headcount Enrollment by Continent, Country of Citizenship, and Level Fall Semester 2016
Continent Country UG Master's Doctoral Other TotalAfrica Algeria 0 1 0 0 1
Botswana 0 1 0 0 1Egypt 27 1 9 0 37Ethiopia 0 1 0 0 1Ghana 0 4 0 0 4Kenya 2 12 0 0 14Liberia 0 1 0 0 1Libya 2 0 0 0 2Mauritius 2 0 0 0 2Morocco 2 1 0 0 3Nigeria 3 14 6 0 23Rwanda 0 51 0 0 51Senegal 1 0 0 0 1Somalia 1 0 0 0 1South Africa 0 2 2 0 4Sudan 4 0 1 0 5Tanzania 0 2 0 0 2Tunisia 6 1 0 0 7Uganda 0 15 1 0 16TOTAL 50 107 19 0 176
Asia Armenia 0 1 1 0 2Azerbaijan 0 1 2 0 3Bahrain 2 0 0 0 2Bangladesh 11 0 4 0 15Brunei 1 0 0 0 1Cambodia/Kampuchea 0 1 0 0 1China 543 1,658 383 9 2,593Georgia 1 0 0 0 1Hong Kong 11 6 3 2 22India 182 1,132 194 5 1,513Indonesia 9 15 3 0 27Iran 4 3 26 0 33Iraq 1 1 0 0 2Israel 1 3 6 0 10Japan 9 33 4 0 46Jordan 12 3 1 0 16Kazakhstan 2 2 4 0 8Kuwait 3 2 2 0 7Kyrgyzstan 1 0 0 0 1Lebanon 2 4 2 0 8Macau 1 0 0 0 1Malaysia 6 5 5 0 16Mongolia 0 1 0 0 1Myanmar 1 0 0 0 1Nepal 2 3 3 0 8Oman 1 0 1 0 2Pakistan 35 19 8 0 62Philippines 1 5 1 1 8Qatar 180 0 0 4 184R.O.C. Taiwan 14 117 32 0 163Russia 0 3 9 0 12Saudi Arabia 3 6 6 0 15Singapore 54 27 15 0 96South Korea 180 53 64 4 301Sri Lanka 3 3 6 0 12Syria 5 1 0 0 6Thailand 11 12 8 0 31Turkey 10 9 34 1 54Vietnam 3 4 7 0 14Yemen 1 0 0 0 1TOTAL 1,306 3,133 834 26 5,299
ENR-36

Australia and Oceania Australia 8 15 3 2 28New Zealand 2 0 2 0 4TOTAL 10 15 5 2 32
Europe Albania 1 0 1 0 2Austria 0 1 1 1 3Belgium 0 2 1 0 3Bulgaria 0 0 1 0 1Croatia 0 0 2 0 2Denmark 0 0 2 0 2France 6 12 6 0 24Germany 6 5 8 0 19Greece 1 3 14 0 18Hungary 0 0 3 0 3Iceland 0 1 1 0 2Ireland 0 1 2 0 3Italy 1 4 11 0 16Lithuania 0 1 0 0 1Macedonia 0 0 1 0 1Moldova 0 0 2 0 2Netherlands 2 0 2 0 4Poland 3 0 1 0 4Portugal 1 2 23 0 26Romania 1 0 4 0 5Serbia 0 0 1 0 1Slovenia 1 0 0 0 1Spain & Canary Islands 3 7 4 1 15Sweden 0 0 2 0 2Switzerland 4 1 2 0 7Ukraine 1 0 2 0 3United Kingdom 10 8 6 1 25TOTAL 41 48 103 3 195
North America and Bahamas 0 1 0 0 1Central America Canada 68 37 41 2 148
Costa Rica 0 3 2 0 5Dominica 0 0 1 0 1Dominican Republic 1 1 0 0 2El Salvador 0 0 1 0 1Guatemala 1 0 0 0 1Haiti 0 0 1 0 1Mexico 5 56 6 0 67Trinidad and Tobago 0 2 1 0 3US Minor Outlying Islands 0 0 1 0 1TOTAL 75 100 54 2 231
South America Argentina 0 3 2 0 5Bolivia 1 0 0 0 1Brazil 3 11 11 0 25Chile 0 2 9 0 11Colombia 0 17 11 1 29Ecuador 0 9 6 0 15Peru 0 10 0 0 10Uruguay 0 1 0 0 1Venezuela 1 7 4 0 12TOTAL 5 60 43 1 109
Country not reported 5 7 5 1 18U.S. Citizen or Permanent Resident 5,082 1,905 807 107 7,901GRAND TOTAL 6,574 5,375 1,870 142 13,961
ENR-37
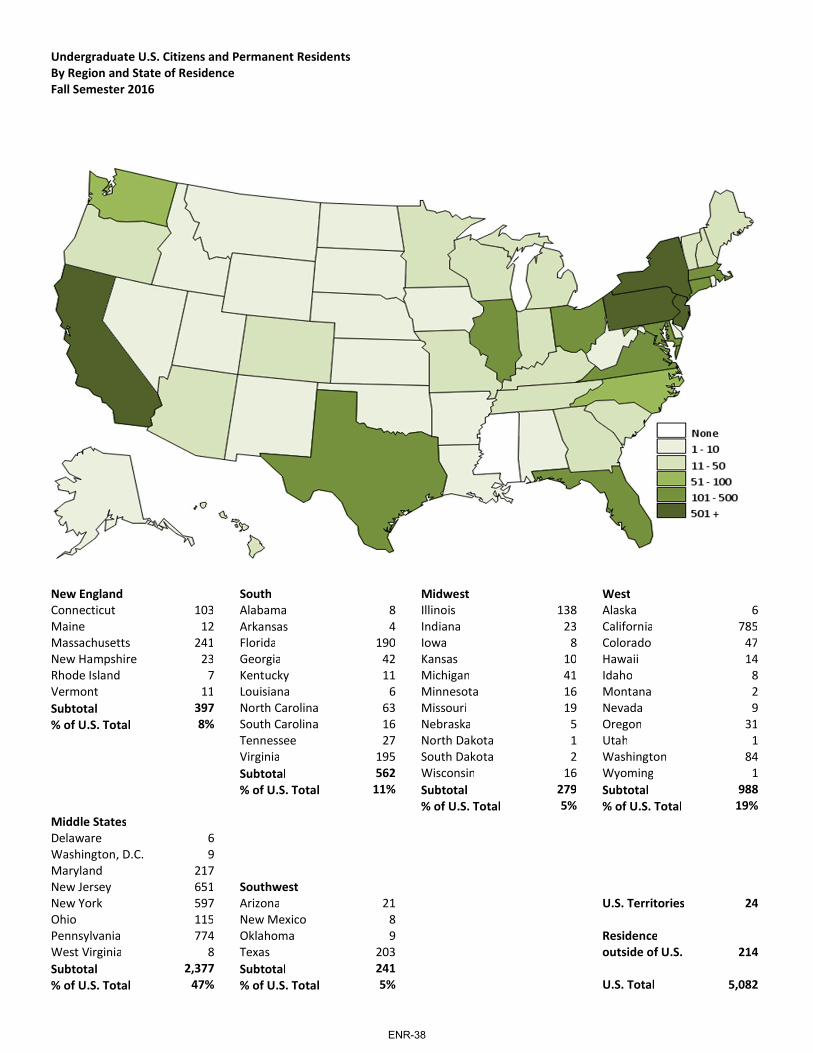
Undergraduate U.S. Citizens and Permanent Residents By Region and State of ResidenceFall Semester 2016
[MAP GOES HERE]
New England South Midwest WestConnecticut 103 Alabama 8 Illinois 138 Alaska 6Maine 12 Arkansas 4 Indiana 23 California 785Massachusetts 241 Florida 190 Iowa 8 Colorado 47New Hampshire 23 Georgia 42 Kansas 10 Hawaii 14Rhode Island 7 Kentucky 11 Michigan 41 Idaho 8Vermont 11 Louisiana 6 Minnesota 16 Montana 2Subtotal 397 North Carolina 63 Missouri 19 Nevada 9% of U.S. Total 8% South Carolina 16 Nebraska 5 Oregon 31
Tennessee 27 North Dakota 1 Utah 1Virginia 195 South Dakota 2 Washington 84Subtotal 562 Wisconsin 16 Wyoming 1% of U.S. Total 11% Subtotal 279 Subtotal 988
% of U.S. Total 5% % of U.S. Total 19%Middle StatesDelaware 6Washington, D.C. 9Maryland 217New Jersey 651 SouthwestNew York 597 Arizona 21 U.S. Territories 24Ohio 115 New Mexico 8Pennsylvania 774 Oklahoma 9 ResidenceWest Virginia 8 Texas 203 outside of U.S. 214Subtotal 2,377 Subtotal 241% of U.S. Total 47% % of U.S. Total 5% U.S. Total 5,082
ENR-38
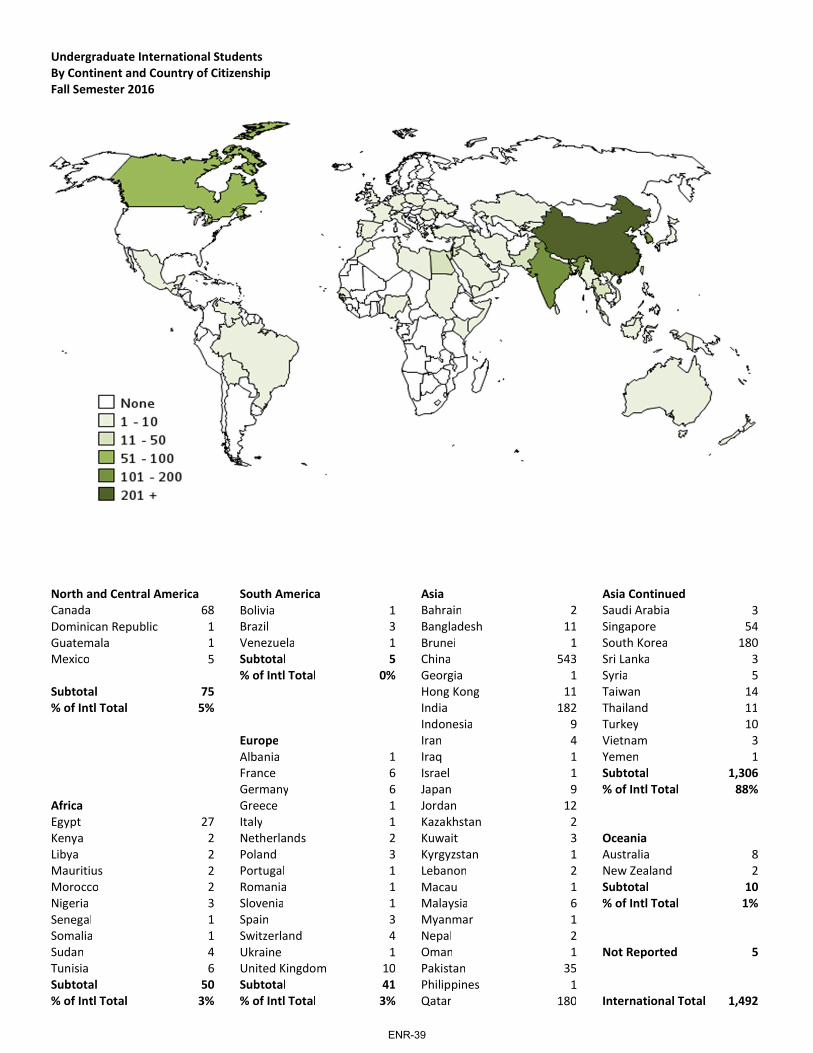
Undergraduate International Students By Continent and Country of CitizenshipFall Semester 2016
[MAP GOES HERE]
North and Central America South America Asia Asia ContinuedCanada 68 Bolivia 1 Bahrain 2 Saudi Arabia 3Dominican Republic 1 Brazil 3 Bangladesh 11 Singapore 54Guatemala 1 Venezuela 1 Brunei 1 South Korea 180Mexico 5 Subtotal 5 China 543 Sri Lanka 3
% of Intl Total 0% Georgia 1 Syria 5Subtotal 75 Hong Kong 11 Taiwan 14% of Intl Total 5% India 182 Thailand 11
Indonesia 9 Turkey 10Europe Iran 4 Vietnam 3Albania 1 Iraq 1 Yemen 1France 6 Israel 1 Subtotal 1,306Germany 6 Japan 9 % of Intl Total 88%
Africa Greece 1 Jordan 12Egypt 27 Italy 1 Kazakhstan 2Kenya 2 Netherlands 2 Kuwait 3 OceaniaLibya 2 Poland 3 Kyrgyzstan 1 Australia 8Mauritius 2 Portugal 1 Lebanon 2 New Zealand 2Morocco 2 Romania 1 Macau 1 Subtotal 10Nigeria 3 Slovenia 1 Malaysia 6 % of Intl Total 1%Senegal 1 Spain 3 Myanmar 1Somalia 1 Switzerland 4 Nepal 2Sudan 4 Ukraine 1 Oman 1 Not Reported 5Tunisia 6 United Kingdom 10 Pakistan 35Subtotal 50 Subtotal 41 Philippines 1% of Intl Total 3% % of Intl Total 3% Qatar 180 International Total 1,492
ENR-39
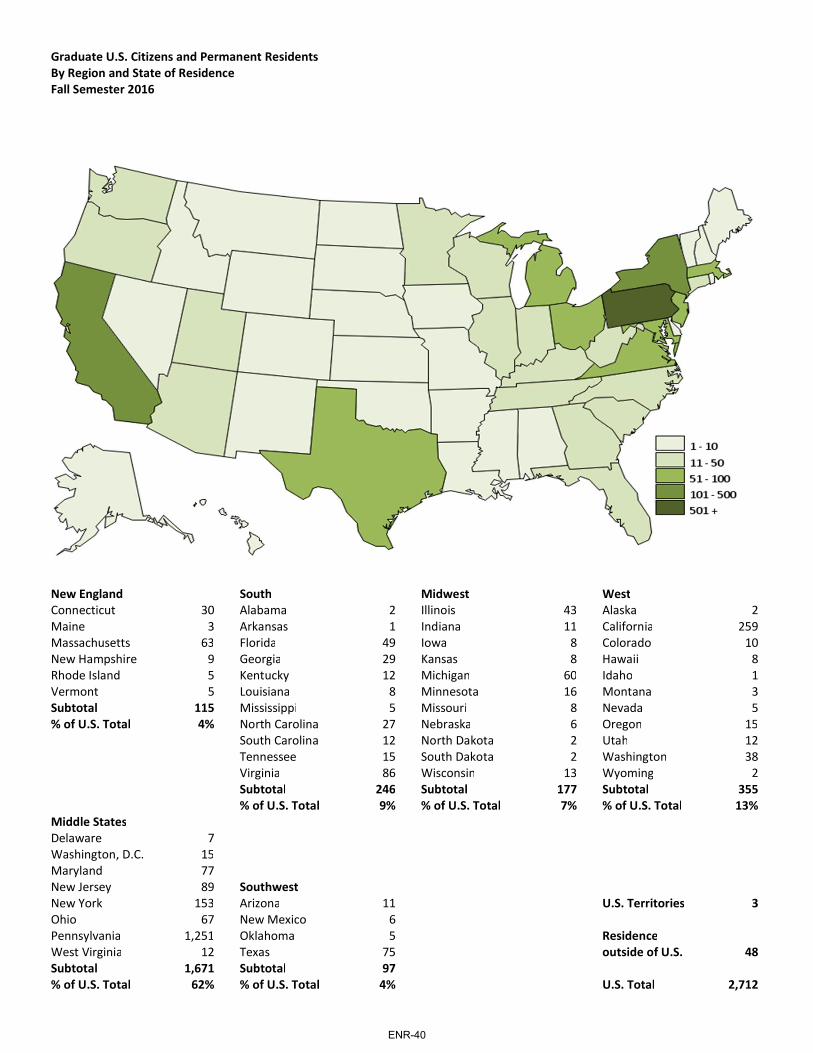
Graduate U.S. Citizens and Permanent Residents By Region and State of ResidenceFall Semester 2016
[MAP GOES HERE]
New England South Midwest WestConnecticut 30 Alabama 2 Illinois 43 Alaska 2Maine 3 Arkansas 1 Indiana 11 California 259Massachusetts 63 Florida 49 Iowa 8 Colorado 10New Hampshire 9 Georgia 29 Kansas 8 Hawaii 8Rhode Island 5 Kentucky 12 Michigan 60 Idaho 1Vermont 5 Louisiana 8 Minnesota 16 Montana 3Subtotal 115 Mississippi 5 Missouri 8 Nevada 5% of U.S. Total 4% North Carolina 27 Nebraska 6 Oregon 15
South Carolina 12 North Dakota 2 Utah 12Tennessee 15 South Dakota 2 Washington 38Virginia 86 Wisconsin 13 Wyoming 2Subtotal 246 Subtotal 177 Subtotal 355% of U.S. Total 9% % of U.S. Total 7% % of U.S. Total 13%
Middle StatesDelaware 7Washington, D.C. 15Maryland 77New Jersey 89 SouthwestNew York 153 Arizona 11 U.S. Territories 3Ohio 67 New Mexico 6Pennsylvania 1,251 Oklahoma 5 ResidenceWest Virginia 12 Texas 75 outside of U.S. 48Subtotal 1,671 Subtotal 97% of U.S. Total 62% % of U.S. Total 4% U.S. Total 2,712
ENR-40
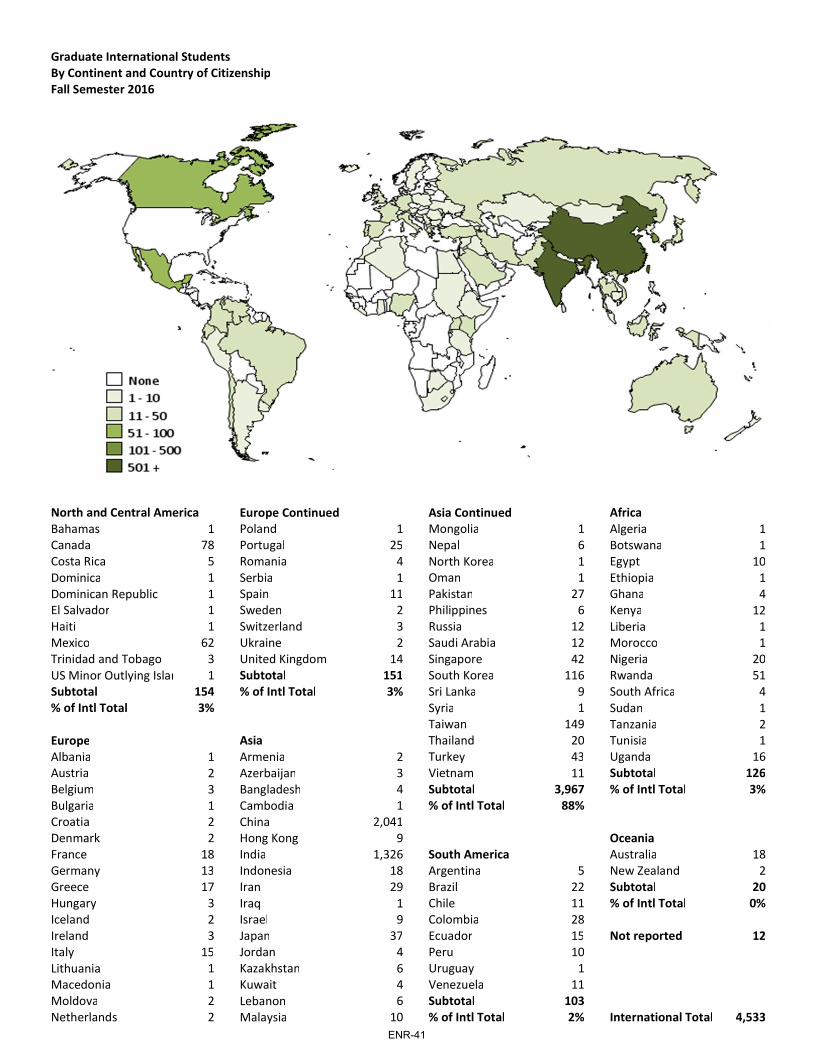
Graduate International Students By Continent and Country of CitizenshipFall Semester 2016
[MAP GOES HERE]
North and Central America Europe Continued Asia Continued AfricaBahamas 1 Poland 1 Mongolia 1 Algeria 1Canada 78 Portugal 25 Nepal 6 Botswana 1Costa Rica 5 Romania 4 North Korea 1 Egypt 10Dominica 1 Serbia 1 Oman 1 Ethiopia 1Dominican Republic 1 Spain 11 Pakistan 27 Ghana 4El Salvador 1 Sweden 2 Philippines 6 Kenya 12Haiti 1 Switzerland 3 Russia 12 Liberia 1Mexico 62 Ukraine 2 Saudi Arabia 12 Morocco 1Trinidad and Tobago 3 United Kingdom 14 Singapore 42 Nigeria 20US Minor Outlying Islan 1 Subtotal 151 South Korea 116 Rwanda 51Subtotal 154 % of Intl Total 3% Sri Lanka 9 South Africa 4% of Intl Total 3% Syria 1 Sudan 1
Taiwan 149 Tanzania 2Europe Asia Thailand 20 Tunisia 1Albania 1 Armenia 2 Turkey 43 Uganda 16Austria 2 Azerbaijan 3 Vietnam 11 Subtotal 126Belgium 3 Bangladesh 4 Subtotal 3,967 % of Intl Total 3%Bulgaria 1 Cambodia 1 % of Intl Total 88%Croatia 2 China 2,041Denmark 2 Hong Kong 9 OceaniaFrance 18 India 1,326 South America Australia 18Germany 13 Indonesia 18 Argentina 5 New Zealand 2Greece 17 Iran 29 Brazil 22 Subtotal 20Hungary 3 Iraq 1 Chile 11 % of Intl Total 0%Iceland 2 Israel 9 Colombia 28Ireland 3 Japan 37 Ecuador 15 Not reported 12Italy 15 Jordan 4 Peru 10Lithuania 1 Kazakhstan 6 Uruguay 1Macedonia 1 Kuwait 4 Venezuela 11Moldova 2 Lebanon 6 Subtotal 103Netherlands 2 Malaysia 10 % of Intl Total 2% International Total 4,533
ENR-41

ENR-42
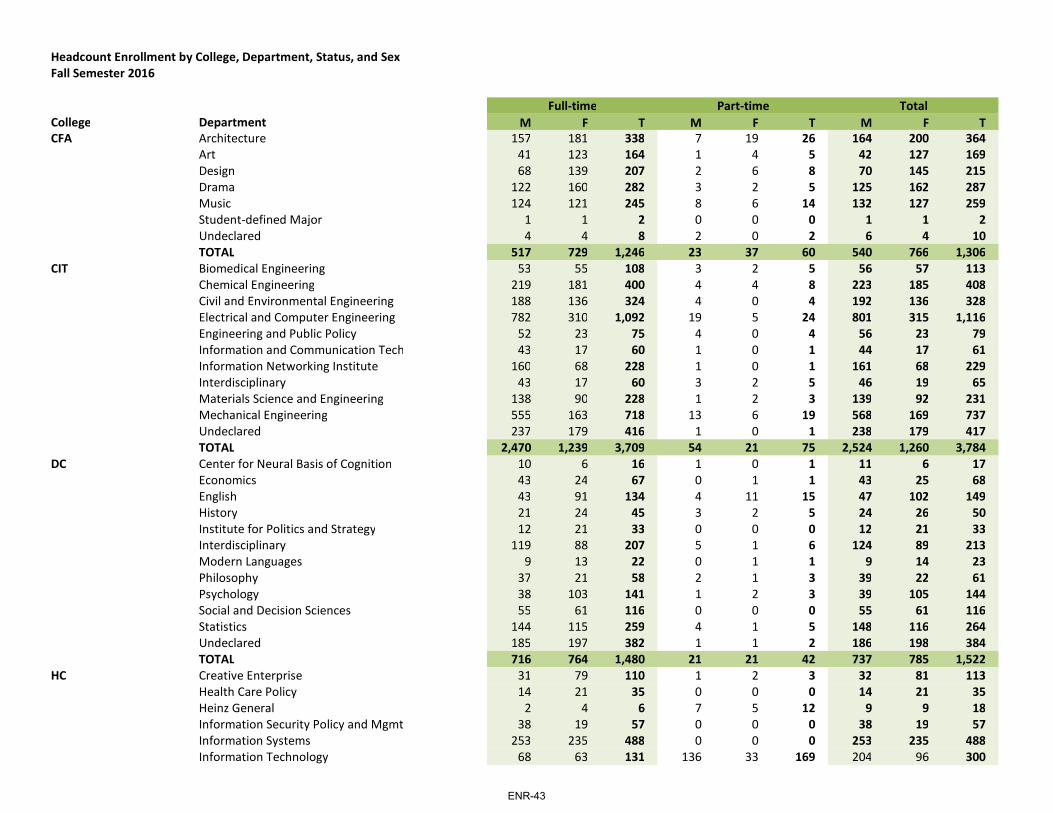
Headcount Enrollment by College, Department, Status, and Sex Fall Semester 2016
Fulltime Parttime TotalCollege Department M F T M F T M F TCFA Architecture 157 181 338 7 19 26 164 200 364
Art 41 123 164 1 4 5 42 127 169Design 68 139 207 2 6 8 70 145 215Drama 122 160 282 3 2 5 125 162 287Music 124 121 245 8 6 14 132 127 259Studentdefined Major 1 1 2 0 0 0 1 1 2Undeclared 4 4 8 2 0 2 6 4 10TOTAL 517 729 1,246 23 37 60 540 766 1,306
CIT Biomedical Engineering 53 55 108 3 2 5 56 57 113Chemical Engineering 219 181 400 4 4 8 223 185 408Civil and Environmental Engineering 188 136 324 4 0 4 192 136 328Electrical and Computer Engineering 782 310 1,092 19 5 24 801 315 1,116Engineering and Public Policy 52 23 75 4 0 4 56 23 79Information and Communication Tech 43 17 60 1 0 1 44 17 61Information Networking Institute 160 68 228 1 0 1 161 68 229Interdisciplinary 43 17 60 3 2 5 46 19 65Materials Science and Engineering 138 90 228 1 2 3 139 92 231Mechanical Engineering 555 163 718 13 6 19 568 169 737Undeclared 237 179 416 1 0 1 238 179 417TOTAL 2,470 1,239 3,709 54 21 75 2,524 1,260 3,784
DC Center for Neural Basis of Cognition 10 6 16 1 0 1 11 6 17Economics 43 24 67 0 1 1 43 25 68English 43 91 134 4 11 15 47 102 149History 21 24 45 3 2 5 24 26 50Institute for Politics and Strategy 12 21 33 0 0 0 12 21 33Interdisciplinary 119 88 207 5 1 6 124 89 213Modern Languages 9 13 22 0 1 1 9 14 23Philosophy 37 21 58 2 1 3 39 22 61Psychology 38 103 141 1 2 3 39 105 144Social and Decision Sciences 55 61 116 0 0 0 55 61 116Statistics 144 115 259 4 1 5 148 116 264Undeclared 185 197 382 1 1 2 186 198 384TOTAL 716 764 1,480 21 21 42 737 785 1,522
HC Creative Enterprise 31 79 110 1 2 3 32 81 113Health Care Policy 14 21 35 0 0 0 14 21 35Heinz General 2 4 6 7 5 12 9 9 18Information Security Policy and Mgmt 38 19 57 0 0 0 38 19 57Information Systems 253 235 488 0 0 0 253 235 488Information Technology 68 63 131 136 33 169 204 96 300
ENR-43
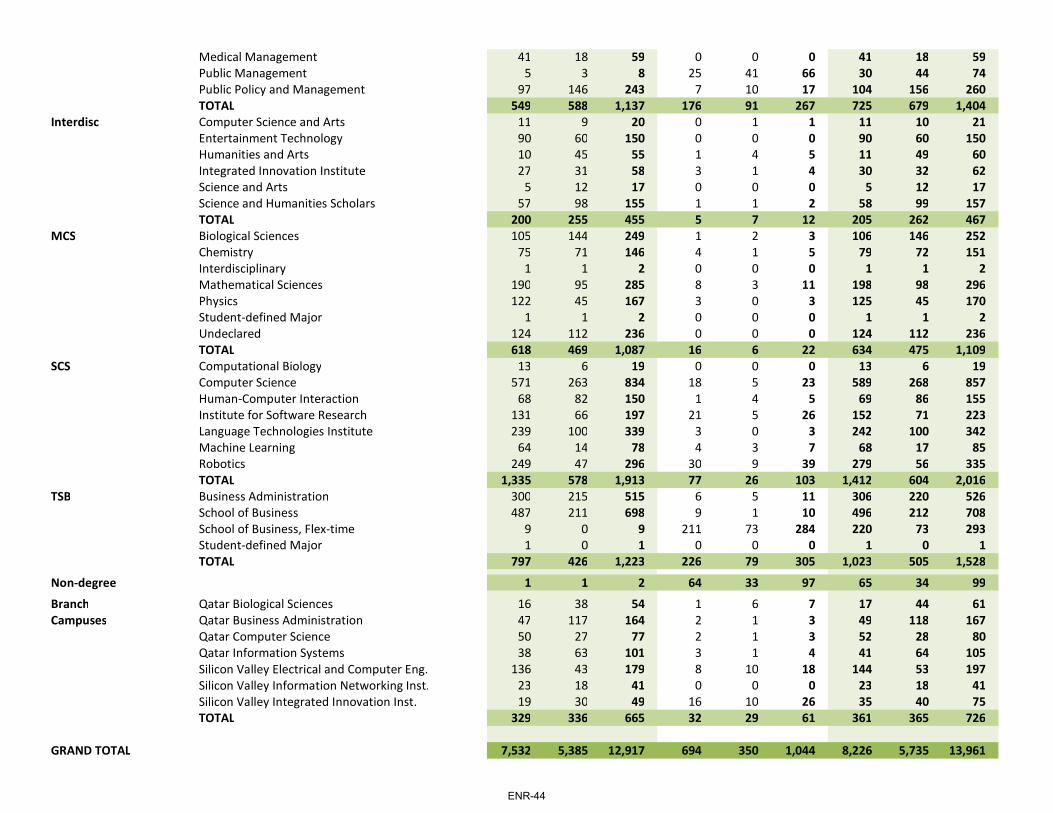
Medical Management 41 18 59 0 0 0 41 18 59Public Management 5 3 8 25 41 66 30 44 74Public Policy and Management 97 146 243 7 10 17 104 156 260TOTAL 549 588 1,137 176 91 267 725 679 1,404
Interdisc Computer Science and Arts 11 9 20 0 1 1 11 10 21Entertainment Technology 90 60 150 0 0 0 90 60 150Humanities and Arts 10 45 55 1 4 5 11 49 60Integrated Innovation Institute 27 31 58 3 1 4 30 32 62Science and Arts 5 12 17 0 0 0 5 12 17Science and Humanities Scholars 57 98 155 1 1 2 58 99 157TOTAL 200 255 455 5 7 12 205 262 467
MCS Biological Sciences 105 144 249 1 2 3 106 146 252Chemistry 75 71 146 4 1 5 79 72 151Interdisciplinary 1 1 2 0 0 0 1 1 2Mathematical Sciences 190 95 285 8 3 11 198 98 296Physics 122 45 167 3 0 3 125 45 170Studentdefined Major 1 1 2 0 0 0 1 1 2Undeclared 124 112 236 0 0 0 124 112 236TOTAL 618 469 1,087 16 6 22 634 475 1,109
SCS Computational Biology 13 6 19 0 0 0 13 6 19Computer Science 571 263 834 18 5 23 589 268 857HumanComputer Interaction 68 82 150 1 4 5 69 86 155Institute for Software Research 131 66 197 21 5 26 152 71 223Language Technologies Institute 239 100 339 3 0 3 242 100 342Machine Learning 64 14 78 4 3 7 68 17 85Robotics 249 47 296 30 9 39 279 56 335TOTAL 1,335 578 1,913 77 26 103 1,412 604 2,016
TSB Business Administration 300 215 515 6 5 11 306 220 526School of Business 487 211 698 9 1 10 496 212 708School of Business, Flextime 9 0 9 211 73 284 220 73 293Studentdefined Major 1 0 1 0 0 0 1 0 1TOTAL 797 426 1,223 226 79 305 1,023 505 1,528
Nondegree 1 1 2 64 33 97 65 34 99
Branch Qatar Biological Sciences 16 38 54 1 6 7 17 44 61Campuses Qatar Business Administration 47 117 164 2 1 3 49 118 167
Qatar Computer Science 50 27 77 2 1 3 52 28 80Qatar Information Systems 38 63 101 3 1 4 41 64 105Silicon Valley Electrical and Computer Eng. 136 43 179 8 10 18 144 53 197Silicon Valley Information Networking Inst. 23 18 41 0 0 0 23 18 41Silicon Valley Integrated Innovation Inst. 19 30 49 16 10 26 35 40 75TOTAL 329 336 665 32 29 61 361 365 726
GRAND TOTAL 7,532 5,385 12,917 694 350 1,044 8,226 5,735 13,961
ENR-44
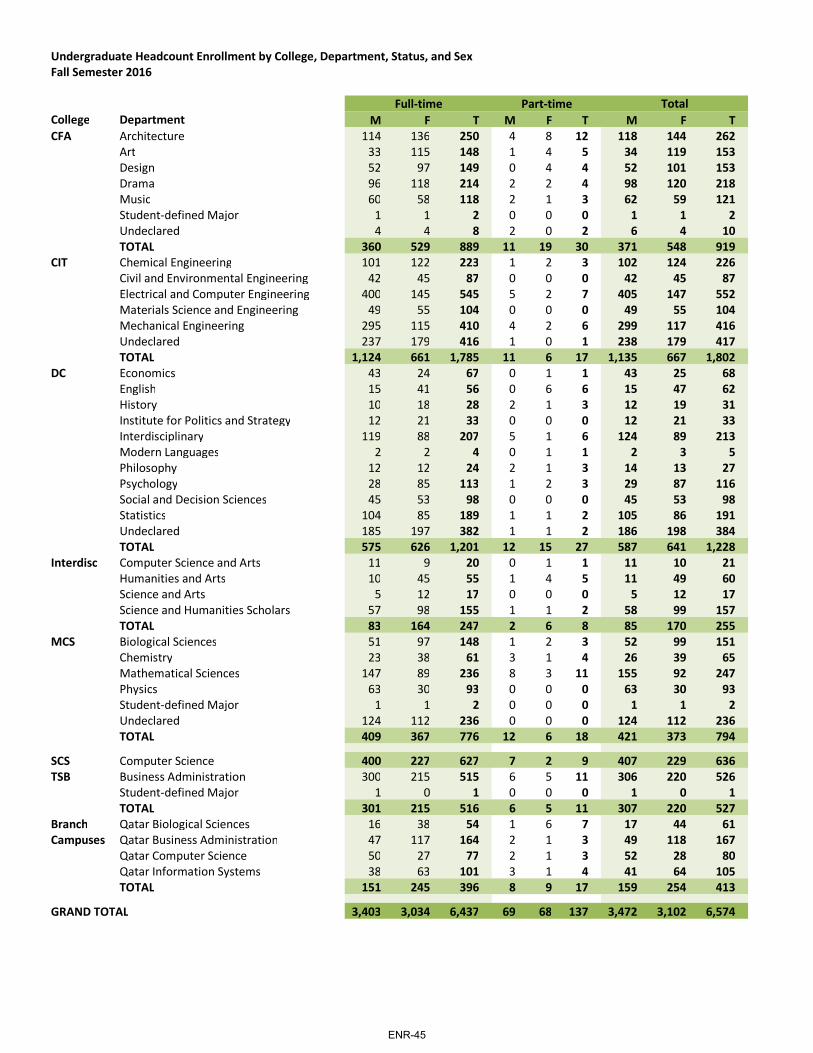
Undergraduate Headcount Enrollment by College, Department, Status, and Sex Fall Semester 2016
Fulltime Parttime TotalCollege Department M F T M F T M F TCFA Architecture 114 136 250 4 8 12 118 144 262
Art 33 115 148 1 4 5 34 119 153Design 52 97 149 0 4 4 52 101 153Drama 96 118 214 2 2 4 98 120 218Music 60 58 118 2 1 3 62 59 121Studentdefined Major 1 1 2 0 0 0 1 1 2Undeclared 4 4 8 2 0 2 6 4 10TOTAL 360 529 889 11 19 30 371 548 919
CIT Chemical Engineering 101 122 223 1 2 3 102 124 226Civil and Environmental Engineering 42 45 87 0 0 0 42 45 87Electrical and Computer Engineering 400 145 545 5 2 7 405 147 552Materials Science and Engineering 49 55 104 0 0 0 49 55 104Mechanical Engineering 295 115 410 4 2 6 299 117 416Undeclared 237 179 416 1 0 1 238 179 417TOTAL 1,124 661 1,785 11 6 17 1,135 667 1,802
DC Economics 43 24 67 0 1 1 43 25 68English 15 41 56 0 6 6 15 47 62History 10 18 28 2 1 3 12 19 31Institute for Politics and Strategy 12 21 33 0 0 0 12 21 33Interdisciplinary 119 88 207 5 1 6 124 89 213Modern Languages 2 2 4 0 1 1 2 3 5Philosophy 12 12 24 2 1 3 14 13 27Psychology 28 85 113 1 2 3 29 87 116Social and Decision Sciences 45 53 98 0 0 0 45 53 98Statistics 104 85 189 1 1 2 105 86 191Undeclared 185 197 382 1 1 2 186 198 384TOTAL 575 626 1,201 12 15 27 587 641 1,228
Interdisc Computer Science and Arts 11 9 20 0 1 1 11 10 21Humanities and Arts 10 45 55 1 4 5 11 49 60Science and Arts 5 12 17 0 0 0 5 12 17Science and Humanities Scholars 57 98 155 1 1 2 58 99 157TOTAL 83 164 247 2 6 8 85 170 255
MCS Biological Sciences 51 97 148 1 2 3 52 99 151Chemistry 23 38 61 3 1 4 26 39 65Mathematical Sciences 147 89 236 8 3 11 155 92 247Physics 63 30 93 0 0 0 63 30 93Studentdefined Major 1 1 2 0 0 0 1 1 2Undeclared 124 112 236 0 0 0 124 112 236TOTAL 409 367 776 12 6 18 421 373 794
SCS Computer Science 400 227 627 7 2 9 407 229 636TSB Business Administration 300 215 515 6 5 11 306 220 526
Studentdefined Major 1 0 1 0 0 0 1 0 1TOTAL 301 215 516 6 5 11 307 220 527
Branch Qatar Biological Sciences 16 38 54 1 6 7 17 44 61Campuses Qatar Business Administration 47 117 164 2 1 3 49 118 167
Qatar Computer Science 50 27 77 2 1 3 52 28 80Qatar Information Systems 38 63 101 3 1 4 41 64 105TOTAL 151 245 396 8 9 17 159 254 413
GRAND TOTAL 3,403 3,034 6,437 69 68 137 3,472 3,102 6,574
ENR-45
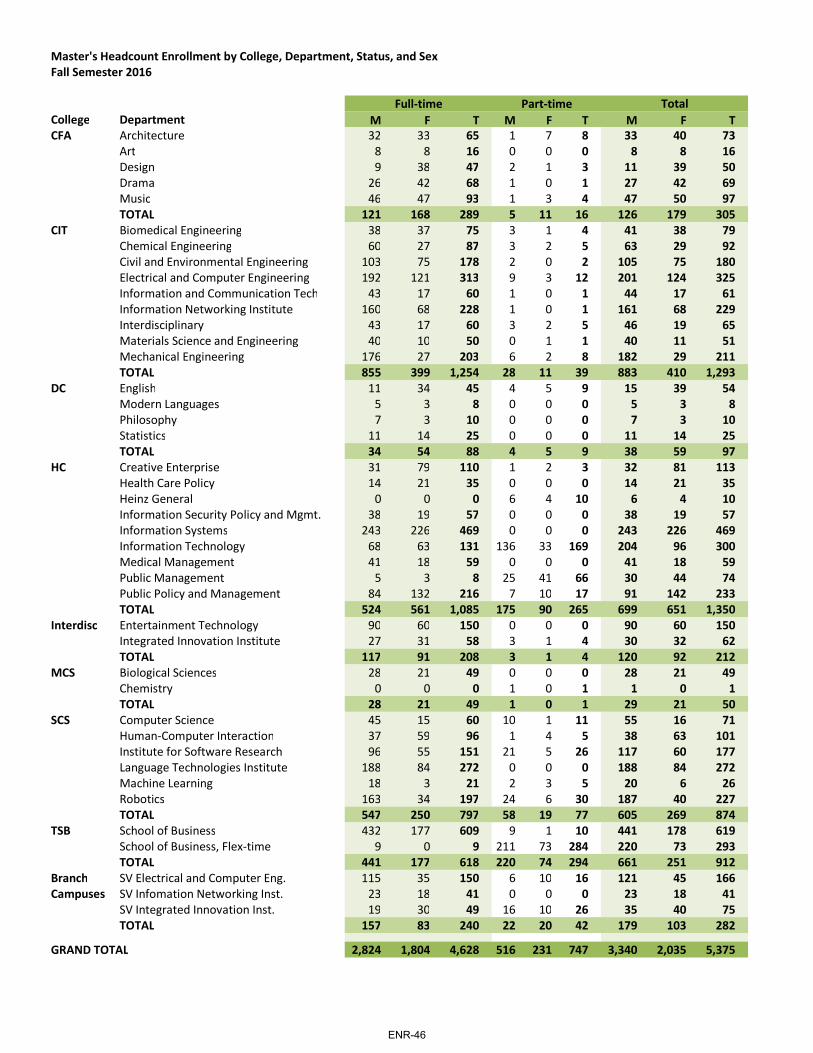
Master's Headcount Enrollment by College, Department, Status, and Sex Fall Semester 2016
Fulltime Parttime TotalCollege Department M F T M F T M F TCFA Architecture 32 33 65 1 7 8 33 40 73
Art 8 8 16 0 0 0 8 8 16Design 9 38 47 2 1 3 11 39 50Drama 26 42 68 1 0 1 27 42 69Music 46 47 93 1 3 4 47 50 97TOTAL 121 168 289 5 11 16 126 179 305
CIT Biomedical Engineering 38 37 75 3 1 4 41 38 79Chemical Engineering 60 27 87 3 2 5 63 29 92Civil and Environmental Engineering 103 75 178 2 0 2 105 75 180Electrical and Computer Engineering 192 121 313 9 3 12 201 124 325Information and Communication Tech 43 17 60 1 0 1 44 17 61Information Networking Institute 160 68 228 1 0 1 161 68 229Interdisciplinary 43 17 60 3 2 5 46 19 65Materials Science and Engineering 40 10 50 0 1 1 40 11 51Mechanical Engineering 176 27 203 6 2 8 182 29 211TOTAL 855 399 1,254 28 11 39 883 410 1,293
DC English 11 34 45 4 5 9 15 39 54Modern Languages 5 3 8 0 0 0 5 3 8Philosophy 7 3 10 0 0 0 7 3 10Statistics 11 14 25 0 0 0 11 14 25TOTAL 34 54 88 4 5 9 38 59 97
HC Creative Enterprise 31 79 110 1 2 3 32 81 113Health Care Policy 14 21 35 0 0 0 14 21 35Heinz General 0 0 0 6 4 10 6 4 10Information Security Policy and Mgmt. 38 19 57 0 0 0 38 19 57Information Systems 243 226 469 0 0 0 243 226 469Information Technology 68 63 131 136 33 169 204 96 300Medical Management 41 18 59 0 0 0 41 18 59Public Management 5 3 8 25 41 66 30 44 74Public Policy and Management 84 132 216 7 10 17 91 142 233TOTAL 524 561 1,085 175 90 265 699 651 1,350
Interdisc Entertainment Technology 90 60 150 0 0 0 90 60 150Integrated Innovation Institute 27 31 58 3 1 4 30 32 62TOTAL 117 91 208 3 1 4 120 92 212
MCS Biological Sciences 28 21 49 0 0 0 28 21 49Chemistry 0 0 0 1 0 1 1 0 1TOTAL 28 21 49 1 0 1 29 21 50
SCS Computer Science 45 15 60 10 1 11 55 16 71HumanComputer Interaction 37 59 96 1 4 5 38 63 101Institute for Software Research 96 55 151 21 5 26 117 60 177Language Technologies Institute 188 84 272 0 0 0 188 84 272Machine Learning 18 3 21 2 3 5 20 6 26Robotics 163 34 197 24 6 30 187 40 227TOTAL 547 250 797 58 19 77 605 269 874
TSB School of Business 432 177 609 9 1 10 441 178 619School of Business, Flextime 9 0 9 211 73 284 220 73 293TOTAL 441 177 618 220 74 294 661 251 912
Branch SV Electrical and Computer Eng. 115 35 150 6 10 16 121 45 166Campuses SV Infomation Networking Inst. 23 18 41 0 0 0 23 18 41
SV Integrated Innovation Inst. 19 30 49 16 10 26 35 40 75TOTAL 157 83 240 22 20 42 179 103 282
GRAND TOTAL 2,824 1,804 4,628 516 231 747 3,340 2,035 5,375
ENR-46

Doctoral Headcount Enrollment by College, Department, Status, and Sex Fall Semester 2016
Fulltime Parttime TotalCollege Department M F T M F T M F TCFA Architecture 11 12 23 2 4 6 13 16 29
Design 7 4 11 0 1 1 7 5 12TOTAL 18 16 34 2 5 7 20 21 41
CIT Biomedical Engineering 15 18 33 0 1 1 15 19 34Chemical Engineering 58 32 90 0 0 0 58 32 90Civil and Environmental Engineering 43 16 59 2 0 2 45 16 61Electrical and Computer Engineering 190 44 234 5 0 5 195 44 239Engineering and Public Policy 52 23 75 4 0 4 56 23 79Materials Science and Engineering 49 25 74 1 1 2 50 26 76Mechanical Engineering 84 21 105 3 2 5 87 23 110TOTAL 491 179 670 15 4 19 506 183 689
DC Center for Neural Basis of Cognition 10 6 16 1 0 1 11 6 17English 17 16 33 0 0 0 17 16 33History 11 6 17 1 1 2 12 7 19Modern Languages 2 8 10 0 0 0 2 8 10Philosophy 18 6 24 0 0 0 18 6 24Psychology 10 18 28 0 0 0 10 18 28Social and Decision Sciences 10 8 18 0 0 0 10 8 18Statistics 29 16 45 3 0 3 32 16 48TOTAL 107 84 191 5 1 6 112 85 197
HC Heinz General 2 4 6 0 0 0 2 4 6Information Systems 10 9 19 0 0 0 10 9 19Public Policy and Management 13 14 27 0 0 0 13 14 27TOTAL 25 27 52 0 0 0 25 27 52
MCS Biological Sciences 26 26 52 0 0 0 26 26 52Chemistry 52 33 85 0 0 0 52 33 85Interdisciplinary 1 1 2 0 0 0 1 1 2Mathematical Sciences 43 6 49 0 0 0 43 6 49Physics 59 15 74 3 0 3 62 15 77TOTAL 181 81 262 3 0 3 184 81 265
SCS Computational Biology 13 6 19 0 0 0 13 6 19Computer Science 126 21 147 1 2 3 127 23 150HumanComputer Interaction 31 23 54 0 0 0 31 23 54Institute for Software Research 35 11 46 0 0 0 35 11 46Language Technologies Institute 51 16 67 3 0 3 54 16 70Machine Learning 46 11 57 2 0 2 48 11 59Robotics 86 13 99 6 3 9 92 16 108TOTAL 388 101 489 12 5 17 400 106 506
TSB School of Business 55 34 89 0 0 0 55 34 89
Branch SV Electrical and Computer Eng. 21 8 29 2 0 2 23 8 31CampusesGRAND TOTAL 1,286 530 1,816 39 15 54 1,325 545 1,870
ENR-47
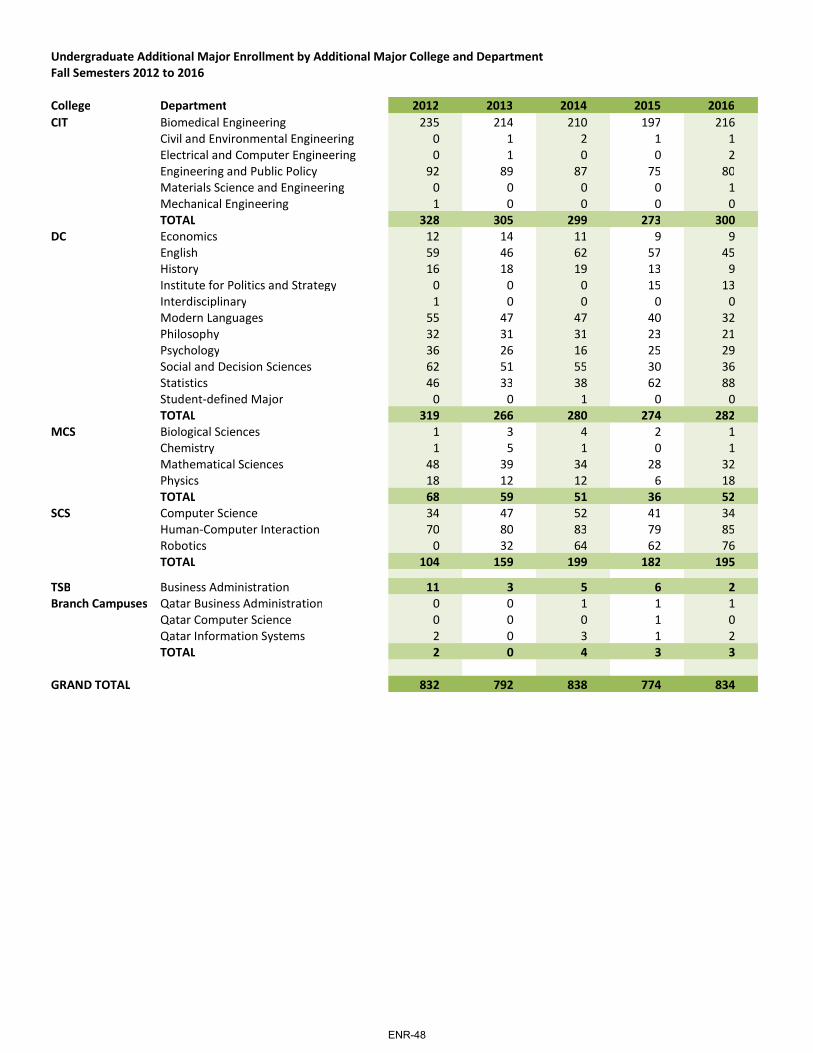
Undergraduate Additional Major Enrollment by Additional Major College and Department Fall Semesters 2012 to 2016
College Department 2012 2013 2014 2015 2016CIT Biomedical Engineering 235 214 210 197 216
Civil and Environmental Engineering 0 1 2 1 1Electrical and Computer Engineering 0 1 0 0 2Engineering and Public Policy 92 89 87 75 80Materials Science and Engineering 0 0 0 0 1Mechanical Engineering 1 0 0 0 0TOTAL 328 305 299 273 300
DC Economics 12 14 11 9 9English 59 46 62 57 45History 16 18 19 13 9Institute for Politics and Strategy 0 0 0 15 13Interdisciplinary 1 0 0 0 0Modern Languages 55 47 47 40 32Philosophy 32 31 31 23 21Psychology 36 26 16 25 29Social and Decision Sciences 62 51 55 30 36Statistics 46 33 38 62 88Studentdefined Major 0 0 1 0 0TOTAL 319 266 280 274 282
MCS Biological Sciences 1 3 4 2 1Chemistry 1 5 1 0 1Mathematical Sciences 48 39 34 28 32Physics 18 12 12 6 18TOTAL 68 59 51 36 52
SCS Computer Science 34 47 52 41 34HumanComputer Interaction 70 80 83 79 85Robotics 0 32 64 62 76TOTAL 104 159 199 182 195
TSB Business Administration 11 3 5 6 2Branch Campuses Qatar Business Administration 0 0 1 1 1
Qatar Computer Science 0 0 0 1 0Qatar Information Systems 2 0 3 1 2TOTAL 2 0 4 3 3
GRAND TOTAL 832 792 838 774 834
ENR-48
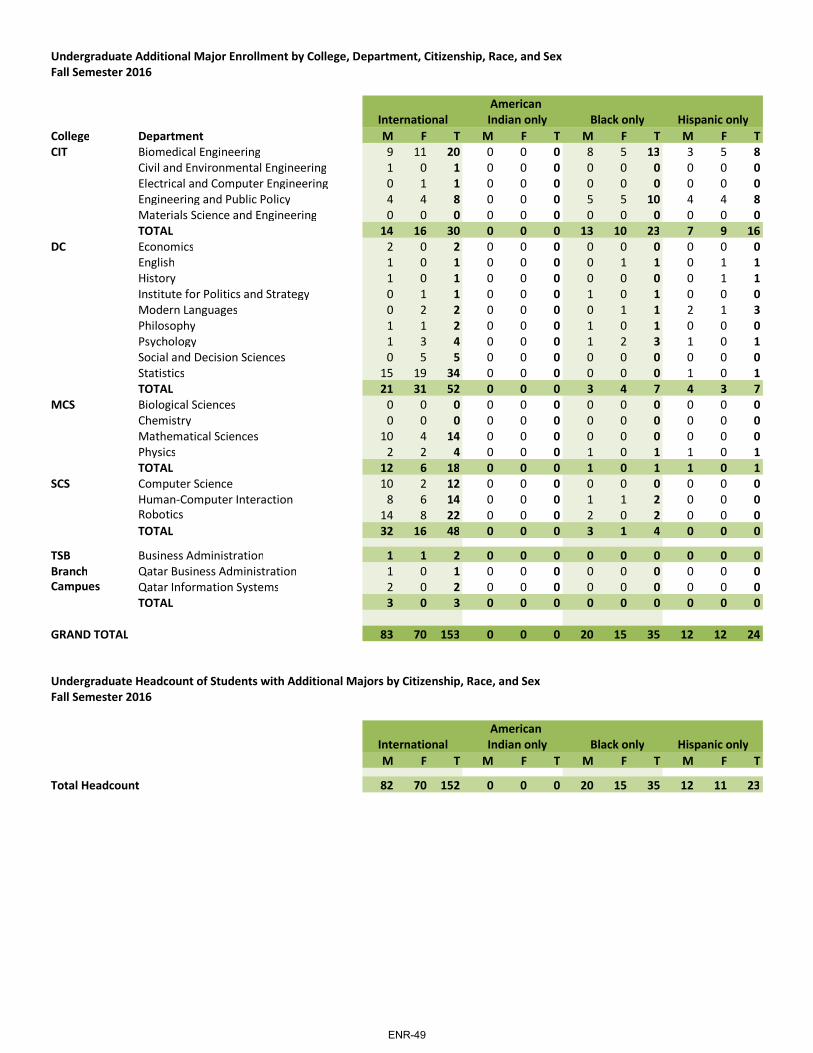
Undergraduate Additional Major Enrollment by College, Department, Citizenship, Race, and Sex Fall Semester 2016
American International Indian only Black only Hispanic only
College Department M F T M F T M F T M F TCIT Biomedical Engineering 9 11 20 0 0 0 8 5 13 3 5 8
Civil and Environmental Engineering 1 0 1 0 0 0 0 0 0 0 0 0Electrical and Computer Engineering 0 1 1 0 0 0 0 0 0 0 0 0Engineering and Public Policy 4 4 8 0 0 0 5 5 10 4 4 8Materials Science and Engineering 0 0 0 0 0 0 0 0 0 0 0 0TOTAL 14 16 30 0 0 0 13 10 23 7 9 16
DC Economics 2 0 2 0 0 0 0 0 0 0 0 0English 1 0 1 0 0 0 0 1 1 0 1 1History 1 0 1 0 0 0 0 0 0 0 1 1Institute for Politics and Strategy 0 1 1 0 0 0 1 0 1 0 0 0Modern Languages 0 2 2 0 0 0 0 1 1 2 1 3Philosophy 1 1 2 0 0 0 1 0 1 0 0 0Psychology 1 3 4 0 0 0 1 2 3 1 0 1Social and Decision Sciences 0 5 5 0 0 0 0 0 0 0 0 0Statistics 15 19 34 0 0 0 0 0 0 1 0 1TOTAL 21 31 52 0 0 0 3 4 7 4 3 7
MCS Biological Sciences 0 0 0 0 0 0 0 0 0 0 0 0Chemistry 0 0 0 0 0 0 0 0 0 0 0 0Mathematical Sciences 10 4 14 0 0 0 0 0 0 0 0 0Physics 2 2 4 0 0 0 1 0 1 1 0 1TOTAL 12 6 18 0 0 0 1 0 1 1 0 1
SCS Computer Science 10 2 12 0 0 0 0 0 0 0 0 0HumanComputer Interaction 8 6 14 0 0 0 1 1 2 0 0 0Robotics 14 8 22 0 0 0 2 0 2 0 0 0TOTAL 32 16 48 0 0 0 3 1 4 0 0 0
TSB Business Administration 1 1 2 0 0 0 0 0 0 0 0 0Branch Qatar Business Administration 1 0 1 0 0 0 0 0 0 0 0 0Campues Qatar Information Systems 2 0 2 0 0 0 0 0 0 0 0 0
TOTAL 3 0 3 0 0 0 0 0 0 0 0 0
GRAND TOTAL 83 70 153 0 0 0 20 15 35 12 12 24
Undergraduate Headcount of Students with Additional Majors by Citizenship, Race, and Sex Fall Semester 2016
American International Indian only Black only Hispanic onlyM F T M F T M F T M F T
Total Headcount 82 70 152 0 0 0 20 15 35 12 11 23
ENR-49
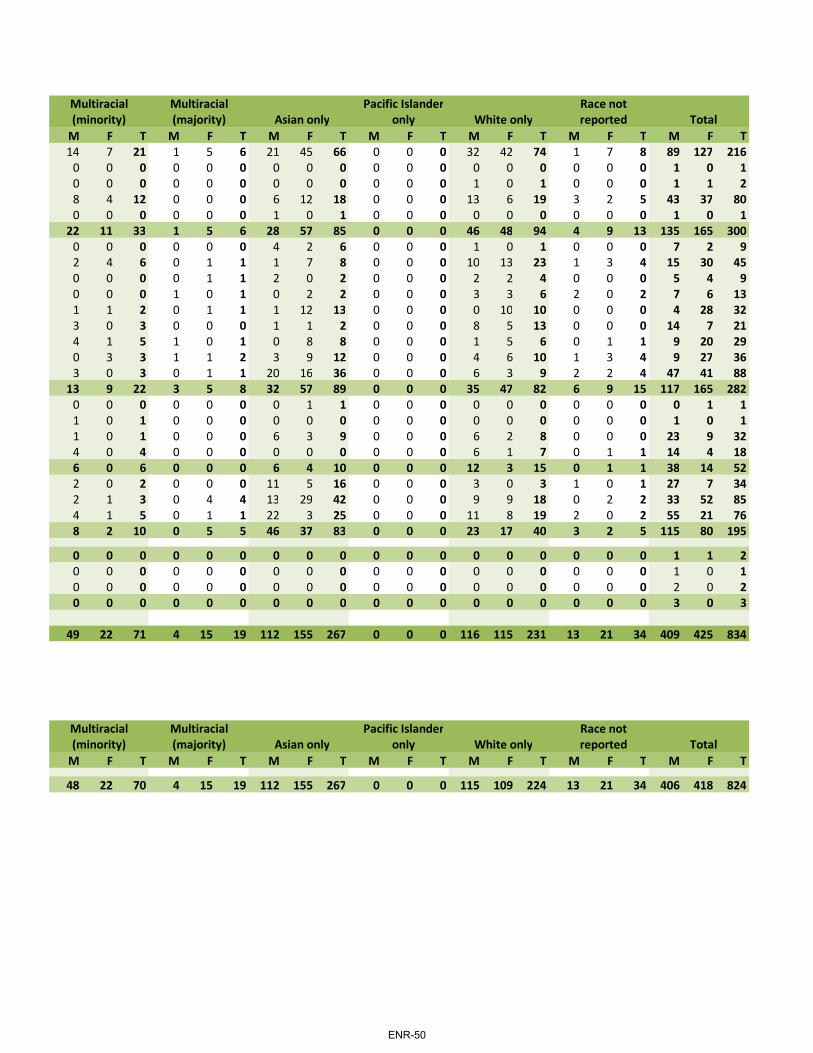
Multiracial Multiracial Pacific Islander Race not(minority) (majority) Asian only only White only reported Total
M F T M F T M F T M F T M F T M F T M F T14 7 21 1 5 6 21 45 66 0 0 0 32 42 74 1 7 8 89 127 216
0 0 0 0 0 0 0 0 0 0 0 0 0 0 0 0 0 0 1 0 10 0 0 0 0 0 0 0 0 0 0 0 1 0 1 0 0 0 1 1 28 4 12 0 0 0 6 12 18 0 0 0 13 6 19 3 2 5 43 37 800 0 0 0 0 0 1 0 1 0 0 0 0 0 0 0 0 0 1 0 1
22 11 33 1 5 6 28 57 85 0 0 0 46 48 94 4 9 13 135 165 3000 0 0 0 0 0 4 2 6 0 0 0 1 0 1 0 0 0 7 2 92 4 6 0 1 1 1 7 8 0 0 0 10 13 23 1 3 4 15 30 450 0 0 0 1 1 2 0 2 0 0 0 2 2 4 0 0 0 5 4 90 0 0 1 0 1 0 2 2 0 0 0 3 3 6 2 0 2 7 6 131 1 2 0 1 1 1 12 13 0 0 0 0 10 10 0 0 0 4 28 323 0 3 0 0 0 1 1 2 0 0 0 8 5 13 0 0 0 14 7 214 1 5 1 0 1 0 8 8 0 0 0 1 5 6 0 1 1 9 20 290 3 3 1 1 2 3 9 12 0 0 0 4 6 10 1 3 4 9 27 363 0 3 0 1 1 20 16 36 0 0 0 6 3 9 2 2 4 47 41 88
13 9 22 3 5 8 32 57 89 0 0 0 35 47 82 6 9 15 117 165 2820 0 0 0 0 0 0 1 1 0 0 0 0 0 0 0 0 0 0 1 11 0 1 0 0 0 0 0 0 0 0 0 0 0 0 0 0 0 1 0 11 0 1 0 0 0 6 3 9 0 0 0 6 2 8 0 0 0 23 9 324 0 4 0 0 0 0 0 0 0 0 0 6 1 7 0 1 1 14 4 186 0 6 0 0 0 6 4 10 0 0 0 12 3 15 0 1 1 38 14 522 0 2 0 0 0 11 5 16 0 0 0 3 0 3 1 0 1 27 7 342 1 3 0 4 4 13 29 42 0 0 0 9 9 18 0 2 2 33 52 854 1 5 0 1 1 22 3 25 0 0 0 11 8 19 2 0 2 55 21 768 2 10 0 5 5 46 37 83 0 0 0 23 17 40 3 2 5 115 80 195
0 0 0 0 0 0 0 0 0 0 0 0 0 0 0 0 0 0 1 1 20 0 0 0 0 0 0 0 0 0 0 0 0 0 0 0 0 0 1 0 10 0 0 0 0 0 0 0 0 0 0 0 0 0 0 0 0 0 2 0 20 0 0 0 0 0 0 0 0 0 0 0 0 0 0 0 0 0 3 0 3
49 22 71 4 15 19 112 155 267 0 0 0 116 115 231 13 21 34 409 425 834
Multiracial Multiracial Pacific Islander Race not(minority) (majority) Asian only only White only reported Total
M F T M F T M F T M F T M F T M F T M F T
48 22 70 4 15 19 112 155 267 0 0 0 115 109 224 13 21 34 406 418 824
ENR-50


![Table of Contents - MJC · 5 | P a g e [To Top] HIGHLIGHTS Enrollment Trends STUDENT HEADCOUNT, CREDIT-COURSE ENROLLMENT, FULL-TIME PROPORTIONS Annual unduplicated student headcount](https://static.fdocuments.net/doc/165x107/6036871153493575042dc0e2/table-of-contents-mjc-5-p-a-g-e-to-top-highlights-enrollment-trends-student.jpg)

