Enhancing Urban Mobility: Integrating Ride-sharing and Public Transit
21
SCL Report Series Enhancing Urban Mobility: Integrating Ride-sharing and Public Transit www.scl.gatech.edu/reports SCL-16-01.pdf February 7, 2016
Transcript of Enhancing Urban Mobility: Integrating Ride-sharing and Public Transit
SCL Report Series Enhancing Urban Mobility: Integrating Ride-sharing and Public Transit
www.scl.gatech.edu/reports SCL-16-01.pdf February 7, 2016
Electronic copy available at: http://ssrn.com/abstract=2805342
Enhancing Urban Mobility: Integrating Ride-sharing and Public
Transit
Mitja Stiglic Niels Agatz Martin Savelsbergh Mirko Gradisar
July 5, 2016
Abstract
Seamless integration of ride-sharing and public transit may offer fast, reliable, and affordable transfer
to and from transit stations in suburban areas thereby enhancing mobility of residents. We investigate
the potential benefits of such a system, as well as the ride-matching technology required to support it, by
means of an extensive computational study.
1 Introduction
People all around the world use private cars to travel to work. Most of these commuter trips are single-
occupant vehicle trips. In the U.S., for example, single-occupant trips represent approximately 77% of all
commuter trips [Polzin and Pisarski, 2013]; similar percentages are found in Europe [European Environment
Agency, 2010]. The low vehicle occupancy rates combined with the high number of trips during peak-hours
often leads to severe traffic congestion in urban areas. The resulting stress and air pollution, caused by
vehicle emissions, can have serious negative health effects.
To reduce the negative externalities of car travel, local governments encourage the use of public transit.
Unfortunately, many suburban and rural areas are not adequately served as they lack the population density
to justify public transit, i.e., the public transit is not economically viable. In cities with sprawling suburban
areas, the utilization of public transit to commute to work is often low, e.g., less than 5% in metropolitan
areas like Houston and Atlanta [McKenzie, 2010].
To attract more riders from suburban areas to public transit, transportation agencies must find adequate
solutions to accommodate the first and last mile from the riders’ home to and from the transit stations.
Possible solutions for a transportation agency include operating a fleet of demand-responsive feeder vehicles
and collaborating with local taxi service providers. In the U.S., for example, public transport providers have
1
Electronic copy available at: http://ssrn.com/abstract=2805342
started collaborating with Uber and Lyft to better coordinate their service offering [Murphy, 2016]. While
the services provided by Uber and Lyft are convenient for the riders, they are often (too) costly for the
transportation agency and/or the riders.
A cheaper and more environmentally sustainable alternative is to use already existing trips as a feeder for
public transit. A recent TRB report highlights ride-sharing as an important opportunity for transportation
agencies to address the “last mile problem” [Murray et al., 2012]. Deutsche Bahn (German railways) is
running several pilots to synchronize bus and ride-shares to provide convenient door-to-door transportation
to their travelers (Annual report DB 2015). The Flinc ride-sharing smartphone app will soon integrate train
timetables and regional public transport schedules across Germany.
In this paper, we examine the potential benefits of integrating ride-sharing and public transit. Ride-
sharing and public transit can, in fact, complement each other. On the one hand, ride-sharing can serve as
a feeder system that connects less densely populated areas to public transit. One the other hand, the public
transit system can extend the reach of ride-sharing and reduce the detours of the drivers. As such, it may
help to overcome incompatibilities in the itineraries of drivers and riders and facilitate the matching process.
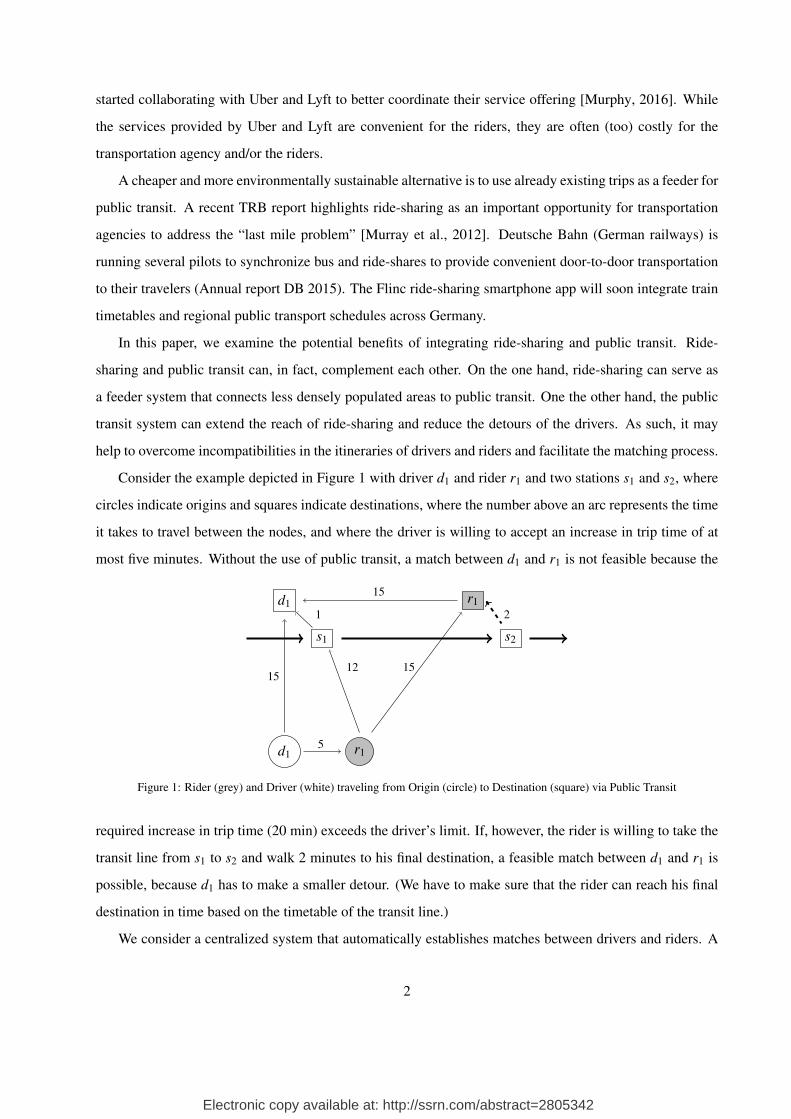
Consider the example depicted in Figure 1 with driver d1 and rider r1 and two stations s1 and s2, where
circles indicate origins and squares indicate destinations, where the number above an arc represents the time
it takes to travel between the nodes, and where the driver is willing to accept an increase in trip time of at
most five minutes. Without the use of public transit, a match between d1 and r1 is not feasible because the
r1
r1
d1
d1
s1 s2
15
15
1512
1 2
5
Figure 1: Rider (grey) and Driver (white) traveling from Origin (circle) to Destination (square) via Public Transit
required increase in trip time (20 min) exceeds the driver’s limit. If, however, the rider is willing to take the
transit line from s1 to s2 and walk 2 minutes to his final destination, a feasible match between d1 and r1 is
possible, because d1 has to make a smaller detour. (We have to make sure that the rider can reach his final
destination in time based on the timetable of the transit line.)
We consider a centralized system that automatically establishes matches between drivers and riders. A
2
Electronic copy available at: http://ssrn.com/abstract=2805342
driver can either move a rider from his origin directly to his destination or to a transit station so that he
can take the train to his final destination. The transit system operates a fixed time table and drivers and
riders announce their itineraries and time schedules on short notice. In this paper, we assume the system
creates matches in a way that maximizes the number of matched riders. As a secondary objective, the system
minimizes the additional driving distance of the matched drivers. As such, this hierarchy aims to maximize
rider mobility while minimizing the inconvenience of the matched drivers and, at the same time, the negative
externalities of car travel.
When there is a park and ride facility at the station, a driver may even decide to park his car after taking
a rider to the station and take public transit to his final destination himself. Drivers provide the ride in
exchange for a small fee that covers the costs of operating the vehicle and a small remuneration for the
time that has been “lost” (due to pick-up and drop-off as well as the detour). The public transit provider
may choose to cooperate with other stakeholders and offer additional benefits to drivers that are willing to
accommodate riders. These might come in the form of a free park-and-ride ticket, a toll waiver, an HOV
lane permit, or priority parking in the city center. As such, this service can be offered at a relatively low cost
to the rider. This may help to increase rider-ship on public transit (which will lead to an increase in public
transportation revenues) and decrease the number of personal vehicles on the road.
The main contributions of our research are that (i) we introduce a new and relevant problem that consid-
ers the integration and synchronization of ride-sharing and scheduled public transit, (ii) we present a solution
approach to optimally create single or multi-modal ride-share matches, and (iii) we conduct an extensive nu-
merical study on artificial instances that capture the main characteristics of many real-world transit settings
and quantify the benefits of integrating ride-sharing and public transit.
The remainder of the paper is organized as follows. In the next section, we discuss relevant and related
literature. In Sections 3 and 4, we formally define the problem and introduce a solution approach. In Section
5, we discuss the details of our numerical experiments and present the main results. We close the paper with
a summary of our findings and recommendations for practitioners.
2 Literature
The use of demand-responsive transportation services to enhance the performance of public transportation
systems has been promoted for some time and a wide variety of such services is offered in practice, often
focusing on, or reserved for, people with disabilities and subsidized by the government.
3
Cayford and Yim [2004] present a basic demand responsive feeder system for the city of Milbrae, Cal-
ifornia. In low-demand periods, buses can deviate from their “fixed” routes as well as from their scheduled
departure times based on actual demand. The route deviation is limited to skipping portions of the fixed
route when there is no demand for drop-offs on those portions on a particular trip. Buses operate according
to the fixed schedule in high-demand periods.
One of the common integration options between a fixed-schedule system and an on-demand feeder sys-
tem is the so-called Demand Responsive Connector (DRC). Koffman [2004] presents examples of DRCs in
several US cities and observes that it is one of the most popular types of flexible transit services. Such sys-
tems typically operate within a service area and move passengers to and from a transfer point that connects
to a major fixed-route transit network.
A critical question in this context is under what conditions is it better, in terms of service and cost, to
operate the feeder system using a fixed route policy and under what conditions is it better to operate the
feeder system as a demand-responsive service. Quadrifoglio and Xiugang [2009] and Li and Quadrifoglio
[2010] develop analytical and simulation models for this purpose and find that the switching point between
a demand responsive and fixed route policy is in the range from 10 to 50 customers/mi2/h.
A DRC is typically deployed within a specified zone, where the zone has one transfer point and where
one transportation company provides the service. Li and Quadrifoglio [2011] consider the optimal zone
design problem and develop an analytical model based on continuous approximations. Lee and Savelsbergh
[2014] study a setting in which a zone has multiple transfer stations and a passenger can be dropped of at
any of these transfer stations as long as the passenger’s desired service is met. They demonstrate that a more
flexible system can offer substantial cost savings, especially when transit services are frequent and/or transit
stations are relatively close together.
In this paper we consider the use of ride-sharing as a feeder system for scheduled transit. Several recent
papers focus on algorithmic approaches to optimally match riders and drivers in the ride-sharing context.
The work in this area typically considers door-to-door trips in which a driver moves one or more riders from
their origin to their destination (see for example Agatz et al. [2011], Wang et al. [2015], Lee and Savelsbergh
[2015], and Stiglic et al. [2016]). Furuhata et al. [2013] and Agatz et al. [2012] provide a detailed overview
of this line of research and the links to other modes of transportation.
In Stiglic et al. [2015], we do not require door-to-door transportation but allow riders to walk to and
from meeting points to facilitate more convenient rides for the drivers. Here, we extend this work by also
allowing transfers to a transit service with a fixed schedule. While there are only a few meeting points
within walking distance of a specific rider, many more transit stations are within reach by using scheduled
4
transit. The synchronization of the ride-share trips with the transit service links our work to multi-hop ride-
sharing which involves the temporal synchronization of different ride-share trips (see Herbawi and Weber
[2011], Coltin and Veloso [2013] and Drews and Luxen [2013] for algorithmic approaches to these types of
problems).
3 Problem definition
We consider a transit service provider that receives a sequence of trip announcements A from participants.
The set of announcements A can be partitioned into the set of trip announcements by the drivers, D⊂ A, and
the set of trip announcements by the riders, R⊂ A. A trip announcement a∈ A has an origin location, oa, and
a destination location, da, as well as an earliest departure time, ea, at the original location and a latest arrival
time, la, at the destination location. We assume that the departure times of the participants are somewhat
flexible so that the difference la− ea is greater than the travel time from the origin to the destination. For
each a ∈ A, there is also a maximum acceptable trip duration, Ta, a maximum acceptable walking distance
from a transit station, ma, and a maximum acceptable waiting time at a transit station, Wa. We denote the
distance from location i to j by di j, the vehicle travel time from location i to j by ti j, and the time it takes to
walk from i to j by t̂i j. We assume that a time τ is incurred when a driver picks up a rider.
We consider a connected public transit network with a fixed cyclic timetable. The timetable describes
the departure and arrival times of each train at each station. (We refer to the transit vehicles as trains but
these could also be buses, trams, or metros.) Let S denote the set of transit stations. Let t pi j be the (shortest)
travel time by train between station i ∈ S and j ∈ S, where the travel between two stations in the network
can involve one train or multiple trains with transfers. In case the shortest route involves transfers then
transfer and waiting times are included in the travel time. Note that for a cyclic timetable with identical
trains the travel time t pi j is not dependent on the departure time from station i. We denote by θ−s (t) the last
train departure at station s ∈ S at or before time t and by θ+s (t) the first train departure at station s ∈ S at or
after time t.
For presentational convenience, we only consider trips into the city center, i.e., the morning commute.
It is straightforward to extend the concepts and technology to accommodate more extensive travel patterns.
Consequently, we assume for each station s ∈ S an access time, τas , representing the time needed to walk
from the drop-off location to the platform. Furthermore, we assume that a subset of the transit stations,
SP ⊆ S, have a park-and-ride facility and for each station s ∈ SP a park time, τps , representing the time
needed to park and walk from the parking facility to the platform. Finally, we assume that when a rider (or
5
a driver) uses public transport, he will always travel to the station that is closest to his final destination. Let
sr be the closest station to the destination of rider r. Hence, using public transit is only feasible for rider
r if sr is within the maximum acceptable walking distance of his destination, i.e., when dsrdr ≤ mr. For
assessing the feasibility of matches involving public transport, it is convenient to calculate the latest time,
lsr , at which a rider r can arrive at the platform at station s ∈ S and reach his destination at or before lr, i.e.,
lsr = θ−s (lr− t̂srdr − t p
ssr).
We allow matches in which a driver picks up two riders for drop-off at a transit station (i.e., from two
different pickup locations). However, to minimize the inconvenience for the driver, the two riders will be
dropped off at the same transit station.
Thus, the transit service provider offers these types of matches:
• A ride-share match: a match between a rider and a driver in which the driver transports the rider from
his origin to his destination;
• A transit match: a match between a rider and a driver in which the driver transports the rider to a
transit station. Subsequently, the driver drives to his destination while the rider takes public transit to
reach his final destination.
• A park-and-ride match: a transit match in which the driver parks his car and then uses public transport
to reach his final destination
A ride-share match always involves one rider, but both a transit match and a park-and-ride match can involve
one or two riders.
3.1 Assessing the feasibility of a ride-share match
A ride-share match involves a driver i ∈ D and a rider j ∈ R. The departure time e ji of a driver i matched
with rider j depends on the announcement time of rider j, the earliest departure time of rider j, and the trip
duration from oi to o j and is set as follows e ji = max(ei,a j,e j− toio j). This assures that driver i does not wait
for rider j at o j. The pickup time, eij, of rider j is e j
i + toio j and the arrival time, lij, at the rider’s destination
is eij + τ + to jd j . Driver i will arrive at his destination at time l j
i = lij + td jdi . The ride-share match is feasible
only if the trip time duration for driver i, i.e., l ji − e j
i , is less than or equal to Ti. Also, driver i and rider j
must arrive at their destinations before their latest arrival times li and l j, respectively.
6
3.2 Assessing the feasibility of a transit match
A single-rider transit match involves a driver i ∈ D, a rider j ∈ R, and a transit station s ∈ S. The departure
time of the driver, e ji , and the pickup time of the rider, ei
j, are computed in the same way as for a ride-
share match. The arrival time at station s is eij + τ + to js. The driver arrives at his destination at time
l ji = ei
j + to js+τ + tsdi . The rider arrives at his destination at time lij = θ+(ei
j +τ + to js+τas )+ t p
ssr + t̂srdr . The
transit match is feasible if the rider arrives at the platform of the transit station in time, i.e., eij+τ+to js+τa
s ≤
lsj, if the driver arrives at his destination in time, i.e., l j
i ≤ li, and the trip durations of the rider, i.e., lij− ei
j,
and the driver, i.e., l ji − e j
i , are less than or equal to Tj and Ti, respectively.
A two-rider transit match involves a driver i ∈ D, riders j,k ∈ R ( j 6= k), and a transit station s ∈ S.
Without loss of generality we assume that rider j is picked up before rider k. To avoid waiting at o j and
ok, the driver departs at e jki = max(ei,a j,e j− toio j ,ak,ek− (toio j + τ + to jok)). The pickup time ei
j of rider j
is e jki + toio j and the pickup time ek
i of rider k is eij + τ + to jok . The arrival time at station s is ei
k + τ + toks.
The driver arrives at his destination at time l ji = ei
k + τ + to js + tsdi . The transit match is feasible only if both
riders arrive at the platform at the transit station in time, if the driver arrives at his destination in time, and if
the trip durations of the driver and the riders are less than the maximum acceptable trip durations.
Note that in the discussion above we have not explicitly considered the waiting time of a rider at the
platform, e.g., wij = θ+(ei
j + τ + to js + τas )− (ei
j + τ + to js + τas ) in the case of a single-rider transit match.
However, it is easy to see that if the transit match is feasible, the waiting time at the transit station can be
minimized by having the driver depart later. The delay in departure of the driver is bounded by min(wij, li−
lij, l
sj− ei
j− (τ + to js + τas )), i.e., the current waiting time, the remaining driver flexibility, and the remaining
rider flexibility.
3.3 Assessing the feasibility of a park-and-ride match
Assessing the feasibility of a park-and-ride match is similar to assessing the feasibility of a transit match. We
only have to account for the fact that after dropping off the rider(s) at the transit station, the driver continues
using public transit rather than continues using his car. The first difference occurs in the calculation of the
arrival time at the station platform: rather than using the access time τas , we use the park time τ
ps to account
for the fact that the driver parks his car and then driver and rider(s) walk to the platform from there. The
second difference is calculating the time that the driver arrives at his destination, which now involves public
transit.
7
3.4 The matching problem
As in Stiglic et al. [2015], we create a node for each driver i∈D and each rider j ∈ R and an edge connecting
node i and j if there is a feasible match between driver i and rider j. We also introduce nodes that represent
pairs of riders ( j,k), where j,k ∈ R and j 6= k. We add an edge connecting node i and ( j,k) if there is a
feasible match between driver i and rider pair ( j,k). Each edge e has two weights: number of riders in
the match, νe, and the additional driving distance for drivers, δe (note that this value may be negative in
park-and-ride matches because the driver uses public transit to reach his destination from the park-and-ride
station). Note that a transfer match between a driver and a rider (or a driver and a pair of riders) may not
be unique, because there may exist a number of feasible transfer matches involving different stations and
different departures. Similarly, a park-and-ride match between a driver and a rider (or a driver and a pair of
riders) may not be unique. We only consider the match with the lowest driving distance for that combination
of the driver and rider(s).
Let E represent the set of all edges in the bipartite graph and let the binary decision variable xe for edge
e ∈ E indicate whether the edge is in an optimal matching (xe = 1) or not (xe = 0). Furthermore, let Ei and
E j represent the set of edges in E associated with driver i and rider j, respectively. Then, our ride-share
matching problem with the objective of maximizing the number of matched riders can be formulated as the
following integer program:
maxz1 = ∑e∈E
νexe (1)
subject to
∑e∈Ei
xe ≤ 1 ∀i ∈ D, (2)
∑e∈E j
xe ≤ 1 ∀ j ∈ R, (3)
xe ∈ {0,1} ∀e ∈ E. (4)
Objective function (1) maximizes the number of matched riders. Constraints (2) and (3) assure that each
driver and each rider is only included in at most one match in an optimal matching, respectively.
To obtain a matching that minimizes the total increase in driving distance for all drivers, the objective
8
should be replaced by:
minz2 = ∑e∈E
δexe. (5)
Since both objectives, i.e., maximizing the number of matched riders and minimizing the total trip time
increase for all participants, are relevant, we take both objectives into account in a hierarchical fashion,
where we consider z1 as the primary objective and z2 as the secondary objective. We first solve (1) subject
to (2) - (4). Let z∗1 be the number of matched riders. We then solve (5) subject to (2) - (4) plus the additional
constraint ∑e∈E νexe ≥ z∗1.
4 Solution approach
Our ride-matching algorithm consist of a match identification phase and an optimization phase in which the
optimal matching is determined (based on the set of feasible matches). Match identification is performed
separately for each match type, i.e. ride-share matches, transfer matches, and park-and-ride transfer matches.
To identify feasible matches with two riders, we take advantage of the property that a match between driver
i and riders j and k, j 6= k, can be time feasible (but not necessarily) only if the matches between driver i and
rider j and driver i and rider k are both time feasible.
4.1 Determining feasible ride-share matches
Single ride-share match identification is a relatively simple task. In this paper, we perform a straightforward
enumeration of all possible driver-rider pairs and identify those that are feasible by checking the conditions
outlined in Section 3.1.
4.2 Determining feasible transit and matches
The identification of feasible transit matches starts with several preprocessing procedures. For each an-
nouncement a ∈ A, we determine the closest public transit station s ∈ S to the destination location da. This
is done by performing a query in a k−d tree in which all transit station locations are stored. Let sa denote
the closest public transit station to the destination location for announcement a. The set of rider announce-
ments Rp :={
j ∈ R | ds jd j ≤ m j}
is considered in the determination of potential transfer matches and the
set of driver announcements Dp :={
i ∈ D | dsidi ≤ mi}
is considered in the determination of potential park-
and-ride transfer matches. Note that all driver announcements d ∈ D are considered in the determination of
9
potential transfer matches.
The next preprocessing procedure serves to find for each rider j ∈ Rp the set of feasible origin transit
stations S j and the set of feasible departures at each feasible origin station s ∈ S j. For a rider j ∈ Rp, a train
departure time t at origin station s ∈ S j is feasible if e j + τ + to js ≤ t and t ≤ l j− t̂s jd j − t pss j , i.e., the earliest
possible arrival time at the station is less than t and the earliest arrival at the destination departing at or after
t is less than l j. All feasible departures are stored for each individual rider separately.
In another preprocessing step, we find for each driver i ∈ D the set of feasible transit stations Sd and
the set of feasible departures at each feasible transit station s ∈ Sd that he can visit. For a driver i ∈ D, a
transit station s is feasible if he can visit this station on his way from his origin to his destination location
without exceeding his maximum acceptable trip duration. A station departure t is feasible if the arrival of
the driver occurs at or before t− τas . To identify such departures, we build an implied time window [ei
s, lis] at
station s with earliest arrival time eis = ei + tois + τ and the latest departure time li
s = li− tsdi . All departures
t for which t− τas ∈ [ei
s, lis] are feasible. A lookup table is constructed that enables one to query potentially
feasible drivers based on origin station and departure. Feasible single rider transit matches are identified
for each rider by inspecting all feasible stations and feasible train departures for that rider and retrieving all
potentially compatible drivers. The feasibility of a particular match is checked by examining the conditions
that are outlined in Section 3.2.
4.3 Determining feasible park-and-ride matches
To identify feasible park-and-ride matches, a slightly different preprocessing procedure for the drivers is
performed in comparison to the one described in the previous section. The (only) difference is that the latest
departure time lis is calculated using transit trip duration from s to si, the destination station of the driver,
i.e., lis = li− ˆsidi− t p
ssi− τps . Based on the preprocessed feasible departures of the riders and drivers, feasible
single-rider park-and-ride matches are identified for each rider by inspecting all feasible stations and feasible
train departures for that rider and retrieving all potentially compatible drivers. The feasibility of a particular
park-and-ride match is checked by examining all conditions that are outlined in Section 3.3.
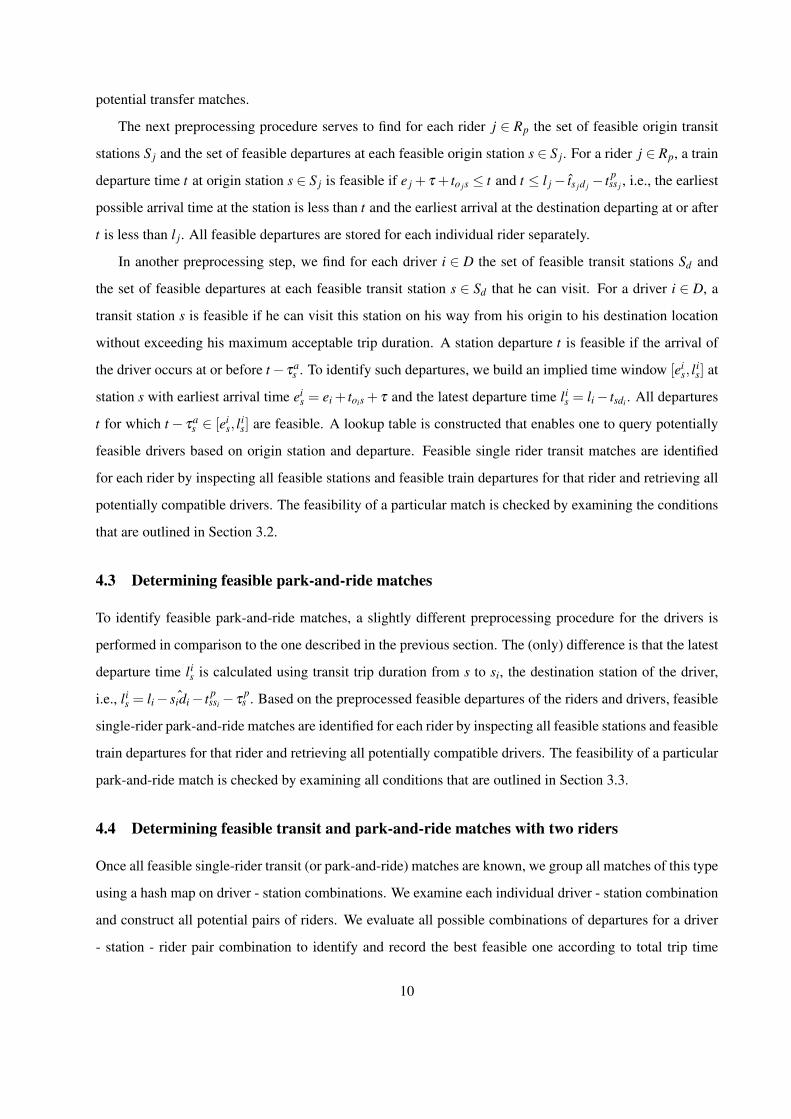
4.4 Determining feasible transit and park-and-ride matches with two riders
Once all feasible single-rider transit (or park-and-ride) matches are known, we group all matches of this type
using a hash map on driver - station combinations. We examine each individual driver - station combination
and construct all potential pairs of riders. We evaluate all possible combinations of departures for a driver
- station - rider pair combination to identify and record the best feasible one according to total trip time
10
increase for the participants in a match. Once all feasible transit and park-and-ride matches are known, we
determine the best match for a particular driver - rider pair match.
5 A computational study
In this section, we report the results of our computational study to assess the possible benefits and synergies
that can arise as a result of integrating a ride-sharing system and a public transit system.
5.1 Generation of instances
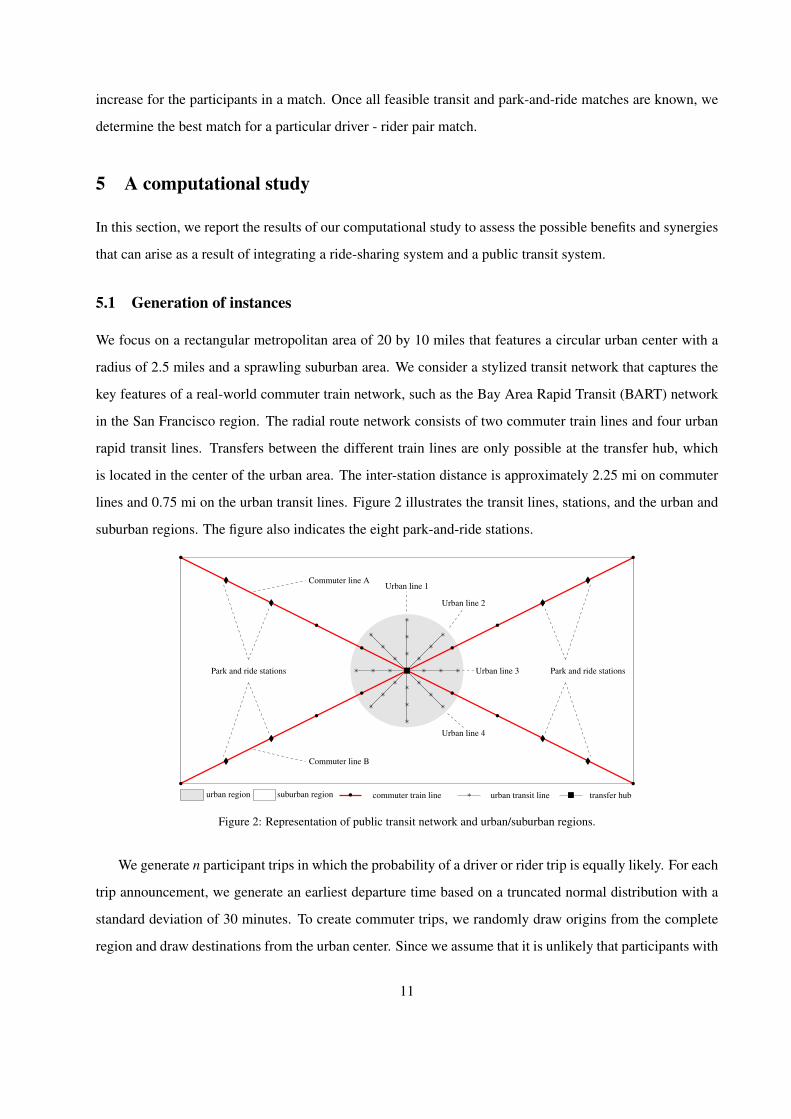
We focus on a rectangular metropolitan area of 20 by 10 miles that features a circular urban center with a
radius of 2.5 miles and a sprawling suburban area. We consider a stylized transit network that captures the
key features of a real-world commuter train network, such as the Bay Area Rapid Transit (BART) network
in the San Francisco region. The radial route network consists of two commuter train lines and four urban
rapid transit lines. Transfers between the different train lines are only possible at the transfer hub, which
is located in the center of the urban area. The inter-station distance is approximately 2.25 mi on commuter
lines and 0.75 mi on the urban transit lines. Figure 2 illustrates the transit lines, stations, and the urban and
suburban regions. The figure also indicates the eight park-and-ride stations.
•
•
•
•
•
•
•
•
•
•
•
Commuter line A
�
�
�
�
Park and ride stations
•
•
•
•
•
•
•
•
•
•
•
Commuter line B
�
�
�
�
Park and ride stations
∗
∗
∗
∗
∗
∗
∗
Urban line 1
∗ ∗ ∗ ∗ ∗ ∗ ∗ Urban line 3∗∗∗
∗
∗
∗
∗
∗
Urban line 2
∗∗∗
∗
∗
∗
∗
∗
Urban line 4
�
urban region suburban region • commuter train line ∗ urban transit line � transfer hub
Figure 2: Representation of public transit network and urban/suburban regions.
We generate n participant trips in which the probability of a driver or rider trip is equally likely. For each
trip announcement, we generate an earliest departure time based on a truncated normal distribution with a
standard deviation of 30 minutes. To create commuter trips, we randomly draw origins from the complete
region and draw destinations from the urban center. Since we assume that it is unlikely that participants with
11
very short trips will participate, we use rejection sampling to filter out the trips that are shorter than 1 mile.
Travel times on roads are calculated using Euclidean distances with a 30% uplift. We assume an average
driving speed of 20 mph, which represents the travel speed in a congested urban area. We consider a pickup
time of two minutes for each rider that is pickup by a driver. We assume a walking speed of 4 feet per second
(LaPlante and Kaeser, 2004). The maximum walking distance for the rider to or from a transit station is 0.5
miles, which corresponds to 11 minutes of walking at this speed.
We assume a cyclic schedule with the same departure frequency for all transit lines, with a default
departure frequency of 15 minutes. The line schedules are synchronized at the hub location so that all
transfers between lines take the same amount of time. The average speed of the commuter train is 40 mph
and the average speed of the urban transit train is 20 mph. All trains have a dwell time of one minute
for regular stations and three minutes at the hub station to allow for transfers. We assume that it takes
two minutes to enter and leave a transit station which captures walking to and from the platform, with an
additional two minute service time for all park-and-ride matches to account for the time that is needed to
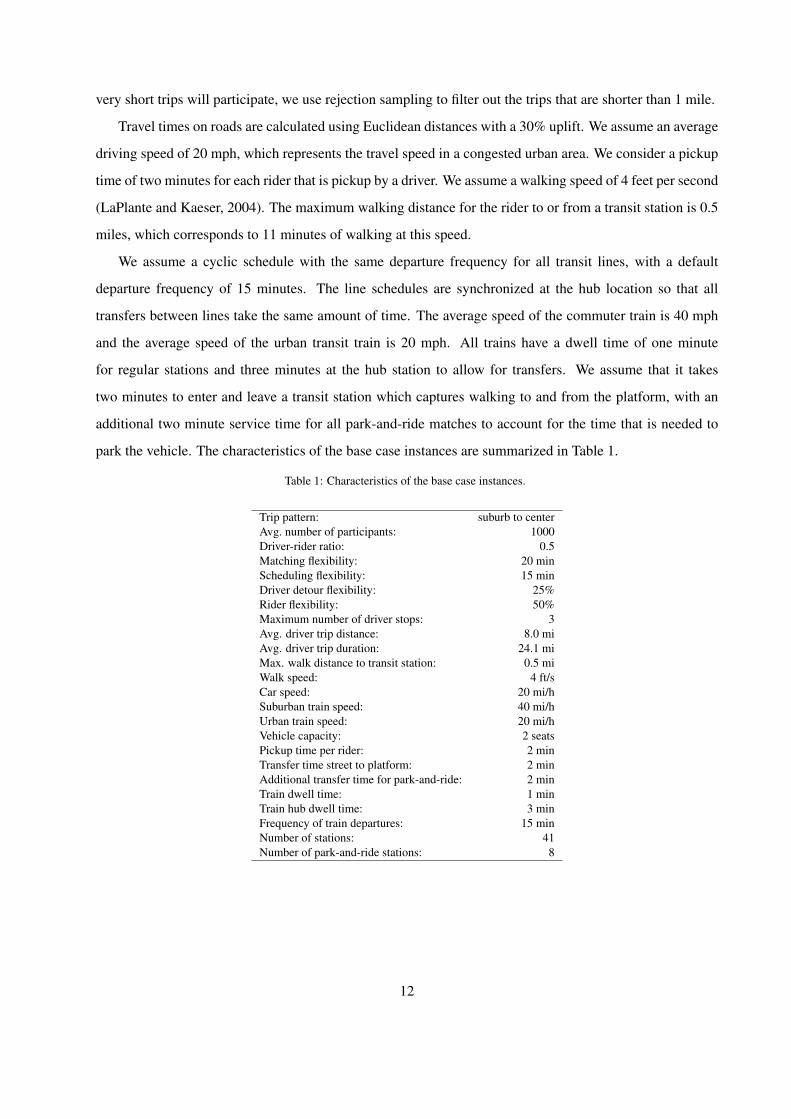
park the vehicle. The characteristics of the base case instances are summarized in Table 1.
Table 1: Characteristics of the base case instances.
Trip pattern: suburb to centerAvg. number of participants: 1000Driver-rider ratio: 0.5Matching flexibility: 20 minScheduling flexibility: 15 minDriver detour flexibility: 25%Rider flexibility: 50%Maximum number of driver stops: 3Avg. driver trip distance: 8.0 miAvg. driver trip duration: 24.1 miMax. walk distance to transit station: 0.5 miWalk speed: 4 ft/sCar speed: 20 mi/hSuburban train speed: 40 mi/hUrban train speed: 20 mi/hVehicle capacity: 2 seatsPickup time per rider: 2 minTransfer time street to platform: 2 minAdditional transfer time for park-and-ride: 2 minTrain dwell time: 1 minTrain hub dwell time: 3 minFrequency of train departures: 15 minNumber of stations: 41Number of park-and-ride stations: 8
12
5.2 Computational results
The main aim of this research is to analyze and quantify the benefits of integrating ride-sharing with public
transit and to determine what value this can create for different stakeholders, e.g., public transit agencies,
ride-share providers, and system participants. We use the optimization results to compute and evaluate a
number of metrics to gain insight into the system performance and the potential of ride-sharing to enhance
mobility and to increase the use of public transport. In all experiments, we either use the base case setting
or a setting in which one of the characteristics is varied in order to assess the sensitivity of the system
performance to this characteristic.
The algorithm for generating feasible matches is implemented in C and the simulation framework is
implemented in Python 3.4. CPLEX 12.6 is used for solving matching problems. All base case instances
are solved within a few seconds, with solution times of up to a minute for the largest instances with 2000
participants.
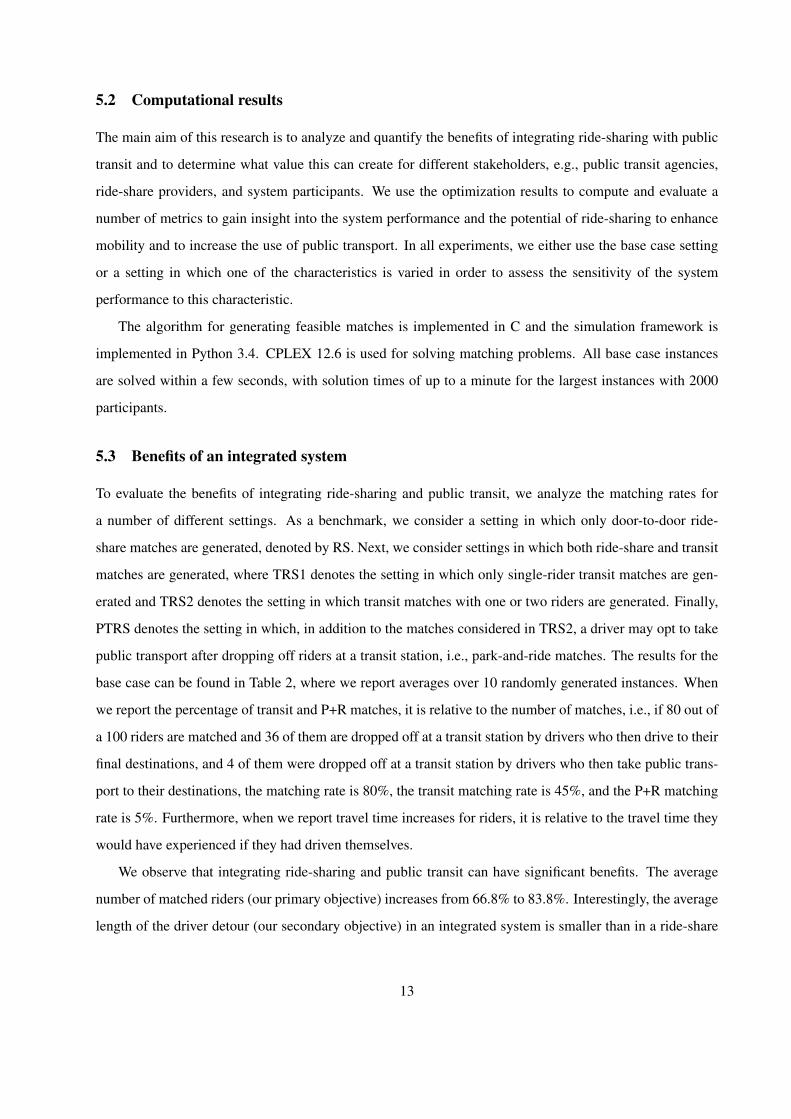
5.3 Benefits of an integrated system
To evaluate the benefits of integrating ride-sharing and public transit, we analyze the matching rates for
a number of different settings. As a benchmark, we consider a setting in which only door-to-door ride-
share matches are generated, denoted by RS. Next, we consider settings in which both ride-share and transit
matches are generated, where TRS1 denotes the setting in which only single-rider transit matches are gen-
erated and TRS2 denotes the setting in which transit matches with one or two riders are generated. Finally,
PTRS denotes the setting in which, in addition to the matches considered in TRS2, a driver may opt to take
public transport after dropping off riders at a transit station, i.e., park-and-ride matches. The results for the
base case can be found in Table 2, where we report averages over 10 randomly generated instances. When
we report the percentage of transit and P+R matches, it is relative to the number of matches, i.e., if 80 out of
a 100 riders are matched and 36 of them are dropped off at a transit station by drivers who then drive to their
final destinations, and 4 of them were dropped off at a transit station by drivers who then take public trans-
port to their destinations, the matching rate is 80%, the transit matching rate is 45%, and the P+R matching
rate is 5%. Furthermore, when we report travel time increases for riders, it is relative to the travel time they
would have experienced if they had driven themselves.
We observe that integrating ride-sharing and public transit can have significant benefits. The average
number of matched riders (our primary objective) increases from 66.8% to 83.8%. Interestingly, the average
length of the driver detour (our secondary objective) in an integrated system is smaller than in a ride-share
13
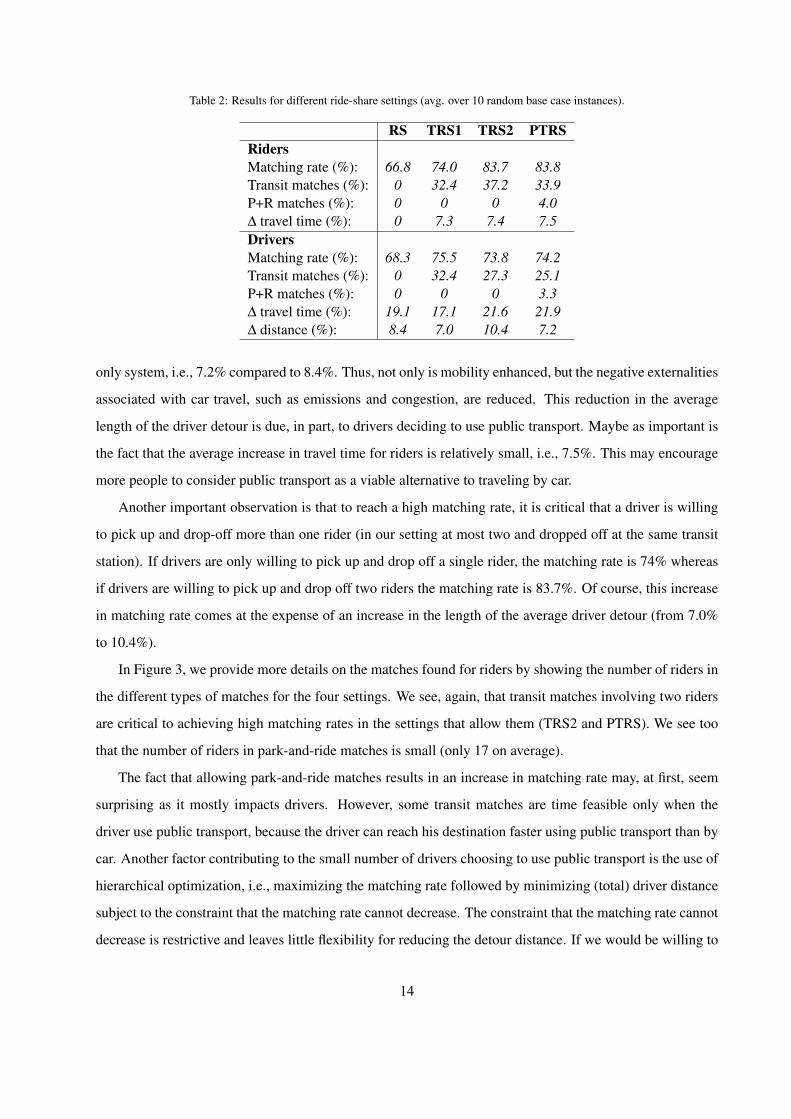
Table 2: Results for different ride-share settings (avg. over 10 random base case instances).
RS TRS1 TRS2 PTRSRidersMatching rate (%): 66.8 74.0 83.7 83.8Transit matches (%): 0 32.4 37.2 33.9P+R matches (%): 0 0 0 4.0∆ travel time (%): 0 7.3 7.4 7.5DriversMatching rate (%): 68.3 75.5 73.8 74.2Transit matches (%): 0 32.4 27.3 25.1P+R matches (%): 0 0 0 3.3∆ travel time (%): 19.1 17.1 21.6 21.9∆ distance (%): 8.4 7.0 10.4 7.2
only system, i.e., 7.2% compared to 8.4%. Thus, not only is mobility enhanced, but the negative externalities
associated with car travel, such as emissions and congestion, are reduced. This reduction in the average
length of the driver detour is due, in part, to drivers deciding to use public transport. Maybe as important is
the fact that the average increase in travel time for riders is relatively small, i.e., 7.5%. This may encourage
more people to consider public transport as a viable alternative to traveling by car.
Another important observation is that to reach a high matching rate, it is critical that a driver is willing
to pick up and drop-off more than one rider (in our setting at most two and dropped off at the same transit
station). If drivers are only willing to pick up and drop off a single rider, the matching rate is 74% whereas
if drivers are willing to pick up and drop off two riders the matching rate is 83.7%. Of course, this increase
in matching rate comes at the expense of an increase in the length of the average driver detour (from 7.0%
to 10.4%).
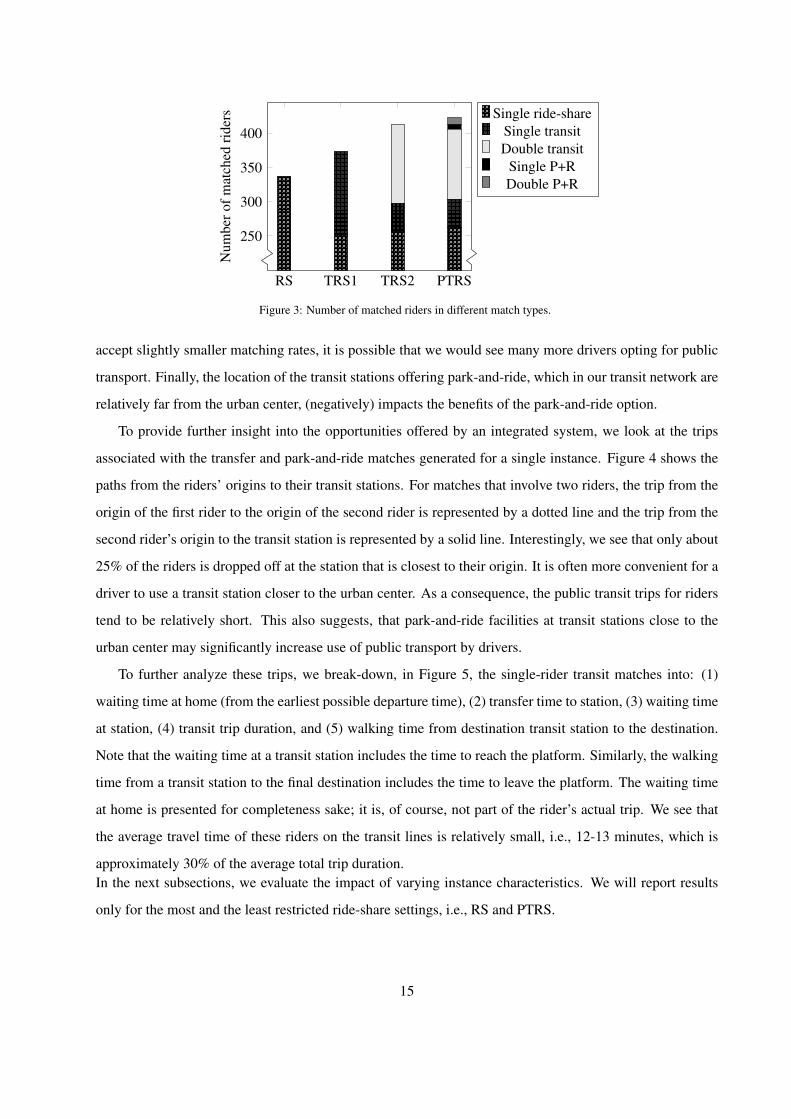
In Figure 3, we provide more details on the matches found for riders by showing the number of riders in
the different types of matches for the four settings. We see, again, that transit matches involving two riders
are critical to achieving high matching rates in the settings that allow them (TRS2 and PTRS). We see too
that the number of riders in park-and-ride matches is small (only 17 on average).
The fact that allowing park-and-ride matches results in an increase in matching rate may, at first, seem
surprising as it mostly impacts drivers. However, some transit matches are time feasible only when the
driver use public transport, because the driver can reach his destination faster using public transport than by
car. Another factor contributing to the small number of drivers choosing to use public transport is the use of
hierarchical optimization, i.e., maximizing the matching rate followed by minimizing (total) driver distance
subject to the constraint that the matching rate cannot decrease. The constraint that the matching rate cannot
decrease is restrictive and leaves little flexibility for reducing the detour distance. If we would be willing to
14
RS TRS1 TRS2 PTRS
250
300
350
400
Num
bero
fmat
ched
ride
rs Single ride-shareSingle transitDouble transit
Single P+RDouble P+R
Figure 3: Number of matched riders in different match types.
accept slightly smaller matching rates, it is possible that we would see many more drivers opting for public
transport. Finally, the location of the transit stations offering park-and-ride, which in our transit network are
relatively far from the urban center, (negatively) impacts the benefits of the park-and-ride option.
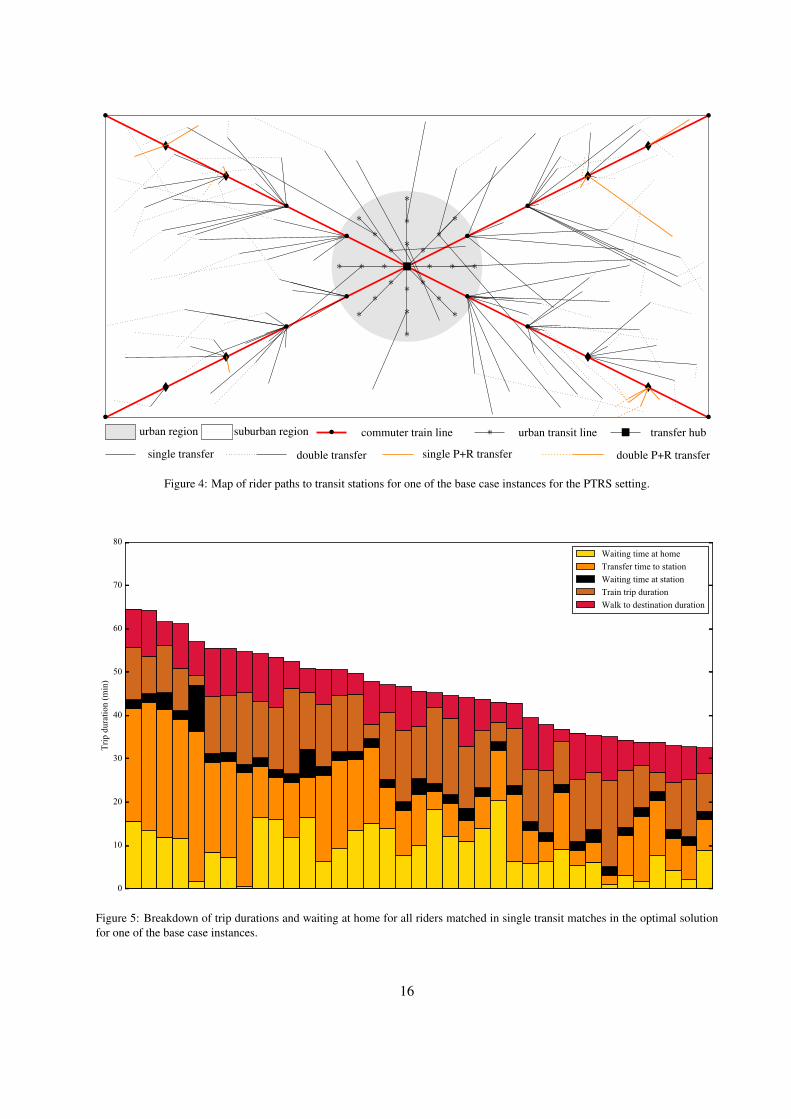
To provide further insight into the opportunities offered by an integrated system, we look at the trips
associated with the transfer and park-and-ride matches generated for a single instance. Figure 4 shows the
paths from the riders’ origins to their transit stations. For matches that involve two riders, the trip from the
origin of the first rider to the origin of the second rider is represented by a dotted line and the trip from the
second rider’s origin to the transit station is represented by a solid line. Interestingly, we see that only about
25% of the riders is dropped off at the station that is closest to their origin. It is often more convenient for a
driver to use a transit station closer to the urban center. As a consequence, the public transit trips for riders
tend to be relatively short. This also suggests, that park-and-ride facilities at transit stations close to the
urban center may significantly increase use of public transport by drivers.
To further analyze these trips, we break-down, in Figure 5, the single-rider transit matches into: (1)
waiting time at home (from the earliest possible departure time), (2) transfer time to station, (3) waiting time
at station, (4) transit trip duration, and (5) walking time from destination transit station to the destination.
Note that the waiting time at a transit station includes the time to reach the platform. Similarly, the walking
time from a transit station to the final destination includes the time to leave the platform. The waiting time
at home is presented for completeness sake; it is, of course, not part of the rider’s actual trip. We see that
the average travel time of these riders on the transit lines is relatively small, i.e., 12-13 minutes, which is
approximately 30% of the average total trip duration.In the next subsections, we evaluate the impact of varying instance characteristics. We will report results
only for the most and the least restricted ride-share settings, i.e., RS and PTRS.
15
•
•
•
•
•
•
•
•
•
•
•
�
�
�
�
•
•
•
•
•
•
•
•
•
•
•
�
�
�
�
∗
∗
∗
∗
∗
∗
∗
∗ ∗ ∗ ∗ ∗ ∗ ∗∗∗∗
∗
∗
∗
∗
∗
∗∗∗
∗
∗
∗
∗
∗
�
urban region suburban region • commuter train line ∗ urban transit line � transfer hub
single transfer double transfer single P+R transfer double P+R transfer
Figure 4: Map of rider paths to transit stations for one of the base case instances for the PTRS setting.
0
10
20
30
40
50
60
70
80
Trip
dur
atio
n (m
in)
Waiting time at homeTransfer time to stationWaiting time at stationTrain trip durationWalk to destination duration
Figure 5: Breakdown of trip durations and waiting at home for all riders matched in single transit matches in the optimal solutionfor one of the base case instances.
16
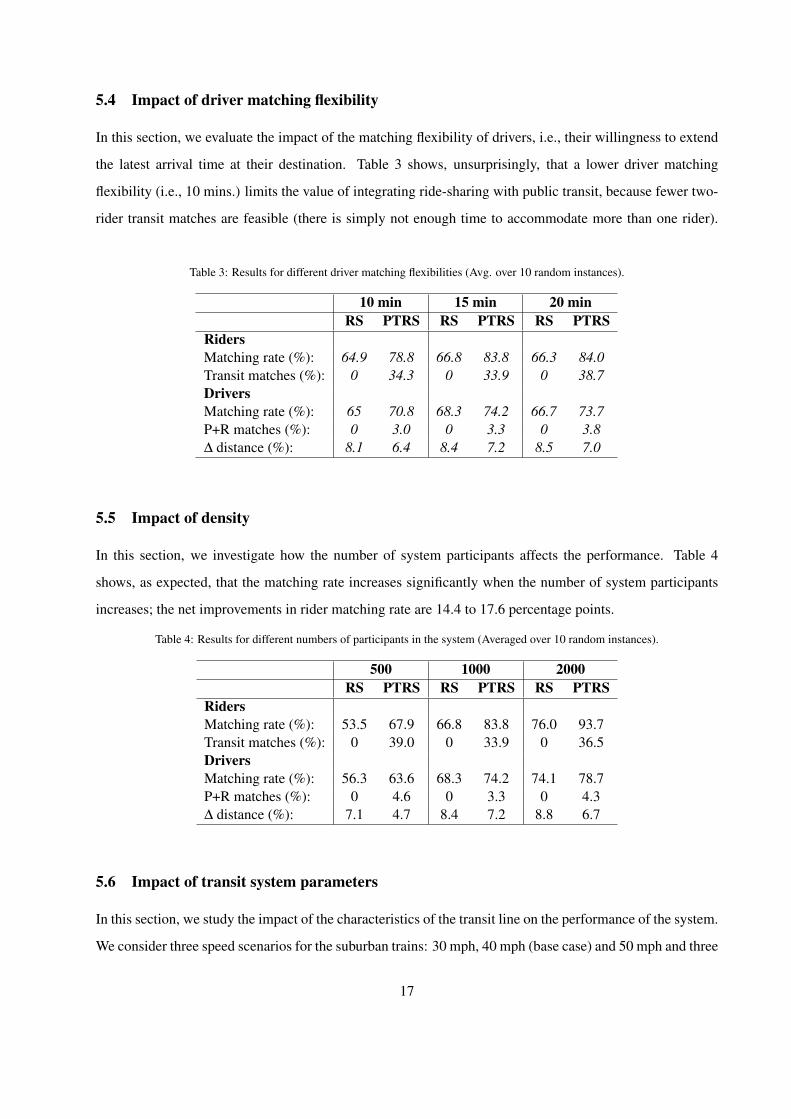
5.4 Impact of driver matching flexibility
In this section, we evaluate the impact of the matching flexibility of drivers, i.e., their willingness to extend
the latest arrival time at their destination. Table 3 shows, unsurprisingly, that a lower driver matching
flexibility (i.e., 10 mins.) limits the value of integrating ride-sharing with public transit, because fewer two-
rider transit matches are feasible (there is simply not enough time to accommodate more than one rider).
Table 3: Results for different driver matching flexibilities (Avg. over 10 random instances).
10 min 15 min 20 minRS PTRS RS PTRS RS PTRS
RidersMatching rate (%): 64.9 78.8 66.8 83.8 66.3 84.0Transit matches (%): 0 34.3 0 33.9 0 38.7DriversMatching rate (%): 65 70.8 68.3 74.2 66.7 73.7P+R matches (%): 0 3.0 0 3.3 0 3.8∆ distance (%): 8.1 6.4 8.4 7.2 8.5 7.0
5.5 Impact of density
In this section, we investigate how the number of system participants affects the performance. Table 4
shows, as expected, that the matching rate increases significantly when the number of system participants
increases; the net improvements in rider matching rate are 14.4 to 17.6 percentage points.
Table 4: Results for different numbers of participants in the system (Averaged over 10 random instances).
500 1000 2000RS PTRS RS PTRS RS PTRS
RidersMatching rate (%): 53.5 67.9 66.8 83.8 76.0 93.7Transit matches (%): 0 39.0 0 33.9 0 36.5DriversMatching rate (%): 56.3 63.6 68.3 74.2 74.1 78.7P+R matches (%): 0 4.6 0 3.3 0 4.3∆ distance (%): 7.1 4.7 8.4 7.2 8.8 6.7
5.6 Impact of transit system parameters
In this section, we study the impact of the characteristics of the transit line on the performance of the system.
We consider three speed scenarios for the suburban trains: 30 mph, 40 mph (base case) and 50 mph and three
17
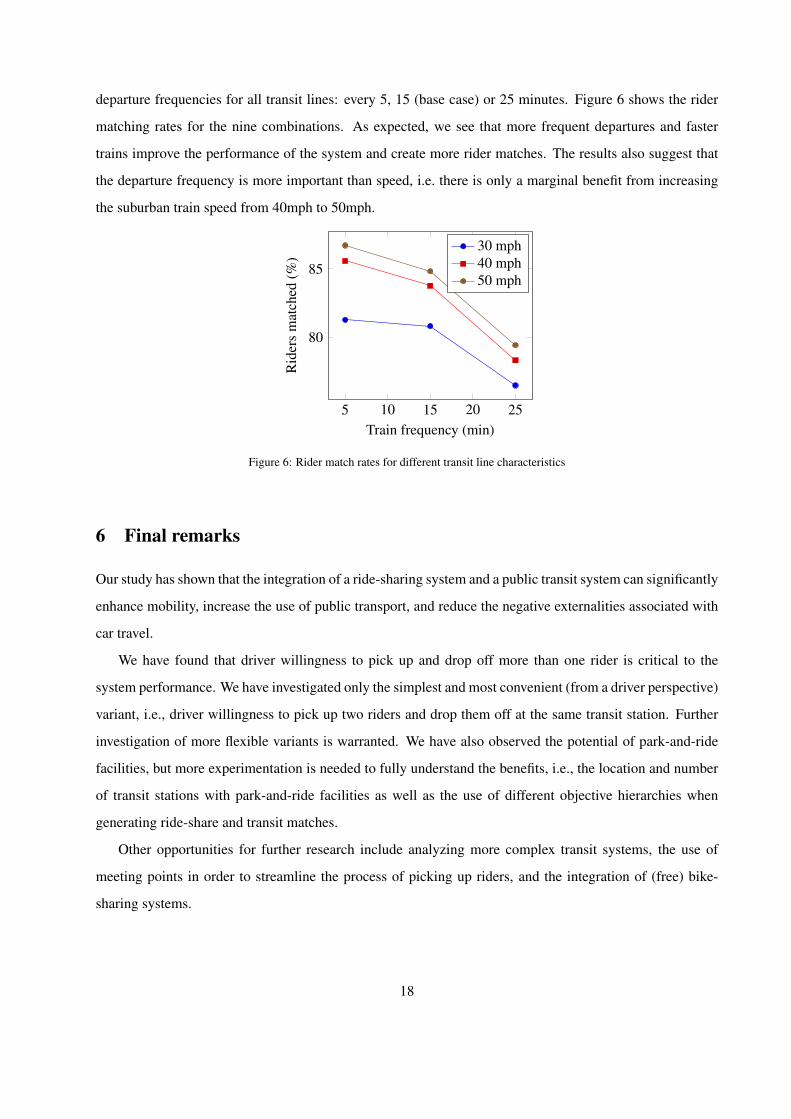
departure frequencies for all transit lines: every 5, 15 (base case) or 25 minutes. Figure 6 shows the rider
matching rates for the nine combinations. As expected, we see that more frequent departures and faster
trains improve the performance of the system and create more rider matches. The results also suggest that
the departure frequency is more important than speed, i.e. there is only a marginal benefit from increasing
the suburban train speed from 40mph to 50mph.
5 10 15 20 25
80
85
Train frequency (min)
Rid
ers
mat
ched
(%)
30 mph40 mph50 mph
Figure 6: Rider match rates for different transit line characteristics
6 Final remarks
Our study has shown that the integration of a ride-sharing system and a public transit system can significantly
enhance mobility, increase the use of public transport, and reduce the negative externalities associated with
car travel.
We have found that driver willingness to pick up and drop off more than one rider is critical to the
system performance. We have investigated only the simplest and most convenient (from a driver perspective)
variant, i.e., driver willingness to pick up two riders and drop them off at the same transit station. Further
investigation of more flexible variants is warranted. We have also observed the potential of park-and-ride
facilities, but more experimentation is needed to fully understand the benefits, i.e., the location and number
of transit stations with park-and-ride facilities as well as the use of different objective hierarchies when
generating ride-share and transit matches.
Other opportunities for further research include analyzing more complex transit systems, the use of
meeting points in order to streamline the process of picking up riders, and the integration of (free) bike-
sharing systems.
18
References
N. A. H. Agatz, A. Erera, M. P. W. Savelsbergh, and X. Wang. Dynamic ride-sharing: A simulation study
in metro atlanta. Transportation Research Part B, 45(9):1450–1464, 2011.
N. A. H. Agatz, A. Erera, M. P. W. Savelsbergh, and X. Wang. Optimization for dynamic ride-sharing: A
review. European Journal of Operational Research, 223(2):295–303, 2012.
R. Cayford and Y Yim, Y.B. Personalized demand-responsive transit service. Technical report, University
of California, Berkley, April 2004.
Brian J Coltin and Manuela Veloso. Towards ridesharing with passenger transfers. In Proceedings of
the 2013 international conference on Autonomous agents and multi-agent systems, pages 1299–1300.
International Foundation for Autonomous Agents and Multiagent Systems, 2013.
Florian Drews and Dennis Luxen. Multi-hop ride sharing. In Proceedings of the Sixth Annual Symposium
on Combinatorial Search, pages 71–79. AAAI Press, 2013.
European Environment Agency. Occupancy rates of passenger vehicles. Technical report, European Envi-
ronment Agency, 2010.
M. Furuhata, M. Dessouky, F. Ordonez, M.E. Brunet, X. Wang, and S. Koenig. Ridesharing: The state-
of-the-art and future directions. Transportation Research Part B: Methodological, 57(0):28 – 46, 2013.
ISSN 0191-2615.
Wesam Herbawi and Michael Weber. Evolutionary multiobjective route planning in dynamic multi-hop
ridesharing. In Evolutionary Computation in Combinatorial Optimization, pages 84–95. Springer, 2011.
D. Koffman. Operational experiences with flexible transit services. Technical report, Transportation Re-
search Board, January 2004.
A. Lee and M. Savelsbergh. An extended demand responsive connector. EURO Journal on Transportation
and Logistics, pages 1–26, 2014.
Alan Lee and Martin Savelsbergh. Dynamic ridesharing: Is there a role for dedicated drivers? Transporta-
tion Research Part B: Methodological, 2015. doi: http://dx.doi.org/10.1016/j.trb.2015.02.013.
X. Li and L. Quadrifoglio. Feeder transit services: Choosing between fixed and demand responsive policy.
Transportation Research Part C: Emerging Technologies, 18(5):770 – 780, 2010.
19
X. Li and L. Quadrifoglio. 2-vehicle zone optimal design for feeder transit services. Public Transport, 3(1):
89–104, 2011.
B.S. McKenzie. Public transportation usage among u.s. workers: 2008 and 2009. Technical report, U.S.
Census Bureau, October 2010.
Colin Murphy. Shared mobility and the transformation of public transit. Technical report, 2016.
G. Murray, M.E. Chase, E. Kim, and M. McBrayer. Ridesharing as a complement to transit: A synthesis of
transit practice. Technical report, Transportation Research Board, February 2012.
S.E. Polzin and A.E. Pisarski. Commuting in america 2013. Technical report, American Association of
State Highway and Transportation Officials, April 2013.
L. Quadrifoglio and L. Xiugang. A methodology to derive the critical demand density for designing and
operating feeder transit services. Transportation Research Part B: Methodological, 43(10):922 – 935,
2009.
M. Stiglic, N. Agatz, M. Savelsbergh, and M. Gradisar. The benefits of meeting points in ride-sharing
systems. Transportation Research Part B: Methodological, 82:36 – 53, 2015.
M. Stiglic, N. Agatz, M. Savelsbergh, and M. Gradisar. Making dynamic ride-sharing work: The impact of
driver and rider flexibility. Transportation Research Part E: Logistics and Transportation Review, 91:190
– 207, 2016.
Xiaoqing Wang, Maged Dessouky, and Fernando Ordonez. A pickup and delivery problem for ridesharing
considering congestion. Transportation Letters: The International Journal of Transportation Research,
pages 1942787515Y–0000000023, 2015.
20