Enhancing Forensic Investigation in Large Capacity Storage Devices
79
2 ABSTRACT Data mining applications have been growing tremendously in today‟s world. One of the important applications of data mining is its usage in forensic investigation especially when a large amount of data is involved. This project explains why forensic tools such as Forensic Tool Kit and Pro Discover cannot be efficiently used when there is huge amount of data involved in various applications. The main focus of the project is to build a data mining system that can handle large sets of data and make forensic investigation efficient and less time consuming. For this purpose two important data mining tools namely Rapid Miner and Waikato Environment for Knowledge Analysis (WEKA) are studied and the system uses WEKA to demonstrate the data mining methodology and thus retrieve data. The four steps of data mining methodology including Association, Classification, Clustering and Regression are demonstrated on a set of data. Later, data retrieval is also performed using Forensic tool Kit (FTK) and the results are compared. Retrieval of data is performed on storage device using data mining and compared to other forensic tools finally.
Transcript of Enhancing Forensic Investigation in Large Capacity Storage Devices

2
ABSTRACT
Data mining applications have been growing tremendously in today‟s world. One of the
important applications of data mining is its usage in forensic investigation especially when a
large amount of data is involved. This project explains why forensic tools such as Forensic Tool
Kit and Pro Discover cannot be efficiently used when there is huge amount of data involved in
various applications. The main focus of the project is to build a data mining system that can
handle large sets of data and make forensic investigation efficient and less time consuming. For
this purpose two important data mining tools namely Rapid Miner and Waikato Environment for
Knowledge Analysis (WEKA) are studied and the system uses WEKA to demonstrate the data
mining methodology and thus retrieve data. The four steps of data mining methodology
including Association, Classification, Clustering and Regression are demonstrated on a set of
data. Later, data retrieval is also performed using Forensic tool Kit (FTK) and the results are
compared. Retrieval of data is performed on storage device using data mining and compared to
other forensic tools finally.

3
TABLE OF CONTENTS
Abstract ............................................................................................................................... i
Table of Contents ................................................................................................................ ii
List of Figures .................................................................................................................... iii
List of Tables ..................................................................................................................... iv
1. Background and Rationale ..........................................................................................1
1.1 Forensic Tools ...................................................................................................3
1.1.1 Forensic Tool Kit ......................................................................................3
1.1.2 Pro-Discover .............................................................................................4
1.2 Applications of Computer Forensics ..................................................................4
1.3 Forensic Techniques……………………………………………………………4
1.4 Data Mining as a source of Forensic Investigation (Veena H Bhat 2010)……..7
2. Narrative…. ................................................................................................................9
2.1 Motivation ..........................................................................................................9
2.2 Data mining .......................................................................................................9
2.2.1 Step by Step Process of Data Mining .......................................................9
2.2.2 Process of Data Mining ...................................................................... …10
2.2.2.1 Clustering……………………………………………………….10
2.2.2.2 Classification...………………………………………………….14
2.2.2.3 Regression ...............................................................................…15
2.2.2.4 Association ..................................................................................17
2.3 Levels of Analysis ...........................................................................................18
2.4 Data Mining Applications ................................................................................19

4
2.5 Limitations of Data Mining .............................................................................20
2.6 Data Mining Open source tools .......................................................................21
2.6.1 Rapid Miner ............................................................................................21
2.6.1.1 Ways of using Rapid Miner ........................................................22
2.6.1.2 Properties of using Rapid Miner .................................................23
2.6.1.3 Operator Info ...............................................................................23
2.6.1.4 Starting Rapid Miner...................................................................23
2.6.1.5 Text mining using Rapid Miner ..................................................27
2.6.1.6 Starting text mining in Rapid Miner ...........................................28
2.6.2 WEKA.....................................................................................................29
2.6.2.1 History.........................................................................................34
2.6.2.2 Core Classes ................................................................................35
2.6.2.3 Learning Schemes .......................................................................35
2.6.2.4 Preprocessing Filters ...................................................................36
2.6.2.5 User Interfaces ............................................................................37
2.6.2.6 Extensibility ................................................................................37
2.6.2.7 Standards and Interoperability ....................................................37
2.6.2.8 Download and Installation ..........................................................38
2.6.2.9 Application and Interfaces ..........................................................40
2.6.2.10 WEKA Function & Tools ……………………………………40
2.6.2.11 Advantages and Disadvantages.................................................41
2.6.2.12 Data Formats ............................................................................41
2.6.2.13 Data Retrieval from CSV file ...................................................42

5
3. Design………………………………………………………………………………45
4 Implementation …….………………………………………………………………46
5. Evaluation and Results…….…………….…………………………………………60
6. Future Work and Conclusion…………….…………………………………………67
Bibliography and References……………………………………………………… 68
Appendix ............................……………………………………………………….70

6
LIST OF FIGURES
Figure1 Measures of violent crime .....................................................................................1
Figure2 Data Storage vs. Time ............................................................................................7
Figure3 Data Mining methodology ....................................................................................10
Figure4 Example of Clustering ..........................................................................................11
Figure5 Exclusive Clustering .............................................................................................13
Figure6 Demonstrating Classification ..............................................................................14
Figure7 Starting Rapid Miner ...........................................................................................24
Figure8 Download Page of Rapid Miner ..........................................................................25
Figure9 Download and Install Rapid Miner .....................................................................25
Figure10 Registration Window .........................................................................................26
Figure11 Start Window of Rapid Miner ...........................................................................26
Figure12 Text Mining using Rapid Miner ........................................................................28
Figure13 Starting WEKA .................................................................................................38
Figure14 Installing WEKA ...............................................................................................39
Figure15 Console Window of WEKA ..............................................................................39
Figure16 WEKA GUI Chooser .........................................................................................40
Figure17 WEKA Explorer ................................................................................................42
Figure18 Preprocessing Window of WEKA .....................................................................43
Figure 19 Classify Window of Explorer.............................................................................43
Figure 20 Example of Decision tree...................................................................................44
Figure 21 Flow Chart for Data Mining...............................................................................45

7
Figure22 Preprocessing Window ......................................................................................47
Figure23 Dialog window for Apriori algorithm ...............................................................49
Figure24 Running Associate data ....................................................................................50
Figure25 Classify Tab in WEKA ......................................................................................52
Figure26 Filtering Capabilities in WEKA ........................................................................52
Figure27 Result Window of Classification in WEKA ......................................................53
Figure28 Result J48 tree ....................................................................................................53
Figure29 Decision tree representation in WEKA .............................................................54
Figure30 Test Instances in WEKA ...................................................................................54
Figure31 Test Results in WEKA .......................................................................................55
Figure32 Cluster Window in WEKA ................................................................................56
Figure33 Applying Simple k-means Algorithm in WEKA ..............................................56
Figure34 Simple K-Means Dialog Box ............................................................................57
Figure35 Result Data Set in Clustering ............................................................................57
Figure36 Visualization Window in Clustering of WEKA ................................................58
Figure37 Visualization threshold curve in Regression .....................................................59
Figure38 Visualization Margin Curve ..............................................................................59
Figure39 Installing FTK ...................................................................................................62
Figure40 Case Lop Option ................................................................................................62
Figure41 Process to Perform using FTK ..........................................................................63
Figure42 Refine Case-Default ..........................................................................................63
Figure43 FTK File Processing ..........................................................................................64
Figure44 FTK Retrieval of Data .......................................................................................64

8
Figure45 Retrieving Data using FTK with unavailable Data Sets .....................................65
Figure46 Resultant Data Set .............................................................................................65
Figure47 Data Retrieval using FTK with hard drive .........................................................66

9
LIST OF TABLES
Table 1.1 Data of Bank Employees ………..…………………………………46
Table 1.2 Time taken to Retrieve Data Using WEKA………………………...61

10
1. BACKGROUND AND RATIONALE
Computer Forensics is a branch of digital forensics wherein the evidence in
certain criminal investigation is found in computers and other digital media. Forensics is
not just about finding data. It is an amalgamation of storing, retrieving, analyzing and
presenting data which is a crucial task in forensic investigation. In short data recovery is
the main objective. Computer Forensics has become important since 1980‟s because that
was the peak period when personal computers have started gaining importance and cyber
crime started spreading like a disease. Some of the cyber crime activities involved child
pornography, piracy of data etc [Wikipedia]. Thus a strong need to attack cyber crime has
come into existence and computer forensics has been gradually developing since then.
Though many countries have well organized forensic tools and techniques, the
developing countries are still facing problems while retrieving data. Figure 1 gives a
description of number of crimes and number of arrests in comparison to those crimes.
Figure 1 Relation between number of crimes and number of arrests
Source: Analyzing Huge Data Sets in Forensic Investigations (Kasun and Yasantha)

11
The number of crimes reported to police is lower when compared to the
percentage of violent crimes [Zoysa 2010]. This happens due to various reasons, some of
which include collection of evidence in unacceptable manner, evidence damaged due to
external conditions which include environmental conditions. Apart from these, the culprit
himself could damage the evidence. Developing countries could face these problems due
to various reasons such as lack of proper equipment, lack of proper software, procedures
and policies are not up to the mark and lack of proper knowledge and training of security
personnel. Bank fraud is yet another area where data mining forensics plays a key role.
Fraud in banks can be of various types. A datacenter manager can make online entries to
move money to his personal accounts. Fictitious loans can be recorded by bank officers
and other lending officials. Apart from that false statements can be submitted by business
customers. The annual cost of fraud and abuse has accounted to $994 billion [Zoysa
2010] which is extremely high, out of which 42% recover nothing after fraud is
discovered. Thus forensic data mining is important since 30% of all frauds are found by
analysis versus tips, unusual discovery of data. Forensic data mining can help find needle
in a haystack. Initially well developed computer systems swoop in, brushing away
surface dust to excavate potential fraud-experts call this forensic data mining. Some of
the professionals who have a good experience in certifying fraud silt through the dirt and
much to determine if the data is occupational fraud or sloppy bookkeeping which is
termed as forensic data analytic [Deguang 2010]. Every fraud case is unique in nature but
any fraud has a common characteristic that any criminal may be caught in at least one
context. Data Mining is one of the most upcoming and most successful programs which
can help professionals examine fraud based on a set of specific risk areas rather than

12
searching a whole lot. Forensic professionals can recover data from any computer system
which can be a desktop, laptop. Apart from these data can be recovered from storage
devices including USB flash drives, cell phones and personal digital assistants. Data
mining can be used in various fields including employee payroll, vendors and account
payable, and various sales and inventory. Data observed includes data of employees with
no deduction, in all working hours, etc. One of the famous quotes says that “Types of
fraud has been changing so as the ability to detect it”[Wikipedia].
1.1 Forensic Tools
Forensic Tools are very crucial in performing forensic analysis. Some of the
widely known forensic tools include
1.1.1 Forensic tool kit (FTK) [Wikipedia]
FTK is one of the most recognized software. It is one of the court validated
software‟s and thus it has become crucial software in cyber forensic investigations. FTK
is an encapsulation of decryption and password cracking. FTK 3 is one of the most
important and latest technologies available in many organizations so that they could
detect any sort of fraud. FTK performs various operations like restoring deleted images
and scan a disk for text strings. FTK also has special software named as FTK imager.
Though FTK is the most widely used forensic tool it has certain limitations and one of the
biggest FTK is one of the most recognized software. It is one of the court validated
software‟s and thus it has become crucial software in cyber forensic investigations. FTK
is an encapsulation of decryption and password cracking. FTK 3 is one of the most
important and latest technologies available in many organizations so that they could
detect any sort of fraud. FTK performs various operations like restoring deleted images
13
and scan a disk for text strings. FTK also has special software named as FTK imager.
Though FTK is the most widely used forensic tool it has certain limitations and one of the
biggest limitation is it can be used only if a certain amount of data is being searched. But
if large amounts of data (for example if terabytes of data) is considered, FTK decreases in
efficiency.
1.1.2 PRODISCOVER
Pro Discover is at another efficient tool in forensic investigation since it scans
data from the sector level itself. It does not delete existing files and in turn recovers data
from the sector level .It performs Boolean search on the entire hard drive and recovers
data. Moreover hash functions can also be used in this type of search. Some of the
advantages of Pro discover include creating bit stream copy of disk to be analyzed while
keeping the data in tact without any modifications. Though pro-discover has its own
advantages, it suffers from limitations such as it cannot be used efficiently when large
amounts of data is considered. Apart from these, some of the forensic tools include Sleuth
Kit, PyFlag, PTK, Autopsy etc. These tools are not widely used due to their complexity
and time consumption.
1.2 Applications
Forensics can be utilized in Genetics, DNA technology, e-forensics and many
other applications
1.3 Forensic Techniques [google]
A number of techniques are used in forensic investigations:

14
• Cross-Drive analysis: An important forensic technique that correlates
information on various hard drives.
• Performing anomaly detection: Corresponds to discovery of events that
typically do not confirm to normal behavior
• Live Analysis: Live analysis is the process of examining computers from
within the operating system using some of the existing tools to extract
evidence from a computer. This sort of technique is useful when dealing with
encrypting file systems, when encryption keys are collected and in some cases
.the hard drive volume can be imaged before the system shuts down
• Deleted Files: Deleted Files can be recovered using computer forensics.
Recent forensic tools have inbuilt tools for recovering deleted files. In many
operating systems physical data is not deleted which enables data to be
reconstructed from physical disk sectors. A technique known as file carving
involves searching for known files headers within a disk image and
reconstructing deleted materials. Apart from that there are various other
forensic techniques which vary from those on computer networks and other
computer systems. On computer networks three types of basic computer
forensic techniques include packet Sniffing, IP address tracing and Email
address tracing.
• Packet Sniffing: Packet sniffing is the process of removing out important
packets of data from the network. The data can contain crucial data including
user names and passwords, email information and any other important data
that is transmitted in the network. IP Address tracing: This technique is

15
important to trace an IP address from which data is being transmitted. IP
address tracing involves counting number of servers which exist between
client and server which are termed as hops.
• Email address tracing: This technique is useful since it detects where an email
has come from. Emails have an e -mail header which in turn consists of the
source from where email has originated.
Though the above techniques are well useful for computer networks, computer
systems have a set of forensic techniques which are very popular. Some of them are as
follows:
• File Structure: File structure is analyzed and the files which are not normal
are collected and subjected to digital evidence. Such type of files may include
encrypted files which may give the examiner a wrong view or any file with an
attached hash algorithms. This is done using automated tools which makes it a
easier process.
• Storage Media: Storage devices include physical or removable disks like hard
drive, thumb drive etc. The data might be deleted due to various reasons.
There are various tools and techniques which are helpful in recovering such
deleted data. The recovered data may or may not of the form it was originally,
thus all the fragments of data are combined so as to get it back to normal
form.
• Steganography: It is the process of hiding information in any other format
than the original format. Data can be hidden by sending it through sound files
or other files across the internet which makes it very difficult for the

16
examiners to detect. In such cases the encrypted data format can be decrypted
using some of the existing techniques or some methods such as steg-analysis
are performed to recover the data
1.4 Data mining as a source of Forensic Investigation [Veena H Bhat
2010]
Data Retrieval in large storage devices has been gaining tremendous importance
now in recent days. Storage capacity is growing with time since new technologies have
been emerging. One of the major problems is that tremendous effort and time are taken to
analyze huge data sets and today most of the forensic tools analyze single drive at a time
which makes it more complex. Thus data mining provides a better approach in solving
the problem. It is a solution to handle massive volumes of data. A diagrammatic approach
of how storage capacity grows over time is as shown in Figure 2.
Figure 2 Storage Capacity over Time
Source: Wikipedia
17
The advantages of data mining include reducing complexity of investigator,
increasing the speed of investigation, improving the quality of data retrieved and data
mining is also economic when huge volumes of data is involved. Data mining is different
from knowledge discovery in databases. Knowledge discovery in databases is the process
of finding useful information and patterns in data whereas data mining makes use of
algorithms to extract useful information and patterns derived by the KDD process. Data
mining is useful in many ways. The results obtained from data mining include forecasting
future events, classification of data into various groups based on their properties,
clustering data based on attributes, associating events that might occur and sequence
them so that they can be used by future events.

18
2. NARRATIVE
2.1 Motivation
Data Mining is a growing area of research in today‟s world and one of the
emerging field in forensic investigation. Data mining plays a crucial role when a large
amount of data is involved. Thus the main objective of this project is to study open
source data mining tools and implement a data mining tool by using all the four steps
involved in data mining.
2.2 Data Mining
Data mining is the process of extracting patterns from huge datasets using a
combination of statistics and artificial intelligence with database management. To
understand data mining in detail, one needs to get a clear understanding of various steps
involved in data mining. They are as follows:
2.2.1 Steps of Data Mining [Veena Bhat 2010]
The following is a step by step methodology to demonstrate the process of data
analysis.
• Data Integration: Data is collected and integrated from different sources
• Data Selection: Useful data is selected while putting aside the data which is
not of any use to the user

19
• Data Cleaning: Data which is selected may not be perfect. It may contain
some disturbances which include noise, errors or unspecific data. Some
techniques are applied to get rid of such data
• Data transformation: Though data is clean, it is not ready for use. It needs to
be transformed to the form in which it serves the purpose. Some of the
techniques include smoothing of data, normalization etc
• Data mining: Now the data is ready to be mined. Techniques like clustering or
association analysis are then used to mine interesting patterns of data
• Pattern evaluation and knowledge representation: In this step, redundant data
is removed. It involves visualization also. After this the data is ready and
decisions are taken finally based on the requirement.
Figure 3 Data Mining Methodology (Source: Oracle.com)
Data mining can be demonstrated using figure 3.
2.2.2 Process of Data Mining:
Data Mining can be performed using the following:
20
Data mining commonly involves four classes of tasks namely clustering,
classification, regression and association rule mining.
2.2.2.1 Clustering [Shi Na, 2010]
Clustering- is the task of discovering groups and structures in the data that are in
some way or another "similar", without using known structures in the data. A formal way
of clustering is it is considered to be the most important unsupervised algorithm which
finds a structure in a collection of unlabeled data. Clustering differentiates similar data
and dissimilar data which say it is different to data in other clusters. [Shi Na, 2010].
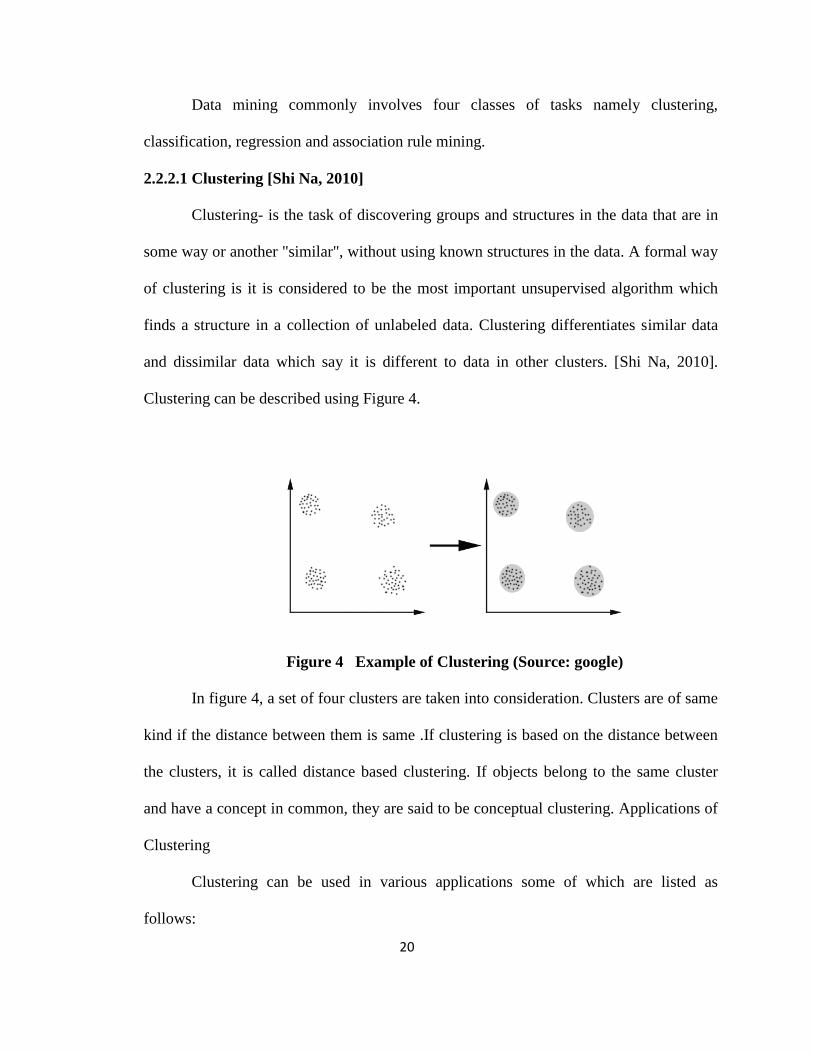
Clustering can be described using Figure 4.
Figure 4 Example of Clustering (Source: google)
In figure 4, a set of four clusters are taken into consideration. Clusters are of same
kind if the distance between them is same .If clustering is based on the distance between
the clusters, it is called distance based clustering. If objects belong to the same cluster
and have a concept in common, they are said to be conceptual clustering. Applications of
Clustering
Clustering can be used in various applications some of which are listed as
follows:

21
• Marketing: In marketing, clustering can be used to find a set of clients who
share a common pattern based on their habits and past purchases
• Biology: In classifying plants and animals based on their characteristics
• Libraries: A set of books are ordered which have similar data
• Insurance: In identifying frauds, by the high probability of crime happened
previously
Apart from these, clustering can be useful in various other applications including
city-planning, earthquake studies etc. To understand clustering in detail, there is a strong
need to understand goals of clustering, requirements of clustering and clustering
algorithms.
• Goals of clustering: The main aim of clustering is to determine the intrinsic
grouping in a set of unlabeled data. Good clustering is based on how the user
supplies the requirements. Any clustering mechanism makes use of clustering
algorithm.
• Clustering Requirements: The main requirements that a clustering algorithm
should satisfy include scalability, dealing with different types of attributes,
discovering clusters with arbitrary shape, minimal requirements for domain
knowledge to determine input parameters, ability to deal with noise and
outliers, insensitivity to order of input records, high dimensionality,
interpretability and usability.
Clustering Algorithms: Clustering algorithms are classified as follows
22
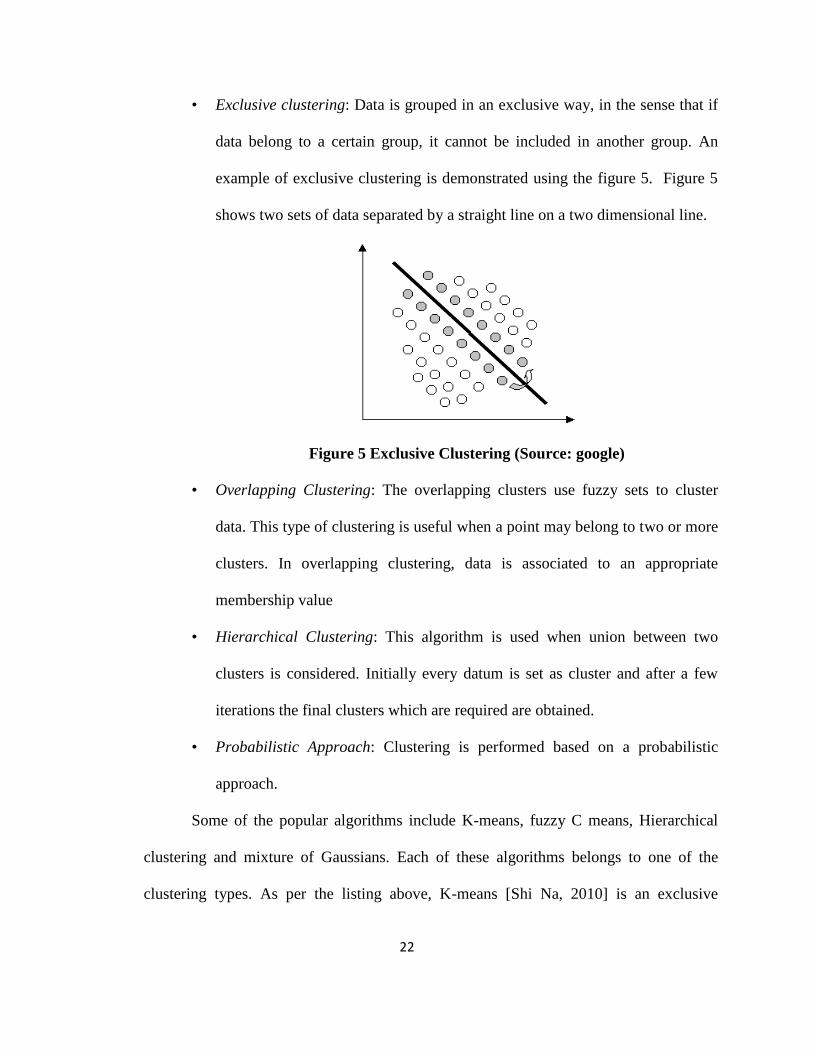
• Exclusive clustering: Data is grouped in an exclusive way, in the sense that if
data belong to a certain group, it cannot be included in another group. An
example of exclusive clustering is demonstrated using the figure 5. Figure 5
shows two sets of data separated by a straight line on a two dimensional line.
Figure 5 Exclusive Clustering (Source: google)
• Overlapping Clustering: The overlapping clusters use fuzzy sets to cluster
data. This type of clustering is useful when a point may belong to two or more
clusters. In overlapping clustering, data is associated to an appropriate
membership value
• Hierarchical Clustering: This algorithm is used when union between two
clusters is considered. Initially every datum is set as cluster and after a few
iterations the final clusters which are required are obtained.
• Probabilistic Approach: Clustering is performed based on a probabilistic
approach.
Some of the popular algorithms include K-means, fuzzy C means, Hierarchical
clustering and mixture of Gaussians. Each of these algorithms belongs to one of the
clustering types. As per the listing above, K-means [Shi Na, 2010] is an exclusive

23
clustering algorithm, Fuzzy C-means is an overlapping clustering algorithm, Hierarchical
clustering and finally Mixture of Gaussian is a probabilistic clustering algorithm.
2.2.2.2 Classification [Christian, 2007]
Classification is the task of generalizing a known structure to apply to new data.
For example, an email program might attempt to classify an email as legitimate or spam.
Common algorithms include decision tree learning, nearest neighbor tree learning,
nearest neighbor, naïve Bayesian classification, neural networks and support vector
machines. For classification, a model is found for class attributes as a function of values
of other attributes. Classification of data involves two data sets which are called training
set and the test set. The training set is given as input to the data mining process and the
test set is used to determine the accuracy of the model. The test set is used to test after the
model is built using the training set. Figure 6 illustrates the classification process of data
mining.
Figure 6 Demonstrating classification (google)

24
Examples of classification include:
• Classifying cancer cells as working or damaged
• Classifying any card transactions as authorized or unauthorized
• Classifying food items as vitamins, minerals, proteins or carbohydrates etc
• Classification of news into sports, weather, stocks etc
Classification Techniques include:
The following are various classification techniques
• Decision tree techniques
• Rule based method
• Neural networks based method
• Naive bayes method
• Support vector machines abbreviated as SVM
2.2.2.3 Regression
Regression – Regression analysis is the process of predicting of continuous
dependant variable from a number of independent variables. It attempts to find a function
which models the data with the least error. Regression analysis can be used on data which
is either continuous or dichotomous. Regression analysis cannot be used to determine
causal relationship. To understand regression in detail, the assumptions of regression
should be understood.
The various assumptions of regression are:

25
• Number of cases: The ratio of cases to independent variables (IVs) ratio
should be 20:1.The minimum ratio should be 5:1.
• Accuracy of data: Data entered should always be checked for accuracy.
Though every entry is not verified, the minimum and maximum value of each
variable should be verified.
• Missing data: Missing data can also be verified using regression analysis.
Some of the variables miss certain values and the user may not be sure if he
can or cannot use those values in his experimentation. After examining data,
the user may want to replace the missing values with the existing values. The
mean value is used as the replacement value.
• Outliers: Outliers are extreme values on a particular item. An outlier is a value
which is at least 3 standard deviations above or below the mean.
• Normality: Normality is used to show how the data is normally distributed.
Normalization of data can be done using histograms. The histogram consists
of a line which conveys how the shape looks like compared with the original
normalized data.
• Scatter plot: Results can be examined statistically using scatter plot.
• Linearity: An important assumption of regression analysis is linearity.
Linearity defines a straight line relationship between Independent variables
and dependant variables. Only linear relationship is considered ignoring the
non-linear relationship. For a linear relationship, the scatter plot is oval.
• Homoscedasticity : The residuals are approximately equal to all predicted
dependant variables .Data is said to be homoscedastic if residual plots are of

26
same width as the predicted dependant variable. To represent
homoscedasticity, cluster of points are taken into consideration.
• Multicollinearity and Singularity: Multicollinearity is a situation where in
independent variables are highly correlated. Singularity refers to the situation
where the independent variables are perfectly correlated and the dependant
variable is obtained from the independent variables.
• Transformations: Transformations are used to normalize data. There are
various types of transformations which vary depending on the requirement. To
choose which type of transformation is to be applied, trial and error method
is used. The transformation produces best results for whose distribution is
normal. For data which is not normal, log transformation is used.
To understand linear regression in detail, one needs to understand simple linear
regression and standard multiple regression. Simple linear regression is used when values
of one variable is to be predicted given values of another variable.
Standard Multiple Regression is the linear regression where different dependant
variables are used to predict another variable while in multiple regressions several
independent variables predicting the dependant variable.
2.2.2.4 Association Rule Learning [Sean 2008], [Du 2010]
Association rule learning searches for relationships between variables. It is a
method for discovering interesting relations between variables in large databases.
Association rules are used to satisfy a user-specified minimum support and a user-
specified minimum confidence at the same time. Initially association rules are generated
using two separate steps, [Sean 2008]. In the first step, minimum support is applied to
27
find all frequent items in a database. In the second step, the frequent data sets are taken
and minimum confidence constraint is used to form rules. Association rule types are
categorized into three types namely actionable rules, trivial rules and inexplicable rules.
Actionable rules are those which convey the actionable information. Trivial Rules are
those in which information is already familiar with the business and market. Inexplicable
Rules are that which have no explanation and does not have any suggested action [Du
2010]. An important terminology in associative rule mining is termed as lift. Lift conveys
how better a rule is when predicting a result than just assuming the result in the first
place. Creating Association rules is one of the crucial tasks in data mining. The following
is a step by step procedure to create association rules [Du 2010].
• Initially the data that is to be mined is taken into consideration
• Generate rules by deciphering the counts in co-occurrence matrix. “A co-
occurrence matrix is a matrix or distribution that is defined over an image to
be distribution of co-occurring values at a given offset” according to
Wikipedia.
• Overcome practical limits imposed by unique items.
For data mining to be understood various levels of analysis are to be understood.
2.3 Levels of Analysis
Different levels of analysis are available which are listed as follows:
• Artificial neural networks: They indicate the non-linear predictive models that
are similar to biological neural networks in structure

28
• Genetic algorithms: Genetic algorithms are optimization techniques which use
processes such as genetic combination, mutation and natural selection in a
design based on the concepts of natural evolution.
• Decision trees: They provide a rule base which can be useful in predicting an
outcome for a new data set
• Rule Induction: Obtaining a set of useful if-then rules from huge sets of data
based on statistical significance
• Nearest neighbor: Classify records based on k-most similar records
• Data visualization: Visual interpretation of complex relationships in
multidimensional data
2.4 Data Mining Applications
Data mining applications can be categorized into 4 types including classification,
numerical prediction, and association and clustering. Some of the examples include
automatic abstraction of data, financial forecasting, targeted marketing, fraud detection,
and weather forecasting and health sectors. Data mining is used to detect fraud and
remove waste initially. But recently it is being used in measuring and improving
performance. Veteran Affairs department uses data mining to predict demographic
changes in the constituency .The airlines department used data mining to analyze flight
crash details. Data mining is also being used in serving a country‟s security purposes.
Data Mining is used in games such as chess, dots and boxes wherein human usable
strategies are extracted from these oracles. In customer services data mining plays a
crucial role. Especially when a company wants to start marketing, instead of randomly
29
selecting a customer, data mining can be performed on selecting the most likely
customers based on their previous sales. Data mining can also be used in human
resources department in identifying characteristics of their most successful employees. In
genetic sciences, data mining can be applied to analyze DNA cells and its risk to develop
cancer. This would be very useful to prevent and treat the disease .The data mining
technique used for such purpose is called multifactor dimensionality reduction.
Engineering is yet another field which utilizes data mining.
2.5 Limitations of Data Mining [Yan Li 2010]
Though data mining has many applications and advantages, it has equal number
of drawbacks. The limitations of data mining are as follows:
• Privacy issues: Privacy is a major concern in any country. In recent years,
internet usage has been increasing and thus privacy has been decreasing.
Selling of private data without the consent of the customers is also termed as
violating privacy law.
• Security Issues: Though many organizations have a lot of private data online,
no proper security measures are being followed.
• Misuse of information: Trends obtain through data mining intended to be used
for marketing purpose or any other purpose is misused. Unauthorized
organizations may obtain data which is extracted through data mining and use
it for illegal purposes.
30
• Connection between behaviors and variables: Though data mining identifies
connections between behaviors and variables, it does not identify a causal
relationship.
The project initially starts with understanding the forensic tools FTK and pro
discover. Later on the data mining process is studied in detail and the methodology
involved is understood. For this purpose some of the open-source data mining tools
including Rapid Miner is focused mainly to understand the process of data mining. A
data miner module is used in this project to retrieve data from a specific drive. It is
further extended to retrieve data from a storage device which can be a hard drive or a
thumb drive. As the data mining process is completed and data retrieval is performed, it
is finally compared with the results obtained from FTK and pro discover. The results are
presented finally after comparison between data mining with other forensic tools in data
retrieval. The main objective of this project would be to study the drawbacks of forensic
tools such as FTK and pro discover .One of the drawbacks of these tools is that they
cannot be used when large amounts of data is involved. Common areas in which data
mining is used include employees and payroll, vendors and accounts payable, expense
reimbursement, loans (for financial institutions), sales and inventory. The data examined
includes employees with no deductions, no sick/vacation/time off, payroll activity
subsequent to termination and employee vs. department vs. company baselines (dollars
and hours).
2.6 Data Mining Open Source Tools
2.6.1 Rapid Miner [rapid-i.com]

31
The knowledge discovery process consists of the various steps which include
visualization of data, machine learning and evaluation and also data preprocessing. Hence
a data mining platform should allow complex nested operator chains or trees, provide
transparent data handling, comfortable parameter handling and optimization, be flexible,
extendable and easy-to-use. Depending on the task a user has to perform, he may want to
perform highly automated data mining process, or continuously inspect intermediate
results. RAPIDMINER which was initially termed YALE, is an environment for machine
learning, text mining, predictive analysis and business analytics. Rapid miner is used to
mine huge amounts of data which includes data preprocessing, visualization and
deployment. Rapid miner is the most widely used tool by researchers due to its nature of
handling transparent data. Rapid miner is used in research areas and also for real-world
implementation. Rapid Miner is currently available in 2 versions including the
community edition which is an open source version and also the enterprise version which
is an upgrade of community edition. Enterprise edition has enhanced features, services
and also has a guarantee period. Process Modeling is yet another important feature that
helps Rapid Miner reach end users. A clear GUI is used and XML scripting language also
plays a key role in machine learning. In Rapid Miner, the leaves indicate simple steps of
the modeled process while the inner nodes correspond to complex or abstract steps. The
root corresponds to the whole process. Rapid Miner uses XML, a widely used language
for describing structured object used in data mining process. XML configuration files
define a standardized interchange format in data mining process.

32
2.6.1.1 Ways of Using Rapid Miner [rapid-i.com]
Rapid Miner can be used in 2 ways. It can either be started off-line or Rapid
Miner GUI can be used to design XML description of the operator tree. Process
configuration is provided as XML file. Break points in rapid miner can be used to check
intermediate results. The other ways of using Rapid miner include invoking rapid miner
from the program instead of GUI. This can be done using Java API or a clear command
line version. To understand Rapid Miner, there is a strong need to understand the
properties of Rapid Miner.
2.6.1.2 Properties of Rapid Miner
The following are various properties of Rapid Miner
• Rapid Miner is completely written in Java.
• Operator trees describe the process of knowledge discovery
• Usage of XML representation ensures a standard for large and automated
experiments
• Graphical User Interface, Command line mode and JAVA API are three
important modes through which rapid miner can be implemented
• A huge set of visualization schemes are available in data miner which is
obtained by the plotting facility available
• Some of the applications of data mining include text mining, multimedia
mining, feature engineering, data stream mining etc.
2.6.1.3 Operator Info [rapid-i.com]
A large set of operators are available in Rapid Miner .One of the important
operators supported by Rapid Miner is OLAP operators. OLAP stands for online

33
analytical processing. OLAP is an approach to swiftly answer multi-dimensional
analytical queries. An OLAP operators are further categorized as aggregation operators,
group by operators, attributes set pivot operators, group by, grouped ANOVA, post
processing operators can be usually applied on models in order to perform some post
processing steps like cost-sensitive threshold selection.
2.6.1.4 Starting Rapid Miner
Two ways exist to start Rapid Miner on any platform. The user can adapt the
amount of memory which is allowed for usage using any of these ways. The method that
is used makes use of installing Rapid Miner along with Java and then the executable is
run on the system.
• For Rapid Miner to be downloaded, initially the user needs to download Java.
For using rapid miner, the user needs to run a java run time environment(JRE)
version 1.5 (officially 5.0) or higher
Figure 7 Starting Rapid Miner [Source:rapid-i.com]
• In the second step, Rapid miner is downloaded and extracted

34
To download and install Rapid Miner, initially go to rapidminer.com as stated
in Figure 7.
Figure 8 Download page of rapid miner [source:rapid-i.com]
Go to downloads tab and download as shown in Figure 8.
Figure 9 Download and Install rapid miner

35
Click on the download option based on the Windows system varying if it is 32 bit
or 62 bit or any other system and this will take the user to the login or register page as
shown in Figure 10.
Figure 10 Registration window
Rapid miner is now downloaded, and now needs to be installed. The installation
guide will take the user through various steps of installation process. Finally an icon of
Rapid miner5 can be seen on the desktop which is similar to the one shown in Figure11.
36
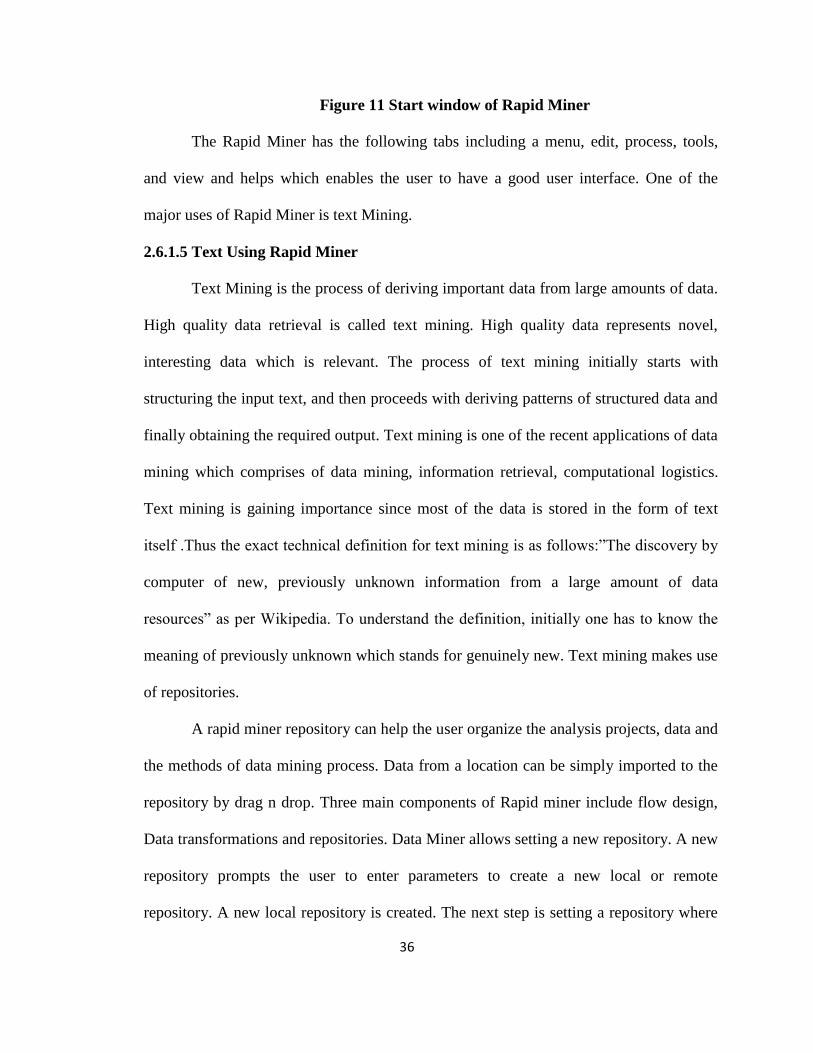
Figure 11 Start window of Rapid Miner
The Rapid Miner has the following tabs including a menu, edit, process, tools,
and view and helps which enables the user to have a good user interface. One of the
major uses of Rapid Miner is text Mining.
2.6.1.5 Text Using Rapid Miner
Text Mining is the process of deriving important data from large amounts of data.
High quality data retrieval is called text mining. High quality data represents novel,
interesting data which is relevant. The process of text mining initially starts with
structuring the input text, and then proceeds with deriving patterns of structured data and
finally obtaining the required output. Text mining is one of the recent applications of data
mining which comprises of data mining, information retrieval, computational logistics.
Text mining is gaining importance since most of the data is stored in the form of text
itself .Thus the exact technical definition for text mining is as follows:”The discovery by
computer of new, previously unknown information from a large amount of data
resources” as per Wikipedia. To understand the definition, initially one has to know the
meaning of previously unknown which stands for genuinely new. Text mining makes use
of repositories.
A rapid miner repository can help the user organize the analysis projects, data and
the methods of data mining process. Data from a location can be simply imported to the
repository by drag n drop. Three main components of Rapid miner include flow design,
Data transformations and repositories. Data Miner allows setting a new repository. A new
repository prompts the user to enter parameters to create a new local or remote
repository. A new local repository is created. The next step is setting a repository where

37
the root directory needs to be specified and click on next, so that the specified directory is
selected. To initialize a new project, a repository location is selected in the repository
browser. This step directs the user to the process perspective. The process perspective is
where the actual repositories and operators are found. Operators in rapid miner are yet
another crucial attributes that are important for data mining process. The operators in
rapid miner define their expected inputs and delivered outputs as well as their parameters.
Rapid Miner has more than 400 data mining operators. Rapid Miner is used to add
operators and connect operators.
2.6.1.6 Starting Text Mining [rapid-i.com]
To start text mining in rapid miner, rapid miner needs to be updated and text
mining needs to be installed. For this, initially one needs to go to the help menu, then
update rapid miner and then select text mining and finally install it
Figure 12 Text Mining using rapid miner [rapid-i.com]
The user should start a new process, select a repository and specify a process
name. On the left side of rapid miner screen one can observe two tabs namely repositories

38
and operators. When the user clicks on the operators tab, the following elements can be
seen. They include process control, utility, repository access, import, export, data
transformation, modeling, evaluation and text processing. To select document, one of the
tabs namely “process doc from files” is selected which retrieves data from a specific file.
To get a system view, it is dragged into the design view and parameters are specified. To
read documents from, one should know where they should be read from. Selection of
specific directories can be performed and internal names can be given to those
parameters. A waiting scheme can be selected. They are taken as unstructured list and
converted to document vector model. Documents are represented as vectors where each
position specifies each word. For each document, each word occurring number of times is
known. If one wants to find relative term frequency, “term frequency” is used to specify
it. Term occurrences correspond to number of times a word occurs.”TF-IDF” is one of
the most important frequencies. Apart from that various separators or regular expressions
can be used in text mining. Though Rapid Miner is useful, it has various drawbacks and
thus not widely used.
2.6.2 WEKA [Waikato.ac.nz]
WEKA, an abbreviated form of Waikato Environment for Knowledge Analysis, is
an open source machine learning tool written in Java developed at the University of
Waikato which is a place in New Zealand. Initially, when the project was developed,
several machine learning algorithms were available which were available on a large
variety of data formats. WEKA is used to compare various machine learning methods.
The WEKA tool kit is flexible and easily extendable. WEKA has various advantages
such as availability under GNU general public license, easily portable due to its

39
implementation in Java, allows data preprocessing and modeling techniques, simple to
use. Various data mining tasks are supported including data preprocessing, clustering,
classification, regression, visualization and feature selection. WEKA provides access to
SQL databases using Java Database Connectivity, the result is returned by a database
query. Some of the features of WEKA are it has forty nine data preprocessing tools,
seventy six classification or regression algorithms, eight clustering algorithms, fifteen
attribute/subset evaluator and ten search algorithms for feature selection.3 algorithms for
finding association rules and three graphical user interfaces.
The graphical user interfaces are “The Explorer”, ”The Experimenter”, ”The
Knowledge Flow”. Explorer has a panel based interface which consists of various panels.
The preprocess panel in WEKA can be used to load data and transform data. Data can be
loaded in various types of file formats like Comma Specified Value (CSV), Attribute
related file format (ARFF) etc. The preprocess panel is used to filter data using pre
processing tools [Remco 2009]. WEKA allows the following such as preprocessing,
visualization, classification, feature selection. Preprocessing allows loading data,
analyzing data and filtering data. Visualization includes comparing pairs of attributes and
plotting matrices. Classification is the process of diving data into algorithms such as
Naïve Bayes etc. Feature Selection is the process of forwarding feature subset selection
etc. The main interface is the Explorer which has various panels.
The various panels including the preprocess panel, classify panel, select attributes
panel, visualize panel provides access to main components of the work bench. The
preprocess panel is a crucial panel which provides an opportunities for importing data
from a database or CSV file. This panel is helpful to visualize prediction errors and also
40
evaluates data via threshold curves. For preprocessing to take place, a filtering algorithm
is applied on the data which is imported. The second panel is used to classify data using
classification and regression techniques [Remco 2010]. After filtering, the resultant
dataset is sent through certain classification and regression algorithms. Regression is one
of the important and easiest techniques to use since it involves a single input and output
variable but can become more complex if large data sets with more number of inputs are
taken into consideration Remco 2010]. The regression model is helpful to predict the
unknown dependant variable if a set of independent variables are taken into consideration
.For data to be passed through regression phase, data should be loaded initially. The data
should be of the format that WEKA understands well. Most probably ARFF type of files
is considered. In this file each column can be defined and the information what each
column contains. The regression models can be used to define numeric or data column.
Initially data is loaded using the preprocessing function explained above. Visualization of
data is performed so that the data set is observed. Now the classify tab is selected and
choose button is selected and the functions branch is expanded. Now the Linear
Regression leaf is selected. Thus the desired model is chosen, and other choices are
“supplied test” which is useful to supply data set to build the model. The other choice is
“cross validation” which is helpful to build a subset model. Apart from that percentage
split is yet another process to build a model based on supplied data set. For WEKA, “use
training set” is the option to perform regression for a certain data set. Though there are
various supervised algorithms, a wide variety of unsupervised algorithms also exist which
are termed as clustering algorithms. The next important panel is termed as cluster panel
where in clustering techniques of data mining are applied. Clustering allows grouping

41
data into patterns. Clustering of data is advantageous over classification because every
attribute is used in grouping of data. Cluster panel provide simple statistics. WEKA‟s
clustering techniques are not very extensive compared to the classification and regression
techniques. Yet clustering of data might be complex and disadvantageous in many
circumstances since the user needs to know in advance how to create data groups.
Attributes are adjusted using simple K means algorithm [Shi 2010].
The select attributes panel is useful for selecting the most probable attributes in a
large set of data. Select attributes panel is a means of having access to large variety of
algorithms and evaluation criteria for identifying the most important attributes in a data
set. Since combining various search methods with different evaluation criteria plays a key
role, large number of candidate techniques is configured. Cross validation is an important
approach to validate robustness of attribute sets. The last panel called the Visualize panel
is helpful for visualization of data. Here data is plotted as a matrix called a scatter plot
matrix. In this panel, data plots can be selected and studied for later purposes. In short
visualization panel provides color-codes scatter plot matrix [Remco 2010] which allows
drilling down of data by selecting individual plots of the matrix and re-selecting parts of
those plots to visualize.
The main aim of designing “The Explorer” phase is for batch-based data
processing. Batch-based data processing is that process where the training data as a whole
is loaded into the memory and then processed. Though this sort of a process is
advantageous for small data sets, it may not be suitable for large data sets. WEKA allows
implementation of some algorithms which allows incremental model building making it a
popular data mining tool.
42
The Explorer interface does not provide a good graphical interface for
incremental model building. In such a case, another set of WEKA‟s graphical user
interfaces have been proven successful. This interface is termed as “Knowledge Flow”.
Though most of the activities performed by the explorer interface are performed by
knowledge interface, the knowledge flow interface is highlighted for its data flow model
which enables incremental updates in addition to batch based training. In this interface,
the incremental updates with the processing nodes can load data and pre process
individual instances prior to serving as inputs to machine learning algorithms which in
this case are the incremental learning algorithms. The knowledge flow interface provides
a set of nodes for visualization and evaluation of data.
The third important graphical user interface is the “Experimenter”. This interface
provides a mechanism to facilitate experimental comparison of predictive performance of
algorithms based on various evaluation criteria. These experiments may include various
algorithms running on a large number of data sets, for example using repeated cross
validation. The experimentation can be conducted on a single node or extended to large
number of nodes on a distributed network which enables reducing computational load to
the individual nodes. As soon as the experiment is set up, it can be saved to either XML
or binary form so as to retake it when necessary. Though WEKA GUI interface provides
a means of accessing the saved experimental data, it can also be accessed through the
command line. According to practitioners, whatever interface is chosen for the data
mining process, it is important for the user to provide java virtual machine which runs
WEKA, with a good and enough heap space. Memory should be pre specified but the

43
basic requirement is it needs to be lower than the amount of physical memory of the
machine the user is handling.
2.6.2.1 History [Remco 2010]
WEKA was a project which was funded by New Zealand Government since
1993.The main aim of the project was stated as follows [Christian 2007]
“The program aims to build a state-of-the-art facility for developing techniques of
machine learning and investigating their application in key areas of the New Zealand
economy. Especially, a work bench is created for machine learning, to determine the
factors that contribute towards its successful application in the agricultural industries,
develop new methods of machine learning and ways of assessing their
effectiveness.”Initially WEKA implementation was started in C language and some
routines were written in Prolog. The initial version of WEKA use only Attribute Relation
File format(ARFF) and was released in 1994.The first official releases of WEKA were in
1996 and 1997 which were termed WEKA 2.1 and WEKA 2.2.Initially eight learning
algorithms, were used in WEKA.WEKA 2.2 also supported UNIX Make files which
were used for large scale experimentation. At a certain point of time, it had become very
difficult to handle large data sets .It was at this point of time, that the system was entirely
written in Java. The complexity factors included changes to supporting libraries,
management of dependencies and complexity of configuration that made the data mining
task a difficult procedure. Thus Java provided a better option to handle such large data
sets since it had unique feature named “Write Once, Run anywhere”. The next version of
WEKA was released in 1998 May termed WEKA 2.3 and finally in 1999 a complete
version of WEKA 3.0 was released. A stable version of WEKA was released in 2003

44
called WEKA 3.4.The latest version of WEKA until present is WEKA 3.6 which given
the even-odd version numbering scheme is considered a feature-stable version. A wide
variety of features make WEKA the most popular tool of data mining. The following are
some of the features in WEKA 3.6
2.6.2.2 Core classes [Remco 2010]
One of the major changes to WEKA‟s core classes is the inclusion of relation-
valued attributes which helps the user to support problems involving multiple instances.
These attributes allow each of its values to refer to a set of instances of a different
set.XML format is yet another data format for ARFF files [Holmes 1994] .An important
update to the core class of WEKA is the “capabilities” meta-data function. Data
characteristics are decided based on the algorithms and filters that are an important part
of this framework. This framework is helpful to the end user since it provides a feedback
about its applications.”Technical Information” class is another set of classes added to the
core classes which allows citing of details for a particular algorithm. Central log file has
been an added important feature which enabled logging into WEKA. Central log file is
one which captures all the information written to any graphical logging panel in WEKA
along with any output to standard out and error.
2.6.2.3 Learning schemes [Christian Kraetzer 2007]
Since WEKA 3.5 has been released, various learning schemes have been
developed and added to WEKA which enabled its popularity. Apart from that some of the
existing schemes have been developed one of which is the instance based learning.
Instance based learning has been improvised and new data structures have been added to

45
improve its performance and efficiency. A set of classification algorithms which have
been added in WEKA 3.6 are listed as follows:
• Bayesian Logistic Regression: It is an algorithm which is used for text
categorization, with Gaussian and Laplace priors.
• Best first Decision Trees: An algorithm which uses best first algorithm in
building a decision tree
• Decision table naïve Bayes hybrid: An algorithm specifically hybrid learner
which is a combination of building decision tree and naïve Bayes
• Functional Trees: Functional trees are a type of decision trees with oblique
splits and leaves represent linear functions.
Apart from these some of the other algorithms include Gaussian processes,
Simple CART, Variants for AODE, Wrapper classifiers. Many multiple instance
algorithms have been added and some meta algorithms also have been added which can
be wrapped around base learning algorithms which enables performance of WEKA.
Some of the meta algorithms include nested dichotomies, dagging, rotation forest etc.
2.6.2.4 Preprocessing filters [Christian Kraetzer, 2007]
WEKA has a large number of preprocessing filters which have increased along
with number of preprocessing tools. Some of the preprocessing filters are listed as
follows:
• Add Classification: Adds predictions of a classifier to a data set
• Add values: Add labels from a given set of data to attribute if they are
missing

46
Apart from these there are other preprocessing filters including Add ID, Attribute
reorder, Numeric to nominal, Partitioned multi-filter, propositional to multi-instance and
vice versa, random subset ,subset by expression, wavelet etc.
2.6.2.5 User Interfaces [Christian Kraetzer 2007]
The GUI chooser of WEKA has been modified and now provides access to
various other interfaces, system information and logging information. The new GUI
interface includes scatter plots, ROC curves, decision trees which are a part of
visualization menu. The tools menu of WEKA supports two new GUIs which are termed
as “SQL viewer” which allows user entered queries to run against a data base and results
are observed. In the explorer, “Open DB” button is used to retrieve data from a data base.
Another GUI is the “Bayes network editor” which helps in analyzing, building and
visualizing bayesian network classifiers.
2.6.2.6 Extensibility
Large number of updates has been added and a number of plugin mechanisms
have been added which makes it widely extensible.
2.6.2.7 Standards and Interoperability
WEKA 3.6 supports importing PMML models .PMML supports predictive
modeling markup language. PMML is a XML based standard for expressing statistical
and data mining models that has gained huge importance .WEKA 3.6 supports import of
PMML regression, and neural network model types. It also supports ability to read and
write data in the format used by the well known Lib-SVM and SVM-Light support vector
machine implementations.

47
2.6.2.8 Download and Installation [Remco 2010]
WEKA can be downloaded at www.cs.waikato.ac.nz/ml/weka/. WEKA can be
downloaded in various formats including a developer version. This can be downloaded
along with Java software or without it if the system already has a version of Java. Since
WEKA is written in Java, it is a mandatory thing to install in Java. The following steps
give a detailed explanation on how to start and install WEKA [Christian, 2007]. The
welcome wizard of WEKA is displayed in Figure 13.
Figure 13 Starting WEKA
Figure 14 shows the installation screenshot of WEKA.

48
Figure
14 Installing WEKA
The setup window pops up as the installation is done which appears as the one in
Figure 15.
Figure 15 Console window of WEKA
As the installation is completed, the WEKA GUI directly pops up on the desktop.
If it does not, go to start menu->programs->WEKA ->WEKA 3.6 and WEKA interface is
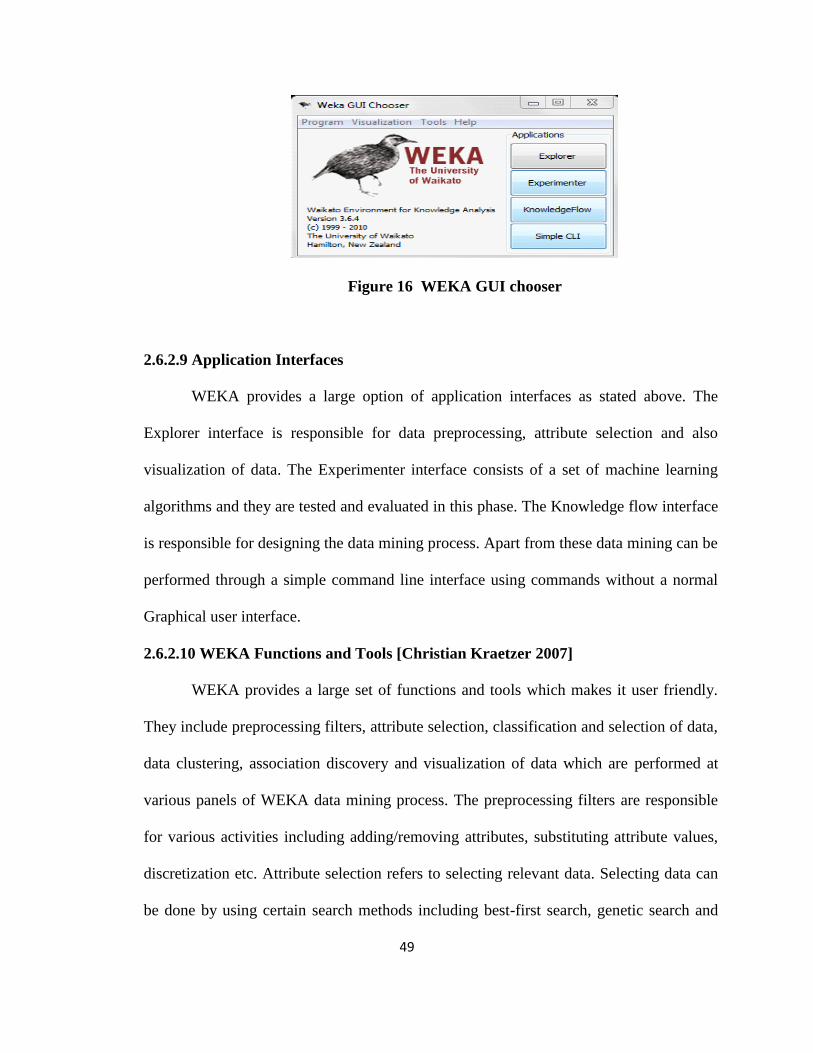
ready to use. WEKA GUI chooser is displayed in Figure 16.
49
Figure 16 WEKA GUI chooser
2.6.2.9 Application Interfaces
WEKA provides a large option of application interfaces as stated above. The
Explorer interface is responsible for data preprocessing, attribute selection and also
visualization of data. The Experimenter interface consists of a set of machine learning
algorithms and they are tested and evaluated in this phase. The Knowledge flow interface
is responsible for designing the data mining process. Apart from these data mining can be
performed through a simple command line interface using commands without a normal
Graphical user interface.
2.6.2.10 WEKA Functions and Tools [Christian Kraetzer 2007]
WEKA provides a large set of functions and tools which makes it user friendly.
They include preprocessing filters, attribute selection, classification and selection of data,
data clustering, association discovery and visualization of data which are performed at
various panels of WEKA data mining process. The preprocessing filters are responsible
for various activities including adding/removing attributes, substituting attribute values,
discretization etc. Attribute selection refers to selecting relevant data. Selecting data can
be done by using certain search methods including best-first search, genetic search and

50
ranking search. After the data is found, relevant data needs to be selected based on a set
of evaluation measures. Another function of WEKA includes classification of data.
Classification of data refers to sorting of data based on a specific category. Data can be
classified using a set of methods including decision trees, naïve bayes method, neural
networks etc. The data thus classified is evaluated using certain evaluation methods
including test data set or cross validation. Data clustering is yet another important
function of WEKA. Clustering can be implemented using a set of algorithms including k-
means, Cobweb, X-means, Farthest first etc. Clustering can be used to compare
visualized clusters and original clusters. Regression is also one of the commonly used
function of data mining using WEKA. The methods for regression of data include linear
regression, neural networks, regression trees etc.
2.6.2.11 Advantages and Drawbacks of WEKA
WEKA is open source free software which makes it available to all the common
people. It is widely extensible and lots of features have been added since its discovery.
WEKA can be integrated into other java packages. WEKA supports a wide variety of
graphical user interfaces which makes it simple and flexible. WEKA can be used to build
various phases of data mining process or it can also be used to run individual
experiments. Though WEKA is a widely used tool it suffers from certain limitations one
of which include poor documentation. Systems are updated constantly which might at
times be confusing and the user might need to learn the process repeatedly.
2.6.2.12 Data Formats in WEKA [RemcoR.Bouckaert 2010]
The data formats for WEKA can be of various formats. The files can be ARFF
(Attribute relation file format) [RemcoR.Bouckaert 2010], Comma Separated value

51
format(CSV),Decision induction algorithm acceptable format etc. Apart from these data
can be read from URL or a SQL database.
2.6.2.13 Data retrieval from CSV file
Data can be imported from a CSV file. A step by step procedure is illustrated
below for a clear overview. Open WEKA and WEKA GUI chooser opens on the desktop.
It has several applications one of which is the explorer. WEKA Explorer shows up which
looks similar to what is shown in Figure 17.
Figure 17 WEKA Explorer
The explorer has various open file, open DB, open URL, generate as options. If
the user needs to import a CSV file, he needs to click on open file and select the required
CSV file. The following example shows the preprocessed data for CSV file which
consists of various presidents of USA, presidency period, Wikipedia entry, took office,
left office, party, portrait, thumbnail, home state. An example of visualizing data when
President field is selected. After preprocessing, the data is organized which can be seen in
figure 18.

52
Figure 18 Preprocessing Window
Data which is retrieved can also be classified based on a set of options. A choose
option exists which allows the user to select from a large set of options. A set of test
options also are applied so as to classify data .For example, a cross validation field exist
which can enable the user to enter the number of folds he wants the data to be which is
displayed in figure 19.
Figure 19 Classify Window of Explorer
Once the data is classified, select the choose option in the classify tab to choose
from various classifiers out of which include bayes, rules, trees etc. If the user wants to
draw a decision tree J-48 he can choose the option in trees .In the result tab which is at
53
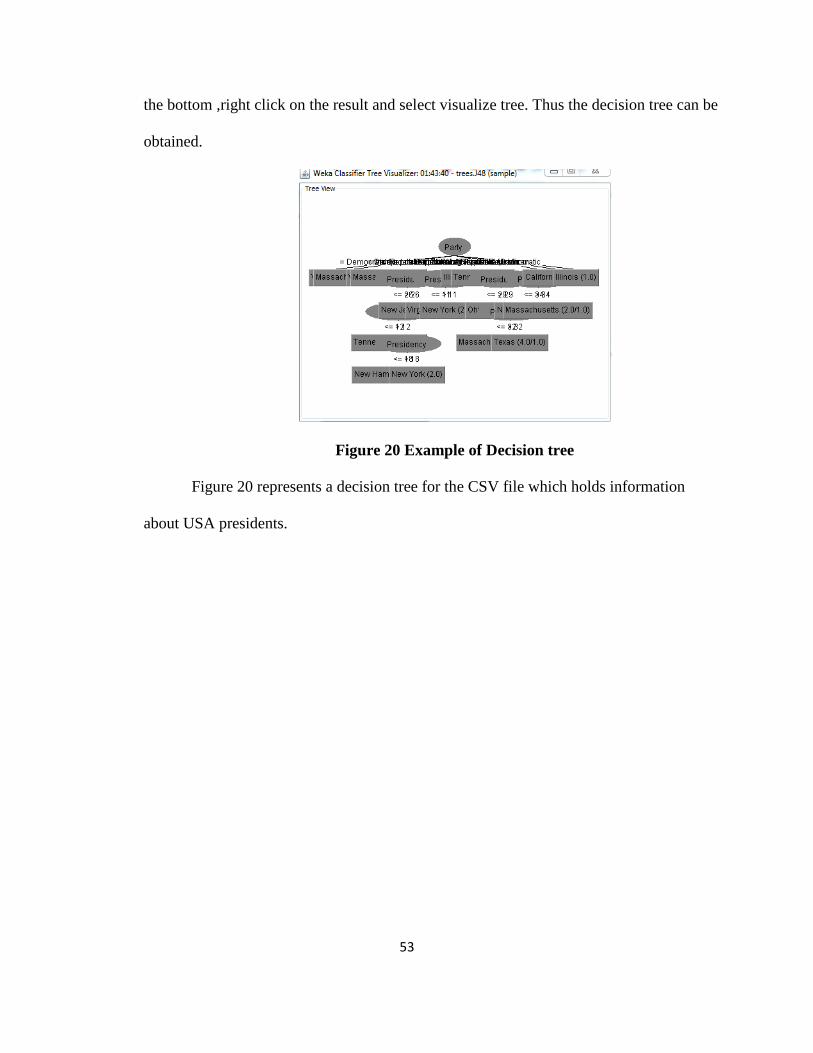
the bottom ,right click on the result and select visualize tree. Thus the decision tree can be
obtained.
Figure 20 Example of Decision tree
Figure 20 represents a decision tree for the CSV file which holds information
about USA presidents.

54
3. DESIGN
The objective is building a data mining system which consists of collecting the
data initially, pre-processing the data, clustering of data, and regression analysis of data
and association rule mining of data. The flow of data is represented using figure 21.
START->PREPROCESSING->ASSOCIATE RULE MINING->
CLASSIFICATION->CLUSTERING->REGRESSION->VISUALIZATION
Figure 21.Flow of Data Mining Methodology in WEKA
In this project, initially data is loaded into WEKA explorer using pre-processing
technique, data is classified based on the attribute selection, and data is then divided into
clusters based on the types of grouping that the user selects. The output obtained after
clustering gives the accuracy of data when data is clustered which can be used for future
predictions. Finally regression analysis describes how regression can be applied and
results can be visualized.

55
4. IMPLEMENTATION
The project is implemented in 4 modules. Each module represents various stages
of data mining process. Each module represents each task of data mining methodology.
The four stages of data mining process include association, classification, clustering and
regression. Initially source data is imported using either the command line interface or the
explorer option in WEKA.
The data taken into consideration in this project is the bank data which consists of
the following fields which has the attributes stated in table1.
TABLE 1: DATA TABLE
Id a unique identification number
Age age of customer in years (numeric)
Sex MALE / FEMALE
Region inner_city/rural/suburban/town
Income income of customer (numeric)
Married is the customer married (YES/NO)
Children number of children (numeric)
Car does the customer own a car (YES/NO)
save_acct does the customer have a saving account (YES/NO)
current_acct does the customer have a current account (YES/NO)
Mortgage does the customer have a mortgage (YES/NO)
Pep did the customer buy a PEP (Personal Equity Plan) after the last mailing

56
(YES/NO)
The following is a step by step procedure to demonstrate Association in data
mining. [Remco, 2010]
• For demonstrating initially change the number of attributes. The source file
can be in one of the forms which is either .arff or .csv. Initially the data is
loaded into WEKA using “Open file” in the Explorer of WEKA GUI
interface.
Figure 22 Preprocessing window
• The left panel of the window shows the attributes and when the user clicks on
any of them, the statistics are displayed on the right side of the explorer.
• The top panel of the explorer shows the values or the basic information of the
attributes selected.

57
• Let us consider an example for children as attributes.
• The attribute children tab which is initially “numeric” should be changed to
attribute “children” {0,1,2,3} which conveys that the data is verified for 4
attributes since WEKA needs a set of specific inputs.
• The id attribute is removed. This can be done by clicking on filter panel and
then click choose button. A window pops up with available filters. Scroll
down and select unsupervised in attributes and then click remove.
• The invert selection button is set to false and click OK..The filter box shows
Remove –R1.
• Association is one important methodology in data mining. This can be
performed on categorical data. For association rule mining, discretization can
be performed on numeric or continuous attributes.
• In this sample set, ”age”, ”income” and “children” are three continuous
attributes. For example consider the “children” attribute, and edit the key
word “numeric” values to “children” as 0,1,2,3.
• Now click on the filter icon and select choose. Choose to find unsupervised
and now select the attribute as discretize
• Click “Discretize –B 10 –M -0.1 –R first-last”. Change attribute indices to 1,4
and bins to 3 and then click OK and then click apply
• Save the data to bank-data-final. arff.
• Change data such as „\‟(-inf -34.333333)\‟ to 0_34.

58
• Click “Associate” tab which is used for association. Use apriori algorithm to
associate the data of bank .The attributes in the associate tab may be of
various formats.[Sean Peisert 2008], [Shi Na 2010]
Lift: P(L,R)/(P(L)P®)
Leverage: P(L,R)-P(L)P®
Conviction: P(L)P(!R)/P(L,!R)
• Apriori algorithm is the default algorithm that is to be used in association rule
mining [Sean Peisert 2008].
• The resulting rules are sorted based on various metrics such as
confidence,leverage and lift[Sean Peisert 2008].
Figure 23 Dialog Window for apriori
• In priori dialog, set “lowerboundMinSupport” to 0.1, set
“upperBoundMinSupport” to1,set “metricType” to lift, set “minMetric” to 1.5,
set “numRules” to 100 [Shi Na, 2010] and finally click “start”.

59
Figure 24 Running Associate Data
CLASSIFICATION [Davis, 2010]
The following is a step by step procedure to demonstrate classification in WEKA
GUI explorer.
• Initially the data is imported into WEKA using open file tab in the explorer
preprocessing window.
• The left panel of the window shows the attributes and when the user clicks on
any of them, the statistics are displayed on the right side of the explorer.
• The top panel of the explorer shows the values or the basic information of the
attributes selected.
• Consider an example for children as attributes.
• The attribute children tab which is initially numeric should be changed to
attribute children {0,1,2,3}which conveys the data is verified for 4 attributes.
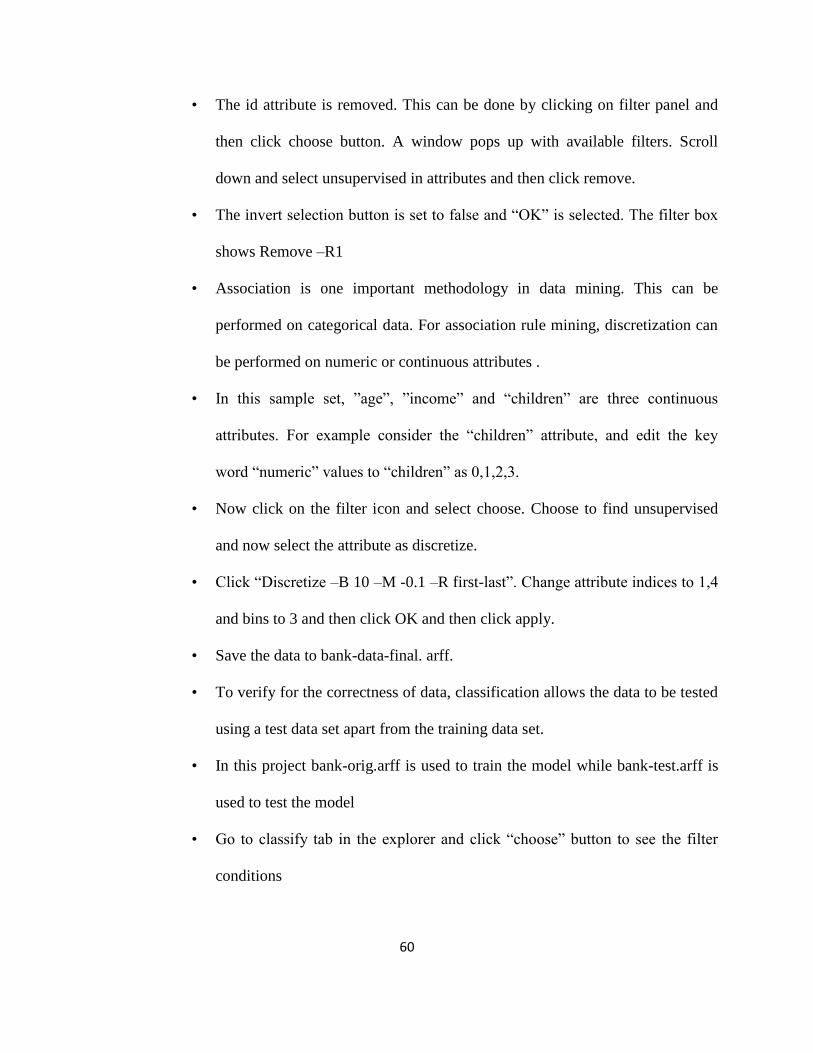
60
• The id attribute is removed. This can be done by clicking on filter panel and
then click choose button. A window pops up with available filters. Scroll
down and select unsupervised in attributes and then click remove.
• The invert selection button is set to false and “OK” is selected. The filter box
shows Remove –R1
• Association is one important methodology in data mining. This can be
performed on categorical data. For association rule mining, discretization can
be performed on numeric or continuous attributes .
• In this sample set, ”age”, ”income” and “children” are three continuous
attributes. For example consider the “children” attribute, and edit the key
word “numeric” values to “children” as 0,1,2,3.
• Now click on the filter icon and select choose. Choose to find unsupervised
and now select the attribute as discretize.
• Click “Discretize –B 10 –M -0.1 –R first-last”. Change attribute indices to 1,4
and bins to 3 and then click OK and then click apply.
• Save the data to bank-data-final. arff.
• To verify for the correctness of data, classification allows the data to be tested
using a test data set apart from the training data set.
• In this project bank-orig.arff is used to train the model while bank-test.arff is
used to test the model
• Go to classify tab in the explorer and click “choose” button to see the filter
conditions

61
Figure 25 Classify tab.
14. For data to be classified, click on filter dialog box and choose binary attributes
numeric attributes and binary class and now the number of available
algorithms are decreased
Figure 26 Filtering Capabilities in WEKA
15. Choose the 10 fold cross validation in the classification tab and click on start .
This starts the process.

62
Figure 27 Result window of classification
• The confusion matrix displayed in the above window shows the details of the
cross validation
• For classified data to be displayed using trees, go to choose and click on trees.
The result is displayed on the bottom right of the window.
Figure 28 Result for J48 tree

63
• The algorithm used here is J48 tree algorithm.
• Right click on the result that is obtained and select “visualize tree”
Figure 29 Decision tree
• To test the data, test data function is used.
• The classification tab has various test options including use training set,
supplied test set, cross validation and percentage split.
• Click on the “supplied test set” and set the test instances .For this purpose a
window pops up and the user can select the test file.

64
Figure 30 Test instances in WEKA
• The results are displayed in the dialog box which can be demonstrated in
figure 30.
Figure 31 Test instances
CLUSTERING [Remco, 2010], [Shi, 2010]
Clustering is yet another important step of data mining. Clustering in WEKA is
performed using K-means algorithm .The following is a step by step procedure to
demonstrate clustering.
• Initially load the data and save it in arff format or csv format.
• Change the attribute “children” to attribute “{0,1,2,3} which means it is for
attributes from 0-3
• Repeat steps 8-11 of classification.
• The new data is now save to bank_cluster.arff
• Now go to cluster tag in the Explorer and click “choose”.

65
Figure 32 Cluster Window in WEKA
• Choose the simple K-Means algorithm in the list of algorithms and the display
would be as follows:[Shi, 2010]
Figure 33 Simple k means algorithm in WEKA
• The user can change the attributes by clicking on the tab which opens up.

66
Figure 34 Simple k means dialog box
• Change the number of clusters”numclusters” to 6 and we can change seed to
10 to 100 or whatever and click on Start
• The following window shows up which displays the instances after attributes
are changed
Figure 35 Result data set in Clustering
• Cluster Instances are displayed on the screen of explorer
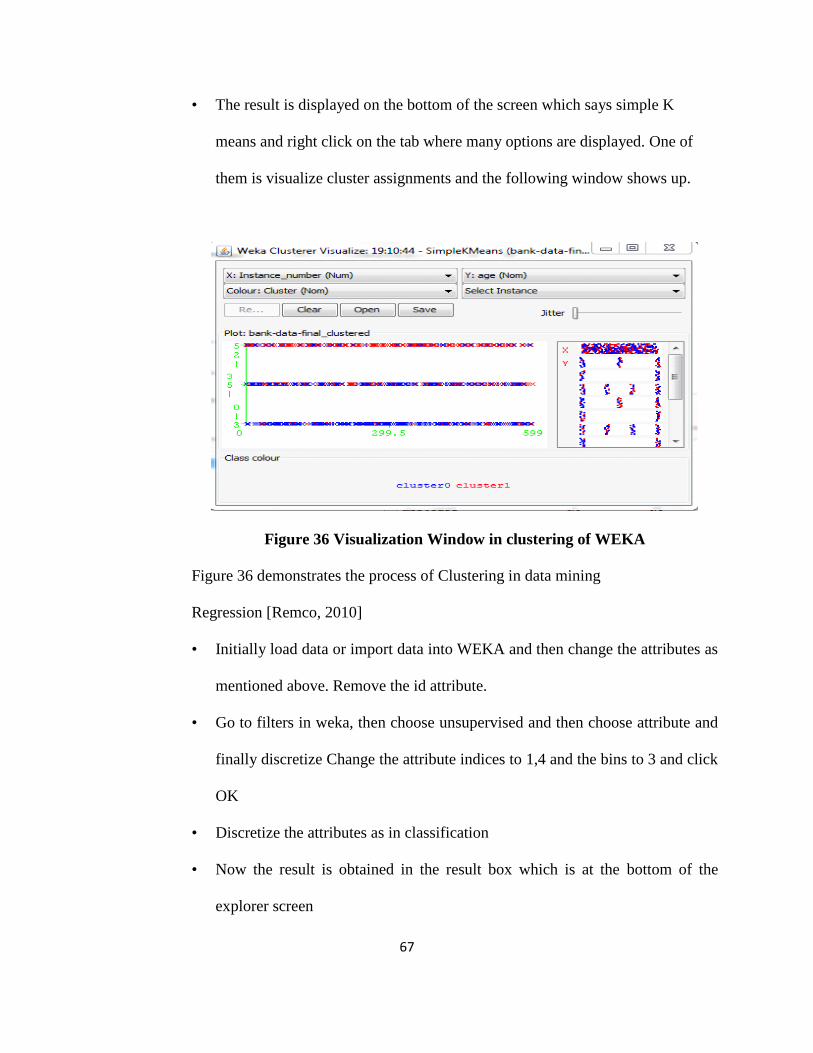
67
• The result is displayed on the bottom of the screen which says simple K
means and right click on the tab where many options are displayed. One of
them is visualize cluster assignments and the following window shows up.
Figure 36 Visualization Window in clustering of WEKA
Figure 36 demonstrates the process of Clustering in data mining
Regression [Remco, 2010]
• Initially load data or import data into WEKA and then change the attributes as
mentioned above. Remove the id attribute.
• Go to filters in weka, then choose unsupervised and then choose attribute and
finally discretize Change the attribute indices to 1,4 and the bins to 3 and click
OK
• Discretize the attributes as in classification
• Now the result is obtained in the result box which is at the bottom of the
explorer screen
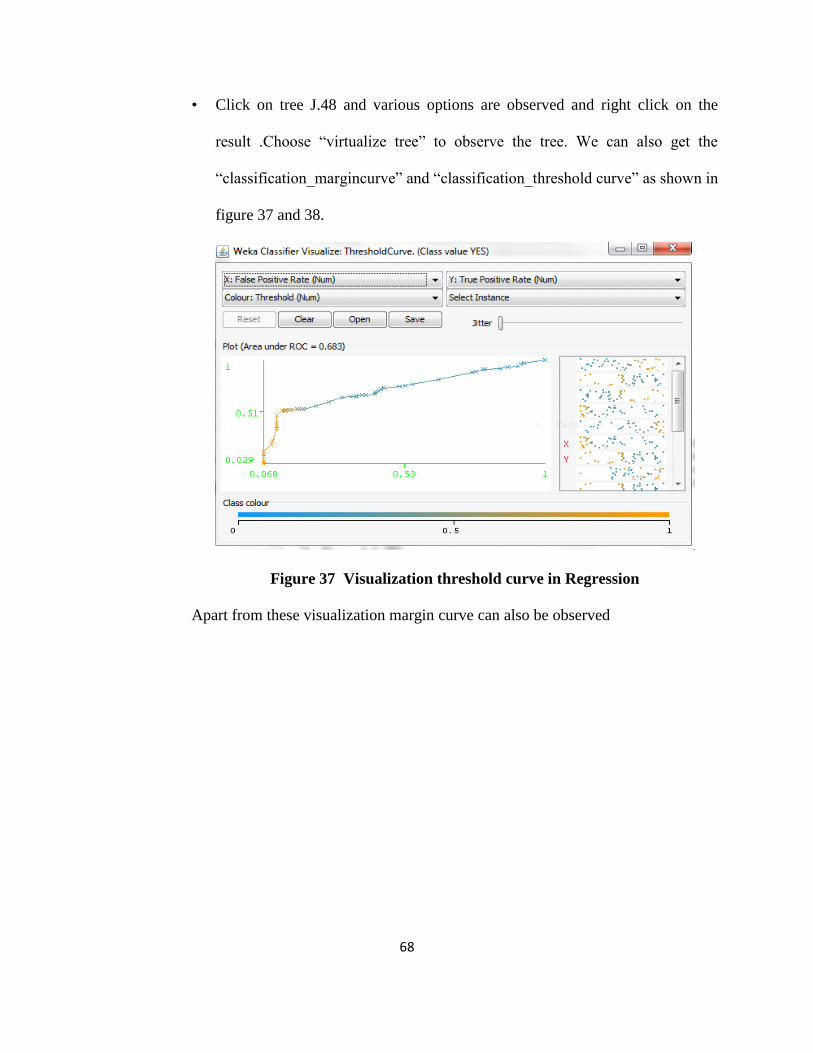
68
• Click on tree J.48 and various options are observed and right click on the
result .Choose “virtualize tree” to observe the tree. We can also get the
“classification_margincurve” and “classification_threshold curve” as shown in
figure 37 and 38.
Figure 37 Visualization threshold curve in Regression
Apart from these visualization margin curve can also be observed

69
Figure 38 Visualization margin curve
5. EVALUATED RESULTS
After understanding and analyzing data mining methodology using WEKA, the
main aim of the project is to retrieve data from a storage device and measure its
performance in comparison to that of existing forensic tools including FTK and pro-
discover. Thus testing is done on a set of .csv files which are stored in a thumb drive and
the results are tabulated. For performing testing, initially metrics for both data mining
tool and forensic tools needs to be analyzed.
Performance metrics include absolute speed, time, accuracy, completeness and
reliability.
The evaluated results after data mining process are as follows:
• The preprocess panel displays the results of newly assigned attribute values
and new labels after changing the attribute values. The data set can be
visualized in the right bottom of the window.

70
• In the classify tab, the correctly specified instances are fifty one percent
approximately while incorrectly specified instances are forty nine percent.
This conveys that the data mining process is accurate to a certain extent since
correctly specified instances are more than the incorrectly specified instances.
Thus classify is used to test accuracy of the model
• The data is then organized into clusters. To observe clustering results “view
clustering results” is used. The results are displayed using various colors of
clusters. Each color represents a cluster which represents the amount of
relevant data in that particular cluster.
Testing with WEKA:
• Testing with thumb drive(small data set)
Consider a test case with a set of sample data which consists of data regarding
presidents of USA. The data is initially present in the thumb drive which is in csv format.
The data is now loaded into WEKA using WEKA Command line interface since WEKA
explorer accepts data in Attribute Related File Format (.arff). The command used to load
data is as follows
java weka. core. converters. CSVLoader bank-data.csv > bank-data. arff .
The csv file containing details of “Details of Presidents of USA” is loaded into the
WEKA explorer and then it is run through WEKA.
The results of the data mining process for “Presidents of USA” data are tabulated
in Table 2.
TABLE 2: Results for Presidents of USA Data Set

71
Data Mining step Time taken to complete the model
Loading and Preprocessing of data 4.2 min
Association rule mining 2.66 min
Classification and results using cross-
validation
3.27min
Clustering with supplied test data 3.78 min
Regression analysis 2.76 min
TOTAL TIME TAKEN 16.73min
The time taken may vary based on various constraints like internet speed, system
performance etc. The process for using WEKA is similar to the one which used bank
employee‟s data set as a sample
TESTING USING FTK
For testing with FTK, install FTK and run it. Add evidence when prompted to and
the user can observe various options in FTK. The following describes a step by step
procedure to demonstrate using of FTK.

72
Figure 39.Installation of FTK
• Figure 39 demonstrates the installation procedure of Forensic tool kit
Figure 40 Case log options
• Figure 40 refers to various case log options which refer to the set of events
that occur during the course of the case.

73
Figure 41. Processes to be performed in FTK
• Figure 41 refers to the processes that are performed while retrieving data
using FTK
Figure 42 .Refine case in FTK
• Figure 42 represents only necessary data to be filtered instead of useless data

74
Figure 43 FTK processing files from the given evidence
• Figure 43 demonstrates the file processing after evidence using FTK. Figure
43 specifies the time taken to retrieve the “USA Presidents set” from the
thumb drive after scanning it.
Figure 44 FTK in retrieval of data
• Figure 44 represents a sample data result which consists of the data set
regarding details of ”Presidents of USA” in another file named worksheets.
Worksheets file can be seen on the right side of the screen

75
Figure 45 Retrieving of data using FTK
• Figure 45 represents data retrieval if no data exists in FTK, in other words if
data set is not found.
Figure 46 Data saved after FTK processing
When data is taken as evidence, and FTK retrieval is performed on it, data which
is retrieved is finally saved in the same drive itself. The total time taken to scan and
retrieve files from a thumb drive was just 5 min which was very much less than that of

76
WEKA. But this is not always true. When a large data set, in case a hard drive is
considered for testing, the results are not the same.
• Testing with Hard Drive:
Consider a hard drive of around 1 Terabyte data in it. It takes around 6 hours for
FTK to scan and retrieve data from a hard drive. Figure 47 gives a view of the time
elapsed while retrieving data from hard drive using FTK
Figure 47 Time Elapsed when Retrieving Data from Hard Drive
But when the data retrieval with WEKA has been performed, it takes around one
to two hours for the entire process including loading of data to WEKA, preprocessing of
data, classification of data based on the requirements, clustering , association rule mining
and finally regression analysis of required data. Thus the results prove that for smaller
data sets FTK is advantageous while for larger data sets data mining would be a better
option.

77
6. CONCLUSION AND FUTURE WORK
This project gives an overview of how data mining can be used as an alternative
to FTK when large capacity storage devices are considered. Thus it can be used as a
source of forensic investigation in future. In this project, data mining has been performed
on two data sets which include a bank employee data set and the data set containing data
of Presidents of USA. The bank employee data set has been used to demonstrate WEKA
data mining process in a step by step methodology while the data set containing data of
Presidents of USA has been used for testing. A new data mining tool can be created
which uses a combination of WEKA and data mining in organization of data which can
be useful for future forensic investigators. Two important forensic tools namely Rapid
Miner and WEKA are studied and then the project demonstrates the implementation of
data mining process using a data mining tool WEKA, which is used to retrieve data from
two storage devices namely thumb drive and a hard drive. The results are compared with
those of retrieving data using well known forensic tools such as FTK. Though data
mining in retrieving data is advantageous, it has its own disadvantages. This is because
not much research is being done in this area. Apart from that data mining is useful and
appropriate only when huge data sets are involved in large storage devices. Thus it
would be a future research area to minimize cost and time when smaller data sets are
involved using data mining. Thus if this is implemented successfully, it reduces cost and
time.

78
BIBLIOGRAPHY AND REFERENCES
[Barbara 2003] Domeniconi,C; Ning Kang, Mining relevant text from unlabelled
documents, Datamining 2003, ICDM 2003, Third IEEE International Conference, pg
489-492
[Christian Kraetzer 2007] Andrea Oermann, Jana Dittman, Andreas Lang, ACM
Proceedings of the 9th
workshop on multimedia and security
[Davis 2010] Davis.J, MacLean.J, Dampier D, Methods of Information hiding and
detection in file systems, 2010 Fifth IEEE International workshop, 66.
[Deguang Wang 2010] Zhigang Zhou, Application of Data field clustering in Computer
Forensics, ICIC ‟10 Proceedings of 2010 Third International Conference on Information
and Computing-volume 1
[Du Ping, 2010] Gao Yongping, A new improvement of Apriori Algorithm for mining
association rules, Computer Application and System Modelling (ICCASM, 2010
International Conference on Volume 2, Pages: V2-529-V2-532.
[Holmes.G 1994] Donkin.A, Witten I.H, WEKA data mining software: An update,
Intelligent Information Systems, 1994, Proceedings of the 1994 Second Australian and
NewZealand Conference, IEEE pg 357-361
[Lu Quin 2010] Lu Quin. Data Mining based on computer forensics based-ID3
algorithm. ICIME, 2010 2nd
IEEE
[RemcoR.Bouckaert 2010] Eibe Frank, Geoffrey Holmes, Bernhard Pfahringer, Peter
Reutemann, IanH. Witeen, WEKA –Experiences with Java Open-Source Project, ACM
The journal of machine learning research.
[Robu.R 2010] Stocu-Tivadar V, Arff Converter tool for WEKA data mining software,
Computational and Technical Informatics (ICCC-CONTI), International Conference,
IEEE, page 247
[Shyam Varan Nath 2006] Shaym Varan Nath, Crime Pattern detection in data mining,
WI-IAT 2006 Workshops, 2006 IEEE/WIC/ACM ) 41-44.
[Sean Peisert 2008]Matt Bishop, Keith Marzullo, Computer Forensics in forensic, ACM
SIGOPS Operating Systems Review, Volume 42 Issue 3
[Shi Na, 2010]Liu Xumin, Research on k-means Clustering Algorithm: An Improved k-
means clustering algorithm, Intelligent Information Technology and Security Informatics
(IITSI), 2010 Third International Sympsosium, pg 63-67.
79
[Thongtae 2008] Thongtae.p,Srisuk.S, An analysis of data mining applications in crime
domain, CIT workshops 2008, IEEE 8th
International Conference, 122-126
[Veena H Bhat 2010] Prashant Rao, Abhilash R V,P Deepa Shenoy, Venugopal K R, L
M Patnaik, A novel data mining approach for digital forensic application in data mining,
IEEE, 2010 Second International Conference on Machine learning and computing
[Yan Li 2008] Guo-gang Li, Fa-chao Li, Chen-xia Jin, Data mining method based on
second learning, Machine learning and Cybernatics, 2008 International Conference, pg
340-344.
[Yen 1997] Show-Jane Yen, Chen, A.L.P. An efficient data mining technique for
discovering interesting association rules, Databases and Expert systems proceedings
[Zdravko Markov 2006] Ingrid Russell, An introduction to WEKA data mining system,
ACM Proceedings of 11th
annual SIGCSE conference on innovation and technology in
computer science education
[Zoysa Kasun 1998] Yasantha Hettirarchi, Analyzing Huge data sets in Forensic
Investigations

80
APPENDIX (Enclosed in CD)
• Data File Of Bank Emploees
• Data File of USA Presidents


![Forensic mortgage investigation corp flyer[1]](https://static.fdocuments.net/doc/165x107/55c7a96ebb61eb5d2e8b4821/forensic-mortgage-investigation-corp-flyer1.jpg)