“ENHANCEMENT OF FABRICATION UNIT OF AN · 5S, OEE (over all equipment effectiveness), ... MIG...
13
125 | Page “ENHANCEMENT OF FABRICATION UNIT OF AN AUTOMOBILE INDUSTRY BY IMPLEMENTING LEAN MANUFACTURING PRINCIPLES” Gaurav Kumar 1 , Mr. Snehasish Patnaik 2 , Dr. Amit Rai Dixit 3 1( M.Tech, Department of Mech. Engg., Indian Institute of Technology, Dhanbad, India) 2( Deputy Manager, MEP Department, JCB India Ltd, Ballabhgarh, India) 3( Associate Professor, Department of Mech. Engg., Indian Institute of Technology, Dhanbad, India) ABSTRACT All the automobile industries are striving too hard to achieve their objectives because of changing global scenario in terms of high quality expectation, reduced cost of production and increased productivity. Therefore value adding process is necessary to achieve this perfection; hence implementing lean manufacturing system is becoming a core competency for any type of organizations to sustain. The study has been undertaken at existing Fabrication business unit (FBU) of Backhoe loader manufactured by an automobile industry to enhance the productivity of FBU by identifying the bottleneck stations and non value added activities to implement lean. Subsequently the improvement actions have been established and implemented using different lean tools like line balancing and layout planning. Hence fixed station based system has been replaced by lean slat conveyor based system which resulted in reduced cycle time, Fork Lift free operation, Dedicated Manpower reduction, Improved Productivity, Tack Time based defined work process, Ergonomics and Automatic Transfer System. Keywords: slat conveyor system, Lean manufacturing, line balancing, layout planning, productivity improvement I. INTRODUCTION Lean principles defines the value of the product/service as perceived by the customer and then making the flow in-line with the customer pull and striving for perfection through continuous improvement to eliminate waste by sorting out Value Added activity(VA) and Non- Value Added activity(NVA). The sources for the NVA activity wastes are Transportation, Inventory, Motion Waiting, Overproduction, over processing and Defects. The NVA activity waste is vital hurdle for VA activity. Elimination of these wastes is achieved through the successful implementation of lean elements [1]. 5S, OEE (over all equipment effectiveness), 8 step practical problem solving (PPS),Pareto analysis, elimination of waste, kaizen, setup time reduction, process mapping, value stream mapping(VSM), quick and easy kaizen, SPC/control charting, 5 why, automation, continuous improvement, continuous flow, visual control, design for six sigma(DFSS), cellular manufacturing, production levelling,
Transcript of “ENHANCEMENT OF FABRICATION UNIT OF AN · 5S, OEE (over all equipment effectiveness), ... MIG...
125 | P a g e
“ENHANCEMENT OF FABRICATION UNIT OF AN
AUTOMOBILE INDUSTRY BY IMPLEMENTING
LEAN MANUFACTURING PRINCIPLES”
Gaurav Kumar1, Mr. Snehasish Patnaik
2, Dr. Amit Rai Dixit
3
1(M.Tech, Department of Mech. Engg., Indian Institute of Technology, Dhanbad, India)
2(Deputy Manager, MEP Department, JCB India Ltd, Ballabhgarh, India)
3(Associate Professor, Department of Mech. Engg., Indian Institute of Technology, Dhanbad, India)
ABSTRACT
All the automobile industries are striving too hard to achieve their objectives because of changing global
scenario in terms of high quality expectation, reduced cost of production and increased productivity. Therefore
value adding process is necessary to achieve this perfection; hence implementing lean manufacturing system is
becoming a core competency for any type of organizations to sustain. The study has been undertaken at existing
Fabrication business unit (FBU) of Backhoe loader manufactured by an automobile industry to enhance the
productivity of FBU by identifying the bottleneck stations and non value added activities to implement lean.
Subsequently the improvement actions have been established and implemented using different lean tools like
line balancing and layout planning. Hence fixed station based system has been replaced by lean slat conveyor
based system which resulted in reduced cycle time, Fork Lift free operation, Dedicated Manpower reduction,
Improved Productivity, Tack Time based defined work process, Ergonomics and Automatic Transfer System.
Keywords: slat conveyor system, Lean manufacturing, line balancing, layout planning, productivity
improvement
I. INTRODUCTION
Lean principles defines the value of the product/service as perceived by the customer and then making the flow
in-line with the customer pull and striving for perfection through continuous improvement to eliminate waste by
sorting out Value Added activity(VA) and Non- Value Added activity(NVA). The sources for the NVA activity
wastes are Transportation, Inventory, Motion Waiting, Overproduction, over processing and Defects. The NVA
activity waste is vital hurdle for VA activity. Elimination of these wastes is achieved through the successful
implementation of lean elements [1]. 5S, OEE (over all equipment effectiveness), 8 step practical problem
solving (PPS),Pareto analysis, elimination of waste, kaizen, setup time reduction, process mapping, value stream
mapping(VSM), quick and easy kaizen, SPC/control charting, 5 why, automation, continuous improvement,
continuous flow, visual control, design for six sigma(DFSS), cellular manufacturing, production levelling,

126 | P a g e
kanban, line balancing, voice of the customer, ANOVAs, Work standardization, work simplification, fish born
diagram, takt time, poka-yoke/ mistake proofing, these are all lean tools to get a maximum benefits.
II. LITERATURE REVIEW
Christian Becker et al.., [2] indicated that assembly line balancing research which traditionally was focused
upon simple problems has evolved towards formulating and solving generalized problems with different
additional characteristics such as cost functions & equipment selection.
Rong et al.., [3] proposed the formation of one-piece flow production system based on FACO method. They
targeted on the just-in-time aspect of the production system and provided a multi-objective evaluation model
whose aim is to minimize cycle time, changeover count, cell load variation, number of cells and maximize the
extent to which items are completed in a cell.
Santosh kumar et al.., [4] applied the lean tool by time measurement and line balance efficiency method. They
reduced the cycle time in a truck body assembly line and improved efficiency in that product line. Also said that
lean manufacturing is a business philosophy that continuously improves the process involve in manufacturing.
Bianca et al.., [5] pointed out the ergonomical issues that occur after the lean acceptance. They also stated that
more and more companies are interested in the well-being and satisfaction of human resources. Their paper
presents a qualitative briefing and review in order to understand the evolution of lean implication.
Pandit et al.., [6] found that with the help of line balancing it was possible to improve productivity and achieve
better utilization of resources. The less attention on accuracy of standard time and poor work arrangement were
identified as the root cause for low efficiency and increase in layout utilization by changing the position of
equipment or by introducing the new machine into the layout.
Singh B et al.., [7] replaced the traditional cells with irregular material flows by U-shaped production lines. In
the U shaped lines also, problem starts when higher changeover and setup times, unbalanced manufacturing
cells, lower effectiveness of the equipments exists. Also found that adoption of continual improvements
environment can reduce the problem where setup, changeover times are reduced to negligible, flow is regular
and paced by a cycle time and is controlled by pull signals lines are operated as mixed-model lines and each
station is able to produce any product.
Aulakh et al.., [8] discussed importance of five elements of lean i.e. manufacturing flow, organisation, process
control, metrics and logistics to appreciate the synergetic effect of each element on others, towards making an
organization lean.
D. L. Sinde et al.., [9] stated that Lean manufacturing also looks ahead on the elimination of wastes from
assembly lines and inventory and the concept of mass production essentially involves the Line Balancing in
assembly of identical or interchangeable parts or components into the final product in various stages at different
workstations.
Based on the above literature survey, case study was carried out at JCB Faridabad Fabrication unit (FBU) of
Backhoe loader to enhance the productivity of FBU by implementing different lean manufacturing principles.

127 | P a g e
III. COMPANY AND FABRICATION SHOP BACKGROUND
JCB India Limited, a fully owned subsidiary of J.C. Bamford Excavators Limited of United Kingdom is ranked
in the top 5 manufacturers of earthmoving and construction equipment in the world. JCB is the world number
one producer for backhoe loaders.
First of all, the machined sheets & pre-build parts are brought in the logistics area. Metal sheets from which
main frames, rear frames, Boom/Dippers are to be welded are moved to fabrication shop. Engines are moved to
skid sub-assembly line and the gears & rear–axle parts are moved to transmission line. The existing fabrication
shop shown in fig.1 which is having Rear frame cell, Loader Tower Robotic Cell, Loader Tower Boring
Cell(mounting holes of loader tower is machined & fabricated with the help of CNC), Press Shop(Bevelling
machines which cuts & chamfers, Radial Drilling Machines, Hydraulic Press to make their surface levelled),
Boom/Dipper Robotic Welding, Main Frame Welding in which MIG welding of different parts of 3DX & other
variants of Backhoe loader or the product which is to be fabricated is done and then after their machining,
finishing and surface smoothening etc. mainframes are moved to paint shop.
Fig.1: Existing Layout of Fabrication shop
IV. CASE STUDY OF MAINFRAME FABRICATION UNIT
4.1. Process Flow
In Main Frame fabrication Process, first of all different parts of the main frame are assembled or arranged by
tacking them in main frame tacking fixture cell. Then, it is pre-welded in pre-welding zone where simple
welding spots are done on the main frame. Then, the main frame is moved to two Robotic cell stations. Then
moved to Manual welding shop where those parts are welded which can’t be welded in Robotic cell. At the last
mainframe moved to SIP (Standard Inspection Procedure station). On SIP station standard inspection(by
gauges), MIG welding of remaining child parts, buffing, chipping, grinding and dimension checking have been
done according to standard specifications list. After that quality have been checked then transferred to stress

128 | P a g e
receiving furnace & paint shop then assembly line. Process flow of mainframe fabrication & snapshot of
mainframe is shown below in fig. 2 and fig.3 respectively.
Process Flow (Main Frame) Component Detail (Main Frame)
A. Length of Mainframe : 3.7 Mtr
B. Width of Mainframe : 2.3 Mtr
C. Weight of Mainframe : 1500 kg
Fig.2: Process Flow Fig.3: Snapshot of Mainframe
4.2 Preliminary analysis
The system diagnosis began with the direct observation of the operators and workflow. To identify which
process is crowded Pareto analysis has been done. First Pareto analysis of manpower distribution in mainframe
fabrication process has been done and shown below in fig. 4. To revarify, Pareto analysis of quantity output per
shift stage has been done and shown in fig.5. Pareto analysis and machine/manpower study shown in Table 1 are
indicating that SIP stage of Mainframe fabrication is the most significant, bottleneck process, having non-value
added activities and should be paretize to implement lean as there is a chance of reduction in cycle time,
manpower reduction and increment in output at SIP stations.
Main Frame
Material In
Tacking (Hydraulic Fixture)
Pre – Weld on Manipulator
Robotic Welding
Post Welding in Robotic cell
SIP Station
Material Out
Main Frame

129 | P a g e
Fig.4: Pareto analysis-Manpower distribution Fig.5: Pareto analysis-Output distribution
Table 1: Machine/Manpower Study of Mainframe fabrication Processes
Stages Equipments / Process Involved Manpower Involved
Status
Tacking
Hydraulic fixtures
Welding machines
Due to size of component 3 persons
are required as per sop Standard
Pre-Welding Welding machines As per weld length calculation 2
persons are required as per sop Standard
Robotic
Welding Robotic welding machine 4 persons are required as per sop Standard
SIP
Gauge checking
Welding
Welding defect
identifications
Buffing operations
Finishing operations
8 persons involved per station
Non-
structured
4.3 Case Study of Existing Mainframe SIP Stations
Existing Mainframe SIP stations have been chosen for the detailed study of status on lean manufacturing
implementation. Currently there are two static stations for mainframe SIP stage in which there are three sub-
stations in every SIP station. Out of three sub-stations two sub-stations are having scissor lift where buffing,
chipping, gauzing process are executed including sub-station 1 process and sub-station 1 is only for welding,
masking, sealing, loading of material as there is no scissor lift here . 3DX, 3CX, 4DX & 2DX Models of
backhoe loader are used to go for SIP stages. Existing layout of SIP Station is indicated below in fig 6.

130 | P a g e
Fig.6: Existing Layout of SIP fixed station
After the direct observation, the SIP station was evaluated using the methods-study and time study
techniques. This analysis has as main objective of the establishment and the normalization of procedures to
allow a maximum effectiveness and quality at SIP. It will be accomplished through the improvement of some
processes and procedures and through the suitability of the workstations resources (operators, equipment and
tools) to the nature of the operations. From the below table, it is concluded that the average process time taking
of a single mainframe at SIP station is approx 28 min and No of mainframe coming out of SIP stations in 2 shift
(9.5 hr each ) is approx 60 considering 90% efficiency and total manpower at SIP station is 16 ( 8 per SIP
station ) .
Table 2: cycle time at SIP station Table 3: Process Time Taking at Single SIP Station
V. IMPLEMENTATION OF LEAN MANUFACTURING AT SIP STATION
From the detailed case study of SIP stations, according to Principle of SQCDM (S- Safety, Q- Quality, C- Cost,
D- Delivery, M- Morale), it is concluded that there are non standard system and mixture of many small types of
Cycle time at SIP station
Mainframe Tag
No.
Cycle Time
(in min)
8AB17J558 22
8AB17J199 20
8AB17J198 22
8AB17J534 40
8AB17J532 28
8AB17J580 35
8AB17J188 28
8AB17J599 34
8AB17J583 29
Average=28 min
Process Time Taking at SIP Station
Process
No. of
operators
Time (In Min)
MF 1 MF
2
MF
3
Loading sequence
& tacking 1 3.5 4 4.5
Welding 2 8 10 8.5
Buffing 2 9 8 9
Chipping 1
4 3 3.5
Sealant 0.5 1 0.5
Inspection
(supervisor)
1+1=2
[ Quality
engineer -1 ]
3 2 2
Total 8 28 28 28

131 | P a g e
equipment available, chances of manpower reductions, no defined cycle time, no defined process, excess Idle
time, Congested area, involvement of lots of non-value added activities, Very unsafe( multiple operators at
same stations), Use of forklift for transporting mainframe from one station to another which is dangerous,
Loading and unloading is directly onto the floor by the forklift so wear and tear of the material takes place.
Some of the critical points identified at SIP stations were related with the main pillars of a manufacturing
system, namely, “layout change” and “line balancing”. Consequently, it was necessary to quantify the real
impact of these critical points to be able to justify any modification, which at this level always imply a strong
impact on the manufacturing system.
5.1 Proposed Layout of New Conveyor Based SIP Station
A new slat conveyor based SIP station was designed, proposed and shown below in fig. 7, 8 and 9. Specified
work/operations and accordingly operators will be distributed to the 6 stations of the SIP. After SIP
manufacturing on 6 conveyor based stations, mainframe will move forward to last and single 7th
Quality SIP
station on slat Conveyor. Conveyor will stop at Quality SIP Station. Main Frame will move up and down on
existing designed Scissor Lift. Quality Person will inspect Main frame. Quality Persons will control the
command for Conveyor run. Conveyor will runs for one pitch. Same operation will be repeated for next frame.
When Frame will reach last station, manual unloading will be done through EOT (Electric overhead travelling
crane). Conveyor Command control panel will be at Quality SIP Station. Space between each Frame should
have enough space for one person moving around. Last Station will have sensor so that if Component is present
in the last Station Conveyor will not run.
Technical specifications of proposed new conveyor based SIP station
Proposed Type of Conveyor : Twin Slat Conveyor
Mounting : On floor
No. of Production Station : 06
No. of Quality Station : 01
Size of slat conveyor : 600X200X10mm.
Width of Conveyor : 2200 mm (space between two scissor lifts)
Usable Length of Conveyor : 29 mtr
Programming Control : PLC (Programmable logic controller)
Conveyor Control : VFD (variable frequency drive)
Position Control : Encoder & Sensors
Speed of Conveyor : 2 mtr/min – 6 mtr/ min
Slat Top Height from Ground : Min 350 mm
Mode of Run : Stop & Go
Type of Flow : Uni – Directional Lean Process Flow

132 | P a g e
Fig. 7: Slat conveyor CAD drawing -1
Fig. 8: Slat conveyor CAD drawing -2
Fig. 9: Slat Conveyor – Conceptual drawing
There are two technical options in proposed conveyor based systems. After comparison of removal and fixed
peg conveyor system, 2nd
option i.e. Fixed peg slat conveyor based system of SIP station is proposed due to
lesser cost as there will be no additional process and conveyor required.

133 | P a g e
Fig. 10: Comparison between Removal and Fixed Peg
5.2 Line Balancing and Allocation of Work on SIP Stations
Line balancing is the process of assigning tasks to different workstations, so that all the workstations have
approximately equal time requirements. The complexity is to assign the elements to an ordered sequence of
stations. The line balancing method is used to reduce cycle time to increase the productivity and to minimize
idle time of operators by working parallelly on stations.
Quadrant method is used to find out the work content of each quadrant of single mainframe. First mainframe
is divided into four quadrants then the time required by each process in every quadrant was found out and shown
below in table 4 and fig. 12 considering Table 2, total average process time taking of single mainframe is 28
min.
Fig. 11: Division of Mainframe into 4 quadrants
41
1
31
1
21
1
11
1
134 | P a g e
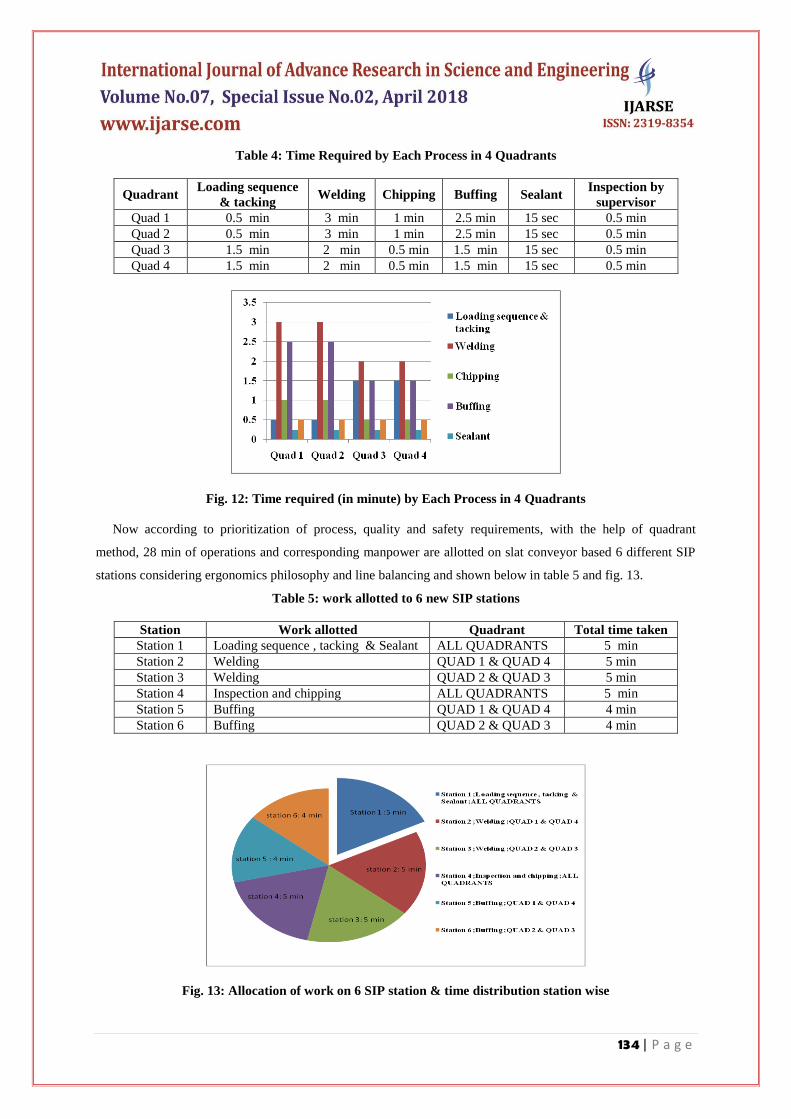
Table 4: Time Required by Each Process in 4 Quadrants
Quadrant Loading sequence
& tacking Welding Chipping Buffing Sealant
Inspection by
supervisor
Quad 1 0.5 min 3 min 1 min 2.5 min 15 sec 0.5 min
Quad 2 0.5 min 3 min 1 min 2.5 min 15 sec 0.5 min
Quad 3 1.5 min 2 min 0.5 min 1.5 min 15 sec 0.5 min
Quad 4 1.5 min 2 min 0.5 min 1.5 min 15 sec 0.5 min
Fig. 12: Time required (in minute) by Each Process in 4 Quadrants
Now according to prioritization of process, quality and safety requirements, with the help of quadrant
method, 28 min of operations and corresponding manpower are allotted on slat conveyor based 6 different SIP
stations considering ergonomics philosophy and line balancing and shown below in table 5 and fig. 13.
Table 5: work allotted to 6 new SIP stations
Station Work allotted Quadrant Total time taken
Station 1 Loading sequence , tacking & Sealant ALL QUADRANTS 5 min
Station 2 Welding QUAD 1 & QUAD 4 5 min
Station 3 Welding QUAD 2 & QUAD 3 5 min
Station 4 Inspection and chipping ALL QUADRANTS 5 min
Station 5 Buffing QUAD 1 & QUAD 4 4 min
Station 6 Buffing QUAD 2 & QUAD 3 4 min
Fig. 13: Allocation of work on 6 SIP station & time distribution station wise

135 | P a g e
From the above line balancing and allocation of work to 6 different SIP stations, it is concluded that average
cycle time of conveyor is 5 min as single station required maximum 5 min to complete their allotted work. Now
considering minimum 15% process loss, average takt time of conveyor suggested is 6min for conveyor.
5.3 Calculation
5.3.1 Productivity
Takt time of new conveyor based SIP stations: 6 min
Duration of a single shift: 9.5 hr
Effective working time per shift: 8.5 hr
No of mainframe will come out of conveyor in 1 hr: 10
No of mainframe will come out of conveyor in 1 shift: 10*8.5 hr =85
No of mainframe comes out of existing SIP stations in 1 shift: 60
So, increment of production due to improvement: 85-60 = 25
Percentage of improvement in production = * 100 % = 41.67 %
5.3.2 Manpower
Table 6: Manpower reduction at New SIP station
Operation Existing Manpower (both SIP station) Proposed Manpower at New SIP
Loading sequence & tacking
& sealant 2 1
Welding 4 4
Buffing 4 4
Chipping 2
1
Supervisor
(Inspection)
2
1
Quality engineer 2 1
Total 16 12
Manpower is proposed in above Table 6 according to work allotted to different 6 SIP stations and one quality
station. So there is a reduction in manpower = 16-12 = 4 person.
Percentage manpower reduction = * 100 % = 25 %
VI. CONCLUSION
Based on the studies after the implementation of lean, according to Principle of SQCDM (S- Safety, Q- Quality,
C- Cost, D- Delivery and M- Morale) following results have been concluded.
(i) Safety- Fork Lift free operation, Safe Transfer Zone – Sensor controlled, Elimination of Lifting & dropping
of chassis during transfer

136 | P a g e
(ii) Quality - Eliminate Metal to Metal Contact, No dent marks issue
(iii) Cost- No dedicated MHE (Material handling equipment) required, Dedicated Manpower reduction by 25%.
(iv) Delivery- Improved Productivity of SIP – Station based by 41.67%
(v) Morale- Defined work process – Tack Time based i.e. 6 min, Safe & Less Movement for Operator –
Ergonomics, Automatic Transfer System; no idle time of worker as works done parallelly.
And the future scopes of this study are installation and commissioning.
REFERENCES
[1]. R.Sundar, A.N.Balaji, and R.M.Satheesh Kumar, “A Review on Lean Manufacturing Implementation
Techniques”, 12th Global Congress on Manufacturing and Management, GCMM 2014.
[2]. Christian Becker and Armin Scholl, “A survey on problems and methods in generalized assembly line
balancing”, European Journal of Operational Research 168, 2006, pp. 694– 715.
[3]. Li and Rong, “The reliable design of one-piece flow production system using fuzzy and colony
optimization”, Computers & Operations Research, vol. 36, 2009, pp.1656 – 1663.
[4]. S. santosh kumar and M. pradeep kumar, Procedia Materials Science, vol. 5, 2014, pp. 1853 – 1862.
[5]. Bianca Cirjaliu and Anca Draghici, “Ergonomic Issues in Lean Manufacturing”, 13th International
Symposium in Management, 2016, pp. 105-110.
[6]. Shamuvel V Pandit, Sunil J Kadam, AvinashKharat and Chetan U Nayakawade, “Productivity improvement
by application of line balancing”, International Journal of Innovative Research in Science, Engineering and
Technology, vol. 3(4), 2014, pp. 11495-11502.
[7]. Singh B, Garg S.K. and Sharma S.K.,"Lean can be a survival strategy during recessionary times",
International Journal of Productivity and Performance Management, vol. 58(8), 2009, pp. 803 – 808
[8]. Sachpreet Singh Aulakh and Janpreet Singh Gill, “Lean Manufacturing- a Practitioner’s Pespective’,
Department of Mechanical Engineering, RIMT-Institute of Engineering & Technology, Mandi, India.
[9]. Prof. D. L. Shinde, Mr. Gaikwad Ajinkya. A, Mr. Kadam Shubham. B, Mr. Kadam Shubham. R and
Mr.Maind Prasad. M, “Optimize Efficiency of Assembly Line by Time Study and Line Balancing”,
International Engineering Research Journal (IERJ), vol. 2(9), 2017, pp. 3260-3267.
[10]. S. Nallusamy, “A proposed model for lead time reduction during maintenance of public passenger
transport vehicles”, International Journal of Engg. Research in Africa, vol. 23, 2016, pp. 174-180.
[11]. Praveen Saraswat, Deepak Kumar, and Manoj Kumar Sain, International Journal of Managing Value and
Supply Chains (IJMVSC), Vol. 6(2), 2015, DOI: 10.5121.
[12]. Jafri Mohd Rohania and Seyed Mojib Zahraee, 2nd International Materials, Industrial, and Manufacturing
Engineering Conference, MIME 2015, Bali Indonesia.
[13]. Tomas Rohac and Martin Jenuska, Procedia Engineering 100, 25th international symposium on intelligent
manufacturing and automation, DAAAM 2014, pp. 520 – 529.
137 | P a g e
[14]. Shamuvel V Pandit, Sunil J Kadam, AvinashKharat and Chetan U Nayakawade, “Productivity
improvement by application of line balancing”, International Journal of Innovative Research in Science,
Engineering and Technology, vol. 3(4), 2014, pp. 11495-11502.
[15] Rahul and Kaler, “Eradication of Productivity Related Problems through Lean Principles in Integrated
Manufacturing Environment”, International Journal of Lean Thinking, Vol. 4, June 2013.
[16] Pattanaik and Sharma, “Implementing lean manufacturing with cellular layout: a case study”, International
Journal for Advanced Manufacturing Technology 4, 2009, pp. 772–779.
[17] Shah R. and Ward P.T., “Defining and developing measures of lean production”, Journal of Operations
Management 25, 2007, pp 785–805.
[18] Herron, C. and Braiden, P. M., "Defining the foundation of lean manufacturing in the context of its origins
(Japan)," IET International Conference on Agile Manufacturing, 2007, pp. 148-157.
[19] Narain R, Yadav R.C. and Antony J,"Productivity gains from flexible manufacturing: Experiences from
India", International Journal of Productivity and Performance Management, Vol. 53 (2 ),2004, pp. 109 – 128.
[20] Rachna Shah and Ward, “Lean manufacturing: context, practice bundles, and performance”, Journal of
Operations Management 21, 2003, pp. 129–149.


![Chipping Potato Handbook[1]](https://static.fdocuments.net/doc/165x107/5571f7e849795991698c3fa1/chipping-potato-handbook1.jpg)