Enhanced Surface Metrology1
25
Enhanced Surface Metrology Russell M. Kurtz RAN Science & Technology, LLC Ryder Nesbitt Hexagon Metrology, Inc.
-
Upload
in-sync-social-media -
Category
Documents
-
view
300 -
download
0
Transcript of Enhanced Surface Metrology1

Enhanced
Surface
Metrology
Russell M. Kurtz
RAN Science &
Technology, LLC
Ryder Nesbitt
Hexagon Metrology, Inc.

Enhanced Surface Metrology
There is a constant search for more accurate measurement
Traditionally 3 Parameters
COST
MEASURMENT SPEED
ACCURACY
Traditional Tradeoffs
Cheap, Fast, Inaccurate
Expensive, Slow, Accurate

Enhanced Surface Metrology
We Present a
Method of
Adding
One More
Tradeoff
Parameter
MEASUREMENT
PRECISION
Measurement Precision
(perpendicular to the surface)
vs.
Sample Correlation
(along the surface)

Enhanced Surface Metrology
Through
application of
statistical
sampling and
curve fitting...
... we can improve
precision by
approximately the
same amount that we
increase correlation

Enhanced Surface Metrology
Theory & Methods
POINT CLOUDS
The number of
points in a 3-D
space, each
corresponding to a
point on the
surface of the item
Enhanced Surface Metrology
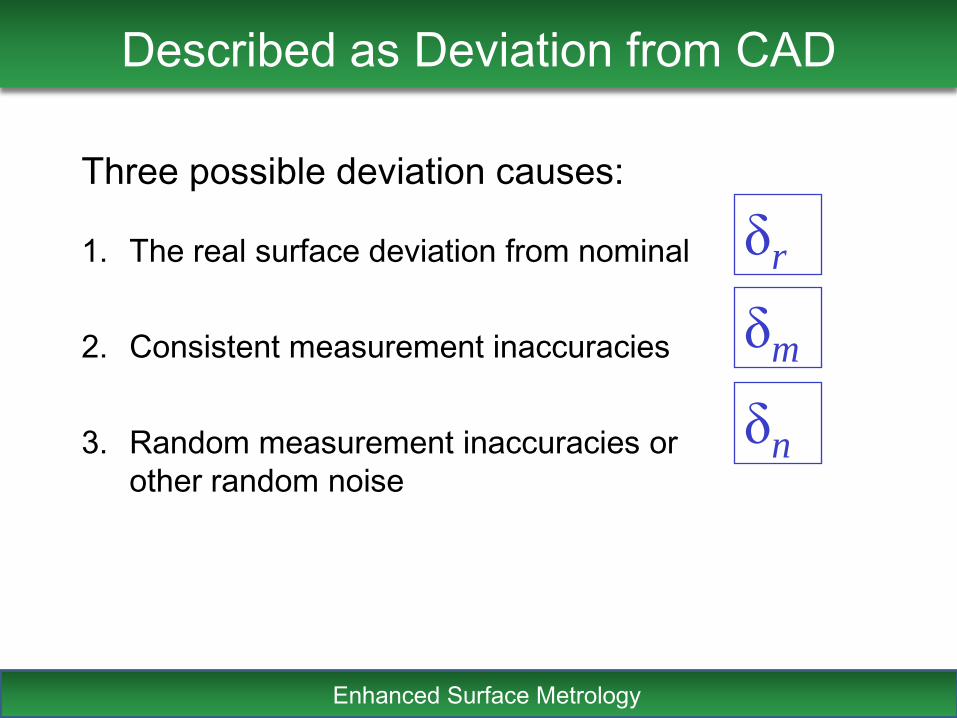
Described as Deviation from CAD
Three possible deviation causes:
1. The real surface deviation from nominal
2. Consistent measurement inaccuracies
3. Random measurement inaccuracies or
other random noise
δr
δm
δn

Enhanced Surface Metrology
Slide 1

Enhanced Surface Metrology
Slide 2

Enhanced Surface Metrology
Slide 3

Enhanced Surface Metrology
Slide 4

Enhanced Surface Metrology
Our Focus: Noise (δn) Reduction
defectvisible with
low noisehidden by
moderate noise
10 x 10 mm portion of a surface, nominally spherical, defect height = ~1.5 µm
Enhanced Surface Metrology
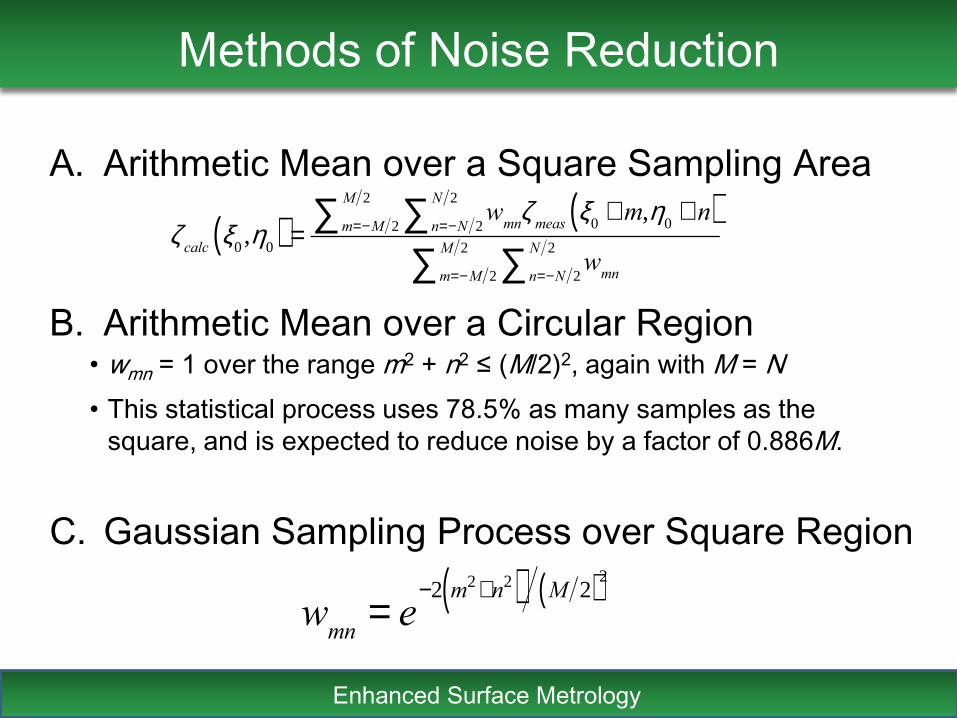
Methods of Noise Reduction
A. Arithmetic Mean over a Square Sampling Area
zcalc
x0,h
0( ) =w
mnn=-N 2
N 2
å zmeas
x0+ m,h
0+ n( )
m=-M 2
M 2
å
wmnn=-N 2
N 2
åm=-M 2
M 2
å
B. Arithmetic Mean over a Circular Region• wmn = 1 over the range m2 + n2 ≤ (M/2)2, again with M = N
• This statistical process uses 78.5% as many samples as the
square, and is expected to reduce noise by a factor of 0.886M.
C. Gaussian Sampling Process over Square Region
w
mn= e
-2 m2+n2( ) M 2( )2

Enhanced Surface Metrology
Sample Correlation, 5 pixel wide
Square
Circular
Gaussian

Enhanced Surface Metrology
Targeting Task Performance Model
Probability of Identifying a 3-µm Feature with No
Noise Reduction

Enhanced Surface Metrology
Experiments
Flat Sample: WLS400
block made of ceramic with a polished white surface finish

Enhanced Surface Metrology
Experiments
Flat Sample: WLS400
Measurement Noise and Actual Surface Deviation
Before Statistical Noise
ReductionAfter Statistical Noise
Reduction

Enhanced Surface Metrology
Experiments
Sphere Sample: WLS400
Test on a known sphere, whose diameter was specified
to be 1.5000±0.0001 in. but whose surface was
specified smooth only to ±0.001 in. We scanned a
section of the upper half of the sphere, a circular area
whose diameter was 27.20 mm.

Enhanced Surface Metrology
Experiments
Sphere Sample: WLS400
Measurement Noise and Actual Surface Deviation
Before Statistical Noise
ReductionAfter Statistical Noise
Reduction

Enhanced Surface Metrology
Experiments
Sphere Sample: WLS400
Surface of the sphere with locations measured from its center.
Surface color shows deviation from nominal (after noise reduction)

Enhanced Surface Metrology
Experiments
Interferometric Measurement
Test on a flat, metallic surface
(aluminum), mechanically polished to RA ≈ 60.
We used a Mach-Zender interferometer to obtain an
interferogram covering a square 1 cm on a side.
The illumination wavelength was 532 nm.

Enhanced Surface Metrology
Experiments
Interferometric Measurement
Original Interferogram
A B
C D
Original fit to a sinusoid
with intensity varying
from 0 to 1
The
difference
is the
noise
pattern
After
noise
reduction
Enhanced Surface Metrology
Summary & Conclusions
We have developed a statistical method for noise
reduction of three-dimensional metrology systems.
The method involves combination of measurement
values over a range of points, and permits weighting
the points (enabling the user to, for example, assign
confidence values to the various measurements).
Enhanced Surface Metrology
Summary & Conclusions
On the flat surface, we reduced the deviation from
nominal by more than a factor of two.
The sphere was specified to an accuracy of ±25.4
µm, and we measured that its accuracy was ±15.8 µm.
With the interferometric measurement we determined
that the surface deviated 16.0% from perfect flatness.
Enhanced Surface Metrology
Summary & Conclusions
These improvements indicate that the statistical surface
metrology enhancement method can be useful in
detecting small features.

Enhanced
Surface
Metrology
Russell M. Kurtz
RAN Science & Technology,
LLC
Ryder Nesbitt
Hexagon Metrology, Inc.