Enhanced Photoresponse in Curled Graphene Ribbons · 1 Enhanced Photoresponse in Curled Graphene...
8
1 Enhanced Photoresponse in Curled Graphene Ribbons Zeynab Jarrahi 1# , Yunhao Cao 2# , Tu Hong 2# , Yevgeniy S. Puzyrev 1 , Bin Wang 1 , Junhao Lin 1 , Alex H. Huffstutter 2 , Sokrates T. Pantelides 1,2,3 , and Ya-Qiong Xu 1,2* Table of Contents: 1. Device fabrication 2. Molecular dynamics (MD) simulations of Curled graphene ribbons (CGRs) 3. Supplemental figures 4. Supplemental references Electronic Supplementary Material (ESI) for Nanoscale This journal is © The Royal Society of Chemistry 2013
Transcript of Enhanced Photoresponse in Curled Graphene Ribbons · 1 Enhanced Photoresponse in Curled Graphene...
1
Enhanced Photoresponse in Curled Graphene Ribbons
Zeynab Jarrahi 1#, Yunhao Cao2#, Tu Hong2#, Yevgeniy S. Puzyrev1, Bin Wang1, Junhao Lin1, Alex H. Huffstutter2, Sokrates T. Pantelides1,2,3, and Ya-Qiong Xu1,2*
Table of Contents:
1. Device fabrication
2. Molecular dynamics (MD) simulations of Curled graphene ribbons (CGRs)
3. Supplemental figures
4. Supplemental references
Electronic Supplementary Material (ESI) for NanoscaleThis journal is © The Royal Society of Chemistry 2013
2
1. Device fabrication and SEM imaging
We patterned 5-μm-wide trenches on 170-μm-thick transparent fused silica substrates using
photolithography via a GCA Autostepper. 5-μm-deep trenches were etched via an Oxford 80 RIE.
Source and drain electrodes were patterned in the same way and deposited with 5 nm of Ti and 40 nm of
Pt via an e-beam evaporator. Single layer graphene was grown on copper foils at 950 °C in the presence
of 35 sccm of methane and 8 sccm of hydrogen via chemical vapor deposition. Then a standard wet
transfer process was applied and a poly-methyl methacrylate (PMMA) layer was spin-coated on top of
the copper foil to hold the graphene film. The PMMA-graphene film was separated from the copper foil
through the wet etching in iron chloride solution, and then transferred onto the pre-patterned chip after
cleaning in multiple DI water baths.
Thermal annealing process has been applied to eliminate the PMMA layer and to make CGRs.
The sample was heated in the furnace for 30 min with the presence of 200 sccm argon under 420 °C at
one atmosphere, which led to a complete evaporation of the PMMA1, 2. During the evaporation, the
graphene that adhered to the substrate would be hold still due to the van der Waals interaction, while the
suspended part was more affected and formed the curled structures.
2. MD Simulations of CGRs
Classical MD simulations were performed using the LAMMPS package3. A bond-order potential
(LCBOP)4 was used to model the atomic interactions and included intrinsic long-range order interaction
between the layers. The simulations in Figure 1b were performed using microcanonical (NVE)
ensemble on a 1-µm-long and 0.1-µm-wide graphene ribbon containing 3,840,000 C atoms. During the
system equilibration before dynamic deformation the simulation box dimensions parallel to the
graphene surface were fixed to correspond to the equilibrium lattice constant of unstrained graphene at
T=300K. The structural evolution during temperature annealing was simulated to mimic desorption of
PMMA molecules. Groups of atoms were randomly selected in the graphene nanoribbon and given
Electronic Supplementary Material (ESI) for NanoscaleThis journal is © The Royal Society of Chemistry 2013
3
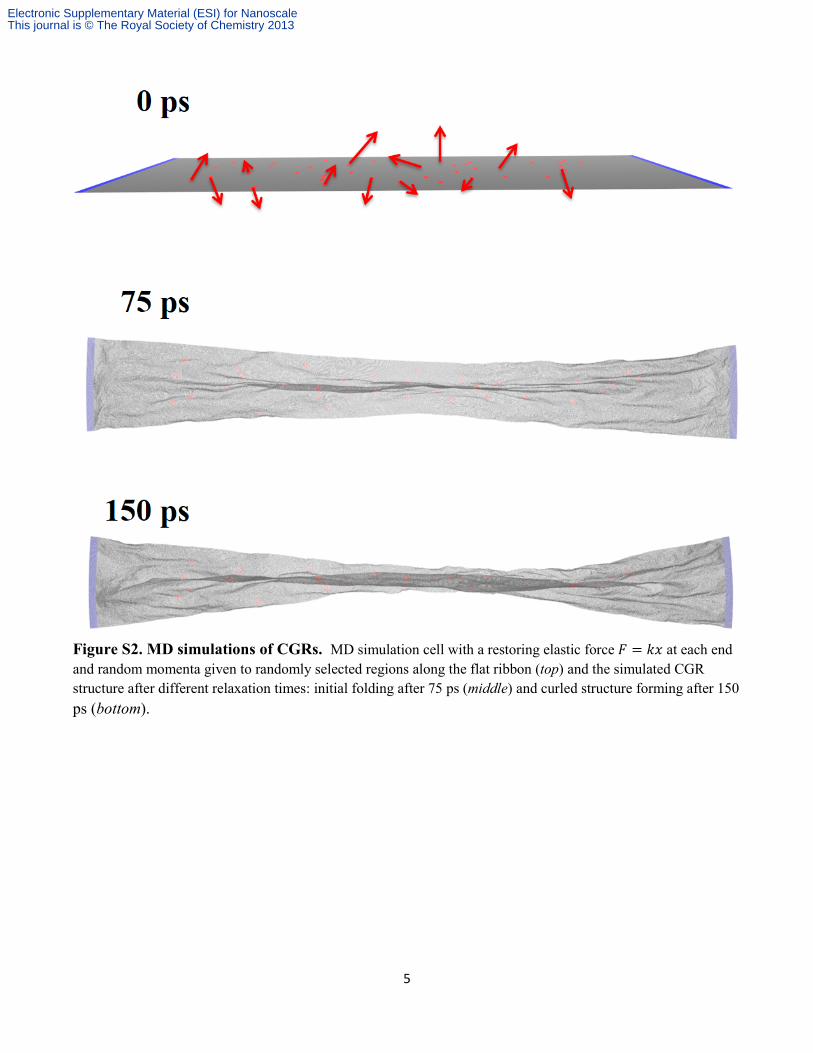
random momenta at the initial time (Fig. S2 top). To accelerate the structural deformation, the
momentum value was chosen to be equivalent to heating up to ~ 2500 K, while the total momentum
remained zero. Average temperature remained close to 400 oC, similar to the experimental value.
Boundary conditions for the larger dimension kept the ends flat with a restoring elastic force 𝐹 = 𝑘𝑥,
according to the experimental conditions. Other dimensions had no restrains. After 75 ps, graphene
nanoribbon formed wrinkles and developed a multilayer-like structure in the middle (Fig. S2 middle).
Within 150 ps after initial momenta were given, the ribbon curled and locally formed multi-layers,
resulting in a quasi-one-dimensional structure in the middle (Fig. S2 bottom). Several sets of atomic
groups and momenta, namely 4 different simulations, were picked to explore the nanoribbon structural
evolution. While the tendencies in structural deformations during all the simulations remained the same,
the time required for the formation of the curled region in the middle of the nanoribbon varied.
Electronic Supplementary Material (ESI) for NanoscaleThis journal is © The Royal Society of Chemistry 2013
4
3. Supplemental Figures
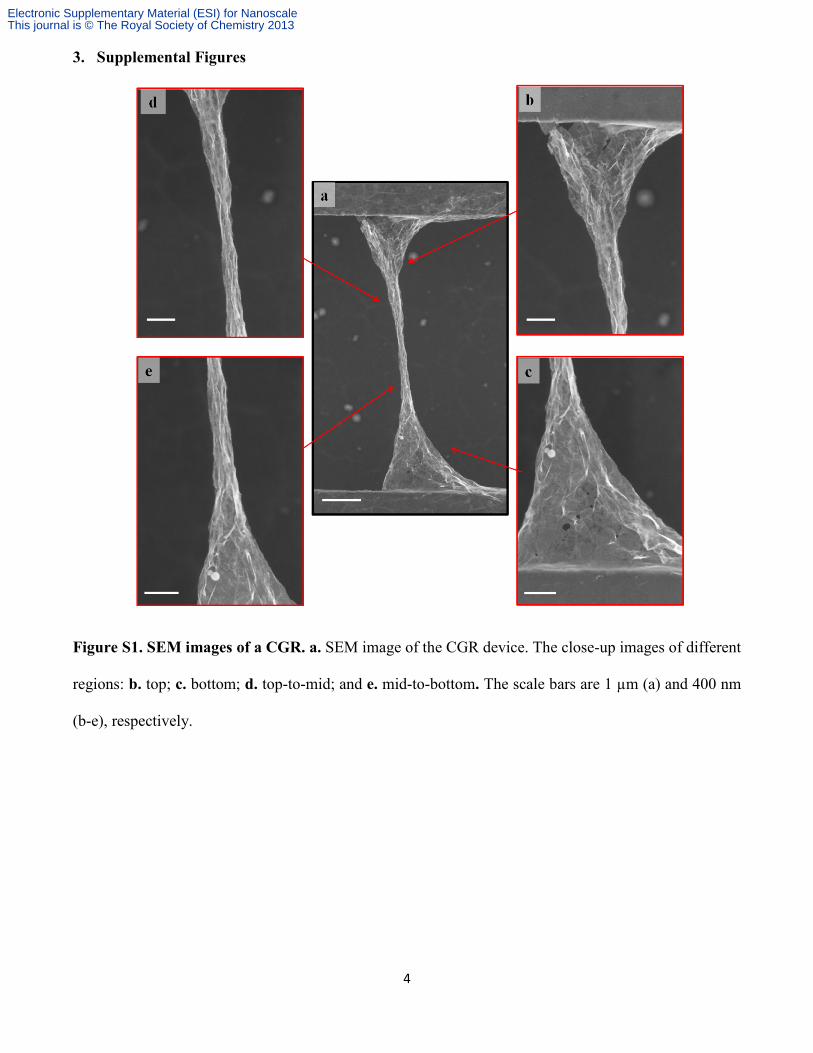
Figure S1. SEM images of a CGR. a. SEM image of the CGR device. The close-up images of different
regions: b. top; c. bottom; d. top-to-mid; and e. mid-to-bottom. The scale bars are 1 µm (a) and 400 nm
(b-e), respectively.
Electronic Supplementary Material (ESI) for NanoscaleThis journal is © The Royal Society of Chemistry 2013
5
Figure S2. MD simulations of CGRs. MD simulation cell with a restoring elastic force 𝐹 = 𝑘𝑥 at each end and random momenta given to randomly selected regions along the flat ribbon (top) and the simulated CGR structure after different relaxation times: initial folding after 75 ps (middle) and curled structure forming after 150 ps (bottom).
Electronic Supplementary Material (ESI) for NanoscaleThis journal is © The Royal Society of Chemistry 2013
6
2600 2650 2700 2750 2800
R1
Inte
nsity
Raman Shift (cm-1)
R6
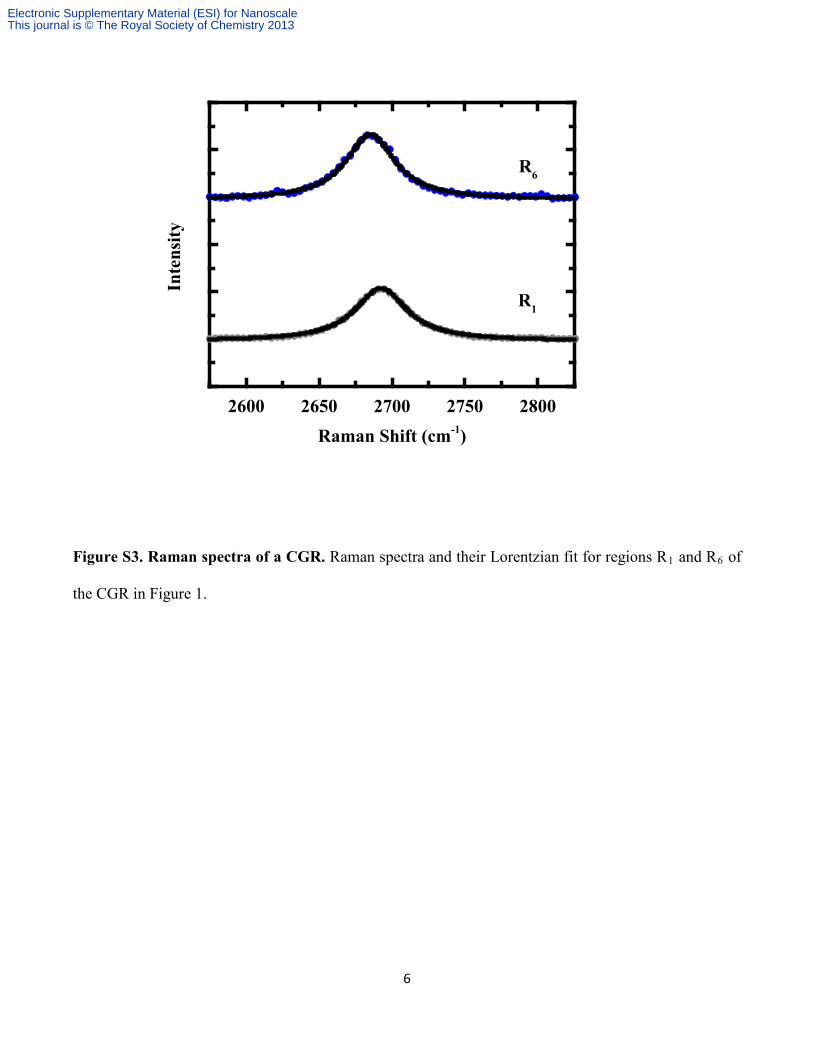
Figure S3. Raman spectra of a CGR. Raman spectra and their Lorentzian fit for regions R1 and R6 of
the CGR in Figure 1.
Electronic Supplementary Material (ESI) for NanoscaleThis journal is © The Royal Society of Chemistry 2013
7
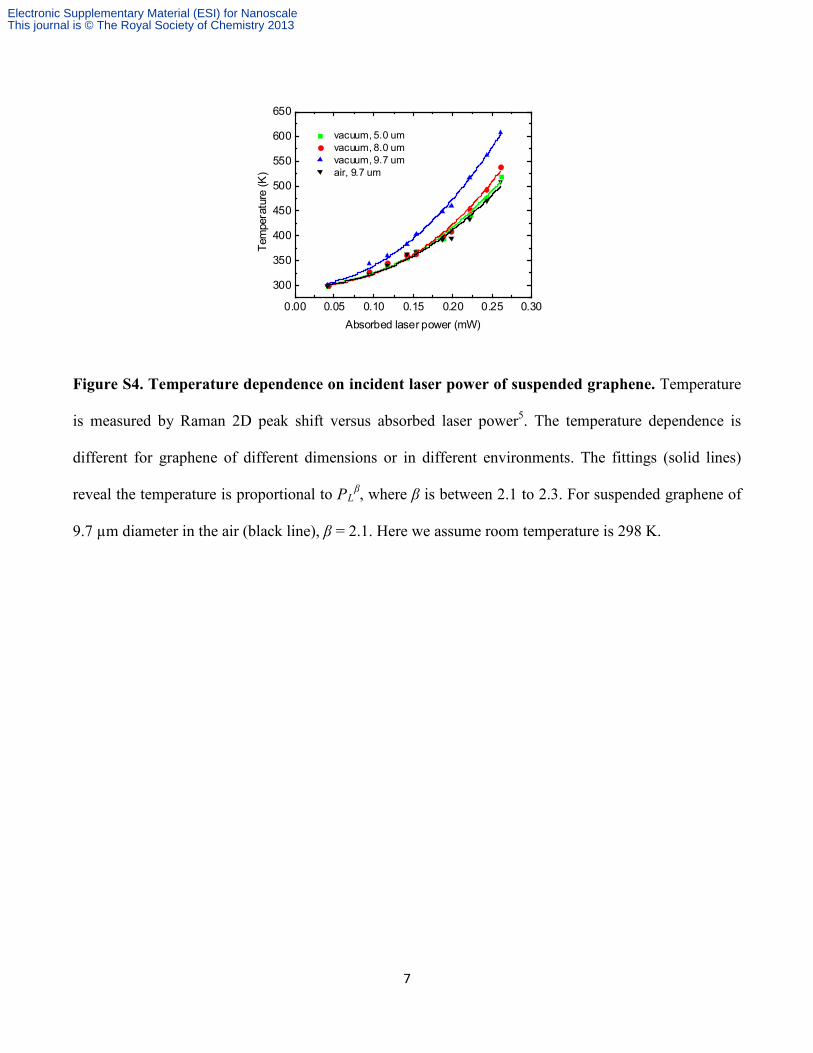
Figure S4. Temperature dependence on incident laser power of suspended graphene. Temperature
is measured by Raman 2D peak shift versus absorbed laser power5. The temperature dependence is
different for graphene of different dimensions or in different environments. The fittings (solid lines)
reveal the temperature is proportional to PLβ, where β is between 2.1 to 2.3. For suspended graphene of
9.7 µm diameter in the air (black line), β = 2.1. Here we assume room temperature is 298 K.
0.00 0.05 0.10 0.15 0.20 0.25 0.30
300
350
400
450
500
550
600
650
vacuum, 5.0 um vacuum, 8.0 um vacuum, 9.7 um air, 9.7 um
Tem
pera
ture
(K)
Absorbed laser power (mW)
Electronic Supplementary Material (ESI) for NanoscaleThis journal is © The Royal Society of Chemistry 2013
8
4. Supplemental References
1. J. D. Peterson, S. Vyazovkin and C. A. Wight, J Phys Chem B, 1999, 103, 8087-8092. 2. J. D. Peterson, S. Vyazovkin and C. A. Wight, Macromol Rapid Comm, 1999, 20, 480-483. 3. J. H. Los and A. Fasolino, Phys. Rev. B, 2003, 68, 024107. 4. S. Plimpton, J. Comp. Phys., 1995, 117, 1-19. 5. S. Chen, A. L. Moore, W. Cai, J. W. Suk, J. An, C. Mishra, C. Amos, C. W. Magnuson, J. Kang,
L. Shi and R. S. Ruoff, Acs Nano, 2010, 5, 321-328.
Electronic Supplementary Material (ESI) for NanoscaleThis journal is © The Royal Society of Chemistry 2013