Enhanced mechanical properties of hBN–ZrO2 composites and ...
20
Enhanced mechanical properties of hBN–ZrO 2 composites and their biological activities on Drosophila melanogaster: synthesis and characterization† Amarendra Gautam, a Chandkiram Gautam, * a Monalisa Mishra, b Vijay Kumar Mishra, c Ajaz Hussain, a Swetapadma Sahu, b Reetuparna Nanda, b Bikash Kisan, b Santoshkumar Biradar d and Rakesh Kumar Gautam e In this study, six compositions in the system [x(h-BN)–(100 x)ZrO 2 ] (10 # x # 90) were synthesized by a bottom up approach, i.e., the solid-state reaction technique. XRD results showed the formation of a novel and main phase of zirconium oxynitrate ZrO(NO 3 ) 2 and SEM exhibited mixed morphology of layered and stacked h-BN nanosheets with ZrO 2 grains. The composite sample 10 wt% h-BN + 90 wt% ZrO 2 (10B90Z) showed outstanding mechanical properties for different parameters, i.e., density (3.12 g cm 3 ), Young's modulus (10.10 GPa), toughness (2.56 MJ m 3 ), and maximum mechanical strength (227.33 MPa). The current study further checked the in vivo toxicity of composite 10B90Z and composite 90B10Z using Drosophila melanogaster. The composite 10B90Z showed less cytotoxicity in this model, while the composite 90B10Z showed higher toxicity in terms of organ development as well as internal damage of the gut mostly at the lower concentrations of 1, 10, and 25 mg mL 1 . Altogether, the current study proposes the composite 10B90Z as an ideal compound for applications in biomedical research. This composite 10B90Z displays remarkable mechanical and biological performances, due to which we recommend this composition for various biomedical applications. 1. Introduction Increasing interest in the development of advanced compos- ites for various biomedical applications has impelled a large amount of research to synthesize easily scalable, low-density, high-strength, wear-resistant and non-toxic biomaterials. The elemental dullness with low density pooled with high strength makes h-BN one of the capable materials for these applica- tions. Boron (B) and nitrogen (N) atoms are bonded with strong covalent bonding, whereas weak van der Waals forces bind the layers, which allow the layers to glide next to each other simply. This special sparkler arrangement and unique bonding between as well as distinctive performances such as proportional elemental and thermal dullness, mechanical properties, hardness and strength, good corrosion resistance and stability at high temperatures, brilliant electrical lagging properties and good manufacturability make h-BN promising for various applications. 1–12 Recently, three dimensional (3-D) interrelated nanostructures of h-BN and graphene architec- tures were synthesized using numerous novel methods. 13–18 Hence, it is predictable that the growing 3-D h-BN architec- tures will enhance their signicance in a wide range of appli- cations. 19,20 Owing to the heterostructures and similarity with carbon, h-BN represents elevated thermal resistance and high mechanical strength. 21–25 The surprising performance of h-BN provides a novel material for the production of numerous technological applications. h-BN-based bioceramics with good chemical stability and high oxidation resistance have been used in diverse research areas at a large scale such as metallic and chemical industries and thermal security systems. 26–32 ZrO 2 is still being employed as a biomaterial for various implants; however, owing to high brittleness, it undergoes terrible failure when a load is applied beyond a certain limit. 33,34 Hence, scientists are much attracted towards the development of such ZrO 2 -based novel composites, which reveals relatively high mechanical properties and low density with notable a Advanced Glass and Glass Ceramics Research Laboratory, Department of Physics, University of Lucknow, Lucknow-226007, India. E-mail: gautam_ceramic@yahoo. com; Tel: +918840389015 b Neural Developmental Biology Lab, Department of Life Science, National Institute of Technology, Rourkela, Odisha-769008, India c Department of Physics, Faculty of Science, Banaras Hindu University, Varanasi - 221005, UP, India d Department of Materials Science & Nano Engineering, Rice University, Houston, Texas, USA e Department of Mechanical Engineering, Indian Institute of Technology, Banaras Hindu University, Varanasi - 221005, UP, India † Electronic supplementary information (ESI) available. See DOI: 10.1039/c9ra07835e Cite this: RSC Adv. , 2019, 9, 40977 Received 26th September 2019 Accepted 25th November 2019 DOI: 10.1039/c9ra07835e rsc.li/rsc-advances This journal is © The Royal Society of Chemistry 2019 RSC Adv., 2019, 9, 40977–40996 | 40977 RSC Advances PAPER Open Access Article. Published on 11 December 2019. Downloaded on 12/30/2021 6:50:35 AM. This article is licensed under a Creative Commons Attribution-NonCommercial 3.0 Unported Licence. View Article Online View Journal | View Issue
Transcript of Enhanced mechanical properties of hBN–ZrO2 composites and ...

RSC Advances
PAPER
Ope
n A
cces
s A
rtic
le. P
ublis
hed
on 1
1 D
ecem
ber
2019
. Dow
nloa
ded
on 1
2/30
/202
1 6:
50:3
5 A
M.
Thi
s ar
ticle
is li
cens
ed u
nder
a C
reat
ive
Com
mon
s A
ttrib
utio
n-N
onC
omm
erci
al 3
.0 U
npor
ted
Lic
ence
.
View Article OnlineView Journal | View Issue
Enhanced mecha
aAdvanced Glass and Glass Ceramics Rese
University of Lucknow, Lucknow-226007,
com; Tel: +918840389015bNeural Developmental Biology Lab, Depart
Technology, Rourkela, Odisha-769008, IndiacDepartment of Physics, Faculty of Science
221005, UP, IndiadDepartment of Materials Science & Nano
Texas, USAeDepartment of Mechanical Engineering, I
Hindu University, Varanasi - 221005, UP, In
† Electronic supplementary informa10.1039/c9ra07835e
Cite this: RSC Adv., 2019, 9, 40977
Received 26th September 2019Accepted 25th November 2019
DOI: 10.1039/c9ra07835e
rsc.li/rsc-advances
This journal is © The Royal Society o
nical properties of hBN–ZrO2
composites and their biological activities onDrosophila melanogaster: synthesis andcharacterization†
Amarendra Gautam,a Chandkiram Gautam, *a Monalisa Mishra,b
Vijay Kumar Mishra,c Ajaz Hussain,a Swetapadma Sahu,b Reetuparna Nanda,b
Bikash Kisan,b Santoshkumar Biradard and Rakesh Kumar Gautame
In this study, six compositions in the system [x(h-BN)–(100 � x)ZrO2] (10 # x # 90) were synthesized by
a bottom up approach, i.e., the solid-state reaction technique. XRD results showed the formation of
a novel and main phase of zirconium oxynitrate ZrO(NO3)2 and SEM exhibited mixed morphology of
layered and stacked h-BN nanosheets with ZrO2 grains. The composite sample 10 wt% h-BN + 90 wt%
ZrO2 (10B90Z) showed outstanding mechanical properties for different parameters, i.e., density
(3.12 g cm�3), Young's modulus (10.10 GPa), toughness (2.56 MJ m�3), and maximum mechanical
strength (227.33 MPa). The current study further checked the in vivo toxicity of composite 10B90Z and
composite 90B10Z using Drosophila melanogaster. The composite 10B90Z showed less cytotoxicity in
this model, while the composite 90B10Z showed higher toxicity in terms of organ development as well
as internal damage of the gut mostly at the lower concentrations of 1, 10, and 25 mg mL�1. Altogether,
the current study proposes the composite 10B90Z as an ideal compound for applications in biomedical
research. This composite 10B90Z displays remarkable mechanical and biological performances, due to
which we recommend this composition for various biomedical applications.
1. Introduction
Increasing interest in the development of advanced compos-ites for various biomedical applications has impelled a largeamount of research to synthesize easily scalable, low-density,high-strength, wear-resistant and non-toxic biomaterials. Theelemental dullness with low density pooled with high strengthmakes h-BN one of the capable materials for these applica-tions. Boron (B) and nitrogen (N) atoms are bonded withstrong covalent bonding, whereas weak van der Waals forcesbind the layers, which allow the layers to glide next to eachother simply. This special sparkler arrangement and unique
arch Laboratory, Department of Physics,
India. E-mail: gautam_ceramic@yahoo.
ment of Life Science, National Institute of
, Banaras Hindu University, Varanasi -
Engineering, Rice University, Houston,
ndian Institute of Technology, Banaras
dia
tion (ESI) available. See DOI:
f Chemistry 2019
bonding between as well as distinctive performances such asproportional elemental and thermal dullness, mechanicalproperties, hardness and strength, good corrosion resistanceand stability at high temperatures, brilliant electrical laggingproperties and good manufacturability make h-BN promisingfor various applications.1–12 Recently, three dimensional (3-D)interrelated nanostructures of h-BN and graphene architec-tures were synthesized using numerous novel methods.13–18
Hence, it is predictable that the growing 3-D h-BN architec-tures will enhance their signicance in a wide range of appli-cations.19,20 Owing to the heterostructures and similarity withcarbon, h-BN represents elevated thermal resistance and highmechanical strength.21–25 The surprising performance of h-BNprovides a novel material for the production of numeroustechnological applications. h-BN-based bioceramics with goodchemical stability and high oxidation resistance have beenused in diverse research areas at a large scale such as metallicand chemical industries and thermal security systems.26–32
ZrO2 is still being employed as a biomaterial for variousimplants; however, owing to high brittleness, it undergoesterrible failure when a load is applied beyond a certain limit.33,34
Hence, scientists are much attracted towards the developmentof such ZrO2-based novel composites, which reveals relativelyhigh mechanical properties and low density with notable
RSC Adv., 2019, 9, 40977–40996 | 40977
RSC Advances Paper
Ope
n A
cces
s A
rtic
le. P
ublis
hed
on 1
1 D
ecem
ber
2019
. Dow
nloa
ded
on 1
2/30
/202
1 6:
50:3
5 A
M.
Thi
s ar
ticle
is li
cens
ed u
nder
a C
reat
ive
Com
mon
s A
ttrib
utio
n-N
onC
omm
erci
al 3
.0 U
npor
ted
Lic
ence
.View Article Online
biological performances for bone implant applications.However, plentiful investigations have been carried out in theresearch eld of biocomposites for numerous biomedicalapplications such as in jawbone, joint, hip, and dental implantsbut the stability and biocompatibility of these implants are notadequate due to their high density, highly fragile nature, highcoefficient of thermal expansion, and low resistance to corro-sion with respect to acid and humid environments.35–42
Hence, scientists having enormous interest for the fabrica-tion of new biocomposites such as zirconia doped alumina,ceria/yttria stabilized zirconia (Ce/Y-TZP), and 84ZrO2–8Al2O3–
8SrAl12O19, which show notable mechanical strength, stiffness,venerable biocompatibility, and substantial requirements forseveral dental/bone implant appliances.43–50 Recently, threedimensional nanostructured biocomposites of hBN–B2O3 werefabricated using plasma sintering technique for bone restora-tion applications and 3-D interconnected architecture of h-BNreinforced ZrO2 composites for structural evolution andenhanced mechanical properties of bone implant applica-tions.18,51 They found remarkable osteogenic properties withenough compressive strength. Besides the mechanical delity,they also report pretty good chemical stability and biocomp-ability. Initially, in 1969, ZrO2 was used for medical devices inbiomedicine as an innovative implant for head, knee, and jaw/teeth in dentistry owing to superior mechanical characteris-tics.52–54 Due to the high utility, its efficacy and malicious effectson humans is a matter of concern. Animal studies have revealedthe toxicity of zirconia nanoparticles in zebra sh andDrosophila.55,56 Drosophila melanogaster is used as a model totest the toxicity of various nanoparticles57,58 because of its shortnatural life, simple translucent larval structure, small size, easeof handling, and ease of visualization under a microscope. Theevolutionary conserved diseased genes can be used to check thetoxic effect in the current study.
In this study, we intend the preparation of composites of h-BN and ZrO2 through a simple solid-state reaction to obtainbetter malleability and improvement in the mechanical andtribological properties without varying the other properties,using a typical sintering method for biomedical applications.
2. Materials and methods2.1. Fabrication of hBN–ZrO2 samples
Herein, various novel composites were synthesized by inves-tigative AR grade chemicals, hexagonal boron nitride (h-BN)(Sigma Aldrich, purity 99%), and zirconia (ZrO2) ne parti-cles (Tosoh Corp. Japan, 27 nm). Total six compositions of h-BN and ZrO2 powders depending on the ratio of their amountsin wt% as (i) 10 wt% h-BN + 90 wt% ZrO2 termed as 10B90Z,(ii) 20 wt% h-BN + 80 wt% ZrO2 termed as 20B80Z, (iii) 40 wt%h-BN + 60 wt% ZrO2 termed as 40B60Z, (iv) 60 wt% h-BN +40 wt% ZrO2 termed as 60B40Z, (v) 80 wt% h-BN + 20 wt%ZrO2 termed as 80B20Z, and (vi) 90 wt% h-BN + 10 wt% ZrO2
termed as 90B10Z, were synthesized by mixing them carefullyinto acetone as the liquid media for 6 h using an agate mortarand pestle. The homogeneously mixed and dehydrated reac-tant powders of the above mentioned compounds were taken
40978 | RSC Adv., 2019, 9, 40977–40996
into six different alumina crucibles, which were nally keptinto a fully programmable furnace having silicon carbide(SiC) as the heating element used for calcinations at 650 �C @5 �C m�1 for 1 h to remove the volatile impurities from thematerial. In this way, the desired bright white material wasobtained. The various cylindrical pellets of the obtained driedpowders were prepared under an optimized load of 10 tonusing a vertical hydraulic press machine at room temperature.The cylindrical pellets were further heated for sintering at1000 �C @ 5 �C m�1 for 3 h into a Metrex made automaticelectric furnace. Thus, the obtained composite samples werethen examined for the several concerned characterizations,i.e., structural, morphological, mechanical, tribological, andbiological investigations.
3. Sample characterizations
In order to examine the crystallographic structures of thecomposites, viz., 10B90Z, 20B80Z, 40B60Z, 60B40Z, 80B20Z, and90B10Z, the XRD patterns were obtained within the range of 15–60� 2q values at the scanning rate of 3� min�1 by employingRigaku Miniex-II XRD consisting of Cu-Ka radiation havingthe wavelength, l¼ 0.15418 nm, monitored at 40 kV and 40 mA.The density values of the sintered composites were evaluated byusing a mass/volume formula.
The respective amounts of all the powder samples weremixed with potassium bromide in weight fraction of 1 to 99using mortar and pestle. Further, various uniformed andcylindrical pellets having diameter of 12 mm were shaped anddried at 120 �C for 60 min in an oven. Finally, IR spectroscopicmeasurements were performed to understand the bondingmechanisms and interaction between the constituent mole-cules of the fabricated composites within the wavenumberrange from 4000–400 cm�1 using an IR Affinity-1S spectrom-eter (Shimadzu). Raman spectroscopic studies were alsocarried out using a Renishaw In-Via Reex Micro-Ramanspectrometer having a 514.5 nm Argon laser. To analyze thesurface composition and chemical states of the compositesample, X-ray photoelectron spectroscopy was performedusing PHI-5000C ESCA Versaprobe-II, FEI, Inc., with Al KR X-ray as the excitation source. A BET analyzer (BELSORP-MINI-II, Japan Inc.) was employed to investigate the surface areaand average pore diameter under nitrogen gas adsorption–desorption.
To obtain the surface morphological information from thesintered, polished, and Ag–Pd coated composite pellets, SEMwas performed using a scanning electron microscope (JEOLJSM-6400). The coating on the pellet samples was done by anAuto Fine Coater sputtering machine (JEOL, JEC-3000FC).Eventually, the coated samples were then xed upon thecopper stubs by conducting carbon tape and the SEM imageswere recorded at appropriate magnications.
To analyze the particle shape and size of the composite,transmission electron microscopy was also conducted by a eldemission gun electron microscope (JEOL 2100). A fraction ofmilligram of the powder sample 10B90Z was subjected to bathsonication up to 25 min in CH3CHOHCH3. Further, few tiny
This journal is © The Royal Society of Chemistry 2019
Paper RSC Advances
Ope
n A
cces
s A
rtic
le. P
ublis
hed
on 1
1 D
ecem
ber
2019
. Dow
nloa
ded
on 1
2/30
/202
1 6:
50:3
5 A
M.
Thi
s ar
ticle
is li
cens
ed u
nder
a C
reat
ive
Com
mon
s A
ttrib
utio
n-N
onC
omm
erci
al 3
.0 U
npor
ted
Lic
ence
.View Article Online
drops were cast on the top surface of the holey carbon grid andthen dried in a vacuum chamber for 24 h. Thus, the TEM imageswere recorded for the vacuum dried sample.
For mechanical characterisation, the Universal TestingMachine (Instron 3639) was employed in the compressionmodefor the sintered pellets (diameter and height 1.2� 1.2 cm2). Theload bearing capability of all the samples was investigated bystress–strain curves, using which the Young's modulus andfracture toughness were determined. The fracture toughnessvalues were estimated using the area under the stress–straincurves.
The wear and sliding friction tests were performed usinga pin-on-disk apparatus (Magnum Engineers, Bangalore,India). A rotating disk of EN31 steel hardened to 60 HRC wasalso utilized as a counter face for testing the composite pins,which were xed during the measurements. The load wasapplied to the pin through the lever, resulting in a contin-uous contact between the pin and the counter face. Moreover,the wear tests were performed for a total duration of 800seconds and then the weight loss was determined using ananalytical balance having 0.0001 g accuracy. Three tests wereperformed for each composite under the same environment.The machine associated with a control panel reveals thefrictional force and therefore, the friction force was notedaer every 30 s and the same method was used to calculatethe coefficient of friction.
3.1. Fly stock maintenance
Control Oregon-R ies were used to check the toxic effects of thecomposite samples. The stock was provided by C-CAMP, FlyFacility Bengaluru India. The ies follow a generalized shortperiod of lifecycle of 10–15 days, which allows us to study all thepositive and negative effects of the nanoparticles. They were fedwith regular y food, which consisted of corn meal, yeastpowder, sucrose, and agar–agar type I. The fabricated nano-composites were fed to the ies by mixing them in their foodwith their respective concentrations. Five different concentra-tions were chosen to check the toxicity of the nanocomposites10B90Z and 90B10Z, i.e., 1 mg mL�1, 10 mg mL�1, 25 mg mL�1, 50mg mL�1, and 100 mg mL�1, along with the control. All the vialshaving these ies were reared with 12 h light–dark conditions at25 �C.
3.2. Developmental cycle analysis
The life cycle of Drosophila was tested from the egg to the adultstage of development at an interval of 6 h and was comparedwith the control to check any delay in the developmental stages.All the developmental changes of the y were carefully observed.The number of pupa was observed in each vial for three daysaer pupa formation at an interval of 24 h and they werecompared with the control.
3.3. Larval crawling assay
Wild type larvae or the control larvae choose to crawl ina straight line towards the periphery of the plate; however, thetreated larvae or the larvae with some defects generally take
This journal is © The Royal Society of Chemistry 2019
a longer path by stopping and changing their directionmultiple times. This assay was done by following Mishra andBarik's study.59 Briey, third instar larvae were collected fromthe food vials and washed in 1� PBS (phosphate buffer saline)to get rid of the extra amount of particulate food stuck ontheir body. Then, they were allowed to move over a 2%solidied agar gel prepared in a 90 mm petri dish. The trailingpath of the larvae was marked. To check the distance travelledby the larvae, we put a graph paper below the petri dish andrecorded the speed of the larvae for 1 min. The speed wasdetermined by counting the number of squares travelled bythe larvae within 1 min. A graph was plotted using thedistance travelled by the larvae.
3.4. Trypan blue staining
To verify the dead cells inside the gut tissue of Drosophila,trypan blue staining was done aer feeding with thecomposite samples. Any kind of injury in the tissue allowstrypan blue to enter through its membrane and get attachedto the damaged cells, thus giving blue colour to that area. Inthis way, the live cells can be distinguished from the deadcells. Trypan blue staining was done by following the study byMishra et al.56 Briey, six third instar larvae were taken fromeach concentration along with the control to perform thisassay. One wash with PBS was done prior to staining. 0.5 mgmL�1 of trypan blue (HIMEDIA) was used to stain the larvaefor 30 minutes in dark. Aer incubating with the stain, thelarva were rewashed with PBS and then observed undera stereo microscope.
3.5. Nitro blue tetrazolium (NBT) reduction assay forreduced oxygen species (ROS) production
ROS production is the result of a normal metabolic pathwaythat maintains homeostasis in one organism. NBT assay isperformed to analyze the amount of free radical yield insidethe larvae aer treatment with the nanocomposite. The NBTtest was performed by following the method reported byMishra et al.56 Briey, the haemolymph was extracted in ice-cold temperatures in order to avoid melanisation. For theextraction of the haemolymph, 15 larvae of all concentrationswere pinched by means of a sterilized needle in a microcentrifuge tube of 0.5 mL with a small cut at its base. The tubewas kept in a tube of 1.5 mL and centrifuged at 4 �C in6000 rpm for 5 min to collect the larval haemolymph. Then, tothe 1.5 mL tube, 10 mL of 1� PBS was added. 10 mL of NBT wasadded to the tube and the sample was kept in dark for 1 h atroom temperature. Then, 20 mL of acetic acid glacial (100%)was mixed with the sample and incubated for 5 min. Finally,150 mL of acetic acid glacial (50%) was mixed with it. Aermixing properly, the sample was taken in a 96 well plate tocheck the OD at 595 nm.
3.6. Adult phenotype assay
The y grew on nanocomposite mixed food and laid eggs in thevial. The embryo completed the developmental stages and therst generation y (F1) was enclosed. 50 adult ies were taken
RSC Adv., 2019, 9, 40977–40996 | 40979

RSC Advances Paper
Ope
n A
cces
s A
rtic
le. P
ublis
hed
on 1
1 D
ecem
ber
2019
. Dow
nloa
ded
on 1
2/30
/202
1 6:
50:3
5 A
M.
Thi
s ar
ticle
is li
cens
ed u
nder
a C
reat
ive
Com
mon
s A
ttrib
utio
n-N
onC
omm
erci
al 3
.0 U
npor
ted
Lic
ence
.View Article Online
from each of the different concentrations along with thecontrol. They were anesthetized and observed carefully underthe digital stereo microscope for unusual phenotypic defects inany body part with special reference to thorax, eyes, and wings.The arrangement of ommatidia in each eye was observed. Thewings were placed over slides and scanned under a digitalstereo microscope to check defects in the venation patterns. Forthe thorax, the number of bristle pairs was counted from theimages and searched for abnormal pattern of bristle. Anyphenotypic concentration of the ies were recorded and plottedin the graph.
4. Results and discussion4.1. XRD analysis
XRD patterns of the prepared nanocomposites of hBN–ZrO2
were recorded and are depicted in Fig. 1(a–f). The diffractionpeaks were sharp for all the compositions and found to beslightly shied towards higher angle side with increasingconcentration of h-BN. A high intensity characteristic peak was
Fig. 1 XRD patterns of the prepared hBN–ZrO2 biocomposite of (a)10B90Z, (b) 20B80Z, (c) 40B60Z, (d) 60B40Z, (e) 80B20Z, and (f)90B10Z sintered at 1000 �C for 3 h.
40980 | RSC Adv., 2019, 9, 40977–40996
observed at 2q value �28.32� that conrmed the formation ofthe major phase of zirconium oxynitrate [ZrO(NO3)2] (JCPDS leno. 049-1062). The secondary phase formation of zirconiumboride (B12Zr) (JCPDS le no. 044-1081), hexagonal boronnitride (h-BN) (JCPDS le no. 035-1365), and zirconium nitrite(Zr2ON2) (JCPDS le no. 050-1170) were also conrmed andmarked in their respective XRD patterns.
4.2. Infrared spectroscopic analysis
In order to study the mechanisms of bond formation, FTIRmeasurements of the pure h-BN, pure ZrO2, and their nano-composites were performed and the results are shown inFig. S1(a, b)† and Fig. 2(a–e) respectively. Fig. 2(a–e) depicts theIR spectra recorded for (a) 10B90Z, (b) 20B80Z, (c) 60B40Z, (d)80B20Z, and (e) 90B10Z. The different shoulders that appearedin the IR spectra of various h-BN–ZrO2 nanocomposites arerepresented in Table 2 and their assignments are given in Table5. The peaks are shown in a rising sequence of 1 to 15. The IRspectra exposed different distinctive absorption peaks thatconrm the existence of different stretching and bendingvibrational modes of h-BN and ZrO2. The asymmetric stretch ofN–B–N appears in the wavenumber range from 1383–1490 cm�1; however, the same vibration for B–N–B appeared inthe wavenumber range from 767–775 cm�1.60–62 The absorptionbands (1) and (2) arose due to the presence of ZrO2 in the
Fig. 2 IR spectra of the prepared hBN–ZrO2 composite samples (a)10B90Z, (b) 20B80Z, (c) 60B40Z, (d) 80B20Z, and (e) 90B10Z sinteredat 1000 �C for 3 h.
This journal is © The Royal Society of Chemistry 2019

Table 1 Sample code, h-BN compositions, density, mechanical strength, Young's modulus, toughness, surface area, pore size and pore volumefor all the composite samples
Sample codeBN compositions(%)
Density(g cm�3)
Mechanical strength(MPa)
Young modulus(GPa)
Toughness(MJ m�3)
Surface area(m2 g�1)
Pore size(nm)
Pore volume(cm3 g�1)
10B90Z 10 3.12 227 10.10 2.56 21.011 1.21 3.7120B80Z 20 3.04 129 9.93 0.96 — — —40B60Z 40 2.82 95 6.60 0.57 — — —60B40Z 60 2.79 76 5.44 0.53 31.073 1.64 7.6380B20Z 80 2.70 38 3.70 0.45 — — —90B10Z 90 2.67 34 3.57 0.16 65.666 1.66 12.24
Table 2 Composite samples code, peak positions in IR spectra of all the composite samples
Samples code
IR peaks position (cm�1)
1 2 3 4 5 6 7 8 9 10 11 12 13 14 15
10B90Z — — — 767 876 923 1060 — 1383 1634 — — — — 345120B80Z — 590 — 769 882 923 1060 1194 1386, 1456 1627 — 2258 2358 — 322160B40Z — 590 643 769 884 922 1071 1193 1338, 1517 — 2030 2257 2358 2515 324280B20Z 507 586 646 814 884 923 1072 1193 1366, 1487 — 2032 2257 2358 2515 319990B10Z — — — 775 883 922 1066 1193 1361, 1490 — — 2257 2358 2515 3223
Paper RSC Advances
Ope
n A
cces
s A
rtic
le. P
ublis
hed
on 1
1 D
ecem
ber
2019
. Dow
nloa
ded
on 1
2/30
/202
1 6:
50:3
5 A
M.
Thi
s ar
ticle
is li
cens
ed u
nder
a C
reat
ive
Com
mon
s A
ttrib
utio
n-N
onC
omm
erci
al 3
.0 U
npor
ted
Lic
ence
.View Article Online
wavenumber range from 0–07 cm�1 and 586–590 cm�1,respectively; however, bands (3) and (4) occurred in the wave-number range from 643.28–646.18 cm�1 and 767–814.95 cm�1,respectively, band (5) in the wavenumber range from 876–883 cm�1, band (6) in the wavenumber range from 922–923 cm�1, and band (7) in the wavenumber range from 1060–1072 cm�1 (h-BN vibrational modes) occurred due to the pres-ence of h-BN.63 The peak (8) situated at 1193 cm�1 might berepresent the B–O–H bending vibrations.18 Further, a highintensity band (9) that appeared in the wavenumber range from1338–1386 cm�1 and 1456–1517 cm�1 is associated with theB–N stretching vibrations and B–O, respectively.64 In Fig. S1(b),†a strong thick envelop in the wavenumber range from 1386–1456 cm�1 was observed that could be attributed to the veryclose involvement of both h-BN as well as ZrO2 vibrations. Theabsorption band (10) appeared due to ZrO2. The absorption
Table 3 Density, percentage of porosity and mechanical properties of d
Bone implant materialsDensity(g cm�3)
Porosity[%]
Titanium (porous) 4.5 48HAp 2.1 410.5 La2O3-HAp (solid state route) 2.85 9.6650BN–50B2O3 (thin lm) 1.3 �36.4Tricalcium phosphate 3.14 503D graphene (SPS) �1.42 42hBN–ZrO2 (solid state route) 2.54 �10hBN–ZrO2 (solid state route) 3.12 —Pure ZrO2 (sintered at 1000 �C for 3 h) 5.68 —
This journal is © The Royal Society of Chemistry 2019
bands (11), (12), (13), and (14) occur at different wavenumberranges from 1627–1634 cm�1, 2030–2032 cm�1, 2257–2258 cm�1, 2358 cm�1, and 2515 cm�1, which appeared owingto h-BN correspondingly. Fascinatingly, as the concentration ofh-BN was increased, the absorption bands (10) vanished due toh-BN, as shown in Fig. 2(c–e). Moreover, this might be due tothe suppression of vibrations of h-BN due to the accumulationof excess amount of h-BN. The excess quantity of h-BN (90 wt%)beyond a certain limit into ZrO2 may restrict these particularusual vibrations. However, some peaks appeared in the wave-number range from 586–590 cm�1, 767–814 cm�1, 1338–1383 cm�1, and 2358 cm�1, and conrmed the presence ofZrO2.65 Eventually, an absorption band (15) was observed in thewavenumber range from 3199–3451 cm�1 in all the IR spectra ofthe nanocomposite samples, which was accredited to O–Hstretching.
ifferent bone implant materials
Compressive strength[MPa] Young's modulus [MPa] References
54 � 5 7.7 � 2 61 and 7334 � 2 — 74
108.89 � 1 90.81 � 0.5 7537 � 5 — 1611 � 1.3 — 7640 � 3 4.1 � 0.5 77
174 � 1 9.84 � 0.5 18227 � 1 10 � 0.1 (GPa) Current work181 � 1 9.053 � 0.1 —
RSC Adv., 2019, 9, 40977–40996 | 40981

Table 4 Composite samples code, peak positions in Raman spectra of all the biocomposite samples
Samples code
Raman shi (cm�1)
1 2 3 4 5 6 7 8 9 10 11 12 13 14 15 16
10B90Z 103 179 191 221 307 333 346 382 475 501 537 558 615 638 — —20B80Z 103 179 191 223 308 334 346 384 475 505 537 557 621 639 — —60B40Z 103 179 191 223 307 332 349 381 475 — — — 616 638 881 136780B20Z 103 179 191 — — 333 349 382 475 — — — 615 638 882 136790B10Z 104 179 191 — — 333 349 385 475 — — — 616 638 882 1366
RSC Advances Paper
Ope
n A
cces
s A
rtic
le. P
ublis
hed
on 1
1 D
ecem
ber
2019
. Dow
nloa
ded
on 1
2/30
/202
1 6:
50:3
5 A
M.
Thi
s ar
ticle
is li
cens
ed u
nder
a C
reat
ive
Com
mon
s A
ttrib
utio
n-N
onC
omm
erci
al 3
.0 U
npor
ted
Lic
ence
.View Article Online
4.3. Raman spectroscopic analysis
Fig. S2(a and b)† represents the Raman spectra for (a) pure h-BN, (b) pure ZrO2 whereas, Fig. S3(a–e)† depicts the Ramanspectra for h-BN–ZrO2 nanocomposites denoted as (a) 10B90Z,(b) 20B80Z, (c) 60B40Z, (d) 80B20Z, and (e) 90B10Z, respec-tively. The bands are represented by (1), (2), (3), (4), .(16) inthe ascending order of the wavenumber of their appearance,similar to the IR results. The obtained Raman spectra of thecomposite samples yield a consistent peak at 1367 cm�1,matching with the Raman peak of high quality crystalline h-BN, as shown in Fig. S3(a).†66 Pure ZrO2 exhibited its charac-teristic Raman active bands at various wavenumbers such as45, 178, 189, 260, 330, 377, 476, and 642 cm�1.67–69 As h-BN wasintroduced into ZrO2, few new bands at 882 cm�1 and1367 cm�1 (already mentioned) appeared due to the charac-teristic bands of h-BN, some existing bands of ZrO2 at 223, 307,505, and 557 cm�1 disappeared dramatically and the remain-ing bands of ZrO2 were shied by the 0 to +5 cm�1 wave-number and nally appeared at 179, 191, and 382 cm�1 in thespectra of all the composites.70–73 Therefore, the typical bands
Table 5 Assignments of infrared and Raman bands in the spectra of varrespectively
Wave number range (cm�1), IRWave number range (cm�1),Raman IR a
0–507 & 586–590 145, 178, 189, 260,330, 377, 476, 642
Occ
643.28–646.18, 767–814.95,876–883, 922–923, 1060–1072
882, 1367 h-B
1193 — Ben1338–1386 1367 Stre
1456–1517 — Stre1386–1456 — It p
theinvof b
1634–1627 — App1627–1634, 2030–2032, 2257–2258,2358 & 2515
— App
586–590, 767–814, 1338–1383 & 2358 — Con3199–3451 — Stre
atm
40982 | RSC Adv., 2019, 9, 40977–40996
of hBN–ZrO2 nanocomposites were centred at 103, 333, 349,476, 615, and 638 cm�1. A strong reduction in the intensities ofthe characteristic bands of h-BN and ZrO2 was observed onincreasing the amount of h-BN from 20 wt% in ZrO2. Thus, theresults obtained from the Raman study are consistent with theIR results (Table 4).
4.4. X-ray photoelectron spectroscopic (XPS) analysis
The composition of the surface and chemical states of Zr, O, B,and N elements in the sample 10B90Z was further tested byusing XPS technique. The XPS spectra are shown in Fig. 3(a–d),representing the existence of Zr, O, B, and N elements on thesurface layer of the powder sample 10B90Z without any impu-rities. Moreover, Fig. 3 shows the observed binding energiescorresponding to particular atomic states that constitutedifferent elements that were recognized as 182.4 and 180.15 eVfor Zr 3d, 528.4 eV for O 1s, 396.1 and 395.9 eV for N 1s, and182.45 eV for B 1s.16,74,75 Fig. 3(a) shows the high-resolutionspectrum of Zr 3d, in which two peaks were observed at180.15 eV (Zr 3d3/2) and 182.4 eV (Zr 3d5/2) with enough
ious composite samples, 10B90Z, 20B80Z, 60B40Z, 80B20Z, 90B10Z
ssignments Raman assignments
urred due to ZrO2 Characteristic Ramanactive bands of pure ZrO2
N vibrational modes59 Characteristic bands of h-BN
ding vibrational mode of B–O–H —tching vibrations of B–N60 Raman peak of high quality
crystalline h-BN66
tching vibrations of B–O —roduced that might be due tonearly the sameolvement of the intensities of vibrationsoth h-BN and ZrO2
—
eared due to ZrO2 —eared owing to h-BN —
rmed the presence of ZrO2 (ref. 61) —tching vibration of O–H group ofospheric moisture
—
This journal is © The Royal Society of Chemistry 2019

Fig. 3 XPS spectra of the 10B90Z composite samples sintered at 1200 �C showing four different peaks (a) Zr 3d reveals a typical ZrO2 formationand shows two separate peaks at binding energies of 182.4 eV and 180.15 eV. (b) O 1s spectra show the main binding energies of oxygen at528.4 eV. (c and d) Showing different peaks of B and N designated as core level B 1s and core level N 1s with the main binding energies of182.45 eV, 395.9 eV, and 396.1 eV, respectively.
Paper RSC Advances
Ope
n A
cces
s A
rtic
le. P
ublis
hed
on 1
1 D
ecem
ber
2019
. Dow
nloa
ded
on 1
2/30
/202
1 6:
50:3
5 A
M.
Thi
s ar
ticle
is li
cens
ed u
nder
a C
reat
ive
Com
mon
s A
ttrib
utio
n-N
onC
omm
erci
al 3
.0 U
npor
ted
Lic
ence
.View Article Online
separation of 2.25 eV. However, Fig. 3(b and c) depicts thespectra of O 1s and B 1s, in which a single peak in each spec-trum was observed at 528.4 eV and 182.45 eV that implies theformation of B–O and B–N bonding.76,77 The N 1s peaks of theparticular XPS spectrum revealed two different peaks ofnitrogen at 396.1 eV and 395.9 eV, which could be the bindingenergy of B–O and B–N (Fig. 3(d)).14 Therefore, the B 1s bindingenergy in B–(O, N) atmosphere is superior than that in B–Oatmosphere, where the N atom replaces the O atom.
4.5. BET analysis
In this study, the surface area and average pore size of fewselected nanocomposites 10B90Z, 60B40Z, and 90B10Z weremeasured with the help of nitrogen (N2) adsorption/desorption isotherms using BET analyzer (Fig. 4(a–d)).These nanocomposites exhibit plentiful microporous chan-nels (2 nm < width). The adsorbed content of N2 with respectto relative pressure, P/P0 was found to be maximum in therange of 0.4 to 0.9 and showed a high-quality hysteresis loop(Fig. 4(a and b)). The usual pore size distributions and surface
This journal is © The Royal Society of Chemistry 2019
area of the composite samples are shown in Fig. 4(c and d). Itis clearly noticed that with increasing the weight% of h-BN,the average pore size and specic surface area of the nano-composite samples 10B90Z, 60B40Z, and 90B10Z alsoincreased from 1.21 nm to 1.66 nm and 21.011 m2 g�1 to 65.66m2 g�1, respectively. It is noticed that sample 90B10Z has thehighest surface area of around 65.666 m2 g�1 but has anaverage pore size of 1.66 nm, whereas the sample 60B40Z hasa surface area of about 31.07 m2 g�1 but it has an average poresize of 1.64 nm. Even though the average pore size is more insample 90B10Z than sample 60B40Z, the number of porespresent in sample 90B10Z or the porosity of it is more thanthat of sample 60B40Z and hence, sample 90B10Z has moresurface area. h-BN has a highly porous nature so the pore sizeand surface area both increase with increasing amount of BN.Fig. 4(d) depicts that the synthesized composites can havehigh BET specic surface area. Therefore, large surface areaand established microporous architecture can play a pivotalrole in cell growth. Fig. 8(d and e) represents the comparisonof the surface area as well as average pore size for the indi-vidual nanocomposite samples.
RSC Adv., 2019, 9, 40977–40996 | 40983
Fig. 4 Nitrogen adsorption–desorption curves for composites (a) 10B90Z and (b) 90B10Z sintered at 1200 �C for 3 h, (c) bar diagram for averagepore size vs. increasing percentage of h-BN, and (d) bar diagram for surface area vs. increasing percentage of h-BN.
RSC Advances Paper
Ope
n A
cces
s A
rtic
le. P
ublis
hed
on 1
1 D
ecem
ber
2019
. Dow
nloa
ded
on 1
2/30
/202
1 6:
50:3
5 A
M.
Thi
s ar
ticle
is li
cens
ed u
nder
a C
reat
ive
Com
mon
s A
ttrib
utio
n-N
onC
omm
erci
al 3
.0 U
npor
ted
Lic
ence
.View Article Online
4.6. Scanning electron microscopic (SEM) analysis
The morphological features of the nanocomposites werestudied using SEM. Fig. 5(a–e) depicts the SEM images of fewselected samples (a) 10B90Z, (b) 20B80Z, (c) 40B60Z, (d)60B40Z, and (e) 90B10Z, respectively. The interrelated grainsand their boundaries were observed that gave rise to thecrystalline nature of the prepared materials. The ne grains ofZrO2 and h-BN sheets are represented by yellow and lightgreen coloured arrows, respectively. The SEM images of thecomposite 10B90Z (Fig. 5(a)) divulged the development ofsmall grains of ZrO2 dispersed in the large, interconnected,and stacked h-BN sheets and 20B80Z showed mixed anduniform grains of h-BN and ZrO2 (Fig. 5(b)). However, theimage Fig. 5(c) for 40B60Z clearly depicts the porous andlayered structure of h-BN with ZrO2 grains. The imagesFig. 5(d and e) for the samples 60B40Z and 90B10Z showedfully developed and randomly oriented h-BN nanosheets ofthickness �100–200 nm and side �0.5–2 mm. The ZrO2
nanoparticles were hardly seen due to two main factors: one isthat the weight percentage of h-BN is larger than that of theZrO2 and the second one is that the density of h-BN(2.1 g cm�3) is comparatively lesser than that of ZrO2
40984 | RSC Adv., 2019, 9, 40977–40996
(5.68 g cm�3), so h-BN nanosheets covered most of the volumein the samples 60B40Z and 90B10Z. Moreover, the substitu-tion of h-BN into ZrO2 reduced the brittleness of ZrO2 andinduced ductility in the sample that agreed with the stress–strain results (Fig. 7(b)). The composition obtained by addi-tion of a suitable amount of h-BN into ZrO2 was strongly ex-pected to be analogous to the natural bone composites. Thenanocomposite sample 10B90Z withstands a maximum loadof up to 227.33 MPa. It is accomplished from the SEM resultsthat the reinforcement of h-BN into ZrO2 amazingly improvedthe stability of the ZrO2 with remarkable enhancement in thesurface properties.
4.7. Transmission electron microscopic (TEM) analysis
Apart from the surface morphological studies, the TEM studywas also carried out to analyse the more magnied view of thenanocomposite 10B90Z at the nanoscale level (Fig. 6(a–f)).Similar to SEM investigations, the mixed h-BN nanosheetsand ZrO2 nanoparticles are clearly observed in the TEMimages also. In the images, the red coloured arrows indicatethe laterally oriented h-BN nanosheets whereas the whitecoloured arrows show the presence of ZrO2 nanoparticles. The
This journal is © The Royal Society of Chemistry 2019

Fig. 5 Scanning electron micrographs of polished composites (a) 10B90Z, (b) 20B80Z, (c) 40B60Z, (d) 60B40Z, and (e) 90B10Z sintered at1000 �C for 3 h.
Paper RSC Advances
Ope
n A
cces
s A
rtic
le. P
ublis
hed
on 1
1 D
ecem
ber
2019
. Dow
nloa
ded
on 1
2/30
/202
1 6:
50:3
5 A
M.
Thi
s ar
ticle
is li
cens
ed u
nder
a C
reat
ive
Com
mon
s A
ttrib
utio
n-N
onC
omm
erci
al 3
.0 U
npor
ted
Lic
ence
.View Article Online
average particle size (side of h-BN) of the h-BN nanosheetswas found to be in the range of 500–1000 nm, which again hasa good agreement with the SEM results. However, the particlesize of nano ZrO2 was found to be in the range of 5–10 nm. Thene ZrO2 nanoparticles are well dispersed with large h-BNnanosheets and appeared darker than individual h-BNnanosheets. The high resolution (HR-TEM) image (Fig. 6(e))exhibited the symmetrically arranged layered structure of h-BN nanosheets separated by a distance of 76 nm. The SAEDpattern showed various diffraction rings associated withvarious lattice planes (000), (002), (101), (004), and (110) of h-BN (Fig. 6(f)).18
This journal is © The Royal Society of Chemistry 2019
4.8. Density analysis
The densities of all the sintered pellets were determined from thegeometrical dimensions and their respective masses. Fig. 7(a)shows the density values of the prepared nanocomposites of h-BN–ZrO2. It is obvious from Fig. 7(a) that the density decreaseswith successive increments in the amount of h-BN or decrease inthe amount of ZrO2 due to the inferior density of h-BN(2.1 g cm�3) in comparison to the density of pure ZrO2
(5.68 g cm�3). Moreover, the determined values of density varyfrom 2.67 g cm�3 to 3.12 g cm�3 for all composites, viz., 3.12,3.04, 2.82, 2.79, 2.70, and 2.67 g cm�3 for 10B90Z, 20B80Z,40B60Z, 60B40Z, 80B20Z, and 90B10Z, respectively (Table 1).
RSC Adv., 2019, 9, 40977–40996 | 40985

Fig. 6 Transmission electron microscopy of the nanostructured composite sample 10B90Z (a) low magnification TEM image showing ZrO2
nanoparticles embedded in h-BN sheets. (b and c) High magnification TEM images showing interconnected large nanorods of hBN–ZrO2
nanoparticles. (d) High magnification bright field TEM image showing interconnected large h-BN sheets consisting of ZrO2 nanoparticles. (e)High resolution TEM image clearly showing the very fine arrangement of large nanorods. (f) Selected area electron diffraction pattern (SAED)showing spotty (ZrO2) and crystalline pattern of h-BN.
40986 | RSC Adv., 2019, 9, 40977–40996 This journal is © The Royal Society of Chemistry 2019
RSC Advances Paper
Ope
n A
cces
s A
rtic
le. P
ublis
hed
on 1
1 D
ecem
ber
2019
. Dow
nloa
ded
on 1
2/30
/202
1 6:
50:3
5 A
M.
Thi
s ar
ticle
is li
cens
ed u
nder
a C
reat
ive
Com
mon
s A
ttrib
utio
n-N
onC
omm
erci
al 3
.0 U
npor
ted
Lic
ence
.View Article Online

Fig. 7 (a) Density of pure ZrO2 and hBN–ZrO2 biocomposite samples with variation of h-BN. (b) Engineering stress vs. % of compressive straingraph of pure ZrO2 and hBN–ZrO2 samples sintered at 1000 �C for 3 h. (c) Variation of Young's modulus of pure ZrO2 and hBN–ZrO2 sampleswith varying concentration of h-BN. (d) Dependency of toughness of pure ZrO2 and hBN–ZrO2 composite samples with variation of h-BN.
Paper RSC Advances
Ope
n A
cces
s A
rtic
le. P
ublis
hed
on 1
1 D
ecem
ber
2019
. Dow
nloa
ded
on 1
2/30
/202
1 6:
50:3
5 A
M.
Thi
s ar
ticle
is li
cens
ed u
nder
a C
reat
ive
Com
mon
s A
ttrib
utio
n-N
onC
omm
erci
al 3
.0 U
npor
ted
Lic
ence
.View Article Online
4.9. Mechanical behaviour
The stress–strain graphs for pure ZrO2, 10B90Z, 20B80Z,40B60Z, 60B40Z, 80B20Z, and 90B10Z nanocomposites aregiven in Fig. 7(b). It is noticed from Fig. 7(b) that on increasingthe amount of h-BN into ZrO2, the mechanical strength,Young's modulus, and toughness decrease (Table 1). Moreover,due to less density of h-BN and its highly lubricating nature, itprovides the exibility to the synthesized composites thatinhibit the brittleness of the composites. However, the nano-composite 10B90Z achieved the highest compressive strength of�227 MPa along with adequate values of Young's modulus andfracture toughness 10.10 GPa and 2.56 MJ m�3, respectively.This composite also has a density of 3.12 g cm�3, which is veryclose to that of natural teeth.78 It is well known that ZrO2 hassuperior mechanical properties due to its dense microstructure.When ZrO2 is added with h-BN and sintered at 1000 �C, they arestrongly bonded with each other and provide better strength tothe nal product. The ne spherical particles linked on the h-BN surface are mostly the minor phase of ZrB2 and ZrB.Because these two kinds of particles have enormous modulusand mechanical strength, they contribute to the reinforcementof the hBN–ZrO2 composites.79 Moreover, the typical SEM image(Fig. 5(a)) of this composite sample shows a uniquemorphology, i.e., the formation of stacked h-BN grains during
This journal is © The Royal Society of Chemistry 2019
the sintering process. When the compressive load is applied,the stacked h-BN grains prevent the crack propagation andhence, the composite shows its maximum strength. Thus, thesendings fullled the mechanical criteria for this nano-composite as a capable alternative to articial teeth and dentalimplants. The hBN–ZrO2 composites expressed trivial deform-ability, which occurs due to the ductile nature of h-BN thatprevents disastrous failures.18 Thus, the addition of h-BN intoZrO2 paves the way to reduce the brittle nature of pure ZrO2 thatcould stand better than natural bone. The Young's modulus andtoughness decreased with increasing concentration of h-BN inZrO2 (Fig. 7(c–d)). The comparative analysis of density, porosity,Young's modulus, and compressive strength of the variouscomposite samples obtained via different synthetic routes, asreported in the literature, with the synthesized compositesample 10B90Z is given in Table 3 along with suitable refer-ences. Among all the synthesized nanocomposite composites,10B90Z was found to be the best and superior in comparison tothe reported biomaterials such as porous titanium (pTi), nHAp,La2O3-Hap, tricalcium phosphate, and 3D graphene.80–84
4.10. Tribological analysis of the composite samples
The tribological characteristics of the few selected samples10B90Z, 60B40Z, and 90B10Z sintered at 1000 �C for 3 h were
RSC Adv., 2019, 9, 40977–40996 | 40987

Fig. 8 Variations of wear against sliding time and coefficient of friction against sliding time at different loads of the composite samples (a and b)10B90Z, (c and d) 60B40Z, and (e and f) 90B10Z sintered at 1000 �C for 3 h.
RSC Advances Paper
Ope
n A
cces
s A
rtic
le. P
ublis
hed
on 1
1 D
ecem
ber
2019
. Dow
nloa
ded
on 1
2/30
/202
1 6:
50:3
5 A
M.
Thi
s ar
ticle
is li
cens
ed u
nder
a C
reat
ive
Com
mon
s A
ttrib
utio
n-N
onC
omm
erci
al 3
.0 U
npor
ted
Lic
ence
.View Article Online
tested to analyze their wear and coefficient of friction behaviors.Fig. 8(a–e) shows the variation of wear and coefficient of fric-tional force with sliding time for the above composite samples.The weight loss of the materials at 15 N load is found to besignicantly lesser than that at 5 N and 10 N loads, whereasweight loss is maximum for 10 N load (Fig. 8(a–c)). Fig. 8(e)reveals the higher weight loss at load 15 N andminimum at load5 N. As the concentration of h-BN increases and the percentageof ZrO2 decreases at higher load (15 N), the weight loss increasesappreciably. However, in all the above mentioned nano-composites, a moderate wear property was observed for 5 Nloads. Thus, these composites may be recommended for wear
40988 | RSC Adv., 2019, 9, 40977–40996
resistance materials for low loads. It is noticed that the variationof coefficient of friction for all the compositions is uctuating innature and within the range of 0.1 to 0.4 (Fig. 8(b, d and f)). Inthe present investigations, at higher load, the coefficient offriction is higher than that at a lower load of 5 N. Therefore, theoptimum value of all compositions occurs at 5 N load. Eventu-ally, the present developed nanocomposite is suitable for 5 Nload. On increasing the reinforcement of h-BN in ZrO2, thecomposite becomes ductile in nature, and owing to the ductileand so nature of h-BN, the sufficient weight loss was found toincrease beyond a certain limit of h-BN concentration. There-fore, in view of the tribological properties, the composite
This journal is © The Royal Society of Chemistry 2019

Fig. 9 Pupal count of fly. (A) Pupal count of composite 10B90Z,showing no significant changes in all the concentrations while thehigher concentrations show a slight decrease in the pupal count. (B)Pupal count of composite 90B10Z, showing a decrease in the pupalcount at lower concentrations while it was unaffected at higherconcentrations. *** designates p < 0.001 and * designates p < 0.05.
Paper RSC Advances
Ope
n A
cces
s A
rtic
le. P
ublis
hed
on 1
1 D
ecem
ber
2019
. Dow
nloa
ded
on 1
2/30
/202
1 6:
50:3
5 A
M.
Thi
s ar
ticle
is li
cens
ed u
nder
a C
reat
ive
Com
mon
s A
ttrib
utio
n-N
onC
omm
erci
al 3
.0 U
npor
ted
Lic
ence
.View Article Online
10B90Z sample was found to be very compatible with teethimplant applications.
5. Biological activities5.1. Life cycle analysis
Nanocomposites may induce defects in the developmentalcycle of the y. But in our case, we did not observe any delayin developmental cycle. From pupal count of third day aerappearance of pupa, we observed that the composite 10B90Z(Fig. 9(A)) induced a negative impact on the pupal number athigh concentration (100 mg mL�1) with the value 19.50 �2.500, which is less than that of the control (51.00 � 5.000).
This journal is © The Royal Society of Chemistry 2019
However, at lower concentrations such as 1 mg mL�1, 10 mgmL�1, 25 mg mL�1, and 50 mg mL�1, no such signicantchanges were observed and the values were 36.00 � 4.000,37.00 � 5.000, 40.00 � 4.000, and 29.00 � 2.000, respectively.The composite 10B90Z, in most of the cases, has no impacton the pupal count. From the pupal count of the third dayaer appearance of pupa, we observed that the composite90B10Z (Fig. 9(B)) induced negative impact on the pupalnumber count in lower concentrations such as 1 mg mL�1 and10 mg mL�1, whose values were 9.000 � 1.000 and 36.50 �1.500, respectively. However, at higher concentrations suchas 25 mg mL�1, 50 mg mL�1, and 100 mg mL�1, no suchsignicant changes were observed, which was conrmed bythe values 48.00 � 5.000, 37.00 � 4.000, and 51.00 � 7.000,respectively. The control value for pupal count was 50.00 �0.0. This result suggests that nanocomposite 90B10Z inducesdamage to pupal development at lower concentrations.However, the nanocomposite 10B90Z has no impact on thepupal count, which revealed the superiority of 10B90Z over90B10Z.
5.2. Larva crawling assay
The larva crawling assay was done to check any neuronaldefects in the larva due to ingestion of nanocomposites10B90Z and 90B10Z through food. The wild type larvae or thecontrol ones moved almost in a straight line from the centre ofthe petri dish towards the periphery, whilst many treatedlarvae traveled confused and curvy paths, and some traveledalmost negligible distances. The larvae treated with differentconcentrations of the sample 10B90Z also showed someconfused movements in the crawling plates, which can beobserved from the traced path (Fig. 10(A)). At concentrationssuch as 1 mg mL�1, 50 mg mL�1, and 100 mg mL�1, the pathtraveled by the larvae is not straight and was confusing. Somelarvae took a lot more time to reach the periphery as comparedto the control larvae. More than half of the larvae treated withthe highest concentration of 10B90Z, i.e., 100 mg mL�1, didn'ttravel a signicant path. This suggests neuronal damage of thelarvae. Mostly, the damage of the larvae is seen at higherconcentrations.
In Fig. 10(B), we can see that the path traced by the larvaetreated with 10 mg mL�1 was very curvy and it fails to reach theperiphery. Also, for those treated with 25 mg mL�1 concen-tration, the path travelled to reach their destination was verylong and curvy, which shows confused behaviour of thelarvae. This suggests that some motor neurons of the larvaewere affected by the nanocomposite 90B10Z at lowerconcentrations.85 This data shows similarity with literatureswhere nanoparticles induced toxicity affects the neuronalhealth of the y.86,87 To validate the crawling assay, wechecked the speed of the larva treated with nanocomposite10B90Z. In Fig. 10(C), the control crawling speed was found tobe 1.544 � 0.1075. We did not nd any signicant changes inthe speed at 10 mg mL�1 and 25 mg mL�1 treated larvae, whosespeeds were found to be 1.206 � 0.1181 and 1.310 � 0.1089,respectively. On the other hand, in the case of 1 mg mL�1, 50
RSC Adv., 2019, 9, 40977–40996 | 40989
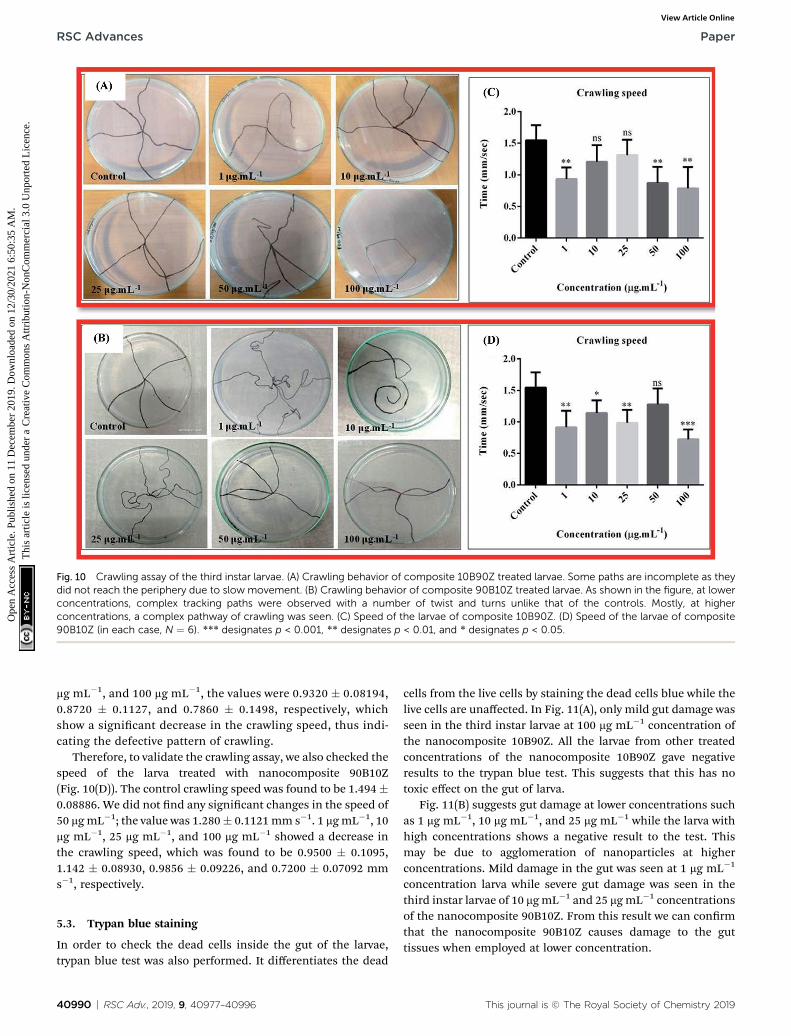
Fig. 10 Crawling assay of the third instar larvae. (A) Crawling behavior of composite 10B90Z treated larvae. Some paths are incomplete as theydid not reach the periphery due to slow movement. (B) Crawling behavior of composite 90B10Z treated larvae. As shown in the figure, at lowerconcentrations, complex tracking paths were observed with a number of twist and turns unlike that of the controls. Mostly, at higherconcentrations, a complex pathway of crawling was seen. (C) Speed of the larvae of composite 10B90Z. (D) Speed of the larvae of composite90B10Z (in each case, N ¼ 6). *** designates p < 0.001, ** designates p < 0.01, and * designates p < 0.05.
RSC Advances Paper
Ope
n A
cces
s A
rtic
le. P
ublis
hed
on 1
1 D
ecem
ber
2019
. Dow
nloa
ded
on 1
2/30
/202
1 6:
50:3
5 A
M.
Thi
s ar
ticle
is li
cens
ed u
nder
a C
reat
ive
Com
mon
s A
ttrib
utio
n-N
onC
omm
erci
al 3
.0 U
npor
ted
Lic
ence
.View Article Online
mg mL�1, and 100 mg mL�1, the values were 0.9320 � 0.08194,0.8720 � 0.1127, and 0.7860 � 0.1498, respectively, whichshow a signicant decrease in the crawling speed, thus indi-cating the defective pattern of crawling.
Therefore, to validate the crawling assay, we also checked thespeed of the larva treated with nanocomposite 90B10Z(Fig. 10(D)). The control crawling speed was found to be 1.494�0.08886. We did not nd any signicant changes in the speed of50 mgmL�1; the value was 1.280� 0.1121mm s�1. 1 mgmL�1, 10mg mL�1, 25 mg mL�1, and 100 mg mL�1 showed a decrease inthe crawling speed, which was found to be 0.9500 � 0.1095,1.142 � 0.08930, 0.9856 � 0.09226, and 0.7200 � 0.07092 mms�1, respectively.
5.3. Trypan blue staining
In order to check the dead cells inside the gut of the larvae,trypan blue test was also performed. It differentiates the dead
40990 | RSC Adv., 2019, 9, 40977–40996
cells from the live cells by staining the dead cells blue while thelive cells are unaffected. In Fig. 11(A), only mild gut damage wasseen in the third instar larvae at 100 mg mL�1 concentration ofthe nanocomposite 10B90Z. All the larvae from other treatedconcentrations of the nanocomposite 10B90Z gave negativeresults to the trypan blue test. This suggests that this has notoxic effect on the gut of larva.
Fig. 11(B) suggests gut damage at lower concentrations suchas 1 mg mL�1, 10 mg mL�1, and 25 mg mL�1 while the larva withhigh concentrations shows a negative result to the test. Thismay be due to agglomeration of nanoparticles at higherconcentrations. Mild damage in the gut was seen at 1 mg mL�1
concentration larva while severe gut damage was seen in thethird instar larvae of 10 mgmL�1 and 25 mgmL�1 concentrationsof the nanocomposite 90B10Z. From this result we can conrmthat the nanocomposite 90B10Z causes damage to the guttissues when employed at lower concentration.
This journal is © The Royal Society of Chemistry 2019

Fig. 11 (A) Trypan blue staining of the composite 10B90Z. At higher concentrations, a blue color stained gut was observed (N ¼ 6). (B) Trypanblue staining of composite 90B10Z. Blue color in the larva indicating damaged portions of the gut at lower concentrations. (C) NBT assay ofcomposite 10B90Z. In most of the cases, ROS production is less or equal to the control. (D) NBT assay of 90B10Z. Lower concentrations showingmore absorbance indicate more ROS production. Only at a moderate concentration, more ROS production is observed (N¼ 15). **** designatesp < 0.0001, *** designates p < 0.001, ** designates p < 0.01, and * designates p < 0.05.
Paper RSC Advances
Ope
n A
cces
s A
rtic
le. P
ublis
hed
on 1
1 D
ecem
ber
2019
. Dow
nloa
ded
on 1
2/30
/202
1 6:
50:3
5 A
M.
Thi
s ar
ticle
is li
cens
ed u
nder
a C
reat
ive
Com
mon
s A
ttrib
utio
n-N
onC
omm
erci
al 3
.0 U
npor
ted
Lic
ence
.View Article Online
5.4. NBT reduction assay for ROS production
The verication of quantity of ROS generated in the haemo-lymph of third instar larvae aer up taking nanoparticles wasdone through NBT assay. The amount of ROS generation isdirectly proportional to the absorbance. For nanocomposite10B90Z, (Fig. 11(C)) absorbance for ROS of control was found tobe 0.09067 � 0.007535. At 1 mg mL�1 and 50 mg mL�1, the valuewas decreased to 0.04133 � 0.004096 and 0.05033 � 0.009333,respectively, showing no increase in ROS generation. Also, wedid not nd a signicant change in the absorbance at 10 mgmL�1 and 100 mg mL�1, which was 0.1030 � 0.003215 and0.09133 � 0.001764, respectively, which is equivalent to thecontrol showing no increase in ROS generation but a signicantincrease was observed in 25 mg mL�1, which was 0.1287 �0.004256. In each case, the experiment was repeated threetimes. Herein, most of the concentrations show negative effect
This journal is © The Royal Society of Chemistry 2019
to increased ROS generation. Only at 25 mg mL�1 toxicity wasseen. Hence, we can infer that this nanoparticle is less toxicwhen applied in all these concentrations.
For the nanocomposite 90B10Z, (Fig. 11(D)) the absorbancefor ROS of the control was found to be 0.08333 � 0.003333. At 1mg mL�1 and 100 mg mL�1, the absorbance was found to be0.0170 � 0.003215 and 0.06567 � 0.002667, respectively, whichwas less than that of the control, while no such signicantchanges were observed in the case of 50 mg mL�1, which was0.0700 � 0.003464. Interestingly, at concentrations of 10 mgmL�1 and 25 mg mL�1, a large increase in the ROS productionwas observed and the values were 0.2007 � 0.01170 and 0.2117� 0.002848, respectively. The literatures suggest that thenanoparticles induce stress in the y, resulting in oxidativedamage.88 So, ROS production will be more.89 Lower concen-trations of the nanocomposite 90B10Z were mostly affected bythe nanoparticles. At higher concentration, the nanoparticle
RSC Adv., 2019, 9, 40977–40996 | 40991

Fig. 12 (A) Adult eye phenotype of the composite 10B90Z. There is a loss of ommatidia found at the border of the eye at moderate concen-trations shown in white circles, while at higher concentrations, a damaged eye can be seen (N ¼ 30). (B) Adult eye phenotype of the composite90B10Z. There are fused ommatidia structures observed in the eyes, indicated with white circles, whereas there is an ommatidia loss visible at 10mg mL�1 and 50 mg mL�1 concentrations (marked with circles). (C) Adult wing phenotype of the composite 10B90Z showing no defects (N¼ 30).(D) Adult wing phenotype of the composite 90B10Z. The wings taken from the flies at different concentrations of the composite are comparedagainst the control flies. A single spot was observed at 10 mg mL�1 and more spots were observed at 100 mg mL�1 concentration, marked withwhite rectangles.
RSC Advances Paper
Ope
n A
cces
s A
rtic
le. P
ublis
hed
on 1
1 D
ecem
ber
2019
. Dow
nloa
ded
on 1
2/30
/202
1 6:
50:3
5 A
M.
Thi
s ar
ticle
is li
cens
ed u
nder
a C
reat
ive
Com
mon
s A
ttrib
utio
n-N
onC
omm
erci
al 3
.0 U
npor
ted
Lic
ence
.View Article Online
size may become larger by agglomeration, so they cannot travelthrough all the tissues. This may be one of the reasons of lesstoxicity at higher concentration of the nanoparticles.
6. Adult phenotype assay6.1. Eye phenotype
In nanocomposite 10B90Z (Fig. 12(A)), we found that at 10 mgmL�1 and 100 mg mL�1 concentrations, the structural arrange-ment of the eyes got disturbed. Ommatidial loss near theperiphery region indicates the apoptosis of structures. At otherconcentrations, the eye structures were unaffected. In case ofthe composite sample 90B10Z (Fig. 12(B)) at lower concentra-tions such as 1 mg mL�1 and 10 mg mL�1, we observed someommatidia loss in the compound eye of Drosophila. The similarkind of eye defect was observed at higher concentrations. Therewere no such defects observed at 25 mg mL�1 and 50 mg mL�1
concentrations.
6.2. Wing phenotype
To check the toxic effect of the nanoparticles, the adultphenotypes were taken. For the nanocomposite 10B90Z(Fig. 12(C)), no such defects appeared in the adult. This suggests
40992 | RSC Adv., 2019, 9, 40977–40996
that the nanocomposite 10B90Z has no negative effect on wingdevelopment in the y. For the nanocomposite 90B10Z(Fig. 12(D)), at 10 mgmL�1 as well as 100 mgmL�1 concentration,some black spots in wings were seen that are absent in thecontrol wings. Wing spots were observed in the wings due togenotoxicity of the nanoparticles on the y's body. Someprevious data suggest that the nanoparticles have genotoxiceffects that may lead to wing spot formation.87 Therefore, thenanocomposite 90B10Z affects the normal development ofwings at lower concentrations as well as higher concentrations.
6.3. Bristle phenotype
The genes achaete–scute complex are responsible for the properformation of microchaetes in y.90 In the case of nanocomposite10B90Z (Fig. 13(A)), no major defects were observed. However,at 25 mg mL�1 concentration, some bristles were absent in thethorax regions. This indicates that the nanocomposite 10B90Zhas no damaging effect on the bristle patterning in Drosophila.In the composite sample 90B10Z (Fig. 13(B)), at 1 mg mL�1
concentration, formation of extra bristle was seen. A number ofmissing bristles at their respective regions were observed at 10mg mL�1. Previous reports suggest that the damage in bristle
This journal is © The Royal Society of Chemistry 2019

Fig. 13 (A) Adult bristle phenotype of the composite 10B90Z. No such major changes were observed. Only at a moderate concentration,a phenotype with missing bristle was found, which was marked with a white circle. (B) Adult bristle phenotype of the composite 90B10Z. Ata lower concentration, extra bristle was formed indicated with white arrow, while in some cases, mechanization and loss of bristles were found,which are indicated with white circles (N ¼ 30).
Paper RSC Advances
Ope
n A
cces
s A
rtic
le. P
ublis
hed
on 1
1 D
ecem
ber
2019
. Dow
nloa
ded
on 1
2/30
/202
1 6:
50:3
5 A
M.
Thi
s ar
ticle
is li
cens
ed u
nder
a C
reat
ive
Com
mon
s A
ttrib
utio
n-N
onC
omm
erci
al 3
.0 U
npor
ted
Lic
ence
.View Article Online
formation in Drosophila is due to nanoparticle uptake.86,91 At 25mgmL�1 and 100 mgmL�1 concentrations, the thorax region wasmelanized. The pigmentation in the thorax region of Drosophilais due to some genes such as ebony and dopa.92,93 They are thekey regulators of melanin synthesis in the y's body.94 Someprevious studies on zirconia toxicity have shown the pigmen-tation at abdominal regions of the y.91 The defective patterningin pigmentation of the thorax of ies suggests that the
This journal is © The Royal Society of Chemistry 2019
nanocomposites affect the pigmentation genes only at higherconcentrations.
7. Conclusions
The various 3-D nano biocomposites of hBN–ZrO2 of highstrength were successfully synthesized via solid state reactionmethod. Their structural, morphological, mechanical, and
RSC Adv., 2019, 9, 40977–40996 | 40993
RSC Advances Paper
Ope
n A
cces
s A
rtic
le. P
ublis
hed
on 1
1 D
ecem
ber
2019
. Dow
nloa
ded
on 1
2/30
/202
1 6:
50:3
5 A
M.
Thi
s ar
ticle
is li
cens
ed u
nder
a C
reat
ive
Com
mon
s A
ttrib
utio
n-N
onC
omm
erci
al 3
.0 U
npor
ted
Lic
ence
.View Article Online
tribological properties were well correlated. A ne inter-connected network was observed in the microstructural study.The zirconia nanoparticles were nely decorated into large andorganized hexagonal nanosheets of boron nitride. The nano-composite 10B90Z showed less toxicity in the in vivo study usingDrosophila melanogaster, while the composite 90B10Z showedtoxicity in Drosophila. Due to the less toxicity of the composite10B90Z, its utilization in nano formulation of various drugdelivery systems can be proposed. Among all the synthesizedcompositions, the composite 10B90Z achieved the mostsignicant mechanical, tribological, and biological propertiescompared to the desired properties for articial teeth and teethimplant materials.
Conflicts of interest
The authors declare no competing nancial interest.
Acknowledgements
C. R. G. appreciatively acknowledges the Science and Engi-neering Research Board, Department of Science and Tech-nology (SERB-DST), New Delhi and Government of India forgiving nancial support under the Empowerment and EquityOpportunities for Excellence in Science (File No. EEO/2018/000647). A. G. acknowledges the University Grant Commis-sion, Government of India, New Delhi for Junior ResearchFellowship File No.: (Roll No. 525791 Sr. No. 2061451179Ref. No: 22/06/2014 (i) EU-V). The authors also acknowledge theCentre of Excellence Scheme of U.P. State Government forproviding PXRD facility at the Department of Physics, Universityof Lucknow. The authors also deeply acknowledge Prof. P. M.Ajayan, Department of Materials Science and Nano Engi-neering, Rice University, USA for providing the SEM/TEM andUTM facilities.
References
1 J. Eichler and C. Lesniak, J. Eur. Ceram. Soc., 2008, 28, 1105–1109.
2 C. Steinborn, M. Herrmann, U. Keitel, A. Schonecker,J. Rathel, D. Rafaja and J. Eichler, J. Eur. Ceram. Soc., 2013,33, 1225–1235.
3 B. Ertug, T. Boyraz and O. Addemir, Mater. Sci. Forum, 2007,554, 197–200.
4 S. K. Lee, K. Nakamura, S. Kume and K. Watari, Eco-Mater.Proc. Des. VII, 2006, 510–511, 398–401.
5 J. Eichler, K. Uibel and C. Lesniak, Adv. Sci. Technol., 2010,65, 61–69.
6 A. Lipp, K. A. Schwetz and K. Hunold, J. Eur. Ceram. Soc.,1989, 5, 3–9.
7 W. S. Cho, M. W. Cho, J. H. Lee and Z. A. Munir, Mater. Sci.Eng., A, 2006, 418, 61–67.
8 X. Duan, M. Wang, D. Jia, N. Jing, Z. Wu, Z. Yang, Z. Tian,S. Wang, P. He, Y. Wang and Y. Zhou, Mater. Sci. Eng., A,2014, 607, 38–43.
40994 | RSC Adv., 2019, 9, 40977–40996
9 S. Guicciardi, R. Calzavarini, V. Medri, S. Bugliosi andA. Bellosi, Mater. Sci. Eng., A, 2007, 445–446, 579–586.
10 H. Y. Jin, W.Wang, J. Q. Gao, G. J. Qiao and Z. H. Jin, Key Eng.Mater., 2006, 317–318, 637–640.
11 B. Lee, D. Lee, J. H. Lee, H. J. Ryu and S. H. Hong, Sci. Rep.,2016, 6, 1–12.
12 Y. L. Li, J. X. Zhang, G. J. Qiao and Z. Jin, Mater. Sci. Eng., A,2005, 397, 35–40.
13 S. A. Taylor and A. L. Moore, J. Mater. Sci., 2015, 50, 6220–6226.
14 S. Vinod, C. S. Tiwary, P. A. S. Autreto, J. T. Tijerina, S. Ozden,A. C. Chipara, R. Vajtai, D. S. Galvao, T. N. Narayanan andP. M. Ajayan, Nat. Commun., 2014, 5, 1–9.
15 B. Senyuk, N. Behabtu, A. Martinez, T. Lee,D. E. Tsentalovich, G. Ceriotti, J. M. Tour, M. Pasquali andI. I. Smalyukh, Nat. Commun., 2015, 6, 1–7.
16 C. R. Gautam, C. S. Tiwary, L. D. Machado, S. Jose, S. Ozden,S. Biradar, D. S. Galvao, R. K. Sonker, B. C. Yadav, R. Vajtaiand P. M. Ajayan, RSC Adv., 2016, 6, 87888–87896.
17 X. Duan, M. Wang, D. Jia, N. Jing, Z. Wu, Z. Yang, Z. Tian,S. Wang, P. He, Y. Wang and Y. Zhou, Mater. Sci. Eng., A,2014, 607, 38–43.
18 C. R. Gautam, A. Gautam, V. K. Mishra, N. Ahmad, R. Trivediand S. Biradar, Ceram. Int., 2019, 45, 1037–1048.
19 S. Schlienger, J. Alauzun, F. Michaux, L. Vidal, J. P. Tier,C. Gervais, F. Babonneau, S. Bernard, P. Miele andJ. B. Parra, Chem. Mater., 2012, 24, 88–96.
20 D. Liu, W. Lei, S. Qin and Y. Chen, Sci. Rep., 2014, 4, 1–5.21 M. Pacella, P. W. Butler-Smith, D. A. Axinte and M. W. Fay,
Diamond Relat. Mater., 2015, 59, 62–68.22 P. B. Mirkarimi, K. F. McCarty and D. L. Medlin, Mater. Sci.
Eng., R, 1997, 21, 47–100.23 G. R. Bhimanapati, M. Wetherington, S. Mahabir and
J. A. Robinson, 2D Mater., 2016, 3, 1–8.24 M. Kawaguchi, S. Kuroda and Y. Muramatsu, J. Phys. Chem.
Solids, 2008, 69, 1171–1178.25 H. Zhang, H. Yan, X. Zhang, M. J. Reece, J. Liu, Z. Shen,
Y. Kan and P. Wang, Mater. Sci. Eng., A, 2008, 475, 92–95.26 J. Eichler and C. Lesniak, J. Eur. Ceram. Soc., 2008, 28, 1105–
1109.27 D. L. Cai, Z. H. Yang, X. M. Duan, B. Liang, Q. Li, D. C. Jia and
Y. Zhou, Mater. Sci. Eng., A, 2015, 633, 194–199.28 M. Engler, C. Lesniak, R. Damasch, B. Ruisinger and
J. Eichler, Ceram. Forum Int., 2007, 84, E49–E53.29 J. Yin, X. Li, J. Zhou and W. Guo, Nano Lett., 2013, 13, 3232–
3236.30 P. Kumbhakar, A. K. Kole, C. S. Tiwary, S. Biswas, S. Vinod,
J. T. Tijerina, U. Chatterjee and P. M. Ajayan, Adv. Opt.Mater., 2015, 3, 828–835.
31 C. Y. Zhi, Y. Bando, C. C. Tang, H. Kuwahara and D. Golberg,Adv. Mater., 2009, 21, 2889–2893.
32 A. Siria, P. Poncharal, A. L. Biance, R. Fulcrand, X. Blase,S. T. Purcell and L. Bocquet, Nature, 2013, 494, 455–458.
33 X. Duan, Z. Yang, L. Chen, Z. Tian, D. Cai, Y. Wang, D. Jiaand Y. Zhou, J. Eur. Ceram. Soc., 2016, 36, 3725–3737.
34 D. Liu, J. P. Matinlinna and E. H. N. Pow, J. Adhes. Sci.Technol., 2012, 26, 1249–1265.
This journal is © The Royal Society of Chemistry 2019

Paper RSC Advances
Ope
n A
cces
s A
rtic
le. P
ublis
hed
on 1
1 D
ecem
ber
2019
. Dow
nloa
ded
on 1
2/30
/202
1 6:
50:3
5 A
M.
Thi
s ar
ticle
is li
cens
ed u
nder
a C
reat
ive
Com
mon
s A
ttrib
utio
n-N
onC
omm
erci
al 3
.0 U
npor
ted
Lic
ence
.View Article Online
35 E. K. Sichel, R. E. Miller, M. S. Abrahams and C. J. Buiocchi,Phys. Rev. B: Solid State, 1976, 13, 4607–4611.
36 A. Simpson and A. D. Stuckes, J. Phys. C: Solid State Phys.,1971, 4, 1710–1718.
37 V. L. Solozhenko, A. G. Lazarenko, J. P. Petitet andA. V. Kanaev, J. Phys. Chem. Solids, 200, 62, 1331–1334.
38 K. Watanabe, T. Taniguchi and H. Kanda, Nat. Mater., 2004,3, 404–409.
39 K. Watanabe, T. Taniguchi and H. Kanda, J. Cryst. Growth,2007, 303, 525–529.
40 T. G. Kim, H. Shin and D. W. Lim, Adv. Funct. Mater., 2012,22, 2446–2468.
41 M. Sarraf, E. Zalnezhad, A. R. Bushroa, A. M. S. Hamouda,A. R. Raeerad and B. N. Tabrizi, Ceram. Int., 2015, 41,7952–7962.
42 B. Artem and J. S. Kutikovand, ACS Biomater. Sci. Eng., 2015,1, 463–480.
43 I. Denry and J. R. Kelly, Dent. Mater., 2008, 24, 299–307.44 D. Golberg, Y. Bando, Y. Huang, T. Terao, M. Mitome,
C. Tang and C. Zhi, ACS Nano, 2010, 4, 2979–2993.45 Y. Pan, K. F. Huo, Y. M. Hu, J. J. Fu, Y. N. Lu, Z. D. Dai, Z. Hu
and Y. Chen, Small, 2005, 1, 1199–1203.46 Y. Yu, H. Chen, Y. Liu, V. S. J. Craig, C. Wang, L. H. Li and
Y. Chen, Adv. Mater. Interfaces, 2015, 2, 1400267–1400276.47 C. R. Gautam, C. S. Tiwary, S. Jose, G. Brunetto, S. Ozden,
S. Vinod, P. Raghavan, S. K. Biradar, D. S. Galvao andP. M. Ajayan, ACS Nano, 2015, 9, 12088–12095.
48 P. Fabbri, C. Piconi, E. Burresi, G. Magnani, F. Mazzanti andC. Mingazzini, Dent. Mater., 2014, 30, 138–142.
49 M. Fornabaio, P. Palmero, R. Traverso, C. Esnouf,H. Reveron, J. Chevalier and L. Montanaro, J. Eur. Ceram.Soc., 2015, 35, 4039–4049.
50 H. Reveron, M. Fornabaio, P. Palmero, T. Furderer,E. Adolfsson, V. Lughi, A. Bonifacio, V. Sergo,L. Montanaro and J. Chevalier, Acta Biomater., 2017, 48,423–432.
51 C. R. Gautam, D. Chakravarty, A. Gautam, C. S. Tiwary,C. F. Woellner, V. K. Mishra, N. Ahmad, S. Ozden, S. Jose,S. Biradar, R. Vajtai, R. Trivedi, D. S. Galvao andP. M. Ajayan, ACS Omega, 2018, 3, 6013–6021.
52 S. Pilathadka, D. Vahalova and T. Vosahlo, Prague Med. Rep.,2007, 108, 5–12.
53 J. D. Helmer and T. D. Driskell, Research on bioceramics,symposium on use of ceramics as surgical implants, ClemsonUniversity, South Carolina, USA 1969.
54 S. Ban, Japanese Dental Science Review, 2008, 44, 3–21.55 R. R. Samuel, G. Annadurai and S. R. Kumar, Drug Chem.
Toxicol., 2019, 42, 104–111.56 M. Mishra, S. Debabrat, E. Basanti, S. Swetapadma,
P. Unnikannan and D. Priyabrat, J. Nanopart. Res., 2017,19, 282–294.
57 S. A. Pappus and M. Mishra, Adv. Exp. Med. Biol., 2018, 18,311–322.
58 B. K. Barik and M. Mishra, Nanotoxicology, 2019, 13, 258–284.
59 M. Mishra and B. K. Barik, Teratogen. Test., 2018, vol. 1797,pp. 277–298.
This journal is © The Royal Society of Chemistry 2019
60 L. M. S. Ansaloni and E. M. B. De Sousa, Mater. Sci. Appl.,2013, 4, 22–28.
61 C. Kizilkaya, Y. Mulazim, M. V. Kahraman, N. K. Apohan andA. Gungor, J. Appl. Polym. Sci., 2012, 124, 706–712.
62 P. M. Sudeep, S. Vinod, S. Ozden, R. Sruthi, A. Kukovecz,Z. Konya, R. Vajtai, M. R. Anantharaman, P. M. Ajayan andT. N. Narayanan, RSC Adv., 2015, 5, 93964–93968.
63 E. Aradi, S. R. Naidoo, D. G. Billing, D. Wamwangi,I. Motochi and T. E. Derry, Nucl. Instrum. Methods Phys.Res., Sect. B, 2014, 331, 140–143.
64 C. C. Tang, Y. Bando, Y. Huang, C. Zhi and D. Golberg, Adv.Funct. Mater., 2008, 18, 3653–3661.
65 A. Cabanas, J. A. Darr, E. Lester and M. Poliakoff, J. Mater.Chem., 2001, 11, 561–568.
66 R. V. Gorbachev, I. Riaz, R. R. Nair, R. Jalil, L. Britnell,B. D. Belle, E. W. Hill, K. S. Novoselov, K. Watanabe,T. Taniguchi, A. K. Geim and P. Blake, Small, 2011, 7, 465–468.
67 A. J. R. Bauer, ZrO2 Phase identication with Ramanspectroscopy, Application Note Raman-020, 2018, vol. A4,pp. 01–03.
68 P. Barberis, T. Merle-Mrjean and P. Quintard, J. Nucl. Mater.,1997, 246, 232–243.
69 T. Merle, R. Guinebretiere, A. Mirgorodsky and P. Quintard,Phys. Rev. B: Condens. Matter Mater. Phys., 2002, 65, 144302–144306.
70 S. Vasanthavel, B. Derby and S. Kannan, Dalton Trans., 2017,46, 6884–6893.
71 S. Vasanthavel and S. Kannan, J. Am. Ceram. Soc., 2016, 99,1212–1220.
72 R. Udaykiran, S. Vasanthavel and S. Kannan, Cryst. GrowthDes., 2015, 15, 4075–4086.
73 S. Vasanthavel and S. Kannan, J. Am. Ceram. Soc., 2014, 97,3774–3780.
74 W. W. Lei, D. Portehault, D. Liu, S. Qin and Y. Chen, Nat.Commun., 2013, 4, 1–7.
75 W. W. Lei, D. Portehault, R. Dimova andM. Antonietti, J. Am.Chem. Soc., 2011, 133, 7121–7127.
76 C. Devallencourt, J. M. Saiter, A. Fafet and E. Ubrich,Thermochim. Acta, 1995, 259, 143–151.
77 Y. Liu, Y. Wang, S. Zhou, S. Lou, L. Yuan, T. Gao, X. Wu,X. Shi and K. Wang, ACS Appl. Mater. Interfaces, 2012, 4,4913–4920.
78 R. A. Farah, M. V. Swain, B. K. Drummond, R. Cook andM. Atieh, J. Dent., 2010, 38, 50–58.
79 L. Chen, Y. H. Huang, Y. J. Wang, H. F. Shen, J. C. Rao andY. Zhou, Mater. Sci. Eng., A, 2013, 573, 106–110.
80 W. Xue, B. V. Krishna, A. Bandyopadhyay and S. Bose, ActaBiomater., 2007, 3, 1007–1018.
81 S. Bose, M. Roy and A. Bandyopadhyay, Trends Biotechnol.,2012, 30, 546–554.
82 C. R. Gautam, S. Kumar, V. K. Mishra and S. Biradar, Ceram.Int., 2017, 43, 14114–14121.
83 S. Tarafder, V. K. Balla, N. M. Davies, A. Bandyopadhyay andS. Bose, J. Tissue Eng. Regener. Med., 2013, 7, 631–641.
84 D. Chakravarty, C. S. Tiwary, C. F. Woellner,S. Radhakrishnan, S. Vinod, S. Ozden, P. A. D. Autreto,
RSC Adv., 2019, 9, 40977–40996 | 40995

RSC Advances Paper
Ope
n A
cces
s A
rtic
le. P
ublis
hed
on 1
1 D
ecem
ber
2019
. Dow
nloa
ded
on 1
2/30
/202
1 6:
50:3
5 A
M.
Thi
s ar
ticle
is li
cens
ed u
nder
a C
reat
ive
Com
mon
s A
ttrib
utio
n-N
onC
omm
erci
al 3
.0 U
npor
ted
Lic
ence
.View Article Online
S. Bhowmick, S. Asif, S. A. Mani, D. S. Galvao andP. M. Ajayan, Adv. Mater., 2016, 2, 8959–8967.
85 C. D. Nichols, J. Becnel and U. B. Pandey, J. Visualized Exp.,2012, 61, 01–05.
86 D. Sabat, A. Patnaik, B. Ekka, P. Dash andM.Mishra, Physiol.Behav., 2016, 167, 76–85.
87 S. Priyadarsini, S. K. Sahoo, S. Sahu, S. Mukherjee, G. Hotaand M. Mishra, Environ. Sci. Pollut. Res., 2019, 1–15.
88 M. Ahamed, R. Posgai, T. J. Gorey, M. Nielsen, S. M. Hussainand J. J. Rowe, Toxicol. Appl. Pharmacol., 2010, 242, 263–269.
89 E. Baeg, K. Sooklert and A. Sereemaspun, Nanomaterials,2018, 8, 824.
40996 | RSC Adv., 2019, 9, 40977–40996
90 N. A. N. Johnson, Y. Wang, Z. Zeng, G. D. Wang, Q. Yao andK. P. Chen, J. Asia-Pac. Entomol., 2019, 22, 398–403.
91 M. Mishra, D. Sabat, B. Ekka, S. Sahu, P. Unnikannan andP. Dash, J. Nano Res., 2017, 19, 282.
92 M. Telonis-Scott, A. A. Hoffmann and C. M. Sgro, Mol. Ecol.,2011, 20, 2100–2110.
93 A. Takahashi, K. Takahashi, R. Ueda and T. T. Shimizu,Genetics, 2007, 177, 1233–1237.
94 Y. Sekine, S. Takagahara, R. Hatanaka, T. Watanabe,H. Oguchi, T. Noguchi, I. Naguro, K. Kobayashi,M. Tsunoda and T. Funatsu, J. Cell Sci., 2011, 124, 3006–3016.
This journal is © The Royal Society of Chemistry 2019


![CB,HBI,HBN目錄 2019.02.27 (宏聯)¼CBI/HBI/HBN... · 4 - - Nominal flow rate [m³/h] 3 0 HQBE (HBI ) HQQE (HBN ) Number of stages x10 Mechanical Seals HBI (N) 8 , 12 8 - 1](https://static.fdocuments.net/doc/165x107/5f06dfae7e708231d41a29ed/cbhbihbnceoe-20190227-e-cbiihbiihbn-4-nominal-flow-rate.jpg)