Enhanced fluorescence signal in nonlinear microscopy ...Enhanced fluorescence signal in nonlinear...
15
Enhanced fluorescence signal in nonlinear microscopy through supplementary fiber-optic light collection by Christoph J. Engelbrecht 1,* , Werner Göbel 1,* & Fritjof Helmchen 1 1 Department of Neurophysiology, Brain Research Institute, University of Zurich, Winterthurerstrasse 190, CH-8057 Zürich, Switzerland. * Equal contributions; Corresponding author: [email protected] Abstract: Nonlinear microscopy techniques crucially rely on efficient signal detection. Here, we present a ring of large-core optical fibers for epi- collection of fluorescence photons that are not transmitted through the objective and thus normally wasted. Theoretical treatments indicated that such a supplementary fiber-optic light collection system (SUFICS) can provide an up to 4-fold signal gain. In typical in vivo imaging experiments, the fiber-ring channel was brighter than the objective channel down to 800 μm depth, thus providing a gain >2. Moreover, SUFICS reduced noise levels in calcium imaging experiments by about 23%. We recommend SUFICS as a generally applicable, effective add-on to nonlinear microscopes for enhancing fluorescence signals. 2009 Optical Society of America OCIS codes: (000.4430) Numerical approximation and analysis; (060.2300) Fiber measurements; (110.2350) Fiber optics imaging; (110.2970) Image detection systems; (110.4280) Noise in imaging systems; (170.3660) Light propagation in tissues; (180.2520) Fluorescence microscopy; (180.4315) Nonlinear microscopy; (180.5810) Scanning microscopy; (180.6900) Three-dimensional microscopy; (190.4180) Multiphoton processes; (290.1350) Backscattering References and links 1. W. R. Zipfel, R. M. Williams, and W. W. Webb, "Nonlinear magic: multiphoton microscopy in the biosciences," Nat. Biotechnol. 21, 1369-1377 (2003). 2. J. Mertz, "Nonlinear microscopy: new techniques and applications," Curr. Opin. Neurobiol. 14, 610-616 (2004). 3. W. Denk, J. H. Strickler, and W. W. Webb, "Two-photon laser scanning fluorescence microscopy," Science 248, 73-76 (1990). 4. F. Helmchen, and W. Denk, "Deep tissue two-photon microscopy," Nat. Methods 2, 932-940 (2005). 5. K. Svoboda, and R. Yasuda, "Principles of two-photon excitation microscopy and its applications to neuroscience," Neuron 50, 823-839 (2006). 6. W. Denk, D. W. Piston, and W. W. Webb, "Multi-photon molecular excitation in laser-scanning microscopy," in Handbook of Biological Confocal Microscopy, J. B. Pawley, ed. (Plenum Press, New York, 2005). 7. M. Oheim, E. Beaurepaire, E. Chaigneau, J. Mertz, and S. Charpak, "Two-photon microscopy in brain tissue: parameters influencing the imaging depth (vol 111, pg 29, 2001)," J. Neurosci. Meth. 112, 205-205 (2001). 8. E. Beaurepaire, and J. Mertz, "Epifluorescence collection in two-photon microscopy," Appl. Opt. 41, 5376- 5382 (2002). 9. H. J. Koester, D. Baur, R. Uhl, and S. W. Hell, "Ca 2+ fluorescence imaging with pico- and femtosecond two-photon excitation: signal and photodamage," Biophys. J. 77, 2226-2236 (1999). 10. Z. F. Mainen, M. Maletic-Savatic, S. H. Shi, Y. Hayashi, R. Malinow, and K. Svoboda, "Two-photon imaging in living brain slices," Methods 18, 231-239 (1999). 11. D. Vucinic, T. M. Bartol, and T. J. Sejnowski, "Hybrid reflecting objectives for functional multiphoton microscopy in turbid media," Opt. Lett. 31, 2447-2449 (2006). 12. C. A. Combs, A. V. Smirnov, J. D. Riley, A. H. Gandjbakhche, J. R. Knutson, and R. S. Balaban, "Optimization of multiphoton excitation microscopy by total emission detection using a parabolic light reflector," J. Microsc. 228, 330-337 (2007). #107537 - $15.00 USD Received 17 Feb 2009; revised 29 Mar 2009; accepted 30 Mar 2009; published 2 Apr 2009 (C) 2009 OSA 13 April 2009 / Vol. 17, No. 8 / OPTICS EXPRESS 6421
Transcript of Enhanced fluorescence signal in nonlinear microscopy ...Enhanced fluorescence signal in nonlinear...
Enhanced fluorescence signal in nonlinear microscopy through
supplementary fiber-optic light collection
by Christoph J. Engelbrecht1,*
, Werner Göbel1,*
& Fritjof Helmchen1
1 Department of Neurophysiology, Brain Research Institute, University of Zurich, Winterthurerstrasse 190, CH-8057 Zürich, Switzerland.
* Equal contributions; Corresponding author: [email protected]
Abstract: Nonlinear microscopy techniques crucially rely on efficient signal detection. Here, we present a ring of large-core optical fibers for epi-collection of fluorescence photons that are not transmitted through the objective and thus normally wasted. Theoretical treatments indicated that such a supplementary fiber-optic light collection system (SUFICS) can provide an up to 4-fold signal gain. In typical in vivo imaging experiments, the fiber-ring channel was brighter than the objective channel down to 800
µm depth, thus providing a gain >2. Moreover, SUFICS reduced noise levels in calcium imaging experiments by about 23%. We recommend SUFICS as a generally applicable, effective add-on to nonlinear microscopes for enhancing fluorescence signals.
2009 Optical Society of America
OCIS codes: (000.4430) Numerical approximation and analysis; (060.2300) Fiber measurements; (110.2350) Fiber optics imaging; (110.2970) Image detection systems; (110.4280) Noise in imaging systems; (170.3660) Light propagation in tissues; (180.2520) Fluorescence microscopy; (180.4315) Nonlinear microscopy; (180.5810) Scanning microscopy; (180.6900) Three-dimensional microscopy; (190.4180) Multiphoton processes; (290.1350) Backscattering
References and links
1. W. R. Zipfel, R. M. Williams, and W. W. Webb, "Nonlinear magic: multiphoton microscopy in the biosciences," Nat. Biotechnol. 21, 1369-1377 (2003).
2. J. Mertz, "Nonlinear microscopy: new techniques and applications," Curr. Opin. Neurobiol. 14, 610-616 (2004).
3. W. Denk, J. H. Strickler, and W. W. Webb, "Two-photon laser scanning fluorescence microscopy," Science 248, 73-76 (1990).
4. F. Helmchen, and W. Denk, "Deep tissue two-photon microscopy," Nat. Methods 2, 932-940 (2005).
5. K. Svoboda, and R. Yasuda, "Principles of two-photon excitation microscopy and its applications to neuroscience," Neuron 50, 823-839 (2006).
6. W. Denk, D. W. Piston, and W. W. Webb, "Multi-photon molecular excitation in laser-scanning microscopy," in Handbook of Biological Confocal Microscopy, J. B. Pawley, ed. (Plenum Press, New York, 2005).
7. M. Oheim, E. Beaurepaire, E. Chaigneau, J. Mertz, and S. Charpak, "Two-photon microscopy in brain tissue: parameters influencing the imaging depth (vol 111, pg 29, 2001)," J. Neurosci. Meth. 112, 205-205 (2001).
8. E. Beaurepaire, and J. Mertz, "Epifluorescence collection in two-photon microscopy," Appl. Opt. 41, 5376-5382 (2002).
9. H. J. Koester, D. Baur, R. Uhl, and S. W. Hell, "Ca2+ fluorescence imaging with pico- and femtosecond two-photon excitation: signal and photodamage," Biophys. J. 77, 2226-2236 (1999).
10. Z. F. Mainen, M. Maletic-Savatic, S. H. Shi, Y. Hayashi, R. Malinow, and K. Svoboda, "Two-photon imaging in living brain slices," Methods 18, 231-239 (1999).
11. D. Vucinic, T. M. Bartol, and T. J. Sejnowski, "Hybrid reflecting objectives for functional multiphoton microscopy in turbid media," Opt. Lett. 31, 2447-2449 (2006).
12. C. A. Combs, A. V. Smirnov, J. D. Riley, A. H. Gandjbakhche, J. R. Knutson, and R. S. Balaban, "Optimization of multiphoton excitation microscopy by total emission detection using a parabolic light reflector," J. Microsc. 228, 330-337 (2007).
#107537 - $15.00 USD Received 17 Feb 2009; revised 29 Mar 2009; accepted 30 Mar 2009; published 2 Apr 2009
(C) 2009 OSA 13 April 2009 / Vol. 17, No. 8 / OPTICS EXPRESS 6421
13. B. A. Flusberg, E. D. Cocker, W. Piyawattanametha, J. C. Jung, E. L. M. Cheung, and M. J. Schnitzer, "Fiber-optic fluorescence imaging," Nat. Methods 2, 941-950 (2005).
14. C. J. Engelbrecht, R. S. Johnston, E. J. Seibel, and F. Helmchen, "Ultra-compact fiber-optic two-photon microscope for functional fluorescence imaging in vivo," Opt. Express 16, 5556-5564 (2008).
15. W. Göbel, B. M. Kampa, and F. Helmchen, "Imaging cellular network dynamics in three dimensions using fast 3D laser scanning," Nat. Methods 4, 73-79 (2007).
16. C. Stosiek, O. Garaschuk, K. Holthoff, and A. Konnerth, "In vivo two-photon calcium imaging of neuronal networks," Proc. Natl. Acad. Sci. U.S.A. 100, 7319-7324 (2003).
17. J. N. D. Kerr, D. Greenberg, and F. Helmchen, "Imaging input and output of neocortical networks in vivo " Proc. Natl. Acad. Sci. U.S.A. 102, 14063-14068 (2005).
18. W. Göbel, and F. Helmchen, "In vivo calcium imaging of neural network function," Physiology (Bethesda) 22, 358-365 (2007).
19. L. Wang, S. L. Jacques, and L. Zheng, "MCML--Monte Carlo modeling of light transport in multi-layered tissues," Comput. Methods Programs Biomed. 47, 131-146 (1995).
20. L. G. Henyey, and J. L. Greenstein, "Diffuse radiation in the galaxy," Astrophys. J. 93, 70-83 (1941).
21. S. L. Jacques, and S. A. Prahl, "Steady-state Monte Carlo: A minimal program, "mc321.c"." (1998), http://omlc.ogi.edu/classroom/ece532/class4/ssmc/roulette.html.
22. P. Theer and W. Denk, "On the fundamental imaging-depth limit in two-photon microscopy," J. Opt. Soc. Am. A Opt. Image Sci. Vis. 23, 3139-3149 (2006).
23. A. Leray, C. Odin, and Y. Le Grand, "Out-of-focus fluorescence collection in two-photon microscopy of scattering media," Opt. Commun. 281, 6139-6144 (2008).
24. E. J. Seibel, R. S. Johnston, and C. D. Melville, "A full-color scanning fiber endoscope," Optical Fibers and Sensors for Medical Diagnostics and Treatment Applications VI. Proceedings of the SPIE. 6083, 9-16 (2006).
25. J. D. McMullen and W. Zipfel, "A Scheme for Increasing the Collection Efficiency of Multiphoton Microscopy," Biophys. J. 96, 639a-639a (2009).
26. A. Hopt and E. Neher, "Highly nonlinear photodamage in two-photon fluorescence microscopy," Biophys. J. 80, 2029-2036 (2001).
27. G. Donnert, C. Eggeling, and S. W. Hell, "Major signal increase in fluorescence microscopy through dark-state relaxation," Nat. Methods 4, 81-86 (2007).
28. N. Ji, J. C. Magee, and E. Betzig, "High-speed, low-photodamage nonlinear imaging using passive pulse splitters," Nat. Methods 5, 197-202 (2008).
29. D. Debarre, N. Olivier, and E. Beaurepaire, "Signal epidetection in third-harmonic generation microscopy of turbid media," Opt. Express 15, 8913-8924 (2007).
30. J. X. Cheng, Y. K. Jia, G. Zheng, and X. S. Xie, "Laser-scanning coherent anti-Stokes Raman scattering microscopy and applications to cell biology," Biophys. J. 83, 502-509 (2002).
31. E. W. Weisstein, "Circle-Circle Intersection," http://mathworld.wolfram.com/Circle-CircleIntersection.html.
1. Introduction
Nonlinear optical microscopy is the current gold standard for high-resolution in vivo imaging deep inside biological tissue [1, 2]. Most prominently, two-photon excited fluorescence laser-scanning microscopy (2PLSM) [3] is widely applied in the life sciences and particularly in neuroscience [4, 5]. A key advantage of nonlinear fluorescence excitation is its three-dimensional confinement to the focus of the microscope objective, resulting in a point-like, isotropically emitting fluorescence source. As a consequence, all fluorescence photons - whether scattered or not - carry useful signal information and as many of them as possible should be collected on the photodetector to maximize the signal-to-noise ratio (SNR) [6]. Several approaches have been devised to optimize fluorescence collection. First, whole-area detection in non-descanned positions [6] is used by default nowadays. Second, low-magnification, high numerical aperture (NA) objectives with large effective field-of-views are especially well suited for epi-fluorescence collection from scattering tissue [7, 8]. Third, an up to 3-fold gain in fluorescence can be achieved for tissue slices by additional fluorescence collection through a high-NA condensor in the trans-illumination pathway [9, 10]. The latter method cannot be utilized, however, for in vivo imaging experiments because photon collection from intact tissue is restricted to the 'epi'-hemisphere that is oriented towards the objective. Despite the general acknowledgment of the importance of maximizing fluorescence collection, many signal-carrying photons are still wasted in current microscope implementations. For example, in vivo imaging experiments typically require long working-
#107537 - $15.00 USD Received 17 Feb 2009; revised 29 Mar 2009; accepted 30 Mar 2009; published 2 Apr 2009
(C) 2009 OSA 13 April 2009 / Vol. 17, No. 8 / OPTICS EXPRESS 6422
distance objectives with NAobj in the range of 0.8-1.0. For such objectives and for transparent
samples, the maximum collection efficiency ηobj is only 10-17% (normalized to the full solid
angle 4π). Thus, considering epifluorescence collection only, a three- to five-fold signal gain is in principle possible. Additional photons can be collected outside of the objective. Such an ‘external detection’ scheme [6] may be realized with the help of reflective surfaces [11, 12]. Here, we demonstrate a simple alternative approach for supplementary epifluorescence collection using large-core optical fibers similar to those previously used for fluorescence collection in miniaturized fiber-optic microscopes [13, 14]. We demonstrate theoretically and experimentally that a ring-like arrangement of multiple optical fibers efficiently collects fluorescence photons, providing an extra image channel that is brighter than the image obtained through a 40x/0.8W objective. Using in vivo two-photon imaging of mouse neocortex we show that this more than 2-fold signal gain (total collected fluorescence divided by fluorescence in objective channel) is maintained throughout the cortical depths and that it improves the SNR of calcium measurements from neuronal populations.
2. Materials and methods
2.1 Optical setup
The principle of our method is to collect photons that emerge into the epi-hemisphere but outside of the collection cone of the objective. The idea is to use a set of large-core optical fibers and direct their tips towards the fluorescence source (Fig. 1(a)). We used a custom-built two-photon laser scanning microscope with a Ti:sapphire laser system (Tsunami and Millenia-X; Spectra-Physics). Laser pulses were prechirped with a pair of SF10 prisms to compensate for pulse broadening in the microscope beam path. We modulated laser intensity with a Pockel’s cell (Conoptics) and expanded beam size with a lens telescope (Thorlabs). For single-fiber characterization we used a 10x air objective (UPlanFLN, NA 0.3; Olympus). For all other experiments we used a 40x water immersion objective (LUMPlanFl/IR, NA 0.8; Olympus). Fluorescence images were acquired with custom software written in the LabView environment (National Instruments).
Fig. 1. Supplementary epifluorescence collection through a ring of optical fibers. (a) Top: CAD-drawing of a custom fiber-ring holder placed under an objective. Bottom: Closeup view showing the ring-like arrangement of the fiber tips. Only five of eight fibers are shown. Fluorophores are 2-photon excited in the focus of an infrared laser beam (red), causing isotropic fluorescence emission (green). (b) Left: Top view of the ring-like arrangement of eight 1-mm diameter fibers. Right: Dual-channel detection in a custom 2PLSM setup. Optical fibers were bundled and placed in front of a second PMT.
#107537 - $15.00 USD Received 17 Feb 2009; revised 29 Mar 2009; accepted 30 Mar 2009; published 2 Apr 2009
(C) 2009 OSA 13 April 2009 / Vol. 17, No. 8 / OPTICS EXPRESS 6423
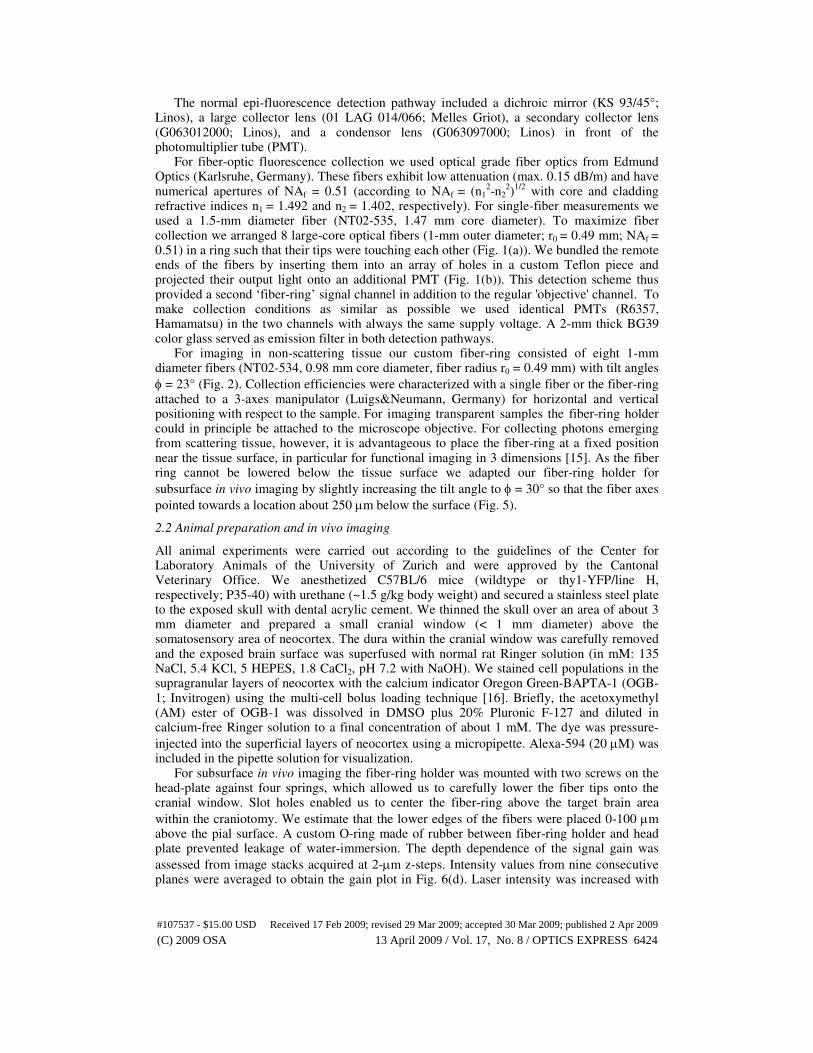
The normal epi-fluorescence detection pathway included a dichroic mirror (KS 93/45°; Linos), a large collector lens (01 LAG 014/066; Melles Griot), a secondary collector lens (G063012000; Linos), and a condensor lens (G063097000; Linos) in front of the photomultiplier tube (PMT). For fiber-optic fluorescence collection we used optical grade fiber optics from Edmund Optics (Karlsruhe, Germany). These fibers exhibit low attenuation (max. 0.15 dB/m) and have numerical apertures of NAf = 0.51 (according to NAf = (n1
2-n2
2)
1/2 with core and cladding
refractive indices n1 = 1.492 and n2 = 1.402, respectively). For single-fiber measurements we used a 1.5-mm diameter fiber (NT02-535, 1.47 mm core diameter). To maximize fiber collection we arranged 8 large-core optical fibers (1-mm outer diameter; r0 = 0.49 mm; NAf = 0.51) in a ring such that their tips were touching each other (Fig. 1(a)). We bundled the remote ends of the fibers by inserting them into an array of holes in a custom Teflon piece and projected their output light onto an additional PMT (Fig. 1(b)). This detection scheme thus provided a second ‘fiber-ring’ signal channel in addition to the regular 'objective' channel. To make collection conditions as similar as possible we used identical PMTs (R6357, Hamamatsu) in the two channels with always the same supply voltage. A 2-mm thick BG39 color glass served as emission filter in both detection pathways. For imaging in non-scattering tissue our custom fiber-ring consisted of eight 1-mm diameter fibers (NT02-534, 0.98 mm core diameter, fiber radius r0 = 0.49 mm) with tilt angles
φ = 23° (Fig. 2). Collection efficiencies were characterized with a single fiber or the fiber-ring attached to a 3-axes manipulator (Luigs&Neumann, Germany) for horizontal and vertical positioning with respect to the sample. For imaging transparent samples the fiber-ring holder could in principle be attached to the microscope objective. For collecting photons emerging from scattering tissue, however, it is advantageous to place the fiber-ring at a fixed position near the tissue surface, in particular for functional imaging in 3 dimensions [15]. As the fiber ring cannot be lowered below the tissue surface we adapted our fiber-ring holder for
subsurface in vivo imaging by slightly increasing the tilt angle to φ = 30° so that the fiber axes
pointed towards a location about 250 µm below the surface (Fig. 5).
2.2 Animal preparation and in vivo imaging
All animal experiments were carried out according to the guidelines of the Center for Laboratory Animals of the University of Zurich and were approved by the Cantonal Veterinary Office. We anesthetized C57BL/6 mice (wildtype or thy1-YFP/line H, respectively; P35-40) with urethane (~1.5 g/kg body weight) and secured a stainless steel plate to the exposed skull with dental acrylic cement. We thinned the skull over an area of about 3 mm diameter and prepared a small cranial window (< 1 mm diameter) above the somatosensory area of neocortex. The dura within the cranial window was carefully removed and the exposed brain surface was superfused with normal rat Ringer solution (in mM: 135 NaCl, 5.4 KCl, 5 HEPES, 1.8 CaCl2, pH 7.2 with NaOH). We stained cell populations in the supragranular layers of neocortex with the calcium indicator Oregon Green-BAPTA-1 (OGB-1; Invitrogen) using the multi-cell bolus loading technique [16]. Briefly, the acetoxymethyl (AM) ester of OGB-1 was dissolved in DMSO plus 20% Pluronic F-127 and diluted in calcium-free Ringer solution to a final concentration of about 1 mM. The dye was pressure-
injected into the superficial layers of neocortex using a micropipette. Alexa-594 (20 µM) was included in the pipette solution for visualization. For subsurface in vivo imaging the fiber-ring holder was mounted with two screws on the head-plate against four springs, which allowed us to carefully lower the fiber tips onto the cranial window. Slot holes enabled us to center the fiber-ring above the target brain area
within the craniotomy. We estimate that the lower edges of the fibers were placed 0-100 µm above the pial surface. A custom O-ring made of rubber between fiber-ring holder and head plate prevented leakage of water-immersion. The depth dependence of the signal gain was
assessed from image stacks acquired at 2-µm z-steps. Intensity values from nine consecutive planes were averaged to obtain the gain plot in Fig. 6(d). Laser intensity was increased with
#107537 - $15.00 USD Received 17 Feb 2009; revised 29 Mar 2009; accepted 30 Mar 2009; published 2 Apr 2009
(C) 2009 OSA 13 April 2009 / Vol. 17, No. 8 / OPTICS EXPRESS 6424
depth. Movies of spontaneous calcium signals were acquired at 10.42 frames/sec (128x64 pixel; 1.5 ms per line). Fluorescence signals in individual cells were analyzed from defined regions-of-interest (ROIs) in both the objective and fiber-ring channel and, in addition, in a combined SUFICS channel that was obtained by summating the two background-corrected channels in ImageJ. To minimize contamination of cellular signals with neuropil calcium signals that reflect ongoing cortical activity [17, 18], we used small ROIs for analysis (less than half of the apparent cell diameter). Calcium signals in all channels were expressed as
relative fluorescence changes ∆F/F. Background signal was estimated from an unstained
region, typically a blood vessel lumen. The noise levels were quantified as the widths σ of
Gaussian fits to the histogram of baseline ∆F/F fluorescence. To correct for slow drifts in the fluorescence traces histograms were calculated from high-pass filtered traces (>0.5 Hz cut-off frequency).
2.3 Monte Carlo simulation of epifluorescence collection
We simulated epifluorescence collection using Monte Carlo simulations similar to previous implementations [7, 8, 19]. Fluorescence emission photons were launched isotropically from a point light-source at depth zs on the microscope’s optical axis inside a semi-infinite three-dimensional block of scattering medium mimicking nervous tissue. The photons then followed a random walk trajectory through the tissue eventually reaching the surface of the tissue block. A scattering event took place every scattering length ls. Scattering lengths were
drawn from an exponential distribution with an average value of ls = 75 µm. Scattering zenith angles were drawn from a Henyey-Greenstein distribution [20] with anisotropy factors g = 0.70, 0.85, 0.90, or 0.95. Azimuth angles were drawn from a uniform distribution between 0
and 2π. Typical absorption lengths of la = 1 cm were assumed. For computational reasons, we limited random walks to 1x10
5 scattering events. Photons were assigned an initial intrinsic
weight. Depending on the tissue albedo A = µs/(µs+µa) with µs = 1/ls and µa = 1/la, photons lost some of this weight with every scattering event and underwent a roulette game once they dropped below a certain weight-threshold. Total photon energy was properly conserved [21]. Two sets of simulations for different depths zS were run assuming the tissue surface to be perfectly smooth (exit angles unchanged), or perfectly rough (exit angles randomized) [8]. After reaching the surface, we tested whether photons hit the objective or any of the fibers. Moreover, we checked for obedience of the NA-related acceptance angle criterion. For the objective, we adjusted the acceptance angle with surface position preserving collecting power [8]. Refractive index mismatches at the surface were not considered. The following optical parameters were used for the simulations in Fig. 5: NAobj = 0.8; objective working distance = 3.3 mm; objective front aperture diameter = 5.5 mm; objective field-of-view diameter = 0.6
mm; NAf = 0.51; fiber radius r0 = 0.49 mm; fiber tilt angle φ = 30º. A typical simulation involved launching 10-100k photons at 15-65 z-planes and took between 5 minutes without scattering and 14 hours for scattering tissue. Simulations were run in parallel on all 4 CPU-cores of an Intel Core 2 Quad (2.4 GHz) desktop PC running Microsoft Windows XP and MATLAB.
3. Theory and experimental results
3.1 Theory of fiber-optic light collection
To understand the properties of a supplementary fiber-optic light collection system we first analyzed fluorescence collection through a single large-core fiber theoretically and experimentally. For any optical detection system two factors determine the collection efficiency: (1) the fraction of photons that reaches the entrance pupil and (2) the fraction of these photons that is actually accepted by the system. The first factor is given by the solid angle of the entrance area of the detection system with respect to the position of the fluorescence source. The second factor depends on the maximum acceptance angle of the system, which is related to its numerical aperture, as well as on source position. In the following we derive an analytical expression for the dependence of fiber-collection efficiency
#107537 - $15.00 USD Received 17 Feb 2009; revised 29 Mar 2009; accepted 30 Mar 2009; published 2 Apr 2009
(C) 2009 OSA 13 April 2009 / Vol. 17, No. 8 / OPTICS EXPRESS 6425
ηf on source position for transparent (non-scattering) medium. Coupling or transmission losses are neglected. The physical dimensions of the objective are typically larger than the size of the accepted light cone at the front lens as given by the numerical aperture (ensuring high-NA imaging over a certain field-of-view). In our configuration the point-like fluorescence source is excited through the same objective; therefore it will always be at focal distance and within the field-
of-view so that the solid angle ΩNA,obj, defined by the half-opening angle αobj =
arcsin(NAobj/n), is the only limiting factor (Fig. 2(a); n being the refractive index of the
immersion medium). The light collection efficiency of an objective (normalized to 4π) is thus given by
( )obj
objNA
obj απ
η cos12
1
4
, −=Ω
= (1)
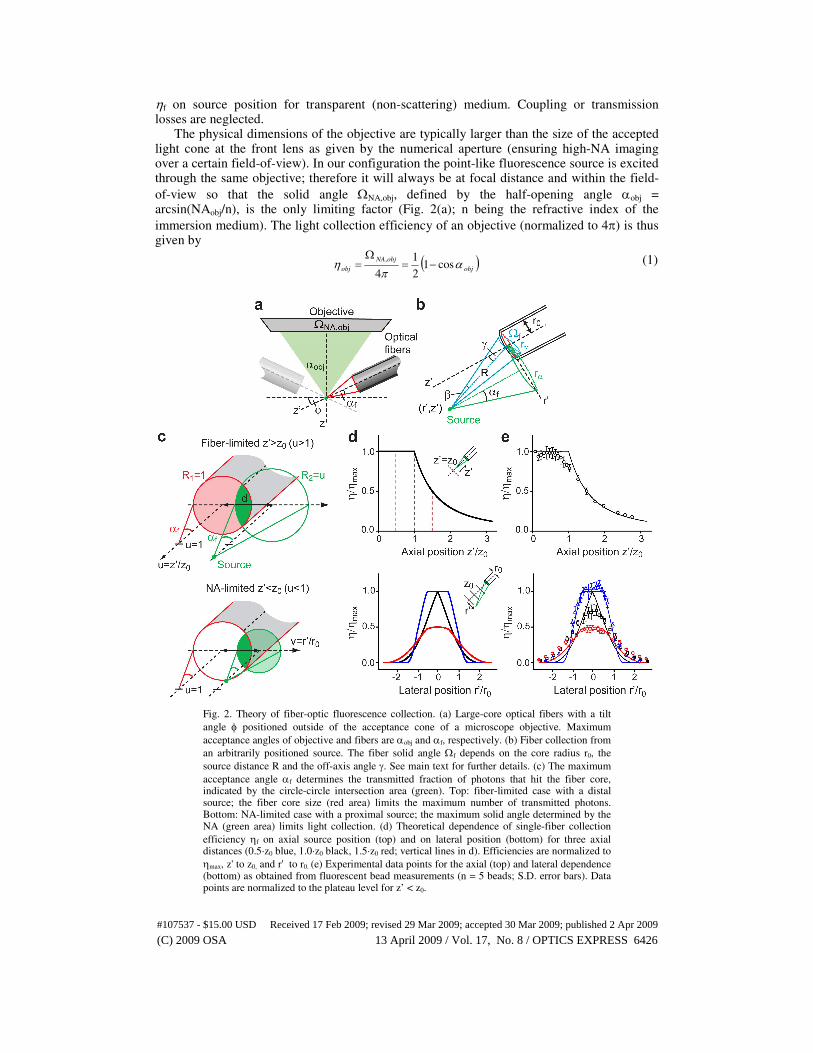
Fig. 2. Theory of fiber-optic fluorescence collection. (a) Large-core optical fibers with a tilt
angle φ positioned outside of the acceptance cone of a microscope objective. Maximum
acceptance angles of objective and fibers are αobj and αf, respectively. (b) Fiber collection from
an arbitrarily positioned source. The fiber solid angle Ωf depends on the core radius r0, the
source distance R and the off-axis angle γ. See main text for further details. (c) The maximum
acceptance angle αf determines the transmitted fraction of photons that hit the fiber core, indicated by the circle-circle intersection area (green). Top: fiber-limited case with a distal source; the fiber core size (red area) limits the maximum number of transmitted photons. Bottom: NA-limited case with a proximal source; the maximum solid angle determined by the NA (green area) limits light collection. (d) Theoretical dependence of single-fiber collection
efficiency ηf on axial source position (top) and on lateral position (bottom) for three axial distances (0.5·z0 blue, 1.0·z0 black, 1.5·z0 red; vertical lines in d). Efficiencies are normalized to
ηmax, z' to z0, and r' to r0. (e) Experimental data points for the axial (top) and lateral dependence (bottom) as obtained from fluorescent bead measurements (n = 5 beads; S.D. error bars). Data points are normalized to the plateau level for z’ < z0.
#107537 - $15.00 USD Received 17 Feb 2009; revised 29 Mar 2009; accepted 30 Mar 2009; published 2 Apr 2009
(C) 2009 OSA 13 April 2009 / Vol. 17, No. 8 / OPTICS EXPRESS 6426
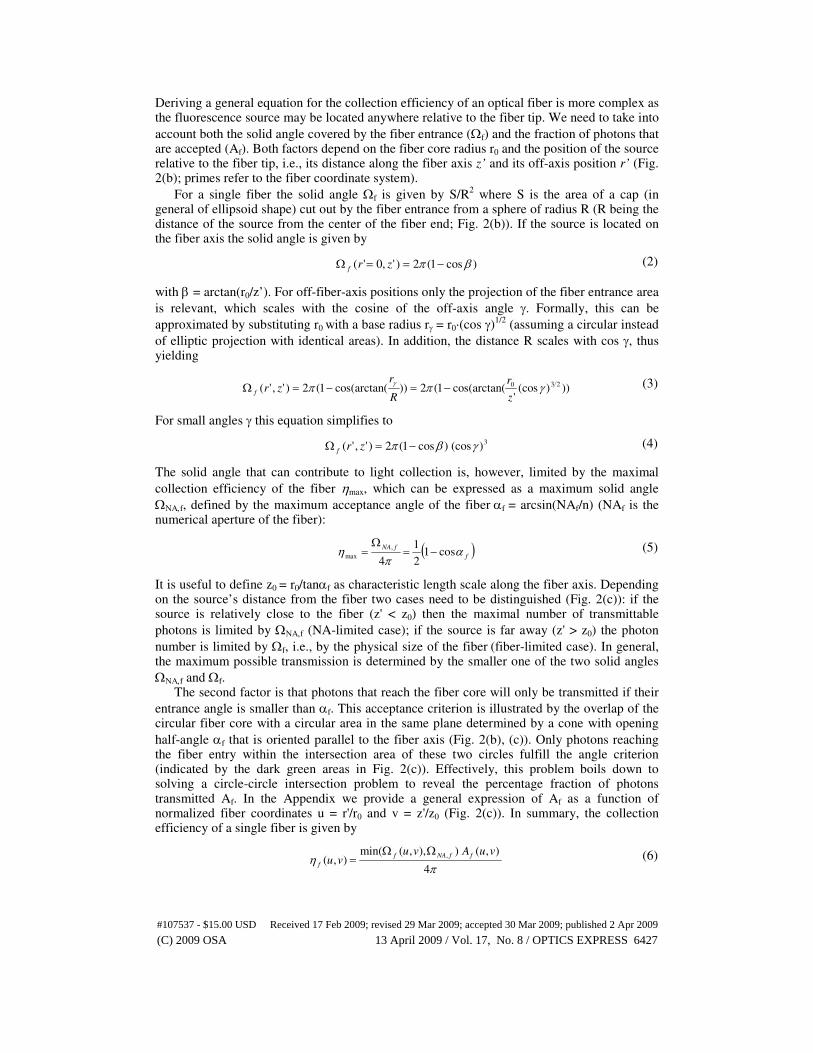
Deriving a general equation for the collection efficiency of an optical fiber is more complex as the fluorescence source may be located anywhere relative to the fiber tip. We need to take into
account both the solid angle covered by the fiber entrance (Ωf) and the fraction of photons that are accepted (Af). Both factors depend on the fiber core radius r0 and the position of the source relative to the fiber tip, i.e., its distance along the fiber axis z’ and its off-axis position r’ (Fig. 2(b); primes refer to the fiber coordinate system).
For a single fiber the solid angle Ωf is given by S/R2 where S is the area of a cap (in
general of ellipsoid shape) cut out by the fiber entrance from a sphere of radius R (R being the distance of the source from the center of the fiber end; Fig. 2(b)). If the source is located on the fiber axis the solid angle is given by
)cos1(2)',0'( βπ −==Ω zrf (2)
with β = arctan(r0/z’). For off-fiber-axis positions only the projection of the fiber entrance area
is relevant, which scales with the cosine of the off-axis angle γ. Formally, this can be
approximated by substituting r0 with a base radius rγ = r0·(cos γ)1/2
(assuming a circular instead
of elliptic projection with identical areas). In addition, the distance R scales with cos γ, thus yielding
)))(cos'
(cos(arctan1(2))(cos(arctan1(2)','( 230 γππ γ
z
r
R
rzrf −=−=Ω (3)
For small angles γ this equation simplifies to
3)(cos)cos1(2)','( γβπ −=Ω zrf (4)
The solid angle that can contribute to light collection is, however, limited by the maximal
collection efficiency of the fiber ηmax, which can be expressed as a maximum solid angle
ΩΝΑ,f, defined by the maximum acceptance angle of the fiber αf = arcsin(NAf/n) (NAf is the numerical aperture of the fiber):
( )f
fNA απ
η cos12
1
4
,
max −=Ω
= (5)
It is useful to define z0 = r0/tanαf as characteristic length scale along the fiber axis. Depending on the source’s distance from the fiber two cases need to be distinguished (Fig. 2(c)): if the source is relatively close to the fiber (z' < z0) then the maximal number of transmittable
photons is limited by ΩΝΑ,f (NA-limited case); if the source is far away (z' > z0) the photon
number is limited by Ωf, i.e., by the physical size of the fiber (fiber-limited case). In general, the maximum possible transmission is determined by the smaller one of the two solid angles
ΩΝΑ,f and Ωf. The second factor is that photons that reach the fiber core will only be transmitted if their
entrance angle is smaller than αf. This acceptance criterion is illustrated by the overlap of the circular fiber core with a circular area in the same plane determined by a cone with opening
half-angle αf that is oriented parallel to the fiber axis (Fig. 2(b), (c)). Only photons reaching the fiber entry within the intersection area of these two circles fulfill the angle criterion (indicated by the dark green areas in Fig. 2(c)). Effectively, this problem boils down to solving a circle-circle intersection problem to reveal the percentage fraction of photons transmitted Af. In the Appendix we provide a general expression of Af as a function of normalized fiber coordinates u = r'/r0 and v = z'/z0 (Fig. 2(c)). In summary, the collection efficiency of a single fiber is given by
π
η4
),()),,(min(),(
, vuAvuvu
ffNAf
f
ΩΩ= (6)
#107537 - $15.00 USD Received 17 Feb 2009; revised 29 Mar 2009; accepted 30 Mar 2009; published 2 Apr 2009
(C) 2009 OSA 13 April 2009 / Vol. 17, No. 8 / OPTICS EXPRESS 6427
3.2 Measurement of fiber collection efficiency
To verify equation 6 experimentally we measured fluorescence collection through a single
large-core fiber using two-photon excitation of fluorescent beads. We embedded 1-µm fluorescent beads in a block of agar that was placed on a microscope slide. We then excited fluorescent beads located at the edge of the agar block with the two-photon microscope (10x/0.3 air objective) and collected fluorescence light through the fiber in air. We systematically varied axial and off-axis position of the bead relative to the fiber end. For comparison with the analytical theory we normalized detected photocurrents to the maximum current, which was reached for short distances (z’ < z0) on the fiber axis. In addition, we
normalized the radial and axial distances to r0 and z0, respectively. Collection efficiency ηf decreased for large axial distances as well as for lateral displacements (Fig. 2(d), (e)). Experimental data agreed well with the theoretical predictions except for a “soft edge” around z’ = z0, the characteristic length of the fiber. These results highlight the importance of the exact position and orientation of the fiber relative to the fluorescence source in order to achieve maximum collection efficiency. In particular, it is crucial to position the fiber end at a distance of about the characteristic length or closer to the source.
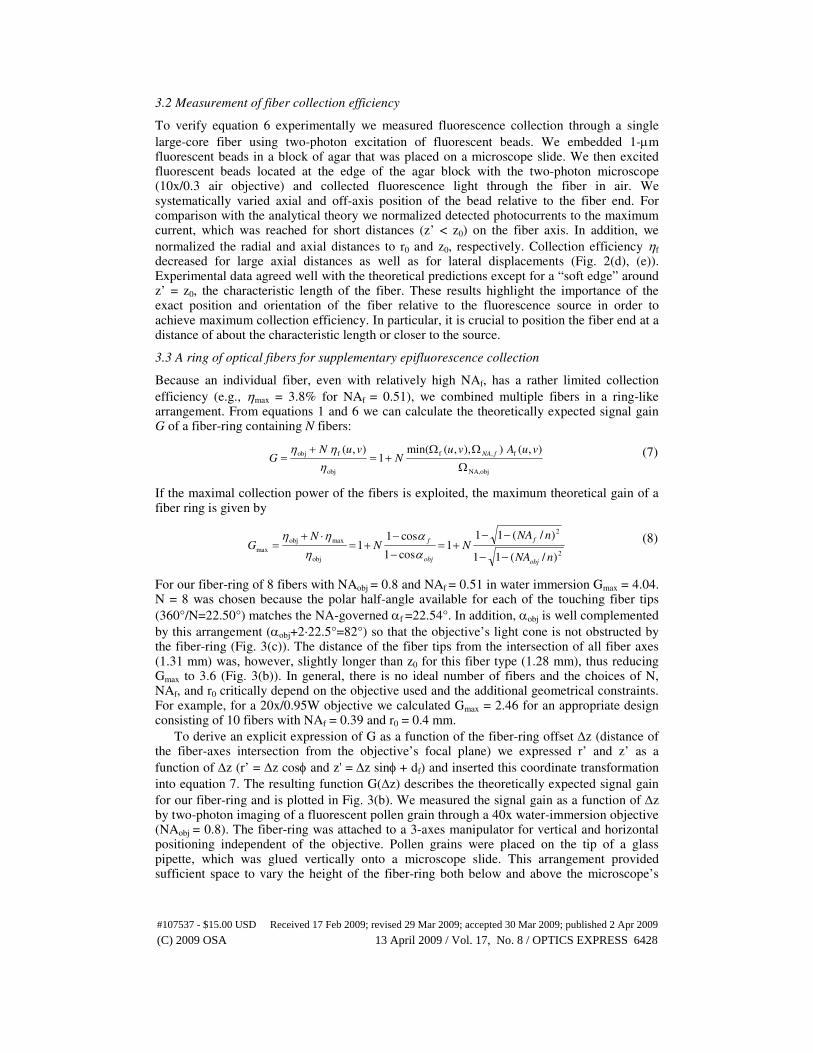
3.3 A ring of optical fibers for supplementary epifluorescence collection
Because an individual fiber, even with relatively high NAf, has a rather limited collection
efficiency (e.g., ηmax = 3.8% for NAf = 0.51), we combined multiple fibers in a ring-like arrangement. From equations 1 and 6 we can calculate the theoretically expected signal gain G of a fiber-ring containing N fibers:
objNA,
f,f
obj
fobj ),()),,(min(1
),(
Ω
ΩΩ+=
+=
vuAvuN
vuNG
fNA
η
ηη (7)
If the maximal collection power of the fibers is exploited, the maximum theoretical gain of a fiber ring is given by
2
2
obj
maxobj
max
)/(11
)/(111
cos1
cos11
nNA
nNANN
NG
obj
f
obj
f
−−
−−+=
−
−+=
⋅+=
α
α
η
ηη (8)
For our fiber-ring of 8 fibers with NAobj = 0.8 and NAf = 0.51 in water immersion Gmax = 4.04. N = 8 was chosen because the polar half-angle available for each of the touching fiber tips
(360°/N=22.50°) matches the NA-governed αf =22.54°. In addition, αobj is well complemented
by this arrangement (αobj+2·22.5°=82°) so that the objective’s light cone is not obstructed by the fiber-ring (Fig. 3(c)). The distance of the fiber tips from the intersection of all fiber axes (1.31 mm) was, however, slightly longer than z0 for this fiber type (1.28 mm), thus reducing Gmax to 3.6 (Fig. 3(b)). In general, there is no ideal number of fibers and the choices of N, NAf, and r0 critically depend on the objective used and the additional geometrical constraints. For example, for a 20x/0.95W objective we calculated Gmax = 2.46 for an appropriate design consisting of 10 fibers with NAf = 0.39 and r0 = 0.4 mm.
To derive an explicit expression of G as a function of the fiber-ring offset ∆z (distance of the fiber-axes intersection from the objective’s focal plane) we expressed r’ and z’ as a
function of ∆z (r’ = ∆z cosφ and z' = ∆z sinφ + df) and inserted this coordinate transformation
into equation 7. The resulting function G(∆z) describes the theoretically expected signal gain
for our fiber-ring and is plotted in Fig. 3(b). We measured the signal gain as a function of ∆z by two-photon imaging of a fluorescent pollen grain through a 40x water-immersion objective (NAobj = 0.8). The fiber-ring was attached to a 3-axes manipulator for vertical and horizontal positioning independent of the objective. Pollen grains were placed on the tip of a glass pipette, which was glued vertically onto a microscope slide. This arrangement provided sufficient space to vary the height of the fiber-ring both below and above the microscope’s
#107537 - $15.00 USD Received 17 Feb 2009; revised 29 Mar 2009; accepted 30 Mar 2009; published 2 Apr 2009
(C) 2009 OSA 13 April 2009 / Vol. 17, No. 8 / OPTICS EXPRESS 6428
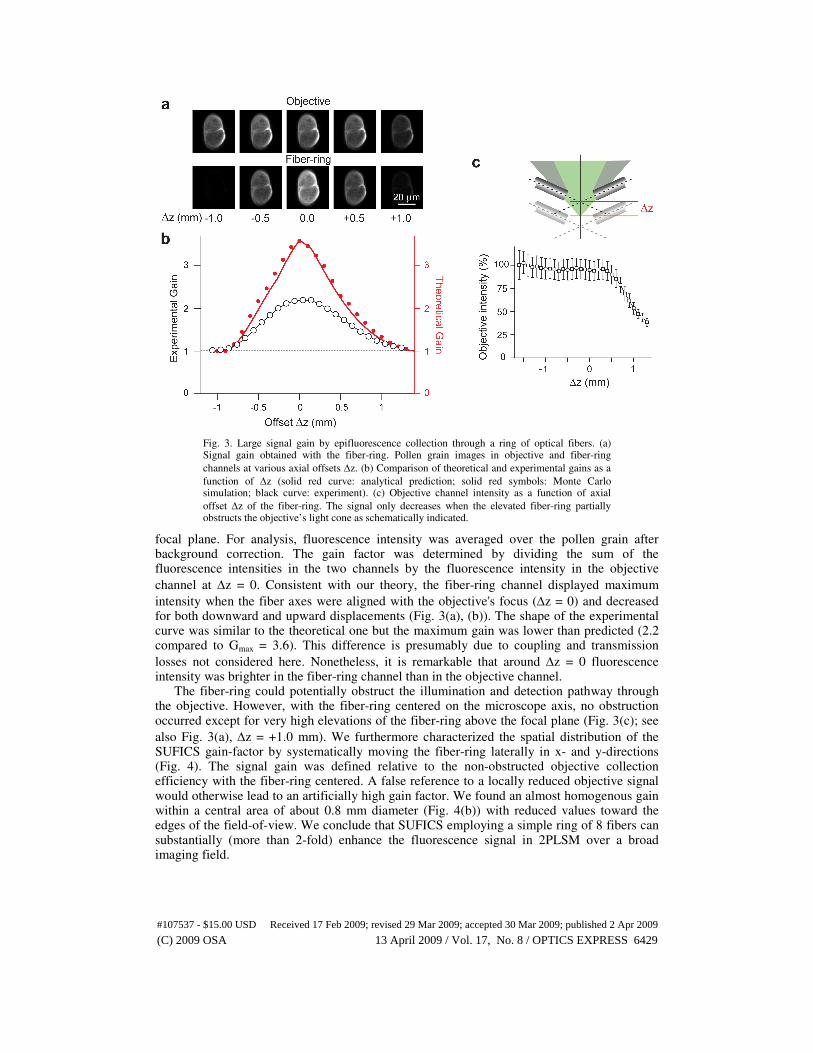
Fig. 3. Large signal gain by epifluorescence collection through a ring of optical fibers. (a) Signal gain obtained with the fiber-ring. Pollen grain images in objective and fiber-ring
channels at various axial offsets ∆z. (b) Comparison of theoretical and experimental gains as a
function of ∆z (solid red curve: analytical prediction; solid red symbols: Monte Carlo simulation; black curve: experiment). (c) Objective channel intensity as a function of axial
offset ∆z of the fiber-ring. The signal only decreases when the elevated fiber-ring partially obstructs the objective’s light cone as schematically indicated.
focal plane. For analysis, fluorescence intensity was averaged over the pollen grain after background correction. The gain factor was determined by dividing the sum of the fluorescence intensities in the two channels by the fluorescence intensity in the objective
channel at ∆z = 0. Consistent with our theory, the fiber-ring channel displayed maximum
intensity when the fiber axes were aligned with the objective's focus (∆z = 0) and decreased for both downward and upward displacements (Fig. 3(a), (b)). The shape of the experimental curve was similar to the theoretical one but the maximum gain was lower than predicted (2.2 compared to Gmax = 3.6). This difference is presumably due to coupling and transmission
losses not considered here. Nonetheless, it is remarkable that around ∆z = 0 fluorescence intensity was brighter in the fiber-ring channel than in the objective channel. The fiber-ring could potentially obstruct the illumination and detection pathway through the objective. However, with the fiber-ring centered on the microscope axis, no obstruction occurred except for very high elevations of the fiber-ring above the focal plane (Fig. 3(c); see
also Fig. 3(a), ∆z = +1.0 mm). We furthermore characterized the spatial distribution of the SUFICS gain-factor by systematically moving the fiber-ring laterally in x- and y-directions (Fig. 4). The signal gain was defined relative to the non-obstructed objective collection efficiency with the fiber-ring centered. A false reference to a locally reduced objective signal would otherwise lead to an artificially high gain factor. We found an almost homogenous gain within a central area of about 0.8 mm diameter (Fig. 4(b)) with reduced values toward the edges of the field-of-view. We conclude that SUFICS employing a simple ring of 8 fibers can substantially (more than 2-fold) enhance the fluorescence signal in 2PLSM over a broad imaging field.
#107537 - $15.00 USD Received 17 Feb 2009; revised 29 Mar 2009; accepted 30 Mar 2009; published 2 Apr 2009
(C) 2009 OSA 13 April 2009 / Vol. 17, No. 8 / OPTICS EXPRESS 6429
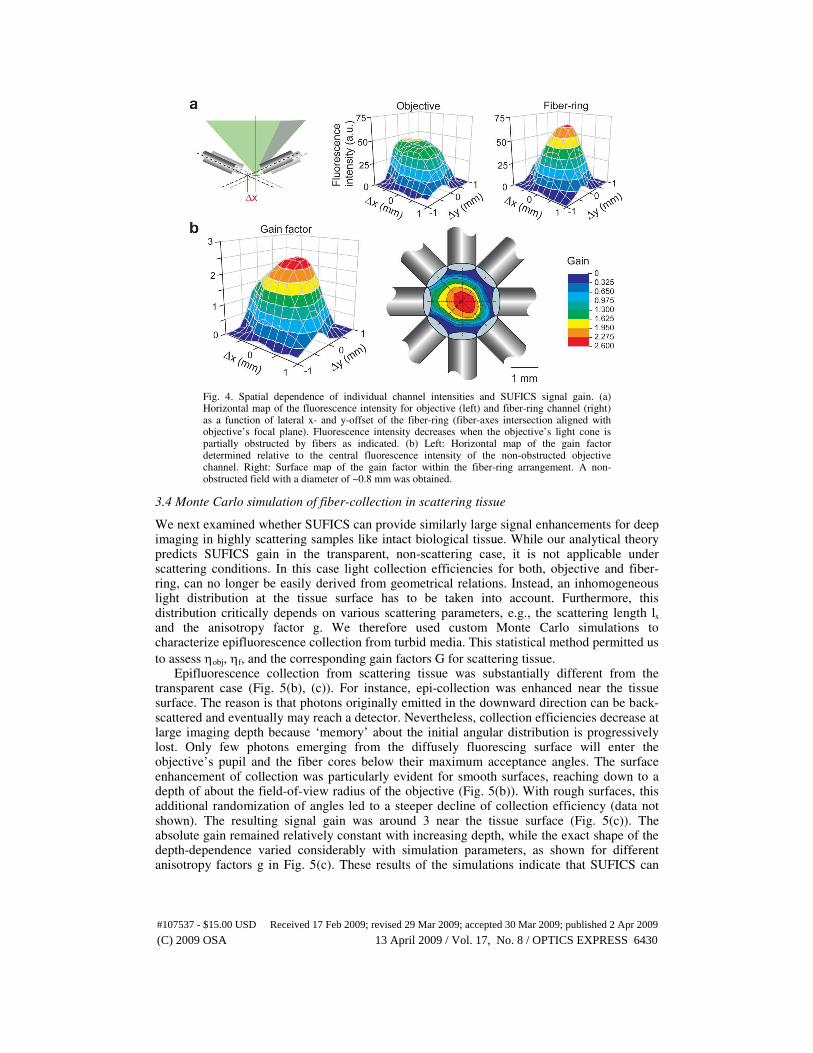
Fig. 4. Spatial dependence of individual channel intensities and SUFICS signal gain. (a) Horizontal map of the fluorescence intensity for objective (left) and fiber-ring channel (right) as a function of lateral x- and y-offset of the fiber-ring (fiber-axes intersection aligned with objective’s focal plane). Fluorescence intensity decreases when the objective’s light cone is partially obstructed by fibers as indicated. (b) Left: Horizontal map of the gain factor determined relative to the central fluorescence intensity of the non-obstructed objective channel. Right: Surface map of the gain factor within the fiber-ring arrangement. A non-obstructed field with a diameter of ~0.8 mm was obtained.
3.4 Monte Carlo simulation of fiber-collection in scattering tissue
We next examined whether SUFICS can provide similarly large signal enhancements for deep imaging in highly scattering samples like intact biological tissue. While our analytical theory predicts SUFICS gain in the transparent, non-scattering case, it is not applicable under scattering conditions. In this case light collection efficiencies for both, objective and fiber-ring, can no longer be easily derived from geometrical relations. Instead, an inhomogeneous light distribution at the tissue surface has to be taken into account. Furthermore, this distribution critically depends on various scattering parameters, e.g., the scattering length ls and the anisotropy factor g. We therefore used custom Monte Carlo simulations to characterize epifluorescence collection from turbid media. This statistical method permitted us
to assess ηobj, ηf, and the corresponding gain factors G for scattering tissue. Epifluorescence collection from scattering tissue was substantially different from the transparent case (Fig. 5(b), (c)). For instance, epi-collection was enhanced near the tissue surface. The reason is that photons originally emitted in the downward direction can be back-scattered and eventually may reach a detector. Nevertheless, collection efficiencies decrease at large imaging depth because ‘memory’ about the initial angular distribution is progressively lost. Only few photons emerging from the diffusely fluorescing surface will enter the objective’s pupil and the fiber cores below their maximum acceptance angles. The surface enhancement of collection was particularly evident for smooth surfaces, reaching down to a depth of about the field-of-view radius of the objective (Fig. 5(b)). With rough surfaces, this additional randomization of angles led to a steeper decline of collection efficiency (data not shown). The resulting signal gain was around 3 near the tissue surface (Fig. 5(c)). The absolute gain remained relatively constant with increasing depth, while the exact shape of the depth-dependence varied considerably with simulation parameters, as shown for different anisotropy factors g in Fig. 5(c). These results of the simulations indicate that SUFICS can
#107537 - $15.00 USD Received 17 Feb 2009; revised 29 Mar 2009; accepted 30 Mar 2009; published 2 Apr 2009
(C) 2009 OSA 13 April 2009 / Vol. 17, No. 8 / OPTICS EXPRESS 6430
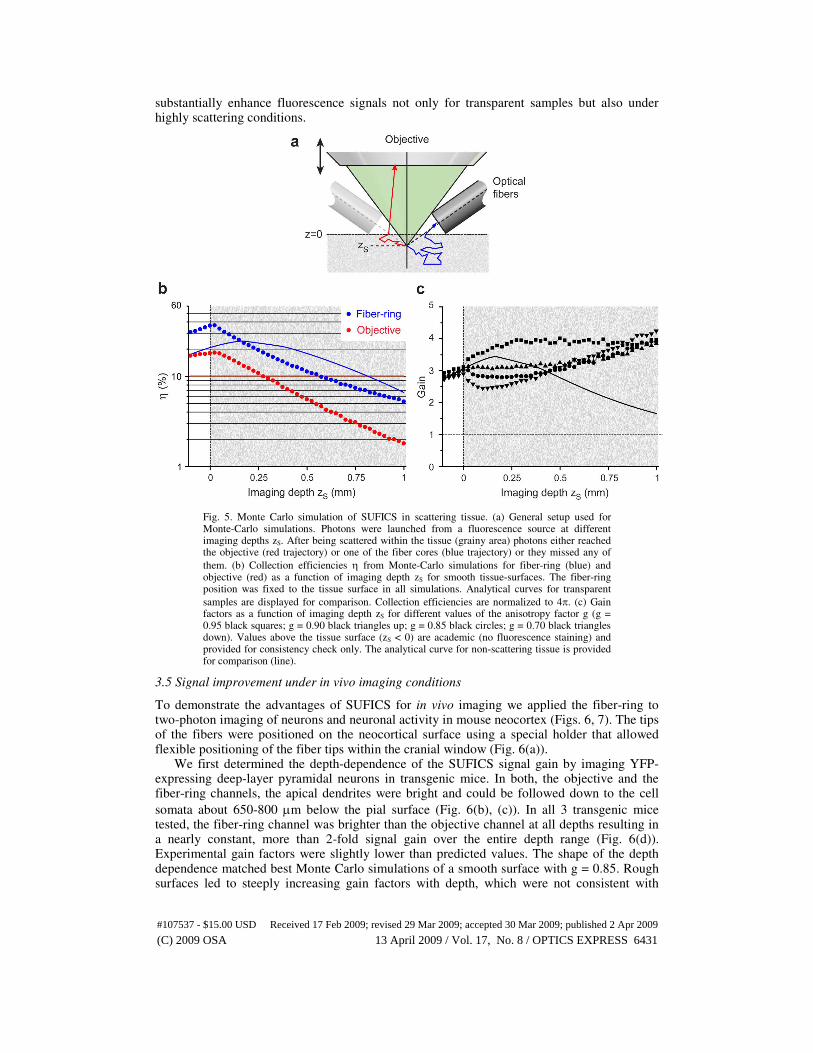
substantially enhance fluorescence signals not only for transparent samples but also under highly scattering conditions.
Fig. 5. Monte Carlo simulation of SUFICS in scattering tissue. (a) General setup used for Monte-Carlo simulations. Photons were launched from a fluorescence source at different imaging depths zS. After being scattered within the tissue (grainy area) photons either reached the objective (red trajectory) or one of the fiber cores (blue trajectory) or they missed any of
them. (b) Collection efficiencies η from Monte-Carlo simulations for fiber-ring (blue) and objective (red) as a function of imaging depth zS for smooth tissue-surfaces. The fiber-ring position was fixed to the tissue surface in all simulations. Analytical curves for transparent
samples are displayed for comparison. Collection efficiencies are normalized to 4π. (c) Gain factors as a function of imaging depth zS for different values of the anisotropy factor g (g = 0.95 black squares; g = 0.90 black triangles up; g = 0.85 black circles; g = 0.70 black triangles down). Values above the tissue surface (zS < 0) are academic (no fluorescence staining) and provided for consistency check only. The analytical curve for non-scattering tissue is provided for comparison (line).
3.5 Signal improvement under in vivo imaging conditions
To demonstrate the advantages of SUFICS for in vivo imaging we applied the fiber-ring to two-photon imaging of neurons and neuronal activity in mouse neocortex (Figs. 6, 7). The tips of the fibers were positioned on the neocortical surface using a special holder that allowed flexible positioning of the fiber tips within the cranial window (Fig. 6(a)). We first determined the depth-dependence of the SUFICS signal gain by imaging YFP-expressing deep-layer pyramidal neurons in transgenic mice. In both, the objective and the fiber-ring channels, the apical dendrites were bright and could be followed down to the cell
somata about 650-800 µm below the pial surface (Fig. 6(b), (c)). In all 3 transgenic mice tested, the fiber-ring channel was brighter than the objective channel at all depths resulting in a nearly constant, more than 2-fold signal gain over the entire depth range (Fig. 6(d)). Experimental gain factors were slightly lower than predicted values. The shape of the depth dependence matched best Monte Carlo simulations of a smooth surface with g = 0.85. Rough surfaces led to steeply increasing gain factors with depth, which were not consistent with
#107537 - $15.00 USD Received 17 Feb 2009; revised 29 Mar 2009; accepted 30 Mar 2009; published 2 Apr 2009
(C) 2009 OSA 13 April 2009 / Vol. 17, No. 8 / OPTICS EXPRESS 6431
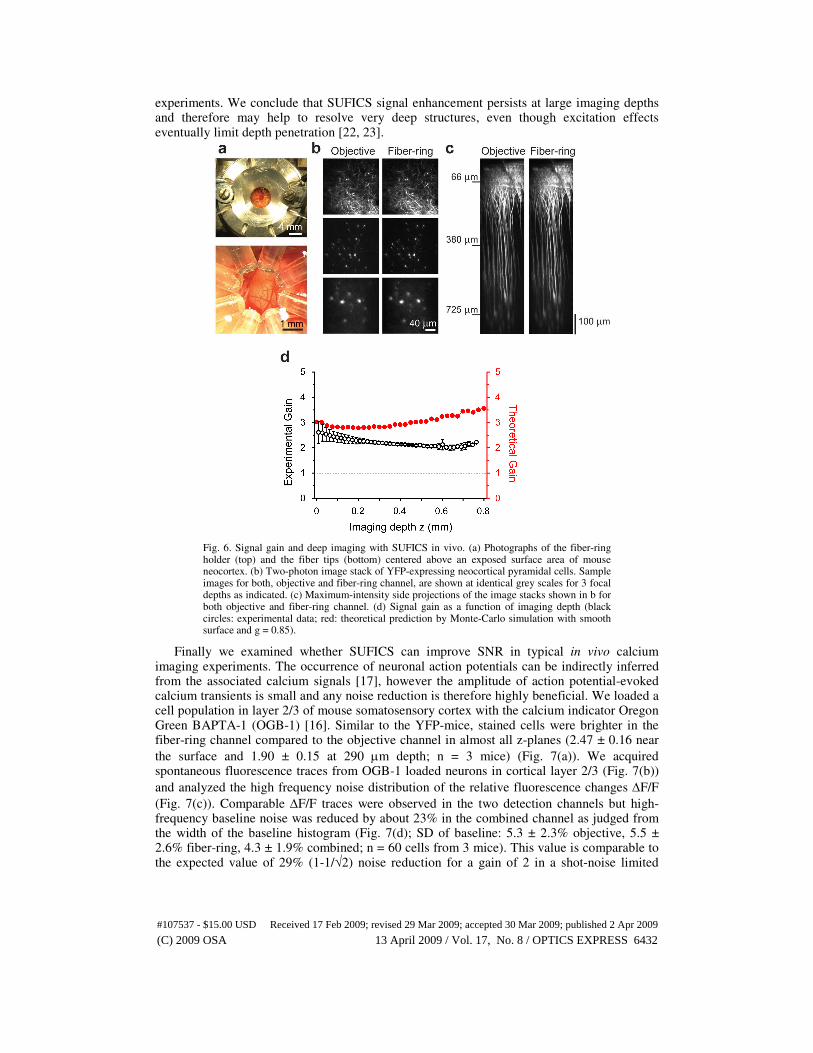
experiments. We conclude that SUFICS signal enhancement persists at large imaging depths and therefore may help to resolve very deep structures, even though excitation effects eventually limit depth penetration [22, 23].
Fig. 6. Signal gain and deep imaging with SUFICS in vivo. (a) Photographs of the fiber-ring holder (top) and the fiber tips (bottom) centered above an exposed surface area of mouse neocortex. (b) Two-photon image stack of YFP-expressing neocortical pyramidal cells. Sample images for both, objective and fiber-ring channel, are shown at identical grey scales for 3 focal depths as indicated. (c) Maximum-intensity side projections of the image stacks shown in b for both objective and fiber-ring channel. (d) Signal gain as a function of imaging depth (black circles: experimental data; red: theoretical prediction by Monte-Carlo simulation with smooth surface and g = 0.85).
Finally we examined whether SUFICS can improve SNR in typical in vivo calcium imaging experiments. The occurrence of neuronal action potentials can be indirectly inferred from the associated calcium signals [17], however the amplitude of action potential-evoked calcium transients is small and any noise reduction is therefore highly beneficial. We loaded a cell population in layer 2/3 of mouse somatosensory cortex with the calcium indicator Oregon Green BAPTA-1 (OGB-1) [16]. Similar to the YFP-mice, stained cells were brighter in the fiber-ring channel compared to the objective channel in almost all z-planes (2.47 ± 0.16 near
the surface and 1.90 ± 0.15 at 290 µm depth; n = 3 mice) (Fig. 7(a)). We acquired spontaneous fluorescence traces from OGB-1 loaded neurons in cortical layer 2/3 (Fig. 7(b))
and analyzed the high frequency noise distribution of the relative fluorescence changes ∆F/F
(Fig. 7(c)). Comparable ∆F/F traces were observed in the two detection channels but high-frequency baseline noise was reduced by about 23% in the combined channel as judged from the width of the baseline histogram (Fig. 7(d); SD of baseline: 5.3 ± 2.3% objective, 5.5 ± 2.6% fiber-ring, 4.3 ± 1.9% combined; n = 60 cells from 3 mice). This value is comparable to the expected value of 29% (1-1/√2) noise reduction for a gain of 2 in a shot-noise limited
#107537 - $15.00 USD Received 17 Feb 2009; revised 29 Mar 2009; accepted 30 Mar 2009; published 2 Apr 2009
(C) 2009 OSA 13 April 2009 / Vol. 17, No. 8 / OPTICS EXPRESS 6432
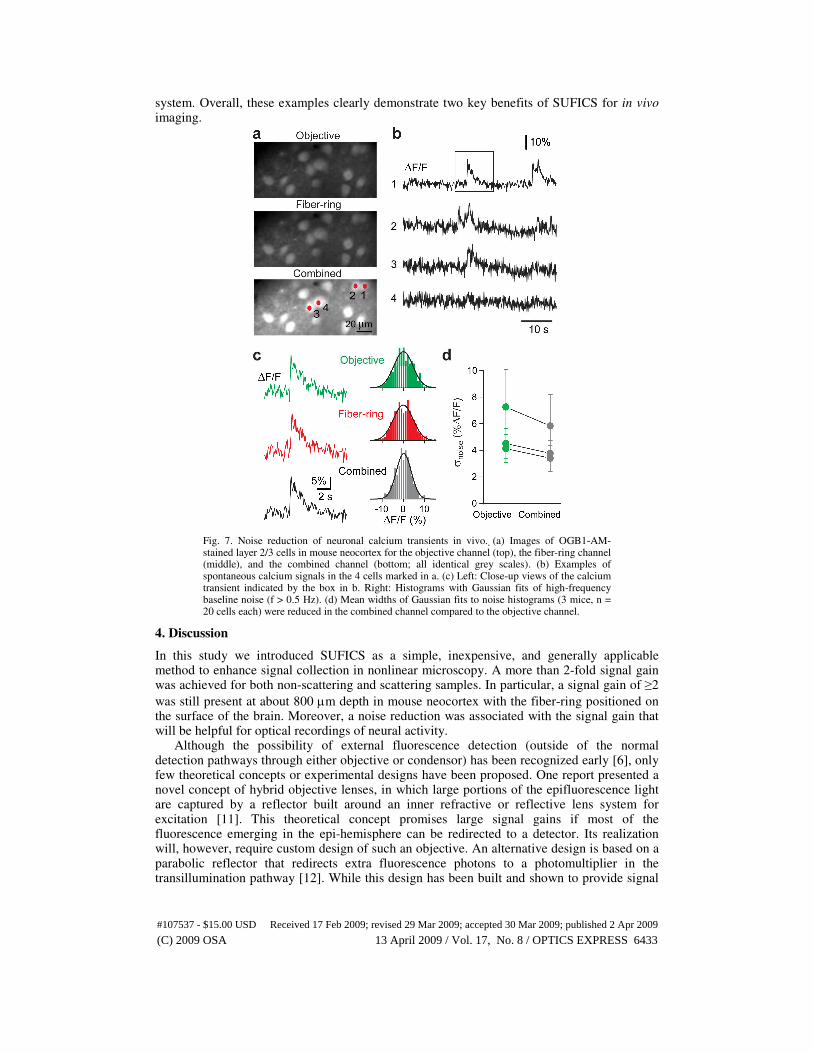
system. Overall, these examples clearly demonstrate two key benefits of SUFICS for in vivo imaging.
Fig. 7. Noise reduction of neuronal calcium transients in vivo. (a) Images of OGB1-AM-stained layer 2/3 cells in mouse neocortex for the objective channel (top), the fiber-ring channel (middle), and the combined channel (bottom; all identical grey scales). (b) Examples of spontaneous calcium signals in the 4 cells marked in a. (c) Left: Close-up views of the calcium transient indicated by the box in b. Right: Histograms with Gaussian fits of high-frequency baseline noise (f > 0.5 Hz). (d) Mean widths of Gaussian fits to noise histograms (3 mice, n = 20 cells each) were reduced in the combined channel compared to the objective channel.
4. Discussion
In this study we introduced SUFICS as a simple, inexpensive, and generally applicable method to enhance signal collection in nonlinear microscopy. A more than 2-fold signal gain was achieved for both non-scattering and scattering samples. In particular, a signal gain of ≥2
was still present at about 800 µm depth in mouse neocortex with the fiber-ring positioned on the surface of the brain. Moreover, a noise reduction was associated with the signal gain that will be helpful for optical recordings of neural activity. Although the possibility of external fluorescence detection (outside of the normal detection pathways through either objective or condensor) has been recognized early [6], only few theoretical concepts or experimental designs have been proposed. One report presented a novel concept of hybrid objective lenses, in which large portions of the epifluorescence light are captured by a reflector built around an inner refractive or reflective lens system for excitation [11]. This theoretical concept promises large signal gains if most of the fluorescence emerging in the epi-hemisphere can be redirected to a detector. Its realization will, however, require custom design of such an objective. An alternative design is based on a parabolic reflector that redirects extra fluorescence photons to a photomultiplier in the transillumination pathway [12]. While this design has been built and shown to provide signal
#107537 - $15.00 USD Received 17 Feb 2009; revised 29 Mar 2009; accepted 30 Mar 2009; published 2 Apr 2009
(C) 2009 OSA 13 April 2009 / Vol. 17, No. 8 / OPTICS EXPRESS 6433
enhancement, its current form is solely applicable to extracted tissue, e.g., brain slices. Unlike SUFICS, it cannot be used for in vivo imaging. SUFICS is an alternative fiber-optic approach that is easy to implement as an add-on to existing microscope setups, at least doubling the microscope’s fluorescence collection efficiency. Besides the fiber-holder that should be designed to allow easy positioning, only one extra PMT is necessary. In principle, it is also possible to project the output of the fiber-bundle onto the same PMT that receives the fluorescence collected by the objective, which might be beneficial in terms of further minimizing detector noise. SUFICS is furthermore compatible with in vivo electrophysiology because omitting a single fiber would provide sufficient space for the insertion of a pipette electrode. With our 8-fiber ring we achieved a 2-3-fold signal enhancement. Similar to a recent study [12], the gain factor was lower than the theoretically calculated value, most probably due to unconsidered coupling and transmission losses. Although we attempted to make conditions in the two detection pathways as equal as possible, we cannot fully exclude slight differences in transmission losses due to aperture effects and surface reflections. In practice, it is advisable to maximize total detection efficiency by optimizing both channels independently. The benefits of SUFICS or other fiber collection schemes [24, 25] may still be further increased by optimization of the fiber-ring holders, by using special light guides, or by combinations of large-core fibers with different diameters covering even larger solid angles. Moreover, custom-shaped photodiode arrays arranged in a similar ring-like fashion may enable comparable gain factors. Enhancing signal detection in 2PLSM is significant for multiple reasons: first, sensitivity for detecting dim objects is increased; second, lower excitation power can be used to obtain sufficiently bright signal intensities which reduces photodamage and phototoxicity [9, 26]; and third, SNRs are improved, e.g., for dynamic measurements. Here, we found that SUFICS provides signal enhancement even at large depths, which may help to enable imaging experiments in deeper cortical layers [4]. SUFICS may also be combined with proposed schemes for optimization of fluorescence excitation, either in terms of fluorescence yield [27] or in terms of reducing photobleaching and photodamage [28]. SUFICS may help to either compensate for signal losses associated with special excitation modes or to further reduce the excitation intensity necessary to achieve a certain signal level. Finally, SUFICS is applicable to and may prove highly beneficial for other nonlinear imaging modalities such as second- or third-harmonic generation microscopy [2, 29] and coherent anti-Stokes Raman scattering microscopy [30]. Enhanced fluorescence collection by SUFICS will also help to gain signal in miniaturized nonlinear microscopes [13, 14]. Overall, we envision numerous applications of SUFICS in many research fields.
5. Appendix
The problem of calculating the fraction of the photons that hit the fiber core entrance and that are also accepted and transmitted, reduces to a circle-circle intersection problem (Fig. 2(c)). For two circles with radii R1 and R2 that are laterally offset by a distance d the intersection area A is given by [31]
−+−−−
−++
−+
=
)))(()((2
1
2arccos
2arccos
Re),,(
2
1
2
2
2
2
2
1
2
2
1
2
2
22
2
1
2
2
2
1
22
1
21
RdRdRR
dR
RRdR
dR
RRdR
dRRA (9)
Here, we apply this equation to obtain a general expression for the percentage fraction Af of transmitted photons as a function the position of the fluorescence source relative to the fiber tip. The two relevant circular areas are (1) the fiber core with radius r0 and (2) a circle in the same plane as the fiber entrance defined by the light cone emerging from the source that
contains photon trajectories with angles below the maximum acceptance angle αf of the fiber (Fig. 2(c)). The center point of the second circle is defined by the off-axis shift r’ of the light
source and its radius given by rα = z’ tan(αf). As the problem is fully defined by the two fiber
#107537 - $15.00 USD Received 17 Feb 2009; revised 29 Mar 2009; accepted 30 Mar 2009; published 2 Apr 2009
(C) 2009 OSA 13 April 2009 / Vol. 17, No. 8 / OPTICS EXPRESS 6434
parameters r0 and αf, we use normalized fiber coordinates u = r'/r0 and v = z'/z0, accounting for the scalability of the problem with regard to the fiber core size and numerical aperture. We defined Af as percentage transmission with respect to the maximally possible transmission. Thus, we normalized the intersection area to the area of the smaller one of the two circles (the fiber core area in the fiber-limited case and the acceptance area in the NA-limited case). Formally, this leads to the following set of equations:
)circles of overlap partial(),1min(),1max(for
)1))(()(1(2
1
2
)1arccos
2
1arccos
Re),1min(
1),(
22
222
22
2
uuv
vuvu
vu
uvu
v
uv
uuvAf
−>
−+−−−
−++
+−
=π
(10)
circles)ofoverlapno(10),(
)circlesofoverlapfull(),1min(),1max(1),(
+>=
−≤=
uvforuvA
uuvuvA
f
f
Of special interest are the limiting cases v = 0 and u = 1. For v = 0 the axial dependence is given by Af(0,u) = 1. The radial dependence at z’ = z0 simplifies to
20)1,(
2422
arccos21
)1,( 2
>=
<=
−−
=
vvA
vvvv
vA
f
f π (11)
To calculate fiber collection efficiencies this expression for Af(u,v) was then inserted into equations 6 and 7.
Acknowledgments
We thank S. Giger and H.J. Kasper for expert technical assistance and B. Grewe for fruitful discussions. This work was supported by Swiss National Science Foundation Grant 3100A0-114624, the National Center of Competence in Research "Neural Plasticity and Repair", and a grant from the Swiss SystemsX.ch initiative, evaluated by the Swiss National Science Foundation. F.H. had the original idea for SUFICS. C.J.E. and F.H. developed the analytical theory and Monte-Carlo simulations. C.J.E. and W.G. performed the fiber collection efficiency measurements and designed and optimized the fiber rings. W.G. and F.H. performed the in vivo experiments. F.H. and C.J.E. wrote the manuscript.
#107537 - $15.00 USD Received 17 Feb 2009; revised 29 Mar 2009; accepted 30 Mar 2009; published 2 Apr 2009
(C) 2009 OSA 13 April 2009 / Vol. 17, No. 8 / OPTICS EXPRESS 6435