Enhanced insulin signaling in density-enhanced phosphatase-1 (DEP-1) k.pdf
TIM A SCHENBRENER, P.E. M A T E R I A L S A N D Q U A L I T Y A S S U R A N C E T E A M
O F F I C E O F A S S E T M A N A G E M E N T , P A V E M E N T S A N D C O N S T R U C T I O N
F H W A
A S P H A L T M I X T U R E E T G M A Y 2 , 2 0 1 7
Enhanced Durability Through Increased Density
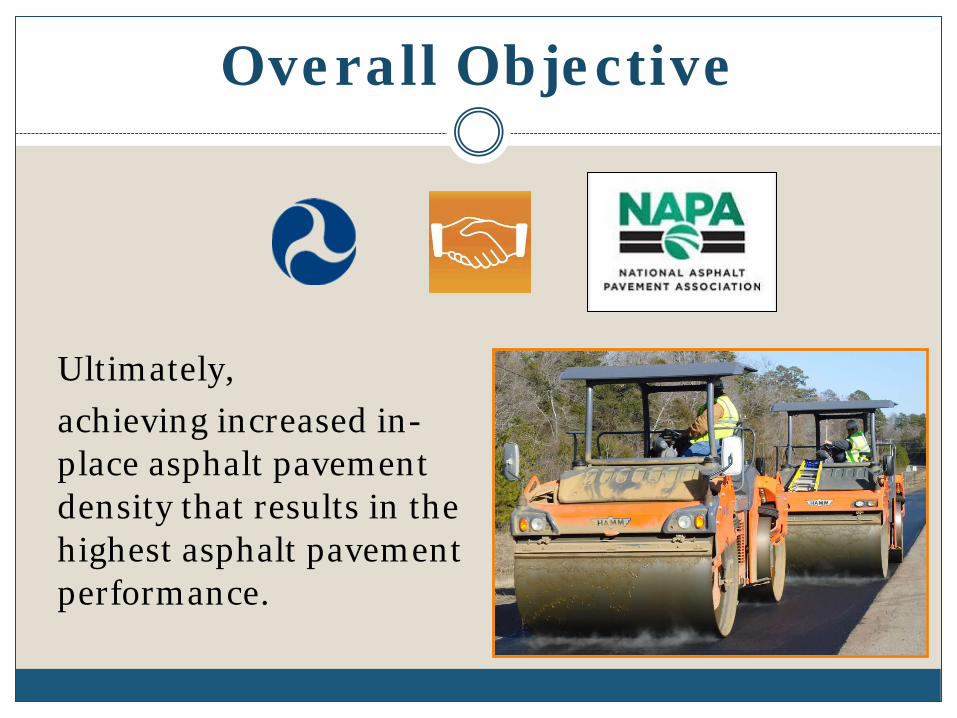
Overall Objective
Ultimately, achieving increased in-place asphalt pavement density that results in the highest asphalt pavement performance.

“A 1% decrease in air voids was estimated to: • improve fatigue
performance by 8.2 and 43.8%
• improve the rutting resistance by 7.3 to 66.3%
• extend the service life by conservatively 10%.”
NCAT Report 16-02 (2016)
http://eng.auburn.edu/research/centers/ncat/files/technical-reports/rep16-02.pdf

Project Support
• Compaction Workshop – Feedback Very Positive – Formal training – Comprehensive
• Field Projects – Pre-paving meeting attendance and advice – On-site technical advice

CA
AZ
CO
NM
TX
OK AR
LA
MO KY
AL GA
FL
VA
OH
MI
AK
MT
NV
ME
WA
OR
UT
KS
ID
WY
ND
SD
MN
NE
WI
IA
IL IN
MS
TN SC
NC
WV
PA
NY
CT NJ DE MD DC HI
Key:
PR
Demonstration projects (10)
Enhanced Durability of Asphalt Pavements through Increased In-Place
Pavement Density
Workshop Only (18)
Mobile Asphalt Testing Trailer (2)
Eastern Federal Lands
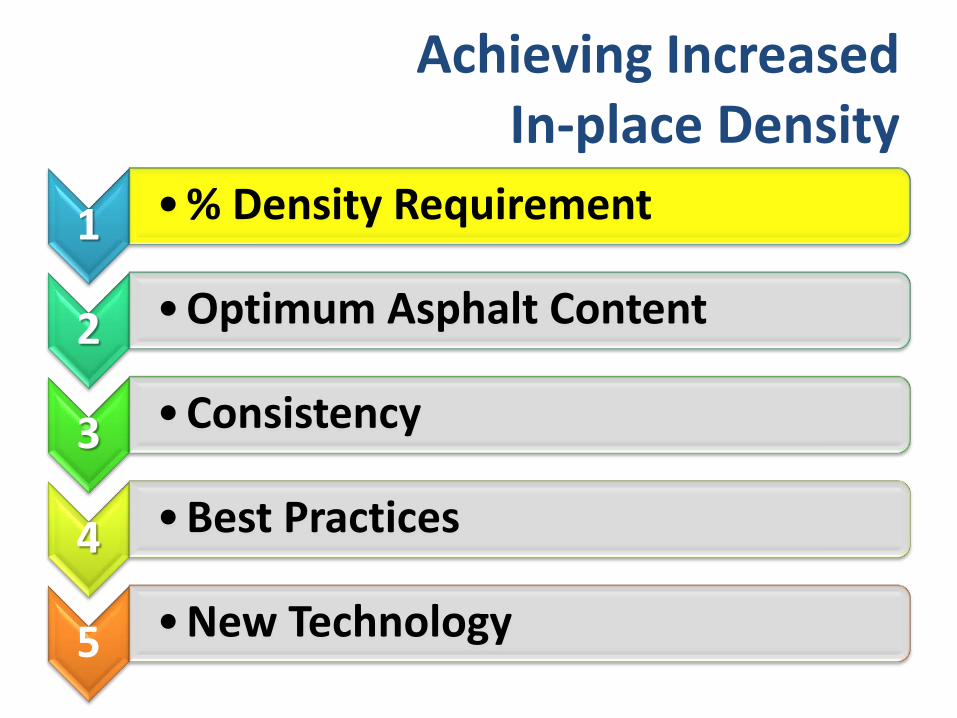
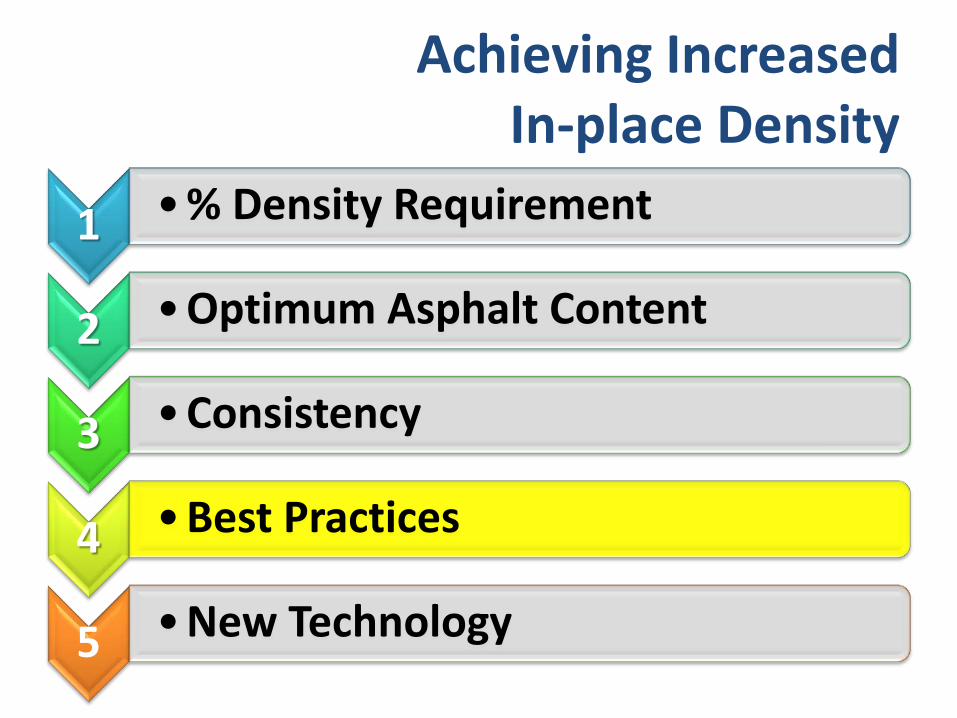
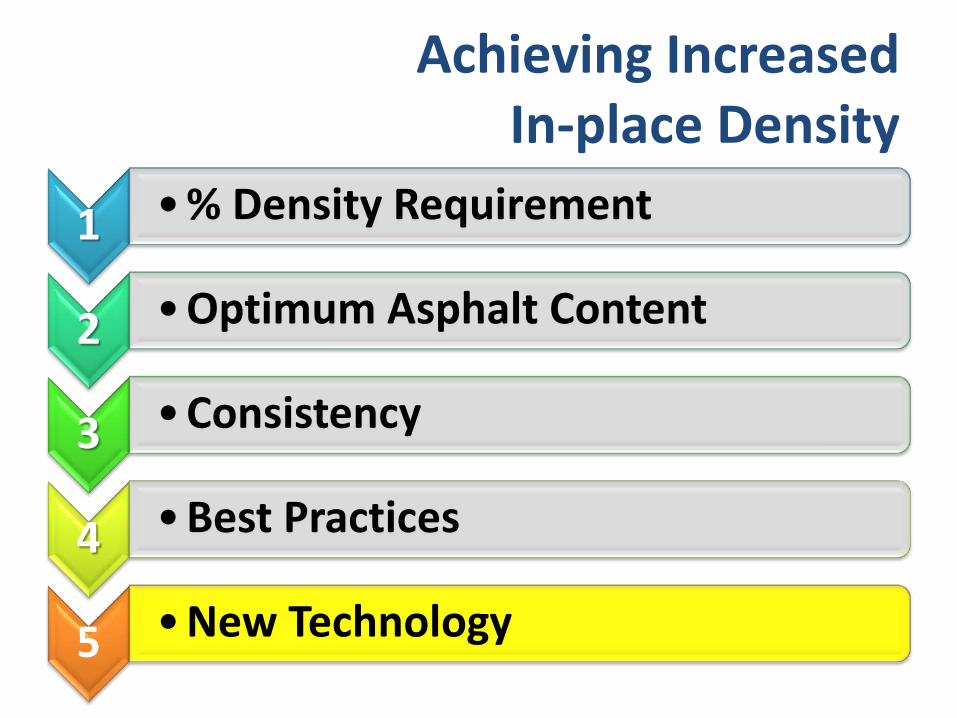
Achieving Increased In-place Density
1 • % Density Requirement
2 • Optimum Asphalt Content
3 • Consistency
4 • Best Practices
5 • New Technology
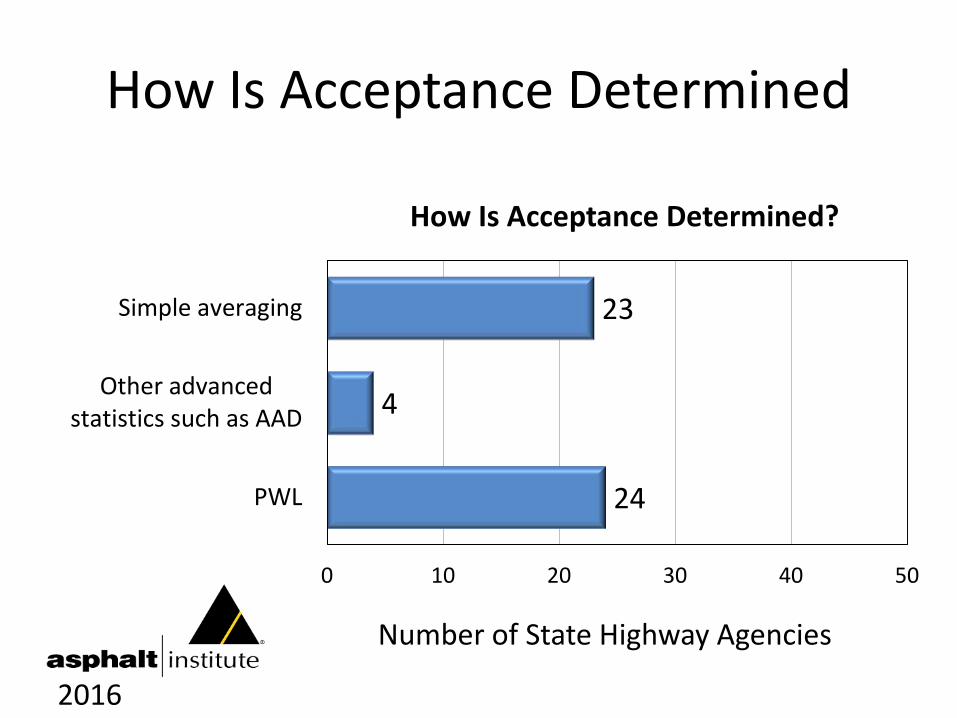
How Is Acceptance Determined
24
4
23
0 10 20 30 40 50
PWL
Other advancedstatistics such as AAD
Simple averaging
Number of State Highway Agencies
How Is Acceptance Determined?
2016

0 2
0 4
0
13
2 3 0 0 0 0
0
5
10
15
20
25
30
Number of State
Highway Agencies
Minimum Lot Average
Density (%)
2016
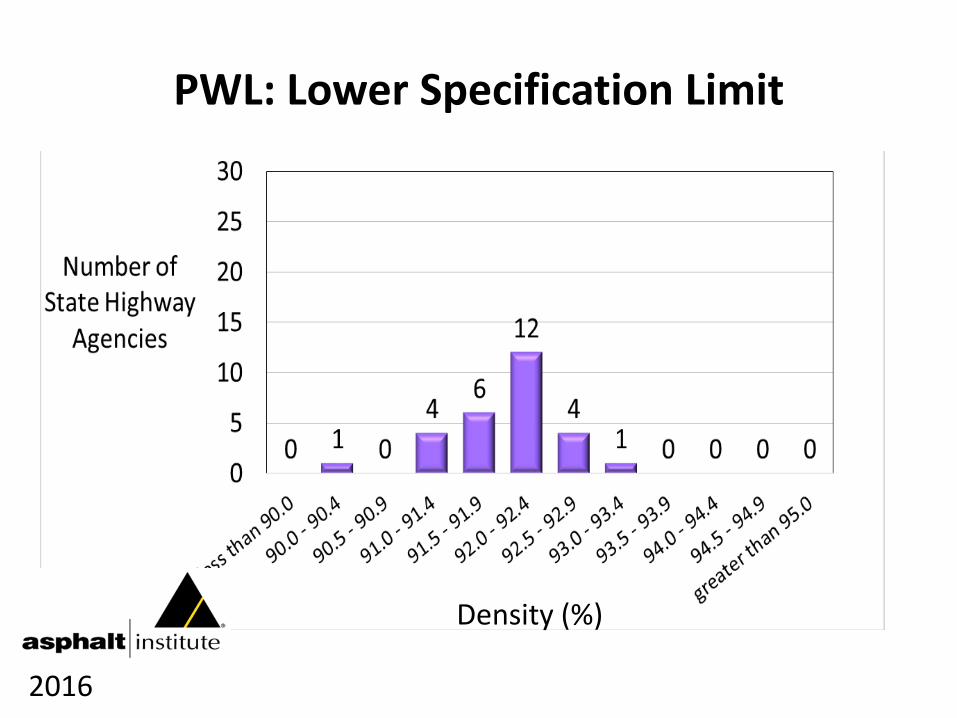
PWL: Lower Specification Limit
2016
Density (%)
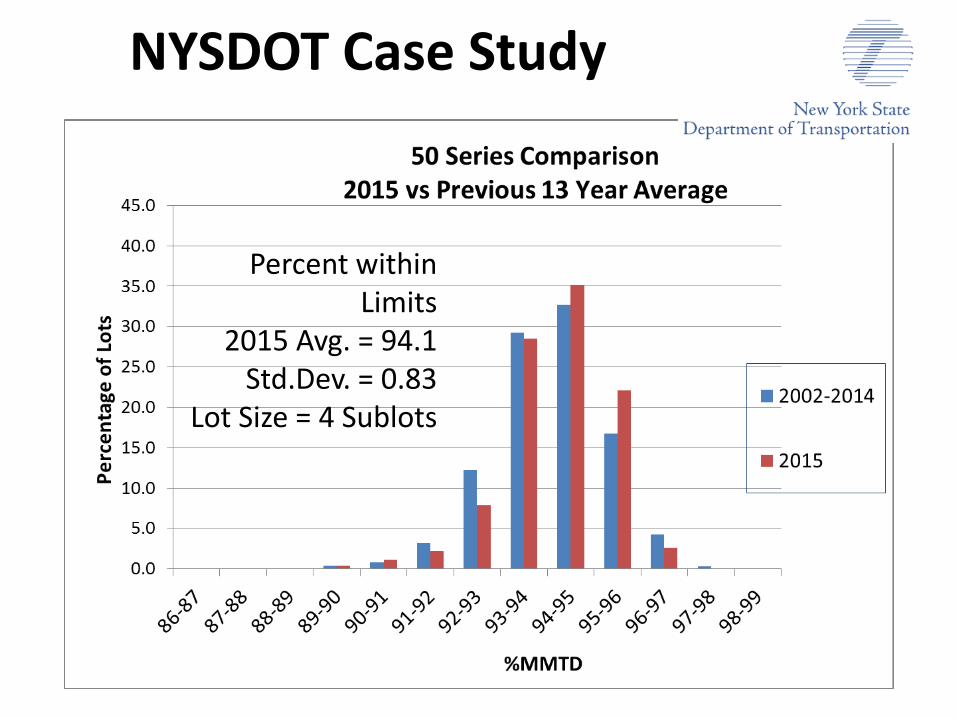
NYSDOT Case Study
Percent within Limits
2015 Avg. = 94.1 Std.Dev. = 0.83
Lot Size = 4 Sublots

Achieving Increased In-place Density
1 • % Density Requirement
2 • Optimum Asphalt Content
3 • Consistency
4 • Best Practices
5 • New Technology
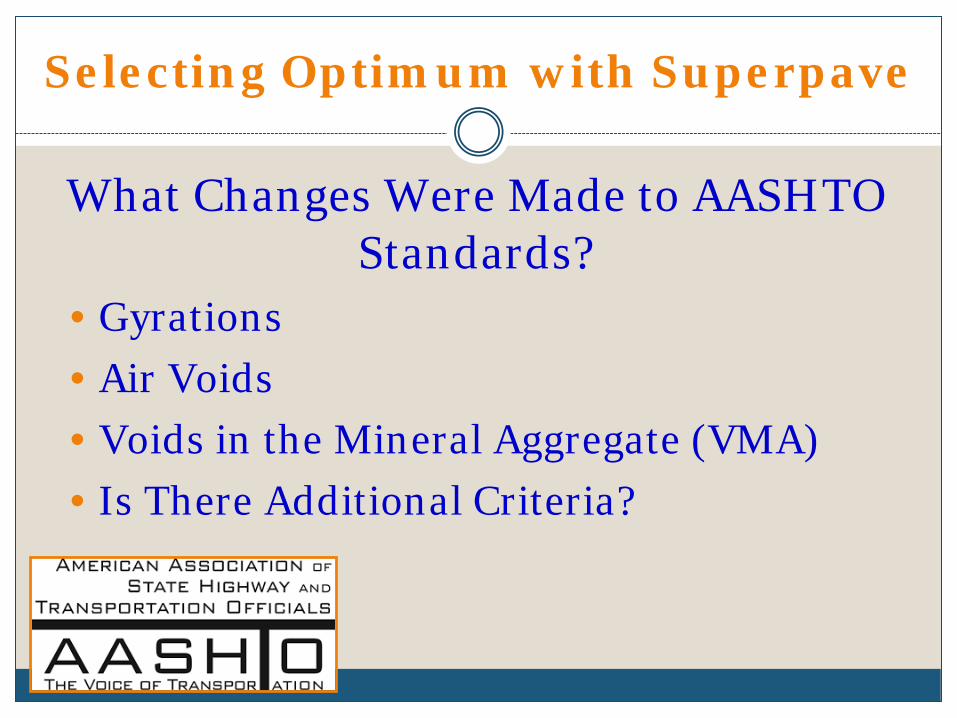
Selecting Optimum with Superpave
What Changes Were Made to AASHTO Standards?
• Gyrations • Air Voids • Voids in the Mineral Aggregate (VMA) • Is There Additional Criteria?

Asphalt Mixture Adjustments State Adjustments Additional
Asphalt
3 Gyrations (Regression) 0.3%
4 Air Voids (Regression) VMA 0.3%
9 Gyrations Air Voids VMA ≈ 0.3%
Important Note: Be sure to update minimum % density requirements
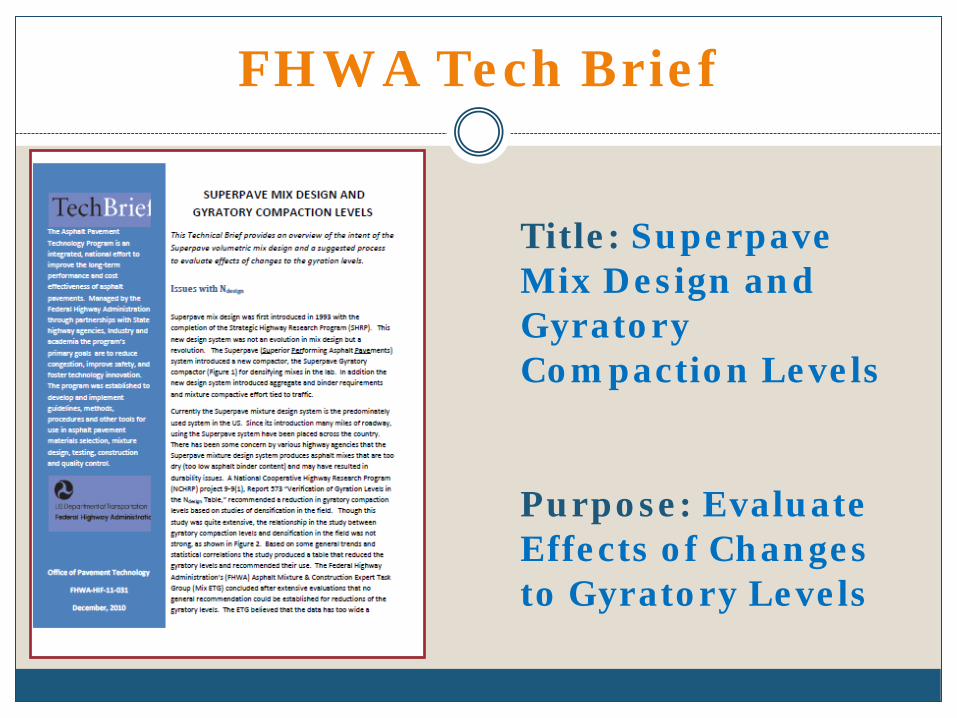
FHWA Tech Brief
Title: Superpave Mix Design and Gyratory Compaction Levels Purpose: Evaluate Effects of Changes to Gyratory Levels

Achieving Increased In-place Density
1 • % Density Requirement
2 • Optimum Asphalt Content
3 • Consistency
4 • Best Practices
5 • New Technology

Consistency is Important Standard Deviation
• State #5
– Cores with lot size = 5 sublots
– Old Spec: S.D. = 1.58 – New Spec: S.D. = 0.98
• State #6 – Nuclear from individual tests
– Control: S.D. = 1.58 – Test Section: S.D. = 0.67
• NYSDOT PWL Statewide – Cores with lot size = 4 sublots
– 2007: S.D. = 0.92 – 2015: S.D. = 0.83
Achieving Increased In-place Density
1 • % Density Requirement
2 • Optimum Asphalt Content
3 • Consistency
4 • Best Practices
5 • New Technology

Equipment Manufacturer Feedback Other Best Practices
• Roller settings • Vibration frequency vs.
roller speed • Amplitude • Vibrating screed • Mat temperature • Paver speed
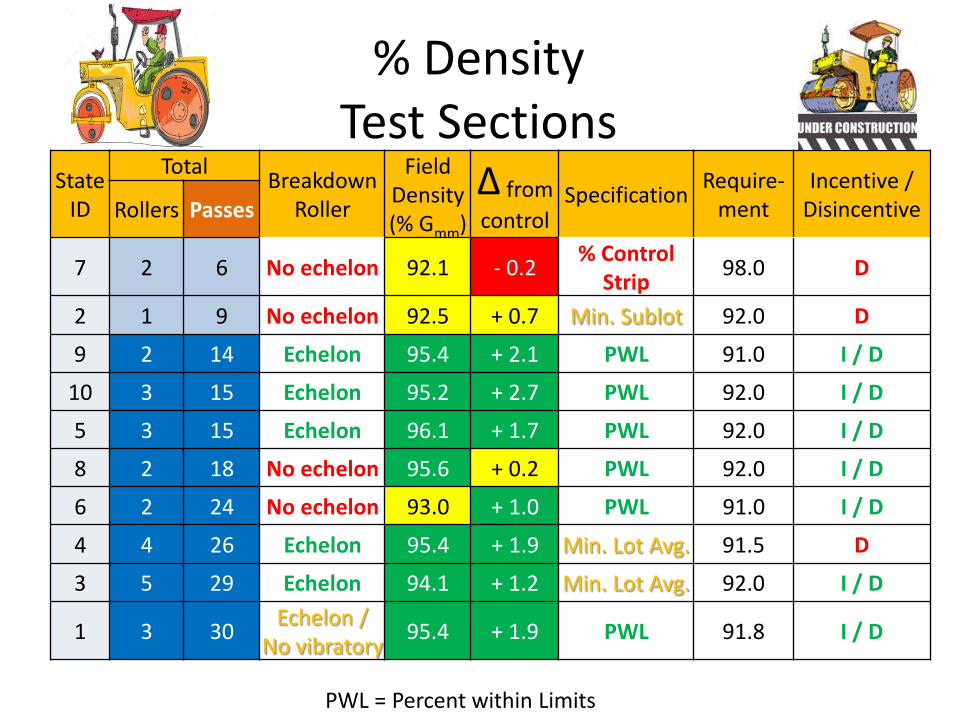
% Density Test Sections
State ID
Total Breakdown Roller
Field Density (% Gmm)
∆ from control
Specification Require- ment
Incentive / Disincentive Rollers Passes
7 2 6 No echelon 92.1 - 0.2 % Control Strip 98.0 D
2 1 9 No echelon 92.5 + 0.7 Min. Sublot 92.0 D
9 2 14 Echelon 95.4 + 2.1 PWL 91.0 I / D
10 3 15 Echelon 95.2 + 2.7 PWL 92.0 I / D
5 3 15 Echelon 96.1 + 1.7 PWL 92.0 I / D
8 2 18 No echelon 95.6 + 0.2 PWL 92.0 I / D
6 2 24 No echelon 93.0 + 1.0 PWL 91.0 I / D
4 4 26 Echelon 95.4 + 1.9 Min. Lot Avg. 91.5 D
3 5 29 Echelon 94.1 + 1.2 Min. Lot Avg. 92.0 I / D
1 3 30 Echelon / No vibratory 95.4 + 1.9 PWL 91.8 I / D
PWL = Percent within Limits

State 4: Cost / Benefit of Best Practices
• Benefit of 1 Percent Density Increase 10 percent of $60 / ton mix = $$$$$$
• Cost of 1 Percent Density Increase Additional rollers ≤ $ AVR to 3% W/binder ≤ $$ WMA Additive ≤ $ 9.5mm vs. 12.5mm ≈ $$
Achieving Increased In-place Density
1 • % Density Requirement
2 • Optimum Asphalt Content
3 • Consistency
4 • Best Practices
5 • New Technology
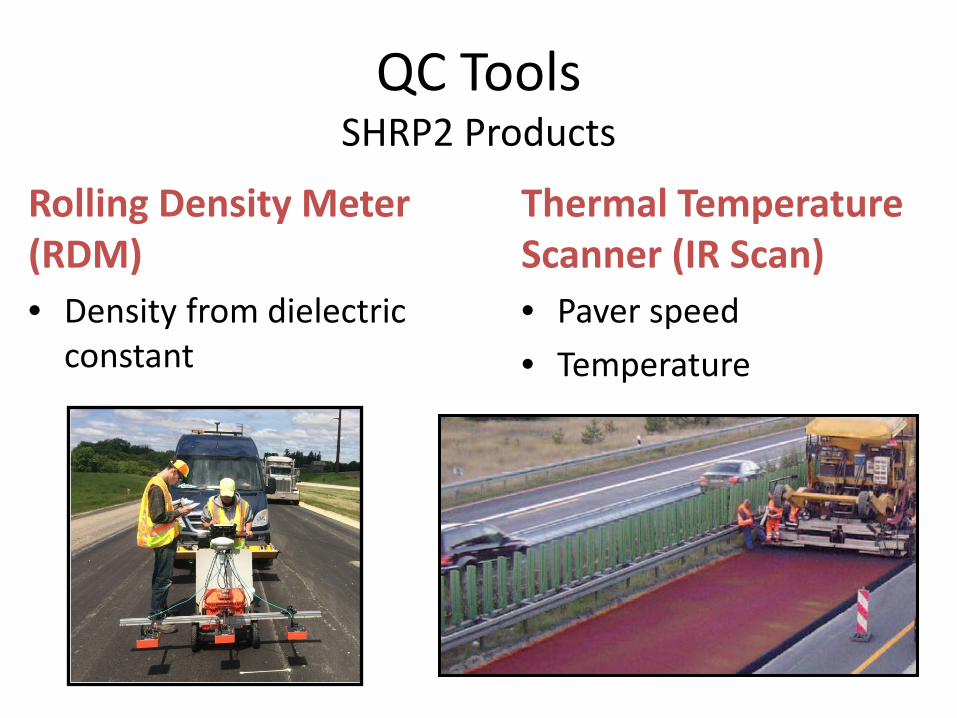
QC Tools SHRP2 Products
Rolling Density Meter (RDM) • Density from dielectric
constant
Thermal Temperature Scanner (IR Scan) • Paver speed • Temperature

States #3 and #10
[A] Density [B] Paver Speed [C] Temp. RDM IR Scan IR Scan
[A] [B] [C]
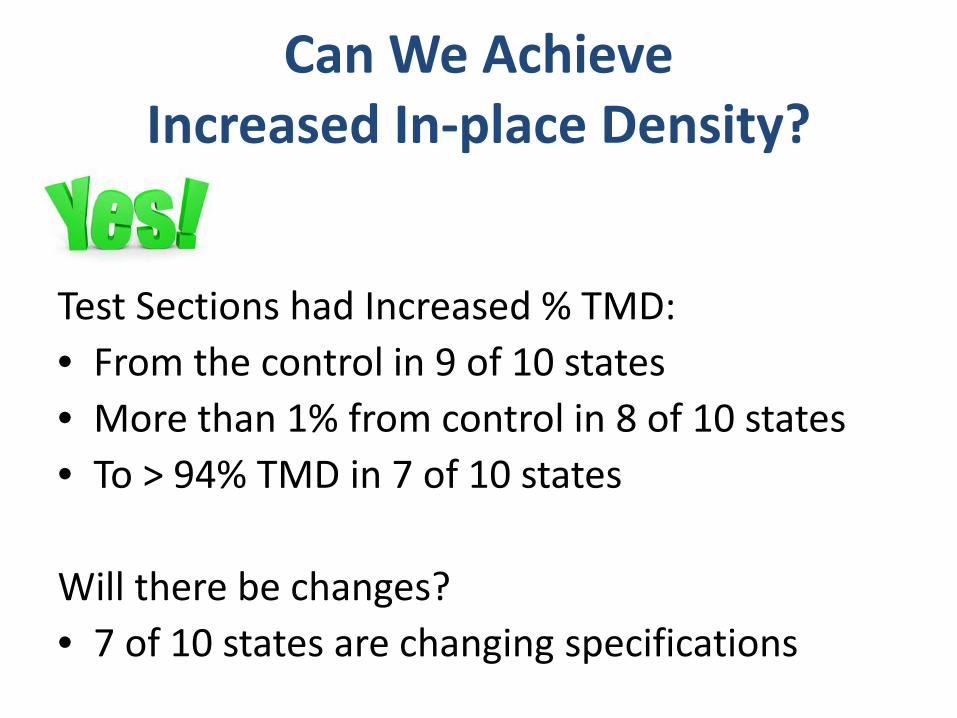
Can We Achieve Increased In-place Density?
Test Sections had Increased % TMD: • From the control in 9 of 10 states • More than 1% from control in 8 of 10 states • To > 94% TMD in 7 of 10 states
Will there be changes? • 7 of 10 states are changing specifications

How Do We Achieve Increased In-place Density?
1 • % Density Requirement
2 • Optimum Asphalt Content
3 • Consistency
4 • Best Practices
5 • New Technology
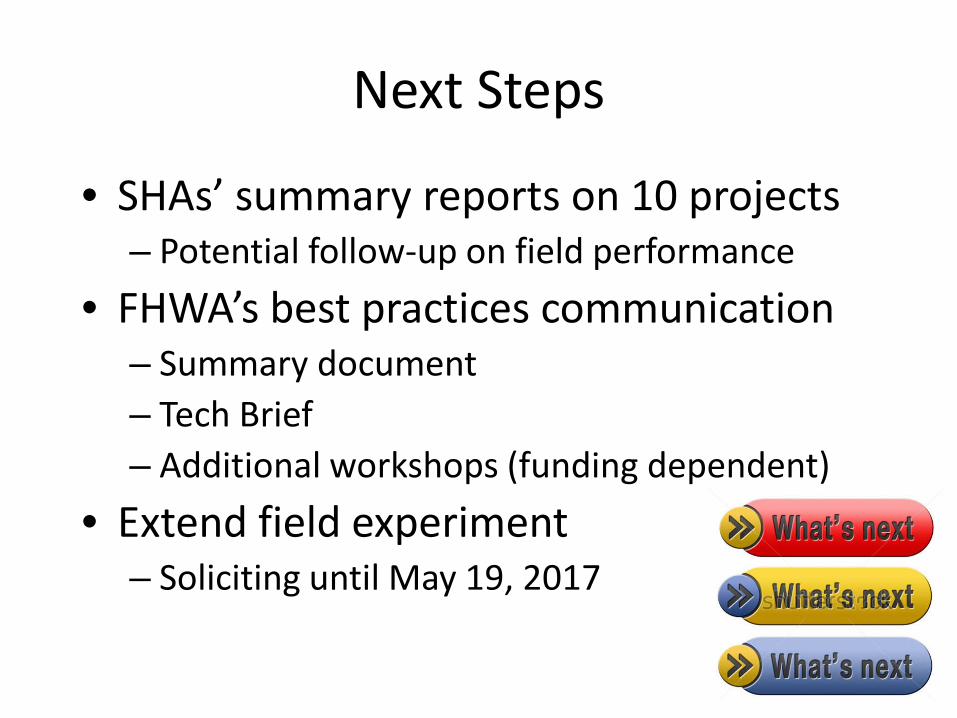
Next Steps
• SHAs’ summary reports on 10 projects – Potential follow-up on field performance
• FHWA’s best practices communication – Summary document – Tech Brief – Additional workshops (funding dependent)
• Extend field experiment – Soliciting until May 19, 2017

Thank you Q U E S T I O N S / C O M M E N T S :
T I M A S C H E N B R E N E R , P . E .
F H W A S E N I O R A S P H A L T P A V E M E N T E N G I N E E R
M A T E R I A L S A N D Q U A L I T Y A S S U R A N C E T E A M O F F I C E O F A S S E T M A N A G E M E N T , P A V E M E N T S A N D
C O N S T R U C T I O N L A K E W O O D , C O L O R A D O
( 7 2 0 ) 9 6 3 - 3 2 4 7
T I M O T H Y . A S C H E N B R E N E R @ D O T . G O V