Enhanced Dissolved Organic Matter Recovery from...
18
ORIGINAL PAPER Enhanced Dissolved Organic Matter Recovery from Saltwater Samples with Electrodialysis Luke R. Chambers 1 • Ellery D. Ingall 1 • Emily M. Saad 1 • Amelia F. Longo 1 • Masayuki Takeuchi 1 • Yuanzhi Tang 1 • Claudia Benitez-Nelson 2 • Sheean T. Haley 3 • Sonya T. Dyhrman 3 • Jay Brandes 4 • Aron Stubbins 4 Received: 21 February 2016 / Accepted: 13 October 2016 / Published online: 24 October 2016 Ó Springer Science+Business Media Dordrecht 2016 Abstract Complexities associated with dissolved organic matter (DOM) isolation from seawater have hampered compositional characterization of this key component of global carbon and nutrient cycles. DOM isolation efficiency by electrodialysis (ED) from salt- containing waters was optimized and evaluated on samples including coastal ocean sea- water, open ocean seawater, artificial seawater from axenic cultures of marine phyto- plankton, and artificial seawater samples containing standard compounds of different molecular sizes and charge. ED was performed with a system optimized for processing 2–10 L sample volumes. Additionally, the combination of ED and solid-phase extraction, using Bond Elut PPL exchange resin, was evaluated. Using only ED, the following DOC recoveries were achieved: coastal seawater, 71.3 ± 6.5 %; open ocean, 50.5 ± 3.1 %; phytoplankton cultures, 70.3 ± 12.5 %; glucose, 90.2 ± 2.1 %; EDTA, 67.5 ± 9.9 %; and vitamin B 12 , 98.3 ± 1.6 %. With the combination of PPL and ED techniques, an average DOC recovery of 76.7 ± 2.6 % was obtained for coastal seawater, but this recovery was not statistically different from seawater recoveries using only ED. Com- parison of C/N ratios and fluorescence excitation emission matrices taken at the beginning and end of the recovery process for coastal samples processed using only ED indicated that the final recovered material was representative of the DOM present in the original samples. Electronic supplementary material The online version of this article (doi:10.1007/s10498-016-9306-2) contains supplementary material, which is available to authorized users. & Ellery D. Ingall [email protected] 1 Department of Earth and Atmospheric Sciences, Georgia Institute of Technology, Atlanta, GA 30332, USA 2 Marine Science Program and Department of Earth and Ocean Sciences, University of South Carolina, Columbia, SC, USA 3 Department of Earth and Environmental Sciences and the Lamont-Doherty Earth Observatory, Columbia University, Palisades, NY, USA 4 Skidaway Institute of Oceanography, University of Georgia, 10 Ocean Science Circle, Savannah, GA 31411, USA 123 Aquat Geochem (2016) 22:555–572 DOI 10.1007/s10498-016-9306-2
Transcript of Enhanced Dissolved Organic Matter Recovery from...
ORIGINAL PAPER
Enhanced Dissolved Organic Matter Recoveryfrom Saltwater Samples with Electrodialysis
Luke R. Chambers1 • Ellery D. Ingall1 • Emily M. Saad1 •
Amelia F. Longo1 • Masayuki Takeuchi1 • Yuanzhi Tang1 •
Claudia Benitez-Nelson2 • Sheean T. Haley3 • Sonya T. Dyhrman3 •
Jay Brandes4 • Aron Stubbins4
Received: 21 February 2016 / Accepted: 13 October 2016 / Published online: 24 October 2016� Springer Science+Business Media Dordrecht 2016
Abstract Complexities associated with dissolved organic matter (DOM) isolation from
seawater have hampered compositional characterization of this key component of global
carbon and nutrient cycles. DOM isolation efficiency by electrodialysis (ED) from salt-
containing waters was optimized and evaluated on samples including coastal ocean sea-
water, open ocean seawater, artificial seawater from axenic cultures of marine phyto-
plankton, and artificial seawater samples containing standard compounds of different
molecular sizes and charge. ED was performed with a system optimized for processing
2–10 L sample volumes. Additionally, the combination of ED and solid-phase extraction,
using Bond Elut PPL exchange resin, was evaluated. Using only ED, the following DOC
recoveries were achieved: coastal seawater, 71.3 ± 6.5 %; open ocean, 50.5 ± 3.1 %;
phytoplankton cultures, 70.3 ± 12.5 %; glucose, 90.2 ± 2.1 %; EDTA, 67.5 ± 9.9 %;
and vitamin B12, 98.3 ± 1.6 %. With the combination of PPL and ED techniques, an
average DOC recovery of 76.7 ± 2.6 % was obtained for coastal seawater, but this
recovery was not statistically different from seawater recoveries using only ED. Com-
parison of C/N ratios and fluorescence excitation emission matrices taken at the beginning
and end of the recovery process for coastal samples processed using only ED indicated that
the final recovered material was representative of the DOM present in the original samples.
Electronic supplementary material The online version of this article (doi:10.1007/s10498-016-9306-2)contains supplementary material, which is available to authorized users.
& Ellery D. [email protected]
1 Department of Earth and Atmospheric Sciences, Georgia Institute of Technology, Atlanta,GA 30332, USA
2 Marine Science Program and Department of Earth and Ocean Sciences, University of SouthCarolina, Columbia, SC, USA
3 Department of Earth and Environmental Sciences and the Lamont-Doherty Earth Observatory,Columbia University, Palisades, NY, USA
4 Skidaway Institute of Oceanography, University of Georgia, 10 Ocean Science Circle, Savannah,GA 31411, USA
123
Aquat Geochem (2016) 22:555–572DOI 10.1007/s10498-016-9306-2
Typical recoveries using combined PPL and ED exceed those of previous isolation
methods.
Keywords DOM � Electrodialysis � PPL � DOC recovery
1 Introduction
Marine dissolved organic matter (DOM) represents one of the world’s largest reservoirs of
exchangeable carbon (Hansell and Carlson 2015). Most chemical and spectral character-
izations of DOM in seawater are confounded by the high inorganic salt concentrations
(*35 g L-1) and comparatively low DOM concentrations (*0.5 mg L-1) (Mopper et al.
2007). Therefore, DOM must be concentrated and isolated before most detailed compo-
sitional characterizations can proceed (Repeta 2015). Over the past few decades, many
technologies have been developed to isolate DOM from marine samples ranging from
selective sorbents to desalting (Green et al. 2014; Repeta 2015).
Solid-phase extraction (SPE) using polystyrene or octadecyl-silica (C-18) resins was
one of the first viable methods for isolating DOM from seawater. The number of available
SPE sorbents has grown to include cross-linked polystyrene (XAD-2, XAD-4, and XAD-
16) and their derivatives (PPL), Isolute ENV, and polyacrylate (XAD-8) (Mopper et al.
2007; Repeta 2015). DOC recoveries and selectivity toward different molecular classes
differ among SPE sorbents. Because of this selectivity, samples are sometimes processed
with more than one SPE sorbent in series to maximize recovery or to fractionate the sample
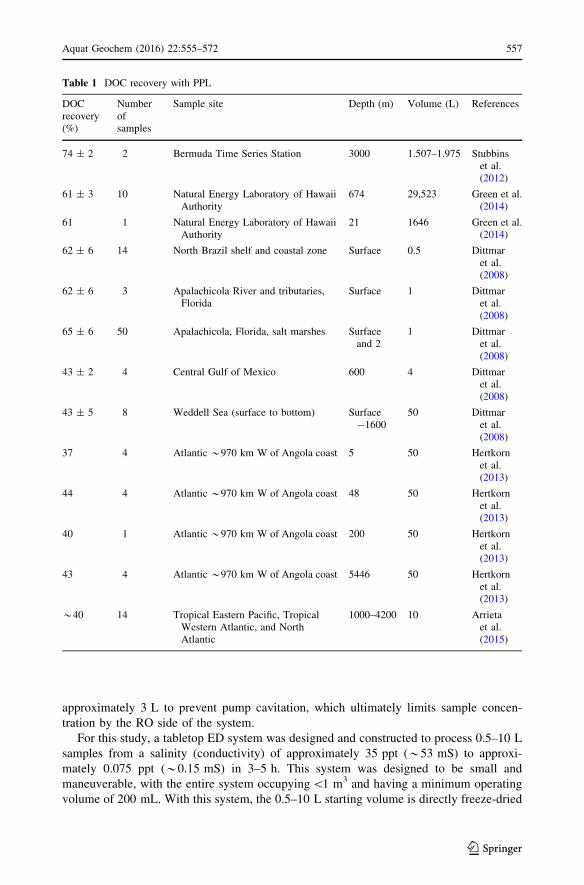
into different operational classes (Green et al. 2014). Some of the highest DOC recoveries
with SPE have been achieved with Bond Elut PPL, averaging approximately 52 %
(Table 1; Arrieta et al. 2015; Dittmar et al. 2008; Green et al. 2014; Hertkorn et al. 2013;
Stubbins et al. 2012). During PPL processing, samples come into contact with dilute
hydrochloric acid (pH 2–2.5) and pure methanol, which could create unknown effects on
sample composition (Repeta 2015). Additionally, PPL may select for certain fractions of
the DOM pool with a bias toward small and polar compounds (Arrieta et al. 2015). Another
method adopted for DOM isolation is cross-flow ultrafiltration, which recovers the high
molecular weight fraction ([1 kDa) of DOM most efficiently (Guo et al. 2000). While this
method avoids the chemical treatments associated with SPE resin processes, it only
recovers up to *30 % of DOC (Benner et al. 1992; McCarthy et al. 1993; Walker et al.
2011) and selects for larger molecules or molecular aggregates.
Advances in DOM isolation have been achieved through the coupling of reverse
osmosis (RO) and electrodialysis (ED) (Chen et al. 2014; Diaz et al. 2008; Green et al.
2014; Gurtler et al. 2008; Helms et al. 2015; Koprivnjak et al. 2006; Vetter et al. 2007;
Young and Ingall 2010). In this method, salts are removed from a sample by ED utilizing
an alternating series of positive and negative ion-exchange membranes under the influence
of an electric potential, while simultaneously reducing sample volume by RO (Vetter et al.
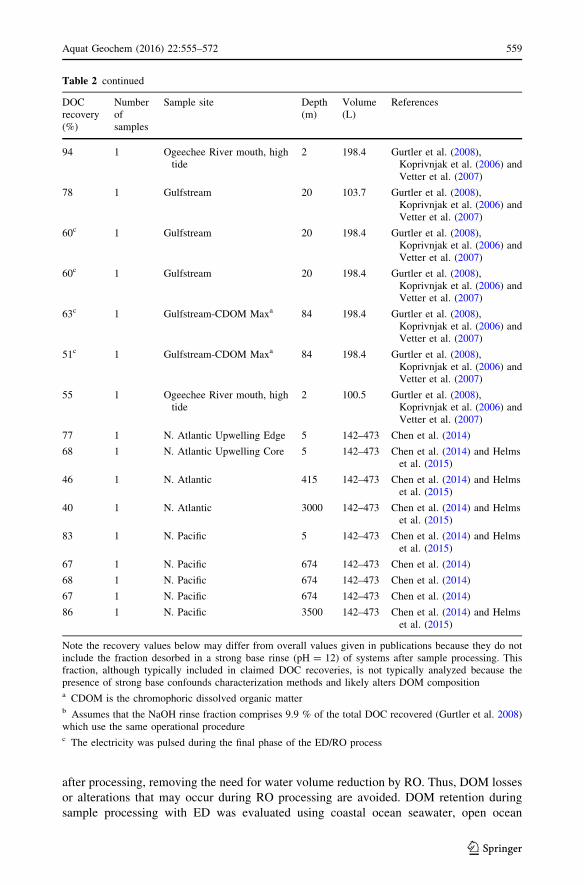
2007). ED/RO DOC recoveries average approximately 68 % (Table 2 for specific values
and references). Most ED/RO systems built to isolate DOM from natural seawater samples
are designed for large ([50 L) sample volumes and require RO to reduce final sample
volumes to sizes practical for freeze-drying (3–5 L) to further concentrate the DOM
(Green et al. 2014; Helms et al. 2015). This makes the systems physically large, and
therefore unruly to manage. Such systems typically require a minimum volume of
556 Aquat Geochem (2016) 22:555–572
123
approximately 3 L to prevent pump cavitation, which ultimately limits sample concen-
tration by the RO side of the system.
For this study, a tabletop ED system was designed and constructed to process 0.5–10 L
samples from a salinity (conductivity) of approximately 35 ppt (*53 mS) to approxi-
mately 0.075 ppt (*0.15 mS) in 3–5 h. This system was designed to be small and
maneuverable, with the entire system occupying\1 m3 and having a minimum operating
volume of 200 mL. With this system, the 0.5–10 L starting volume is directly freeze-dried
Table 1 DOC recovery with PPL
DOCrecovery(%)
Numberofsamples
Sample site Depth (m) Volume (L) References
74 ± 2 2 Bermuda Time Series Station 3000 1.507–1.975 Stubbinset al.(2012)
61 ± 3 10 Natural Energy Laboratory of HawaiiAuthority
674 29,523 Green et al.(2014)
61 1 Natural Energy Laboratory of HawaiiAuthority
21 1646 Green et al.(2014)
62 ± 6 14 North Brazil shelf and coastal zone Surface 0.5 Dittmaret al.(2008)
62 ± 6 3 Apalachicola River and tributaries,Florida
Surface 1 Dittmaret al.(2008)
65 ± 6 50 Apalachicola, Florida, salt marshes Surfaceand 2
1 Dittmaret al.(2008)
43 ± 2 4 Central Gulf of Mexico 600 4 Dittmaret al.(2008)
43 ± 5 8 Weddell Sea (surface to bottom) Surface-1600
50 Dittmaret al.(2008)
37 4 Atlantic *970 km W of Angola coast 5 50 Hertkornet al.(2013)
44 4 Atlantic *970 km W of Angola coast 48 50 Hertkornet al.(2013)
40 1 Atlantic *970 km W of Angola coast 200 50 Hertkornet al.(2013)
43 4 Atlantic *970 km W of Angola coast 5446 50 Hertkornet al.(2013)
*40 14 Tropical Eastern Pacific, TropicalWestern Atlantic, and NorthAtlantic
1000–4200 10 Arrietaet al.(2015)
Aquat Geochem (2016) 22:555–572 557
123
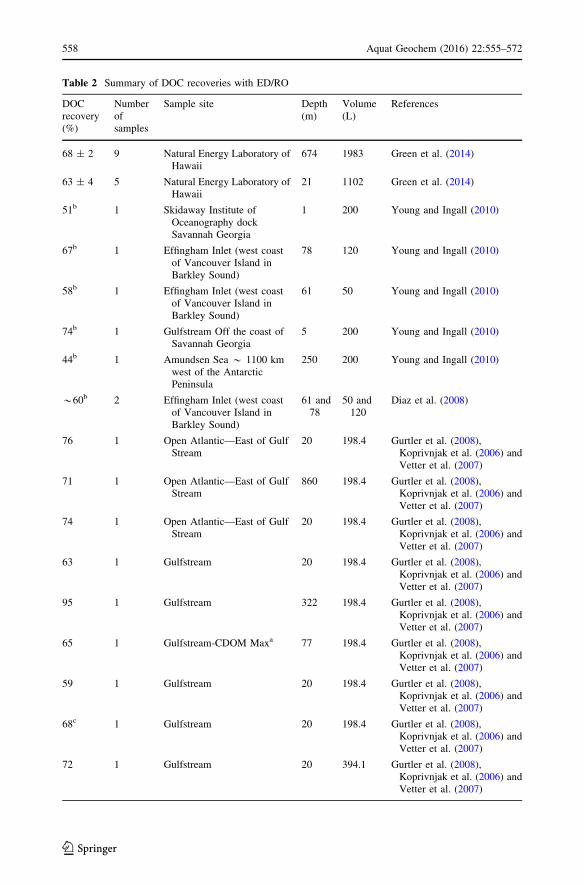
Table 2 Summary of DOC recoveries with ED/RO
DOCrecovery(%)
Numberofsamples
Sample site Depth(m)
Volume(L)
References
68 ± 2 9 Natural Energy Laboratory ofHawaii
674 1983 Green et al. (2014)
63 ± 4 5 Natural Energy Laboratory ofHawaii
21 1102 Green et al. (2014)
51b 1 Skidaway Institute ofOceanography dockSavannah Georgia
1 200 Young and Ingall (2010)
67b 1 Effingham Inlet (west coastof Vancouver Island inBarkley Sound)
78 120 Young and Ingall (2010)
58b 1 Effingham Inlet (west coastof Vancouver Island inBarkley Sound)
61 50 Young and Ingall (2010)
74b 1 Gulfstream Off the coast ofSavannah Georgia
5 200 Young and Ingall (2010)
44b 1 Amundsen Sea * 1100 kmwest of the AntarcticPeninsula
250 200 Young and Ingall (2010)
*60b 2 Effingham Inlet (west coastof Vancouver Island inBarkley Sound)
61 and78
50 and120
Diaz et al. (2008)
76 1 Open Atlantic—East of GulfStream
20 198.4 Gurtler et al. (2008),Koprivnjak et al. (2006) andVetter et al. (2007)
71 1 Open Atlantic—East of GulfStream
860 198.4 Gurtler et al. (2008),Koprivnjak et al. (2006) andVetter et al. (2007)
74 1 Open Atlantic—East of GulfStream
20 198.4 Gurtler et al. (2008),Koprivnjak et al. (2006) andVetter et al. (2007)
63 1 Gulfstream 20 198.4 Gurtler et al. (2008),Koprivnjak et al. (2006) andVetter et al. (2007)
95 1 Gulfstream 322 198.4 Gurtler et al. (2008),Koprivnjak et al. (2006) andVetter et al. (2007)
65 1 Gulfstream-CDOM Maxa 77 198.4 Gurtler et al. (2008),Koprivnjak et al. (2006) andVetter et al. (2007)
59 1 Gulfstream 20 198.4 Gurtler et al. (2008),Koprivnjak et al. (2006) andVetter et al. (2007)
68c 1 Gulfstream 20 198.4 Gurtler et al. (2008),Koprivnjak et al. (2006) andVetter et al. (2007)
72 1 Gulfstream 20 394.1 Gurtler et al. (2008),Koprivnjak et al. (2006) andVetter et al. (2007)
558 Aquat Geochem (2016) 22:555–572
123
after processing, removing the need for water volume reduction by RO. Thus, DOM losses
or alterations that may occur during RO processing are avoided. DOM retention during
sample processing with ED was evaluated using coastal ocean seawater, open ocean
Table 2 continued
DOCrecovery(%)
Numberofsamples
Sample site Depth(m)
Volume(L)
References
94 1 Ogeechee River mouth, hightide
2 198.4 Gurtler et al. (2008),Koprivnjak et al. (2006) andVetter et al. (2007)
78 1 Gulfstream 20 103.7 Gurtler et al. (2008),Koprivnjak et al. (2006) andVetter et al. (2007)
60c 1 Gulfstream 20 198.4 Gurtler et al. (2008),Koprivnjak et al. (2006) andVetter et al. (2007)
60c 1 Gulfstream 20 198.4 Gurtler et al. (2008),Koprivnjak et al. (2006) andVetter et al. (2007)
63c 1 Gulfstream-CDOM Maxa 84 198.4 Gurtler et al. (2008),Koprivnjak et al. (2006) andVetter et al. (2007)
51c 1 Gulfstream-CDOM Maxa 84 198.4 Gurtler et al. (2008),Koprivnjak et al. (2006) andVetter et al. (2007)
55 1 Ogeechee River mouth, hightide
2 100.5 Gurtler et al. (2008),Koprivnjak et al. (2006) andVetter et al. (2007)
77 1 N. Atlantic Upwelling Edge 5 142–473 Chen et al. (2014)
68 1 N. Atlantic Upwelling Core 5 142–473 Chen et al. (2014) and Helmset al. (2015)
46 1 N. Atlantic 415 142–473 Chen et al. (2014) and Helmset al. (2015)
40 1 N. Atlantic 3000 142–473 Chen et al. (2014) and Helmset al. (2015)
83 1 N. Pacific 5 142–473 Chen et al. (2014) and Helmset al. (2015)
67 1 N. Pacific 674 142–473 Chen et al. (2014)
68 1 N. Pacific 674 142–473 Chen et al. (2014)
67 1 N. Pacific 674 142–473 Chen et al. (2014)
86 1 N. Pacific 3500 142–473 Chen et al. (2014) and Helmset al. (2015)
Note the recovery values below may differ from overall values given in publications because they do notinclude the fraction desorbed in a strong base rinse (pH = 12) of systems after sample processing. Thisfraction, although typically included in claimed DOC recoveries, is not typically analyzed because thepresence of strong base confounds characterization methods and likely alters DOM compositiona CDOM is the chromophoric dissolved organic matterb Assumes that the NaOH rinse fraction comprises 9.9 % of the total DOC recovered (Gurtler et al. 2008)which use the same operational procedurec The electricity was pulsed during the final phase of the ED/RO process
Aquat Geochem (2016) 22:555–572 559
123
seawater, artificial seawater from cultures of marine phytoplankton, and artificial seawater
samples containing standard compounds of different molecular sizes and charge. Addi-
tionally, various operational parameters such as electrical pulsing, fluid salinity ranges, and
sequence of isolation techniques were tested and optimized to improve recoveries. Given
the high recoveries and potential recovery of different molecular classes by PPL relative to
ED, the two techniques were combined for a subset of natural samples to improve total
DOM recoveries and to recover a more representative fraction of the molecular classes
present in the original DOM sample.
2 Materials and Methods
2.1 Electrodialysis
Electrodialysis was performed using a Deukum electrodialysis stack (Deukum GmbH,
Frickenhausen, Germany) coupled to a circulation system built in our laboratory (Sup-
plement Fig. S1 & Table S1). The circulation system is composed of three Iwaki WMD
water pumps and associated adjustable valves used to control the flow and pressure of the
sample (diluate), concentrate (water flow that receives ions from the sample), and electrode
rinse (flow that maintains ionic balance between the cathode and anode). In addition to the
pumps, the system includes an Oakton Cond 6? conductivity meter with the electrode
mounted in a laboratory-built housing so it could be used inline, and three high-density
polyethylene (HDPE) tanks to store the diluate, concentrate, and electrode rinse. A 10-cell-
pair electrodialysis stack was constructed consisting of alternating Neosepta anion AMX
(strongly basic, anion permeable, high mechanical strength, 2.4 X cm2) and Neosepta
cation CMX (strongly acidic, cation permeable, high mechanical strength, 3.0 X cm2)
exchange membranes. These membranes are held between opposing flow regulating end
blocks of the stack, which, respectively, house a platinized titanium mesh anode and a
stainless steel cathode. Two CMX membranes were situated at the end of the stack nearest
to the cathode to protect the cathode from corrosion (Pfromm et al. 1999). The membranes
are separated by 0.7-mm-thick flexible turbulence promoting spacers and have a cross-
sectional active membrane area of approximately 100 cm2. The electric potential across
the stack was supplied by a 1.2-kW Sorensen DCS150-8EM1 solid-state power supply.
During the ED process, anions are pulled through the AMX membranes toward the anode,
while cations are pulled through CMX membranes toward the cathode. As the ions are
pulled to their respective electrodes, they move out of the diluate flow channel and into the
concentrate flow channel.
2.1.1 ED System Preparation and Sample Processing
The following procedure was developed for cleaning and preparing the ED system. An
electrode rinse solution is made by dissolving 60 g of sodium sulfate (Na2SO4) into 2 L of
Milli-Q water (Pfromm et al. 1999). The electrode rinse tank is filled with the electrode
rinse solution and the concentrate tank filled with 24 L of Milli-Q water. With all three
channels in circulation, the diluate channel is rinsed 6 times with 1 L of Milli-Q water for
2 min per rinse. After the diluate channel rinses, the concentrate solution is replaced with
24 L of fresh Milli-Q water. Before sample processing, the diluate channel is rinsed with
two 300-mL sample aliquots for 2 min per rinse. The pH of the electrode rinse should be
560 Aquat Geochem (2016) 22:555–572
123
monitored before and after a sample is processed. If the pH falls outside the range of 5.5–7,
the electrode rinse flow channel should be rinsed three times with Milli-Q water and the
electrode rinse replaced. A pressure of 4.5 psig was maintained in all flow channels during
cleaning and sample processing to prevent pressure differences across the membranes.
Based on numerous tests and optimizations, the following procedure was developed for
ED processing of samples (Supplement). A sample is placed in the diluate tank and
circulated through the system for 2 min to ensure good mixing before the electricity is
supplied. At this point, the conductivity of the sample is measured and a 40-mL subsample
is collected for DOC and total dissolved nitrogen (TN) analysis (subsample Tinitial). Once
the power is supplied to the system, it is vital that both the conductivity of the sample and
the applied amperage are continuously monitored to ensure the electrical current per unit
area of membrane does not increase above the limiting current density (LCD). The LCD
can be determined by increasing the current across the stack in a stepwise manner and
plotting the electrical resistance of the stack as a function of the reciprocal current
(Pfromm et al. 1999). If the electrical current exceeds the LCD, ion concentrations drop to
near zero at the membrane surface on the diluate side of the membranes (Pfromm et al.
1999). The absence of ions at the membrane surface results in the splitting of water
molecules. The hydroxyl ions resulting from the splitting of water pass through the
membranes causing a rapid increase in the pH of the concentrate and a corresponding
decrease in the pH of diluate (Pfromm et al. 1999).
During sample processing, the conductivity of the concentrate and sample is continu-
ously measured. When the conductivity of the concentrate exceeds that of the sample by
approximately 2 mS, the system is briefly shut off and the concentrate is changed. Opti-
mization experiments (Supplement) indicate that sample DOM recoveries are highest when
4 L of concentrate is left in the tank and 20 L of the concentrate replaced with Milli-Q
water rather than completely replacing the concentrate with Milli-Q water. After a con-
centrate change, the system is turned back on and the sample is processed to the desired
end point, typically a conductivity of approximately 150 lS (Supplement) which corre-
sponds to an approximate salinity of 0.075 ppt. At the end of the ED process, a 40-mL
subsample is collected (subsample Tfinal) to calculate the total DOC and TN recoveries. It
should be noted that near the end of the process when sample conductivities are\400 lS,the limiting current density is difficult to define. At this point, samples were run at a current
of 0.13 amps until the final target conductivity was reached. At these final stages of sample
processing, it was found that reducing the electric current below 0.13 amps led to
impractically long run times, while not increasing the recovery. At the end of a run, the
diluate channel is cleaned by rinsing 6 times with 1 L of Milli-Q water for 2 min per rinse.
If the membrane stack is not going to be used to process samples within 1 day, an
approximately 100 mS NaCl brine solution is run through the electrodialysis stack to
hinder biological growth in the system.
A 3-L sample volume was processed in the majority of experiments. This volume
required approximately 4 h to process on the ED system, including system cleaning. The
subsequent freeze-drying of this volume required about one week using a laboratory-scale
freeze-drying system with a chamber just large enough to accommodate a 3-L beaker.
2.2 Bond Elut PPL
Bond Elut PPL, manufactured by Agilent Technologies, is a styrene–divinylbenzene
(SDVB) polymer that has been modified with a proprietary nonpolar surface. The cleaning
procedures below and the protocol for DOM extraction via SPE using PPL sorbent were
Aquat Geochem (2016) 22:555–572 561
123
adapted from previous works (Arrieta et al. 2015; Dittmar et al. 2008; Green et al. 2014;
Hertkorn et al. 2013; Stubbins et al. 2012) and the manufacturer’s guidelines using 6-mL
Bond Elut PPL cartridges (columns).
Before DOM can be extracted with PPL columns, the sorbent must first be conditioned
and equilibrated (Dittmar et al. 2008). This is a 2-day process with several cycles of
sorbent soaking and rinsing. On the first day, the cartridge is filled and drained three times
with methanol (LC/MS Grade; 3 cartridge volumes = *6 mL), then immediately rinsed
with three cartridge volumes of Milli-Q water, and again rinsed with three cartridge
volumes of methanol. The cartridge is then filled with methanol and left to soak overnight
(minimum of 4 h). On the second day of conditioning, a pH 2 Milli-Q solution is made by
adding 1 mL of 12 N HCl (ACS grade or higher) to 1 L of Milli-Q water. The cartridge is
then rinsed three times with a cartridge volume of Milli-Q water, followed by three
cartridge volumes of methanol, and finally three cartridge volumes of the pH 2 Milli-Q
solution. The extraction step is immediately preformed after the cartridge final rinse.
Prior to PPL processing, samples are acidified to pH 2 with HCl (ACS grade; 12 N).
Acid-washed (pH 2 Milli-Q water) Teflon tubing (ID 2 mm), Luer adaptors, and fittings are
attached to the cartridges and used to siphon the sample through the PPL. The flow is
adjusted to approximately 10 mL min-1. Initial and final weights of the seawater samples
are recorded to determine the total processed volumes. Once the entire sample has passed
through the column, the PPL columns are rinsed with three cartridge volumes of pH 2
Milli-Q water to remove any remaining salts. Zero-grade air is then passed through the
cartridge at approximately 10 psig in an effort to dry the resin before elution. Once the
columns are dry, DOM sorbed to the column is eluted with approximately 9 mL of
methanol. The volumes of the eluted methanol are measured gravimetrically. Eluted
samples are stored at -20 �C until processing.
To calculate final DOM recoveries, a known aliquot of the methanol extract is placed in
a vented drying oven at 40 �C for 24 h to dry the sample. The sample is then resuspended
in 20 mL of pH 2 Milli-Q water and sonicated for 10 min. Concentrations of DOC and TN
are then determined using a Shimadzu TOC-VCSN total organic carbon (TOC) analyzer
(see Sect. 2.5 below).
2.3 Combined PPL: ED Natural Samples
DOC recovery using the combined PPL/ED technique was evaluated using saltwater
samples collected between the dates of 09/03/2014 and 12/10/2014 from the Skidaway
River (31�59024.100N, 81�01020.900W) off the main dock of the Skidaway Institute of
Oceanography located near Savannah Georgia, USA. The samples were collected 1 m
below the water surface at approximately 1 h after high tide to obtain waters when they are
at their maximum salinity during a tidal cycle. The samples, which had initial conduc-
tivities between 38 and 47 mS, were filtered through an acid-cleaned Whatman Polycap
TC Filter Capsule with pore size 0.2 lm and stored in acid-washed Nalgene 20 L carboys
at 4 �C before processing.
Seven samples were collected on different days throughout September 2014 and pro-
cessed using ED within 3 days of collection. Two approximately 25-L samples were
collected on 10/21/14 and 11/25/14 and placed in cold storage in acid-washed carboys.
Three separate 2-L aliquots of the samples collected on 10/21/14 were processed on 10/27/
14, 11/13/14, and 11/24/14 with solely ED. One 2-L aliquot of the sample collected on
10/21/14 was processed with PPL and subsequently processed with ED on 11/26/14. Three
separate 2-L aliquots were taken from the sample collected on 11/25/14 and processed with
562 Aquat Geochem (2016) 22:555–572
123
PPL and subsequently processed with ED on 11/28/14, 12/10/14 (2 runs). Three separate
2-L aliquots were taken from the sample collected on 11/25/14 and processed solely using
ED on 11/30/14, 12/3/14, and 12/7/14. See Table S2 for sample details. Note that the
samples processed with PPL then ED were acidified to pH 2 before processing on PPL and
not neutralized before ED processing.
2.4 Standards and Samples for ED Optimization
Samples of artificial seawater from phytoplankton cultures and open ocean seawater (de-
scribed below) were processed with ED to evaluate and optimize the DOM recovery of
samples presumably representing freshly produced and extensively cycled DOM, respec-
tively. Additionally, to evaluate the recovery of molecules of different size and charge,
three standard reagent-grade compounds, including D-(?)-Glucose (C6H12O6; Sigma-
Aldrich C99.5 %), ethylenediaminetetraacetic acid (EDTA; (HO2CCH2)2-NCH2CH2N(CH2CO2H)2; Sigma-Aldrich, ACS grade, 99.4–100.6 %), and vitamin B12
(C63H88CoN14O14P; Sigma-Aldrich, C98 %) were each individually dissolved in artificial
seawater (Grasshoff et al. 1999; Kester et al. 1967) and processed with ED.
Two species of marine phytoplankton obtained from the Bigelow National Center for
Marine Algae and Microbiota (NCMA) were grown in axenic laboratory cultures and
processed with ED. Thalassiosira pseudonana (CCMP 1335), a diatom, was cultured in Si
replete f/2 media (Guillard 1975; Guillard and Ryther 1962) under axenic conditions in
artificial seawater (Grasshoff et al. 1999; Kester et al. 1967). The biomass of T. pseudo-
nana was harvested via centrifugation at 4500 rpm for 5 min, and the supernatant con-
taining DOM exudates was filtered through a glass fiber filter (Whatman 1825-150 GF/F,
pore size 0.7 lm) before processing with ED. Emiliania huxleyi (CCMP 371), a coccol-
ithophore, was cultured in L1/25 media (Guillard and Hargraves 1993) under axenic con-
ditions in artificial seawater (Grasshoff et al. 1999; Kester et al. 1967). E. huxleyi cells
were harvested onto a polycarbonate filter (pore size 0.2 lm), and the filtrate containing
DOM exudates was frozen until ED processing. These phytoplankton were cultured under
different conditions to produce the following treatments: nutrient replete, N-stressed (di-
atom only) and P-stressed, as part of a different study and sampled in the late logarithmic
phase of growth. Three separate cultures were grown for each nutrient treatment and were
processed individually with ED.
Open ocean seawater samples were collected using the underway pumping system of
the R/V Savannah in Atlantic Ocean waters located approximately 100 km east of
Savannah, Georgia, on 1/13/14. The samples were filtered through an acid-cleaned
Whatman Polycap TC Filter Capsule (0.2 lm) and stored in several 20-L acid-washed
Nalgene carboys at 4 �C before processing with the ED. Triplicate aliquots of the open
ocean seawater sample and all other samples in this study were processed in accordance
with the protocol described above.
2.5 Sample Analysis
DOC concentrations were used to monitor DOM recovery during sample processing. DOC
concentrations in subsamples (40 mL) were measured as non-purgeable organic carbon
using high-temperature catalytic oxidation with a Shimadzu TOC-VCSN or TOC-VCPH
analyzer (Benner and Strom 1993; Grasshoff et al. 1999). DOC recoveries were calculated
by dividing the mass of DOC at the end of processing (Sample TFinal) by the mass of DOC
initially supplied (Sample TInitial). Calculated recoveries also account for the removal of
Aquat Geochem (2016) 22:555–572 563
123
DOC in subsamples taken for measurements (Table S2). The Shimadzu instruments above
were also used to measure TN concentrations in the subsamples. During ED processing,
[99 % of the dissolved inorganic nitrogen (DIN) was removed from the sample. Thus, TN
concentrations determined at the end of the ED process for all sample types more accu-
rately represent dissolved organic nitrogen (DON) concentrations. To calculate initial
DON concentrations in seawater and cultured phytoplankton samples, the initial DIN
concentrations must be subtracted from the initial TN concentrations. For seawater samples
collected at the Skidaway dock, DIN was estimated using mean annual NO3- and NH4
?
concentrations of 2.2 and 2.7 lM, respectively, for the Skidaway River estuary (Verity
2002). Initial DIN concentrations for cultured phytoplankton filtrates were measured as
RNOx using anion chromatography (Metrohm A Supp 5 150.0/x 4.0 mm) coupled with
ultraviolet detection (Beckman Coulter DU 720 detector) and a NaCl eluent (Beckler et al.
2014). Initial and final carbon-to-nitrogen (C/N) ratios were calculated by dividing the
DOC concentrations by the dissolved organic nitrogen.
d13C values for both ED and PPL isolates were determined at the Skidaway Institute
Scientific Stable Isotope Laboratory (SISSIL) using a Delta V plus (2007) light stable e
mass spectrometer coupled to a ThermoFisher Flash EA (Fry et al. 1996). Freeze-dried
aliquots of extracts were weighed into tin combustion cups prior to analysis. Samples were
calibrated using an internal laboratory standard of chitin (Sigma-Aldrich), which was in
turn referenced to PDB using the USGS 40 isotopic standard. Typical precision on stan-
dards was 0.2 % for isotopic composition.
Fluorescence excitation emission matrices (EEM) spectra for Skidaway dock seawater
samples were measured on subsamples collected during ED processing in 1-cm quartz cells
by a Horiba AquaLog VS140 (CCD1) spectrofluorometer. EEMs are produced from
multiple emission spectra collected at successively increasing excitation wavelengths
(Fellman et al. 2010; Stedmon and Bro 2008). EEMs can be used to categorize a subset of
colored dissolved organic matter known as fluorescent dissolved organic matter (Stedmon
and Alvarez-Salgado 2011; Stubbins et al. 2014). The peaks present on an EEM surface
correlate to different molecular classes within the sample (Coble et al. 1990, 1998; Fellman
et al. 2010; Jaffe et al. 2014; Wagner et al. 2015). Florescence and absorbance measure-
ments for EEMs were processed in similar fashion to previous studies (Coble et al.
1990, 1998; Fellman et al. 2010; Stubbins et al. 2014). However, the Horiba Aqualog and
its included software allowed for simultaneous data collection and EEM generation.
A Milli-Q water blank EEM was subtracted from each sample EEM to remove Raman
scatter peaks (Coble et al. 1998). Rayleigh scattering was removed from EEMs by
smoothing with surrounding emission values.
3 Results
For the 13 seawater samples collected at the Skidaway dock, DOC recoveries using only
ED averaged 71.3 ± 6.5 % (Fig. 1). Two of the seawater samples collected at the Skid-
away dock were divided into three 2-L aliquots, with each aliquot processed separately
through ED to evaluate reproducibility of DOC recovery. Recovery was 71.1 ± 4.8 % for
the sample collected on 11/25/2014 and processed on 11/30/14, 12/3/14, and 12/7/14 and
69.8 ± 11.6 % for the sample collected on 10/21/2014 and processed on 10/27/14, 11/13/
14, and 11/24/14. The absence of obvious trends in DOC recovery related to length of
564 Aquat Geochem (2016) 22:555–572
123
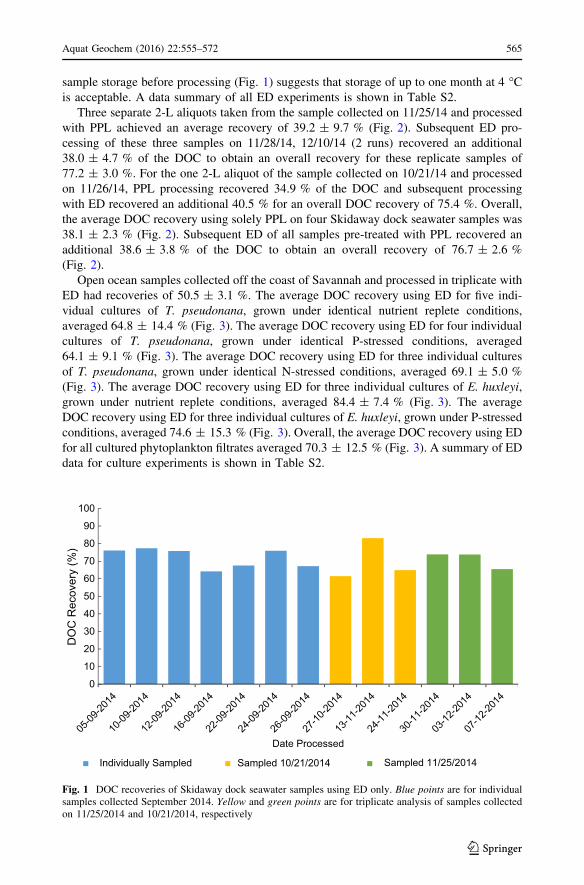
sample storage before processing (Fig. 1) suggests that storage of up to one month at 4 �Cis acceptable. A data summary of all ED experiments is shown in Table S2.
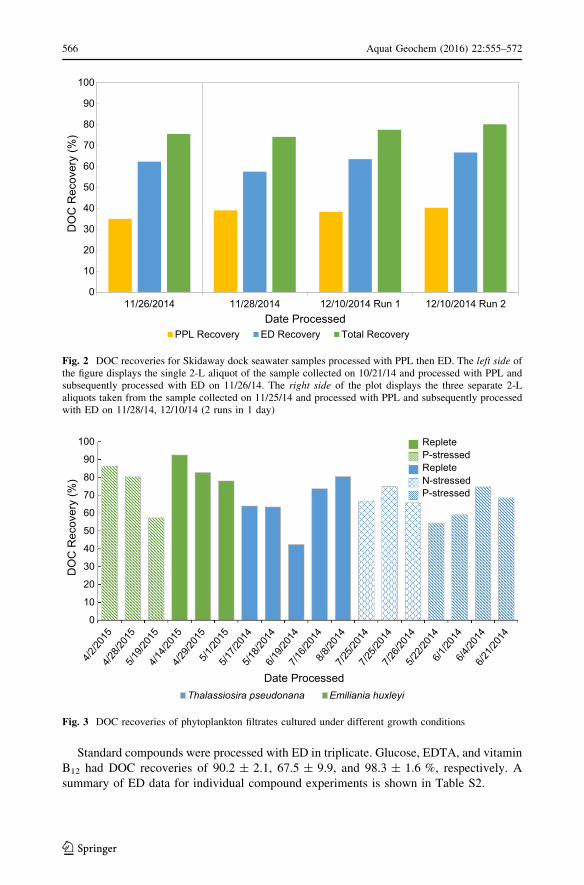
Three separate 2-L aliquots taken from the sample collected on 11/25/14 and processed
with PPL achieved an average recovery of 39.2 ± 9.7 % (Fig. 2). Subsequent ED pro-
cessing of these three samples on 11/28/14, 12/10/14 (2 runs) recovered an additional
38.0 ± 4.7 % of the DOC to obtain an overall recovery for these replicate samples of
77.2 ± 3.0 %. For the one 2-L aliquot of the sample collected on 10/21/14 and processed
on 11/26/14, PPL processing recovered 34.9 % of the DOC and subsequent processing
with ED recovered an additional 40.5 % for an overall DOC recovery of 75.4 %. Overall,
the average DOC recovery using solely PPL on four Skidaway dock seawater samples was
38.1 ± 2.3 % (Fig. 2). Subsequent ED of all samples pre-treated with PPL recovered an
additional 38.6 ± 3.8 % of the DOC to obtain an overall recovery of 76.7 ± 2.6 %
(Fig. 2).
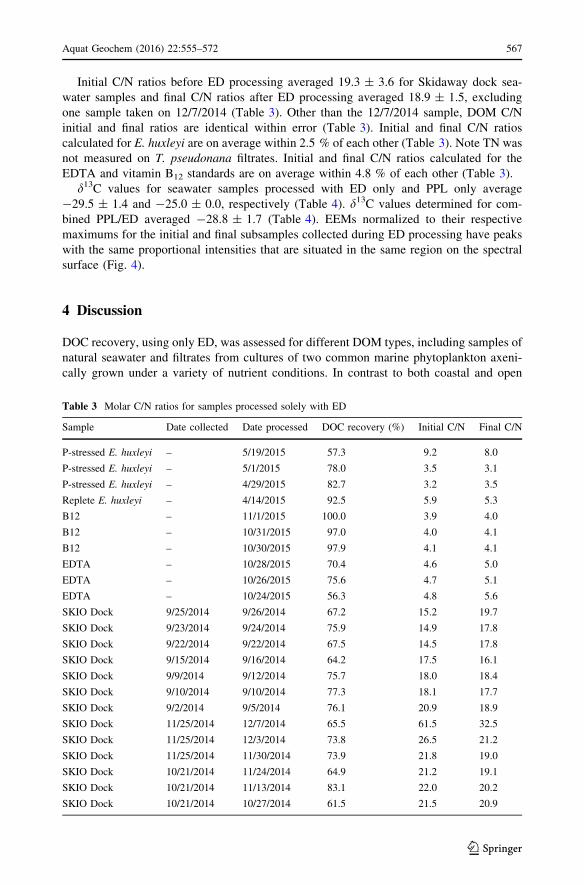
Open ocean samples collected off the coast of Savannah and processed in triplicate with
ED had recoveries of 50.5 ± 3.1 %. The average DOC recovery using ED for five indi-
vidual cultures of T. pseudonana, grown under identical nutrient replete conditions,
averaged 64.8 ± 14.4 % (Fig. 3). The average DOC recovery using ED for four individual
cultures of T. pseudonana, grown under identical P-stressed conditions, averaged
64.1 ± 9.1 % (Fig. 3). The average DOC recovery using ED for three individual cultures
of T. pseudonana, grown under identical N-stressed conditions, averaged 69.1 ± 5.0 %
(Fig. 3). The average DOC recovery using ED for three individual cultures of E. huxleyi,
grown under nutrient replete conditions, averaged 84.4 ± 7.4 % (Fig. 3). The average
DOC recovery using ED for three individual cultures of E. huxleyi, grown under P-stressed
conditions, averaged 74.6 ± 15.3 % (Fig. 3). Overall, the average DOC recovery using ED
for all cultured phytoplankton filtrates averaged 70.3 ± 12.5 % (Fig. 3). A summary of ED
data for culture experiments is shown in Table S2.
0
10
20
30
40
50
60
70
80
90
100
DO
C R
ecov
ery
(%)
Date Processed
Individually Sampled Sampled 10/21/2014 Sampled 11/25/2014
Fig. 1 DOC recoveries of Skidaway dock seawater samples using ED only. Blue points are for individualsamples collected September 2014. Yellow and green points are for triplicate analysis of samples collectedon 11/25/2014 and 10/21/2014, respectively
Aquat Geochem (2016) 22:555–572 565
123
Standard compounds were processed with ED in triplicate. Glucose, EDTA, and vitamin
B12 had DOC recoveries of 90.2 ± 2.1, 67.5 ± 9.9, and 98.3 ± 1.6 %, respectively. A
summary of ED data for individual compound experiments is shown in Table S2.
0
10
20
30
40
50
60
70
80
90
100
11/26/2014 11/28/2014 12/10/2014 Run 1 12/10/2014 Run 2
DO
C R
ecov
ery
(%)
Date ProcessedPPL Recovery ED Recovery Total Recovery
Fig. 2 DOC recoveries for Skidaway dock seawater samples processed with PPL then ED. The left side ofthe figure displays the single 2-L aliquot of the sample collected on 10/21/14 and processed with PPL andsubsequently processed with ED on 11/26/14. The right side of the plot displays the three separate 2-Laliquots taken from the sample collected on 11/25/14 and processed with PPL and subsequently processedwith ED on 11/28/14, 12/10/14 (2 runs in 1 day)
0
10
20
30
40
50
60
70
80
90
100
DO
C R
ecov
ery
(%)
Date ProcessedThalassiosira pseudonana Emiliania huxleyi
RepleteP-stressedRepleteN-stressedP-stressed
Fig. 3 DOC recoveries of phytoplankton filtrates cultured under different growth conditions
566 Aquat Geochem (2016) 22:555–572
123
Initial C/N ratios before ED processing averaged 19.3 ± 3.6 for Skidaway dock sea-
water samples and final C/N ratios after ED processing averaged 18.9 ± 1.5, excluding
one sample taken on 12/7/2014 (Table 3). Other than the 12/7/2014 sample, DOM C/N
initial and final ratios are identical within error (Table 3). Initial and final C/N ratios
calculated for E. huxleyi are on average within 2.5 % of each other (Table 3). Note TN was
not measured on T. pseudonana filtrates. Initial and final C/N ratios calculated for the
EDTA and vitamin B12 standards are on average within 4.8 % of each other (Table 3).
d13C values for seawater samples processed with ED only and PPL only average
-29.5 ± 1.4 and -25.0 ± 0.0, respectively (Table 4). d13C values determined for com-
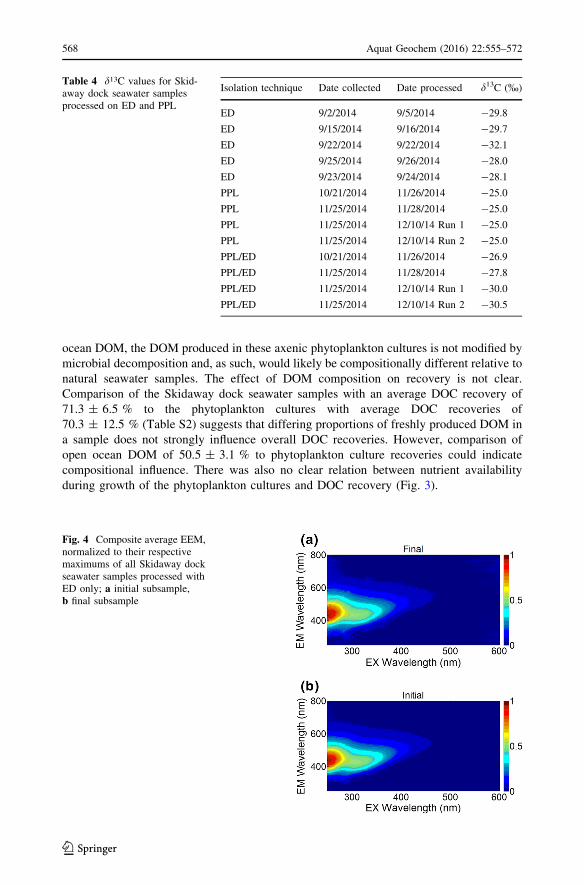
bined PPL/ED averaged -28.8 ± 1.7 (Table 4). EEMs normalized to their respective
maximums for the initial and final subsamples collected during ED processing have peaks
with the same proportional intensities that are situated in the same region on the spectral
surface (Fig. 4).
4 Discussion
DOC recovery, using only ED, was assessed for different DOM types, including samples of
natural seawater and filtrates from cultures of two common marine phytoplankton axeni-
cally grown under a variety of nutrient conditions. In contrast to both coastal and open
Table 3 Molar C/N ratios for samples processed solely with ED
Sample Date collected Date processed DOC recovery (%) Initial C/N Final C/N
P-stressed E. huxleyi – 5/19/2015 57.3 9.2 8.0
P-stressed E. huxleyi – 5/1/2015 78.0 3.5 3.1
P-stressed E. huxleyi – 4/29/2015 82.7 3.2 3.5
Replete E. huxleyi – 4/14/2015 92.5 5.9 5.3
B12 – 11/1/2015 100.0 3.9 4.0
B12 – 10/31/2015 97.0 4.0 4.1
B12 – 10/30/2015 97.9 4.1 4.1
EDTA – 10/28/2015 70.4 4.6 5.0
EDTA – 10/26/2015 75.6 4.7 5.1
EDTA – 10/24/2015 56.3 4.8 5.6
SKIO Dock 9/25/2014 9/26/2014 67.2 15.2 19.7
SKIO Dock 9/23/2014 9/24/2014 75.9 14.9 17.8
SKIO Dock 9/22/2014 9/22/2014 67.5 14.5 17.8
SKIO Dock 9/15/2014 9/16/2014 64.2 17.5 16.1
SKIO Dock 9/9/2014 9/12/2014 75.7 18.0 18.4
SKIO Dock 9/10/2014 9/10/2014 77.3 18.1 17.7
SKIO Dock 9/2/2014 9/5/2014 76.1 20.9 18.9
SKIO Dock 11/25/2014 12/7/2014 65.5 61.5 32.5
SKIO Dock 11/25/2014 12/3/2014 73.8 26.5 21.2
SKIO Dock 11/25/2014 11/30/2014 73.9 21.8 19.0
SKIO Dock 10/21/2014 11/24/2014 64.9 21.2 19.1
SKIO Dock 10/21/2014 11/13/2014 83.1 22.0 20.2
SKIO Dock 10/21/2014 10/27/2014 61.5 21.5 20.9
Aquat Geochem (2016) 22:555–572 567
123
ocean DOM, the DOM produced in these axenic phytoplankton cultures is not modified by
microbial decomposition and, as such, would likely be compositionally different relative to
natural seawater samples. The effect of DOM composition on recovery is not clear.
Comparison of the Skidaway dock seawater samples with an average DOC recovery of
71.3 ± 6.5 % to the phytoplankton cultures with average DOC recoveries of
70.3 ± 12.5 % (Table S2) suggests that differing proportions of freshly produced DOM in
a sample does not strongly influence overall DOC recoveries. However, comparison of
open ocean DOM of 50.5 ± 3.1 % to phytoplankton culture recoveries could indicate
compositional influence. There was also no clear relation between nutrient availability
during growth of the phytoplankton cultures and DOC recovery (Fig. 3).
Table 4 d13C values for Skid-away dock seawater samplesprocessed on ED and PPL
Isolation technique Date collected Date processed d13C (%)
ED 9/2/2014 9/5/2014 -29.8
ED 9/15/2014 9/16/2014 -29.7
ED 9/22/2014 9/22/2014 -32.1
ED 9/25/2014 9/26/2014 -28.0
ED 9/23/2014 9/24/2014 -28.1
PPL 10/21/2014 11/26/2014 -25.0
PPL 11/25/2014 11/28/2014 -25.0
PPL 11/25/2014 12/10/14 Run 1 -25.0
PPL 11/25/2014 12/10/14 Run 2 -25.0
PPL/ED 10/21/2014 11/26/2014 -26.9
PPL/ED 11/25/2014 11/28/2014 -27.8
PPL/ED 11/25/2014 12/10/14 Run 1 -30.0
PPL/ED 11/25/2014 12/10/14 Run 2 -30.5
Fig. 4 Composite average EEM,normalized to their respectivemaximums of all Skidaway dockseawater samples processed withED only; a initial subsample,b final subsample
568 Aquat Geochem (2016) 22:555–572
123
The recovery of three molecules of differing molecular weight, size, and charge was
examined using only ED. A 90.2 ± 2.1 % recovery of glucose (molecular weight 180.2)
was achieved using ED. This is in contrast to ultrafiltration techniques, for which such low
molecular weight molecules are below membrane size cutoffs (typically 1000 Da) and are
therefore expected to pass through the membranes resulting in extremely poor recoveries
(Repeta 2015). EDTA, another low molecular weight molecule (molecular weight 292.2),
has a charge of -4 at the ED operating pH (pH = 7). The lower recovery of EDTA
(67.5 ± 9.9 %) relative to electrically neutral glucose likely results from attractive forces
pulling negatively charged EDTA across the membrane toward the anode. Vitamin B12 is a
larger molecule (molecular weight 1355.4) than both glucose and EDTA, but it is elec-
trically neutral at the pH value maintained during ED processing. The size and charge
characteristics of B12 are both likely factors in its essentially complete (98.3 ± 1.6 %)
recovery during ED. The difference between glucose, EDTA, and B12 recoveries suggests
that both size and charge play a role in the molecular retention during ED, with small,
charged molecules having the lowest recoveries.
Using only ED, the high recoveries achieved on all sample types suggest that, unlike
SPE and cross-flow ultrafiltration, preferential size and/or compositional selection is
greatly reduced during the DOM isolation process. Reduced compositional and size
selectivity during ED relative to other methods is further reflected in the similarity of C/N
ratios and EEM spectra of initial and final subsamples. The percent difference between
initial and final molar C/N ratios obtained using ED was small in all sample types: Ski-
daway dock seawater 12.1 %, phytoplankton cultures 2.5 %, EDTA 9.6 %, and B12 0.1 %.
This suggests that ED isolation of DOM is not strongly selective in terms of the C/N ratio
of molecules retained. The peaks on the initial and final EEMs are situated in the same
regions and have the same proportional intensities, suggesting that ED is not selective
toward the molecular classes present in the fluorescent DOM fraction characterized by this
method (Fig. 4). Examination of two specific excitation wavelengths, 250 and 300 nm,
normalized to their respective maximums also shows a high correspondence (R2[ 0.99) of
initial and final samples (Supplement Fig. S2). This further confirms the similarities
between the initial and final EEM analyses. Average d13C values of -29.5 ± 1.4 and
-25.0 ± 0.0 for DOC isolated by ED and PPL, respectively (Table 4), suggest a differ-
ence in the DOC isolated by the two methods. There has been limited work on the d13Ccomposition of different molecular components of DOC (Bauer 2015); however, the lighter
isotopic composition of DOC isolated by ED may suggest that it contains higher pro-
portions of isotopically light hydrophobic components like lipids. DOC collected at the
Skidaway dock site would be expected to have substantial terrestrial influences given its
estuarine location. The average C/N ratio of 19.3 ± 3.6 is consistent with terrestrial
influence. It was not possible to determine the d13C of the whole water DOC using the
method employed. Final d13C values for the samples processed with ED are -29 ± 1.4 %and with PPL/ED are -28.8 ± 1.7 %, which compare to d13C values for freshwater
particulate organic matter (-30.4 to -34.5 %) from the Savannah River (Flite et al. 2008)
and terrigenous DOM in general (-25 to -30 %) (Boutton 1991; Williams and Gordon
1970) than to autochthonous, oceanic DOM (-18 to -28 %) (Beaupre 2015). As such, the
d13C values of ED and PPL/ED DOM are consistent with the d13C values expected for
estuarine samples.
The small increase in DOC recovery from 71.3 ± 6.5 % using only ED relative to the
recovery of 76.7 ± 2.6 % (Fig. 2) for the combined PPL, ED process is not statistically
significant (Student’s t test, p = 0.13). Thus, given the time-consuming cleaning and
sample processing times associated with PPL techniques, there is little overall benefit in
Aquat Geochem (2016) 22:555–572 569
123
processing samples with combined ED and PPL. Both ED and PPL/ED recovery values are
somewhat higher than the average value for studies applying combined ED/RO, 68 %
(Table 2). The small-volume design of the system used in this study eliminates the need for
RO to reduce sample volumes for subsequent freeze-drying. Elimination of RO processing
greatly reduces the membrane surface area contacted by the sample, which may increase
overall recovery and eliminate the need for a base rinse of the system to desorb DOM from
RO membranes. It is difficult to fully drain the sample from the system at the end of
processing; therefore, the overall sample recovery was likely higher in this study because
of the lower system volume, partly achieved through the elimination of RO. Although
freeze-drying times could be reduced by using RO, the issues described above counteract
the potential benefits of reduced freeze-drying times. Studies using combined ED/RO
(Table 2) were performed on systems that were designed to process approximately 200-L
samples. With system cleaning, processing of such large-volume samples requires
approximately 18 h per sample (excluding freeze-drying). In comparison, the small-vol-
ume ED system developed for this study required approximately 4 h to process one sample
with cleaning (excluding freeze-drying). This allows for greater analytical replication and
for the processing of smaller samples, such as the algal cultures examined in this study.
The smaller volume processed by the ED system used in this study also makes it physically
much smaller than the ED/RO systems used in previous studies. This greatly facilitates
system portability for processing samples on a ship or in the field.
5 Conclusions
ED processing of natural and artificial seawater samples in a system optimized for small
volumes (0.5–10 L) achieved reproducible DOC recoveries typically greater than those
obtained using the best previously applied techniques including PPL resins, cross-flow
ultrafiltration, and ED/RO. Sample processing by ED takes 3–5 h, and small starting
sample volumes alleviate the need for RO to reduce sample volumes. Similar DOC
recoveries of the Skidaway dock seawater samples and axenic phytoplankton culture
artificial seawater samples suggest that differing proportions of freshly produced molecules
does not influence recoveries. Comparison of initial and final C/N ratios, and EEMs
suggest the recovered DOM is compositionally representative of the DOM initially present
in the samples.
Acknowledgments This material is based upon work supported by the National Science Foundation underGrant OCE 1357375 (EDI), OCE 1316036 (STD), and NASA CAN7 (YT). Any opinions, findings, andconclusions or recommendations expressed in this material are those of the authors and do not necessarilyreflect the views of either the National Science Foundation or NASA.
References
Arrieta JM, Mayol E, Hansman RL, Herndl GJ, Dittmar T, Duarte CM (2015) Dilution limits dissolvedorganic carbon utilization in the deep ocean. Science 348:331–333. doi:10.1126/science.1258955
Bauer JE (2015) Chapter 8—chemical characterization and cycling of dissolved organic matter. In: HansellDA, Carlson CA (eds) Biogeochemistry of marine dissolved organic matter, 2nd edn. Academic Press,Saint Louis, pp 405–453
Beaupre SR (2015) The carbon isotopic composition of marine DOC. In: Biogeochemistry of marinedissolved organic matter, 2nd edn. Academic Press Ltd, London. doi:10.1016/b978-0-12-405940-5.00006-6
570 Aquat Geochem (2016) 22:555–572
123
Beckler JS, Nuzzio DB, Taillefert M (2014) Development of single-step liquid chromatography methodswith ultraviolet detection for the measurement of inorganic anions in marine waters. Limnol OceanogrMethods 12:563–576. doi:10.4319/lom.2014.12.563
Benner R, Strom M (1993) Measurement of dissolved organic carbon and nitrogen in natural waters—acritical evaluation of the analytical blank associated with DOC measurements by high-temperaturecatalytic oxidation. Mar Chem 41:153–160. doi:10.1016/0304-4203(93)90113-3
Benner R, Pakulski JD, McCarthy M, Hedges JI, Hatcher PG (1992) Bulk chemical characteristics ofdissolved organic matter in the ocean. Science 255:1561–1564
Boutton TW (1991) Stable carbon isotope ratios of natural materials. I. Sample preparation and massspectrometric analysis. In: Coleman DC, Fry, B (eds) Carbon Isotope Techniques. Academic Press,New York, pp 155–171
Chen H, Stubbins A, Perdue EM, Green NW, Helms JR, Mopper K, Hatcher PG (2014) Ultrahigh resolutionmass spectrometric differentiation of dissolved organic matter isolated by coupled reverse osmosis-electrodialysis from various major oceanic water masses. Mar Chem 164:48–59. doi:10.1016/j.marchem.2014.06.002
Coble PG, Green SA, Blough NV, Gagosian RB (1990) Characterization of dissolved organic matter in theBlack Sea by fluorescence spectroscopy. Nature 348:432–435. doi:10.1038/348432a0
Coble PG, Del Castillo CE, Avril B (1998) Distribution and optical properties of CDOM in the Arabian Seaduring the 1995 Southwest Monsoon. Deep Sea Res Part II Top Stud Oceanogr 45:2195–2223. doi:10.1016/s0967-0645(98)00068-x
Diaz J, Ingall E, Benitez-Nelson C, Paterson D, de Jonge MD, McNulty I, Brandes JA (2008) Marinepolyphosphate: a key player in geologic phosphorus sequestration. Science 320:652–655. doi:10.1126/science.1151751
Dittmar T, Koch B, Hertkorn N, Kattner G (2008) A simple and efficient method for the solid-phase extractionof dissolved organic matter (SPE-DOM) from seawater. Limnol Oceanogr Methods 6:230–235
Fellman JB, Hood E, Spencer RGM (2010) Fluorescence spectroscopy opens new windows into dissolvedorganic matter dynamics in freshwater ecosystems: a review. Limnol Oceanogr 55:2452–2462. doi:10.4319/lo.2010.55.6.2452
Flite O, Eidson G, Moak J, Metts B, Sefick S (2008) Overview of stable isotope results from a compre-hensive Savannah River study. Paper presented at the S.C. Water Resources Conference, Charleston,SC
Fry B, Garritt R, Tholke K, Neill C, Michener RH, Mersch FJ, Brand W (1996) Cryoflow: cryofocusingnanomole amounts of CO2, N-2, and SO2 from an elemental analyzer for stable isotopic analysis.Rapid Commun Mass Spectrom 10:953–958. doi:10.1002/(sici)1097-0231(19960610)10:8\953:aid-rcm534[3.0.co;2-0
Grasshoff K, Kremling K, Ehrhardt M (1999) Methods of seawater analysis, 3rd edn. Wiley-VCH, NewYork
Green NW et al (2014) An intercomparison of three methods for the large-scale isolation of oceanicdissolved organic matter. Mar Chem 161:14–19. doi:10.1016/j.marchem.2014.01.012
Guillard RL (1975) Culture of phytoplankton for feeding marine invertebrates. In: Smith W, Chanley M(eds) Culture of marine invertebrate animals. Springer, New York, pp 29–60. doi:10.1007/978-1-4615-8714-9_3
Guillard RRL, Hargraves PE (1993) Stichochrysis-immobilis is a diatom, not a chyrsophyte. Phycologia32:234–236. doi:10.2216/i0031-8884-32-3-234.1
Guillard RR, Ryther JH (1962) Studies of marine planktonic diatoms. 1. Cyclotella Nana Hustedt, andDetonula Confervacea (Cleve) Gran. Can J Microbiol 8:229
Guo L, Wen L-S, Tang D, Santschi PH (2000) Re-examination of cross-flow ultrafiltration for samplingaquatic colloids: evidence from molecular probes. Mar Chem 69:75–90. doi:10.1016/S0304-4203(99)00097-3
Gurtler BK, Vetter TA, Perdue EM, Ingall E, Koprivnjak JF, Pfromm PH (2008) Combining reverse osmosisand pulsed electrical current electrodialysis for improved recovery of dissolved organic matter fromseawater. J Membr Sci 323:328–336. doi:10.1016/j.memsci.2008.06.025
Hansell DA, Carlson CA (2015) Preface. In: Hansell DA, Carlson CA (eds) Biogeochemistry of marinedissolved organic matter, 2nd edn. Academic Press, Saint Louis, pp xvii–xviii
Helms JR et al (2015) Spectroscopic characterization of oceanic dissolved organic matter isolated by reverseosmosis coupled with electrodialysis. Mar Chem 177(Part 2):278–287. doi:10.1016/j.marchem.2015.07.007
Hertkorn N, Harir M, Koch BP, Michalke B, Schmitt-Kopplin P (2013) High-field NMR spectroscopy andFTICR mass spectrometry: powerful discovery tools for the molecular level characterization of marinedissolved organic matter. Biogeosciences 10:1583–1624. doi:10.5194/bg-10-1583-2013
Aquat Geochem (2016) 22:555–572 571
123
Jaffe R, Cawley KM, Yamashita Y (2014) Applications of excitation emission matrix fluorescence withparallel factor analysis (EEM-PARAFAC) in assessing environmental dynamics of natural dissolvedorganic matter (DOM) in aquatic environments: a review. In: RosarioOrtiz F (ed) Advances in thephysicochemical characterization of dissolved organic matter: impact on natural and engineered sys-tems, ACS symposium series, vol 1160. Amer Chemical Soc, Washington, pp 27–73
Kester DR, Duedall IW, Connors DN, Pttkowicz RM (1967) Preparation of artificial seawater. LimnolOceanogr 12:177–179
Koprivnjak JF, Perdue EM, Pfromm PH (2006) Coupling reverse osmosis with electrodialysis to isolatenatural organic matter from fresh waters. Water Res 40:3385–3392. doi:10.1016/j.watres.2006.07.019
McCarthy MD, Hedges JI, Benner R (1993) The chemical composition of dissolved organic matter inseawater. Chem Geol 107:503–507. doi:10.1016/0009-2541(93)90240-j
Mopper K, Stubbins A, Ritchie JD, Bialk HM, Hatcher PG (2007) Advanced instrumental approaches forcharacterization of marine dissolved organic matter: extraction techniques, mass spectrometry, andnuclear magnetic resonance spectroscopy. Chem Rev 107:419–442. doi:10.1021/cr050359b
Pfromm PH, Tsai SP, Henry MP (1999) Electrodialysis for bleach effluent recycling in kraft pulp pro-duction: simultaneous control of chloride and other non-process elements. Can J Chem Eng77:1231–1238
Repeta DJ (2015) Chapter 2—chemical characterization and cycling of dissolved organic matter. In: CarlsonDAHA (ed) Biogeochemistry of marine dissolved organic matter, 2nd edn. Academic Press, SaintLouis, pp 21–65
Ruiz B, Sistat P, Huguet P, Pourcelly G, Araya-Farias M, Bazinet L (2007) Application of relaxation periodsduring electrodialysis of a casein solution: impact on anion-exchange membrane fouling. J Membr Sci287:41–50. doi:10.1016/j.memsci.2006.09.046
Stedmon CA, Alvarez-Salgado XA (2011) Shedding light on a black box: UV–visible spectroscopiccharacterization of marine dissolved organic matter. In: Jiao N, Azam F, Sander S (eds) Microbialcarbon pump in the ocean. AAAS, Washington DC, pp 62–63
Stedmon CA, Bro R (2008) Characterizing dissolved organic matter fluorescence with parallel factoranalysis: a tutorial. Limnol Oceanogr Methods 6:572–579
Stubbins A, Niggemann J, Dittmar T (2012) Photo-lability of deep ocean dissolved black carbon. Bio-geosciences 9:1661–1670. doi:10.5194/bg-9-1661-2012
Stubbins A, Lapierre JF, Berggren M, Prairie YT, Dittmar T, del Giorgio PA (2014) What’s in an EEM?Molecular signatures associated with dissolved organic fluorescence in boreal Canada. Environ SciTechnol 48:10598–10606. doi:10.1021/es502086e
Verity PG (2002) A decade of change in the Skidaway River estuary. I. Hydrography and nutrients.Estuaries 25:944–960. doi:10.1007/bf02691343
Vetter TA, Perdue EM, Ingall E, Koprivnjak JF, Pfromm PH (2007) Combining reverse osmosis andelectrodialysis for more complete recovery of dissolved organic matter from seawater. Sep PurifTechnol 56:383–387. doi:10.1016/j.seppur.2007.04.012
Wagner S, Jaffe R, Cawley K, Dittmar T, Stubbins A (2015) Associations between the molecular and opticalproperties of dissolved organic matter in the Florida Everglades, a model coastal wetland systemFrontiers. Chemistry. doi:10.3389/fchem.2015.00066
Walker BD, Beaupre SR, Guilderson TP, Druffel ERM, McCarthy MD (2011) Large-volume ultrafiltrationfor the study of radiocarbon signatures and size vs. age relationships in marine dissolved organicmatter. Geochim Cosmochim Acta 75:5187–5202. doi:10.1016/j.gca.2011.06.015
Williams PM, Gordon LI (1970) C-13-C-12 ratios in dissolved and particulate organic matter in sea. DeepSea Res 17:19. doi:10.1016/0011-7471(70)90085-9
Young CL, Ingall ED (2010) Marine dissolved organic phosphorus composition: insights from samplesrecovered using combined electrodialysis/reverse osmosis. Aquat Geochem 16:563–574. doi:10.1007/s10498-009-9087-y
572 Aquat Geochem (2016) 22:555–572
123