Enhanced Core Noise Modeling for Turbofan EnginesEnhanced Core Noise Modeling for Turbofan Engines...
59
James R. Stone, Eugene A. Krejsa, and Bruce J. Clark MTC Technologies, Westlake, Ohio Enhanced Core Noise Modeling for Turbofan Engines NASA/CR—2011-217026 June 2011
Transcript of Enhanced Core Noise Modeling for Turbofan EnginesEnhanced Core Noise Modeling for Turbofan Engines...

James R. Stone, Eugene A. Krejsa, and Bruce J. ClarkMTC Technologies, Westlake, Ohio
Enhanced Core Noise Modeling for Turbofan Engines
NASA/CR—2011-217026
June 2011

NASA STI Program . . . in Profile
Since its founding, NASA has been dedicated to the advancement of aeronautics and space science. The NASA Scientific and Technical Information (STI) program plays a key part in helping NASA maintain this important role.
The NASA STI Program operates under the auspices of the Agency Chief Information Officer. It collects, organizes, provides for archiving, and disseminates NASA’s STI. The NASA STI program provides access to the NASA Aeronautics and Space Database and its public interface, the NASA Technical Reports Server, thus providing one of the largest collections of aeronautical and space science STI in the world. Results are published in both non-NASA channels and by NASA in the NASA STI Report Series, which includes the following report types: • TECHNICAL PUBLICATION. Reports of
completed research or a major significant phase of research that present the results of NASA programs and include extensive data or theoretical analysis. Includes compilations of significant scientific and technical data and information deemed to be of continuing reference value. NASA counterpart of peer-reviewed formal professional papers but has less stringent limitations on manuscript length and extent of graphic presentations.
• TECHNICAL MEMORANDUM. Scientific
and technical findings that are preliminary or of specialized interest, e.g., quick release reports, working papers, and bibliographies that contain minimal annotation. Does not contain extensive analysis.
• CONTRACTOR REPORT. Scientific and
technical findings by NASA-sponsored contractors and grantees.
• CONFERENCE PUBLICATION. Collected papers from scientific and technical conferences, symposia, seminars, or other meetings sponsored or cosponsored by NASA.
• SPECIAL PUBLICATION. Scientific,
technical, or historical information from NASA programs, projects, and missions, often concerned with subjects having substantial public interest.
• TECHNICAL TRANSLATION. English-
language translations of foreign scientific and technical material pertinent to NASA’s mission.
Specialized services also include creating custom thesauri, building customized databases, organizing and publishing research results.
For more information about the NASA STI program, see the following:
• Access the NASA STI program home page at http://www.sti.nasa.gov
• E-mail your question via the Internet to help@
sti.nasa.gov • Fax your question to the NASA STI Help Desk
at 443–757–5803 • Telephone the NASA STI Help Desk at 443–757–5802 • Write to:
NASA Center for AeroSpace Information (CASI) 7115 Standard Drive Hanover, MD 21076–1320

James R. Stone, Eugene A. Krejsa, and Bruce J. ClarkMTC Technologies, Westlake, Ohio
Enhanced Core Noise Modeling for Turbofan Engines
NASA/CR—2011-217026
June 2011
National Aeronautics andSpace Administration
Glenn Research Center Cleveland, Ohio 44135
Prepared under Contract NAS3–00178, Task Order 15

Available from
NASA Center for Aerospace Information7115 Standard DriveHanover, MD 21076–1320
National Technical Information Service5301 Shawnee Road
Alexandria, VA 22312
Available electronically at http://www.sti.nasa.gov
Trade names and trademarks are used in this report for identification only. Their usage does not constitute an official endorsement, either expressed or implied, by the National Aeronautics and
Space Administration.
This work was sponsored by the Fundamental Aeronautics Program at the NASA Glenn Research Center.
Level of Review: This material has been technically reviewed by NASA expert reviewer(s).
This report is a formal draft or working paper, intended to solicit comments and
ideas from a technical peer group.
This report contains preliminary findings, subject to revision as analysis proceeds.

NASA/CR—2011-217026 iii
Contents Executive Summary ...................................................................................................................................... v 1.0 Introduction .......................................................................................................................................... 1
1.1 Background ................................................................................................................................. 1 1.2 Approach ..................................................................................................................................... 2 1.3 Sample Extraction ....................................................................................................................... 3
2.0 Validation of Jet Noise Model .............................................................................................................. 4 2.1 CF6 Engine ................................................................................................................................. 4 2.2 CF34 Engine ............................................................................................................................... 5 2.3 CFM56 Engine ............................................................................................................................ 5 2.4 GE90 Engine ............................................................................................................................... 6 2.5 Accuracy of Jet Noise Prediction ................................................................................................ 6
3.0 Core Noise Correlation ......................................................................................................................... 6 3.1 Component Level Correlations ................................................................................................... 6
3.1.1 Low Frequency Component .......................................................................................... 7 3.1.2 Middle Frequency Component ...................................................................................... 7 3.1.3 High Frequency Component ......................................................................................... 7
3.2 Spectral Directivity Correlations ................................................................................................ 8 3.2.1 Low Frequency Component .......................................................................................... 8 3.2.2 Middle Frequency Component ...................................................................................... 8 3.2.3 High Frequency Component ......................................................................................... 8
3.3 Statistical Evaluation .................................................................................................................. 9 3.4 Application of Correlation to Other Engines .............................................................................. 9
3.4.1 JT15D .......................................................................................................................... 10 3.4.2 YF102.......................................................................................................................... 10 3.4.3 Prospects for Extension/Improvement ........................................................................ 10
4.0 Concluding Remarks .......................................................................................................................... 10 References ................................................................................................................................................... 11 Appendix A.—Nomenclature ..................................................................................................................... 47
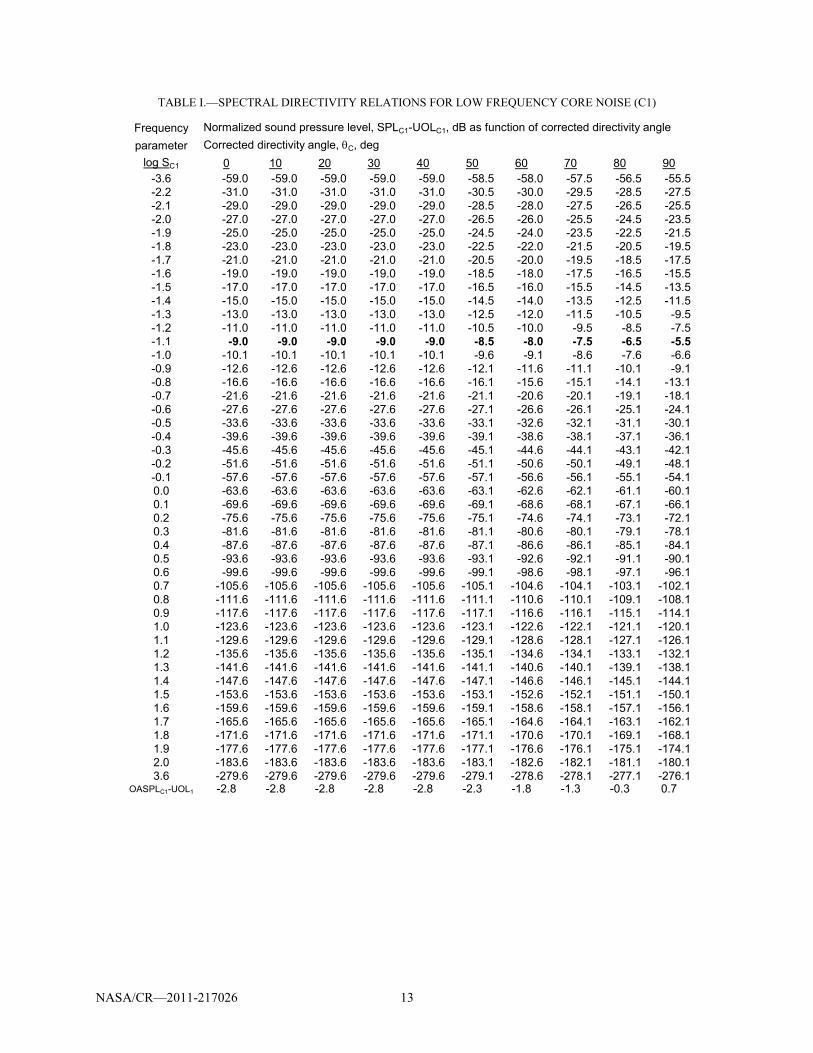
List of Tables Table I.—Spectral Directivity Relations For Low Frequency Core Noise (C1) ......................................... 13 Table II.—Spectral Directivity Relations For Mid-Frequency Core Noise (C2) ........................................ 15 Table III.—Spectral Directivity Relations For High Frequency Core Noise (C3) ..................................... 17
List of Figures Figure 1.—Flight Effect Variables for Engine Exhaust Noise. .................................................................. 19 Figure 2.—Typical Example Flight Effects on Exhaust Noise. .................................................................. 19 Figure 3.—Typical Component Extraction for CF6-80C2A5F at Low Power, Vmix/camb = 0.402.............. 20 Figure 4.—Comparison of Experimental and Predicted Spectra for CF6-80C2A5F at High Power,
Vmix/camb = 1.004. ................................................................................................................................ 21 Figure 5.—Comparison of Experimental and Predicted OASPL Directivities for CF6-80C2A5F at
3534 rpm and Vmix/camb = 1.004. .................................................................................................... 24 Figure 6.—Comparison of Experimental and Predicted Spectra for CF34-8C at High Power,
Vmix/camb =1.049. ................................................................................................................................. 24 Figure 7.—Comparison of Experimental and Predicted OASPL Directivities for CF34-9C at High
Power, Vmix/camb = 1.049. ................................................................................................................... 27

NASA/CR—2011-217026 iv
Figure 8.—Comparison of Experimental and Predicted Spectra for CFM56-5B/P High Power, Vmix/camb = 1.006. ................................................................................................................................ 27
Figure 9.—Comparison of Experimental and Predicted OASPL Directivities for CFM56-5B/P at High Power, Vmix/camb = 1.006. .......................................................................................................... 30
Figure 10.—Comparison of Experimental and Predicted Spectra for GE90 at High Power, Vmix/camb = 0.906. ................................................................................................................................ 30
Figure 11.—Comparison of Experimental and Predicted OASPL Directivities for GE90 at High Power, Vmix/camb = 0.906. ................................................................................................................... 33
Figure 12.—Core Noise Level Correlations. .............................................................................................. 33 Figure 13.—Normalized Spectra for Low Frequency Core Noise. ............................................................ 35 Figure 14.—Normalized Spectra for Middle Frequency Core Noise. ........................................................ 37 Figure 15.—Normalized Spectra for High Frequency Core Noise. ............................................................ 40 Figure 16.—Error (Experimental—Predicted) Versus Nondimensional Mixed Jet Velocity..................... 42 Figure 17.—Standard Deviation Versus Nondimensional Mixed Jet Velocity. ......................................... 43 Figure 18.—Root-Mean-Square Error Versus Nondimensional Mixed Jet Velocity. ................................ 43 Figure 19.—Experimental 3-Signal Coherence Spectra Compared With Correlation at Directivity
Angle θ = 120 deg for JT15D Engine. ............................................................................................... 44 Figure 20.—Experimental Spectra Compared With Correlation at Directivity Angle θ = 120 deg
for YF-102 Engine. ............................................................................................................................ 46

NASA/CR—2011-217026 v
Executive Summary This report describes work performed by MTC Technologies (MTCT) for NASA Glenn Research
Center (GRC) under Contract NAS3-00178, Task Order No. 15. MTCT previously developed a first-generation empirical model that correlates the core/combustion noise of four GE engines, the CF6, CF34, CFM56, and GE90 for General Electric (GE) under Contract No. 200-1X-14W53048, in support of GRC Contract NAS3-01135. MTCT has demonstrated in earlier noise modeling efforts that the improvement of predictive modeling is greatly enhanced by an iterative approach, so in support of NASA’s Quiet Aircraft Technology Project, GRC sponsored this effort to improve the model.
Since the noise data available for correlation are total engine noise spectra, it is total engine noise that must be predicted. Since the scope of this effort was not sufficient to explore fan and turbine noise, the most meaningful comparisons must be restricted to frequencies below the blade passage frequency. Below the blade passage frequency and at relatively high power settings jet noise is expected to be the dominant source, and comparisons are shown that demonstrate the accuracy of the jet noise model recently developed by MTCT for NASA under Contract NAS3-00178, Task Order No. 10. At lower power settings the core noise became most apparent, and these data corrected for the contribution of jet noise were then used to establish the characteristics of core noise. There is clearly more than one spectral range where core noise is evident, so the spectral approach developed by von Glahn and Krejsa in 1982 wherein four spectral regions overlap, was used in the GE effort. Further analysis indicates that the two higher frequency components, which are often somewhat masked by turbomachinery noise, can be treated as one component, and it is on that basis that the current model is formulated. The frequency scaling relationships are improved and are now based on combustor and core nozzle geometries.
In conjunction with the Task Order No. 10 jet noise model, this core noise model is shown to provide statistical accuracy comparable to the jet noise model for frequencies below blade passage. This model is incorporated in the NASA FOOTPR code and a user’s guide is provided.


NASA/CR—2011-217026 1
Enhanced Core Noise Modeling for Turbofan Engines
James R. Stone, Eugene A. Krejsa, and Bruce J. Clark MTC Technologies
Westlake, Ohio 44145
1.0 Introduction The introduction of high bypass ratio turbofan engines on modern aircraft has led to a substantial
reduction of jet exhaust noise, in comparison to the older low bypass and turbojet engines. However, the growth of air traffic and the need to protect the environment in the vicinity of airports result in the need to further reduce jet noise. Local noise restrictions and the likelihood of international agreement on stricter noise rules in the near future make this need more urgent. Still higher bypass ratio engines and devices that can reduce noise without major weight or performance penalties are under development. As fan noise is reduced in these newer engines, jet exhaust noise reduces the system benefits that can be obtained.
With the evolution from turbojets to first low-bypass and then high-bypass turbofan engines, the importance of noise sources other than jet mixing became apparent. In addition to the fairly obvious fan noise, other internal sources became apparent throughout the spectrum. Since it was difficult to determine exactly what source or mechanism was responsible for each part of the spectrum, the term “core noise” was evolved to describe all noise generated within the engine core, or essentially all noise not generated by the fan or the jet. Mahan and Karchmer (Ref. 1) state, “Combustion noise in gas turbine engines is classified according to source mechanism as either direct or indirect. Direct combustion noise is produced by the combustion process itself, while indirect combustion noise occurs when the hot products of combustion pass through the turbine and exhaust nozzle. The combination of direct and indirect combustion noise in a gas turbine engine makes up an important part of what is generally called core noise. Depending on the authority cited, core noise may or may not include compressor noise as well as turbine noise not associated with the combustion process. In some quarters, core noise is defined as all noise exclusive of jet noise emitted into the rear arc of gas turbine engine.” To help quantify this somewhat elusive noise component so that it can be properly included in engine system noise assessments, a task was undertaken to develop a predictive model for combustion/core noise for General Electric (GE) with support from NASA Glenn Research Center (GRC) (Ref. 2). This effort is to develop an improved and more general model. For simplicity we will use the “core noise” identification.
1.1 Background
The real importance of core noise relative to jet noise for gas turbine engines did not become appreciated until relatively good quality flight data became available in the 1970s. Some of the terminology needed to describe flight effects is shown in Figure 1 (from Ref. 3). The cases considered in this discussion are level flyovers at airplane velocity V0, with the observer located at an angle θ from the inlet axis. According to classical jet noise theory (e.g., Ffowcs Williams, Ref. 4) in-flight noise should follow a fairly simple relation. For a given absolute jet velocity Vj, increasing the flight velocity V0 reduces the velocity of the jet relative to the air. This reduces the shear, and therefore the noise should be less in flight.
Interest in jet noise flight effects and in core noise was greatly stimulated when Rolls Royce (Refs. 5 and 6) reported results like those shown in Figure 2, where the overall sound pressure level OASPL is plotted against the directivity angle θ. The static case is shown by the solid curve, and the corresponding flight case is shown by the dash-dot curve. The noise in the rear quadrant was reduced, as expected. However, in some cases, such as the one shown here, the noise in the forward quadrant increased in flight. Further confusing the issue is the fact that model-jet simulated flight tests indicate that in-flight noise should be reduced at all angles, roughly in agreement with theory, as shown by the dashed curve. Studies

NASA/CR—2011-217026 2
conducted or sponsored by NASA suggest that these apparent anomalies can be resolved when the engine internal noise, or “core noise,” is considered (e.g., Refs. 7 to 13). The core noise is amplified by a sufficient amount (Ref. 14) in the forward quadrant (θ < 90 deg) that the total in-flight noise exceeds the static level even though the jet noise is reduced. The primary source of the low-to-middle frequency, broadband core noise is the combustor, including both “direct” and “indirect” combustion noise. Direct combustion noise is that generated by the mixing and burning processes, while indirect combustion noise results from the combustion-generated nonuniform flow through area changes such as the turbine and nozzle.
Engine ground tests are hard to interpret because of the tendency for jet mixing noise, which is reduced in flight, to obscure the core/combustion noise, which is not. Because both noise components are primarily broadband and peak at similar frequencies, it is very difficult to separate their contributions. The earliest prediction procedures for core/combustion noise (Refs. 15 to 17) were based primarily on combustor rig data, but Reference 16 does include engine tests data. These predictive models do not agree on some parametric effects. It was in the late 1970s and early 1980s that the most relevant experimental work was done to determine the far-field noise emanating from the engine core for a turbofan engine (e.g., Refs. 18 to 20). Perhaps of greater concern is that recent tests indicate that combustion noise may be increased by as much as 10 to 15 dB for low emission combustors compared with conventional combustors for which predictive models, though crude, exist (Ref. 21).
1.2 Approach
This FOOTPR framework (Ref. 22) has been used by MTCT in developing noise prediction models for NASA and the industry. Most recently we have developed a model for predicting the jet noise for a wide variety of single and dual-stream nozzles (Ref. 23). Since the core/combustion noise is at low to moderately high frequencies, it is the jet noise that is most important to estimate correctly in order to isolate the core/combustion noise. However, for the middle frequency region fan noise can become in an important factor. In our initial analysis of the recent engine data, assuming that the combustion noise spectrum would have a rather broad, single-peaked spectrum as in earlier models (e.g., Refs. 15, 16, and 24) was found not to be consistent with the data, as multiple peaks were apparent (Ref. 2). We reviewed the findings of von Glahn and Krejsa (Ref. 20) wherein as many as four core-related peaks were found for several turbofan engines from three-signal coherence analysis. We also noted that recent results for low-emissions combustors (Ref. 21) also exhibited such trends. Further analyses after the completion of the GE task (Ref. 2) led us to conclude that because of the partial masking of the two higher frequency core noise components by turbomachinery noise, a three-component core noise model was most appropriate.
For the current effort the noise for all the engine components was predicted, with the combustion core noise assumed to consist of three spectral regions. Since the engines tested had some acoustic treatment, some arbitrary adjustments had to be made for the fan noise (Ref. 25); turbine parameters were not provided, so turbine noise (Ref. 26) could not be predicted. It is likely that some of the high frequency noise currently attributed to plug separation noise is actually turbine noise.
The jet noise, consisting of four components, is calculated using the model of Reference 27 with very limited adjustments depending on the confidence we have in the individual component predictions. For the large-scale (“merged”) turbulent mixing noise generated well downstream of the nozzle exits, only ±1.0 dB is used in fitting the individual test cases. For small-scale turbulent mixing noise generated near the nozzle exits, ±2.0 dB is tolerated, while for transitional/intermediate scale (“premerged”) turbulent mixing noise, and plug separation noise, the tolerances are ±3.0 and 4.0 dB, respectively.
An important point to understanding our analysis approach is to recognize that for each component, at any angle and at any frequency, the sound pressure level SPLcomp,EE is always directly proportional to the component coefficient, Ccomp,exp. The process is iterative. We initially compare the experimental results with absolute prediction (Ref. 27 for jet noise, Ref. 25 for fan noise, and Ref. 2 modified to three components for core noise). We next adjust the five coefficients in the fan noise prediction (forward broadband, forward tone, multiple pure tones, aft broadband and aft tone) to provide reasonable

NASA/CR—2011-217026 3
“eye-ball” agreement in the vicinity of the BPF; since many of the test cases involve some degree of fan acoustic treatment, this process is rather crude. We do not attempt to minimize the errors at very high frequencies, since turbine noise is likely to be a major factor there. At this point we establish the frequency range over which each of the core noise components is most important and calculate the statistical relations between experimental and predicted total levels across these frequency bands. Finally, we vary the jet and core noise coefficients carefully in small increments (with jet coefficients constrained as mentioned above) to produce the minimum average error ∆ over each of these frequency ranges, often being able to achieve ∆ = 0.0 dB. This yields the experimental component coefficients CC1,exp, CC2,exp, and CC3,exp for core noise, along with CL,exp (large-scale mixing), CS,exp (small-scale mixing), CT,exp (transitional/intermediate scale mixing) and CP,exp (plug separation).
From these calculations the predicted contribution of each component to the total is calculated. This calculated difference, SPL(total)—SPL(component), is then applied to the experimental spectra to produce experimental/extracted spectra for each component, SPLcomp,EE. These component SPLs are significant only where the component SPL is close to the total, and it is on such data that our correlations are based.
As a starting point, we made the assumption that core noise should correlate with the same parameters included in the original NASA ANOPP core noise prediction (Ref. 15), where overall sound power level OAPWL was correlated as follows: OAPWL = Constant + 10 log WI {[TC,o – TC,i] [PC,i/Pamb] [Tamb/TC,i]}2 (1) Where WI is the total core mass flow rate (fuel and air), TC,o is the combustor outlet temperature, TC,i is the combustor inlet temperature, Tamb is the ambient temperature, PC,i is the combustor inlet pressure, and Pamb is the ambient pressure.
1.3 Sample Extraction
A sample of our component noise extraction procedure, discussed above, is shown in Figure 3 for one specific engine. (The values of SPL on the figure are relative, as the exact values are proprietary to GE). Total experimental spectra and experimental/extracted (denoted EE) component spectra are shown for nominal directivity angles (with respect to the inlet axis) θ = 90, 120, and 150 deg are shown in Figure 3(a) to (c). Note that we break the core noise contributions into three regions, denoted C1, C2, and C3. The jet noise components are denoted L for large scale mixing, S for small scale mixing, T for transitional mixing, and P for plug separation; turbomachinery noise is denoted by tm. (Note that software limitations cause subscripts to appear as normal text in figure legends.) The turbomachinery noise tends to dominate at frequencies above the blade passage frequency, in this case 1045 Hz, with jet and core noise dominating at lower frequencies, especially toward the sideline and in the rear quadrant, as shown here. At this very low power setting, the total engine noise below 1000 Hz is well above that predicted for jet noise, except at very low frequency and as we approach the jet axis (Fig. 3(c)). The coefficients for the three core noise components are adjusted to minimize the error between experimental and predicted total SPLs over the appropriate frequency ranges. The adjustments to the jet noise model in this case were 1.0 dB for large scale mixing noise, 0.0 dB on small scale mixing noise, 3.0 dB, and 4.0 dB on plug separation noise (which may also include turbine noise.)
For this particular case, the middle and high frequency core noise components are quite evident at θ = 90 and 120 deg (Figs. 3(a) and (b)), and the third is clearly evident even at θ = 150 deg (Fig. 3(c)). The low frequency core noise component is on the same order as the large scale mixing noise at θ = 90 and 120 deg (Fig. 3(a) and (b)) and is obscured by this jet noise component at θ = 150 deg (Fig. 3(c)). These observations are not general; each case must be considered individually.
The component coefficients obtained in this manner for the full set of cases analyzed are correlated as a function of combustor design and aerothermodynamic variables to yield the final predictive model.

NASA/CR—2011-217026 4
2.0 Validation of Jet Noise Model The development of the core noise model from total engine noise data requires the accurate prediction
of jet noise. It is at high power that jet noise is expected to be most evident, so this section shows comparisons of experimental data with predictions for all four engines at the highest power setting. The jet noise components, large scale mixing (SPLL,Pred), small scale mixing (SPLS,Pred), transitional/ intermediate scale mixing (SPLT,Pred), and the plug separation noise (SPLP,Pred) are all predicted using the relations of Reference 27 exactly, with no adjustment. The turbomachinery noise (SPLtm,Pred) is very crudely predicted/fit by a temporary method. Even though jet noise is expected to be dominant below the blade passage frequency, core noise is estimated using the finalized model exactly as described later in this report; these components are SPLC1,Pred, SPLC2,Pred, and SPLC3,Pred. The point of the comparisons in this section is that the jet noise model of Reference 27 is valid for these engines.
2.1 CF6 Engine
Figure 4 presents a comparison of the experimental spectra with prediction at the highest power setting tested, 3534 rpm. Blade passage frequency (BPF) is 2238 Hz.
It appears that the SPL is slightly over-predicted at low frequency, where large-scale turbulent mixing noise is expected to be dominant at all angles. At θ = 30 deg (Fig. 4(a)) the noise from about 200 Hz up to the BPF is predicted with reasonable accuracy, with a significant contribution from core noise even at this high power. These observations are also appropriate at θ = 60 deg (Fig. 4(b)) and θ = 90 deg (Fig. 4(c)), but the accuracy is better. At high frequencies, it is difficult to separate the relative contributions of small scale mixing noise, plug separation noise and turbomachinery noise. The large scale mixing prediction appears to be reasonably well validated over this angular range.
In the aft quadrant the jet mixing noise components are expected to become more dominant. At θ = 120 deg (Fig. 4(d)) the agreement below BPF is quite good, with large scale mixing noise predicted to dominate at f < 630 Hz, and with small scale mixing predicted to be most important at 1000 to 6300 Hz, except where fan tones appear. The under-prediction at f > BPF is likely due mainly to the turbomachinery noise or plug separation noise. At θ = 150 deg (Fig. 4(e)) the spectrum is predicted to be dominated by large scale mixing noise for f ≤ 1000 Hz and by small scale mixing noise at 1250 ≤ f ≤ 8000 Hz (again with the exception of fan tones). The agreement for f < BPF is very good, and at higher frequencies plug separation and/or turbomachinery noises appear to be somewhat under-predicted.
Overall there is an average over-prediction of the SPLs at all angles and f < BPF of 0.5 dB, with a standard deviation (σ) of 1.1 dB and a RMS error (ε) of 1.2 dB. This is quite good when it is recognized that most of the inaccuracy is in the crude core noise model. In comparison, as shown in Reference 27 in comparing repeat model tests for a nominal BPR = 5 external plug nozzle (Ref. 28) at Vmix/camb = 1.072±0.014 and Mf = 0.28, it was observed that when the data at all frequencies and all angles are considered the average error is ±0.9 dB, with σ = ε = 1.2 dB. When the component coefficients are adjusted as in Reference 27 the over-prediction is reduced to 0.1 dB, with σ = 0.9 dB and ε = 0.9 dB. Because of the improvements included in the present core noise model the statistical accuracy is significantly improved over that shown in Reference 2.
The OASPL directivity comparison is shown in Figure 5. Large scale mixing is the dominant component for all angles, and the agreement is good at all angles except very near the jet axis. The disagreement that exists at high angle is related to the fact that the jet noise model is calibrated to give reasonable results at these angles for both static and simulated (free jet) flight test. It is the contention of at least one of us (Stone) that the problem probably lies in the infinitesimally thin shear layer assumed in the transformation procedure; it is in the rear quadrant that the effects of the thick and spreading shear layer would be greatest.

NASA/CR—2011-217026 5
2.2 CF34 Engine
Analogous comparisons are shown in Figures 6 and 7 for a CF34-8C engine at the highest power setting tested, 7225 rpm, with BPF = 3372 Hz.
Spectral comparisons are shown at θ = 30 deg (Fig. 6(a)), and agreement below BPF is fairly good except for an under-prediction on the order of 2 dB at 125 to 250 Hz, probably due as much to the core noise as large-scale turbulent mixing noise. The agreement is a little better at θ = 60 deg (Fig. 6(b)), except for a near-tone at 125 Hz with the experimental SPL 3.4 dB above prediction. At θ = 90 deg (Fig. 6(c)) the agreement is excellent. At this angle large scale mixing noise is predicted to dominate up to f = 800 Hz, with the intermediate/transitional scales dominating from 800 ≤ f ≤ 2500 Hz, and small scale mixing being the strongest at 3150 to 8,000 Hz. The small scale mixing appears to be under-predicted by about 1.0 dB (This could also be due to fan noise.), with the lower frequency components being predicted very accurately. At θ = 120 deg (Fig. 6(d)) the mixing noise components are again predicted to dominate and the agreement is very good. At θ = 150 deg (Fig. 6(e)) the mixing noise components are still predicted to dominate, but the agreement is not as good and it appears that the large scale mixing noise is over-predicted. As discussed earlier, these aft angle problems may be due to the accommodation of the predictive model for simulated flight data. Looking at the full range of angles, the three components predicted for mixing noise agree rather well with the experimental data.
Overall there is an average over-prediction of the SPLs at all angles and f < BPF of 0.3 dB, with σ = 1.5 dB and ε = 1.8 dB. When the component coefficients are adjusted (slightly) the average is now exactly predicted (instead of over-predicted), with σ = 1.5 dB and ε = 1.7 dB. Again this is somewhat better agreement than shown in Reference 2.
The OASPL directivity comparison is shown in Figure 7. Large scale mixing is the dominant component, or nearly so for all θ, and the agreement is good except beyond θ = 140 deg. The aft angle disagreement is a little worse than for the CF6 case (Fig. 5), probably for the same reasons.
2.3 CFM56 Engine
Analogous comparisons are shown in Figures 8 and 9 for a CFM56-5B/P engine at the highest power setting tested, 5053 rpm, with BPF = 3032 Hz.
Spectral comparisons are shown at θ = 30 deg (Fig. 8(a)) where the only jet noise predicted to be the strongest component is large scale mixing at f ≤ 160 Hz, and in that range the agreement is quite good. Through the middle frequencies where core noise is predicted to be the strongest contributor, there is fairly good agreement. Some over-prediction is evident at the higher frequencies where turbomachinery noise is most evident. At θ = 60 deg (Fig. 8(b)) there is some under-prediction across parts of the spectrum, with large scale mixing noise predicted to be strongest component for f ≤ 160 Hz and transitional/intermediate scale mixing significant over the 500 ≤ f ≤ 2000 Hz range. At θ = 90 deg (Fig. 8(c)) there is a 1 to 2 dB under-prediction over much of the spectrum. At θ = 120 deg (Fig. 8(d)) the spectral shape is predicted fairly well, but there is an under-prediction of about 1 to 2 dB. Large scale mixing noise is predicted to be dominant for f ≤ 400 Hz and transitional/intermediate scale mixing is predicted to be the strongest contributor for 631 ≤ f ≤ 1595 Hz. At θ = 150 deg (Fig. 8(e)) the agreement is fairly good up to BPF, although it appears that large scale mixing and transitional/intermediate scale mixing noises may be over-predicted by about 1 to 2 dB.
Overall there is an average under-prediction of the SPLs at all angles and f < BPF of 1.0 dB, with σ = 1.8 dB and ε = 1.8 dB. When the component coefficients are adjusted (slightly) the average is over-predicted by 0.1 dB, but with σ = 1.4 dB and ε = 1.5 dB.
The OASPL directivity comparison is shown in Figure 9. The agreement is not bad, but not quite as good as for the CF6 and CF34, with a fairly consistent over-prediction of about 1.5 dB for 40 ≤ θ ≤ 140 deg.

NASA/CR—2011-217026 6
2.4 GE90 Engine
Analogous comparisons are shown in Figures 10 and 11 for a GE90 engine at the highest power setting tested, 2400 rpm, with BPF = 880 Hz. For this large, slowly rotating engine, turbomachinery noise is expected to obscure jet and core noise more than for the smaller engines, furthermore fan multiple pure tones appear to generate significant noise at f < BPF.
Spectral comparisons throughout the forward quadrant, shown at θ = 30, 60 and 90 deg (Figs. 10(a) to (c)), indicate that large-scale turbulent mixing noise should predominate for f ≤ 200Hz; these low frequency levels are somewhat under-predicted at θ = 30 deg (Fig. 10(a)) but are in good agreement at higher angles. Inaccurate prediction of fan multiple pure tones appears at θ = 30 and 60 deg (Figs. 10(a) to (b)), but at θ = 90 deg (Fig. 10(c)) the predicted multiple pure tones are low enough that the transitional/intermediate mixing noise is predicted to be the strongest component between about 251 and 631 Hz, and the agreement is good up to BPF. At θ = 120 and 150 deg (Figs. 10(d) to (e)) agreement is good for f ≤ BPF, indicating reasonably good agreement with the jet noise model.
Overall there is an average over-prediction of the SPLs at all angles and f < BPF of 0.5 dB, with σ = 1.7 dB and ε = 1.9 dB; this is primarily due to non-jet components. At the lowest frequencies, 50 to 126 Hz, there is an under-prediction of 0.5 dB, with σ = 1.2 dB and ε = 1.2 dB. When the component coefficients are adjusted (mainly combustion noise) the average for f < BPF is now predicted accurately to 0.1 dB, with slightly reduced scatter, σ = 1.6 dB and ε = 1.8 dB.
The OASPL directivity comparison is shown in Figure 11. The agreement is not bad, but not quite as good as for the CF6 and CF34. The agreement is about the same or little better than CFM56.
2.5 Accuracy of Jet Noise Prediction
From these comparisons we conclude that the jet noise model is sufficiently accurate to enable reasonably accurate extraction of the core/combustor noise. When the statistics are averaged for these four cases in terms of all frequencies below BPF and all angles, the average predicted within less than 0.1 dB, with σ = 1.5 and ε = 1.6 dB. Considering that some of these errors are due to the core and turbomachinery contributions, it is not unreasonable to claim very good agreement for the jet noise model in regions where it is the dominant source.
3.0 Core Noise Correlation The experimental data for a wide range of test conditions on the various engines were analyzed in the
“extraction” process described in Section 1.3. This resulted in “experimental/extracted” spectra as a function of corrected directivity angle for each noise component. The correlation of the core noise component results is described in this section. First the component level coefficients, CC1, CC2, CC3, are determined using the following type of assumed relation. UOLC(i),EE = CC(i),exp – 20 log R + 10 log WI {[TC,o – TC,i] [PC,i/Pamb] [Tamb/TC,i]}2 (2) Where R is the source-to-observer distance, and UOLC(i),EE is the experimental/extracted overall sound pressure level for that component at a corrected directivity angle θ = 90 deg, but recall as explained earlier that CC(i),exp is determined to minimize the average error at all angles over the frequency range considered. These coefficients are then correlated as described in the following.
3.1 Component Level Correlations
Although the coefficients are defined as above (Eq. (2)), we observed that the variation of the component levels UOLC(i),EE with the NASA core noise parameter, log WI {[TC,o – TC,i] [PC,i/Pamb]

NASA/CR—2011-217026 7
[Tamb/TC,i]}2, does not always have a slope of 10 and may be a function of other variables. The approach we use is to plot the distance-corrected level (which is the value at θC,cor minimizing the error at all angles), UOLC(i),EE + 20 log R, versus 10 log WI {[TC,o – TC,i] [PC,i/Pamb] [Tamb/TC,i]}2 for each component and determining the effects of other variables by comparing the results for the different engines. Fuel nozzle number nf emerged as a possible correlating parameter (Fig. 12), as discussed below, but further analyses might yield better alternative approaches. The following general form is used for all three components: UOLC(i) = CC(i) – 20 log R + NC(i) log (WI {[TC,o – TC,i][PC,i/Pamb] [Tamb/TC,i]}2) – FC(i) log nf (3)
3.1.1 Low Frequency Component The normalized (distance-corrected) component level, UOLC1,EE + 20 log R, was plotted against
10 log WI {[TC,o – TC,i] [PC,i/Pamb] [Tamb/TC,i]}2 for the four engines, with differences between engines being evident. To bring the data bands closer together, the term – 20 log nf was added to the correlating parameter, as shown in Figure 12(a). To help emphasize the cases where this noise component is most important, the experimental data for each engine are divided into as many as three categories: significant, where this component is the strongest noise component at some angles and frequencies; marginal or tone contaminated, where exact correlation is not meaningful; and minor, where significant changes in the level of this component has very little effect on the total noise level at any angle or frequency, meaning that only very crude correlation of these levels is needed to provide accurate total noise prediction. As an example of a “minor” effect, the point falling 10 dB below the correlation line for the CF6 is so insensitive to this component that increasing its level by 10 dB (to the correlation value) would only increase the average error in total noise in this frequency range by 0.5 dB. The observed slope is less than the original NASA model predicts, and the following set of correlation parameters based on Equation (3) is obtained: UOLC1 = 78.0 – 20 log R + 7.0 log (WI {[TC,o – TC,i][PC,i/Pamb] [Tamb/TC,i]}2) – 14.0 log nf (5)
3.1.2 Middle Frequency Component The normalized component level was plotted against the core noise parameter, as was done for the
low frequency component. Again engine-to-engine differences were observed. In this case the term – 18 log nf was added to the correlating parameter, as shown in Figure 12(b). The same symbol convention is used to identify the relative sensitivity of each data point. For the “significant” cases, the scatter appears to be more than for the low frequency component; the middle frequency component is more difficult to extract since both large-scale and transitional jet noise, both of the other core noise components, and in some cases fan noise, can all contribute in this frequency range. The observed slope is as in the original NASA model, and the following set of correlation parameters based on Equation (3) is obtained: UOLC2 = 60.3 – 20 log R + 10.0 log (WI {[TC,o – TC,i][PC,i/Pamb] [Tamb/TC,i]}2) – 18.0 log nf (6)
3.1.3 High Frequency Component The normalized component level was plotted against the core noise parameter, as was done for the
two lower frequency components. In this case there did not appear to be any significant engine-to-engine differences, so the correlating parameter was not modified with a fuel nozzle number term. The results are shown in Figure 12(c). The same symbol convention is again used to identify the relative sensitivity of each data point. For the “significant” cases, the scatter appears to be more than for the low frequency component but somewhat less than for the middle frequency component. The slope is better defined than for any other component and is slightly less than the original NASA model; the following set of correlation parameters based on Equation (3) is obtained:

NASA/CR—2011-217026 8
UOLC3 = 42.5 – 20 log R + 9.0 log (WI {[TC,o – TC,i][PC,i/Pamb] [Tamb/TC,i]}2) (7)
3.2 Spectral Directivity Correlations
Correlations of the spectral directivity characteristics of the three core noise component are shown in Figures 13 to 15. For each component the normalized spectra are shown at θ = 30, 60, 90, 120 and 150 deg in parts (a), (b), (c), (d), and (e) of each figure. The component experimental extracted level at each angle and frequency, SPLC(i),EE, is normalized by subtracting the adjusted overall level for that component at θC = 90 deg, UOLC(i),EE. The normalized SPL is plotted versus the logarithmic Strouhal number for each component. Note that for all data plotted, the experimental extracted level is within 7 dB of the total. Data where this difference is greater than 7 dB are dominated by other noise components.
3.2.1 Low Frequency Component For the lowest frequency core noise (Fig. 13), the Strouhal number is based on core nozzle hydraulic
diameter (Dh,I) and ambient sonic velocity (camb), as follows: SC1 = fDh,I/camb (8) The agreement with prediction is reasonably good except at θ ≅ 150 deg, where jet noise is most dominant, making core noise inaccurate to extract. Even though the general agreement is reasonably good, it is possible that there are engine-to-engine effects that are not totally correlated. The sound pressure level of the low-frequency core noise component (SPLC1) is presented as a function of UOLC1 and SC1 in Table 1.
3.2.2 Middle Frequency Component For the middle frequency core noise (Fig. 14), the Strouhal number, is based on combustor diameter
(DC) and combustor exit sonic velocity (cC,o), as follows: SC2 = fDC/cC,o (9) Except at θ ≅ 150 deg, the agreement is not as good as for the lowest frequency component; largely due to the existence of strong tones for the CFM56. Also contributing to this is that fact there are more noise components overlapping in this range, both lowest and highest frequency core noise, as well as jet noise, making this component more inaccurate to extract. The sound pressure level of the middle-frequency core noise component (SPLC2) is presented as a function of UOLC2 and SC2 in Table 2.
3.2.3 High Frequency Component For the highest frequency core noise (Fig. 15), the Strouhal number is calculated as for the middle
frequency component, as follows: SC2 = fDC/cC,o (10) The agreement is not quite as good as for the middle frequency core noise, which is not surprising since fan noise can be a significant contributor in this frequency range, complicating the extraction process.
The characteristic lengths and velocities used in these Strouhal relations may very well change if data for other engines over a wider range of correlating variables become available. The selection of the currently used characteristic velocities and lengths was based simply on identifying a set that approximately correlated engine-to-engine trends and the fairly small trends with engine power. No claim is made that better relationships cannot be found with further study. The sound pressure level of the high-frequency core noise component (SPLC3) is presented as a function of UOLC3 and SC3 in Table 3.

NASA/CR—2011-217026 9
3.3 Statistical Evaluation
We view the process of developing an empirical predictive model as an evolutionary process, particularly for such a complex situation as a turbofan engine. Certainly the model in its current state is an advancement over the earlier models (Refs. 15 to 17 and even 2), so it is appropriate to establish comparisons now against which to judge future progress. These comparisons are all on an absolute basis, not adjusted as in Figure 3. The only adjustment is to the fan noise model, to minimize the errors in the vicinity of the blade passage frequency. In each plot the solid symbols are for the average measure at all angles and at frequencies below blade passage. The heavily shaded symbols are for all angles and the frequency range where the low frequency component is the greatest core noise contributor. The lightly shaded symbols are for the frequency range of middle frequency core noise, and the open symbols are for the frequency range of high frequency core noise.
Absolute errors ∆ (experimental minus predicted) are shown plotted versus nondimensional mixed jet velocity, Vmix/camb, in Figure 16. (Note that Vmix is the mass averaged jet velocity). With our current model we predict the noise below the blade passage frequency correctly on average for all engines. With ∆ = –0.1, –0.5, 0.2, and 0.3 dB for the CF6, CF34, CFM56, and GE90, respectively. These differences suggest that there may be effects of combustor variables not yet correlated completely. The tendency to under-predict is most pronounced at low power. The lowest frequency component is predicted quite well except for CF6. For the middle frequency components the agreement is very good except for the CF34. For the high frequency component the agreement is fairly good for all engines.
Standard deviation, σ, is shown in Figure 17 versus Vmix/camb. On average for frequencies below blade passage, σ = 1.4 dB. Since the standard deviation corrects for the mean error, these results are indicative of what may be achieved as the model is evolved; such σ values are lower than we observe in correlating model jet noise experimental data.
The more difficult root-mean-square error, ε, is shown in Figure 18. The average for all cases at frequencies below blade passage is 1.7 dB, which is comparable to model scale jet noise accuracy. However, there is clearly room for considerable progress. Since some of the differences appear to be systematic, further iteration will likely lead to an improved model.
3.4 Application of Correlation to Other Engines
Previous experience with other combustion noise correlations has been that, while they work well for the engines of a given manufacturer, they do not necessarily apply to the engines of a different manufacturer. One hypothesis for this disagreement is that different aircraft engine manufacturers have different combustion design approaches that result in different combustor noise characteristics. Thus in order to test the generality of the combustion noise prediction procedure presented in this report an attempt was made to apply it to aircraft engines from different manufactures. One of the difficulties in doing this is finding both the noise data and the required cycle data and engine geometry, especially data and geometry related to the combustor. Fortunately, sufficient data to perform a preliminary evaluation of the prediction method were found for two engines not manufactured by General Electric. These are the Avco Lycoming YF102 engine and the Pratt and Whitney JT15D engine. For these two engines, some of the geometric parameters, such as combustor diameter, were obtained from report figures using known dimensions to determine the scale. Thus these dimensions are at best approximate and assumed that the report figures accurately depicted the engine geometry. In addition, the number of fuel nozzles was not immediately obtainable in time for this study for the JT15D and YF102 engines. This parameter is used in the determination of the levels of the first two predicted peaks, but is not needed for the level of the third peak or for the prediction of the frequencies of the three peaks. For the analysis presented here, a value of 18 fuel nozzles was used for both engines.
Noise data for the JT15D engine were obtained from Reference 20 and that for the YF102 were obtained from Reference 19. Both sets of data were obtained using the three-signal coherence method developed by Krejsa (Ref. 19). In this method combustion noise levels were determined from cross-

NASA/CR—2011-217026 10
correlations between internal engine and far-field noise measurements. The resultant levels are due only to sources within the engine core, which at the low frequencies analyzed in this report are combustion noise sources. However, results were reported only at an angle of 120 degrees from the engine inlet.
Predicted levels for the two engines are compared with data in Figures 19 and 20. In these figures the levels of the predicted lowest frequency combustion noise component were adjusted to match the data but the peak frequencies of all three components and the levels of the two higher frequency components were those predicted by the correlation.
3.4.1 JT15D In Figure 19, combustion noise levels determined using the three-signal coherence method are
compared with predictions, with the levels for the lowest frequency component decreased by 8 dB, for the JT15D engine at four engine speeds. This reduction in peak level was made to allow the degree of spectral agreement to be observed. At all speeds, the peak frequencies appear to be high by 1 or 2 1/3 octave bands. At the two lowest speeds, the levels are within 2 to 3 dB of the measured levels. At the higher speeds, the difference between the predicted and measured levels is larger, but the sharper peaks in the measured spectra indicate that combustor instabilities may be present. The combustion noise method presented in this report is not intended to predict levels associated with combustor instabilities.
3.4.2 YF102 In Figure 20, the adjusted prediction is compared with data for the YF102 engine at 37 percent engine
speed. In Figure 20(a), the measured levels are those determined using the three-signal coherence technique and those in Figure 20(b) are the total measured levels. For this engine, the levels for the lowest frequency were decreased by 15 dB. All other levels and frequencies were as predicted. Similar to the JT15D engine, the frequencies of the two higher peaks appear to be about 1/3 octave band high and the levels are within a few dB of the data.
3.4.3 Prospects for Extension/Improvement The two comparisons presented in this section indicate that, except for the level of the lowest
frequency noise component, the combustion noise prediction methodology presented in this report is capable of predicting the combustion noise associated with engines from several manufactures. At present, the reason for the substantial adjustment required for the level of the lowest frequency component is unknown. The comparisons for the JT15D and YF102 are not affected by the jet noise model since the experimental technique yields core noise only. However, for the other engines, relatively small changes in the large-scale jet mixing noise model could have a significant effect on experimental/extracted low frequency core noise. It will probably be necessary to adjust both the jet and core noise models to improve the accuracy and generality of the model.
Differences for the other components may be due to approximations in the combustor parameters, including frequency-scaling effects. Data from more engine geometries and manufacturers would be useful to resolve these issues.
4.0 Concluding Remarks MTC Technologies (MTCT) has developed a prediction model for core/combustion noise in turbofan
engines based on experimental data for four General Electric (GE) engines. The model is based on core noise components peaking at low, medium and fairly high (~1 kHz) frequency based on extensive analysis of these data. Since it is impossible to exactly determine the contribution of core noise, statistical accuracy is evaluated on the basis of total noise at frequencies below blade passage. On this basis, the prediction agrees with the data for the four GE engines exactly on average, with root-mean-square error of 1.7 dB. Very limited comparisons with data for engines from other manufacturers indicate rough

NASA/CR—2011-217026 11
agreement with the two higher-frequency components, but fall significantly below the current prediction for the low frequency component.
The statistical accuracy of the model is documented so that users may apply it with quantifiable confidence. Overall the accuracy is comparable to correlation of model-scale jet noise, but since systematic trends appear to be present, improvement is achievable. We feel that further iteration is warranted, but comparison with data for other engines would be even more valuable.
References 1. Mahan, J.R. and Karchmer, A., “Combustion and Core Noise” NASA RP-1258, Vol. 1, pp. 483–517,
1991. 2. Stone, J.R., Krejsa, E.A. and Clark, B.J., “Empirical Correlation of Core/Combustor Noise,” MTCT
Report to GE (Contract 200-1X-14W53048) in support of NASA Contract NAS3-01135, June 14, 2004.
3. Stone, J.R., and Feiler, C.J., “Recent Developments in Aircraft Engine Noise Reduction Technology,” 1980 Aircraft Safety and Operating Problems
4. Ffowcs Williams, J.E., “The Noise from Turbulence Convected at High Speed,” , NASA CP-2170, 1981, pp. 671–698.
Philosophical Transactions of the Royal Society of London
5. Brooks, J.R. and Woodrow, R.J., “The Effects of Forward Speed on a Number of Turbojet Exhaust Silencers,” AIAA-75-506, March 1975.
, Series A, Vol. 255, 1963, pp. 469–503.
6. Bushell, K.W., “Measurement and Prediction of Jet Noise in Flight,” AIAA-75-461, March 1975. 7. Stone, J.R., “On the Effects of Flight on Jet Engine Exhaust Noise,” NASA TM X-71819, November
1975. 8. Merriman, J.E., et al., “Forward Motion and Installation Effects on Engine Noise,” AIAA-76-584,
July 1976. 9. Blankenship, G.L., et al., “Effect of Forward Motion on Engine Noise,” NASA CR-134954, 1977
(MDC-J7708, Douglas Aircraft Co., Inc., NASA Contract NAS3-20031). 10. Stone, J.R., “Prediction of In-Flight Exhaust Noise for Turbojet and Turbofan Engines,” Noise
Control Engineering11. Stone, J.R., “On the Use of Relative Velocity Exponents for Jet Engine Exhaust Noise,” NASA TM-
78873, 1978.
, Vol. 10, No. 1, January-February 1978, pp. 40–46.
12. Ahuja, K.K., Tester, B.J. and Tanna, H.K., “The Free Jet as a Simulator of Forward Velocity Effects on Jet Noise,” NASA CR-3056, 1978.
13. Burcham, F.W., Jr., Lasagna, P.L. and Oas, S.C., “Measurements and Predictions of Flyover and Static Noise of a TF-30 Afterburning Turbofan Engine,” NASA TP-1372, 1978.
14. Morse, P.M. and Ingard, K.U., “Theoretical Acoustics,” McGraw-Hill Book Co., Inc., 1968. 15. Huff, R.G., Clark, B.J. and Dorsch, R.G., “Interim Prediction Method for Low Frequency Core
Noise,” NASA TM-71627, 1974. 16. Matta, R.K., Sandusky, G.T. and Doyle, V.L., “GE Core Noise Investigation – Low Emission
Engines,” FAA-RD-77-4, U.S. Dept. of Transportation, 1977, pp. 152–153. (Available from NTIS as AD-A048590.)
17. Mathews, D.C. and Rekos, N.F., Jr., “Prediction and Measurement of Direct Combustion Noise in Turbopropulsion Systems,” J. Aircraft
18. Karchmer, A.M., Reshotko, M. and Montegani, F.J., “Measurement of Far-Field Combustion Noise from a Turbofan Engine Using Coherence Functions,” NASA TM-73748, 1977.
, Vol. 14, No. 9, September 1977, pp. 850–859.
19. Krejsa, E.A., “New Technique for the Direct Measurement of Core Noise from Aircraft Engines,” NASA TM-82634, July 1981.
20. von Glahn, U.H. and Krejsa, E.A., “Correlation of Core Noise Obtained by Three-Signal Coherence Techniques,” NASA TM-83012, November 1982.

NASA/CR—2011-217026 12
21. Gliebe, P., Mani, R., Shin, H., Mitchell, B., Ashford, G., Salamah, S. and Connell, S. “AST Critical Propulsion and Noise Reduction Technologies for Future Commercial Subsonic Engines, Aeroacoustic Prediction Codes,” GE Aircraft Engines Final Report to NASA, Contract NAS3-27720, Area of Interest 13, December 1999.
22. Clark, B.J., “Computer Program to Predict Aircraft Noise Levels,” NASA TP-1913, September 1981. 23. Stone, J.R., Krejsa, E.A. and Clark, B.J., “Philosophy and Evolution of a Semi-Empirical Model for
Jet Noise Prediction,” AIAA-2004-0361, January 2004. 24. Stone, J.R., “Prediction of Unsuppressed Jet Engine Exhaust Noise in Flight from Static Data,”
AIAA-80-1008, June 1980. 25. Heidmann, M.F., “Interim Prediction Method for Fan and Compressor Source Noise,” NASA TM X-
71763, 1979. 26. Krejsa, E.A. and Valerino, M.F., “Interim Prediction Method for Turbine Noise,” NASA TM X-
73566, 1976. 27. Stone, J.R., Krejsa, E.A. and Clark, B.J., “Jet Noise Modeling for Suppressed and Unsuppressed
Aircraft in Flight,” MTC Final Report to NASA, Contract NAS3-10078, Task Order No. 10, October 2003 (NASA CR in publication).
28. Janardan, B.A., Hoff, G.E., Barter, J.W., Martens, S., and Gliebe, P.R. (GEAE), and Mengle, V. and Dalton, W.N. (Allison Engine Co.), “AST Critical Propulsion and Noise Reduction Technologies for Future Commercial Subsonic Engines – Separate-Flow Exhaust System Noise Reduction Evaluation,” Final Report: NAS3-27720, Area of Interest 14.3, General Electric Report R98AEB152, May 1998.
NASA/CR—2011-217026 13
TABLE I.—SPECTRAL DIRECTIVITY RELATIONS FOR LOW FREQUENCY CORE NOISE (C1)
Frequency Normalized sound pressure level, SPLC1-UOLC1, dB as function of corrected directivity angle parameter Corrected directivity angle, θC, deg
log SC1 0 10 20 30 40 50 60 70 80 90-3.6 -59.0 -59.0 -59.0 -59.0 -59.0 -58.5 -58.0 -57.5 -56.5 -55.5-2.2 -31.0 -31.0 -31.0 -31.0 -31.0 -30.5 -30.0 -29.5 -28.5 -27.5-2.1 -29.0 -29.0 -29.0 -29.0 -29.0 -28.5 -28.0 -27.5 -26.5 -25.5-2.0 -27.0 -27.0 -27.0 -27.0 -27.0 -26.5 -26.0 -25.5 -24.5 -23.5-1.9 -25.0 -25.0 -25.0 -25.0 -25.0 -24.5 -24.0 -23.5 -22.5 -21.5-1.8 -23.0 -23.0 -23.0 -23.0 -23.0 -22.5 -22.0 -21.5 -20.5 -19.5-1.7 -21.0 -21.0 -21.0 -21.0 -21.0 -20.5 -20.0 -19.5 -18.5 -17.5-1.6 -19.0 -19.0 -19.0 -19.0 -19.0 -18.5 -18.0 -17.5 -16.5 -15.5-1.5 -17.0 -17.0 -17.0 -17.0 -17.0 -16.5 -16.0 -15.5 -14.5 -13.5-1.4 -15.0 -15.0 -15.0 -15.0 -15.0 -14.5 -14.0 -13.5 -12.5 -11.5-1.3 -13.0 -13.0 -13.0 -13.0 -13.0 -12.5 -12.0 -11.5 -10.5 -9.5-1.2 -11.0 -11.0 -11.0 -11.0 -11.0 -10.5 -10.0 -9.5 -8.5 -7.5-1.1 -9.0 -9.0 -9.0 -9.0 -9.0 -8.5 -8.0 -7.5 -6.5 -5.5-1.0 -10.1 -10.1 -10.1 -10.1 -10.1 -9.6 -9.1 -8.6 -7.6 -6.6-0.9 -12.6 -12.6 -12.6 -12.6 -12.6 -12.1 -11.6 -11.1 -10.1 -9.1-0.8 -16.6 -16.6 -16.6 -16.6 -16.6 -16.1 -15.6 -15.1 -14.1 -13.1-0.7 -21.6 -21.6 -21.6 -21.6 -21.6 -21.1 -20.6 -20.1 -19.1 -18.1-0.6 -27.6 -27.6 -27.6 -27.6 -27.6 -27.1 -26.6 -26.1 -25.1 -24.1-0.5 -33.6 -33.6 -33.6 -33.6 -33.6 -33.1 -32.6 -32.1 -31.1 -30.1-0.4 -39.6 -39.6 -39.6 -39.6 -39.6 -39.1 -38.6 -38.1 -37.1 -36.1-0.3 -45.6 -45.6 -45.6 -45.6 -45.6 -45.1 -44.6 -44.1 -43.1 -42.1-0.2 -51.6 -51.6 -51.6 -51.6 -51.6 -51.1 -50.6 -50.1 -49.1 -48.1-0.1 -57.6 -57.6 -57.6 -57.6 -57.6 -57.1 -56.6 -56.1 -55.1 -54.10.0 -63.6 -63.6 -63.6 -63.6 -63.6 -63.1 -62.6 -62.1 -61.1 -60.10.1 -69.6 -69.6 -69.6 -69.6 -69.6 -69.1 -68.6 -68.1 -67.1 -66.10.2 -75.6 -75.6 -75.6 -75.6 -75.6 -75.1 -74.6 -74.1 -73.1 -72.10.3 -81.6 -81.6 -81.6 -81.6 -81.6 -81.1 -80.6 -80.1 -79.1 -78.10.4 -87.6 -87.6 -87.6 -87.6 -87.6 -87.1 -86.6 -86.1 -85.1 -84.10.5 -93.6 -93.6 -93.6 -93.6 -93.6 -93.1 -92.6 -92.1 -91.1 -90.10.6 -99.6 -99.6 -99.6 -99.6 -99.6 -99.1 -98.6 -98.1 -97.1 -96.10.7 -105.6 -105.6 -105.6 -105.6 -105.6 -105.1 -104.6 -104.1 -103.1 -102.10.8 -111.6 -111.6 -111.6 -111.6 -111.6 -111.1 -110.6 -110.1 -109.1 -108.10.9 -117.6 -117.6 -117.6 -117.6 -117.6 -117.1 -116.6 -116.1 -115.1 -114.11.0 -123.6 -123.6 -123.6 -123.6 -123.6 -123.1 -122.6 -122.1 -121.1 -120.11.1 -129.6 -129.6 -129.6 -129.6 -129.6 -129.1 -128.6 -128.1 -127.1 -126.11.2 -135.6 -135.6 -135.6 -135.6 -135.6 -135.1 -134.6 -134.1 -133.1 -132.11.3 -141.6 -141.6 -141.6 -141.6 -141.6 -141.1 -140.6 -140.1 -139.1 -138.11.4 -147.6 -147.6 -147.6 -147.6 -147.6 -147.1 -146.6 -146.1 -145.1 -144.11.5 -153.6 -153.6 -153.6 -153.6 -153.6 -153.1 -152.6 -152.1 -151.1 -150.11.6 -159.6 -159.6 -159.6 -159.6 -159.6 -159.1 -158.6 -158.1 -157.1 -156.11.7 -165.6 -165.6 -165.6 -165.6 -165.6 -165.1 -164.6 -164.1 -163.1 -162.11.8 -171.6 -171.6 -171.6 -171.6 -171.6 -171.1 -170.6 -170.1 -169.1 -168.11.9 -177.6 -177.6 -177.6 -177.6 -177.6 -177.1 -176.6 -176.1 -175.1 -174.12.0 -183.6 -183.6 -183.6 -183.6 -183.6 -183.1 -182.6 -182.1 -181.1 -180.13.6 -279.6 -279.6 -279.6 -279.6 -279.6 -279.1 -278.6 -278.1 -277.1 -276.1
OASPLC1-UOL1 -2.8 -2.8 -2.8 -2.8 -2.8 -2.3 -1.8 -1.3 -0.3 0.7

NASA/CR—2011-217026 14
TABLE I.—Concluded.
Frequency Normalized sound pressure level, SPLC1-UOLC1, dB as function of corrected directivity a parameter Corrected directivity angle, θC, deg
log SC1 100 110 120 130 140 150 160 170 180-3.6 -54.0 -52.3 -49.8 -46.2 -47.2 -50.2 -55.2 -60.2 -65.2-2.2 -26.0 -24.3 -21.8 -18.2 -19.2 -22.2 -27.2 -32.2 -37.2-2.1 -24.0 -22.3 -19.8 -16.2 -17.2 -20.2 -25.2 -30.2 -35.2-2.0 -22.0 -20.3 -17.8 -14.3 -15.3 -18.3 -23.3 -28.3 -33.3-1.9 -20.0 -18.3 -15.8 -12.5 -13.5 -16.5 -21.5 -26.5 -31.5-1.8 -18.0 -16.3 -13.8 -10.8 -11.8 -14.8 -19.8 -24.8 -29.8-1.7 -16.0 -14.3 -11.8 -9.2 -10.2 -13.2 -18.2 -23.2 -28.2-1.6 -14.0 -12.3 -9.8 -7.7 -8.7 -11.7 -16.7 -21.7 -26.7-1.5 -12.0 -10.3 -7.9 -6.2 -7.2 -10.2 -15.2 -20.2 -25.2-1.4 -10.0 -8.3 -6.1 -4.7 -5.7 -8.7 -13.7 -18.7 -23.7-1.3 -8.0 -6.3 -4.4 -3.2 -4.2 -7.2 -12.2 -17.2 -22.2-1.2 -6.0 -4.5 -3.1 -2.0 -3.0 -6.0 -11.0 -16.0 -21.0-1.1 -4.2 -3.0 -2.0 -1.0 -2.0 -5.0 -10.0 -15.0 -20.0-1.0 -5.3 -4.0 -2.9 -1.8 -2.8 -5.8 -10.8 -15.8 -20.8-0.9 -7.8 -6.5 -5.4 -4.3 -5.3 -8.3 -13.3 -18.3 -23.3-0.8 -11.8 -10.5 -9.4 -8.3 -9.3 -12.3 -17.3 -22.3 -27.3-0.7 -16.8 -15.5 -14.4 -13.3 -14.3 -17.3 -22.3 -27.3 -32.3-0.6 -22.8 -21.5 -20.4 -19.3 -20.3 -23.3 -28.3 -33.3 -38.3-0.5 -28.8 -27.5 -26.4 -25.3 -26.3 -29.3 -34.3 -39.3 -44.3-0.4 -34.8 -33.5 -32.4 -31.3 -32.3 -35.3 -40.3 -45.3 -50.3-0.3 -40.8 -39.5 -38.4 -37.3 -38.3 -41.3 -46.3 -51.3 -56.3-0.2 -46.8 -45.5 -44.4 -43.3 -44.3 -47.3 -52.3 -57.3 -62.3-0.1 -52.8 -51.5 -50.4 -49.3 -50.3 -53.3 -58.3 -63.3 -68.30.0 -58.8 -57.5 -56.4 -55.3 -56.3 -59.3 -64.3 -69.3 -74.30.1 -64.8 -63.5 -62.4 -61.3 -62.3 -65.3 -70.3 -75.3 -80.30.2 -70.8 -69.5 -68.4 -67.3 -68.3 -71.3 -76.3 -81.3 -86.30.3 -76.8 -75.5 -74.4 -73.3 -74.3 -77.3 -82.3 -87.3 -92.30.4 -82.8 -81.5 -80.4 -79.3 -80.3 -83.3 -88.3 -93.3 -98.30.5 -88.8 -87.5 -86.4 -85.3 -86.3 -89.3 -94.3 -99.3 -104.30.6 -94.8 -93.5 -92.4 -91.3 -92.3 -95.3 -100.3 -105.3 -110.30.7 -100.8 -99.5 -98.4 -97.3 -98.3 -101.3 -106.3 -111.3 -116.30.8 -106.8 -105.5 -104.4 -103.3 -104.3 -107.3 -112.3 -117.3 -122.30.9 -112.8 -111.5 -110.4 -109.3 -110.3 -113.3 -118.3 -123.3 -128.31.0 -118.8 -117.5 -116.4 -115.3 -116.3 -119.3 -124.3 -129.3 -134.31.1 -124.8 -123.5 -122.4 -121.3 -122.3 -125.3 -130.3 -135.3 -140.31.2 -130.8 -129.5 -128.4 -127.3 -128.3 -131.3 -136.3 -141.3 -146.31.3 -136.8 -135.5 -134.4 -133.3 -134.3 -137.3 -142.3 -147.3 -152.31.4 -142.8 -141.5 -140.4 -139.3 -140.3 -143.3 -148.3 -153.3 -158.31.5 -148.8 -147.5 -146.4 -145.3 -146.3 -149.3 -154.3 -159.3 -164.31.6 -154.8 -153.5 -152.4 -151.3 -152.3 -155.3 -160.3 -165.3 -170.31.7 -160.8 -159.5 -158.4 -157.3 -158.3 -161.3 -166.3 -171.3 -176.31.8 -166.8 -165.5 -164.4 -163.3 -164.3 -167.3 -172.3 -177.3 -182.31.9 -172.8 -171.5 -170.4 -169.3 -170.3 -173.3 -178.3 -183.3 -188.32.0 -178.8 -177.5 -176.4 -175.3 -176.3 -179.3 -184.3 -189.3 -194.33.6 -274.8 -273.5 -272.4 -271.3 -272.3 -275.3 -280.3 -285.3 -290.3
OASPLC1-UOL1 2.1 3.5 5.0 6.3 5.3 2.3 -2.7 -7.7 -12.7

NASA/CR—2011-217026 15
TABLE II.—SPECTRAL DIRECTIVITY RELATIONS FOR MID-FREQUENCY CORE NOISE (C2)
Frequency Normalized sound pressure level, SPLC2-UOLC2, dB as function of corrected directivity angle parameter Corrected directivity angle, θC, deg
log SC2 0 10 20 30 40 50 60 70 80 90-3.6 -176.3 -175.3 -174.3 -173.3 -172.3 -170.8 -169.8 -168.8 -168.3 -167.8-2.2 -92.3 -91.3 -90.3 -89.3 -88.3 -86.8 -85.8 -84.8 -84.3 -83.8-2.1 -86.3 -85.3 -84.3 -83.3 -82.3 -80.8 -79.8 -78.8 -78.3 -77.8-2.0 -80.3 -79.3 -78.3 -77.3 -76.3 -74.8 -73.8 -72.8 -72.3 -71.8-1.9 -74.3 -73.3 -72.3 -71.3 -70.3 -68.8 -67.8 -66.8 -66.3 -65.8-1.8 -68.3 -67.3 -66.3 -65.3 -64.3 -62.8 -61.8 -60.8 -60.3 -59.8-1.7 -62.3 -61.3 -60.3 -59.3 -58.3 -56.8 -55.8 -54.8 -54.3 -53.8-1.6 -56.3 -55.3 -54.3 -53.3 -52.3 -50.8 -49.8 -48.8 -48.3 -47.8-1.5 -50.3 -49.3 -48.3 -47.3 -46.3 -44.8 -43.8 -42.8 -42.3 -41.8-1.4 -44.3 -43.3 -42.3 -41.3 -40.3 -38.8 -37.8 -36.8 -36.3 -35.8-1.3 -38.3 -37.3 -36.3 -35.3 -34.3 -32.8 -31.8 -30.8 -30.3 -29.8-1.2 -32.3 -31.3 -30.3 -29.3 -28.3 -26.8 -25.8 -24.8 -24.3 -23.8-1.1 -26.3 -25.3 -24.3 -23.3 -22.3 -20.8 -19.8 -18.8 -18.3 -17.8-1.0 -20.3 -19.3 -18.3 -17.3 -16.3 -14.8 -13.8 -12.8 -12.3 -11.8-0.9 -16.3 -15.3 -14.3 -13.3 -12.3 -10.8 -9.8 -8.8 -8.3 -7.8-0.8 -14.3 -13.3 -12.3 -11.3 -10.3 -8.8 -7.8 -6.8 -6.3 -5.8-0.7 -15.0 -14.0 -13.0 -12.0 -11.0 -9.5 -8.5 -7.5 -7.0 -6.5-0.6 -16.9 -15.9 -14.9 -13.9 -12.9 -11.4 -10.4 -9.4 -8.9 -8.4-0.5 -19.8 -18.8 -17.8 -16.8 -15.8 -14.3 -13.3 -12.3 -11.8 -11.3-0.4 -23.8 -22.8 -21.8 -20.8 -19.8 -18.3 -17.3 -16.3 -15.8 -15.3-0.3 -28.8 -27.8 -26.8 -25.8 -24.8 -23.3 -22.3 -21.3 -20.8 -20.3-0.2 -34.1 -33.1 -32.1 -31.1 -30.1 -28.6 -27.6 -26.6 -26.1 -25.6-0.1 -39.7 -38.7 -37.7 -36.7 -35.7 -34.2 -33.2 -32.2 -31.7 -31.20.0 -45.7 -44.7 -43.7 -42.7 -41.7 -40.2 -39.2 -38.2 -37.7 -37.20.1 -51.7 -50.7 -49.7 -48.7 -47.7 -46.2 -45.2 -44.2 -43.7 -43.20.2 -57.7 -56.7 -55.7 -54.7 -53.7 -52.2 -51.2 -50.2 -49.7 -49.20.3 -63.7 -62.7 -61.7 -60.7 -59.7 -58.2 -57.2 -56.2 -55.7 -55.20.4 -69.7 -68.7 -67.7 -66.7 -65.7 -64.2 -63.2 -62.2 -61.7 -61.20.5 -75.7 -74.7 -73.7 -72.7 -71.7 -70.2 -69.2 -68.2 -67.7 -67.20.6 -81.7 -80.7 -79.7 -78.7 -77.7 -76.2 -75.2 -74.2 -73.7 -73.20.7 -87.7 -86.7 -85.7 -84.7 -83.7 -82.2 -81.2 -80.2 -79.7 -79.20.8 -93.7 -92.7 -91.7 -90.7 -89.7 -88.2 -87.2 -86.2 -85.7 -85.20.9 -99.7 -98.7 -97.7 -96.7 -95.7 -94.2 -93.2 -92.2 -91.7 -91.21.0 -105.7 -104.7 -103.7 -102.7 -101.7 -100.2 -99.2 -98.2 -97.7 -97.21.1 -111.7 -110.7 -109.7 -108.7 -107.7 -106.2 -105.2 -104.2 -103.7 -103.21.2 -117.7 -116.7 -115.7 -114.7 -113.7 -112.2 -111.2 -110.2 -109.7 -109.21.3 -123.7 -122.7 -121.7 -120.7 -119.7 -118.2 -117.2 -116.2 -115.7 -115.21.4 -129.7 -128.7 -127.7 -126.7 -125.7 -124.2 -123.2 -122.2 -121.7 -121.21.5 -135.7 -134.7 -133.7 -132.7 -131.7 -130.2 -129.2 -128.2 -127.7 -127.21.6 -141.7 -140.7 -139.7 -138.7 -137.7 -136.2 -135.2 -134.2 -133.7 -133.21.7 -147.7 -146.7 -145.7 -144.7 -143.7 -142.2 -141.2 -140.2 -139.7 -139.21.8 -153.7 -152.7 -151.7 -150.7 -149.7 -148.2 -147.2 -146.2 -145.7 -145.21.9 -159.7 -158.7 -157.7 -156.7 -155.7 -154.2 -153.2 -152.2 -151.7 -151.22.0 -165.7 -164.7 -163.7 -162.7 -161.7 -160.2 -159.2 -158.2 -157.7 -157.23.6 -261.7 -260.7 -259.7 -258.7 -257.7 -256.2 -255.2 -254.2 -253.7 -253.2
OASPLC2-UOLC2 -8.5 -7.5 -6.5 -5.5 -4.5 -3.0 -2.0 -1.0 -0.5 0.0

NASA/CR—2011-217026 16
TABLE II.—Concluded.
Frequency Normalized sound pressure level, SPLC2-UOLC2, dB as function of corrected directivity a parameter Corrected directivity angle, θC, deg
log SC2 100 110 120 130 140 150 160 170 180-3.6 -167.3 -166.8 -166.3 -165.8 -167.3 -169.5 -171.7 -173.9 -176.1-2.2 -83.3 -82.8 -82.3 -81.8 -83.3 -85.5 -87.7 -89.9 -92.1-2.1 -77.3 -76.8 -76.3 -75.8 -77.3 -79.5 -81.7 -83.9 -86.1-2.0 -71.3 -70.8 -70.3 -69.8 -71.3 -73.5 -75.7 -77.9 -80.1-1.9 -65.3 -64.8 -64.3 -63.8 -65.3 -67.5 -69.7 -71.9 -74.1-1.8 -59.3 -58.8 -58.3 -57.8 -59.3 -61.5 -63.7 -65.9 -68.1-1.7 -53.3 -52.8 -52.3 -51.8 -53.3 -55.5 -57.7 -59.9 -62.1-1.6 -47.3 -46.8 -46.3 -45.8 -47.3 -49.5 -51.7 -53.9 -56.1-1.5 -41.3 -40.8 -40.3 -39.8 -41.3 -43.5 -45.7 -47.9 -50.1-1.4 -35.3 -34.8 -34.3 -33.8 -35.3 -37.5 -39.7 -41.9 -44.1-1.3 -29.3 -28.8 -28.3 -27.8 -29.3 -31.5 -33.7 -35.9 -38.1-1.2 -23.3 -22.8 -22.3 -21.8 -23.3 -25.5 -27.7 -29.9 -32.1-1.1 -17.3 -16.8 -16.3 -15.8 -17.3 -19.5 -21.7 -23.9 -26.1-1.0 -11.3 -10.8 -10.3 -9.8 -11.3 -13.5 -15.7 -17.9 -20.1-0.9 -7.3 -6.8 -6.3 -5.8 -7.3 -9.5 -11.7 -13.9 -16.1-0.8 -5.3 -4.8 -4.3 -3.8 -5.3 -7.5 -9.7 -11.9 -14.1-0.7 -6.0 -5.5 -5.0 -4.5 -6.0 -8.2 -10.4 -12.6 -14.8-0.6 -7.9 -7.4 -6.9 -6.4 -7.9 -10.1 -12.3 -14.5 -16.7-0.5 -10.8 -10.3 -9.8 -9.3 -10.8 -13.0 -15.2 -17.4 -19.6-0.4 -14.8 -14.3 -13.8 -13.3 -14.8 -17.0 -19.2 -21.4 -23.6-0.3 -19.8 -19.3 -18.8 -18.3 -19.8 -22.0 -24.2 -26.4 -28.6-0.2 -25.1 -24.6 -24.1 -23.6 -25.1 -27.3 -29.5 -31.7 -33.9-0.1 -30.7 -30.2 -29.7 -29.2 -30.7 -32.9 -35.1 -37.3 -39.50.0 -36.7 -36.2 -35.7 -35.2 -36.7 -38.9 -41.1 -43.3 -45.50.1 -42.7 -42.2 -41.7 -41.2 -42.7 -44.9 -47.1 -49.3 -51.50.2 -48.7 -48.2 -47.7 -47.2 -48.7 -50.9 -53.1 -55.3 -57.50.3 -54.7 -54.2 -53.7 -53.2 -54.7 -56.9 -59.1 -61.3 -63.50.4 -60.7 -60.2 -59.7 -59.2 -60.7 -62.9 -65.1 -67.3 -69.50.5 -66.7 -66.2 -65.7 -65.2 -66.7 -68.9 -71.1 -73.3 -75.50.6 -72.7 -72.2 -71.7 -71.2 -72.7 -74.9 -77.1 -79.3 -81.50.7 -78.7 -78.2 -77.7 -77.2 -78.7 -80.9 -83.1 -85.3 -87.50.8 -84.7 -84.2 -83.7 -83.2 -84.7 -86.9 -89.1 -91.3 -93.50.9 -90.7 -90.2 -89.7 -89.2 -90.7 -92.9 -95.1 -97.3 -99.51.0 -96.7 -96.2 -95.7 -95.2 -96.7 -98.9 -101.1 -103.3 -105.51.1 -102.7 -102.2 -101.7 -101.2 -102.7 -104.9 -107.1 -109.3 -111.51.2 -108.7 -108.2 -107.7 -107.2 -108.7 -110.9 -113.1 -115.3 -117.51.3 -114.7 -114.2 -113.7 -113.2 -114.7 -116.9 -119.1 -121.3 -123.51.4 -120.7 -120.2 -119.7 -119.2 -120.7 -122.9 -125.1 -127.3 -129.51.5 -126.7 -126.2 -125.7 -125.2 -126.7 -128.9 -131.1 -133.3 -135.51.6 -132.7 -132.2 -131.7 -131.2 -132.7 -134.9 -137.1 -139.3 -141.51.7 -138.7 -138.2 -137.7 -137.2 -138.7 -140.9 -143.1 -145.3 -147.51.8 -144.7 -144.2 -143.7 -143.2 -144.7 -146.9 -149.1 -151.3 -153.51.9 -150.7 -150.2 -149.7 -149.2 -150.7 -152.9 -155.1 -157.3 -159.52.0 -156.7 -156.2 -155.7 -155.2 -156.7 -158.9 -161.1 -163.3 -165.53.6 -252.7 -252.2 -251.7 -251.2 -252.7 -254.9 -257.1 -259.3 -261.5
OASPLC2-UOLC2 0.5 1.0 1.5 2.0 0.5 -1.7 -3.9 -6.1 -8.3

NASA/CR—2011-217026 17
TABLE III.—SPECTRAL DIRECTIVITY RELATIONS FOR HIGH FREQUENCY CORE NOISE (C3)
Frequency Normalized sound pressure level, SPLC3-UOLC3, dB as function of corrected directivity angleparameter Corrected directivity angle, θc, deg
log Sc 0 10 20 30 40 50 60 70 80 90-3.6 -198.8 -198.2 -197.6 -197.0 -196.4 -195.7 -195.0 -194.8 -194.4 -193.6-2.2 -114.8 -114.2 -113.6 -113.0 -112.4 -111.7 -111.0 -110.8 -110.4 -109.6-2.1 -108.8 -108.2 -107.6 -107.0 -106.4 -105.7 -105.0 -104.8 -104.4 -103.6-2.0 -102.8 -102.2 -101.6 -101.0 -100.4 -99.7 -99.0 -98.8 -98.4 -97.6-1.9 -96.8 -96.2 -95.6 -95.0 -94.4 -93.7 -93.0 -92.8 -92.4 -91.6-1.8 -90.8 -90.2 -89.6 -89.0 -88.4 -87.7 -87.0 -86.8 -86.4 -85.6-1.7 -84.8 -84.2 -83.6 -83.0 -82.4 -81.7 -81.0 -80.8 -80.4 -79.6-1.6 -78.8 -78.2 -77.6 -77.0 -76.4 -75.7 -75.0 -74.8 -74.4 -73.6-1.5 -72.8 -72.2 -71.6 -71.0 -70.4 -69.7 -69.0 -68.8 -68.4 -67.6-1.4 -66.8 -66.2 -65.6 -65.0 -64.4 -63.7 -63.0 -62.8 -62.4 -61.6-1.3 -60.8 -60.2 -59.6 -59.0 -58.4 -57.7 -57.0 -56.8 -56.4 -55.6-1.2 -54.8 -54.2 -53.6 -53.0 -52.4 -51.7 -51.0 -50.8 -50.4 -49.6-1.1 -48.8 -48.2 -47.6 -47.0 -46.4 -45.7 -45.0 -44.8 -44.4 -43.6-1.0 -42.8 -42.2 -41.6 -41.0 -40.4 -39.7 -39.0 -38.8 -38.4 -37.6-0.9 -36.8 -36.2 -35.6 -35.0 -34.4 -33.7 -33.0 -32.8 -32.4 -31.6-0.8 -30.8 -30.2 -29.6 -29.0 -28.4 -27.7 -27.0 -26.8 -26.4 -25.6-0.7 -24.8 -24.2 -23.6 -23.0 -22.4 -21.7 -21.0 -20.8 -20.4 -19.6-0.6 -19.6 -19.0 -18.4 -17.8 -17.2 -16.5 -15.8 -15.6 -15.2 -14.4-0.5 -15.5 -14.9 -14.3 -13.7 -13.1 -12.4 -11.7 -11.5 -11.1 -10.3-0.4 -12.6 -12.0 -11.4 -10.8 -10.2 -9.5 -8.8 -8.6 -8.2 -7.4-0.3 -11.6 -11.0 -10.4 -9.8 -9.2 -8.5 -7.8 -7.6 -7.2 -6.4-0.2 -11.9 -11.3 -10.7 -10.1 -9.5 -8.8 -8.1 -7.9 -7.5 -6.7-0.1 -12.9 -12.3 -11.7 -11.1 -10.5 -9.8 -9.1 -8.9 -8.5 -7.70.0 -15.1 -14.5 -13.9 -13.3 -12.7 -12.0 -11.3 -11.1 -10.7 -9.90.1 -18.7 -18.1 -17.5 -16.9 -16.3 -15.6 -14.9 -14.7 -14.3 -13.50.2 -23.2 -22.6 -22.0 -21.4 -20.8 -20.1 -19.4 -19.2 -18.8 -18.00.3 -29.2 -28.6 -28.0 -27.4 -26.8 -26.1 -25.4 -25.2 -24.8 -24.00.4 -35.2 -34.6 -34.0 -33.4 -32.8 -32.1 -31.4 -31.2 -30.8 -30.00.5 -41.2 -40.6 -40.0 -39.4 -38.8 -38.1 -37.4 -37.2 -36.8 -36.00.6 -47.2 -46.6 -46.0 -45.4 -44.8 -44.1 -43.4 -43.2 -42.8 -42.00.7 -53.2 -52.6 -52.0 -51.4 -50.8 -50.1 -49.4 -49.2 -48.8 -48.00.8 -59.2 -58.6 -58.0 -57.4 -56.8 -56.1 -55.4 -55.2 -54.8 -54.00.9 -65.2 -64.6 -64.0 -63.4 -62.8 -62.1 -61.4 -61.2 -60.8 -60.01.0 -71.2 -70.6 -70.0 -69.4 -68.8 -68.1 -67.4 -67.2 -66.8 -66.01.1 -77.2 -76.6 -76.0 -75.4 -74.8 -74.1 -73.4 -73.2 -72.8 -72.01.2 -83.2 -82.6 -82.0 -81.4 -80.8 -80.1 -79.4 -79.2 -78.8 -78.01.3 -89.2 -88.6 -88.0 -87.4 -86.8 -86.1 -85.4 -85.2 -84.8 -84.01.4 -95.2 -94.6 -94.0 -93.4 -92.8 -92.1 -91.4 -91.2 -90.8 -90.01.5 -101.2 -100.6 -100.0 -99.4 -98.8 -98.1 -97.4 -97.2 -96.8 -96.01.6 -107.2 -106.6 -106.0 -105.4 -104.8 -104.1 -103.4 -103.2 -102.8 -102.01.7 -113.2 -112.6 -112.0 -111.4 -110.8 -110.1 -109.4 -109.2 -108.8 -108.01.8 -119.2 -118.6 -118.0 -117.4 -116.8 -116.1 -115.4 -115.2 -114.8 -114.01.9 -125.2 -124.6 -124.0 -123.4 -122.8 -122.1 -121.4 -121.2 -120.8 -120.02.0 -131.2 -130.6 -130.0 -129.4 -128.8 -128.1 -127.4 -127.2 -126.8 -126.03.6 -227.2 -226.6 -226.0 -225.4 -224.8 -224.1 -223.4 -223.2 -222.8 -222.0
OASPLc3-UOL3 -4.8 -4.2 -3.6 -3.0 -2.4 -1.7 -1.0 -0.8 -0.4 0.4

NASA/CR—2011-217026 18
TABLE III.—Concluded.
Frequency Normalized sound pressure level, SPLC3-UOLC3, dB as function of corrected directivity parameter Corrected directivity angle, θc, deg
log SC2 100 110 120 130 140 150 160 170 180-3.6 -192.1 -190.4 -188.6 -187.2 -190.7 -193.2 -195.2 -197.2 -199.2-2.2 -108.1 -106.4 -104.6 -103.2 -106.7 -109.2 -111.2 -113.2 -115.2-2.1 -102.1 -100.4 -98.6 -97.2 -100.7 -103.2 -105.2 -107.2 -109.2-2.0 -96.1 -94.4 -92.6 -91.2 -94.7 -97.2 -99.2 -101.2 -103.2-1.9 -90.1 -88.4 -86.6 -85.2 -88.7 -91.2 -93.2 -95.2 -97.2-1.8 -84.1 -82.4 -80.6 -79.2 -82.7 -85.2 -87.2 -89.2 -91.2-1.7 -78.1 -76.4 -74.6 -73.2 -76.7 -79.2 -81.2 -83.2 -85.2-1.6 -72.1 -70.4 -68.6 -67.2 -70.7 -73.2 -75.2 -77.2 -79.2-1.5 -66.1 -64.4 -62.6 -61.2 -64.7 -67.2 -69.2 -71.2 -73.2-1.4 -60.1 -58.4 -56.6 -55.2 -58.7 -61.2 -63.2 -65.2 -67.2-1.3 -54.1 -52.4 -50.6 -49.2 -52.7 -55.2 -57.2 -59.2 -61.2-1.2 -48.1 -46.4 -44.6 -43.2 -46.7 -49.2 -51.2 -53.2 -55.2-1.1 -42.1 -40.4 -38.6 -37.2 -40.7 -43.2 -45.2 -47.2 -49.2-1.0 -36.1 -34.4 -32.6 -31.2 -34.7 -37.2 -39.2 -41.2 -43.2-0.9 -30.1 -28.4 -26.6 -25.2 -28.7 -31.2 -33.2 -35.2 -37.2-0.8 -24.1 -22.4 -20.6 -19.2 -22.7 -25.2 -27.2 -29.2 -31.2-0.7 -18.1 -16.4 -14.6 -13.2 -16.7 -19.2 -21.2 -23.2 -25.2-0.6 -12.9 -11.2 -9.4 -8.0 -11.5 -14.0 -16.0 -18.0 -20.0-0.5 -8.8 -7.1 -5.3 -3.9 -7.4 -9.9 -11.9 -13.9 -15.9-0.4 -5.9 -4.2 -2.4 -1.0 -4.5 -7.0 -9.0 -11.0 -13.0-0.3 -4.9 -3.2 -1.4 0.0 -3.5 -6.0 -8.0 -10.0 -12.0-0.2 -5.2 -3.5 -1.7 -0.3 -3.8 -6.3 -8.3 -10.7 -12.7-0.1 -6.2 -4.5 -2.7 -1.3 -4.8 -7.3 -9.3 -12.2 -14.20.0 -8.4 -6.7 -4.9 -3.5 -7.0 -9.5 -11.5 -15.0 -17.00.1 -12.0 -10.3 -8.5 -7.1 -10.6 -13.1 -15.1 -19.3 -21.30.2 -16.5 -14.8 -13.0 -11.6 -15.1 -17.6 -19.6 -25.1 -27.10.3 -22.5 -20.8 -19.0 -17.6 -21.1 -23.6 -25.6 -31.1 -33.10.4 -28.5 -26.8 -25.0 -23.6 -27.1 -29.6 -31.6 -37.1 -39.10.5 -34.5 -32.8 -31.0 -29.6 -33.1 -35.6 -37.6 -43.1 -45.10.6 -40.5 -38.8 -37.0 -35.6 -39.1 -41.6 -43.6 -49.1 -51.10.7 -46.5 -44.8 -43.0 -41.6 -45.1 -47.6 -49.6 -55.1 -57.10.8 -52.5 -50.8 -49.0 -47.6 -51.1 -53.6 -55.6 -61.1 -63.10.9 -58.5 -56.8 -55.0 -53.6 -57.1 -59.6 -61.6 -67.1 -69.11.0 -64.5 -62.8 -61.0 -59.6 -63.1 -65.6 -67.6 -73.1 -75.11.1 -70.5 -68.8 -67.0 -65.6 -69.1 -71.6 -73.6 -79.1 -81.11.2 -76.5 -74.8 -73.0 -71.6 -75.1 -77.6 -79.6 -85.1 -87.11.3 -82.5 -80.8 -79.0 -77.6 -81.1 -83.6 -85.6 -91.1 -93.11.4 -88.5 -86.8 -85.0 -83.6 -87.1 -89.6 -91.6 -97.1 -99.11.5 -94.5 -92.8 -91.0 -89.6 -93.1 -95.6 -97.6 -103.1 -105.11.6 -100.5 -98.8 -97.0 -95.6 -99.1 -101.6 -103.6 -109.1 -111.11.7 -106.5 -104.8 -103.0 -101.6 -105.1 -107.6 -109.6 -115.1 -117.11.8 -112.5 -110.8 -109.0 -107.6 -111.1 -113.6 -115.6 -121.1 -123.11.9 -118.5 -116.8 -115.0 -113.6 -117.1 -119.6 -121.6 -127.1 -129.12.0 -124.5 -122.8 -121.0 -119.6 -123.1 -125.6 -127.6 -133.1 -135.13.6 -220.5 -218.8 -217.0 -215.6 -219.1 -221.6 -223.6 -229.1 -231.1
OASPLc3-UOL3 1.9 3.6 5.4 6.8 3.3 0.8 -1.2 -3.6 -5.6

NASA/CR—2011-217026 19
Figure 1.—Flight Effect Variables for Engine Exhaust Noise.
Figure 2.—Typical Example Flight Effects on Exhaust Noise.

NASA/CR—2011-217026 20
(a) Directivity Angle θ = 90 deg
(b) Directivity Angle θ = 120 deg
Figure 3.—Typical Component Extraction for CF6-80C2A5F at Low Power, Vmix/camb = 0.402.
0
5
10
15
20
25
30
35
40
10 100 1000 10000
1/3-Octave-Band Center Frequency, f, Hz
Rel
ativ
e SP
L, d
BSPLexpSPLC1,EESPLC2,EESPLC3,EESPLtm,EESPLP,EESPLL,EESPLS,EESPLT,EE
0
5
10
15
20
25
30
35
40
10 100 1000 10000
1/3-Octave-Band Center Frequency, f, Hz
Rel
ativ
e SP
L, d
B
SPLexpSPLC1,EESPLC2,EESPLC3,EESPLtm,EESPLP,EESPLL,EESPLS,EESPLT,EE

NASA/CR—2011-217026 21
(c) Directivity Angle θ = 150 deg
Figure 3.—Concluded.
(a) Directivity Angle θ = 30 deg
Figure 4.—Comparison of Experimental and Predicted Spectra for CF6-80C2A5F at High Power, Vmix/camb = 1.004.
0
5
10
15
20
25
30
35
40
10 100 1000 10000
1/3-Octave-Band Center Frequency, f, Hz
Rel
ativ
e SP
L, d
B
SPLexpSPLC1,EESPLC2,EESPLC3,EESPLtm,EESPLP,EESPLL,EESPLS,EESPLT,EE
10
15
20
25
30
35
40
45
50
10 100 1000 10000
1/3-Octave-Band Center Frequency, f, Hz
Rel
ativ
e SP
L, d
B
SPLexpSPLPredSPLC1,PredSPLC2,PredSPLC3,PredSPLtm,PredSPLP,PredSPLL,PredSPLS,PredSPLT,Pred

NASA/CR—2011-217026 22
(b) Directivity Angle θ = 60 deg
(c) Directivity Angle θ = 90 deg
Figure 4.—Continued.
20
25
30
35
40
45
50
55
60
10 100 1000 100001/3-Octave-Band Center Frequency, f, Hz
Rel
ativ
e SP
L, d
B
SPLexpSPLPredSPLC1,PredSPLC2,PredSPLC3,PredSPLtm,PredSPLP,PredSPLL,PredSPLS,PredSPLT,Pred
20
25
30
35
40
45
50
55
60
10 100 1000 10000
1/3-Octave-Band Center Frequency, f, Hz
Rel
ativ
e SP
L, d
B
SPLexpSPLPredSPLC1,PredSPLC2,PredSPLC3,PredSPLtm,PredSPLP,PredSPLL,PredSPLS,PredSPLT,Pred

NASA/CR—2011-217026 23
(d) Directivity Angle θ = 120 deg
(e) Directivity Angle θ = 150 deg
Figure 4.—Concluded.
30
35
40
45
50
55
60
65
70
10 100 1000 10000
1/3-Octave-Band Center Frequency, f, Hz
Rel
ativ
e SP
L, d
B
SPLexpSPLPredSPLC1,PredSPLC2,PredSPLC3,PredSPLtm,PredSPLP,PredSPLL,PredSPLS,PredSPLT,Pred
25
30
35
40
45
50
55
60
65
10 100 1000 10000
1/3-Octave-Band Center Frequency, f, Hz
Rel
ativ
e SP
L, d
B
SPLexpSPLPredSPLC1,PredSPLC2,PredSPLC3,PredSPLtm,PredSPLP,PredSPLL,PredSPLS,PredSPLT,Pred

NASA/CR—2011-217026 24
Figure 5.—Comparison of Experimental and Predicted OASPL Directivities for CF6-80C2A5F at
3534 rpm and Vmix/camb = 1.004.
(a) Directivity Angle θ = 30 deg
Figure 6.—Comparison of Experimental and Predicted Spectra for CF34-8C at High Power, Vmix/camb =1.049.
40
45
50
55
60
65
70
75
80
0 20 40 60 80 100 120 140 160 180
Directivity Angle, θ, deg
Rel
ativ
e O
ASP
L, d
BOASPLexpOASPLPredOASPLC1,PredOASPLC2,PredOASPLC3,PredOASPLF,PredOASPLP,PredOASPLL,PredOASPLS,PredOASPLT,Pred
15
20
25
30
35
40
45
50
55
10 100 1000 10000
1/3-Octave-Band Center Frequency, f, Hz
Rel
ativ
e SP
L, d
B
SPLexpSPLPredSPLC1,PredSPLC2,PredSPLC3,PredSPLtm,PredSPLP,PredSPLL,PredSPLS,PredSPLT,Pred

NASA/CR—2011-217026 25
(b) Directivity Angle θ = 60 deg
(c) Directivity Angle θ = 90 deg
Figure 6.—Continued.
25
30
35
40
45
50
55
60
65
10 100 1000 100001/3-Octave-Band Center Frequency, f, Hz
Rel
ativ
e SP
L, d
BSPLexpSPLPredSPLC1,PredSPLC2,PredSPLC3,PredSPLtm,PredSPLP,PredSPLL,PredSPLS,PredSPLT,Pred
20
25
30
35
40
45
50
55
60
10 100 1000 10000
1/3-Octave-Band Center Frequency, f, Hz
Rel
ativ
e SP
L, d
B
SPLexpSPLPredSPLC1,PredSPLC2,PredSPLC3,PredSPLtm,PredSPLP,PredSPLL,PredSPLS,PredSPLT,Pred

NASA/CR—2011-217026 26
(d) Directivity Angle θ = 120 deg
(e) Directivity Angle θ = 150 deg
Figure 6.—Concluded.
30
35
40
45
50
55
60
65
70
75
10 100 1000 100001/3-Octave-Band Center Frequency, f, Hz
Rel
ativ
e SP
L, d
B
SPLexpSPLPredSPLC1,PredSPLC2,PredSPLC3,PredSPLtm,PredSPLP,PredSPLL,PredSPLS,PredSPLT,Pred
30
35
40
45
50
55
60
65
70
10 100 1000 10000
1/3-Octave-Band Center Frequency, f, Hz
Rel
ativ
e SP
L, d
B
SPLexpSPLPredSPLC1,PredSPLC2,PredSPLC3,PredSPLtm,PredSPLP,PredSPLL,PredSPLS,PredSPLT,Pred

NASA/CR—2011-217026 27
Figure 7.—Comparison of Experimental and Predicted OASPL Directivities for CF34-9C at High Power,
Vmix/camb = 1.049.
(a) Directivity Angle θ = 30 deg
Figure 8.—Comparison of Experimental and Predicted Spectra for CFM56-5B/P High Power, Vmix/camb = 1.006.
45
50
55
60
65
70
75
80
85
0 20 40 60 80 100 120 140 160 180
Directivity Angle, θ, deg
Rel
ativ
e O
ASP
L, d
B
OASPLexpOASPLPredOASPLC1,PredOASPLC2,PredOASPLC3,PredOASPLF,PredOASPLP,PredOASPLL,PredOASPLS,PredOASPLT,Pred
20
25
30
35
40
45
50
55
60
10 100 1000 10000
1/3-Octave-Band Center Frequency, f, Hz
Rel
ativ
e SP
L, d
B
SPLexpSPLPredSPLC1,PredSPLC2,PredSPLC3,PredSPLtm,PredSPLP,PredSPLL,PredSPLS,PredSPLT,Pred

NASA/CR—2011-217026 28
(b) Directivity Angle θ = 60 deg
(c) Directivity Angle θ = 90 deg
Figure 8.—Continued.
25
30
35
40
45
50
55
60
65
10 100 1000 10000
1/3-Octave-Band Center Frequency, f, Hz
Rel
ativ
e SP
L, d
B
SPLexpSPLPredSPLC1,PredSPLC2,PredSPLC3,PredSPLtm,PredSPLP,PredSPLL,PredSPLS,PredSPLT,Pred
25
30
35
40
45
50
55
60
65
10 100 1000 10000
1/3-Octave-Band Center Frequency, f, Hz
Rel
ativ
e SP
L, d
B
SPLexpSPLPredSPLC1,PredSPLC2,PredSPLC3,PredSPLtm,PredSPLP,PredSPLL,PredSPLS,PredSPLT,Pred

NASA/CR—2011-217026 29
(d) Directivity Angle θ = 120 deg
(e) Directivity Angle θ = 150 deg
Figure 8.—Concluded.
35
40
45
50
55
60
65
70
75
80
10 100 1000 100001/3-Octave-Band Center Frequency, f, Hz
Rel
ativ
e SP
L, d
BSPLexpSPLPredSPLC1,PredSPLC2,PredSPLC3,PredSPLtm,PredSPLP,PredSPLL,PredSPLS,PredSPLT,Pred
35
40
45
50
55
60
65
70
75
10 100 1000 100001/3-Octave-Band Center Frequency, f, Hz
Rel
ativ
e SP
L, d
B
SPLexpSPLPredSPLC1,PredSPLC2,PredSPLC3,PredSPLtm,PredSPLP,PredSPLL,PredSPLS,PredSPLT,Pred

NASA/CR—2011-217026 30
Figure 9.—Comparison of Experimental and Predicted OASPL Directivities for CFM56-5B/P at
High Power, Vmix/camb = 1.006.
(a) Directivity Angle θ = 30 deg
Figure 10.—Comparison of Experimental and Predicted Spectra for GE90 at High Power, Vmix/camb = 0.906.
30
35
40
45
50
55
60
65
70
10 100 1000 100001/3-Octave-Band Center Frequency, f, Hz
Rel
ativ
e SP
L, d
BSPLexpSPLPredSPLC1,PredSPLC2,PredSPLC3,PredSPLtm,PredSPLP,PredSPLL,PredSPLS,PredSPLT,Pred
50
55
60
65
70
75
80
85
90
0 20 40 60 80 100 120 140 160 180Directivity Angle, θ, deg
Rel
ativ
e O
ASP
L, d
B
OASPLexpOASPLPredOASPLC1,PredOASPLC2,PredOASPLC3,PredOASPLF,PredOASPLP,PredOASPLL,PredOASPLS,PredOASPLT,Pred
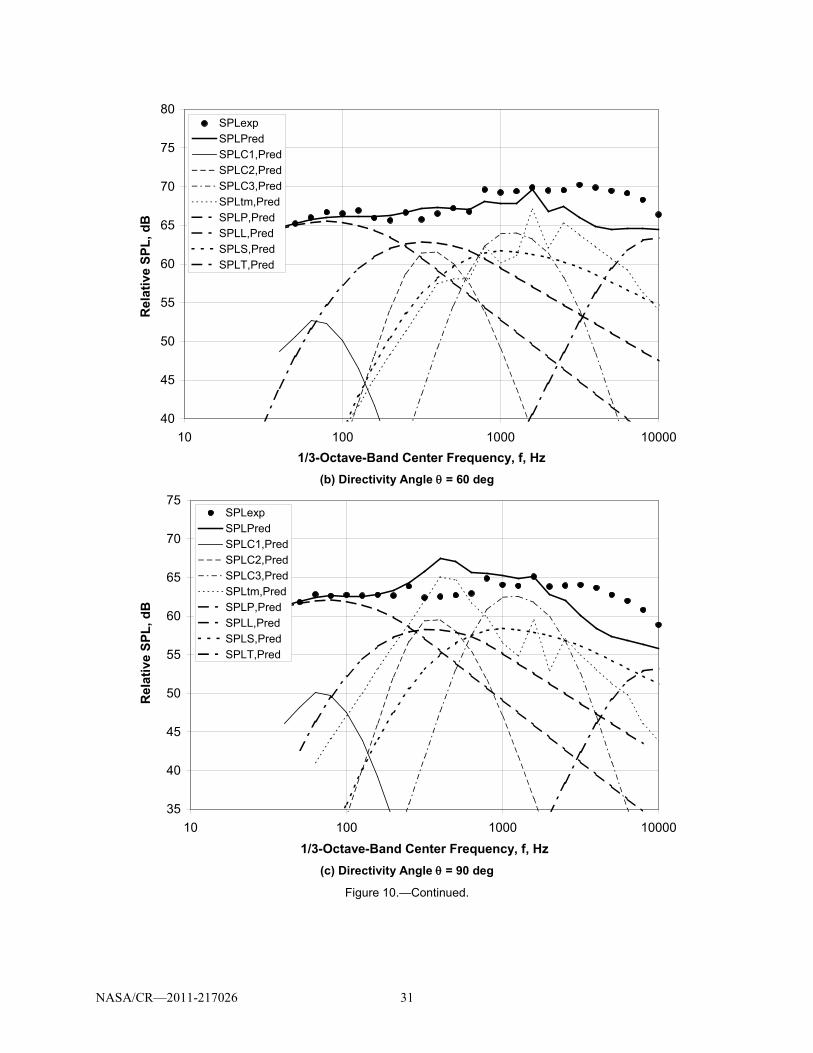
NASA/CR—2011-217026 31
(b) Directivity Angle θ = 60 deg
(c) Directivity Angle θ = 90 deg
Figure 10.—Continued.
40
45
50
55
60
65
70
75
80
10 100 1000 100001/3-Octave-Band Center Frequency, f, Hz
Rel
ativ
e SP
L, d
B
SPLexpSPLPredSPLC1,PredSPLC2,PredSPLC3,PredSPLtm,PredSPLP,PredSPLL,PredSPLS,PredSPLT,Pred
35
40
45
50
55
60
65
70
75
10 100 1000 100001/3-Octave-Band Center Frequency, f, Hz
Rel
ativ
e SP
L, d
B
SPLexpSPLPredSPLC1,PredSPLC2,PredSPLC3,PredSPLtm,PredSPLP,PredSPLL,PredSPLS,PredSPLT,Pred

NASA/CR—2011-217026 32
(d) Directivity Angle θ = 120 deg
(e) Directivity Angle θ = 150 deg
Figure 10.—Concluded.
45
50
55
60
65
70
75
80
85
10 100 1000 10000
1/3-Octave-Band Center Frequency, f, Hz
Rel
ativ
e SP
L, d
BSPLexpSPLPredSPLC1,PredSPLC2,PredSPLC3,PredSPLtm,PredSPLP,PredSPLL,PredSPLS,PredSPLT,Pred
45
50
55
60
65
70
75
80
85
10 100 1000 100001/3-Octave-Band Center Frequency, f, Hz
Rel
ativ
e SP
L, d
B
SPLexpSPLPredSPLC1,PredSPLC2,PredSPLC3,PredSPLtm,PredSPLP,PredSPLL,PredSPLS,PredSPLT,Pred

NASA/CR—2011-217026 33
Figure 11.—Comparison of Experimental and Predicted OASPL Directivities for GE90 at High Power,
Vmix/camb = 0.906.
(a) Low Frequency Component
Figure 12.—Core Noise Level Correlations.
60
65
70
75
80
85
90
95
100
0 20 40 60 80 100 120 140 160 180
Directivity Angle, θ, deg
Rel
ativ
e O
ASP
L, d
BOASPLexpOASPLPredOASPLC1,PredOASPLC2,PredOASPLC3,PredOASPLF,PredOASPLP,PredOASPLL,PredOASPLS,PredOASPLT,Pred
105
110
115
120
125
130
135
140
145
50 55 60 65 70 75 80 85 90
Modified Core Noise Parameter, 10 log WI [(TC,o - TC,i)(PC,i/Pamb)(Tamb/TC,i)]2} - 20 log nf, dB
Nor
mai
lized
Com
pone
nt L
evel
, UO
L C1 +
20
log
R,
dB
CF6CF6CF34CF34CFM56CFM56GE90GE90GE90CorrCorr + 3Corr - 3
Correlation: UOLC1 = CC1 - 20 log R - FC1 log nf + NC1 log {WI [(TC,o - TC,i)(PC,i/Pamb)(Tamb/TC,i)]
2}Where: CC1 = 78.0; FC1 = 14.0; NC1 = 7.0
Note: small solid symbols denote this component is significant, medium gray symbols
denote component marginal or tone contaminated; large open symbols denote
minor component - approximate value

NASA/CR—2011-217026 34
(b) Middle Frequency Component
(c) High Frequency Component
Figure 12.—Concluded.
105
110
115
120
125
130
135
140
145
150
155
50 55 60 65 70 75 80 85 90Modifeied Core Noise Parameter, 10 log {WI [(TC,o -
TC,i)(PC,i/Pamb)(Tamb/TC,i)]2} - 18 log nf, dB
Nor
mal
ized
Com
pone
nt L
evel
, UO
L C2 +
20
log
R,
dB
CF6CF34CFM56GE90CF6CFM56CFM56GE90GE90CorrCorr + 3Corr - 3
Correlation: UOLC2 = CC2 - 20 log R - FC2 log nf + NC2
log {WI [(TC,o - TC,i)(PC,i/Pamb)(Tamb/TC,i)]2}
Where: CC2= 60.3; FC2 = 18; NC2 = 10.0
Note: small solid symbols denote this component is significant, medium gray symbols denote component marginal or tone contaminated; large open symbols
denote minor component - approximate value
110
115
120
125
130
135
140
145
150
155
80 85 90 95 100 105 110 115 120Core Noise Parameter, 10 log {WI [(TC,o - TC,i)(PC,i/Pamb)(Tamb/TC,i)]2}, dB
Nor
mal
ized
Com
pone
nt L
evel
, CC
3 + 2
0 lo
g R
, dB
CF6CF34CFM56GE90CFM56CFM56GE90CorrCorr + 3Corr - 3
Correlation: UOLC3 = CC3 - 20 log R - FC3 log nf + NC3 log {WI [(TC,o - TC,i)(PC,i/Pamb)(Tamb/TC,i)]
2}Where: CC3 = 42.5; FC3 = 0.0; NC3 = 9.0
Note: small solid symbols denote this component is significant, medium gray symbols denote component marginal or tone contaminated; large open symbols
denote minor component - approximate value

NASA/CR—2011-217026 35
(a) Corrected Directivity Angle θC,cor = 29.4-29.7 deg
(b) Corrected Directivity Angle θC,cor = 59.0-59.4 deg
Figure 13.—Normalized Spectra for Low Frequency Core Noise.
-20
-18
-16
-14
-12
-10
-8
-6
-4
-2
0
-1.6 -1.4 -1.2 -1.0 -0.8 -0.6Core Strouhal Parameter, log SC1, dimensionless
Nor
mal
ized
Sou
nd P
ress
ure
Leve
l, SP
L C1,
EE -
UO
L C1,
EE,
dB
Corr 60Corr + 3Corr - 3CF6, 1650CF6, 1800CF6, 2100CF34, 4000CF34, 4200CF34, 4400CFM56, 1375CFM56, 2000CFM56, 2150CFM56, 2450CFM56, 5053GE90, 1200GE90, 1320GE90, 1720GE90, 1800GE90-cfg5, 1200GE90-Blkiv, 1200GE90-Blkiv, 710
StC1 = fDh,I/camb
Note: data plotted only if SPLC1 is within 7.0 dB of total
-20
-18
-16
-14
-12
-10
-8
-6
-4
-2
0
-1.6 -1.4 -1.2 -1.0 -0.8 -0.6Core Strouhal Parameter, log SC1, dimensionless
Nor
mal
ized
Sou
nd P
ress
ure
Leve
l, SP
L C1,
EE -
UO
L C1,
EE,
dB
Corr 30Corr + 3Corr - 3CF6, 1650CF6, 1800CF6, 2100CF34, 4000CF34, 4200CF34, 4400CFM56, 1375CFM56, 2000CFM56, 2150CFM56, 2450CFM56, 5053GE90, 1200GE90, 1320GE90, 1720GE90, 1800GE90-cfg5, 1200GE90-Blkiv, 1200GE90-Blkiv, 710
StC1 = fDh,I/camb
Note: data plotted only if SPLC1 is within 7.0 dB of total
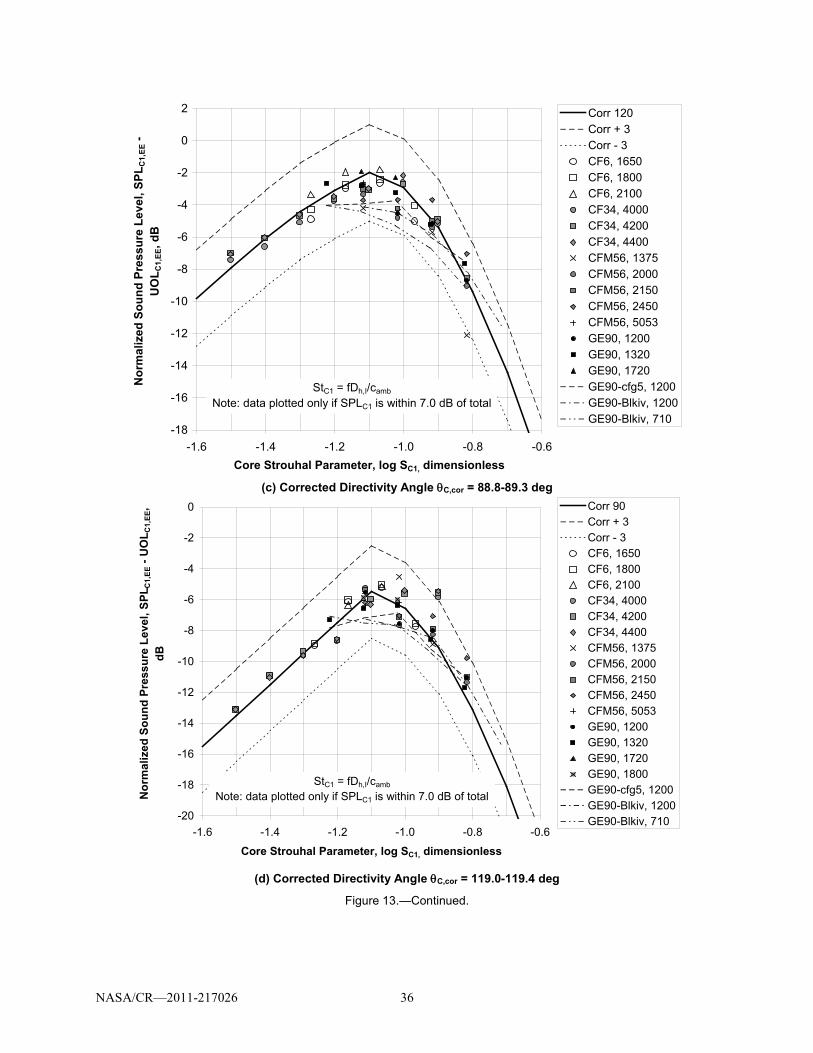
NASA/CR—2011-217026 36
(c) Corrected Directivity Angle θC,cor = 88.8-89.3 deg
(d) Corrected Directivity Angle θC,cor = 119.0-119.4 deg
Figure 13.—Continued.
-18
-16
-14
-12
-10
-8
-6
-4
-2
0
2
-1.6 -1.4 -1.2 -1.0 -0.8 -0.6Core Strouhal Parameter, log SC1, dimensionless
Nor
mal
ized
Sou
nd P
ress
ure
Leve
l, SP
L C1,
EE -
UO
L C1,
EE, d
B
Corr 120Corr + 3Corr - 3CF6, 1650CF6, 1800CF6, 2100CF34, 4000CF34, 4200CF34, 4400CFM56, 1375CFM56, 2000CFM56, 2150CFM56, 2450CFM56, 5053GE90, 1200GE90, 1320GE90, 1720GE90-cfg5, 1200GE90-Blkiv, 1200GE90-Blkiv, 710
StC1 = fDh,I/camb
Note: data plotted only if SPLC1 is within 7.0 dB of total
-20
-18
-16
-14
-12
-10
-8
-6
-4
-2
0
-1.6 -1.4 -1.2 -1.0 -0.8 -0.6
Core Strouhal Parameter, log SC1, dimensionless
Nor
mal
ized
Sou
nd P
ress
ure
Leve
l, SP
L C1,
EE -
UO
L C1,
EE,
dB
Corr 90Corr + 3Corr - 3CF6, 1650CF6, 1800CF6, 2100CF34, 4000CF34, 4200CF34, 4400CFM56, 1375CFM56, 2000CFM56, 2150CFM56, 2450CFM56, 5053GE90, 1200GE90, 1320GE90, 1720GE90, 1800GE90-cfg5, 1200GE90-Blkiv, 1200GE90-Blkiv, 710
StC1 = fDh,I/camb
Note: data plotted only if SPLC1 is within 7.0 dB of total

NASA/CR—2011-217026 37
(e) Corrected Directivity Angle θC,cor = 149.4-149.6 deg
Figure 13.—Concluded.
(a) Corrected Directivity Angle θC,cor = 29.4-29.7 deg
Figure 14.—Normalized Spectra for Middle Frequency Core Noise.
-20
-18
-16
-14
-12
-10
-8
-6
-4
-2
0
-1.6 -1.4 -1.2 -1.0 -0.8 -0.6
Core Strouhal Parameter, log SC1, dimensionless
Nor
mal
ized
Sou
nd P
ress
ure
Leve
l, SP
L C1,
EE -
UO
L C1,
EE, d
B
Corr 150Corr + 3Corr - 3CF34, 4000CFM56, 1375CFM56, 2000CFM56, 2150CFM56, 2450GE90, 1200GE90-cfg5, 1200GE90-Blkiv, 1200GE90-Blkiv, 710
StC1 = fDh,I/camb
Note: data plotted only if SPLC1 is within 7.0 dB of total
-24
-22
-20
-18
-16
-14
-12
-10
-8
-6
-4
-2
0
2
-1.2 -1.0 -0.8 -0.6 -0.4
Core Strouhal Parameter, log SC2, dimensionless
Nor
mal
ized
Sou
nd P
ress
ure
Leve
l, SP
L C2,
EE -
UO
L C2,
EE, d
B
Corr 30Corr + 3.0Corr - 3.0CF6, 1650CF6, 1800CF6, 2100CF6, 2700CF6, 3534CF34, 4000CF34, 4200CF34, 4400CF34, 6800CF34, 7225CFM56, 1375CFM56, 2000CFM56, 2150CFM56, 2450CFM56, 5053GE90, 1200GE90, 1320GE90, 1720GE90, 1880GE90, 2200GE90-cfg5, 1200GE90-Blkiv, 1200
SC2 = fDC/cC,o
Note: data plotted only ifSPLC2 is within 7.0 dB of total

NASA/CR—2011-217026 38
(b) Corrected Directivity Angle θC,cor = 59.0-59.4 deg
(c) Corrected Directivity Angle θC,cor = 88.8-89.3 deg
Figure 14.—Continued.
-22
-20
-18
-16
-14
-12
-10
-8
-6
-4
-2
0
2
4
-1.2 -1.0 -0.8 -0.6 -0.4
Core Strouhal Parameter, log SC2, dimensionless
Nor
mal
ized
Sou
nd P
ress
ure
Leve
l, SP
L C2,
EE -
UO
L C2,
EE, d
B
Corr 90Corr + 3.0Corr - 3.0CF6, 1650CF6, 1800CF6, 2100CF6, 2700CF6, 3534CF34, 4000CF34, 4200CF34, 4400CF34, 6800CF34, 7225CFM56, 1375CFM56, 2000CFM56, 2150CFM56, 2450CFM56, 5053GE90, 1200GE90, 1320GE90, 1720GE90, 1800GE90, 1880GE90, 2200GE90-cfg5, 1200GE90-Blkiv, 1200GE90-Blkiv, 710
SC2 = fDC/cC,o
Note: data plotted only if SPLC2 is within 7.0 dB of total
-22
-20
-18
-16
-14
-12
-10
-8
-6
-4
-2
0
2
4
-1.2 -1.0 -0.8 -0.6 -0.4
Core Strouhal Parameter, log SC2, dimensionless
Nor
mal
ized
Sou
nd P
ress
ure
Leve
l, SP
L C2,
EE -
UO
L C2,
EE, d
B
Corr 60Corr + 3.0Corr - 3.0CF6, 1650CF6, 1800CF6, 2100CF6, 2700CF6, 3534CF34, 4000CF34, 4200CF34, 4400CF34, 6800CF34, 7225CFM56, 1375CFM56, 2000CFM56, 2150CFM56, 2450CFM56, 5053GE90, 1200GE90, 1320GE90, 1720GE90, 1800GE90, 1880GE90, 2200GE90-cfg5, 1200GE90-Blkiv, 1200GE90-Blkiv, 710
SC2 = fDC/cC,o
Note: data plotted only if SPLC2
is within 7.0 dB of total

NASA/CR—2011-217026 39
(d) Corrected Directivity Angle θC,cor = 119.0-119.4 deg
(e) Corrected Directivity Angle θC,cor = 149.4-149.6 deg
Figure 14.—Concluded.
-24
-22
-20
-18
-16
-14
-12
-10
-8
-6
-4
-2
0
2
4
-1.2 -1.0 -0.8 -0.6 -0.4
Core Strouhal Parameter, log SC2, dimensionless
Nor
mal
ized
Sou
nd P
ress
ure
Leve
l, SP
L C2,
EE -
UO
L C2,
EE, d
B
Corr 150Corr + 3.0Corr - 3.0CF6, 1650CF6, 1800CF6, 2100CF34, 4000CF34, 4200CF34, 4400CFM56, 1375CFM56, 2000CFM56, 2150CFM56, 2450GE90, 1200GE90, 1320GE90, 1720GE90-cfg5, 1200GE90-Blkiv, 1200GE90-Blkiv, 710
SC2 = fDC/cC,o
Note: data plotted only if SPLC2
is within 7.0 dB of total
-22
-20
-18
-16
-14
-12
-10
-8
-6
-4
-2
0
2
4
6
-1.2 -1.0 -0.8 -0.6 -0.4
Core Strouhal Parameter, log SC2, dimensionless
Nor
mal
ized
Sou
nd P
ress
ure
Leve
l, SP
L C2,
EE -
UO
L C2,
EE, d
B
Corr 120Corr + 3.0Corr - 3.0CF6, 1650CF6, 1800CF6, 2100CF6, 2700CF34, 4000CF34, 4200CF34, 4400CFM56, 1375CFM56, 2000CFM56, 2150CFM56, 2450CFM56, 5053GE90, 1200GE90, 1320GE90, 1720GE90, 1880GE90, 2200GE90-cfg5, 1200GE90-Blkiv, 1200GE90-Blkiv, 710
SC2 = fDC/cC,o
Note: data plotted only if SPLC2 is within 7.0 dB of total

NASA/CR—2011-217026 40
(a) Corrected Directivity Angle θC,cor = 29.4-29.7 deg
(b) Corrected Directivity Angle θC,cor = 59.0-59.4 deg
Figure 15.—Normalized Spectra for High Frequency Core Noise.
-20
-18
-16
-14
-12
-10
-8
-6
-4
-2
0
-0.7 -0.6 -0.5 -0.4 -0.3 -0.2 -0.1 0.0 0.1 0.2 0.3
Core Strouhal Parameter, log SC3, dimensionless
Nor
mal
ized
Sou
nd P
ress
ure
Leve
l, SP
L C3,
EE -
UO
L C3,
EE, d
B
Pred 60Corr + 3.0Corr - 3.0CF6, 1650CF6, 1800CF6, 2100CF6, 2700CF6, 3534CF34, 4000CF34, 4200CF34, 4400CF34, 6800CF34, 7225CFM56, 1375CFM56, 2000CFM56, 2150CFM56, 2450GE90, 1200GE90, 1320GE90, 1720GE90, 1800GE90, 1880GE90, 2200GE90, 2400GE90-Blkiv, 1200
SC3 = fDC/cC,o
Note: data plotted only ifSPLC3 is within 7.0 dB of total
-20
-18
-16
-14
-12
-10
-8
-6
-4
-2
0
-0.7 -0.6 -0.5 -0.4 -0.3 -0.2 -0.1 0.0 0.1 0.2 0.3
Core Strouhal Parameter, log SC3, dimensionless
Nor
mal
ized
Sou
nd P
ress
ure
Leve
l, SP
L C3,
EE -
UO
L C3,
EE, d
B
Pred 30Corr + 3.0Corr - 3.0CF6, 1650CF6, 1800CF6, 2100CF6, 2700CF6, 3534CF34, 4000CF34, 4200CF34, 4400CF34, 6800CF34, 7225CFM56, 1375CFM56, 2000CFM56, 2150CFM56, 2450GE90, 1200GE90, 1320GE90, 1720GE90, 1800GE90, 1880GE90, 2200GE90, 2400
SC3 = fDC/cC,o
Note: data plotted only ifSPLC3 is within 7.0 dB of total

NASA/CR—2011-217026 41
(c) Corrected Directivity Angle θC,cor = 88.8-89.3 deg
(d) Corrected Directivity Angle θC,cor = 119.0-119.4 deg
Figure 15.—Continued.
-18
-16
-14
-12
-10
-8
-6
-4
-2
0
2
-0.7 -0.6 -0.5 -0.4 -0.3 -0.2 -0.1 0.0 0.1 0.2 0.3
Core Strouhal Parameter, log SC3, dimensionless
Nor
mal
ized
Sou
nd P
ress
ure
Leve
l, SP
L C3,
EE -
UO
L C3,
EE, d
B
Pred 120Corr + 3.0Corr - 3.0CF6, 1650CF6, 1800CF6, 2100CF6, 2700CF6, 3534CF34, 4000CF34, 4200CF34, 4400CF34, 6800CF34, 7225CFM56, 1375CFM56, 2000CFM56, 2150CFM56, 2450GE90, 1200GE90, 1320GE90, 1720GE90, 1800GE90, 1880GE90, 2200GE90, 2400GE90-Blkiv, 1200
SC3 = fDC/cC,o
Note: data plotted only if SPLC3 is within 7.0 dB of total
-20
-18
-16
-14
-12
-10
-8
-6
-4
-2
0
-0.7 -0.6 -0.5 -0.4 -0.3 -0.2 -0.1 0.0 0.1 0.2 0.3
Core Strouhal Parameter, log SC3, dimensionless
Nor
mal
ized
Sou
nd P
ress
ure
Leve
l, SP
L C3,
EE -
UO
L C3,
EE, d
B
Pred 90Corr + 3.0Corr - 3.0CF6, 1650CF6, 1800CF6, 2100CF6, 2700CF6, 3534CF34, 4000CF34, 4200CF34, 4400CF34, 6800CF34, 7225CFM56, 1375CFM56, 2000CFM56, 2150CFM56, 2450GE90, 1200GE90, 1320GE90, 1720GE90, 1800GE90, 1880GE90, 2200GE90, 2400GE90-Blkiv, 1200
SC3 = fDC/cC,o
Note: data plotted only ifSPLC3 is within 7.0 dB of total

NASA/CR—2011-217026 42
(e) Corrected Directivity Angle θC,cor = 149.4-149.6 deg
Figure 15.—Concluded.
Figure 16.—Error (Experimental—Predicted) Versus Nondimensional Mixed Jet Velocity.
-22
-20
-18
-16
-14
-12
-10
-8
-6
-4
-2
-0.7 -0.6 -0.5 -0.4 -0.3 -0.2 -0.1 0.0 0.1 0.2 0.3
Core Strouhal Parameter, log SC3, dimensionless
Nor
mai
zed
Soun
d Pr
essu
re L
evel
, SPL
C3,
EE -
UO
L C3,
EE, d
B
Pred 150Corr + 3.0Corr - 3.0CF6, 1650CF6, 1800CF6, 2100CF6, 2700CF34, 4000CF34, 4200CF34, 4400CFM56, 1375CFM56, 2000CFM56, 2150CFM56, 2450GE90, 1200GE90, 1320GE90, 1720GE90, 1800GE90, 1880GE90, 2200GE90, 2400GE90-Blkiv, 1200
SC3 = fDC/cC,o
Note: data plotted only if SPLC3 is within 7.0 dB of total
-2.5
-2.0
-1.5
-1.0
-0.5
0.0
0.5
1.0
1.5
2.0
2.5
0.200 0.400 0.600 0.800 1.000 1.200
Nondimensional Mixed Jet Velocity, Vmix/camb
Erro
r ∆ (E
xper
imen
tal -
Pre
dict
ed),
dB
Sub-BPF:CF6Sub-BPF:CF34Sub-BPF:CFM56Sub-BPF:GE90C1:CF6C1:CF34C1:CFM56C1:GE90C2:CF6C2:CF34C2:CFM56C2:GE90C3:CF6C3:CF34C3:CFM56C3:GE90

NASA/CR—2011-217026 43
Figure 17.—Standard Deviation Versus Nondimensional Mixed Jet Velocity.
Figure 18.—Root-Mean-Square Error Versus Nondimensional Mixed Jet Velocity.
0.0
0.5
1.0
1.5
2.0
2.5
0.200 0.400 0.600 0.800 1.000 1.200
Nondimensional Mixed Jet Velocity, Vmix/camb
Stan
dard
Dev
iatio
n, σ
, dB
Sub-BPF:CF6Sub-BPF:CF34Sub-BPF:CFM56Sub-BPF:GE90C1:CF6C1:CF34C1:CFM56C1:GE90C2:CF6C2:CF34C2:CFM56C2:GE90C3:ACF6C3:CF34C3:CFM56C3:GE90
0.0
0.5
1.0
1.5
2.0
2.5
3.0
3.5
4.0
4.5
0.200 0.400 0.600 0.800 1.000 1.200
Nondimensional Mixed Jet Velocity, Vmix/camb
Roo
t-Mea
n-Sq
uare
Err
or, ε
, dB
Sub-BPF:CF6Sub-BPF:CF34Sub-BPF:CFM56Sub-BPF:GE90C1:CF6C1:CF34C1:CFM56C1:GE90C2:CF6C2:CF34C2:CFM56C2:GE90C3:CF6C3:CF34C3:CFM56C3:GE90

NASA/CR—2011-217026 44
(a) 33 Percent rpm
(b) 40 Percent rpm
Figure 19.—Experimental 3-Signal Coherence Spectra Compared With Correlation at Directivity Angle θ = 120 deg for JT15D Engine.
45
50
55
60
65
70
75
80
85
10 100 1000 10000
1/3-Octave-Band Center Frequency, f, Hz
Free
-Fie
ld S
PL a
t 100
ft, S
PL, d
BSPLexpSPLPredSPLC1,PredSPLC2,PredSPLC3,Pred
45
50
55
60
65
70
75
80
85
10 100 1000 10000
1/3-Octave-Band Center Frequency, f, Hz
Free
-Fie
ld S
PL a
t 100
ft, d
B
SPLexpSPLPredSPLC1,PredSPLC2,PredSPLC3,Pred

NASA/CR—2011-217026 45
(c) 55 Percent rpm
(d) 73 Percent rpm
Figure 19.—Concluded.
45
50
55
60
65
70
75
80
85
10 100 1000 100001/3-Octave-Band Center Frequency, f, Hz
Free
-Fie
ld S
PL a
t 100
ft, d
BSPLexpSPLPredSPLC1,PredSPLC2,PredSPLC3,Pred
45
50
55
60
65
70
75
80
85
10 100 1000 10000
1/3-Octave-Band Center Frequency, f, Hz
Free
-Fie
ld L
ossl
ess
SPL
at 1
00 ft
, dB
SPLexpSPLPredSPLC1,PredSPLC2,PredSPLC3,Pred

NASA/CR—2011-217026 46
(a) Three-Signal Coherence Data
(b) Total Engine Noise Data
Figure 20.—Experimental Spectra Compared With Correlation at Directivity Angle θ = 120 deg for YF-102 Engine.
45
50
55
60
65
70
75
80
85
10 100 1000 10000
1/3-Octave-Band Center Frequency, f, Hz
Free
-Fie
ld L
ossl
ess
SPL
at 1
00 ft
, dB
SPLexpSPLPredSPLC1,PredSPLC2,PredSPLC3,PredSPLF,PredSPLL,PredSPLT,Pred
45
50
55
60
65
70
75
80
85
10 100 1000 10000
1/3-Octave-Band Center Frequency, f, Hz
Free
-Fie
ld L
ossl
ess
SPL
at 1
00 ft
, dB
SPLexpSPLPredSPLC1,PredSPLC2,PredSPLC3,Pred

NASA/CR—2011-217026 47
Appendix A.—Nomenclature
ANOPP Aircraft Noise Prediction Program BPF Blade passage frequency, Hz BPR Bypass ratio C Noise component coefficient c Sonic velocity D Diameter, ft F (Negative) slope of UOL versus nf relationships f Frequency, Hz GE General Electric GRC Glenn Research Center M Mach number MTCT MTC Technologies N Core noise component slope (UOL vs. core parameter) nf Number of fuel nozzles NASA National Aeronautics and Space Administration OAPWL Overall sound power level, dB OASPL Overall sound pressure level, dB re 20 µPa P Total pressure (absolute), psia R Source-to-observer distance, ft S Strouhal number, dimensionless SPL Sound pressure level, dB re 20 µPa T Total temperature (absolute), deg R UOL OASPL at θ = 90 deg V Velocity, ft/sec W Mass flow rate, lbm/sec ∆ Error, experimental minus predicted value, dB ε Root-mean-square (RMS) error, dB θ Directivity angle (relative to engine inlet), deg σ Standard deviation, dB
Subscripts:
0 Flight amb Ambient C Combustor C1 Low frequency core noise component C2 Middle frequency core noise component C3 High frequency core noise component C,i Combustor inlet C,o Combustor outlet C(i) “i”th core noise component comp Component

NASA/CR—2011-217026 48
cor Corrected for source location EE Experimental/extracted exp Experimental f Simulated flight h Hydraulic I Inner (core, total into nozzle) j Jet L Large scale mixing mix Mass-averaged mixed flow P Plug separation Pred Predicted S Small scale mixing T Transitional mixing tm Turbomachinery

REPORT DOCUMENTATION PAGE Form Approved OMB No. 0704-0188
The public reporting burden for this collection of information is estimated to average 1 hour per response, including the time for reviewing instructions, searching existing data sources, gathering and maintaining the data needed, and completing and reviewing the collection of information. Send comments regarding this burden estimate or any other aspect of this collection of information, including suggestions for reducing this burden, to Department of Defense, Washington Headquarters Services, Directorate for Information Operations and Reports (0704-0188), 1215 Jefferson Davis Highway, Suite 1204, Arlington, VA 22202-4302. Respondents should be aware that notwithstanding any other provision of law, no person shall be subject to any penalty for failing to comply with a collection of information if it does not display a currently valid OMB control number. PLEASE DO NOT RETURN YOUR FORM TO THE ABOVE ADDRESS.
1. REPORT DATE (DD-MM-YYYY) 01-06-2011
2. REPORT TYPE Final Contractor Report
3. DATES COVERED (From - To)
4. TITLE AND SUBTITLE Enhanced Core Noise Modeling for Turbofan Engines
5a. CONTRACT NUMBER NAS3-00178
5b. GRANT NUMBER
5c. PROGRAM ELEMENT NUMBER
6. AUTHOR(S) Stone, James, R.; Krejsa, Eugene, A.; Clark, Bruce, J.
5d. PROJECT NUMBER
5e. TASK NUMBER 15
5f. WORK UNIT NUMBER WU 22-781-20-01
7. PERFORMING ORGANIZATION NAME(S) AND ADDRESS(ES) MTC Technologies
8. PERFORMING ORGANIZATION REPORT NUMBER E-17691
9. SPONSORING/MONITORING AGENCY NAME(S) AND ADDRESS(ES) National Aeronautics and Space Administration Washington, DC 20546-0001
10. SPONSORING/MONITOR'S ACRONYM(S) NASA
11. SPONSORING/MONITORING REPORT NUMBER NASA/CR-2011-217026
12. DISTRIBUTION/AVAILABILITY STATEMENT Unclassified-Unlimited Subject Categories: 05 and 07 Available electronically at http://www.sti.nasa.gov This publication is available from the NASA Center for AeroSpace Information, 443-757-5802
13. SUPPLEMENTARY NOTES
14. ABSTRACT This report describes work performed by MTC Technologies (MTCT) for NASA Glenn Research Center (GRC) under Contract NAS3-00178, Task Order No. 15. MTCT previously developed a first-generation empirical model that correlates the core/combustion noise of four GE engines, the CF6, CF34, CFM56, and GE90 for General Electric (GE) under Contract No. 200-1X-14W53048, in support of GRC Contract NAS3-01135. MTCT has demonstrated in earlier noise modeling efforts that the improvement of predictive modeling is greatly enhanced by an iterative approach, so in support of NASA’s Quiet Aircraft Technology Project, GRC sponsored this effort to improve the model. Since the noise data available for correlation are total engine noise spectra, it is total engine noise that must be predicted. Since the scope of this effort was not sufficient to explore fan and turbine noise, the most meaningful comparisons must be restricted to frequencies below the blade passage frequency. Below the blade passage frequency and at relatively high power settings jet noise is expected to be the dominant source, and comparisons are shown that demonstrate the accuracy of the jet noise model recently developed by MTCT for NASA under Contract NAS3-00178, Task Order No. 10. At lower power settings the core noise became most apparent, and these data corrected for the contribution of jet noise were then used to establish the characteristics of core noise. There is clearly more than one spectral range where core noise is evident, so the spectral approach developed by von Glahn and Krejsa in 1982 wherein four spectral regions overlap, was used in the GE effort. Further analysis indicates that the two higher frequency components, which are often somewhat masked by turbomachinery noise, can be treated as one component, and it is on that basis that the current model is formulated. The frequency scaling relationships are improved and are now based on combustor and core nozzle geometries. In conjunction with the Task Order No. 10 jet noise model, this core noise model is shown to provide statistical accuracy comparable to the jet noise model for frequencies below blade passage. This model is incorporated in the NASA FOOTPR code and a user’s guide is provided. 15. SUBJECT TERMS Aeroacoustics; Aircraft noise; Jet aircraft noise; Noise prediction (aircraft)
16. SECURITY CLASSIFICATION OF: 17. LIMITATION OF ABSTRACT UU
18. NUMBER OF PAGES
57
19a. NAME OF RESPONSIBLE PERSON STI Help Desk (email:[email protected])
a. REPORT U
b. ABSTRACT U
c. THIS PAGE U
19b. TELEPHONE NUMBER (include area code) 443-757-5802
Standard Form 298 (Rev. 8-98)Prescribed by ANSI Std. Z39-18