ENHANCED BURN WOUND HEALING THROUGH CONTROLLED …
218
ENHANCED BURN WOUND HEALING THROUGH CONTROLLED AND SUSTAINED DELIVERY OF BIOACTIVE INSULIN FROM ALGINATE SPONGE DRESSINGS By Michael Thomas Hrynyk A thesis submitted to the Graduate Program in Chemical Engineering in conformity with the requirements for the degree of Doctor of Philosophy Queen’s University Kingston, Ontario, Canada December 2012 Copyright © Michael Thomas Hrynyk, 2012
Transcript of ENHANCED BURN WOUND HEALING THROUGH CONTROLLED …

ENHANCED BURN WOUND HEALING THROUGH CONTROLLED AND
SUSTAINED DELIVERY OF BIOACTIVE INSULIN
FROM ALGINATE SPONGE DRESSINGS
By
Michael Thomas Hrynyk
A thesis submitted to the Graduate Program in Chemical Engineering
in conformity with the requirements for
the degree of Doctor of Philosophy
Queen’s University
Kingston, Ontario, Canada
December 2012
Copyright © Michael Thomas Hrynyk, 2012

i
Abstract
Skin is a dynamic and complex organ that relies on the interaction of different cell types,
biomacromolecules and signaling molecules. Upon injury, a cascade of events occurs to quickly
restore the skin’s integrity. Depending on the size and severity of the wound, a dressing is used
to provide a temporary barrier to protect from dehydration, microorganisms and debris. Current
wound dressings however, cannot accelerate wound healing beyond the natural rate, require
frequent dressing changes, and cannot be easily removed without triggering additional pain or
tissue destruction. Insulin, a peptide used to treat Type 1 diabetes, has been reported to improve
the recovery of severe burn wounds. Yet, no one has successfully demonstrated a convenient
and effective insulin delivery vehicle that can be used to accelerate burn wound healing.
Poly(lactic-co-glycolic acid) microparticles, were shown to release bioactive insulin for a
period of 25 days, stimulating human keratinocyte migration in vitro. A wound dressing made
from poly(ethylene glycol) and alginate was formulated incorporating the insulin-loaded
poly(lactic-co-glycolic acid) microparticles. Bioactive insulin release was achieved for nearly 3
weeks, along with favourable water handling and physical properties conducive for wound
healing. Finally, in vivo testing confirmed that a constant dose of insulin from alginate-PEG
sponge dressings loaded with 0.125mg, or 0.04mg/cm2 insulin, with dressing changes every 3
days, was sufficient to significantly improve wound healing by 25%, as compared to an alginate-
PEG sponge dressing without insulin. Insulin releasing alginate-PEG sponge dressings are
therefore, an effective method of improving burn wound healing and may serve as a delivery
vehicle platform to incorporate other therapeutic molecules in the future.

ii
Acknowledgements
I would like to begin by saying thank you to my supervisor, Dr. Ron Neufeld for his
steadfast support during my journey through graduate school. Your advice, patience, and
encouragement have made me get through some truly difficult times and have always given me
hope for the future. I credit you for making me a better researcher, mentor and individual inside
and outside of the lab.
To Drs. Annelise Barron, Manuela Martins-Green, and Yan Liu, thank you for
introducing me to the world of wound healing, and for providing me with the support to pursue
my studies both here in Kingston and in California. Your insight was pivotal in allowing me to
complete my PhD. To Kristen Bowey, Joe Steele, and Jordon Ellis, thank you for being my
second pair of eyes, and for giving me the insight to explore new avenues. To Mr. Charlie
Cooney and Andrea Liskova, thank you for all of your technical advice over the years. I will
miss hearing your stories in the SEM room.
To my parents, I cannot express how much I appreciate all of your support, love and
advice you have given me over the past 4 years. You’ve made me realize that there is always a
light at the end of the tunnel, and that you will always be there to support me in whatever it is
that I tackle. Melissa, thank you so much for all of your patience, love, advice and emotional
support during my PhD. The tens of thousands of kilometers I drove to see your smile over the
years was well worth it to remind me of the life I have outside of school. To Mr. Tony
Tiefenbach, thank you for giving me my wings, and showing me a new perspective few get to
see. You and Anne will always be my family away from home.

iii
Table of Contents
Abstract .................................................................................................................................... i
Acknowledgements .................................................................................................................. ii
List of Figures .......................................................................................................................... x
List of Tables ........................................................................................................................... xvii
Chapter 1 Introduction ............................................................................................................. 1
1.0 Burn Injuries and Treatment .................................................................................... 1
Chapter 2 Literature Review .................................................................................................... 3
2.0 Human Skin .............................................................................................................. 3
2.1 Skin – Physiology and Anatomy .............................................................................. 4
2.2 Epidermis ........................................................................................................ 4
2.2.1 Keratinocytes ............................................................................................... 5
2.2.2 Melanocytes ................................................................................................. 6
2.2.3 Merkel Cells ................................................................................................. 7
2.2.4 Langerhans Cells .......................................................................................... 7
2.2.5 Fibroblasts .................................................................................................... 9
2.2.6 Stratum Basale ............................................................................................. 9
2.2.7 Stratum Spinosum ........................................................................................ 10
2.2.8 Stratum Granulosum .................................................................................... 10

iv
2.2.9 Stratum Corneum ......................................................................................... 11
2.3 Dermal-Epidermal Junction...................................................................................... 12
2.4 Dermis ...................................................................................................................... 12
2.5 Skin Appendages ...................................................................................................... 14
2.5.1 Eccrine Sweat Glands .................................................................................. 14
2.5.2 Apocrine Sweat Glands ................................................................................ 14
2.5.3 Sebaceous Sweat Glands .............................................................................. 15
2.5.4 Hair Follicles ................................................................................................ 15
2.5.5 Nails ............................................................................................................. 16
2.6 Wounds ..................................................................................................................... 17
2.6.1 Burns ............................................................................................................ 19
2.6.2 Burn Epidemiology ...................................................................................... 19
2.6.3 Burn Etiology ............................................................................................... 20
2.6.4 Burn Scoring ................................................................................................ 24
2.6.5 First Degree/Superficial Burns..................................................................... 25
2.6.6 Second Degree/Partial-Thickness Burns ...................................................... 25
2.6.7 Third Degree/Full-Thickness Burns ............................................................. 26
2.6.8 Total Body Surface Area (TBSA) ................................................................ 27
2.7 Wound Healing ......................................................................................................... 28
2.7.1 Haemostasis ................................................................................................. 28
2.7.2 Inflammatory Phase ..................................................................................... 29

v
2.7.3 Proliferative Phase ....................................................................................... 30
2.7.4 Remodeling Phase ........................................................................................ 32
2.8 Dressing Requirements ............................................................................................. 33
2.8.1 Calcium Alginate Dressings......................................................................... 35
2.8.2 Foam Dressings ............................................................................................ 37
2.8.3 Gauze ........................................................................................................... 38
2.8.4 Hydrocolloids ............................................................................................... 39
2.8.5 Hydrogels ..................................................................................................... 40
2.8.6 Transparent Films ........................................................................................ 42
2.8.7 Biologicals ................................................................................................... 43
2.8.7.1 Epidermal Growth Factor ................................................................ 44
2.8.7.2 Transforming Growth Factor Beta .................................................. 45
2.8.7.3 Platelet Derived Growth Factor ....................................................... 47
2.8.7.4 Additional Growth Factors .............................................................. 48
2.9 Insulin and Wound Healing ...................................................................................... 50
2.9.1 Discovery of Insulin ..................................................................................... 50
2.9.2 Biosynthesis and Structure ........................................................................... 51
2.9.3 Recombinant Synthesis and Crystallization ................................................. 55
2.9.4 Insulin Receptor ........................................................................................... 56
2.9.5 Beginning of Insulin-Wound Healing .......................................................... 60
2.9.6 Insulin-Wound Healing Research: 1940s-1980s ......................................... 62

vi
2.9.7 Animal and Human Wound Healing Studies – 1980s to Present ................ 65
2.9.8 Cell Based Wound Healing Studies – 1990s to Present............................... 70
2.9.9 Peptide Delivery ........................................................................................... 73
2.9.9.1 Microencapsulation ......................................................................... 74
2.9.9.2 Poly(lactic-co-glycolic acid)............................................................ 77
2.9.9.3 Summary .......................................................................................... 81
Chapter 3 Research Objectives ................................................................................................ 82
Chapter 4 Materials and Methods ............................................................................................ 84
4.1 Materials ................................................................................................................... 84
4.2 Methods .................................................................................................................... 85
4.2.1 Microparticle Preparation ............................................................................ 85
4.2.2 Encapsulation Efficiency ............................................................................. 86
4.2.3 Particle Size and Morphology ...................................................................... 86
4.2.4 DSC Analysis ............................................................................................... 86
4.2.5 In vitro Insulin Release Kinetics from Microparticles ................................. 86
4.2.6 Cell Culture of Rat L6 Myoblasts ................................................................ 87
4.2.7 Cell Culture of HaCaT Cells ........................................................................ 87
4.2.8 Insulin Bioactivity: FACE AKT ELISA ...................................................... 87
4.2.9 Insulin Bioactivity by HaCaT Cell Scratch Assay ....................................... 88
4.3 Alginate Sponge Dressing (ASD) ............................................................................ 89
4.3.1 Scanning Electron Microscopy .................................................................... 89

vii
4.3.2 Physical Properties: Dressing Density ......................................................... 89
4.3.3 Physical Properties: Tensile Testing ............................................................ 90
4.3.4 Physical Properties: Water Vapour Transmission Rate ............................... 90
4.3.5 Physical Properties: Water Absorption Capacity ......................................... 90
4.3.6 Insulin Release Kinetics from PLGA Microparticles within ASD ............. 91
4.4 Insulin Stability ........................................................................................................ 91
4.5 Alginate Microbial Contamination Assay ................................................................ 91
4.6 Animal Burn Model .................................................................................................. 92
4.6.1 Dressing Application and Monitoring.......................................................... 92
4.6.2 Tissue Histology .......................................................................................... 93
4.7 Statistical Analysis ................................................................................................... 93
Chapter 5 Results and Discussion ............................................................................................ 94
5.1 Phase 1 – Microparticle Development .................................................................. 95
5.1.1 Insulin Content in PLGA Microparticles ..................................................... 99
5.1.2 Particle Size and Morphology ...................................................................... 99
5.1.3 DSC Analysis ............................................................................................... 102
5.1.4 Insulin Dissolution ....................................................................................... 103
5.1.5 Insulin Release Kinetics ............................................................................... 104
5.1.6 Insulin Bioactivity: Cellular AKT Phosphorylation Assay ......................... 106
5.1.7 Insulin Bioactivity: Scratch Assay ............................................................... 108
5.2 Phase 2 – Alginate Sponge Dressing (ASD) Development ..................................... 115

viii
5.2.1 Encapsulation Efficiency ............................................................................. 121
5.2.2 Alginate Sponge Dressing (ASD) Morphology ........................................... 122
5.2.3 Density of Sponge Dressings ....................................................................... 124
5.2.4 Tensile Strength of Sponge Dressings ......................................................... 125
5.2.5 Water Vapour Transmission Rate and Water Abs. Capacity of ASD ......... 127
5.2.6 Insulin Release Kinetics ............................................................................... 129
5.2.7 Bioactivity of Released Insulin: HaCaT Scratch Assay ............................... 134
5.2.8 Alginate Microbial Contamination .............................................................. 139
5.2.9 ASD Summary ............................................................................................. 140
5.3 Phase 3 – Animal Studies ......................................................................................... 141
5.3.1 Microparticle Biocompatibility .................................................................... 141
5.3.2 ASD Biocompatibility.................................................................................. 142
5.3.3 ASD Pilot Study ........................................................................................... 145
5.3.4 ASD Dosing ................................................................................................. 148
5.4 Saline Moistened ASD Application with 0.125 mg Insulin Dose ............................ 151
5.4.1 Wound Measurements.................................................................................. 151
5.4.2 Blood Glucose .............................................................................................. 158
5.4.3 Animal Weight ............................................................................................. 160
5.4.4 Histology ...................................................................................................... 161
5.5 ASD with Low Insulin Dose (0.0625 mg) ............................................................... 163
5.6 ASD Repeat Study with 0.125 mg Insulin Dose ...................................................... 166

ix
5.7 Verification of ASD Dose and Application Protocol ............................................... 167
5.8 Summary .................................................................................................................. 168
Chapter 6 Conclusions, Contributions to Knowledge and Future Directions .......................... 170
References ............................................................................................................................... 173

x
List of Figures
Figure 1. An illustration of healthy human skin comprised of the epidermis, dermis, skin appendages and subcutaneous fat.[9]. ............................................................................ 4
Figure 2. An example of a healthy keratinocyte.[28]. ........................................................... 6 Figure 3. An illustration of Langerhans cells sampling and engulfing foreign antigen. The
antigen is then internalized and processed while the Langerhans cells migrate through the local lymphatic ducts to a lymph node. While in the lymph node, the antigen is presented to naïve T cells where a release of cytokines, prime and activate the T cell into a mature effector T cell. The effector T cell is then free to migrate away from the lymph node and search for the foreign pathogen bearing the antigen.[37] ............................................... 8
Figure 4. The epidermis including the stratum basale, stratum spinosum, stratum granulosum
and stratum corneum. Note the position of melanocytes and Langerhans cells located within the deeper layers of the epidermis.[16] ............................................................... 11
Figure 5. The nail unit comprised of the nail plate, nail bed, hyponychium, nail matrix, nail
folds, cuticle, anchoring ligament and distal phalangeal bones.[71]. ............................. 17 Figure 6. A cross-section of the skin and the classification of first-, second- and third-degree
burns. Note that first-degree burns are marginalized to the epidermis, while second- and third-degree burns can reach the dermis and subcutaneous fat.[78] .............................. 18
Figure 7. A pediatric patient with a scald injury to the foot resulting in a superficial partial
thickness burn. British Association of Plastic and Reconstructive and Aesthetic Surgeons, 2012. ............................................................................................................................... 21
Figure 8. A clinical photograph of a male patient with severe alkaline chemical burns to the left
cheek and neck.[85] ........................................................................................................ 22 Figure 9. A patient with electrical burn to the foot. The location of the injury represents an exit
wound whereby the electrical current would have flown out of the body to a ground source. Dr. Ken Harrison, NSW Institute of Trauma and Injury Management. ......................... 23
Figure 10. A male patient with a severe sunburn affecting the back. The uneven appearance of
the sunburn is a result of uneven sunscreen application prior to exposure.[86] ............. 24 Figure 11. The rule of nines in adults (A), and the Lund-Browder estimations for calculating
TBSA in children (B).[88] ............................................................................................. 27 Figure 12. A timeline plotting the appearance of neutrophils, macrophages, fibroblasts during
different phases of wound healing.[102] ........................................................................ 30

xi
Figure 13. Appearance of fibronectin, and types I and III collagen during the wound healing process.[102] .................................................................................................................. 31
Figure 14. The complex wound healing cascade illustrating the importance of cytokines that
drive the transition from one phase of wound healing to the other. The phases of hemostasis (coagulation), inflammation, migration, proliferation and remodeling
are the necessary components for successful wound healing.[81] ................................ 33 Figure 15. The biosynthetic pathway of insulin in its initial, unmodified form as preproinsulin,
through post-translational modification and release of mature insulin within the pancreatic β cells.[204] .................................................................................................................... 53
Figure 16. Proinsulin prior to having the connecting peptide (C-peptide) proteolytically cleaved.
The arrows indicate the cleavage sites, while -S-S- indicate the presence of disulphide bonds.[202] ..................................................................................................................... 54
Figure 17. The proteolytic processing of preproinsulin to proinsulin, then to insulin. Note the
three key steps in insulin’s biosynthetic pathway, 1) cleavage of the signal sequence, 2) formation of the disulphide bond and 3) the removal of the connecting (C-peptide) polypeptide.[205]............................................................................................................ 55
Figure 18. An illustration of the insulin receptor situated on the surface of the plasma
membrane.[237] ............................................................................................................. 59 Figure 19. A plot of insulin concentration over time, along with the proposed structural changes
which occur as insulin binds with Sites 1 & 2.[232]. ..................................................... 60 Figure 20. The chemical structure of PLGA. Note the ester bond which links the lactic acid
moiety to the glycolic acid moiety. The ester bond can be broken by hydrolysis causing the erosion of PLGA with time. ..................................................................................... 79
Figure 21. The reaction mechanism illustrating the hydrolysis of PLGA. The R group
represents a methyl group for the lactide and H for the glycolide. The sequence can be initiated by the deprotonation from the carboxylic acid by the alcohol, or by the protonation of the alcohol and deprotonation of the carboxylic acid by water.[309] .... 79
Figure 22. The bulk degradation process of a PLGA microparticle (blue), loaded with a drug
(orange). As pores on the surface of the microparticle begin to erode, small microchannels are formed throughout the matrix. This process results in pockets within the microparticle where water and carboxylic acids begin to accumulate as a result of the hydrolysis mechanism. Once the structure of the matrix has been compromised, the entire vehicle collapses and fragments.[305] ........................................................................................ 80
Figure 23. A temperature profile of the aqueous phase containing microparticles undergoing
solvent evaporation under gentle stirring. ...................................................................... 97

xii
Figure 24. Preparation of insulin-loaded PLGA microparticles using a S/O/W emulsification, solvent evaporation technique. Dichloromethane (DCM) and
poly(vinyl alcohol) (PVA). ............................................................................................ 98 Figure 25. Shape and surface morphology of microparticles with A) 0%, B) 2.5%, C) 5%, and
D) 10% insulin crystal loadings. A highly porous surface structure is visible in panel (E). Recombinant human insulin crystals are shown in (F). White size bar found at the bottom of each image represents 200 µm in A-D, 20 µm in E and F. ........................................ 100
Figure 26. TEM cross sectional images of PLGA microparticles with 10% w/w crystalline
insulin entrapment. Arrows point to insulin crystals embedded within, and extending out from the surface of PLGA microparticles (A). The highly porous outer region of the PLGA microparticle is highlighted by an arrow (B). Size bars represent 10 µm in A and 2 µm in B. .......................................................................................................................... 101
Figure 27. DSC thermograms for PLGA microparticles loaded with A) 10%, B) 5%, C) 2.5%,
and D) 0% crystalline insulin. ........................................................................................ 103 Figure 28. A micro BCA assay calibration curve for insulin standards prepared between 1.25-40
µg/mL. ............................................................................................................................ 104 Figure 29. Insulin release kinetics from PLGA microparticles containing 2.5-10% insulin. ............................................................................................................. 106 Figure 30. Insulin bioactivity measurements for PLGA microparticle formulations with 0-10%
w/w crystalline insulin. Asterisks indicate statistical significance between placebo and sample (p= 0.05). ............................................................................................................ 108
Figure 31. HaCaT cell scratch repair assays evaluating bioactivity of insulin released from 2.5
(A), 5 (B), and 10% (C) insulin loaded PLGA microparticles into supernatants sampled on days 1, 7, 14 and 23 days of sustained release. Single asterisks indicate statistical significance between fresh insulin control and insulin free PLGA supernatant, double asterisk indicates difference between insulin released to supernatant, and fresh insulin control, and plus sign indicates difference between insulin released to supernatant and insulin free PLGA supernatant (p= 0.05). ..................................................................... 111
Figure 32. Phase contrast micrographs of HaCaT scratch wounds with supernatant from 10%
insulin-loaded microparticles from days 1, 7, 14 and 23, placebo and fresh insulin control solutions after A) 0 h, B) 4 h and C) 24 h. The red lines indicate the margins
of the scratch.................................................................................................................. 114 Figure 33. ASD prepared from alginate concentrations 0.3-2.5%, and fill volumes ranging from
5-15 mL. ASD prepared with 0.3% alginate solutions and low fill volumes of less than 10 mL were often delicate and contained numerous large cracks. ...................................... 117

xiii
Figure 34. An ASD prepared with 5 mL 0.3% alginate solution. Note the thinning of the center of the ASD, resulting from the formation of a meniscus during the pouring and lyophilizing process. .......................................................................................................................... 117
Figure 35. Dry ASD prior to being cross-linked with calcium. Samples 1-4, 5-6, 9-12 and 13-
16 were prepared from 2, 1, 0.5 and 0.25% alginate solutions and fill volumes of 1-4 mL respectively. .................................................................................................................... 118
Figure 36. Dry ASD cross-linked with calcium. Samples 1-4, 5-6, 9-12 and 13-16 were
prepared from 2, 1, 0.5 and 0.25% alginate solutions and fill volumes of 1-4 mL respectively. .................................................................................................................... 119
Figure 37. Calcium cross-linked ASD prepared from 2% alginate and fill volumes ranging from
1-4 mL (left to right). Note the brilliant white appearance and warped morphology after being cross-linked and lyophilized a second time. ......................................................... 119
Figure 38. Alginate, PEG, distilled water and insulin-loaded PLGA microparticles are
transferred into a 24 well-plate. The plate is then frozen at -80ºC and lyophilized overnight to yield circular ASD disks. ........................................................................................... 121
Figure 39. Cross-sectional SEM images of 2% M- (A), 4% M- (B), 2% G- (C), and 4% G- (D)
ASD loaded with insulin-PLGA microparticles. White scale bars represent 200 µm. . 123 Figure 40. Cross sectional SEM images of P/M-ASD prepared with 1.45 kDa PEG at
concentrations of 0.1 (A), 1 (B) and 10% (C). Images of P/M-ASD with 10 kDa PEG at concentrations of 0.1 (D), 2 (E) and 10% (F). White scale bars in images A-C and D-F represent 500 and 200 µm respectively. ......................................................................... 124
Figure 41. A photograph showing the placement of ASD into netwell inserts, held within 6 well tissue culture plates. The positioning of the netwell membrane was strategically placed at the air-water interface to mimic the surface of a fresh wound. ...................................... 131
Figure 42. A representative human insulin ELISA assay calibration curve from 3-200 mU/L. .......................................................................................................... 132 Figure 43. Insulin release kinetics from ASD prepared from 2% ( ) and 4% ( ) M and 2%
( ) and 4% ( ) G alginates. All samples were performed in triplicate and bars around the mean represent the standard error. ............................................................................ 133
Figure 44. Insulin release kinetics from ASD prepared from 2% M alginate solution with 0.1%
( ), 1% ( ) and 10% ( ) 1.45 kDa PEG and 0.1% ( ), 1% ( ) and 10% ( ) 10 kDa PEG. All samples were performed in triplicate and bars around the mean represent the standard error. .......................................................................................................... 133
Figure 45. A representation of HaCaT cells after being (A) freshly scratched by a pipette tip and
(B) after treatment with insulin for 48 hours as seen through an inverted contrast microscope. The black vertical bars in (A) indicate the margins of the scratch

xiv
approximately 500µm in width, with the space between the bars representing the “scratch wound.” .......................................................................................................................... 136
Figure 46. HaCaT cell scratch assays evaluating bioactivity of insulin released from 2% M- (A),
and 2% G- (B) ASD from days 1, 7, and 21. * indicate statistical significance between fresh insulin control and insulin free PLGA supernatant , ** indicates difference between insulin released to supernatant, and fresh insulin control, and + indicates difference between insulin released to supernatant and insulin free PLGA supernatant (p= 0.05). Supernatants from days 7 and 21 in (A) and (B) represent samples in which 10-7 M insulin was difficult to achieve. ................................................................................................ 137
Figure 47. HaCaT cell scratch assays evaluating bioactivity of insulin released from 2% M-
with 1% PEG 1.45 kDa (A), and 2% M- with 1% PEG 10 kDa (B) ASD from days 1, 10, and 21. * indicate statistical significance between fresh insulin control and insulin free PLGA supernatant , ** indicates difference between insulin released to supernatant, and fresh insulin control, and + indicates difference between insulin released to supernatant and insulin free PLGA supernatant (p= 0.05). Supernatant from day 21 in (A), and (B) represent samples in which 10-7 M insulin was difficult to achieve. ............................ 138
Figure 48. Microbial contamination measured in colonies/mL for distilled water and 2%
alginate solutions plated on tryptase and blood agar. ..................................................... 140 Figure 49. Four punch wounds formed on the dorsal side of a Sprague Dawley rat. Wound A)
was the blank control, B) 100 mM CaCl2 pre-treatment, C) M-ASD, and D) 200 mM CaCl2. .......................................................................................................... 143 Figure 50. Wounds A) blank control, B) M-ASD 100 mM CaCl2 pre-treatment, C) M-ASD, and D) M-ASD 200 mM CaCl2 pre-treatment 5 days post injury. ................................. 144 Figure 51. Wounds 5 days post-injury showing in panel A) a strong connection between
subcutaneous tissues and wound margins, in comparison with panel B) showing a separation between the skin and underlying tissues treated with M-ASD. .................... 145
Figure 52. A partial-thickness scald burn, formed after the application of a brass cylinder held
firmly over the skin for 6 sec. ......................................................................................... 146 Figure 53. A P/M-ASD placed over a burn wound covered without a tegaderm patch (A) and
with a tegaderm patch (B). ............................................................................................. 147 Figure 54. Blood glucose levels for control and insulin treatment group over a 23h period.
Basal blood glucose levels were recorded at time 0, and continuously measured post P/M-ASD application. ............................................................................................................ 148
Figure 55. Blood glucose levels measured from control and treatment rats over a 72h period.
All P/M-ASD formulations resulted in similar blood glucose profiles, with no significant deviations in rats treated with insulin or blank controls. The black arrow indicates the

xv
point at which dressings were changed without addition of saline. The red arrow indicates a dressing change along with 75 µL of sterile saline. .................................................... 150
Figure 56. A photograph of a partial-thickness scald burn, 5 days post injury after being 75%
covered with a 0.25mg insulin P/M-ASD. A red ring of inflammation around the margins of the wound is visible as part of the normal healing response. No infection is visible in the wound. ...................................................................................................................... 150
Figure 57A-D. Wound traces obtained from control group rats treated with P/M-ASD and
treatment rats receiving 0.125mg P/M-ASD, following dressing changes every 3 days. Animal I2 had developed a wound infection by day 15, slowing re-epithelialization. .. 155
Figure 58. Normalized wound areas measurements for control group rats treated with P/M-ASD
and treatment rats receiving 0.125 mg P/M-ASD with 3 animals in each treatment group. The asterisk denotes significance of p <0.05. ............................................................... 156
Figure 59. Photographs of the burn wounds in both the blank control and insulin treated groups.
Note the difference on day 15, where the insulin treated wound is nearly completely healed, while the control wound remains over a significant surface area. ................................. 157
Figure 60. Graph (A) shows the normalized blood glucose levels for a period of 12 h after the
application of the control and insulin loaded P/M-ASD. Graph (B) shows normalized blood glucose levels for the same groups over a 12 day period. .................................... 159
Figure 61. Weight recordings from both control group and insulin treated animals over a 15 day
period. Animal weight in both groups remained close to 250g and did not fluctuate. ............................................................................................. 160 Figure 62. H&E stained wound tissue from rats treated with a blank control and insulin loaded
P/M-ASD. The blue bar indicates the length of the epidermal migration tongue. ........ 161 Figure 63. Mason’s trichrome staining performed on tissue samples obtained from control and
insulin treated animals. Collagen has been stained blue, and appears in dense, thick and oriented fibers in tissues exposed to insulin, as compared to controls. .......................... 163
Figure 64. A plot of the wound healing response over a 15 day period with 2 control animals
treated with blank and 2 control animals treated with insulin-loaded P/M-ASD. ......... 165 Figure 65. The wound healing response over a 22 day period of animals treated with full P/M-
ASD loaded with 0.0625 mg insulin, and blank controls. None of the P/M-ASD were cut. Animal study groups contained 4 rats each. ................................................................... 165
Figure 66. Wound area plotted over a 15 day period, comparing P/M-ASD loaded with 0.125
mg insulin and blank controls. Dressings were changed every 3 days. Asterisks indicate significance with a p <0.05. ............................................................................................ 167
xvi
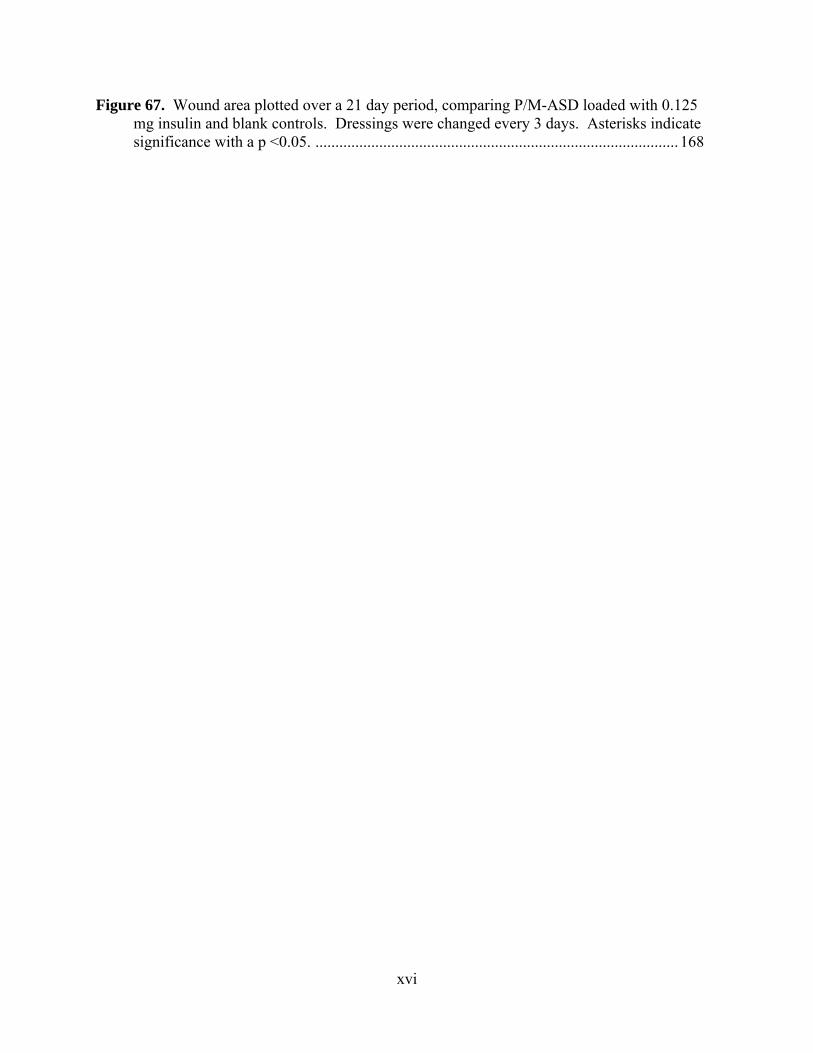
Figure 67. Wound area plotted over a 21 day period, comparing P/M-ASD loaded with 0.125 mg insulin and blank controls. Dressings were changed every 3 days. Asterisks indicate significance with a p <0.05. ........................................................................................... 168

xvii
List of Tables
Table 1. Selected statistics from the American Burn Association 2001-2010, for burn admissions to burn centers. ............................................................................................. 20
Table 2. Classification of the three degrees of burn injuries with (-) meaning "absence of" and
(+) meaning “presence of.”[87] ...................................................................................... 26 Table 3. Evaporative water loss and skin temperature values for different burn wound types[93] ........................................................................................................................ 29 Table 4. A list of transparent film wound dressing products.[7] ............................................ 34 Table 5. A classification chart matching exudate levels with different dressing examples.[109] .............................................................................................................. 35 Table 6. Alginate wound dressing products.[111] ................................................................. 37 Table 7. Foam wound dressing products.[128] ...................................................................... 38
Table 8. Gauze wound dressing products.[129] ..................................................................... 39 Table 9. Hydrocolloid wound dressing products.[109] .......................................................... 40 Table 10. Hydrogel wound dressing products.[139] .............................................................. 41 Table 11. Transparent film wound dressing products.[213] .................................................. 42 Table 12. Growth factors released during wound healing, along with the target cell types and
cost of obtaining pure growth factor .............................................................................. 49 Table 13. Biocompatible polymers commonly used in the production of microparticles used in
peptide delivery.[290] .................................................................................................... 76 Table 14. Pharmaceuticals which employ the use of PLGA in the drug delivery vehicle to
provide sustained and controlled release. ....................................................................... 77 Table 15. PLGA molecular weight and batch size combinations and outcomes. .................. 96 Table 16. Densities of M- and G-ASD. .................................................................................. 125 Table 17. Density P/M-ASD with 0.1-10%, 1.45 kDa or 10kDa PEG. ................................. 125 Table 18. Tensile strength of M- and G-ASD. ....................................................................... 126

xviii
Table 19. Tensile strength of P/M-ASD prepared from 2% M alginate solutions containing 0.1-10% PEG, 1.45 kDa and 10 kDa. ................................................................................... 126
Table 20. WVTR and WAC for 2-4% M- and G-ASD. ........................................................ 128 Table 21. WVTR and WAC for ASD prepared from 2% M alginate solutions and combined
with 0.1-10% PEG 1.45 kDa and 10 kDa. ...................................................................... 128

1
Chapter 1
INTRODUCTION
1.0 Burn Injuries and Treatment
Burn injuries are one of the most common types of skin injuries that an individual can
experience throughout their lifetime. Burns often result from excessive exposure to heat, caustic
chemicals, or solar radiation, and predominantly occur in the home, workplace, or in traffic
accidents.[1,2] Depending on the size, and the depth, a burn wound can take several weeks
before the skin’s integrity is restored, and months before the skin returns to its original state.[3]
In some cases, burn injuries can be so severe, that skin grafts, reconstructive surgery, amputation,
or loss of life can result.[4] Rehabilitation following severe burns is difficult, painful, time
consuming and costly. Consequently, burn injuries place a significant burden on healthcare
providers and medical resources.
Presently, burn treatments encompass a wide range of approaches depending on the
condition of the burn. Most treatments combine the use of gauze bandages, hydrocolloids and
ointments (white petrolatum) as gold standards of treatment.[5] These dressings help to prevent
the entry of foreign debris, maintain a moist wound healing environment and absorb excess
blood and exudate from the wound.[6,7] Gauze bandages, ointments, and hydrocolloids are also
affordable, widely available, convenient, and remain stable for extended periods.[8] All of these
dressings however, have no inherent capacity to promote wound healing beyond the natural rate.
Removal and reapplication can also cause significant damage to the wound bed, resulting in
impaired wound healing.[9] Infections caused by infrequent dressing changes can also lead to

2
the development of chronic wounds. Therefore, a new approach in wound dressing technologies
must be explored to enhance patient recovery and comfort.
Delivery of growth factors to a wound is one approach that would enhance current burn
wound treatments. Growth factors are signaling molecules that stimulate skin cells to migrate
and proliferate when applied to a wound.[10] Epidermal growth factor (EGF) and keratinocyte
growth factor (KGF) are two examples of growth factors which have been tested in the
past.[11,12] Unfortunately, growth factors are expensive, unstable and require suitable delivery
vehicles to be used effectively.[13] Insulin on the other hand, has been reported to promote
wound healing over the past century. Insulin is affordable, available in a highly pure crystalline
form, and is compatible with most common biomaterials used in wound dressings and drug
delivery devices.
Currently, no group has demonstrated the ability to deliver bioactive insulin from a burn
wound dressing. Consequently, the focus of this research was to design and test a delivery
vehicle that released bioactive insulin in a sustainable and controllable manner for a period of 1
month. Crystalline insulin stabilized within poly(lactic-co-glycolic acid) (PLGA) microparticles
was determined to be the best approach to achieve extended controlled release, and subsequent
integration into an alginate-poly(ethylene glycol) (PEG) foam dressing. The dressing would
enable uniform application of the insulin and protect the wound from the outside environment.
Rodent testing revealed up to a 25% improvement in wound re-epithelialization, and improved
scar tissue morphology. Extended insulin release from insulin-loaded PLGA microparticles,
incorporated into alginate-PEG dressings, is therefore an affordable and potentially effective
method of improving burn wound recovery.

3
Chapter 2
LITERATURE REVIEW
2.0 Human Skin
Human skin is a sophisticated and complex organ, responsible for protecting internal
tissues from the external environment. Skin as the largest organ, collectively weighs an average
of 4 kg, and covers a surface area of nearly 2 m2.[14,15,16] Embedded within the skin, is a
dense network of nerve endings that detect heat, pain and pressure, providing feedback to the
brain about the environment.[17] This feedback mechanism alerts the body to excessive heat, or
mechanical stress which may rupture the integrity of the skin. The skin also defends against
pathogens by using a combination of cytokines, antibodies, complement proteins and immune
effector cells that rapidly detect and deter infectious agents.[18] The skin also synthesizes
vitamin D,[19] produces glandular secretions,[19,20] facilitates water transfer[21] and CO2 gas
exchange to facilitate homeostasis.[22] The skin therefore plays an integral role in supporting
organ systems and protecting the body.
Consequently, when the skin becomes injured, its integrity must be restored as quickly as
possible. The process of wound healing is a coordinated event that utilizes signaling molecules
and various cell types to repair the defect.[23] To better understand this process, the following
sections outline the normal physiology and anatomy of the skin, followed by a description of the
wound healing process.

4
2.1 Skin – Physiology and Anatomy
Physiologically, the skin is comprised of several specialized layers, and components, as
illustrated in Figure 1. The epidermis is the outermost layer followed by the dermis, skin
appendages and subcutaneous fat. Each layer is comprised of specific cell types which play a
role in the formation and regeneration of the skin after injury.
Figure 1. An illustration of healthy human skin comprised of the epidermis, dermis, skin appendages and subcutaneous fat.[9]
2.2 Epidermis
The epidermis is the outermost layer and originates from the embryonic ectoderm. It is
composed four layers and normally replaces itself about every 4 weeks.[17] The five major cell
types found within the epidermis are keratinocytes, melanocytes, Merkel cells, Langerhans cells
and fibroblasts. These cells help make up the four different epidermal layers including the
stratum basale, the stratum spinosum, the stratum granulosum and the stratum corneum.
Connecting the epidermis to the dermis are rete ridges, small projections that protrude from the
5
epidermis into the dermis, securing the two major layers in place.[24] The epidermis is therefore
a complex structure that protects all underlying tissues.
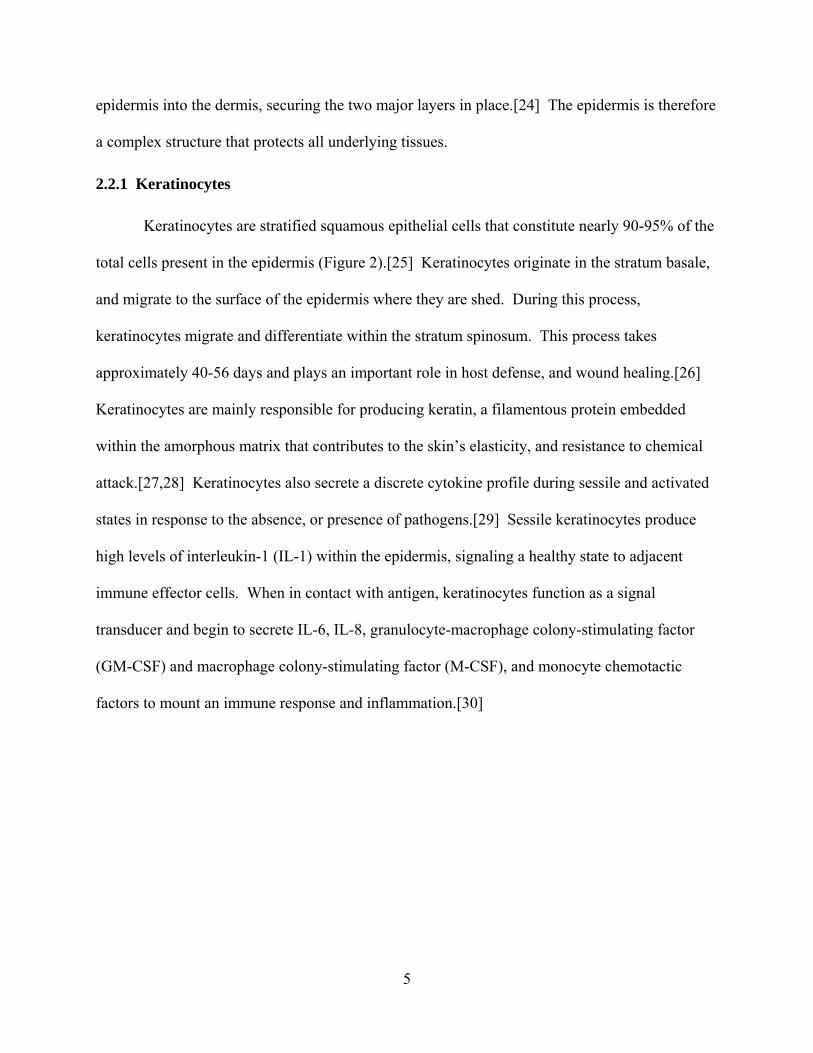
2.2.1 Keratinocytes
Keratinocytes are stratified squamous epithelial cells that constitute nearly 90-95% of the
total cells present in the epidermis (Figure 2).[25] Keratinocytes originate in the stratum basale,
and migrate to the surface of the epidermis where they are shed. During this process,
keratinocytes migrate and differentiate within the stratum spinosum. This process takes
approximately 40-56 days and plays an important role in host defense, and wound healing.[26]
Keratinocytes are mainly responsible for producing keratin, a filamentous protein embedded
within the amorphous matrix that contributes to the skin’s elasticity, and resistance to chemical
attack.[27,28] Keratinocytes also secrete a discrete cytokine profile during sessile and activated
states in response to the absence, or presence of pathogens.[29] Sessile keratinocytes produce
high levels of interleukin-1 (IL-1) within the epidermis, signaling a healthy state to adjacent
immune effector cells. When in contact with antigen, keratinocytes function as a signal
transducer and begin to secrete IL-6, IL-8, granulocyte-macrophage colony-stimulating factor
(GM-CSF) and macrophage colony-stimulating factor (M-CSF), and monocyte chemotactic
factors to mount an immune response and inflammation.[30]
6
Figure 2. An example of a healthy keratinocyte.[28]
2.2.2 Melanocytes
Melanocytes are located in the epidermis, hair follicles and eyes, and are the primary
producers of melanin, a pigment responsible for skin colour.[27] Morphologically, melanocytes
are highly dendritic and reside in fewer numbers than keratinocytes, with approximately 1
melanocyte for every 10 keratinocytes.[31] Melanin is produced by specialized membrane-
bound organelles called melanosomes. The purpose of melanin production is to protect the skin
from DNA-damage induced by solar ultraviolet (UV) radiation. Upon stimulation by solar
radiation, melanosomes translocate within the dendrites, positioning above the keratinocyte
nuclei.[32] Almost instantaneously, melanin secretion occurs and blocks UV induced DNA-
damage by photo-oxidizing and delayed tanning, through a mechanism that has not been clearly
elucidated.[33] With chronic UV exposure however, uneven photo-ageing with uneven pigment
distribution can occur. More recently, melanin has also been implicated in host immune function
as well. Melanin has been shown to also interact with enzymes and serve as a cation chelator,
thereby neutralizing oxidants, and inhibiting bacterial enzymes.[34] Melanocytes are therefore
7
important for protecting keratinocytes from UV radiation and help in maintaining host immune
defenses.
2.2.3 Merkel Cells
Merkel cells reside in the undersurface of the epidermis, oral mucosa and are relatively
scarce in numbers. Located within the basal layer of the epidermis, Merkel cells resemble nerve
fibers and are believed to help perceive touch.[31] Localized concentrations of Merkel cells
have been identified in the outer root sheaths of hair follicles and epidermal ridges.[35] Merkel
cells are also implicated in the stimulation of the proliferation of keratinocytes leading to the
three-dimensional development of the epidermal anlagen (a point of foundation), the
maintenance of normal differentiation of keratinocytes, and the release of bioactive substances to
subepidermal spaces.[36] Without Merkel cells, epidermal health cannot be maintained and
sensation of the outside environment is hindered.
2.2.4 Langerhans Cells
Langerhans cells are immature dendritic cells of the skin. These cells are considered
sentinel cells because they are phagocytic, and actively sample antigen present within the
skin.[37] They are located in concentrations of 460-1000 cells/mm2, making up nearly 3-8% of
the total cells present in the epidermis.[31] They originate from the bone marrow and reside in
the epidermis in an immature state.[38] Upon stimulation, the pathogen is engulfed, processed
and presented once the Langerhans cell migrates via the lymphatic system to local lymphoid
tissue.[39] At this point, the Langerhans cell matures into a dendritic cell responsible for
presenting the processed antigen via major histocompatability complexes (MHC) class I or II.[37]
This facilitates the presentation of truncated antigen fragments to naïve T cells in conjunction
with a cytokine profile to stimulate the adaptive arm of the immune system. These cytokines

8
include IL-1α, IL-6, IL-7, IL-10, IL- 12, IL-13, IL-15, IL-18, tumour necrosis factor-α (TNF-α),
and transforming growth factor-β (TGF-β).[40] These cytokines help to attract, prime, and
differentiate naïve T cells to become an effector T cell. Langerhans cells also play a role in
rejecting foreign xenogenic, or allogenic skin grafts due to MHC class II mismatch between
donor and host.[41] Figure 3 shows an illustration of the process by which Langerhans cells
detect, engulf, transport and display antigen in local lymph nodes. Langerhans cells are an
important cell type that detects foreign pathogens and alerts the immune system to an attack.
Figure 3. An illustration of Langerhans cells sampling and engulfing foreign antigen. The antigen is then internalized and processed while the Langerhans cells migrate through the local lymphatic ducts to a lymph node. While in the lymph node, the antigen is presented to naïve T cells where a release of cytokines, prime and activate the T cell into a mature effector T cell. The effector T cell is then free to migrate away from the lymph node and search for the foreign pathogen bearing the antigen.[37]

9
2.2.5 Fibroblasts
Dermal fibroblasts are a member of the connective-tissue family, which include cartilage
and bone cells. Fibroblasts originate as differentiated mesenchymal cells and constitute 40-60%
of the total cell populations found in the skin, lung and gingiva.[42] Morphologically,
fibroblasts appear as spindle-shaped cells, which contain well-developed endoplasmic reticulum
and are pertinent to the normal production and organization of the extracellular matrix (ECM).
Fibroblasts are chiefly responsible for the secretion of types I and III collagen,[43] elastin and
laminin, and assist with epidermal differentiation.[44] In addition to biomacromolecules,
fibroblasts also secrete various growth factors such as insulin growth factor (IGF), keratinocyte
growth factor (KGF), platelet derived growth factor (PDGF), transforming growth factor (TGF)
and vascular endothelial growth factor (VEGF) which helps stimulate and bridge communication
between various cell types found within the skin.[44,45] Upon injury, fibroblasts are one of the
first cell populations to arrive and help rebuild the ECM by laying down new collagen to repair
the defect.
2.2.6 Stratum Basale
The stratum basale, also commonly referred to as the stratum germinativum is a
continuous layer that is typically one-cell layer thick, with occasionally two or three layers
found.[19,46] The basal cells consist of non-serated (cuboidal) and serated basal keratinocytes
(projections).[47] These cells are considered to be the “stem cells” of the stratum basale and
help to continuously renew the epidermis approximately every 14 days.[19,24,48] This rate of
renewal can increase if injury or inflammation are present, ensuring that there is a continuous
supply of keratinocytes to heal the wound.

10
2.2.7 Stratum Spinosum
The stratum spinosum is located next to the stratum basale and contains keratinocytes
undergoing active differentiation. This region is characterized by spines, or intercellular bridges
that extend between keratinocytes.[19] The keratin is produced by keratinocytes which linked
together by the help of desmosomes which anchor adjacent cells together. The keratinocytes in
this layer appear “spiky” and progressively transition from polygonal to a larger and flatter shape
as they move towards the surface of the skin.[49]
2.2.8 Stratum Granulosum
Adjacent to the stratum spinosum, the stratum granulosum is a region where
keratinocytes continue to differentiate, acquire additional keratin, and progressively become
flatter in morphology.[19] At this point, the keratinocytes also begin to acquire distinctive dark
granules that are composed of keratohyalin, consisting of two proteins rich in proline and
cysteine amino acid residues.[50] Profilaggrin, the precursor to filaggrin is associated with the
aggregation of keratin fibers in the stratum corneum.[14] Involucrin is the second protein and
plays a role in the formation of the cell envelope of cells located within the stratum corneum.[51]
The granular cells within the stratum granulosum also contain lamellar granules containing a
variety of biomacromolecules including polysaccharides, glycoproteins, and lipids which are
secreted into the intracellular spaces.[19] These biomacromolecules help anchor cells within the
stratum corneum, and prevent moisture loss from the skin.[52] As a result, the stratum
granulosum is responsible for providing additional support to the epidermis and helping to shape
the stratum corneum.

11
2.2.9 Stratum Corneum
The stratum corneum is composed of cells which are rich in keratin and stacked in
approximately 15 to 25 layers.[19] The soles of the feet and palms of the hands can have up to
100 layers, providing additional support and protection. This arrangement facilitates the
formation of a semi-permeable layer which is highly effective in preventing moisture loss and
chemical penetration from occurring. Morphologically, the cells within the stratum corneum
appear large, flat, and polyhedral, and are held together by a lipid rich glue. The primary
purpose of the epidermis is to produce the stratum corneum, the major physical barrier of the
skin.[53] Figure 4 illustrates the entire composition of the epidermis, with all four sub-layers.
Figure 4. The epidermis including the stratum basale, stratum spinosum, stratum granulosum and stratum corneum. Note the position of melanocytes and Langerhans cells located within the deeper layers of the epidermis.[16]

12
2.3 Dermal-Epidermal Junction
The dermal-epidermal junction is also commonly referred to as the basement membrane
zone and marks the interface between the two major layers of the skin. The basement membrane
is a complex mixture of biomacromolecules that are thin, continuous layers, containing type IV
and VII collagen, laminin, nidogen, and heparin sulfate proteoglycans.[54] Four distinct layers
are contained within the dermal-epidermal junction including keratin filaments, lamina lucida,
lamina densa, and anchoring fibrils.[19] Keratin filaments in the basal keratinocytes attach to
hemidesmosomes which connect to adjacent anchoring filaments found in the lamina lucida.[55]
The lamina lucida is a lucent space with a thickness of approximately 26-49 nm and contains
structures such as collagen fibrils, anchoring fibrils, or microfibrils.[56] The lamina densa is rich
in type IV collagen, laminins and perlecan, all synthesized by the keratinocytes located in the
stratum basale.[54] Anchoring fibrils resemble thick fibers which are predominantly composed
of type VII collagen and located in the sublamina densa region of the papillary dermis.[19]
These four layers in turn, help to connect the epidermis and dermis through the use of
biomacromolecules which form a glue between the layers.
2.4 Dermis
The dermis is a robust elastic structure that supports the normal health and function of the
epidermis located above. The dermis is approximately 1-4 mm thick and has three main
functions including facilitating nutrient exchange, providing sensory input, and draining lymph
from the skin.[19] Nutrient exchange is achieved through a dense, microcirculatory bed that is
concentrated around the dermal papillae, hair follicles and eccrine sweat glands. The capillaries
form loops with a diameter of 2-3 µm to increase surface area and support metabolically active
areas with sufficient gas, nutrient and waste exchange.[57] Neuronal communication within the

13
dermis is achieved by both sensory and autonomic arms which provide information and reaction
to the outside environment. Free or specialized nerve endings closely situated around blood
vessels, sweat glands and hair follicles, provide sensory input, whereas autonomic fibers provide
homeostatic control of blood vessels, sweat glands and erector pili muscles near hair follicles.[58]
The dermal lymphatic system, similar to the blood capillary bed, forms a dense network which
shuttles water, proteins, macromolecules, cell fragments, and mobile inflammatory and tumour
cells from the interstitial spaces to regional lymph nodes located away from the skin.[59] This
arrangement ensures that immune effector cells can quickly access the skin and remove a
potentially harmful pathogen from invading the host.
Structurally, the dermis is composed of fibrous and non-fibrous biomacromolecules
which give the skin elasticity and tensile strength. Fibrous elements are the most predominant
component of the dermis and include over 75-80% type I collagen and 25-20% type III collagen.
Throughout life, the ratio of type I and type III collagen remains fairly constant, however the
proportion of type III collagen begins to increase with advancing age.[60] Collagen, along with
elastin, helps to dissipate mechanical energy during movement and allows the skin to return to its
original shape after deformation.[61] Non-fibrous components of the dermis include finely
filamentous glycoproteins, glycosainoglycans, and proteoglycans (i.e., hyaluronic acid,
chondroitin sulphate, dermatan sulphate, versican, and decorin).[62] These biomacromolecules
help to guide collagen fiber formation, organization and interaction, as well as provide turgor and
resilience.[63] Fibroblasts synthesize collagen and help to maintain the supply of collagen
during normal growth and repair after injury.[64] The dermis is therefore an integral component
of the architecture of the skin which provides strength and support for the overlying epidermis.

14
2.5 Skin Appendages
The skin also contains several skin appendages that help the body maintain thermal
regulation and mechanical function. These components include eccrine glands, apocrine sweat
glands, hair follicles and sebaceous glands and nails. The skin appendages excluding nails,
originate from the epidermis, but become situated within the dermis over time.[19] Each of the
elements comprising the skin appendages will be described in the following sections.
2.5.1 Eccrine Sweat Glands
The eccrine sweat glands are one of the most significant skin appendages as they are
responsible for releasing sweat upon thermal or emotional stimuli. The release of sweat is
chiefly responsible for regulating body temperature through evaporation from the skin surface.
The secretory portion of the gland consists of a coiled tubule which is located deep within the
dermis and leads to the surface via a sweat duct through the epidermis.[19] There are
approximately 3-4 million eccrine sweat glands distributed across the skin releasing up to 10 L
per day.[65] Sweat is similar in composition to blood plasma, but becomes hypotonic as it
transitions through the sweat duct nearing the surface of the skin.[19] The eccrine gland is
therefore an important skin appendage necessary for thermal regulation.
2.5.2 Apocrine Sweat Glands
Apocrine sweat glands are another skin appendage concentrated mostly in the armpit and
anogenital regions of the body. Similar to the eccrine sweat glands, apocrine glands consist of
coiled tubules, but terminate at the distal portion of the hair follicle.[66] This results in sweat
being carried up the length of the hair follicle until it reaches the surface. During development,
apocrine sweat glands require stimulation via androgens to develop, and serve little function in
thermal regulation later in life.[19]

15
2.5.3 Sebaceous Sweat Glands
Sebaceous sweat glands are skin appendages that are physically fused together with hair
follicles throughout the body, except for the soles and palms. Sebaceous glands are responsible
for the production of sebum, a lipid-rich liquid consisting of cholesterol, squalene, waxes, and
inorganic salts. The purpose of sebum is to bath the hair shaft to prevent it from drying out,
giving it an oily appearance when not washed for several days. The greatest concentration of
sebaceous glands are found on the scalp, forehead, cheeks and chin.[67] Harkey (1993),
estimates that a 10 cm2 area of the scalp is capable of producing 0.7-2.4 mg of sebum within a 4
h period. Sebaceous glands, especially during adolescence, are implicated in the development of
acne vulgaris, when the sebaceous gland becomes clogged with sebum.
2.5.4 Hair Follicles
Hair follicles produce and secure hair deep within the dermis in almost every body
surface except for the palms and soles of the feet. In animals, hair growth is necessary to retain
heat, provide camouflage and provide protection from environmental elements. In humans, hair
helps with thermoregulation by providing insulation and a large surface area for sweat to
evaporate and cool the skin.[19] Within the hair follicle, three different cell types including
epithelial, mesenchymal, and neuroectodermal cells are present to help establish and synthesize
building blocks used to form the hair shaft.[68] Overall, the hair follicle is divided into three
distinct zones, all with specific functions pertinent to the formation and anchoring of the hair
shaft.[67] Approximately 3-4 mm below the surface of the skin, the innermost region near the
bulb of the hair root, is the area associated with the biological synthesis of hair cells. Nearby this
area are small smooth muscle bundles originating in the dermis and function to raise the hair in
order to retain additional heat.[69] Immediately above the bulb, in the second region is the

16
keratogenous zone where the hairs harden and solidify. The third zone is a fully hardened hair
shaft consisting of dehydrated, cornified cells shaped into fibrils that fuse with an intercellular
binding material.[67] Alongside the hair shaft are two types of glands which excrete sweat
down the length of the hair follicle. In the armpit and anogenital areas, the apocrine sweat gland
drains into the hair follicle. In all other areas of the body, the sebaceous sweat gland is fused
next to the hair follicle and is also responsible for releasing sweat.[19] In combination with the
eccrine glands, the hair helps to trap the liquid sweat and spread it over a larger surface area,
thereby enabling more efficient cooling whenever the body is exposed to hot environments.
Once the hair has exited the hair follicle, the hair can be classified according to its physical
appearance and length. Short, fine and light coloured hair is call vellus hair, whereas thick, long
and dark hair is classified as terminal hair.[66]
2.5.5 Nails
The human nail is a specialized skin appendage which grows from the ends of the toes
and fingers to facilitate grasping, manipulation, scratching, and prying.[70] Physiologically, the
nail unit is composed of the nail plate, nail bed, hyponychium, nail matrix, nail folds, cuticle,
anchoring ligament and distal phalangeal bones (Figure 5).[71] The nail is produced by the
matrix through continuous differentiation of basal cells that lose their nuclei, flatten, cornify and
migrate to form the nail plate.[71] The average growth rate of the nail is approximately 0.1
mm/day, or 3 mm/month in a healthy human being and can be influenced by the overall health of
the individual as well as specific medications.[72]

17
Figure 5. The nail unit comprised of the nail plate, nail bed, hyponychium, nail matrix, nail folds, cuticle, anchoring ligament and distal phalangeal bones.[71]
2.6 Wounds
When skin is exposed to excess thermal energy, reactive chemicals, or mechanical force,
a wound typically results.[1] Wounds come in several forms and can be as minor as a small cut
in the skin or as severe as a full thickness burn extending down to the underlying bone.
Depending on the extent of the wound, healing can be slow, impair the quality of life and take up
substantial healthcare resources.[73] Consequently, wound healing is an active and dynamic
process, designed to regenerate lost skin layers.[74,75]
Wounds are frequently classified as either acute or chronic, depending on the time frame
required to establish complete wound healing. According to Whitney (2005), all wounds at the
time of trauma can be considered acute, regardless if they are the result of accident, trauma, burn,
or surgery.[76] What differentiates the two categories is the length of time required for healing
take place. Acute wounds generally heal within a period of 8-12 weeks, while chronic wounds

18
extend well beyond this time frame.[77] Burn wounds for example, are classified as a form of
acute injury, and vary significantly in healing time depending on the type of burn (first-, second-,
or third-degree), treatment provided (wound dressing selection, fluid replacement, surgery, etc.),
and age of the patient.[78] Figure 6 demonstrates how the burn depth is used to classify the
severity of burn wound.
Figure 6. A cross-section of the skin and the classification of first-, second- and third-degree burns. Note that first-degree burns are marginalized to the epidermis, while second- and third-degree burns can reach the dermis and subcutaneous fat.[78] The danger posed by acute wounds is the risk of bacterial infection if a wound remains
open for too long. When infection occurs, the body’s adaptive immune response can lead to an
intense inflammatory response resulting in localized tissue hypoxia and poor wound healing
characteristics.[79] Excessive tissue damage, wound tension and inadequate hemostasis may
also result from bacterial infection.[80] Therefore, a dressing can function as a temporary
protective barrier, isolating the wound from the external environment and improve healing.
Chronic wounds fail to heal within the normal 8-12 week period.[1] Chronic wounds can
develop as a result of persistent infections, tissue hypoxia, necrosis, diabetes, tumours, excess
exudate, malnutrition, old age and excess levels of inflammatory cytokines, delaying the normal

19
progression of healing.[77] According to Fonder et al. (2008), venous ulcers, arterial ulcers,
diabetic foot ulcers, vasculitis, and pressure ulcers are all forms of chronic wounds that result
from one or more of the factors listed above.[81] As a result, chronic wounds require longer
periods of care, and more complex treatment regimens.
The overall goal in the treatment of burn wounds therefore must be to stimulate the
natural regenerative mechanisms at the earliest possible opportunity, while also providing an
optimal wound healing environment to facilitate the restoration of damaged tissues. This in turn
stimulates cell migration, differentiation and re-epithelialization of the wound.
2.6.1 Burns
Burns are one form of thermal injury that occurs when the skin is subjected to high
temperatures for extended periods time, distorting the epidermis and/or dermis.[23] Depending
on the size, depth and extent of the burn, significant medical attention can be required. The
process of burn wound healing is therefore often lengthy, susceptible to infection, painful and
has the potential to lead to death.[82]
2.6.2 Burn Epidemiology
The Canadian Burn Foundation estimates that a child is burned every 7.5 minutes at the
home by a hot liquid and that thousands of Canadians are seriously burned each year.[83]
Spinks et al., (2008) studied pediatric burn cases over a ten-year period between 1994-2003 and
determined that nearly 500 children died from burn injuries and that over 10,000 were admitted
to Canadian hospitals for burn treatment.[84] Scalds were the most significant etiological factor,
accounting for about 50% of all hospital admissions across Canada. In the United States, the
American Burn Association (2011 Fact Sheet), has estimated that nearly 450,000 burn injuries
required medical attention, while 3,500 individuals died directly from fire or burns alone.[2]

20
Table 1 summarizes the demographics for 2001-2010 burn admissions to burn centers as
reported by the American Burn Association, showing that most burns originate from fire in the
home, and involve a higher number of males as compared to females.
Table 1. Selected statistics from the American Burn Association 2001-2010, for burn admissions to burn centers.
Category Percentage Survival Rate 96.1 Gender 70 Male
30 Female Ethnicity 60 Caucasian
19 African-American 15 Hispanic 6 Other
Admission Cause 44 Fire/Flame 33 Scald 9 Contact 4 Electrical 3 Chemical 7 Other
Place of Occurrence 68 Home 10 Occupational 7 Street/Highway 15 Other
2.6.3 Burn Etiology
Burns originate whenever sources of heat, chemicals, electricity, or radiation are applied
to the skin in excessive amounts, causing a disruption in the epidermis and/or dermis. Burns
stemming from heat are classified as either originating from wet or dry heat. Wet heat is most
frequently associated with scalds, resulting in skin loss. Boiling water, superheated steam and
hot grease only require seconds to cause damage across large surface areas.[3] Figure 7 shows
an example of a common scald injury to the foot of a pediatric patient. Consequently, scalds are
one of the most common types of burn injuries particularly in young children.[23] Dry heat
injuries can result from direct contact with a flame, hot surface or molten metal. Dry heat burns

21
are the second most common form of burn injury and are usually concentrated to a small area,
but can extend deeper into underlying tissues.[3]
Figure 7. A pediatric patient with a scald injury to the foot resulting in a superficial partial thickness burn. British Association of Plastic and Reconstructive and Aesthetic Surgeons, 2012.
Chemical burns are much more variable in nature due to reactivity of the compound,
concentration and contact time. Cement is one material that contains large quantities of lime that
when left on the skin over extended periods, results in a chemical burn. Dust during cement
mixing and application can penetrate clothing, enter work boots and come into direct contact
with skin. Over a period of time, lime begins to react with the skin, resulting in a chemical
burn.[85] Figure 8 shows a photograph of a male patient with alkaline burns to the face and
upper chest. Phenol and hydrofluoric acid used in metal processing and cleaning are other
workplace chemicals that can cause severe burns, long after exposure has occurred.[3] In all
cases, chemical residue must be removed to prevent further damage once a wound has been
dressed.

22
Figure 8. A clinical photograph of a male patient with severe alkaline chemical burns to the left cheek and neck.[85]
Electrical burns occur when the skin comes into direct contact with a high energy source.
These sources may include frayed electrical cords, high-voltage supplies and improperly
grounded industrial electrical equipment. The passage of current from the source will frequently
result in a small punctate that extends deeply into the underlying tissue.[3] Figure 9 shows an
example of an electrical burn. In some cases, current may pass across the chest resulting in
cardiac arrhythmias, or through limbs causing severe destruction of muscle and nerve
bundles.[23,86]
Over exposure to solar radiation is another form of burn injury that commonly affects all
age demographics. Sunburns are often localized to the superficial layers of the skin, but can
cover extensive surface areas resulting in excessive pain and discomfort.[3] Figure 10 illustrates
a sunburn caused by excessive exposure to solar radiation. More rarely are burns associated
from ionizing radiation, which typically appear in patients receiving radiotherapy.[86]

23
Figure 9. A patient with electrical burn to the foot. The location of the injury represents an exit wound whereby the electrical current would have flown out of the body to a ground source. Dr. Ken Harrison, NSW Institute of Trauma and Injury Management.

24
Figure 10. A male patient with a severe sunburn affecting the back. The uneven appearance of the sunburn is a result of uneven sunscreen application prior to exposure.[86]
2.6.4 Burn Scoring
Burn scoring is the process of determining the severity of a burn by measuring both the
depth of the injury and the total body surface area affected. Classically, burn depth has been
ranked as first, second and third degree depending on the appearance of the injury. More
recently, this ranking method has been replaced with a method which describes the anatomical
thickness of the skin layers affected by the injury.[18] Burn wounds are now classified as being
superficial, partial-thickness and full-thickness.[4]

25
2.6.5 First Degree/Superficial Burns
First degree, or superficial burns are injuries that only affect the epidermis. According to
Barrett-Nerin et al., (2006), superficial burns are not included in the total body surface area
assessment and are typically caused by UV radiation from the sun. These types of burns are
minor in severity and typically manifest with the appearance of reddened skin, painful to tactile
touch, and occasionally the formation of small blisters.[87] Healing occurs typically within 1
week and is achieved through the sloughing off of keratinocytes. No medical attention is needed,
however the application of topical moisturizing creams and anaesthetics provide relief from dry
and tender skin.
2.6.6 Second Degree/Partial-Thickness Burns
Second degree, or partial-thickness burns extend beyond the epidermis and into the
dermis. Depending on the depth, partial-thickness burns can be further classified as superficial
or deep.[18] In superficial, partial-thickness burns, the injury extends to the superficial papillary
dermis, causing blistering and extreme pain. The skin will also appear bright pink and blanches
whenever tactile pressure is applied.[4] Healing from this type of wound usually occurs via the
proliferation of keratinocytes from the margins of the wound and from hair follicles which are
still intact. Healing time takes approximately three weeks to complete and will usually not result
in the formation of a scar.
Deep partial-thickness burns extend into the reticular dermis and require more time to
heal. Hair follicles, skin appendages and nerve endings are often damaged resulting in longer
recovery times beyond three weeks. Characteristically, deep partial-thickness burns appear waxy,
and white-pink and typically are less painful than superficial partial-thickness burns. Recovery
can involve surgery to remove dead tissue and may require skin grafting to accelerate recovery.

26
Increased scaring and a higher susceptibility to infection are common complications that occur
following recovery from deep partial-thickness burns.[4]
2.6.7 Third Degree/Full-Thickness Burns
Full-thickness burns extend throughout the entire depth of the dermis and into the
subcutaneous fat. This is the most severe, debilitating and life threatening burn injury that can be
sustained. In children, full-thickness burns occur more easily due to thinner skin as opposed to
adult skin which requires significantly more thermal energy, and are more difficult to stabilize.88
Full-thickness burns appear yellow, brown, or black, along with sever edema and lack of
blistering. Since the integrity of the skin is lost, there is a serious risk of infection and sepsis.[18]
Drastic physiological shifts in fluid balance and metabolic activity frequently follow full-
thickness burns, resulting in impaired organ function and body system failure. Recovery is often
painful, difficult and requires significant medical resources. Table 2 summarizes the three
degrees of burn injuries and their causes.
Table 2. Classification of the three degrees of burn injuries with (-) meaning "absence of" and (+) meaning “presence of.”[87]
Burn Depth Colour Appearance Pain Treatment
First Degree/ Superficial
Pink (-) Blisters
(-) Eschar
Mild Moisturizers
Analgesic
Superficial Partial Thickness
Red (+) Blisters
(-) Eschar
Moderate to severe
Topical Antibiotic
Deep Partial Thickness
Red, Cream, Yellow
(+/-) Blisters
(+/-) Eschar
Moderate Topical Antibiotic
Possible Skin Graft
Third Degree/
Full Thickness
Brown, Black (-) Blisters
(+) Eschar
None Topical Antibiotic
Skin Graft Required

27
2.6.8 Total Body Surface Area (TBSA)
Total body surface area is a measurement used to estimate the percentage of the skin
surface area that has been burned. Adult TBSA is calculated using the rule of nines, estimating
the surface area of the arms, torso, head and legs as multiples of nines. In burns whereby the
surface area only affects a portion of the limb or torso, the patient’s palm is usually used to
represent 1% of the TBSA.[18] In children and infants, since the rule of nine is less accurate, the
Lund-Browder chart for children is used.[88] Figure 11 illustrates both the rule of nine and
Lund-Browder estimates for TBSA coverage. The purpose of measuring TBSA and burn depth
is to calculate how much fluid resuscitation is needed to restore the fluid balance in the patient
after experiencing a severe burn injury.
Figure 11. The rule of nines in adults (A), and the Lund-Browder estimations for calculating TBSA in children (B).[88]

28
2.7 Wound Healing
Wound healing is a dynamic process that relies on the interaction of different cell types and
signalling molecules, and on the communication and cooperation of resident cells in the
surrounding area of the wound (e.g., fibroblasts) and peripheral circulating immune cells (e.g.,
macrophages, neutrophils, monocytes and lymphocytes).[89] As soon as a wound forms, a four
part wound healing process begins. To understand this process, the following sections outline
the phases of wound healing and the mediators involved.
2.7.1 Haemostasis
Haemostasis is the process whereby vascular constriction and the formation of a fibrin
clot take place to prevent excessive blood loss from the injury. A fibrin clot is necessary to
initiate platelet aggregation and the release of proinflammatory cytokines and growth factors
initiating the wound healing response.[90] After hemostasis has been achieved, the wound
begins to secrete exudate, which is essentially blood, from which most of the red blood cells and
platelets have been removed. Exudates continue to be released throughout the wound healing
process.[91] Exudates function to keep the wound moist and continually irrigate the region.
Burns in particular are highly destructive and destroy the semipermeable membrane associated
with the lipoprotein layer in the stratum corneum, leading to excessive levels of exudates.[92,93]
Table 3 lists the measured amount of water vapour lost from burns of various degrees.
Hemostasis is designed to control and stop loss of blood, while also priming and signalling
immune effector cells to the wound region.

29
Table 3. Evaporative water loss and skin temperature values for different burn wound types.[93]
Wound Condition Evaporative Water
Loss (g/m2/24 h)
Surface Temperature (°C)
Normal Skin 204 + 12 35.8 + 0.2 First Degree 278 + 26 35.3 + 0.1 Second Degree 4274 + 132 35.3 + 0.4 Third Degree 3437 + 108 34.5 + 0.4 Granulating Wound 5138 + 202 34.7 + 0.2 Donor Site 3590 + 180 35.3 + 0.2
2.7.2 Inflammatory Phase
Twenty-four hours after platelets have coagulated and growth factors have been released,
immune effector cells begin to arrive at the wound site.[94] Inflammatory cells such as
neutrophils, lymphocytes, monocytes and macrophages migrate through the blood vessels and
surrounding tissues toward the wound to protect the area from infection.[23] Figure 12
illustrates a timeline at which different cell types appear within the wound during the healing
process.
These cells also function to clean and remove cellular debris through phagocytosis, to
prepare the site for tissue repair. During this stage, a second influx of cytokines and low-
molecular weight signalling molecules such as interleukins, thromboxanes, leukotrienes, kinins,
serotonin, and catecholamines are released and fill the wound to promote regional inflammation
and tissue repair.[95] Likewise, reactive oxygen species (ROS) released by inflammatory cells,
destroy any foreign material that may have entered the wound to maintain a clean wound
environment.[23,96] After approximately 3 days, the wound transitions from an inflammatory
phase into a proliferative phase.

30
Figure 12. A timeline plotting the appearance of neutrophils, macrophages, fibroblasts during different phases of wound healing.[102]
2.7.3 Proliferative Phase
The proliferative phase is the third stage of wound healing responsible for replacing
tissue and repairing vascular damage. Angiogenesis, collagen deposition, granulation tissue
formation, and re-epithelialization are the major events of this stage of wound healing.[97] Once
the wound site has been cleaned and liberated of cellular debris, fibroblasts migrate to the wound
following a gradient of cytokines and growth factors such as transforming growth factor-α (TGF-
α), platelet-derived growth factor (PDGF), EGF, KGF-1 and fibroblast growth factor
(FGF).[98,99] Many of these growth factors result in the differentiation of fibroblasts into
wound fibroblasts which begin to lay down a new extracellular matrix (ECM).[100] This new
ECM consists of granulation tissue which is a mixture of collagen types I and III, tenascin,
fibronectin, proteoglycans and in some cases, the inclusion of a new network of blood
vessels.[100] Figure 13 illustrates a timeline of the appearance of different ECM components
during the wound healing process. As the fibroblasts invade and differentiate, they produce

31
another influx of messenger molecules and peptides such as plasminogen activator, lymphokines
and hyaluronan.[101] As the fibroblasts establish a new ECM and become inhibited by
increasing concentrations of glycosaminoglycan, another set of cells migrate toward the center of
the wound.[102] Basal keratinocytes at the wound edges and hair follicles begin to migrate
toward the inner portion of the wound,[102] stimulated by the increasing levels of fibrin,
fibronectin and collagen type I.[103] Keratinocytes continue to proliferate, transform and
phagocytose any remaining cellular debris, resulting in re-epithelialization, with closure of the
open wound achieved by about the 12th day from the time of injury.[23] It is this phase of
wound healing that is of strong interest to most burn researchers because of the high number of
cellular and signaling events taking place. Consequently, the delivery of additional growth
factors to the wound site may modulate the proliferative phase and accelerate the wound healing.
Once keratinocytes have entered the wound, the proliferative phase is complete and wound
remodeling can take place.
Figure 13. Appearance of fibronectin, and types I and III collagen during the wound healing process.[102]

32
2.7.4 Remodeling Phase
Remodelling is the final phase of wound healing taking several weeks to complete.[76].
The goal of wound remodeling is to replace weaker components of the ECM with more robust
biological molecules that provide greater strength to the re-epithelialized wound. An example of
this process is the exchange of hyaluronan with sulphated proteoglycans such as decorin,
byglycan and versican produced by mature scar fibroblasts to provide the tissue with greater
resilience.[104] In addition, collagen replenishment continues along with more complex
interwoven molecular cross-linking until about 7 weeks after wound healing.[104] The outcome
of this event is a proportion of activated fibroblasts transforming into myofibroblasts that pull
normal dermal and adipose tissue into the wound defect.[105] As a result, a scar begins to form
and wound contraction results. Although this remodeling is an important step in wound healing,
it serves little purpose when trying to accelerate wound healing once re-epithelialization has
occurred in the proliferative phase of healing. However, all four phases are necessary
components in effective and efficient wound healing. Figure 14 illustrates the exchange of
chemotactic and cellular communication that takes place during the wound healing process.

33
Figure 14. The complex wound healing cascade illustrating the importance of cytokines that drive the transition from one phase of wound healing to the other. The phases of hemostasis (coagulation), inflammation, migration, proliferation and remodeling are the necessary components for successful wound healing.[81]
2.8 Dressing Requirements
Skin wounds inflicted by mechanical injury, and burn wounds heal in an almost identical
fashion to those observed in other large wounds of the skin.[7] One point of difference however,
is that burn wounds lose large amounts of fluid through evaporation and exudation, compared to
deep lacerations. Elevated fluid loss from the surface of the skin, and heat loss due to
evaporation is increased leading to a drop in core body temperature. Dressings designed for
burns must therefore be able to absorb fluid, control water vapour transfer rate at approximately

34
2-2.5 kg/m2/ 24 h, allow oxygen and carbon dioxide permeability, prevent bacterial growth and
be easily applied and removed.[106] Table 4 illustrates the elements required for an effective
wound dressing.[7]
Table 4. A list of transparent film wound dressing products.[7] Absorbency Ease of Application and Removal Adherence Elasticity Bacterial Barrier Gaseous Exchange Comfort Haemostatic Comformability Nonantigenic and Nontoxic Drug/Peptide Delivery Sterilizability Durability Water Vapour Transmissability
Dressings are applied to the wound surface to provide a protective barrier, relieve pain
and accelerate wound healing.[7] In early times, dressings made of honey, fats, and plant fibres
were used to prevent the entry of debris into the wound.[77,107] Although the primary function
was to wick away moisture and prevent infection, these primitive dressings could hinder the
wound healing process.[91] Modern dressings help to maintain a moist wound healing
environment, proven to facilitate the diffusion of growth factors, and more effective cell-to-cell
communication.[108]
Wound dressings come in a variety of materials including biomaterials and synthetic
polymers woven into different shapes and sizes. Materials such as natural (cotton, chitosan, etc.)
or synthetic polymers (polyurethanes, etc.) are commonly used because of cost-effectiveness and
wide availability.[23] Ultimately, the purpose of the wound dressing is to offer the highest rate
of healing, but also facilitate the best aesthetic repair of the wound. Therefore, the design of a
wound dressing suitable for all types of wounds is challenging and may not be effective in all
cases.

35
Table 5 lists the various dressing types organized based on compatibility with wounds
releasing different levels of exudates. According to Seaman (2002), wound dressings may
include: absorptive wound fillers, foams, collagens, gauze, hydrocolloids, hydrogels and
transparent films.[109] Consequently, depending on the type of wound, an appropriate wound
dressing must be selected.
Table 5. A classification chart matching exudate levels with different dressing examples.[109] Wound
Characteristic Goal of Therapy Dressing Examples
High Exudate Exudate Absorption Calcium Alginate (Wound Filler & Hydrogel) Foams (high moisture vapour transmission rate) Gauze
Low Exudate Maintain Moisture Hydrocolloids Foams (low moisture vapour transmission rate) Transparent Films
No Exudate Add Moisture Hydrogels Transparent Films Hydrocolloids
2.8.1 Calcium Alginate Dressings
Calcium alginate wound dressings have been used since the Second World War and have
been recognized for excellent haemostatic properties and biocompatibility. [110],[111]
Commonly, calcium alginates are combined with starch copolymers to make pads and packings
with a variety of shapes and sizes.[112] Alginates are polysaccharides harvested from brown
seaweed consisting of linear chains of (1,4)-β-D-mannuronic acid (M unit) and (1,3)-α-L-
guluronic acid (G unit).[113] Alginates are block copolymers of M and G units organized in a
manner such that divalent cations such as Ca2+ cooperatively bind between the blocks of G units
in adjacent alginate chains.[114] The crosslinked alginate polymer branches have been referred
to as the "eggbox model," because of the arrangement of the G units around the calcium ion.

36
Depending on the type of alginic acid used and the ratio of sodium to calcium in the dressing, the
gelling and structural properties of the dressing can be altered.
Alginates also have several chemical and bioactive properties that make them useful in
wound dressings. Alginates are generally well tolerated by the body and are broken down into
simpler glucose type residues which later become fully absorbed.[115] This allows wounds to
be completely covered, or packed by alginate without rejection by the body. In a porcine wound
model, Barnett et al. (1987) observed that calcium alginate dressings could be left on a wound
for up to 14 days with little ill effect.[116] Calcium alginates are therefore, well tolerated and
are highly biocompatible as wound dressings.
Alginates also have several bioactive properties that promote wound healing. According
to Thomas et al. (2000), alginates have the capacity to induce cytokine production by human
monocytes, as well as activate macrophages at the site of the wound.[117] Furthermore, the slow
release of calcium ions from the dressing are also used in the clotting cascade to provide superior
hemostatic control in the wound.[118] Both of these features allow for control over severe
bleeding, but also stimulate the inflammatory phase at an earlier opportunity to promote wound
healing.
Alginate dressings also have the capacity to absorb up to 20 times the dressing weight in
water and can conform to irregular surfaces.[119] The benefit of having such a large water
absorptive capacity is that it minimizes pain and additional trauma stemming from over packing,
or frequent dressing removal from heavily exudating wounds. Finally, according to Porter
(1991), alginate dressings can be applied and left in place until it separates spontaneously from
the wound which can lower the cost of constantly replacing medical resources.[118] However,

37
alginate dressings usually require a secondary outer barrier to hold the dressing in place. Table 6
lists some common, commercially available alginate wound dressings on the market.
Table 6. Alginate wound dressing products.[111] Product Company
Sorbsan™ Maersk Medical (UK) Algosteril™ Laboratory Brothier (Fr) Kaltostat™ Convatec (UK) Urgosorb™ Urgo (Fr) Tegagel™ 3M (USA) Tegagen HG™ 3M (USA) Curasorb™ Kendall Healthcare (USA)
Calcium alginate dressings can be manufactured using a variety of methods, forming
electrospun mats and sponges, and can be combined with silk fibroin, gelatin, poly(ethylene
glycol), poly(vinyl alcohol) (PVA) and chitosan to control physical and chemical
properties.[120,121,122,123] By controlling the physical and chemical properties of alginate
dressings, factors such as water uptake, gelling, and evaporation can be further attenuated to
minimize the risk of wound drying. Alginates have also been used in the microencapsulation of
insulin and functions as an effective drug delivery material for diabetes treatment, making it a
highly amenable biomaterial.[124]
2.8.2 Foam Dressings
Foam dressings are categorized as an occlusive wound dressings, used on partial
thickness dermal injuries, or as coverings for hydrogels, hydrophilic pastes (alginates), or
powders.[125] They are available as pads of varying thickness, adhesive and non-adhesive
forms, and can be laminated with a vapour barrier. According to Seaman (2002), moisture
transmission rates can range between 0.8 to 5 kg/m2/day based on the thickness and chemical
composition of the material.[109] This wide range of variations allows foam dressings to be

38
used in combination with ointments, creams and wound fillers that may synergistically promote
healing.
Foams are typically fabricated from a wide variety of synthetic polymers including PVA,
polyurethane or poly(siloxane).[126,127] Similar to calcium alginate dressings, foams have the
ability to absorb large amounts of wound exudate due to a porous microstructure and polymer
composition. Thus most foam wound dressings are reserved for wounds that are classified as
high exudating because of a large capacity to absorb moisture, and not recommended for drier
wounds.[128] Table 7 is a list of common foam dressings available on the market.
Table 7. Foam wound dressing products.[128]
Product Company Allevyn™ Smith & Nephew Curafoam™ Tyco Kendall PolyMem™ Ferris Mfg. Corp. Flexan™ Bertek Pharmaceuticals Lyofoam™ ConvaTec Mepilex™ Medline Industries Tielle Hydropolymer™ Johnson & Johnson
2.8.3 Gauze
Gauze dressings are one of the oldest and most commonly used wound dressings. It is a
standard in wound care and can be used to wipe debris away from a wound, absorb blood and
protect the wound during healing.[23] Gauze dressings are made from materials such as lint,
cotton and cellulose, and are available in either woven, or non-woven formats.[129,130] Woven
gauze is a fabric-like material composed of fibers spun into thread and woven into a ribbon or
pad. According to Seaman (2002), woven gauze is predominantly used for packing wounds due
to its lower water absorption capacity. This can be useful in injuries such as puncture wounds, or
deep gashes that need to be packed with material to help stop bleeding.[23] One pitfall however,

39
is that woven gauze has a higher tendency to shed lint which can become entrapped within the
wound bed and may impede wound healing.[131]
Non-woven gauze is made by a blending of materials instead of weaving.[132] This type
of gauze is especially effective when used to help stop heavily exudating or bleeding wounds and
does not shed as much lint. In addition, non-woven gauze can be combined with white
petrolatum and other additives to help maintain moisture and control bacterial growth.
Although gauze dressings are widely available and effective first aid tools, gauze
dressings can also be problematic. Gauze dressings require attention and maintenance to prevent
a condition known as wet-to-dry, where the gauze dressing becomes saturated with exudate, or is
pre-soaked in saline by a physician, applied to the wound and accidentally left to dry. The dry
gauze adheres to the newly healed tissue, resulting in a difficult, destructive and painful removal
of the gauze dressing.[133] Gauze wound dressings are not effective for moist wound treatment,
but useful for first aid and wound preparation. Table 8 lists common gauze dressings available
on the market.
Table 8. Gauze wound dressing products.[129] Product Company
Scarlet Red™ Kendall (USA) Vaseline Gauze™ Kendall USA) Xeroform™ Kendall (USA) Telfa™ Kendall (USA) Adaptic™ Johnson & Johnson
(USA)
2.8.4 Hydrocolloids
Hydrocolloids are a type of adhesive wound dressing commonly used for the treatment of
burns, and chronic or low exudating wounds. Hydrocolloids consist of materials such as

40
poly(isobutylene) sodium carboxymethylcellulose, gelatin and pectin, that swell upon contact
with wound exudate.[134] Hydrophilic materials help to absorb and maintain a moist wound
environment when placed over the wound. Often, hydrocolloids are processed into sheets and
layered with a thin impermeable membrane to prevent water vapour loss and the entry of
bacteria.[135] Table 9 lists commercially available hydrocolloid dressings.
Clinically, hydrocolloids are an attractive wound dressing because of low cost and ease of
use. Hydrocolloids may be applied for up to 7 days without changing, thereby reducing the
burden on healthcare providers and the use of resources.[136] Hydrocolloids are often described
as comfortable to wear and can be removed easily with little trauma to the wound bed. The
disadvantage in using hydrocolloid dressings is that frequent dressing changes are needed to
prevent bacterial growth.[137] Overall, hydrocolloids are an effective wound dressing for
chronic wounds, but should be avoided for heavy exudating wounds.
Table 9. Hydrocolloid wound dressing products.[109]
Product Company Tegasorb™ 3M Comfeel™ Coloplast Corp. DuoDerm™ ConvaTec RepliCare™ Smith & Nephew Restore™ Hollister Inc.
2.8.5 Hydrogels
Hydrogels are water-based products that contain 60-90% water and are used in a variety
of tissue engineering, wound healing and biomaterials applications.[138] Hydrogels are
typically used on wounds that are very dry, or have low levels of exudate whereby the dressing
can keep the wound environment moist.[81] Due to the moistening effect, the dressings are non-
adherent and are comfortable to apply and remove.[139] Hydrogels are made from natural and

41
synthetic polymers such as dextran, collagen, chitosan, Pluronic F-127, poly(vinyl alcohol)
(PVA) and poly(ethylene glycol) (PEG).[140,141,142] According to Drury (2003), synthetic
hydrogels have the ability to be easily reproduced with a high level of control over chemical
properties such as molecular weight, block structure, crosslinking density and degradable
linkages. These properties influence the gelling characteristics that can be adjusted depending on
the desired properties. Natural polymers on the other hand, more closely mimic the chemical
and physical properties of native extracellular matrix components. They can be used in a natural
form, or chemically modified to become semi-synthetic and have added properties such as
photocrosslinkability. Hydrogels therefore, can be easily attenuated to suit the needs of the
wound healing application and offer a wide range of flexibility. Table 10 lists typical hydrogel
wound dressings which are available on the market.[139]
Linear PEG hydrogels are of particular interest in wound dressings for several reasons.
PEGs are generally non-toxic, non-immunogenic, do not harm active proteins or cells, and are
easily cleared by the body.[143] Hydrophilicity of PEG also helps to preserve the bioactivity of
hydrophilic biomacromolecules and depending on the molecular weight and content, can
attenuate drug or peptide release kinetics.[144] In this case, incorporation into alginate dressings
would allow for control over drug delivery release kinetics, without affecting the
biocompatibility of the dressing.
Table 10. Hydrogel wound dressing products.[139] Product Company
Aquaform Robert Bailey Granugel Convatec Intrasite Gel Smith & Nephew Nu-Gel Johnson & Johnson Purilon Gel Coloplast Vigilon PEG Hydrogel Bard Inc.

42
2.8.6 Transparent Films
Transparent films are thin, clear polyurethane dressings with an adhesive layer that sticks
to the skin, but not to a moist wound.[145] Transparent films function by covering superficial
wounds, or by acting as secondary dressings to protect wounds which have been packed with
absorptive fillers. Thinness and conformability lead to a dressing which is unable to absorb large
amounts of exudate, but permit the passage of a limited amount of water vapour and
exudate.[146] Typically, films will have water vapour transfer rates of 0.3 to 0.8 kg/m2/24
h.[147,148] As a result of this low permeability, films are more resistant to permitting bacteria
and other pathogens from entering the wound. Flexibility and thinness also allows for easy
conformability around a variety of shapes which makes for easy application to uneven body
surfaces, or around I.V. lines, or drainage tubes.
Films can also be left on for extended periods of time ranging between 5 to 7 days
allowing the underlying wound to heal without being disturbed. [147] On the other hand, films
have limited capacity to absorb exudate and if used improperly, can cause underlying fluid to
pool leading to maceration. Table 11 lists several different types of films available in the clinic.
For superficial wounds or as secondary dressings, films are a primary choice, but not in the
healing of severe exudating wounds.
Table 11. Transparent film wound dressing products.[213] Product Company
Bioclusive™ Johnson & Johnson (USA) Opsite IV3000™ Smith & Nephew (UK) Tegaderm™ 3M (USA)
43
2.8.7 Biologicals
Biologicals are a class of recombinant medicines including monoclonal antibodies,
nucleic acids, and small or large molecular weight proteins.[149,150,151] Approximately 150
recombinant biopharmaceuticals have been approved by the Food and Drug Administration
(FDA) and the list of submissions and approvals continues to grow. [152] Recombinant peptides
are an increasingly important therapeutic intervention against a variety of medical conditions
including diabetic, oncologic, cardiovascular, immunosuppressive and gastroenterological
diseases.[153,154,155,156,157]
Growth factors are polypeptides with the capability of stimulating, or inhibiting cellular
division, differentiation, migration or gene expression, depending on the cells involved.[158]
Growth factors can act in an autocrine, paracrine or endocrine fashion depending on the target
receptor.[159] Once released, growth factors will either bind to their respective receptor, or
become consumed by proteolytic enzymes inactivating the polypeptide. The action of growth
factors is therefore strong and usually short-lived.
Biomedical researchers have examined the potential use of growth factors, especially in
the field of wound healing.[160] Exhaustively investigated growth factors have included
epidermal growth factor (EGF),[161] transforming growth factor beta (TGF-β),[162] and platelet
derived growth factor (PDGF).[163] As a result, growth factors are one method of ameliorating
the wound healing process by providing an earlier onset of the body’s own regenerative
mechanisms.
Unfortunately, the high cost of producing highly purified growth factors has prevented
their application within wound dressings. Beginning in the 1970’s, growth factors were first
harvested by processing tissue and/or blood samples from animals and humans.[164] Tissues

44
would undergo mechanical and chemical treatments to yield small quantities of semi-pure
growth factors. This approach was laborious and ineffective in sustaining large scale production.
As molecular techniques advanced, recombinant technologies utilizing bacteria and yeast made it
easier and safer to increase production.[165] As a result, the mean cost of growth factors such as
EGF, TGF-β and other highly specialized growth factors can be upwards of $1,500 - 10,000
USD per mg.[166] Growth factor application in wound healing technologies has therefore been
confined largely to experimental settings, and not commercial markets.
2.8.7.1 Epidermal Growth Factor
Epidermal growth factor (EGF) is a peptide and biological responsible for regulating cell
proliferation and differentiation in animals and humans. Structurally, EGF is a peptide with a
molecular weight of 5400 Da and contains a primary amino acid sequence of 53 amino acid
residues.[167] Within the peptide chain are six strategically placed cysteine residues forming
three disulfide bonds upon protein folding.[168] EGF binds to the EGF receptor (EGFR), a
tyrosine kinase transmembrane receptor found on the surface of keratinocytes, throughout the
basal layer of the epidermis.[169] Once two EGF molecules bind to the receptor, the EGFR
dimerizes resulting in autophosphorylation triggering a downstream signaling cascade.[12]
According to Barrientos et al. (2008), EGF has been one of the most heavily studied
growth factors in the field of wound healing, due to its important role in re-epithelialization of
acute wounds. Originally, Cohen (1962) reported isolating a polypeptide from the submaxillary
gland of male mice that accelerated eyelid opening and incisor eruption in newborn animals.
Subsequent testing on mice showed that proliferation and keratinization of the epidermis was
possible and that faster growth of chick embryos in vitro, could be achieved.[170] EGF was later
report to be secreted by platelets, macrophages and fibroblasts in order to stimulate keratinocytes

45
during the wound healing process.[12] Hardwicke et al., 2008, reported that EGF stimulates
fibronectin synthesis, angiogenesis, fibroplasia, and collagenase activity. These functions help
re-epithelialize the wound after the initial clot has formed.[11] Franklin and Lynch (1979) tested
the effect of topical EGF application on wounds inflicted to the anterior surface of the rabbit ear
down to the cartilage. Every 12 hours, a topical ointment of 0.83 µg/mL mouse EGF was
applied for up to 20 days, along with a blank topical ointment for comparison. After 20 days, the
EGF-treated group had wounds which had healed with a thicker and denser epithelium, along
with less wound contracture versus control. Wound healing was faster and resulted in a more
naturally appearing scar than the untreated group.[171]
In vivo studies performed by Nanney (1990) compared the healing rates associated with
topical EGF treatment and untreated dermatomed pigs. Using a semi-occlusive bandage in
conjunction with an application 10 µg/mL/day was optimal in achieving re-epithelialized skin
within 3 days versus 4 days in the control group.[172] Tanaka et al., (2005) examined the in
vivo efficiency of gelatin sheets loaded with 10 mg/mL human recombinant EGF on the repair of
partial-thickness wounds on the dorsal side of hairless dogs. The sheets were replaced daily for
14 days and resulted in a significant reduction in the wound area by days 9 and 12 versus the
blank control group. By day 9, more than 50% of the wound area had been repaired, as opposed
to only approximately 20% in the control.[161] EGF is therefore a potent mitogen of
keratinocyte migration and proliferation.
2.8.7.2 Transforming Growth Factor Beta
Transforming growth factor beta (TGF-β) is a polypeptide implicated in several aspects
of wound healing including cellular proliferation, differentiation and matrix metabolism.[158]
Human TGF-β is a dimer polypeptide with a molecular weight of 25 kDa and yields two

46
identical chains of 122 amino acid residues in length.[173] The two chains are held together
with a disulfide bond required for ligand-TGF-β receptor (TGFR) binding to take place
successfully.[173] TGF-β is secreted by platelets, activated macrophages, T-lymphocytes,
endothelial cells and fibroblasts where active wound repair is present.[162] The TGFR is part of
the cell surface, transmembrane, serine-threonine kinase receptor family and is found on nearly
all cells including epithelial, mesenchymal, and lymphocytic.[12] Activation of the TGFR
results in a downstream signaling cascade surmounting in anchorage-independent growth and
proliferation of fibroblasts, as well as inhibiting the proliferation of mitogen stimulated B and T
cells, and keratinocytes.[12,174] The activation of fibroblasts enables matrix formation to take
place with the deposition of type I and III collagen, which when uncontrolled, can lead to
significant fibrosis and scar tissue formation.[158,175] As a result, the release of TGF-β occurs
in a highly controlled and timely manner during the wound healing process.
TGF-β has been used in wound healing applications and has demonstrated some
beneficial effects. Puolakkainen et al., (1995) reported the use of TGF-β incorporated into 4
drug delivery vehicles including phosphate-buffered saline, polyoxamer gel, DuoDerm
hydroactive paste and a poly(ethylene oxide) gel. The various topicals were applied to full-
thickness wounds in rats and wound healing measurements were recorded. A single TGF-β dose
of 1 µg/wound was administered and resulted in enhanced wound healing between days 2-5
when compared to the blank vehicle controls.[162] Beyond day 7, the blank controls and TGF-β
treatment groups did not differ in wound closure rate. Pandit et al., (1999) examined the wound
healing response of rabbits with full-thickness wounds treated with collagen scaffolds loaded
with 2 µg/cm2 TGF-β. All wounds were covered with a secondary polyurethane dressing
monitored at 1, 2 and 3 week intervals.[176] By week 3, nearly 95 + 47%, 51 + 14% and 44 +

47
25% wound re-epithelialization was recovered in the TGF-β, control and collagen only study
groups respectively. No significant differences were reported in mechanical strength of repaired
tissue. Overall, TGF-β delivery did help to enhance wound healing, but showed little difference
in mechanical strength. Brown and colleagues (1988) studied the effects of a single dose of
TGF-β and EGF delivered separately by a single injection into rats given a single incision. The
wound tissue was harvested 10 days later, revealing that EGF caused wound tensile strength to
increase by 200%, whereas TGF-β increased wound tensile strength by only 50% when
compared to controls.[177] TGF-β showed strong potential in enhancing wound healing, but
only if delivered immediately after injury.
2.8.7.3 Platelet Derived Growth Factor
Platelet derived growth factor (PDGF) is a polypeptide released from platelet granules
upon injury. It belongs to a family of homo and heterodimeric growth factors and is produced
primarily by platelets, but in smaller quantities by macrophages, vascular endothelium,
fibroblasts, and keratinocytes.[12] The polypeptide consists of an A and B chain held together
with two disulfide bonds, resulting in a molecular weight of 30 kDa.[158] When platelets are
exposed to subendothelial basement or collagen, the platelets degranulate causing PDGF to be
released at the site of the injury.[178] PDGF then binds to the PDGF receptor (PGFR), a
transmembrane, tyrosine kinase receptor that autophosphorylates upon activation, located on
fibroblasts, and lymphocytes.[179] The elevated levels of PDGF cause a series of chain
reactions beginning with the attraction of neutrophils, macrophages and fibroblasts to the site of
the wound. Once activated, the macrophages and fibroblasts begin to proliferate, while also
secreting fibronectin, hyaluronin and collagen at the injury site.[180] PDGF is therefore a

48
powerful stimulator of fibroblasts which enable the replacement and production of lost ECM
components.
Delivery of PDGF exogenously through wound dressing devices has been explored as
one method of ameliorating the wound healing process. Li and colleagues (2009) reported the
effects of using a PDGF loaded two-component polyurethane scaffold to heal rat skin inflicted
with an excisional wound. A range of loadings included 0-11.5 µg/mL of scaffold were tested,
along with blank scaffold controls. By the 14th day post injury, PDGF treated animals
demonstrated nearly 100% re-epithelialization, while the blank control group achieved only 70%
tissue recovery.[181] Jin et al., (2008) tested PDGF loaded poly(lactic-co-glycolic acid) (PLGA)
microparticles incorporated into nanofibrous scaffolds as a strategy to repair incisions made on
the dorsal regions of rats. Loadings ranging between 2.5-25 µg/wound were implanted, and
monitored over a period of 21 days. Treatment groups showed increased angiogenesis and tissue
neogenesis versus the blank control groups.[182] Sun et al., (2007) used collagen membranes
loaded with PDGF to accelerate wound healing in rabbit dermal ischemic ulcer models. Using
electrospinning techniques, collagen was spun to form sheets loaded with 0.64 nM PDGF
resulting in a mean re-epithelialization of approximately 55%, versus 30% in the blank control
after 14 days. PDGF delivery is therefore one method of accelerating wound healing of
cutaneous wounds.
2.8.7.4 Additional Growth Factors
Wound healing includes additional growth factors, released during different periods of
the wound healing process. Many of the growth factors listed in Table 12 have been tested in a
laboratory setting, with few making it to the clinic.

49
Table 12. Growth factors released during wound healing, along with the target cell types and cost of obtaining pure growth factor. Growth Factor Cells Involved Function Format Cost CAD/mg EGF Platelets
Macrophages Fibroblasts
Re-epithelialization
Lyophilized Powder
$987[183]
TGF-β Platelets Keratinocytes Macrophages Lymphocytes Fibroblasts
Inflammation Granulation tissue formation Re-epithelialization Matrix formation
Lyophilized Powder
$9800[184]
PDGF Platelets Keratinocytes Macrophages Endothelial Cells Fibroblasts
Inflammation Granulation tissue formation Matrix formation and remodeling
Lyophilized Powder
$4300[185]
FGF-2 (Fibroblast Growth Factor-2)
Keratinocytes Mast Cells Fibroblasts Endothelial Cells Smooth Muscle Cells Chondrocytes
Granulation tissue formation Re-epithlialization Matrix formation and remodeling
Lyophilized Powder
$5700[13]
VEGF (Vascular Endothelial Growth Factor)
Platelets Neutrophils Macrophages Endothelial Cells Smooth Muscle Cells Fibroblasts
Granulation tissue formation
Lyophilized Powder
$4300[186]
IL-1 (Interleukin-1)
Neutrophils Monocytes Macrophages Keratinocytes
Inflammation Re-epithelialization
Lyophilized Powder
$5200[187]
IL-6 (Interleukin-6)
Neutrophils Macrophages
Inflammation Re-epithelialization
Lyophilized Powder [188]
$3000[188]
TNF-α (Tumour Necrosis Factor- α)
Neutrophils Macrophages
Inflammation Re-epithelialization
Lyophilized Powder
$1500[189]
Insulin
Keratinocytes Fibroblasts Endothelial Cells
Re-epithelialization Angiogenesis
Crystalline Powder
$1[190]

50
2.9 Insulin and Wound Healing
Insulin is a peptide and growth factor with several physiological roles. It is primarily
known as a hormone that regulates circulating blood glucose levels within the body. Over the
past 100 years however, insulin has played a quieter role in the field of wound healing. As an
effective and affordable peptide, which can help restore the integrity of the skin, insulin is
becoming an increasingly useful peptide of interest in the field of wound care.
2.9.1 Discovery of Insulin
The discovery of insulin was one of the greatest achievements of the 20th century. Prior
to the early 1900’s, medicine offered little relief to patients who were diagnosed with juvenile
diabetes, and little was known about the physiology and function of the pancreas. In almost all
cases, juvenile diabetics resulted in poor health outcomes and typically underwent one of two
approaches. The first treatment included a starvation diet developed by Frederick Allen, which
limited the patient’s intake of carbohydrates and reduced the incidence of glycosuria.[191] The
second and more morbid therapeutic option was to provide no medical intervention.[192] In
both cases, young patients would often suffer and die from cachexia, or diabetic ketoacidosis
resulting from impaired metabolic regulation.[193]
Frederick Banting and Charles Best successfully isolated insulin in 1921 from processed
porcine pancreases.[194] Systemic administration of insulin isolates demonstrated successful
lowering of blood glucose levels in dogs, and signified the introduction of a new therapy for
juvenile diabetes.
Soon after the discovery of insulin, stability issues became apparent. Without access to
fresh insulin, the peptide would degrade and fail in controlling serum glucose levels. In an
attempt to correct this problem, John Abel developed a method in 1926, of co-crystalizing insulin

51
with zinc salts to form a stable hexamer.[195] Jørgen Schlichtkrull refined the formulation
conditions, and identified a reliable and reproducible method of crystallizing insulin. This was
an important step because a crystalline form enabled longer periods of storage without loss of
bioactivity. Schlichtkrull also discovered that hexameric insulin favourably complexed with
either two, or four zinc atoms stabilizing insulin for extended periods,[193] allowing Fred
Sanfer to determine the primary amino acid sequence of the peptide nearly three decades later in
1955,[196] and Don Steiner to identify the biosynthetic pathway in 1967, making it subsequently
possible to partially synthesize insulin. Steiner discovered that insulin is first synthesized as a
proinsulin precursor, requiring post-translational modification to become fully active.[197] Two
years later, Dorothy Crowfoot Hodgkin and colleagues described the three-dimensional structure
of insulin using X-ray crystallography, allowing for structure and function relationships to be
completed.[198] These discoveries culminated with the introduction of recombinant
technologies, which permitted industrial-scale production, resulting in reduced cost and
increased clinical availability.[199] Today, insulin is prepared in a number of highly stable and
pure forms for about $1 CAD/mg.
2.9.2 Biosynthesis and Structure
Insulin is one of the most highly conserved peptides found in vertebrates and generally
differs by 1-3 amino acids between species.[200] Naturally, insulin is biosynthesized by β-cells
of the islets of Langerhans, clustered within the pancreas. The islets are supported by a highly
vascularized and densely innervated network that provides accurate sensing, and control of blood
glucose levels.[201] Normally, the pancreas is capable of producing up to 200 U (8mg) insulin
per day, of which only 50 U (2mg) is usually secreted.[202] Within the islets, insulin is
synthesized as a single-chain precursor, known as preproinsulin,[203] comprised of several

52
segments including: an N-terminal signal sequence of 24 amino acids, followed by the insulin B-
chain, an Arg-Arg sequence, a connecting C-peptide of 31 amino acids, a Lys-Arg sequence and
the insulin A-chain.[201] These signalling sequences are necessary to direct the secretion of the
preproinsulin through the endoplasmic reticulum and Golgi bodies so that further post-
translational modifications, such as the cleavage of the C-peptide, can take place.[204,205]
Figure 15 depicts the biosynthesis of preproinsulin, modification and release of insulin, while
Figure 16 illustrates the structure of proinsulin.
Post-translationally modified insulin is approximately 5800 Da and consists of an A-
chain with 21 and a B-chain with 30 amino acid residues, held together by 2 disulfide bonds.
Figure 17 shows the structure of proinsulin undergoing proteolytic cleavage of the C-chain.
After modification, insulin complexes with zinc and forms crystalline granules within β-cells of
the pancreas and becomes sequestered until the time of release.[206] The crystallization process
is a key facet in ensuring that insulin can be preserved for extended periods of time within the
body, but released when needed.
Once released into systemic circulation, insulin is degraded by four different mechanisms,
including degradation by the insulin-degrading enzymes (IDE), and by being bound and
internalized by the insulin receptor (IR).[207,208,209,210] These mechanisms ensure that
prolonged insulin stimulation can be avoided and tight regulatory control enabled.

53
Figure 15. The biosynthetic pathway of insulin in its initial, unmodified form as preproinsulin, through post-translational modification and release of mature insulin within the pancreatic β cells.[204]

54
Figure 16. Proinsulin prior to having the connecting peptide (C-peptide) proteolytically cleaved. The arrows indicate the cleavage sites, while -S-S- indicate the presence of disulphide bonds.[202]
S
S
S
S
H2N
COOH
60 81
1 30
211
1 30
S S
7 11
A-Chain
B-Chain
Connecting Peptide

55
Figure 17. The proteolytic processing of preproinsulin to proinsulin, then to insulin. Note the three key steps in insulin’s biosynthetic pathway, 1) cleavage of the signal sequence, 2) formation of the disulphide bond and 3) the removal of the connecting (C-peptide) polypeptide.[205]
2.9.3 Recombinant Synthesis and Crystallization
Industrially, insulin is produced using recombinant DNA technologies with genetically
modified yeast and bacteria.[211] A recombinant approach alleviates the need for animal
sourced organs, safeguarding against the transmission of animal-to-human pathogens, and is a
cost-effective approach in large-scale production.[212] Purified insulin is crystallized at pH 5.8-
6.0, by adding zinc salts.[213] Insulin also complexes and precipitates with cobalt and cadmium

56
salts, however these preparations are not intended for clinical use.[214] The crystallization
process is therefore a key step in stabilizing the peptide.
Crystallization of insulin also retards the dissolution rate under physiological conditions.
For example, four-zinc hexameric insulin dissolves slower than non-complexed monomeric
insulin, thereby allowing diabetic patients to maintain near constant serum levels of injected
insulin for prolonged periods.[215] Regulation of blood sugar levels is then enabled through
sleep periods by avoiding multiple injections. The rate limiting step in the dissolution
mechanism is liberation of the zinc atom, which in turn releases insulin monomers that then bind
with the insulin receptor (IR).[213]
2.9.4 Insulin Receptor
The insulin receptor (IR) is amongst the most ubiquitous cell surface receptors in the
body. The IR belongs to a family of receptor tyrosine kinase (RTK) transmembrane signaling
proteins, which include the insulin-like growth factor-1 (IGF-1), EGF and PDGF receptors.[216]
Insulin receptors are found on myocytes, erythrocytes, adipocytes, granulocytes, lymphocytes
and in brain tissue at nearly 40 to 300 x 103 binding sites per cell.[217,218,219,220,221] IR
binding sites have also been identified on both human skin fibroblasts and keratinocytes in
separate high and low affinity binding populations. [222,223] Fibroblasts have approximately
1,100 high affinity and 30,000 low affinity insulin binding sites per cell.[224] Keratinocytes
have nearly 6,000 high affinity and 80,000 low affinity binding sites per cell. Specific to
keratinocytes, the IR is responsible for inducing the expression of keratins 1 and 10 during
calcium-induced differentiation and conversely inhibits the activation of the IGF-1 receptor
which has an inhibitory effect.[225] The presence of high and low affinity binding sites permits

57
IR to respond differently to variable insulin concentrations in the blood stream.[226] Insulin
receptors are a key mediator of signal transduction in homeostasis and tissue repair.
Structurally, the receptor is initially synthesized as a proreceptor and cleaved to form a
350-400 kDa heterotetrameric receptor composed of two α-subunits (135 kDa each) and two β-
subunits (95 kDa each) joined by disulphide bonds in a β-α-α-β configuration (Figure 18).[227]
The proreceptor is approximately 1340-1382 residues in length and can be spliced in more than
one way.[228,229] The α-subunits are located near the N-terminal domain and constitute the
extracellular[230], whereas the β-subunit contains a transmembrane domain, an intracellular
region which contains the tyrosine phosphokinase, ATP-binding site and a tyrosine
autophosphorylation site.[231] Other key regions of the IR include a leucine-rich repeat domain,
a cysteine-rich region, a second leucine-rich repeat domain, and three fibronectin type III
domains which help to maintain the conformational shape of the receptor.[232]
During receptor activation, insulin binds to one of two binding sites on each of the αβ
monomer called, site 1 and site 2.[233] When insulin first binds to site 1, a high-affinity cross-
linking reaction takes place, allowing 2 to become accessible for ligand binding to activate the
receptor.[234,235] This binding regime means that IR demonstrates a negative co-operativity,
meaning that as one ligand binds to the receptor, the IR affinity for a second ligand will decrease
(Figure 19). Once bound, the α-subunit which normally prevents autophosphorylation of the β-
subunit, is inhibited causing the kinase activity of the β-subunit to transphosphorylate, change
conformation and increase its own kinase activity.[236] Interestingly, IR and IGF-1 receptors
form functional hybrids which help elucidate why IGF-1 and insulin can act on each other’s
respective receptors.[236]

58
After insulin binds to the IR, specific biochemical events take place downstream of the
binding domain. Specifically, tyrosine residues in the β-subunit become phosphorylated, thus
forming docking sites for receptor substrates found within the cytosol which contain SH2 (Src-
homology-2) domains.[237,238,239] Insulin receptor substrates (IRS) are then permitted to
interact with the docking sites and result in a wide array of downstream signalling cascades,
including activation of PI(3)-kinase and downstream PtdIns(3,4,5)P3-dependent protein kinases,
ras and the MAP kinase cascade, and Cbl/CAP, glucose transporter (GLUT4) and the activation
of TC10.[237,240,241] Other tyrosines found within the kinase domain begin to regulate the
catalytic activity of the β-subunit.[238] The culmination activating IRS results in coordinated
regulation of vesicle trafficking, protein synthesis, enzyme activation and inactivation, and gene
expression, aspects which are necessary for normal metabolism and tissue repair.
Soon after activation, the IR is quickly inactivated through two major pathways. The first
includes internalization of the receptor which becomes sequestered from the plasma membrane
and concentrated into heteratogeneous, non-lysosomal tubulovesicular structures called
endosomal apparatuses.[242] Once within the endosomal apparatus, the IR undergoes receptor
sorting, recycling and degradation.[242] The second method includes protein tyrosine
phosphatases that desphophorylate the receptor and its substrates, resulting in receptor
inactivation.[243] IR inactivation can be variable depending on the nature of the stimulus.

59
Figure 18. An illustration of the insulin receptor situated on the surface of the plasma membrane.[237]

60
Figure 19. A plot of insulin concentration over time, along with the proposed structural changes which occur as insulin binds with Sites 1 & 2.[232]
2.9.5 Beginning of Insulin-Wound Healing
Insulin’s role in wound healing can be traced back to the early 20th century to surgeons
who observed differences in healing rates amongst diabetics and non-diabetics recovering from
surgery.[244] In diabetics, wounds would fail to re-epithelialize normally, exposing raw flesh to
open environment, resulting in infections. As the infection spread to the blood, death would soon
follow. After the discovery of insulin in 1921, William Thalhimer was the first to report the
application of insulin to treat postoperative (nondiabetic) acidosis. At the time, Thalhimer had
been monitoring three patients who had undergone surgery and were suffering from severe
vomiting and post-operative metabolic imbalance. Thalhimer reported that there was strong
evidence linking acidosis with the development of severe infection and death. After injecting
three patients with glucose and 10 units of insulin, the symptoms of acidosis were cleared, and
the metabolic balance restored.[245] Improved recovery for the patients was evidence for the

61
role of insulin regulating tissue repair. Nellis Foster in 1925 was also attempting to treat similar
cases of diabetic acidosis by administering 30-75 units of insulin.[246] The mortality rate from
infection in diabetics was reduced from 40 to 12% in those patients receiving insulin therapy
intravenously amongst 20 patients. The Thalimer and Foster observations provide early
indications of insulin’s ability to improve wound healing, and thus enhance postoperative health
in diabetics.
Schazzilo and Ksendowsky used radiographic and histological techniques in 1928 to
investigate the effects of insulin on bone fracture repair. Using a rodent animal model, 1 unit of
crystalline insulin was injected into test animals, resulting in faster healing compared to blank
control specimens of 5 animals each.[247] Soon after, Barnet Joseph (1930) used insulin therapy
to treat cardiac patients with non-diabetic bed sores. Joseph administered 10 units of insulin
once daily to 5 patients, and observed improvements to the wound of 50 to nearly 100% after 14
days of therapy.[248] Rabinowitch (1932) later studied 250 consecutive surgical cases of
gallbladder disease, which included a subset of 50 diabetic patients. Rates of death in both
diabetic (4%) and non-diabetic (5.5%) patient pools showed that insulin had reduced the risk of
post-operative wound infection to a level comparable with normal patient recovery.[249] Walter
Stuck (1932) examined the effect of exogenous administration of 1.5 units insulin intravenously
to promote faster bone healing in rabbits with fractured left fibulas. Faster calcification of the
callus in the presence of insulin was reported between 14 and 28 days versus the control group,
and while bone morphology between the insulin and control groups did not differ, those treated
with insulin had healed faster.[250]

62
2.9.6 Insulin-Wound Healing Research: 1940s-1980s
Much of the research during the early part of this period was directed toward bone
fracture healing before refocusing on soft tissue injuries. Lawrence et al. (1954) studied the
effects of insulin on nitrogen balance in hypophysectomozed rats, postulating that insulin was
responsible for nitrogen retention related to the uptake of amino acids, synthesis of proteins and
inhibition of protein catabolism. These three factors are important to tissue repair following
damage or injury. The study compared hypophysectomized rats treated with, and without insulin,
along with non-hypophysectomized rats. Hypophysectomized rats receiving insulin responded
positively to the insulin treatment and demonstrated a linear relationship in stimulating protein
synthesis with dose.[251] Lawrence concluded that insulin could therefore be a potent growth
factor in the absence in pituitary signaling molecules, and potentially in tissue repair. Later,
Stunkle and Wray (1965) examined the effect of long-acting insulin on the rate and quality of
recovery from fractured tibias in non-diabetic and diabetic rats. This was one of the first studies
to utilize long-acting insulin, contained two arginine amino acids added to the C-terminal of the
B chain and a substitution of asparagine 21 on the A chain with glycine.[252] The principle was
based on lowering the isoelectric point to pH 4, so that upon injection, insulin would remain
crystalline under normal physiological pH and dissolve more slowly with time. The study
concluded that there was no significant difference in tensile strength of repaired tibias between
treated and control animals.[253] Unfortunately, the study did not present findings related to the
time to heal in control and treatment groups. In the same year, Gregory (1965) tested the effect
of insulin on bone healing, by performing a simulated bone fracture on male albino rats. A hole
was drilled through the lateral aspect of the femur with a dental bur, cutting into the marrow.
Following the injury, 40 units/kg of protamine-zinc insulin (intermediate- acting insulin) were

63
injected every 24 hours in 31 test animals and compared to 31 control subjects. The application
of insulin showed no effect on bone strength, weight gain or histology.[254] Like the previous
study, this study was not designed to examine the time to heal the defect in both control and
insulin treated groups, only the break strength after insulin therapy. At this point, insulin therapy
for bone regeneration in rabbit and rat models did not appear to improve bone strength after
recovery and provided contradictory results to studies performed in the late 20’s and 30’s.
In the late 1960’s, interest in using insulin for soft tissue wound healing was gaining
popularity in both laboratory, veterinary and some human studies. In 1966, Paul described a case
report on a 56-year-old diabetic woman who had developed gangrene which was spreading
throughout the rest of her foot. After amputation, the stump became infected with
Staphylococcus pyogenes, releasing puss and eventually becoming necrotic. After repeated
dosing with cloxacillin and erythromycin, no improvement in the infection was noted and the
wound continued to heal poorly. Gauze soaked with 20 units of soluble insulin was then applied
to the wound and covered. The dressing was changed twice daily and the injury healed within 3-
4 day.[255] Paul concluded that insulin may have helped to promote glucose utilization in
tissues, resulting in improved healing and immediate clearing of the infection. Following this
study, Rosenthal (1968) examined the acceleration of primary wound healing by insulin in male
albino Wistar rats. A 4 cm vertical incision through the musculofascial layer, including the
peritoneum was made on the left side of the upper part of the abdomen. Protamine zinc insulin
suspensions were given daily for 2 to 3 days prior to the surgery, and then daily. Insulin treated
animals showed a significant increase in wound tensile strength of nearly 15% over that of
controls, 7 days after surgery, and weight gain of nearly 7 fold.[256] Rosenthal concluded that
the insulin must have been stimulating protein synthesis increasing the wound tensile strength in

64
animals receiving insulin treatment. Belfield et al. (1970) developed a cream containing 10 units
of ulcerin, which was applied to surgical wounds, fresh bites and lacerations on cats and dogs. In
non-infected wounds, no noticeable wound healing response was observed, however animals
with abscesses, ulcers, or infected surgical wounds had a strong response to ulcerin in as little as
24 hours in some cases.[257] After nearly 100 animal cases, the cream was moved into the
clinic for testing. Ulcerin strength was adjusted from 10 to 80 units of insulin and was applied
topically twice daily. Healing of ulcerated wounds began to appear within 48 h along with new
tissue growth in the treatment of 20 animals. The authors suggested that clinically, ulcerin was
helping to normalize cell permeability, increase vascularization, reduce exudation, arrest
bacterial growth, enhance phagocytosis, stimulate proliferation, decrease local tissue hypoxia,
eliminate edema and increase wound contracture.
Udupa et al. (1971) examined the biochemical and histological aspects of insulin-
mediated wound healing. Rats were dosed daily with 0.02 U/g of body weight, administered
subcutaneously. The experiments included 25 insulin treated rats and 25 controls, and continued
for approximately 3 weeks in which insulin therapy ceased 5 days before sacrificing. Linear
musculoperitoneal wounds measuring 5 cm in length were made and sutured closed. Protamine
zinc insulin significantly increased the bursting strength of experimental abdominal wounds in
rats, along with an earlier appearance of collagen fibers which were dense and better oriented
compared to control animals.[258] There was however, no difference in the appearance of
collagen fibers, and no data dealing with healing times was presented. Goodson et al. (1978)
examined wire mesh cylinders implanted subcutaneously into diabetic rats. Rats were given
insulin, either immediately or in intervals after the implantation procedure. Wound healing was
assessed by measuring the concentration of hydroxyproline in the tissue which had grown into

65
the cylinders after 21 days. Without insulin therapy in diabetic rats, wound healing was impaired
and insulin was needed in the earlier phases of wound healing.[259] Weringer et al. (1982)
continued to study the effect of insulin on wound healing in diabetic mice. Diabetic and non-
treated C57B1/6 mice received small dermal wounds in the ear up to 40 h after injection of
insulin, or placebo. The wound tissue was excised 8 h later and the presence of capillaries,
fibroblasts, and collagen, studied microscopically.[260] Diabetic mice showed impaired healing,
whereas diabetic mice provided with insulin responded similarly to non-diabetic controls by
reducing the mean level of hyperglycemia experienced after wounding. No detectable difference
in the duration of healing was observed between insulin-treated and non-insulin treated diabetic
mice. The authors concluded that the mild reduction in hyperglycemia does support the
hypothesis that insulin is necessary in an adequate wound healing response.
2.9.7 Animal and Human Wound Healing Studies – 1980s to Present
Sakurai et al. (1992) from the Wolfe/Herndon group at the Shriner’s Burn Center in
Galveston, Texas published one of the most significant reports on insulin-mediated wound
healing. The effectiveness of long term insulin infusion in burn patients to alter protein kinetics
in skeletal muscle in severely injured burn patients was studied. The hypothesis tested was that
protein anabolism could be altered by an increased rate of transmembrane amino acid transport
upon stimulation by insulin infusion.[261] Nine patients with severe burns were studied and
given 7 days of high-dose insulin randomly. Exogenous insulin delivery was found to stimulate
protein synthesis by 50% in the wound, as compared to controls, however varied greatly between
patients. Three years later, Sakurai’s group conducted a similar experiment whereby six patients
with burns to greater than 40% of total body surface area received insulin plus glucose infusions
for 7 days.[262] The aim was to show that limb protein anabolism and improved wound healing

66
could be achieved. Patients were given 25 to 49 U/h along with dextrose to maintain euglycemia,
and burn wound donor-sites were biopsied and analyzed. Insulin, along with glucose was shown
to reduce healing times from 6.5 +/- 1.0 days to 4.7 +/- 1.2 days during insulin infusion.
Laminin staining of the biopsied tissue revealed intense staining along the basal lamina and
blood vessels, together with an increase in collagen type IV after combined insulin therapy. The
study proved to be clinically significant because it highlighted that a combined insulin-glucose
therapy can be used to greatly improve the quality of wound matrix formation, and reduce the
healing time by nearly 30%.
Wolfe and colleagues in 1999 continued to examine wound healing in animal models to
determine if insulin or growth hormone could stimulate protein anabolism in male New Zealand
white rabbits. Four groups including a control (n=10), a low-dose insulin (n=5), a high-dose
insulin (n=5) and a growth hormone group (n=5) were subjected to a partial thickness, scald burn
to the ear. A L-[ring-13C16]phenylalanine trace was infused to measure muscle protein synthesis,
while insulin was infused at either 0.6, or 2.3-3.4 mU/kg/min, or 2 mg/kg/d of growth hormone.
Low or high dose insulin inhibited protein proteolysis, while growth hormone had no net
effect.[263] Using the same experimental protocol, the effects of co-administration of amino
acids, including radio-labeled phenylalanine and proline, and insulin was tested to determine if
the net protein balance in skin wounds could be improved. Rabbits were injured with a partial
thickness scald to the ear and treated with 2.5 mU/kg/min insulin and a combination of lysine,
valine, phenylalanine, histidine, threonine, methionine, tryptophan, alanine, arginine, glycine,
proline, serine and tyrosine at doses ranging from 40 mg to 2.07 g.[264] The combination of
both insulin and amino acid therapy caused a shift from protein catabolism, to anabolism in the
skin wound from -6.5 +/- 4.5 to 1.4 +/- 5.2 µmol/100 g/h, compared to insulin, amino acids alone,

67
or without any treatment at all.[264] The authors concluded that there is an interactive effect of
insulin and sufficient amino acid supply on protein metabolism in skin wound and that it is better
when co-administered, rather than individually infused into animals. This study was
instrumental in the design of human trials conducted by Gore and colleagues (2002) examining
six severely burned male patients with burns on greater than 60% of their total body surface area.
The amino acid and insulin therapy did not mimic the anabolic effects of insulin and amino acid
therapy in human patients as seen in the previous studies by Wolfe and colleagues.[265]
Wolfe’s group in 2007 examined the effects of localized insulin delivery versus
intravenous administration as reported in previous studies. Local insulin-zinc was injected into
the backs of dermatomed New Zealand white rabbits, simulating a parital thickness wound to the
skin. [266] The purpose was to determine if localized insulin delivery could accelerate wound
healing as effectively as intravenous infusion, but without the effects of hypoglycemia and
hypokalemia. Injections of 0.25 units insulin were directly placed into 5 sites around the wound,
approximately 1 to 1.5 cm from the wound margin every other day. The treatment resulted in
wounds healing in 11.2 +/- 2.3 days as compared to controls that healed on average 15.1 +/- 4.1
days.[267] Using a similar experimental protocol, Zhang and colleagues determined that DNA
synthesis was also increased by nearly 50% in wound tissue as compared to control animals.[266]
Wolfe’s research showed that although infusion of insulin is one method of improving wound
healing in animal models, localized insulin delivery can be just as effective in accelerating
wound closure. Zhang et al. (2009) revisited the insulin infusion model to determine if DNA and
protein synthesis would increase with the presence of insulin. Protein and DNA synthesis rates
were up 9.0 +/- 1.2 and 5.4 +/- 0.5 % per day, versus the controls which had rates of 6.4 +/- 0.5
and 4.0 +/- 0.6 % per day respectively.[268] As a result, the Wolfe/Herndon group was able to

68
demonstrate that intravenous and topical insulin delivery are capable of reducing wound healing
times, and increasing both protein and DNA synthesis by wound tissue.
Wound repair of corneal tissues was also examined in diabetic rats to study insulin’s role
in improving re-epithelialization. Zagon et al. (2006) investigated whether intensive treatment
with insulin could be used to maintain blood glucose levels at near normal levels in diabetic rats
to facilitate delayed corneal wound healing. Corneal abrasions were inflicted and followed with
insulin injections to maintain blood glucose near normal levels after 9 and 11 weeks post-
induction of diabetes. Healing and DNA synthesis in diabetic rats treated with insulin exhibited
similar healing as control animals, suggesting that intensive insulin therapy prevents delayed
wound healing on the ocular surface of diabetic rats.[269] Zagon in 2007, reported similar
results whereby insulin was topically applied to injured corneal surfaces. Eye drops containing 1,
2 and 5 U of insulin applied 4 times daily for 7 days resulted in diabetic rats healing at a similar
rate to that of non-diabetic test animals.[270]
Recently, four clinical studies between 2009 and 2011 were designed to test insulin
therapy in pediatric and adult wound cases. Rezvani et al. (2009) conducted a randomized,
double-blind, placebo-controlled trial to determine the effects of topical insulin on wound
healing in 45 patients with non-infected acute and chronic extremity wounds. Topical
application of a 0.1mL/cm2 of 0.9% saline spray, or 10 U of crystalline insulin twice daily were
used. The endpoint was complete wound closure.[271] There were no significant differences in
wound healing rates between control and treatment groups which could have been related to the
experimental protocol where the solution was permitted to dry on the surface of the wound. This
would have prevented insulin from penetrating and diffusing into the wound, resulting in no
improvement to wound healing. Wilson et al. (2008) reported on the topical use of insulin to

69
promote healing of problematic surgical wounds. An 80 year-old female patient with a chronic
non-healing wound following a laparotomy procedure, failed to heal, even after 3 weeks of
negative-pressure vacuum pump dressing application. The patient underwent insulin therapy as
a last resort method. The dressings were replaced with daily irrigation with 20 mL of saline
containing 2 U of soluble insulin for 7 days.[272] At the end of the therapy, visible
improvement was observed, along with no metabolic side effects. Fram et al. (2010) conducted
a randomized trial on 20 pediatric burn cases with burns to more than 40% of total body surface
area. Blood glucose levels of one group were maintained between 80 to 110 mg/dL, and
approximately 215 mg/dL for a second group, with intravenous infusions for 10-14 days. The
findings concluded that intensive insulin therapy in pediatric patients can be performed safely
with the ability to improve metabolic balance and to prevent insulin resistance after acute
trauma.[273] Scimeca et al. (2010), combined insulin chemotherapy with negative pressure
wound therapy (NPWT) in treating complex wounds. NPWT is used to assist in the
development of granulation tissue by improving wound contracture, moisture and re-
epithelialization. A 71 year old male diabetic patient who had received an emergency
amputation, received NPWT in conjunction with an infusion drip of insulin at a rate of 40 mL/h
following a dose similarly used by Wilson et al. (2008).[274] Within 48 h, the wound base was
90% granular with neo-epithelialization visibly present. Tuvdendorj et al. (2011) also explored
the use of intensive insulin-therapy in enhancing the healing of skin graft donor sites in burn
patients by increasing the fractional synthesis rate of wound protein. The randomized trial
followed 13 control and 10 insulin treated pediatric patients with burns to greater than 38% body
surface area, requiring skin grafting. Insulin was provided at a rate of 0.1 U/kg/h and the blood
glucose level maintained at 80-110 mg/dL. The metabolic response 2-4 (early period) and 5-6

70
(late period) days postoperatively was examined. In the early period, intensive insulin therapy
increased the fractional synthesis rate of wound proteins as determined by radiotracers
administered during the insulin therapy to measure protein turnover rates.[275] The significance
of this study reveals that in skin graft donor sites, insulin therapy administered as early as
possible, is able to increase fractional synthesis of proteins more effectively.
2.9.8 Cell Based Wound Healing Studies – 1990s to Present
While human and animal trials were being conducted by the Wolfe group, insulin therapy
was also being explored in the animal and tissue-based studies to further examine the molecular
events behind the role of insulin in enhancing the healing process. Yano et al. (1996) evaluated
the effect of insulin on fracture and wound repair of bone at both the tissue and cellular level
using parietal bones removed from 20 day old Sprague-Dawley rat fetuses and cultured in vitro.
After fracturing, specimens were placed in either medium with 10-6 mol/L insulin, or medium
without insulin, and studied 12 days. Bones receiving insulin treatment showed complete bone
gap restoration after the 12th day, along with a thick osteoid layer and several layers of
osteoblasts. No osteoclasts were detected. In the control group, 6 bones did not bridge the gap,
while the remaining 5 indicated some marginal bone growth. The frequency of bone bridging
(gap restoration) was statistically significant in the insulin treated group, compared to the insulin-
free controls. Yano concluded that insulin had promoted bone repair through the stimulation of
bone-forming cells and inhibition of bone-resorbing processes. Huang et al. (1999) studied the
effect of extracellular calcium, in combination with zinc, insulin and insulin-like growth factor 1
(IGF-1) on DNA synthesis in 3T3 fibroblasts cultured in serum containing 1.8 mM Ca+2,
stimulated with 0.75-2.0 mM Ca+2, along with the addition of zinc (15-60 mM) , insulin and

71
IGF-1. Insulin, along with zinc had prolonged Ca+2 induced mitogen-activated protein (MAP)
kinase activity and p70 S6 kinases, thereby promoting improved fibroblast growth.[276]
Shanley et al. (2004) investigated the effects of insulin and leptin on in vitro wound
healing of transformed human corneal epithelial cell monoloayer. The aim was to identify
cellular and intracellular signaling pathways involved in either proliferation, or migration events.
Using a monolayer of human corneal epithelial cells (HCEC), a single scratch was made into the
monolayer of cells. The scratched monolayers were exposed to insulin and leptin and monitored
every hour for 8 h. Western blot analysis of phosphoinositide 3-kinase (PI3-kinase) and MAP-
kinase activation was conducted. Inhibitors such as Ly 294002 and wortmanin were used to
prevent PI3-kinase and ERK 1/2 insulin induced activation as well. Shanley concluded that
insulin alone facilitated wound closure of HCEC cell monolayers through the phosphorylation of
ERK 1/2 and Akt and that their inhibition severely reduced insulin-induced wound healing.[277]
Insulin facilitated cell migration instead of proliferation through the lack of BrDU uptake as the
scratch area became filled over the 8 h period. The importance of this study is that the authors
showed that for small wounds, cell migration is the key driving force in wound healing whereas
in larger wounds, proliferation plays a larger role. Musselmann et al. (2005) observed the effect
of keratocytes (mature corneal stroma cells) co-cultured with three different growth factors
including fibroblast growth factor-2 (FGF-2), insulin and platelet derived growth factor-BB
(PDGF) on keratocyte proliferation and the maintenance of the keratocyte markers over 7-days at
low and high seeding densities in serum-free conditions. Proliferation was measured using
[3H]thymidine incorporation and by DNA content of the cultures. The expression of cytosolic
aldehyde dehydrogenase and keratocan determined by Western blot, measured the degree of
keratocyte phenotype expression during the course of the experiment. All growth factors

72
stimulated proliferation and increased the DNA content of the cultures over the 6-day period.
Insulin however, stimulated thymidine incorporation in a more consistent fashion, and attained
the greatest accumulation of DNA across all cultures. Likewise, insulin maintained keratocyte
morphology at the end of the study period more effectively than the other growth factors. The
relevance of this study indicates that insulin may be an important element in maintaining the
phenotype of proliferating cells in culture.
The cellular and molecular mechanisms of wound healing and vascular repair within the
skin were examined by the Martins-Green group. Liu et al. (2008) studied insulin’s angiogenic
effects using a combination of in vitro and in vivo techniques. C57BL/6J mice were injected
with 0.03 units of insulin per 20 µL saline in treatment groups and saline only in control groups
every 24 hours for 5 days. On day 6, skin samples were removed and histologically analyzed.
Insulin injections stimulated the formation of microvessels, with significantly more branching as
compared to control animals receiving saline injections. Cellular migration and DNA synthesis
was measured using human microvascular endothelial cells (HMEC) treated with insulin
concentrations ranging from 10-5 to 10-8 M. As well, insulin stimulated endothelial cell
migration and tube formation independently of the VEGF/VEGFR receptor pathway. The
molecular mechanism of action was found to be driven by the PI3-K, Akt, sterol regulatory
element binding protein 1 (SREBP-1) and Rac 1 signaling proteins. Inhibition of any of these
pathways resulted in the elimination of endothelial cell migration, tube formation and the
development of microvessels.[278] Liu et al. (2009) explored the cell and molecular
mechanisms of keratinocyte function in similar in vivo and in vitro studies.[153] Using
C57BL/6J mice, 7 mm excision wounds were made and treated with a topical application of 0.03
units of insulin. In addition, human keratinocytes co-incubated with insulin, were assayed using

73
a cell scratch assay. Both studies demonstrated that topical insulin application to excision
wounds and in human cell culture would result in the migration and differentiation of
keratinocytes. Wounds in mice showed accelerated wound re-epithelialization more rapidly than
controls. The tissue response in culture depended on the activation of the PI3-K and Akt
pathway, followed by the activation of Rac1 and the integrin α3 and the ECM molecule laminin
332. The authors reported that this study helps to identify the critical pathways involved in skin
wound healing and the importance that insulin could have in future biopharmaceutical wound
healing therapies.[153]
Topical insulin delivery has therefore been shown to be beneficial in stimulating re-
epithelialization, angiogenesis and in the recovery of both acute and chronic wounds in vitro and
in vivo. Wound healing technologies that could provide sustained and controlled delivery of
bioactive insulin would be beneficial.
2.9.9 Peptide Delivery
The use of recombinant polypeptides in the clinic has been continually growing for the
past two decades. Whilst growth is rapid, instability and the need for a sustained delivery
vehicle remain. Unlike small molecular weight drugs less than 1 kDa, polypeptides are complex
molecules with molecular weights ranging from 5-200 kDa.[279] Maintaining amino acid
sequence and unique three-dimensional structure is essential for preserving polypeptide
bioactivity and avoiding undesirable immunological reactions.[280,281] Furthermore,
polypeptide delivery has often been accomplished via intravenous infusion, or injection as is
practiced with insulin .[94,282] Unfortunately, these routes of delivery offer little to no
protection from enzymatic degradation, and require frequent dosing to maintain therapeutic
levels within systemic circulation. As a result, careful selection of the delivery vehicle and

74
biomaterial are necessary in designing a peptide delivery system which can stabilize a sensitive
polypeptide.
Microparticles, are an example of a peptide delivery vehicle, used to deliver a variety of
biologicals.[94] Microparticles can be manufactured from several biocompatible biopolymers
and techniques such as emulsification or electrospray. Insulin for example, has been
encapsulated in a variety of delivery vehicles including aqueous insulin solutions,
nano/microparticles and hydrogels.[283,284,285] Various delivery vehicles and biomaterials
that can be used to deliver insulin and other growth factors topically are described in the
following sections.
2.9.9.1 Microencapsulation
Microencapsulation is a technique widely used in pharmaceutics to stabilize and release
peptides and/or drugs. Unlike small molecular weight drugs, recombinant peptides and proteins
are sensitive to enzymatic degradation, shear stress, and changes in temperature and pH.
[286,287] In some cases, microencapsulation has also been used to deliver plasmid DNA,
antisense oligonucleotides, and synthetic double-stranded DNA for gene therapy and other
vaccine applications.[288,289,290] Consequently, microencapsulation utilizes carefully selected
biocompatible polymers and manufacturing techniques to take into account the molecular weight
of the peptide, biological half-life, immunogenicity, conformational stability, dose requirement,
pharmacokinetics and pharmacodynamics, in order to successfully deliver the therapeutic
molecule.[290,291] Microencapsulation is therefore a useful drug delivery technique to
overcome physiological and stability issues associated with the delivery of a recombinant peptide.
Polymeric microparticles are one of the most popular methods to microencapsulate
recombinant peptides, although liposomes and implants such as rods, disks and pellets are

75
sometimes used as well.[292] Microparticles are advantageous because they are small in size
(<1-500 µm), easy to manufacture and can be delivered virtually anywhere within the body
through a single injection, or spread across large surface area.[293] In addition, microparticles
can be prepared from several different types of polymers which are either synthetic or natural.
Characteristically, the polymers used in microencapsulation are biocompatible, demonstrate low
cytotoxicity, biodegrade within a desired time frame, and are usually approved by the FDA for
use in the human body.[294] Since most microparticles are injected within the body, many
formulations use polyesters and other biodegradable polymers to slowly erode and release the
peptide over time. This ensures that after delivery, the microparticles will not remain in the body
risking the chance of becoming lodged in small capillaries or orifices. Some common
biopolymers that are used for peptide delivery include poly(lactic-co-glycolic acid) PLGA,
poly(lactic acid) (PLA), poly(ethylene glycol) PEG, and poly(caprolactones)
(PCL).[94,283,295,296] Table 13 lists common biocompatible polymers used to prepare
microparticles. Applying these polymers, microparticles can be produced using techniques such
as spray drying, emulsion-solvent evaporation, extrusion and electrospraying.[297,298,299]
Depending on the method used, the porosity, size distribution and distribution of peptide within
the polymer matrix can be tailored to suit drug release profiles. Polymeric microparticles are
therefore, effective drug delivery platforms that are well suited to provide sustained, controlled
delivery of peptides such as insulin.
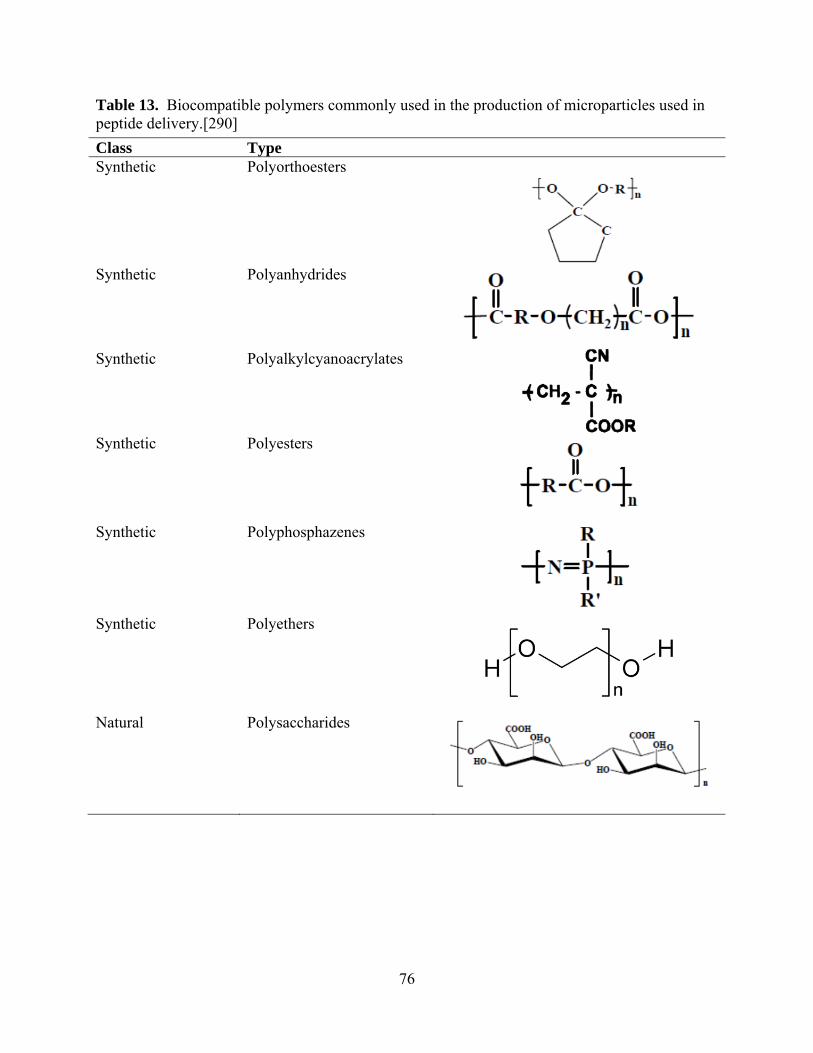
76
Table 13. Biocompatible polymers commonly used in the production of microparticles used in peptide delivery.[290]
Class Type Synthetic Polyorthoesters
Synthetic Polyanhydrides
Synthetic Polyalkylcyanoacrylates
Synthetic Polyesters
Synthetic Polyphosphazenes
Synthetic Polyethers
Natural Polysaccharides

77
2.9.9.2 Poly(lactic-co-glycolic acid)
Poly(lactide-co-glycolic acid) (PLGA) is a biocompatible polymer commonly used in
sustained, controlled release applications. Originally, PLGA was developed as a polymer for
bioabsorbable sutures, however the polymer’s degradation kinetics made it more ideal for
extended drug delivery.[300] Soon after, PLGA became a popular choice for
microencapsulating recombinant proteins,[301] nucleic acids,[302] and small molecular weight
drugs for nearly 30 years.[303] PLGA is approved by the FDA for use in medical devices and
has been incorporated into several pharmaceutical products throughout the world (Table
14).[300,304]
Table 14. Pharmaceuticals which employ the use of PLGA in the drug delivery vehicle to provide sustained and controlled release.
Pharmaceutical/Biological Manufacturer
Lupron Depot TAP Pharmaceutical Products Inc.
Nutropin Depot Genentech Inc.
Sandostatin LAR Novartiz
Trelstar Depot Watson
Zoladex Astrazeneca
Chemically, PLGA is a copolymer of poly(lactic acid) (PLA) and poly(glycolic acid)
(PGA), linked together with an ester bond,[305] as illustrated in Figure 20. The ester bond
hydrolyzes in water, resulting in polymer erosion.[94] According to Houchin and Topp (2008),
the PLGA hydrolysis mechanism proceeds via a tetrahedral intermediate, which produces both a
primary alcohol and a carboxylic acid. The ester functional groups are susceptible to hydrolysis
because the oxygen atoms provide an electron withdrawing effect, which results in a partially
positive ester carbon. Eventually, the accumulation of carboxylic acid hydrolysis products

78
within the PLGA matrix causes additional autocatalysis and the erosion of the matrix. Figure 21
illustrates the reaction mechanism of PLGA hydrolysis. As the PLGA polymer matrix begins to
erode away, small channels form throughout the matrix allowing water to penetrate deep within
the polymer network. The formation of microchannels helps to slowly release the drug or
biological entrapped within the matrix over a slow, and near constant rate. As the matrix begins
to further break down, acidic byproducts accumulate within the central core, eventually resulting
in complete breakdown and fragmentation of the delivery vehicle.[306] Often, this process
results in a large burst of the drug toward the end of the release period, resulting in a biphasic
drug release profile.[307] In some cases, the acidic environment can be harmful to peptides,
resulting in protein degradation and loss of bioactivity. Figure 22 depicts the bulk degradation
process of PLGA microparticles.
PLGA can also be chemically tailored to meet specific physico-chemical properties by
altering the ratio of lactic and glycolic acid, adjusting the molecular weight and changing the
end-cap groups. Characteristics such as degradation rate, glass transition temperatures (Tg),
hydrophobicity, and mechanical strength are all properties that can be adjusted by changing the
ratio of PLA to PGA.[308] By altering the proportions between 25:75, 50:50, 75:50
lactic:glycolic acid, PLGA can be tailored to provide shorter term-or longer term drug release by
varying the degree of crystallinity within the polymer chain, or molecular weight.[308]
Similarly, the polymer end groups can be capped with either ester or carboxlic acid, resulting in a
change to the overall hydrophobicity of the polymer.[309] As more carboxylic end groups are
attached, the hydrophobicity can be lowered to allow greater water uptake and faster hydrolysis
of the peptide.[310] PLGA can therefore be highly tuned to achieve a range of drug release
profiles.

79
Figure 20. The chemical structure of PLGA. Note the ester bond which links the lactic acid moiety to the glycolic acid moiety. The ester bond can be broken by hydrolysis causing the erosion of PLGA with time.
Figure 21. The reaction mechanism illustrating the hydrolysis of PLGA. The R group represents a methyl group for the lactide and H for the glycolide. The sequence can be initiated by the deprotonation from the carboxylic acid by the alcohol, or by the protonation of the alcohol and deprotonation of the carboxylic acid by water.[309]

80
Figure 22. The bulk degradation process of a PLGA microparticle (blue), loaded with a drug (orange). As pores on the surface of the microparticle begin to erode, small microchannels are formed throughout the matrix. This process results in pockets within the microparticle where water and carboxylic acids begin to accumulate as a result of the hydrolysis mechanism. Once the structure of the matrix has been compromised, the entire vehicle collapses and fragments.[305]
PLGA can be formulated into a number of shapes including slabs, films and
microparticles. Commonly though, PLGA microparticles are prepared because they have a
number of favourable characteristics such as having lubricious, smooth, permeable,
biodegradable, and biocompatible qualities.[94,140] For topical insulin delivery, microparticles
are a favourable approach because they can be spread across a large surface area effectively.
Conventionally, PLGA microparticles are formed using techniques such as the water-in-oil-in-
water (W/O/W) emulsion, solvent evaporation method. This approach is advantageous due to its
relative ease in preparation, but does pose a problem in preserving peptide activity.[311] Factors
such as heat and shear forces associated with mixing, and interfacial tension can lead to
unfolding and deactivation of polypeptides.[312,313,314,315] Likewise, polypeptides such as
insulin can be exposed to highly acidic microenvironments within PLGA microparticles, causing
peptide denaturation during the bulk erosion process [316,317,318] To prevent degradation from
occurring, the incorporation of poly(ethylene glycol) (PEG) can also help to preserve peptide
bioactivity and attenuate release kinetics.[144] PLGA microparticles are therefore an effective

81
method of providing peptide delivery when used in combination with other polymers such as
PEG.
2.9.9.3 Summary
Burn wounds are destructive, painful and potentially life threatening injuries that can
require significant medical care, time and inflict great amounts of pain. Currently, wound
dressings such as gauze, hydrocolloids and alginate dressings provide a sufficient temporary
occlusive barrier that enables a debris-free, moist wound healing environment. Unfortunately,
these dressings do not provide any inherent method of accelerating wound closure beyond the
natural rate of healing. Consequently, some investigators have reported that the topical
application of growth factors such as EGF, TGF-β, PDGF and others, are capable of stimulating
angiogenesis, re-epithelialization and a quicker recovery overall. The cost of these growth
factors ($1000-9800 per mg) however, subsequently limits widespread use. Insulin on the other
hand, is an affordable peptide ($1.00 per mg) that has been demonstrated by Rosenthal, Wolfe
and Martins-Green, to be a potent inducer of rapid wound healing. To date, no one has
successfully demonstrated a convenient and effective insulin delivery vehicle which can be used
to increase the rate of wound healing. As a result, a biodegradable, insulin-eluting wound
dressing that could provide sustained, controlled release of insulin from biocompatible materials
would be valuable.

82
Chapter 3
RESEARCH OBJECTIVES
Burns are destructive injuries that result in severe pain and tissue disruption, and thus
require immediate medical attention. A dressing subsequently provides a temporary barrier that
facilitates healing, prevents the entry of microorganisms and debris, absorbs exudate and
maintains a moist wound healing environment conducive for wound healing. Current wound
dressings however, cannot accelerate wound healing beyond the natural rate, often require
frequent dressing changes and cannot be removed easily without triggering additional pain or
tissue destruction. Incorporation of growth factors into wound dressings is also technically
challenging, expensive and difficult to preserve over extended periods of time.
One approach would be to formulate a composite wound dressing capable of releasing
insulin from a natural polymer that absorbs water and forms a stable hydrogel. Alginate foam
wound dressings are of interest because of beneficial healing properties, excellent water handling
characteristics, ease of use, and ability to deliver peptides. Incorporation of PLGA
microparticles loaded with human recombinant crystalline insulin is proposed as a mechanism to
enable sustained, controlled insulin delivery over an extended period of time and across a large
surface area. In order to develop a composite wound dressing capable of insulin release, the
following research objectives were developed.

83
1. Identify a microparticle formulation method that can provide
release of bioactive insulin for up to 21 days at a controlled and
adjustable rate to stimulate wound re-epithelialization.
2. Characterize the release profiles and bioactivity of insulin in a
physiologically relevant in vitro model.
3. Develop a wound dressing in which insulin loaded
microparticles can be embedded and monitored for the insulin
release and bioactivity.
4. Demonstrate accelerated wound healing in a rodent burn model
and characterize the effect of topical insulin delivery on
metabolic and wound healing responses.

84
Chapter 4
MATERIALS AND METHODS
4.1 Materials
PLGA (D,L;50:50, 5-15kDa), human recombinant crystalline insulin (hRcI),
poly(ethylene glycol) (PEG) (Avg. MW 1450 Da and 10 kDa), poly(vinyl alcohol) (PVA) (Avg
MW 13-23 kDa), CaCl2, NaCl, NaOH, and sodium dodecyl sulphate (SDS) were supplied by
Sigma Aldrich (Oakville, Canada). Purasorb 5002 PLGA (D,L;50:50, avg. 17 kDa) was obtained
from Purac Biomaterials (Lincolnshire, USA). Protanal LF10/60 (65-75% guluronic/25-35%
mannuronic) (G) and LF10/60 LS (35-45% guluronic/55-65% mannuronic) (M) were obtained
from FMC Biopolymer (Philadelphia, USA). Bovine serum albumin (BSA) and micro BCA
protein assay kit were obtained through ThermoFisher (Ottawa, Canada). Dichloromethane
(DCM) was supplied by Caledon Labs (Georgetown, Canada). Rat L6 myoblasts were supplied
by ATCC (Manassas, USA). Human keratinocytes (HaCaT) were purchased from Cell Line
Service (Eppelheim, Germany). Dulbecco’s modified Eagle’s medium (DMEM), Dulbeco’s
phosphate buffered saline (DPBS), and 0.25% trypsin with EDTA were obtained through Gibco
(Carlsbad, USA). Fetal bovine serum (FBS) and penicillin-streptomycin were purchased from
Hyclone (Fair Lawn, USA). Fast Activated Cell-based ELISA (FACE) AKT ELISA assay kit
was obtained through Active Motif (Carlsbad, USA). Human insulin ELISA kit was supplied by
Mercodia (Winston Salem, USA).

85
4.2 Methods
4.2.1 Microparticle Preparation
Human recombinant crystalline insulin (hRcI) was microencapsulated by solvent
evaporation method from a solid (insulin crystals)-in-oil-in-water (S/O/W) multiple phase
emulsion method. Microparticles were prepared with 0 (blank), 2.5, 5 and 10% w/w hRcI by
dissolving 90-100 mg of PLGA in 1 mL of dichloromethane (DCM) and combining with 0, 2.5,
5 or 10 mg of hRcI. The suspension was aspirated several times with glass Pasteur pipette to
disperse the crystals, then transferred drop-wise into 30 mL of a chilled aqueous solution of 5%
PVA. The resulting S/O/W emulsion was stirred for 1 min at 430 rpm with a high shear impeller
mixer (Caframo; Wiarton, Canada), then the mixture was poured into a beaker filled with 400
mL distilled water chilled to 5-7°C, and stirred overnight in an ice bath at 200 rpm with a
propeller mixer. The microparticles were collected by vacuum filtration, rinsed 3 times with ice
cold distilled water, and then transferred to a -20°C freezer overnight. The microparticles were
then refrigerated at 4°C for 12 h prior to being placed under vacuum for another 12 h to remove
residual DCM. Microparticles were stored at -20°C when not in use.

86
4.2.2 Encapsulation Efficiency
Microparticles (8-10 mg) were dissolved in 3 mL DCM. DCM was evaporated off, then
the residue was dissolved in 10 mL aqueous 5% SDS, 0.1 M NaOH with stirring at 80 rpm for 24
h at 37°C. Protein concentration was determined by micro BCA protein assay and read
spectrophotometrically at 562 nm. Encapsulation efficiencies (E.E.%) were calculated by taking
the ratio of residual insulin versus the initial insulin added during microparticle formulation. All
samples were measured in triplicate.
4.2.3 Particle Size and Morphology
Mean sphere and pore sizes were determined by measuring at least 1000 microparticles
by hand from SEM images (JEOL 840, USA). To examine the internal morphology,
microparticles were embedded into LR white resin, sectioned and mounted onto copper grids.
TEM images (JEOL 1200EX, USA) were later digitally captured and then analyzed for presence
and location of insulin crystals.
4.2.4 DSC Analysis
Approximately 4 mg of microparticles were placed into aluminum pans that were
hermetically sealed. Both empty and sample pans were placed into a DSC (TA Instruments,
USA), cooled to -30°C and equilibrated for 1 min. Samples were then heated to 110°C and
cooled back to -30°C at a rate of 10°C per min.
4.2.5 In vitro Insulin Release Kinetics from Microparticles
Microparticles (4-6 mg) were added to 2 mL of 20 mM phosphate buffer at pH 7.4 and
mixed on an orbital shaker at 60 rpm and 37°C. Insulin in supernatants was measured by a micro
BCA assay compared to insulin standards. Supernatants were replaced with fresh buffer after
each sampling. All samples were tested in triplicate.

87
4.2.6 Cell Culture of Rat L6 Myoblasts
Rat L6 myoblasts were cultured in T75 flasks containing 15 mL complete DMEM
medium supplemented with 20% FBS and 1% pen-strep. Cells were incubated at 37°C and
maintained in an atmosphere of 5% CO2. When cells reached 80-90% confluence, the medium
was aspirated and cells washed with 15 mL PBS. Cells were then detached with 5 mL of a 0.25%
trypsin and EDTA solution and incubated for 5 min. The trypsin was neutralized with complete
medium, and cells centrifuged at 200 x g for 5 min, then resuspended in 10 mL of fresh complete
medium. Cells were counted by removing 10 µL of cell suspension and combining it with an
equal volume of trypan blue solution. This mixture was vortexed and a sample loaded into a
hemacytometer chamber (Fisher; Pittsburgh, USA) and cells counted under an inverted
microscope (Nikon; Melville, USA).
4.2.7 Cell Culture of HaCaT Cells
HaCaT cells were cultured in T75 flasks containing 15 mL complete DMEM medium
supplemented with 10% FBS and 1% pen-strep. Cells were incubated at 37°C and maintained in
an atmosphere of 5% CO2. Cell passaging and counting were performed as described above for
the L6 myoblasts.
4.2.8 Insulin Bioactivity: FACE AKT ELISA
L6 myoblast cell suspensions were diluted to 112,500 cells/mL in complete medium and
seeded onto 96 well plates (Costar; Lowell, USA) to a final well volume of 200 µL. Cells
reached 80% confluence in 24 h, at which time the cells were washed twice in the wells with
PBS. Then, 200 µL of starvation medium consisting of 99% DMEM and 1% pen-strep were
placed into the wells 6 h prior to stimulation. Cells were then stimulated with starvation medium
used to dilute (i) fresh insulin dissolved in starvation medium to 150 nM; (ii) supernatant

88
containing 150 nM insulin released from microparticles; or (iii) supernatant from placebo
microparticles. Supernatant samples from release experiments were taken from days 1, 7, 14 and
23. After 20 min stimulation, the medium was aspirated off and 100 µL of 4% formaldehyde in
PBS was added. The wells were then processed according to the Fast Activated Cell-based
ELISA (FACE) AKT kit protocol, measuring total AKT and phosphorylated AKT (phospho-
AKT). The level of AKT phosphorylation was normalized for cell density measured by crystal
violet staining. Six replicates were used for each sample.
4.2.9 Insulin Bioactivity by HaCaT Cell Scratch Assay
HaCaT cell suspensions were diluted to 250,000 cells/mL in complete medium and
seeded onto 24 well plates (Costar; Lowell, USA) to a final well volume of 1 mL. Cells formed
a confluent layer 48 h later, at which time a single scratch was made using a 10 µL pipette tip.
All wells were washed twice with 1 mL PBS to remove cellular debris. Then, 500 µL of
starvation medium consisting of DMEM, 2% FBS and 1% pen-strep were used to dilute (i) fresh
insulin to 10-7 M; (ii) supernatant containing 10-7 M insulin released from microparticles; or (iii)
supernatant from placebo microparticles. Supernatant samples from release experiments were
taken from days 1, 7, 14 and 23. Scratches were photographed and width measured using a
bright field inverted microscope (Nikon; Melville, USA) at 0, 4, 24 and 48 h. All samples were
tested in triplicate.
Using the same method above, supernatants obtained from alginate sponge dressing
(ASD) insulin release studies were also tested and compared to the same fresh insulin control. In
some cases, supernatants contained very little insulin making it difficult to achieve the 10-7 M
concentration. The samples which have been affected are indicated in the figure caption. Cell

89
migration across the scratch was measured under a phase contrast inverted microscope (VWR;
Mississauga, Canada) at 0, 4, 24 and 48 h.
4.3 Alginate Sponge Dressing (ASD)
Aqueous alginate solutions (2 and 4% w/v) were prepared by slowly adding alginate M
(high mannuronic content) or G (high guluronic content) powder into 100 mL distilled water,
under high shear mixing. Various quantities of PEG (0.1-10% w/w) with differing molecular
weights (1.45 or 10 kDa) were added to 2% M alginate solutions during the mixing process.
Once all of the constituents were fully dissolved, 0.9 mL were transferred into 24 well plates
(Costar; Lowell, USA). Insulin-loaded PLGA microparticles (5 mg) were then directly deposited
into the wells and mixed briefly. The plates were frozen at -80°C for 1 h, then freeze-dried
(Virtis; Gardiner, USA). Circular alginate sponge dressings (ASD) made from high guluronic
alginate (G-ASD), high mannuronic alginate (M-ASD), and PEG-high mannuronic alginate
(P/M-ASD) were then removed from the wells and stored at -20°C until use.
4.3.1 Scanning Electron Microscopy
External and internal morphologies of the various ASD formulations were characterized
using SEM (JEOL 840, USA). Cross sections were prepared by cutting the circular dressings
using a razor blade and mounting sections on aluminum stubs covered with double-sided carbon
tape. All stubs were gold sputter coated and analyzed.
4.3.2 Physical Properties: Dressing Density
The density of the various ASD was calculated by measuring the dimensions of the
circular sample and the mass (Mettler; Mississauga, Canada). The density was expressed as the
ratio between the mass and its volume.

90
4.3.3 Physical Properties: Tensile Testing
The tensile strength of the various ASD was measured by cutting samples into 5 x 20 mm
rectangular strips. The dimensions were measured using a digital micrometer prior to attachment
to the instrument. The maximum stress (MPa), Young’s modulus (MPa) and elongation at
fracture were obtained using a texture analyzer (TA Instruments, New Castle, USA) with a strain
of 2 mm/min.
4.3.4 Physical Properties: Water Vapour Transmission Rate
The water vapour transmission rate (WVTR) was determined using a method described in
ASTM E96.[319,320] ASD were attached using silicone sealant (GE, Huntsville, USA) to the
underside of an inverted netwell insert (Corning; Lowell, USA), adhered to a polystyrene petri
dish lid. The chamber within the netwell insert was filled with 8 mL distilled water and the
entire apparatus placed into an incubator at 35°C to mimic human skin temperature and a relative
humidity of 33%. The mass of the apparatus was weighed at the beginning of the experiment,
and then 24 h later to record the amount of water lost. WVTR= W/ (A x t), where W is the
weight lost through the membrane, A is the area of the membrane and t is fixed at 24 h.
4.3.5 Physical Properties: Water Absorption Capacity
The water absorption capacity (WAC) of the ASD was tested using a method modified
from that described in the British Pharmacopoeia (BP) monograph for alginate wound dressings
and packings.[321] Individual ASD were weighed (W1) and placed in plastic weigh boats filled
with solution A (142 mM NaCl, 2.5 mM CaCl2), equal to 40 times the mass of the sample. The
ASD were transferred into an incubator at 35°C for 30 min, then removed by lifting the corner
using forceps, and held in suspension for 30 s to remove excess liquid before weighing (W2). The
water absorption capacity was calculated using WAC=(W2-W1) /W1.

91
4.3.6 Insulin Release Kinetics from PLGA Microparticles within ASD
ASD were individually placed inside netwell insert supports, prior to being loaded into 6
well plates filled with 1.5 mL British Pharmacopoeia solution A as the wound exudate
simulant.[321] All plates were covered and sealed with parafilm prior to being placed on an
orbital shaker rotating at 60 rpm at 35°C for up to 21 days. Insulin supernatants were measured
using a human ELISA assay kit using human recombinant insulin as calibration standard. A
cumulative release plot was constructed by adding the quantity of insulin released at each time
point and expressing it as a ratio of the total insulin released over time versus the amount of
insulin initially encapsulated within the microparticles. Supernatants were replaced with fresh
solution A after each sampling.
4.4 Insulin Stability
A 40 mg/L insulin solution was prepared by dissolving crystalline insulin into solution A
at room temperature. Approximately 40 mL insulin solution was transferred into a 50 mL
conical vial (Becton Dickinson; Oakville, Canada) and placed on an orbital shaker rotating at 30
rpm, in an incubator set at 37ºC. Sampling was performed daily by removing a 2 mL aliquot and
storing it at -80ºC until testing. After 5 days of sampling, the aliquots were quickly thawed from
storage and assayed using a micro BCA and human insulin ELISA as per manufacturer’s
instructions.
4.5 Alginate Microbial Contamination Assay
A 2% alginate solution was prepared by thoroughly mixing high M alginate and distilled
water using an impeller mixer. Using a sterile technique, 0.4 mL alginate solution, or distilled
water were spread across 3 tryptase agar plates, and 3 blood agar plates using a glass rod. All
plates were transferred to the incubator set at 37ºC, inverted and colonies counted 48 h later.

92
4.6 Animal Burn Model
Female Sprague Dawley rats (200-240g) were obtained from the University of California
Riverside vivarium and housed under a 12 hour light/dark cycle. All experimental protocols
were approved by the UCR Institutional Animal Care and Use Committee, and animals were
provided with fresh water and standard rat chow. Rats were anesthetized with a single injection
of ketamine (40mg/kg) and xylazine (12mg/kg) intraperitoneally (IP). The depth of anesthesia
prior to the burn, was performed by testing for a lack of responses to tail clamping and foot
pinching. Once anesthetized, hair was removed from the back of the animal’s neck with the aid
of electric clippers and the use of Nair™ (Church & Dwight; Riverside, USA) to remove excess
stubble. A burn with approximately 20-30% TBSA was performed by heating a brass cylinder
with a surface area of 3.1 cm2 in 80ºC for approximately 3 minutes, and contacting the bare skin
for 6 s. Immediately after the burn, an opioid analgesic, buprenorphine 0.05-0.1 mg/kg was
administered to prevent post-burn pain. Each test group was comprised of 4 test (ASD containing
insulin loaded microparticles) and 4 control animals (ASD containing blank microparticles).
4.6.1 Dressing Application and Monitoring
ASD consisting of 1% PEG 1450 and 2% high M alginate was prepared and sterilized
under UV light for 20 min each side prior to application. 100 µL of sterile saline solution was
applied to the contact surface of the ASD and trimmed to fit over the burn. A tegaderm patch
(3M; London, Canada) was applied to secure the ASD in place over the burn. Dressings were
changed every 2-3 days and wounds cleaned with sterile saline to prevent bacterial growth.
Wound traces were performed by placing a cellophane sheet over the wound and tracing the
margins of the wound until re-epithelialization was achieved. Photographs of the wound were
taken using a digital camera at a distance of 4 cm. Blood sugar was monitored using an
93
electronic glucose meter (Bayer; Tarrytown, USA) and animal weight measured using a digital
electronic scale (Mettler Toledo; Columbus, USA).
4.6.2 Tissue Histology
At the conclusion of the animal study, rats were sacrificed using CO2 asphyxiation.
Wound tissue was excised by cutting the skin around the edge of the wound including an area of
5mm of the surrounding unwounded area. Tissues were fixed in 4% paraformaldehyde for 2 h
and incubated in 0.1 M glycine/PBS for 1 h followed by 15% and 30% sucrose prior to
embedding in OCT (Tissue-Tek; Torrance, USA), freezing in a mixture of ethanol/dry ice, and
stored at -80ºC. The migration of keratinocytes with the tissue samples was measured in sections
stained with Hematoxylin and Eosin. The length of the migration tongue was determined by the
distance from the margin of the wound to the tip of the migrating keratinocytes.
4.7 Statistical Analysis
Statistical analysis was conducted with GraphPad Prism 5 and JMPTM. A one-way
ANOVA, followed by a pairwise comparison was performed wherever appropriate with a p=
0.05.

94
Chapter 5
RESULTS AND DISCUSSION
The aim of the present study was to develop an effective method of accelerating burn
wound healing by topical delivery of therapeutic levels of bioactive insulin. This study
represents the first report of a wound dressing designed to provide sustained and controlled
delivery of a bioactive therapeutic, in this case insulin, over a three week period, a time critical
for tissue repair. The investigation was organized into three phases aimed at developing,
characterizing and testing an effective insulin-eluting wound dressing.
Phase 1 was designed to develop a formulation approach, to achieve three weeks of
continuous release of bioactive insulin from polymeric microparticles, at therapeutic levels.
Scanning electron microscopy (SEM), differential scanning calorimetry (DSC), micro BCA and
cell-based assays were used to characterize microparticle morphologies and insulin bioactivity.
The second phase of the study was designed to incorporate the polymeric microparticles
into a dressing material, facilitating application to the surface of a wound, and enabling direct
delivery of bioactive insulin to the wound site. Water (exudate) handling characteristics and
insulin release kinetics were considered over a 3 week period, along with cell-based assays to
assess insulin bioactivity. After an optimal dressing formulation was selected, it was advanced
into the third phase of development.
In the final phase of the study, the efficacy of the designed wound dressing material,
releasing bioactive insulin, was tested on burn wound healing, using a partial-thickness, rodent
burn model. Wound healing was monitored using wound surface area measurements,
photography and histology, while animal weight and blood sugar provided feedback on animal
95
health and insulin tolerance. This aspect of the study was conducted at the laboratory of Prof.
Manuela Martins-Green in the Department of Cell Biology and Neuroscience, University of
California, Riverside.
5.1 Phase 1 – Microparticle Development
Poly(lactic-co-glycolic acid) (PLGA) was selected as the encapsulation polymer, because
of known slow drug release characteristics and biocompatibility.[322] The study began by
testing different molecular weights of PLGA (5-75 kDa) and batch sizes (25-100 mg) to identify
optimal combinations which would reliably emulsify and produce microparticles (Table 15). An
oil-in-water (O/W) emulsion, solvent evaporation technique was used to formulate
microparticles made from 5-15 kDa PLGA. Batch sizes of 25 mg and 50 mg resulted in
significant microparticle loss during transferring and washing, providing a recovery of
approximately 40%, whereas a batch size of 100 mg resulted in higher product recovery of
approximately 95%. The study was repeated a second time using PLGA with a molecular weight
of 40-75 kDa. All formulations failed to produce discrete microparticles and high molecular
weight PLGA was discontinued from further development. During emulsification, the high
molecular weight PLGA would stick to the impeller mixer, failing to disperse into the external
aqueous phase. A final formulation consisting of 100 mg, 5-15 kDa PLGA was found to form
stable and discrete microparticles with a recovery of nearly 95%. The formulation was therefore
selected and carried forward into subsequent formulation studies with insulin.

96
Table 15. PLGA molecular weight and batch size combinations and outcomes.
PLGA Molecular Weight (kDa) Batch Size (mg) Outcome 5-15 25 Microparticles formed, significant product
loss, Approximately <25% remaining 5-15 50 Microparticles formed, product loss noted,
<40% remaining 5-15 100 Microparticles formed, little product loss,
up to 90-95% remaining 40-75 25 No microparticles formed, thick polymer
gel adhering to impeller 40-75 50 No microparticles formed, thick polymer
gel adhering to impeller 40-75 100 No microparticles formed, thick polymer
gel adhering to impeller
Insulin was then combined with PLGA in quantities ranging from 0, 2.5, 5 and 10% per
100mg batch. Initially, aqueous solutions of insulin (Novolin ge; Novo Nordisk, Canada) were
added directly into the PLGA polymer/solvent mixture and emulsified. Repeated encapsulation
attempts resulted in efficiencies of less 4%. Most of the insulin was being lost during the
emulsification and solvent evaporation steps into the surrounding aqueous phase, a common
challenge associated with PLGA microencapsulation of hydrophilic molecules.[323] To
overcome this challenge, bovine and human insulin crystals were encapsulated resulting in
encapsulation efficiencies of 78-100%. Lowering the temperature of the aqueous outer phase
was found to help harden microparticles during the solvent evaporation phase, stabilizing the
crystalline insulin entrapped within. Figure 23 shows the temperature profile of the PVA
solution during the solvent evaporation phase. A low temperature within the first hour is critical
in stabilizing the microparticles and helped to prevent coalescence from taking place. A final
formulation methodology was established and used for all subsequent microparticle batches as
shown in Figure 24.

97
Figure 23. A temperature profile of the aqueous phase containing microparticles undergoing solvent evaporation under gentle stirring.
0 5 10 15 200
5
10
15
20
25
Time (h)
Tem
per
atu
re (C
)

98
Figure 24. Preparation of insulin-loaded PLGA microparticles using a S/O/W emulsification, solvent evaporation technique. Dichloromethane (DCM) and poly(vinyl alcohol) (PVA).

99
5.1.1 Insulin Content in PLGA Microparticles
Microencapsulation of human recombinant crystalline insulin was performed using the
S/O/W emulsion, solvent evaporation technique illustrated in Figure 24. Encapsulation
efficiency was 99 ± 10, 83 ± 8 and 78 ± 1% for loadings of 2.5, 5 and 10% insulin per batch
respectively, showing that at the lowest loading, insulin was essentially fully entrapped.
5.1.2 Particle Size and Morphology
Morphologically, microparticles were discrete with spherical geometries as seen in
Figures 25A-D. The surface appeared highly porous as seen in Figure 25E, and varying amounts
of insulin crystals may be seen protruding from the surface of the microparticles in Figures 25B,
C and D. The mean microparticle diameters for formulations containing 0, 2.5, 5 and 10%
crystalline insulin were 154 + 57, 131 + 92, 153 + 53, and 137 + 52µm respectively. Mean pore
diameters were 318 + 121, 282 + 106, 314 + 126 and 387 + 145nm for microparticles with 0, 2.5,
5 and 10% insulin, respectively. According to Yang et al., the high degree of porosity exhibited
on the surface of the PLGA microparticles is a function of the low temperatures at which the
microparticles are made. The authors reported that solvent diffusion occurs at a much slower
rate from the hardening of microparticles at reduced temperatures.[298] This causes the polymer
to remain semi-solid for a longer period of time, thereby allowing water from the outer aqueous
phase to interact at the particle interface. The small water droplets become entrapped within the
outer layer of the microparticle and either leave a porous structure toward the outer surface of the
microparticle, or migrate into the microparticle as hardening occurs. Insulin crystals seen in
Figure 25F with sharp and distinct edges and composed of various sizes. The mean crystal size
was 4 + 5µm.

100
TEM imaging revealed insulin crystals embedded within the polymer matrix of the
microparticle, as well as at the periphery as seen in Figure 26A. A magnified view of the outer
edge of the microparticles revealed a porous structure going well into the matrix, as illustrated in
Figure 26B.
Figure 25. Shape and surface morphology of microparticles with A) 0%, B) 2.5%, C) 5%, and D) 10% insulin crystal loadings. A highly porous surface structure is visible in panel (E). Recombinant human insulin crystals are shown in (F). White size bar found at the bottom of each image represents 200µm in A-D, 20µm in E and F.

101
Figure 26. TEM cross sectional images of PLGA microparticles with 10% w/w crystalline insulin entrapment. Arrows point to insulin crystals embedded within, and extending out from the surface of PLGA microparticles (A). The highly porous outer region of the PLGA microparticle is highlighted by an arrow (B). Size bars represent 10µm in A and 2µm in B.

102
5.1.3 DSC Analysis
DSC analysis was performed to determine the effect of increasing insulin crystal content
on the glass transition temperature (Tg) of fabricated PLGA microparticles. Thermograms in
Figure 27 illustrate Tg of 13.2°C, 19.4°C, 20.8°C, and 24.0°C for microparticles with 0, 2.5, 5 and
10% insulin respectively. During formulation, PLGA microparticles with highest crystalline
insulin content were noticeably much more rigid when being handled at room temperature.
Bouissou et al. [324] reported Tg of W/O/W formulated PLGA microparticles of 20-29°C
depending on the addition of surfactants in the formulation. The authors also reported that an
added peptide acted like an anti-plasticizing agent, raising the Tg. Higher levels of crystalline
insulin in the present study may have the same effect. Okada et al. (1994) also reported an
increase in Tg with an increase in drug content.[325] Using leuprorelin acetate, a peptide-like
analogue, the authors suggested that the ionic interaction between basic amino acids and the
terminal carboxylic acid groups of the polymer result in stronger molecular interactions that
elevate the Tg. The relationship between Tg and drug content provides insight into approaches
toward manufacturing, handling and storage of microparticles to prevent aggregation and
irreversible coalescence.

103
Figure 27. DSC thermograms for PLGA microparticles loaded with A) 10%, B) 5%, C) 2.5%, and D) 0% crystalline insulin.
5.1.4 Insulin Dissolution
Insulin crystals dissolved instantaneously within 37oC phosphate buffer, and the insulin
solution was then used to construct a standard curve using a micro BCA assay as shown in
Figure 28. This calibration curve was subsequently used to assay for insulin release from
microparticles.

104
Figure 28. A micro BCA assay calibration curve for insulin standards prepared between 1.25-40 µg/mL. 5.1.5 Insulin Release Kinetics
Insulin release kinetics revealed that all microparticle formulations achieved nearly 100%
insulin release over a 25 day period as seen in Figure 29. A burst release of 28-46% was
observed within the first 24h of the assay, followed by a period of near zero order release
kinetics for approximately 10 days thereafter. The rapid dissolution of insulin from crystals
exposed on the surface of the microparticles causes an initial rapid release of insulin into solution,
resulting in a burst effect in the release profile. Figure 25 confirms the presence of large insulin
crystals embedded on the surface of the microparticles, making it possible for rapid dissolution
to take place.
0 10 20 30 40 500.0
0.2
0.4
0.6
0.8
Insulin Concentration (g/mL)
Ab
so
rba
nc
e

105
After the burst phase, the formation of pores and channels within the microparticle matrix
caused by PLGA hydrolysis, resulted in a constant and near-zero order release of insulin for
about 10 days. This process is governed by insulin diffusion through pores and channels in the
microparticle and erosion controlled release by polymer hydrolysis.[326] By days 12-14, all
formulations exhibited a rapid increase in release of approximately 27-29% before reaching a
plateau by day 25. Thus the overall release behavior appeared to be biphasic. Li et al. 2008,[327]
reported a similar secondary burst effect of methotrexate loaded PLGA microparticles and
attribute the secondary burst phase to changes in the physicochemical properties of the PLGA
matrix. During the later stages of PLGA degradation, the porosity and formation of internal
channels increases from PLGA polymer weight loss attributed to polymer hydrolysis.
[327,328,329] This causes drug diffusion to suddenly increase, resulting in a secondary burst to
occur toward the end of the release kinetics profile.[330]

106
Figure 29. Insulin release kinetics from PLGA microparticles containing 2.5-10% insulin.
5.1.6 Insulin Bioactivity: Cellular AKT Phosphorylation Assay
Bioactivity of released insulin was assessed by measuring the induction of the cellular
insulin receptor signaling pathway in rat L-6 myoblasts using a fast activated cell-based AKT
ELISA assay. When insulin binds to insulin-receptor 1, the receptor dimerizes and
autophosphorylates, causing downstream signaling molecules such as AKT to also become
phosphorylated.[331] AKT is an important downstream signaling molecule because it is
responsible for inducing cellular events such as cellular migration, proliferation and other
survival responses to occur.[153,332,333] Unlike chemical structural assay methods such as
HPLC-MS, and UV circular dichroism which provide evidence of primary/secondary structural
integrity, or the presence of degradation products, [310,334,335] ELISA assays directly assess
0 2 4 6 8 10 12 14 16 18 20 22 24 26 280
50
100
150
2.5%5%10%
Days
% C
um
ula
tive
In
suli
n R
elea
se

107
the induction of the insulin receptor signal transduction pathway, which is only achievable
through a biologically active peptide molecule.
By comparing the levels of AKT phosphorylation relative to the activity of a fresh insulin
control at the same protein concentration, insulin bioactivity could be monitored over the 23 day
release period as shown in Figure 30. Released insulin on day 1 was fully active for all
formulations, demonstrating that insulin biological activity was fully retained during and
following the encapsulation protocol. The activity of released insulin then dropped gradually
over the 23 day release period, yet activity remained to the end of 23 days. In general,
microparticles with the lowest loading of insulin showed the highest level of released activity to
14 days. A pairwise comparison for all bioactivities showed that they were statistically
significant (p < 0.05) when compared to placebo microparticle supernatant at time points up to
day 23. A Welch test of means, which accounts for non-equal variances, concluded a significant
difference between the sample and placebo groups. By day 23, the activity of released insulin
ranged from 25- 37%, depending on the formulation. Loss of insulin activity may be attributed
to the acidic microenvironment within the particle due to PLGA hydrolysis [316].
AKT phosphorylation not only indicates the direct bioactivity of insulin, but sheds
light on the potential for wound healing applications. The use of a novel encapsulation technique
incorporating crystalline insulin seems to suggest that the conditions are much milder than more
conventional W/O/W preparation techniques and could be beneficial for other protein therapeutic
formulations. Overall, active insulin continues to be released beyond a three week period,
indicating that long term PLGA mediated insulin delivery is a viable option.

108
Figure 30. Insulin bioactivity measurements for PLGA microparticle formulations with 0-10% w/w crystalline insulin. Asterisks indicate statistical significance between placebo and sample (p= 0.05).
5.1.7 Insulin Bioactivity: Scratch Assay
Scratch repair assays were performed on human HaCaT cells to further investigate the
bioactivity of released insulin. The approximate initial width of the applied scratch was 0.5 mm,
which filled rapidly due to cell migration, stimulated by applied insulin as may be seen in Figure
31. Unlike the AKT ELISA assay that provides information about the ability to induce an
insulin stimulated signal cascade, the scratch assay provides a measure of cell migration, a
process critical for wound healing. Using this model, it was possible to observe whether insulin
bioactivity changes, or remains stable over time of release by comparing microparticle
supernatants collected from days 1, 7, 14 and 23. The amount of insulin-protein applied to the
tissue scratch at the beginning of the assay was 10-7 M for all conditions, with the exception of
supernatant from blank microparticles (0% insulin control), in which case protein free
supernatant was assayed to determine if there was a tissue response to PLGA degradation
products. Figure 31A, B and C represent assays for insulin released from 2.5, 5 and 10% insulin
Day 1 Day 7 Day 14 Day 230
25
50
75
100
125Fresh Insulin Control
2.5%5%10%
0%
**
**
*
*
*
*
* ***
*
Insu
lin B
ioac
tivi
ty (%
)

109
loaded microparticles, respectively. Assay of supernatant from 2.5% insulin loaded
microparticles was most problematic because of the very small quantities of insulin being
released on individual days, which may explain the irregular response as was observed for
example, with insulin sampled on day 14. Clearer and more consistent trends are evident with
insulin released from 5 and 10% insulin microparticles where standardization of insulin-protein
was more accurately conducted. Figure 32 shows photomicrographs taken of the migrating
HaCaT cells after being exposed to insulin released into supernatants obtained from 10% insulin
loaded PLGA microparticles.
The most rapid cell migration in the scratch assay took place between 4 and 24h for cells
exposed to 10-7 M fresh insulin, with cells approaching confluence at 24h, and fully confluent at
48 h. Cell migration was also evident in the absence of insulin, but the differences between
insulin exposed cells and cells growing in absence of insulin were large, and significantly
different based on a one-way ANOVA test followed by a pairwise comparison, beyond 4h of
stimulation. For example, at 24h, percent scratch closure was 84% for cells exposed to fresh
insulin in comparison to 46% for cells migrating in absence of insulin. At 48h, the scratch was
fully closed in the presence of fresh insulin, in comparison to 67% for cells growing in the
absence of insulin. Thus it is clear that insulin strongly stimulates growth and migration of
HaCaT cells.
A comparison may then be drawn between cell migration in presence of insulin released
from PLGA microparticles over the 23 day period, to that of fresh insulin. By 48h, the scratch
was fully closed for all but one supernatant insulin sample. In comparison to the fresh insulin
control, there was no significant difference in tissue response at 4, 24 or 48h for all remaining
supernatant samples. It would then appear that supernatant insulin released to 23 days from all

110
formulations, was fully active, in comparison to fresh insulin when evaluated in terms of tissue
migration response.
Overall, most insulin containing supernatants resulted in full scratch closure within 48 h,
and at a much faster rate than in the absence of insulin, as was observed with supernatants from
blank microparticles. This indicates that released insulin was bioactive, and PLGA degradation
products did not have a stimulatory effect. Therefore, we conclude that the cellular response was
due to the addition of insulin alone. Thus these results show that insulin released over a 23 day
period stimulates the same cell migration response as fresh insulin, indicating a high level of
sustained bioactivity.
A
4 24 480
20
40
60
80
100
120
Day 23
Day 1Day 7Day 14
Fresh Insulin Control0%
Time (h)
**
+
+
++
**
**
**
**
Scra
tch C
losed (%
)

111
B
C
Figure 31. HaCaT cell scratch repair assays evaluating bioactivity of insulin released from 2.5 (A), 5 (B), and 10% (C) insulin loaded PLGA microparticles into supernatants sampled on days 1, 7, 14 and 23 days of sustained release. Single asterisks indicate statistical significance between fresh insulin control and insulin free PLGA supernatant, double asterisk indicates difference between insulin released to supernatant, and fresh insulin control, and plus sign indicates difference between insulin released to supernatant and insulin free PLGA supernatant (p= 0.05).
4 24 480
20
40
60
80
100
120
Day 23
Day 1Day 7Day 14
Insulin Control0%
Time (h)
**
+ +++******
Scr
atch
Clo
sed
(%
)
4 24 480
20
40
60
80
100
120
Day 23
Day 1Day 7Day 14
Fresh Insulin Control0%
Time (h)
**
++
+**
**
**
Scra
tch C
losed (%
)

112
A
Time: 0 h Day 1
Day 7 Placebo
Day 14
Day 23 Insulin Control

113
B
Time: 4 h Day 1
Day 7 Placebo
Day 14
Day 23 Insulin Control

114
C
Time: 24 h Day 1
Day 7 Placebo
Day 14
Day 23 Insulin Control
Figure 32. Phase contrast micrographs of HaCaT scratch wounds with supernatant from 10% insulin-loaded microparticles from days 1, 7, 14 and 23, placebo and fresh insulin control solutions after A) 0 h, B) 4 h and C) 24 h. The vertical lines indicate the margins of the scratch.

115
5.2 Phase 2 - Alginate Sponge Dressing (ASD) Development
Previously, crystalline insulin was encapsulated into PLGA microparticles which
functioned as a drug depot device, having the capability to slowly and controllably deliver
bioactive insulin over a period of 1 month. Microparticles alone are difficult to homogeneously
spread across a wound and secure in position for extended periods. Microparticles also have no
capacity to function as a protective barrier, or to provide an optimal, moist wound healing
environment. A polymer matrix with the ability to protect the wound, absorb exudate, provide a
moist healing environment, and permit insulin diffusion was needed.
A candidate composite polymer blend consisting of alginate and poly(ethylene glycol)
(PEG) was selected as the constituents of the matrix formulation. These two polymers were
selected based upon their inert chemical properties, suitable biocompatibility, and hygroscopic
characteristics.
Formulation development began by defining the process parameters necessary to produce
a robust matrix which could support the incorporation of insulin-loaded microparticles. During
development, design criteria were established to help guide formulation design. Some of the
characteristics included the ability for the dressing to be stored dry, and upon hydration, for a
hydrogel that would facilitate insulin diffusion, and PLGA degradation with time. The matrix
also had to endure ambient temperature storage conditions, resist significant mechanical stress
and conform around uneven skin surfaces. Optimization of the polymer concentrations,
manufacturing techniques and process parameters would enable the formulation of a basic
alginate wound dressing.
An alginate sponge dressing (ASD) made from freeze-dried solutions of alginate and
PEG were selected as the matrix material to support incorporation of insulin-loaded

116
microparticles. ASD was formulated by preparing alginate solutions of 0.3-2.5% and filling
small plastic petri dishes with approximately 5-15 mL of the various alginate solutions. ASDs
were then produced by lyophilizing the solution, resulting in circular ASD as seen in Figure 33.
ASD prepared from fill volumes of >10 mL and alginate concentrations of >1%, were flexible,
uniform and resistant to damage. ASD prepared from alginate solutions <1% and fill volumes
<10 mL were non-uniform in morphology and significantly more fragile. In some cases, large
cracks and holes were formed in the center of the ASD prepared with 5 mL 0.3% alginate as seen
in Figure 34.
Dilute alginate solutions (i.e., <5 mL) and low fill volumes (i.e., 0.3%) caused a meniscus
to form within the petri dish as seen in Figure 34. As the solutions froze, the shape of the
meniscus was retained after lyophilisation. The thinner central portion was delicate and broke
with ease, suggesting that an optimal fill volume and concentration was necessary to avoid this
problem. A fill volume of at least 10 mL and an alginate concentration of 1% consistently
prevented thinning from occurring.
Water absorption was tested by placing ASD into distilled water, to observe the
behaviour of the ASD over several hours. All samples absorbed water rapidly and remained
intact for approximately 4-5h. Beyond 5h, ASD began to slowly dissolve and leave behind small
fragments. With time, the hydrogel network dissociated and resulted in the complete loss of the
ASD. Cross-linking the alginate hydrogel was tested in the subsequent study, to determine if this
approach would help retain the alginate hydrogel structure over a period of time exceeding 5h.

117
Figure 33. ASD prepared from alginate concentrations 0.3-2.5%, and fill volumes ranging from 5-15 mL. ASD prepared with 0.3% alginate solutions and low fill volumes of less than 10 mL were often delicate and contained numerous large cracks.
Figure 34. An ASD prepared with 5 mL 0.3% alginate solution. Note the thinning of the center of the ASD, resulting from the formation of a meniscus during the pouring and lyophilizing process.

118
ASD prepared from 1-4mL, 0.25, 05, 1 and 2% alginate solutions were cross-linked by
rapidly dipping ASD into a solution of calcium chloride, followed by re-lyophilization. Figure
35 shows the dry ASD prior to being crosslinked, and Figure 36 shows the appearance of ASD
after cross-linking with calcium and re-lyophilization. All ASD shown in Figure 37 after
removal from the molds, became brilliant white after cross-linking with calcium, and were
significantly more brittle and stiffer, as opposed to non-cross-linked ASD. Fill volumes and
alginate concentration had no immediate effect on the ASD, other than changing the dimensions
of the ASD. Porosity was completely lost in all samples upon closer examination. The loss of
porosity prevented ASD from swelling, even after sitting in distilled water for 4 h. Cross-linking
with calcium chloride resulted in an ASD which was stiff, unable to swell to form a hydrogel and
brittle. Cross-linking ASD with calcium was determined not to benefit the ASD formulation and
was dropped from further investigation.
Figure 35. Dry ASD prior to being cross-linked with calcium. Samples 1-4, 5-6, 9-12 and 13-16 were prepared from 2, 1, 0.5 and 0.25% alginate solutions and fill volumes of 1-4mL respectively.

119
Figure 36. Dry ASD cross-linked with calcium. Samples 1-4, 5-6, 9-12 and 13-16 were prepared from 2, 1, 0.5 and 0.25% alginate solutions and fill volumes of 1-4mL respectively.
Figure 37. Calcium cross-linked ASD prepared from 2% alginate and fill volumes ranging from 1-4mL (left to right). Note the brilliant white appearance and warped morphology after being cross-linked and lyophilized a second time.

120
The last approach combined PEG with alginate. PEG with a molecular weight of 1-10
kDa and concentrations of 0.1-10% was tested. The sodium alginate (Sigma-Aldrich) previously
used, was also substituted for high mannuronic (high M) and high guluronic (high G) alginates
(FMC Biopolymer) because of its purity and different chemical compositions. ASD was
produced using a similar method as described before. Alginate, water, PEG and insulin-loaded
PLGA microparticles were combined together and poured into multi-well plates. All samples
were frozen and lyophilized using a method described in Figure 38. Each sample was then tested
to measure the effects of formulation characteristics on insulin release kinetics and bioactivity.

121
Figure 38. Alginate, PEG, distilled water and insulin-loaded PLGA microparticles are transferred into a 24 well-plate. The plate is then frozen at -80ºC and lyophilized overnight to yield circular ASD disks.
5.2.1 Encapsulation Efficiency
Prior to incorporating insulin-loaded PLGA microparticles into the ASD, the amount of
insulin loaded was measured. Three microparticle batches were prepared and the mean
crystalline insulin loading of 0.04mg/mg of microparticle determined, representing an 80 + 7%
encapsulation efficiency.

122
5.2.2 Alginate Sponge Dressing (ASD) Morphology
Strength is a critical component of wound dressing and can be influenced by the
morphology and chemical composition of a material. Scanning electron micrographs in Figure
39A-D, revealed a complex, porous microstructure in both high M ASD (M-ASD) and high G
(G-ASD) with clusters of microparticles embedded within the lamellar structure. Distinct
differences in morphology were observed between M-ASD (Figures 39A-B) and G-ASD
(Figures 39C-D). M-ASD revealed a highly corrugated and sharp lamellar structure with pores
having an internal diameter ranging from approximately 6-105µm. G-ASD on the other hand
showed smoother, fold-like lamellar structures with the absence of distinct open porous spaces.
ASD prepared with 0.1-10 % PEG at molecular weight 1.45 kDa (Figure 40A-C), or 10
kDa (Figure 40D-F) were also examined using SEM. The dressings with lowest concentration of
1.45 kDa PEG displayed almost no morphological difference to PEG free M-ASD, revealing
little bulking effect by PEG incorporation. As the PEG concentration increased to 1% (Figure
40B), the corrugated surfaces of the sharp lamellar internal structures became increasingly larger,
and an overall bulking effect of the foam network was observed. As the 1.45 kDa PEG content
was increased to 10% (Figure 40C), the porous lamellar sponge network became covered by a
dense, outer layer of PEG, filling in much of the porous internal spaces.

123
Figure 39. Cross-sectional SEM images of 2% M- (A), 4% M- (B), 2% G- (C), and 4% G- (D) ASD loaded with insulin-PLGA microparticles. White scale bars represent 200µm.
Figures 40D-F show the effects of incorporating 0.1-10% PEG 10 kDa into high M
alginate sponge dressing (P/M-ASD). An immediate bulking effect was apparent with the
incorporation of higher molecular weight 0.1% 10 kDa PEG (Figure 40D). The internal lamellar
structure supporting the pores appeared bulkier and smoother, with less of a corrugated
arrangement than PEG-free M-ASD. As the concentration of 10 kDa PEG increased to 1%, the
open cell internal structure of the P/M-ASD transitioned into aligned and thick, layered sheets of
alginate and PEG (Figure 40E). Finally, as the concentration of 10 kDa PEG increased to 10%
(Figure 40F), the internal open cell structures were completely lost and the P/M-ASD became a
solid mass.
A B
C D

124
Figure 40. Cross sectional SEM images of P/M-ASD prepared with 1.45 kDa PEG at concentrations of 0.1 (A), 1 (B) and 10% (C). Images of P/M-ASD with 10 kDa PEG at concentrations of 0.1 (D), 2 (E) and 10% (F). White scale bars in images A-C and D-F represent 500 and 200 µm respectively.
Scanning electron microscopy revealed that for the most part, both M- and G-ASD had
similar, thin reticulating pore microstructures. As more alginate and PEG were added to the
formulation, the pore walls became noticeably bulkier in size. Shapiro et al. (1997) reported that
as the overall polymer content of a porous material increases, the additional polymer adds to the
bulkiness of the pore walls.[336] Alginate and PEG content therefore played a role in
contributing to the morphology of the pore walls within ASD.
5.2.3 Density of Sponge Dressings
Densities of ASD were measured and are summarized in Table 16. In both M- and G-
ASP, the density doubled in response to a doubling in initial alginate solution concentration from
2-4% in the preparation of the sponge dressing. The effect of adding various concentrations of
PEG with different molecular weights, into G-ASD (formed with 2% alginate), also had an effect
A B C
D E F

125
on final ASD density as shown in Table 17. As PEG concentration increased in P/M-ASD, the
density did so as well. PEG molecular weight did not significantly affect the density of the
P/M-ASD between 1.45 to 10kDa.
Table 16. Densities of M- and G-ASD. 2% M-ASD 4% M-ASD 2% G-ASD 4% G-ASD Density (mg/cm3) 26 + 3 45 + 3 24 + 1 43 + 0.2
Table 17. Density P/M-ASD with 0.1-10%, 1.45 kDa or 10kDa PEG. PEG 1.45 kDa PEG 10 kDa Percent w/v PEG
0.1 1 10 0.1 1 10
Density (mg/cm3)
26 + 1 32 + 4 110 + 7 27 + 2 36 + 4 122 + 4
5.2.4 Tensile Strength of Sponge Dressings
Tensile testing was performed on ASD to determine the influence of alginate type and
PEG content on dressing stiffness, an important property that determines how well a dressing can
stretch around body contours. Young’s modulus (MPa), maximum stress at fracture (MPa), and
the percent elongation at fracture of M- and G-ASD made from 2 and 4% alginate solutions are
summarized in Table 18. In both M- and G-ASD, the Young’s modulus increased with alginate
concentration, indicating a stiffer material. On the other hand, the Young’s modulus showed no
significant difference between M- and G-ASD suggesting that alginate concentration plays more
of a role in controlling ASD stiffness, than alginate chemistry. As alginate concentration was
increased from 2-4%, the tolerated stress before failure increased by about 4-fold. These trends
were similar in both M- and G-ASD, indicating that the alginate chemistry played less of a role
in governing tensile strength, as opposed to the density which was a more influencing factor. On
the other hand, the percent elongation at fracture remained nearly constant across all four of the

126
different formulations. Considering density and tensile strength, denser ASD proved to be much
stiffer, and was not as influenced by the type of alginate used (M or G).
Table 18. Tensile strength of M- and G-ASD. M-ASD G-ASD Alginate Concentration (w/w) 2% 4% 2% 4% Young’s Modulus (MPa) 1.04 + 0.24 9.40 + 5.27 1.04 + 0.73 4.29 + 2.81 Max Stress (MPa) 0.06 + 0.01 0.25 + 0.13 0.04 + 0.04 0.16 + 0.04 Elongation at Fracture (%) 5.31 + 0.72 4.52 + 0.67 5.36 + 1.14 6.16 + 2.08
Alternatively, the incorporation of low and high molecular weight PEG at different
concentrations was further investigated to determine if dressing stiffness could be controlled.
The effect of PEG molecular weight and concentration on tensile strength is illustrated in Table
19. When 1.45 kDa PEG was introduced to M-ASD, an increase of PEG from 0.1% to 1.0%
reduced the Young’s modulus from 5.0 to 2.2 MPa, almost half the original value, indicating that
PEG had initially increased the Young’s modulus in comparison to PEG-free ASD, but then
dropped as PEG concentrations surpassed 0.1%. With PEG concentrations increasing beyond
0.1%, the reduction in stiffness of the sponge was a result of PEG’s plasticizing effect which
increases flexibility and reduces brittleness.[337] Beyond 1% 1.45 kDa PEG, the ASD became
increasingly PEG-based and too fragile to handle.
Table 19. Tensile strength of P/M-ASD prepared from 2% M alginate solutions containing 0.1-10% PEG, 1.45 kDa and 10 kDa.
PEG 1.45 kDa PEG 10 kDa PEG (% w/v) 0.1 1 0.1 1 Young’s Modulus (MPa) 5.0 + 2.1 2.2 + 0.7 0.3 + 0.3 0.6 + 0.3 Max Stress (MPa) 0.13 0.03 0.01 0.02 Elongation at Fracture (%) 5.1 + 1.3 2.41 + 0.5 12.0 + 3.0 4.5 + 0.9

127
The experiment was repeated using P/M-ASD made from 0.1-1%, 10 kDa PEG to
determine if increasing the molecular weight of PEG could have a more significant effect on
reducing the Young’s modulus. The result was an immediate reduction in the Young’s modulus
for preparations containing 0.1% and 1% 10 kDa PEG. The dressings however were so delicate,
that the calculated moduli were nearly baseline, indicating that as the molecular weight of PEG
increases significantly in P/M-ASD, the material becomes too fragile to be physically stretched.
The maximum stress achieved by P/M-ASD containing 10 kDa PEG was nearly zero, indicating
that no matter the PEG content, high molecular weight PEG limits any significant amount of
stretching. At 10% PEG, P/M-ASD was too brittle to test.
5.2.5 Water Vapour Transmission Rate and Water Absorption Capacity of ASD
Water vapour transmission rate (WVTR) and water absorption capacity (WAC) were
determined for 2-4% M- and G-ASD as summarized in Table 20. M- and G-ASD prepared from
solutions of 2% M or G alginates, transmitted between 17-18mg/cm2/h vapour with no
significant difference between preparations. WAC of M- and G-ASD measured between 16-27
mg H2O/mg ASD showing a greater capacity to absorb water in ASD prepared with 2% alginate
solutions versus 4%. WVTR and WAC were also measured on ASD prepared from solutions of
2% M alginate, combined with 0.1-10% 1.45 and 10 kDa PEG, as reported in Table 20. When
1.45 kDa PEG was introduced into the M-ASD, the WVTR jumped to a range of 23-29mg/cm2/h,
which was slightly higher than ASD without PEG. PEG as a hygroscopic material may be acting
as a desiccant, absorbing as opposed to transmitting water vapour through the dressing material.
To determine if PEG molecular weight had an effect, samples with 0.1-10% 10 kDa PEG were
tested. A similar range of WVTR of 24-29mg/cm2/h was measured, indicating that increasing
the PEG molecular weight had little effect on WVTR.

128
Table 20. WVTR and WAC for 2-4% M- and G-ASD. 2% M-ASD 4% M-ASD 2% G-ASD 4% G-ASD WVTR (mg/cm2/h) 17.1 + 0.8 16.7 +0.4 17.9 + 0.4 18.3 + 0.8 WAC (mg H2O/mg ASD) 23.8 + 4.9 16.3 + 1.0 27.2 + 3.5 18.1 + 0.8
Since PEG increased WVTR, it was also important to determine if WAC could be
controlled by varying the amount and molecular weight of PEG. M-ASDs were prepared with
0.1-1.0% 1.45 or 10 kDa PEG, and resulted in a WAC ranging from 15-19mg H2O/mg ASD
(Table 21). When comparing to PEG-free ASD formulation, PEG reduced the absorptive
capacity of the ASD slightly. This effect is due to the reduction in porosity and surface area as
the ASD becomes denser with higher levels of PEG being added to the formulation. Data was
unavailable for dressings with 10% PEG because the dressing material was unstable, dissolving
in the assay solution.
Table 21. WVTR and WAC for ASD prepared from 2% M alginate solutions and combined with 0.1-10% PEG 1.45 kDa and 10 kDa. PEG 1.45 kDa PEG 10 kDa Percent PEG (w/v)
0.1 1 10 0.1 1 10
WVTR (mg/cm2/h)
26.3 + 2.1 28.8 + 2.1 22.9 + 0.8 28.8 + 3.8 26.7 + 3.3 23.8 + 0.8
WAC (mg H2O/mg ASD)
19.0 + 3.9 16.1 + 0.8 - 19.1 + 5.2 15.4 + 1.3 -
Although flexibility and strength are important wound dressing attributes, water
absorption and vapour transfer are equally as important. Since human burn wounds can release
exudate at a rate of 20mg/cm2/h, the ability of a wound dressing to absorb and release moisture
through evaporation ensures that the wound is kept moist, but not wet.[338,339] Moisture is also
an important driving force in PLGA erosion and the diffusion of insulin, so being able to adjust
the formulation to maintain a moist environment is essential. One method of controlling water
absorption capacity was by changing the internal sponge surface area. Lower density M- and G-

129
ASD had highly open, complex porous networks which absorbed up to 30 times its mass in water,
whereas denser materials absorbed much less water. Although this capability is important,
especially in wounds with heavy exudate, retaining such large amounts of moisture can also
promote bacterial growth and impede healing. Quinn et al. (1985) recommended that water
vapour transfer rates for burn wound dressings should range between 8-10mg/cm2/h to sustain
healthy healing.[7] In the present study, M-, G- and P/M-ASD exhibited WVTR values that
were nearly double and triple the recommended range. Although this may suggest that the
wound could dry out, a secondary dressing used to secure the ASD in place over the wound
could also function to reduce the rate of moisture loss.[109] The formulation studies have
therefore demonstrated that polymer content is an important contributor to sponge density, which
in turn influences flexibility, strength and water handling properties.
5.2.6 Insulin Release Kinetics
Insulin release kinetics were measured by placing ASD containing insulin loaded
microparticles, into netwell inserts, held at the air-water interface to mimic the surface of a
wound as illustrated in Figure 41. A calibration curve was constructed using human insulin
ELISA assay (Figure 42) and used to measure insulin release from M- and G-ASD containing 5
mg of insulin-loaded PLGA microparticles as shown in Figure 43. Over 21 days of assay, M-
ASD released a cumulative 6-12% of the entrapped insulin, whereas G-ASD released 3-5% of
the encapsulated insulin. After the initial release, M- and G-ASD provided insulin sustained
release over the following 21 days. M-ASD appeared to maintain near zero order release
kinetics over the assay period, more so than G-ASD which plateaued earlier.
Figure 44 is a plot of insulin released from P/M-ASD prepared with 0.1-10%, 1.45 or 10
kDa PEG. All P/M-ASD released approximately 20-30% of the total entrapped insulin over a 21

130
day period. Almost no immediate release of insulin was observed in any of the P/M-ASD, as
opposed to the PEG-free ASD (Figure 43). Near zero order release kinetics were maintained
until day 14, after which the release kinetics gradually plateaued. Differences in PEG molecular
weight and content did not appear to play a role in P/M-ASD release beyond 14 days, however
significantly improved the amount of insulin detected over the entire study period when
compared to PEG-free ASD. This effect is likely to be the result of PEG’s ability to stabilize
proteins in solution,[340] and also promote a shift in equilibrium towards the liberation of
monomeric forms of the insulin from multimeric configurations,[341] which are
stoichiometrically quantifiable with the ELISA assay. Insulin stability in a wound exudate
simulant solution (British Pharmacopoeia solution A) was verified by sampling a stock insulin
solution over a period of 5 days. A micro BCA and ELISA assay both confirmed that insulin
reactivity remained steady over a 5 day period, indicating that insulin does not undergo
degradation in solution A. These data support the conclusion that PEG may have had a role in
facilitating the release of monomeric insulin from the multimeric configuration, attributed by the
larger amount of insulin measured from P/M-ASD as compared to PEG-free ASD.
Insulin release kinetics were considered over a 21 day period, a time frame critical for
wound healing. ASD with and without PEG released nearly equivalent amounts of insulin
within the first 24 hours. Since all formulations contained the same amount of insulin-PLGA
microparticles, it is possible that the surface bound insulin was first to dissolve in equivalent
proportions. After 5 days, differences in the release kinetics began to appear in PEG-free ASD
which resulted in less insulin being released over the same period of 25 days. Although the
acidic degradation products of PLGA were considered as potentially responsible for reduced
insulin release, it was demonstrated earlier that biologically active insulin was released from

131
PLGA for an extended period of 25 days as verified through two assays. One assay showed high
activity of released insulin through the stimulation of rat L9 myoblasts, phosphorylating Akt
(Figure 30). The second assay (Figure 31), involved measuring HaCaT cell migration following
an applied injury to a cell monolayer. Biologically active insulin is therefore still capable of
being released over a month-long period, a period critical for wound healing.
Figure 41. Placement of ASD into netwell inserts, held within 6 well tissue culture plates. The positioning of the netwell membrane was strategically placed at the air-water interface to mimic the surface of a fresh wound.

132
Figure 42. A representative human insulin ELISA assay calibration curve from 3-200 mU/L.
0 50 100 150 200 2500.0
0.5
1.0
1.5
2.0
Insulin (mU/L)
Ab
sorb
ance
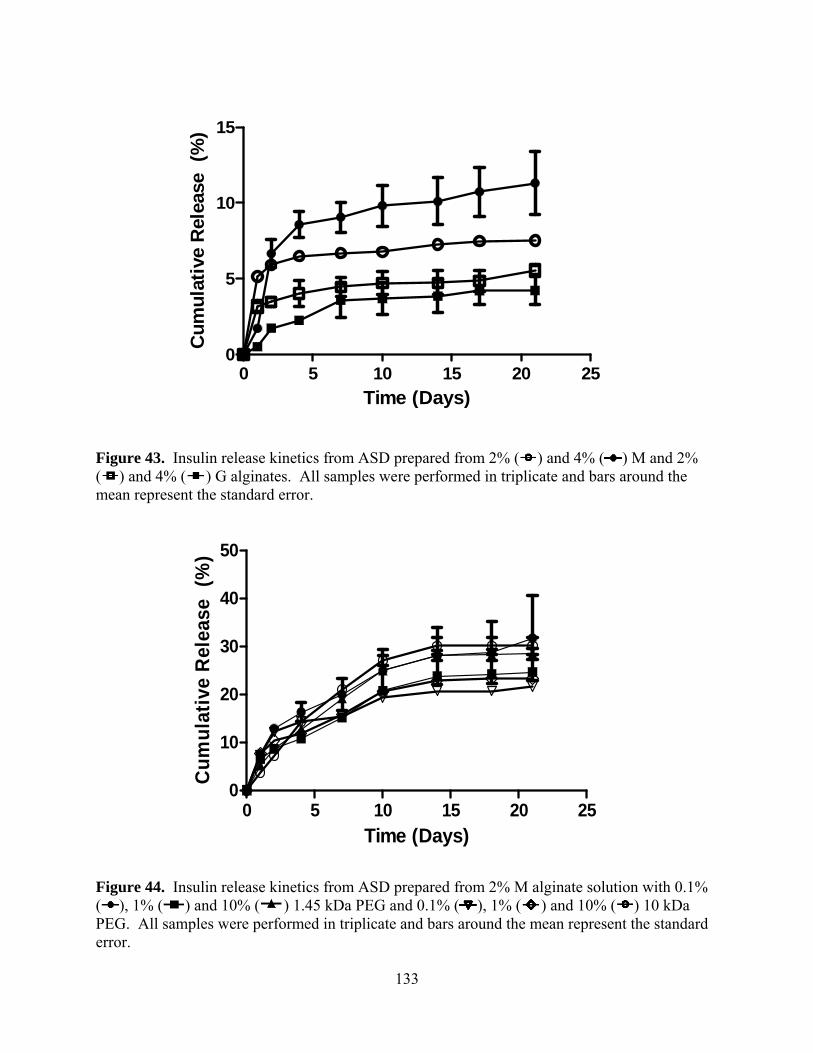
133
Figure 43. Insulin release kinetics from ASD prepared from 2% ( ) and 4% ( ) M and 2% ( ) and 4% ( ) G alginates. All samples were performed in triplicate and bars around the mean represent the standard error.
Figure 44. Insulin release kinetics from ASD prepared from 2% M alginate solution with 0.1% ( ), 1% ( ) and 10% ( ) 1.45 kDa PEG and 0.1% ( ), 1% ( ) and 10% ( ) 10 kDa PEG. All samples were performed in triplicate and bars around the mean represent the standard error.
0 5 10 15 20 250
5
10
15
Time (Days)
Cu
mu
lati
ve R
elea
se
(%)
0 5 10 15 20 250
10
20
30
40
50
Time (Days)
Cu
mu
lati
ve R
elea
se
(%)

134
5.2.7 Bioactivity of Released Insulin: HaCaT Scratch Assay
Wounding experiments were simulated using a cell monolayer scratch assay with a
human keratinocyte cell line (HaCaT) to assess the bioactivity of released insulin. A scratch of
approximately 500 µm in width was made on a confluent layer of HaCaT cells and monitored for
the progression of cell migration upon stimulation with insulin. Figure 45 shows a
representation of (A) HaCaT cells after being freshly scratched and (B) recovery after 48h.
Figures 46 and 47 show the extent of HaCaT cell migration over time to close the scratch, after
stimulation. In cases where ASD were formulated with alginate and PEG, ASD with only 1%
1.45 and 10 kDa PEG were tested.
The greatest stimulation of cell migration took place between 4 and 24h for cells that
were exposed to 10-7 M fresh insulin versus the blank control. By 24h, the scratch was 70%
closed and fully confluent after 48h, whereas the blank insulin-free negative control failed to
achieve full scratch closure in the same period of time. Although some cell migration was
observed, cells treated with blank supernatant only reached 15% and 48% scratch recovery at 24
and 48h respectively. A one-way ANOVA followed by a pairwise comparison indicated a
significant difference between the fresh insulin control and blank alginate control beyond hour 4,
suggesting that insulin has a strong stimulatory effect on the migration of HaCaT cells.
A comparison between insulin released from ASD over a 21 day period and fresh insulin
is also presented in Figures 43 and 44. In all preparations, insulin released after the first day had
the same bioactivity as that of the fresh insulin control and did not differ in performance
statistically, over the 48h scratch assay. When examining the bioactivity of insulin released from
M- and G-ASD (Figure 46A-B), both had reduced bioactivity by day 7 of release. In either case,
supernatants obtained from day 7 only led to a scratch recovery of 16% and 29% for M- and G-

135
ASD respectively. By day 21, the bioactivity of the insulin released from M- and G-ASD had
similar activity to the blank, only recovering 34% and 56% of the scratch respectively. A
comparison between M- and G-ASD revealed that over the course of the scratch assay, insulin
bioactivity was similar for both formulations.
ASD prepared from initial solutions of 2% M ASD with 1% 1.45 or 10 kDa PEG had
prolonged bioactivity of released insulin for at least 10 days, longer than that of insulin from M-
or G-ASD alone (Figure 47A-B). Insulin bioactivity measured on the first day of the assay was
nearly identical for 1.45 and 10 kDa P/M-ASD and comparable to that of the fresh insulin
control. On day 10 however, P/M-ASD supernatants were better able to match the insulin
bioactivity comparable to that of the fresh insulin control, as opposed to M- and G-ASD
containing no PEG. By day 21, insulin bioactivity had diminished and was inactive as compared
to the fresh insulin control.
Overall, insulin bioactivity was maintained for at least 10 days. ASD prepared from 2%
M alginate solutions with 1% PEG 1.45 and10 kDa helped to maintain insulin bioactivity at
levels similar to that of fresh insulin, versus insulin free ASD. No differences were observed in
activity between P/M-ASD prepared with either 1.45 or 10 kDa PEG.
A cell scratch assay to test insulin for bioactivity is based on the ability to promote
changes in cell migration, thus serving as an in vitro model of repair in human epidermal cells.
Insulin released from both M- and G-ASD had strong stimulatory effects after the first day of
release, similar to that of the fresh insulin control. However, by day 7 and beyond, the
bioactivity was reduced relative to the fresh insulin control. Since low quantities of insulin were
being detected during the latter half of the assay, there were often insufficient levels of insulin to
reach target concentrations to fully stimulate HaCaT migration. Furthermore this low

136
concentration of insulin in the supernatants also resulted in HaCaT cells being almost entirely
exposed to release solution A, which lacks many of the nutrients normally obtained from the
starvation media to facilitate migration and normal growth. On the other hand, the presence of
PEG in P/M-ASD sustained insulin bioactivity for up to 10 days. PEG hydrogels have been
shown to protect and preserve peptides in harsh environments.[342] It also appeared that PEG
molecular weight within the dressing does not influence insulin bioactivity while its presence is
necessary to preserve dressing integrity and insulin bioactivity.
Figure 45. A representation of HaCaT cells after being (A) freshly scratched by a pipette tip and (B) after treatment with insulin for 48 hours as seen through an inverted contrast microscope. The vertical bars in (A) indicate the margins of the scratch approximately 500µm in width, with the space between the bars representing the “scratch wound.”

137
A 2% M-ASD
B 2% G-ASD
Figure 46. HaCaT cell scratch assays evaluating bioactivity of insulin released from 2% M- (A), and 2% G- (B) ASD from days 1, 7, and 21. * indicate statistical significance between fresh insulin control and insulin free PLGA supernatant , ** indicates difference between insulin released to supernatant, and fresh insulin control, and + indicates difference between insulin released to supernatant and insulin free PLGA supernatant (p= 0.05). Supernatants from days 7 and 21 in (A) and (B) represent samples in which 10-7 M insulin was difficult to achieve.
4 24 480
20
40
60
80
100
120Fresh Insulin Control0%Day 1Day 7Day 21
*
*
******
**+
+
+
+
Time (h)
Scr
atch
Clo
sed
(%
)
4 24 480
20
40
60
80
100
120Fresh Insulin Control0%Day 1Day 7Day 21
*
***
**
**+++
++
++
Time (h)
Scr
atch
Clo
sed
(%
)

138
A P/M-ASD with 1.45 kDa PEG
B P/M-ASD with 10 kDa PEG
Figure 47. HaCaT cell scratch assays evaluating bioactivity of insulin released from 2% M- with 1% PEG 1.45 kDa (A), and 2% M- with 1% PEG 10 kDa (B) ASD from days 1, 10, and 21. * indicate statistical significance between fresh insulin control and insulin free PLGA supernatant , ** indicates difference between insulin released to supernatant, and fresh insulin control, and + indicates difference between insulin released to supernatant and insulin free PLGA supernatant (p= 0.05). Supernatant from day 21 in (A), and (B) represent samples in which 10-7 M insulin was difficult to achieve.
4 24 480
20
40
60
80
100
120Fresh Insulin Control0%Day 1Day 10Day 21
*
*
**
**
+
**
+
Time (h)
Scr
atch
Clo
sed
(%
)
4 24 480
20
40
60
80
100
120Fresh Insulin Control0%Day 1Day 10Day 21
*
***
**
+
+ +
Time (h)
Scr
atch
Clo
sed
(%
)

139
5.2.8 Alginate Microbial Contamination
Alginate and distilled water were tested for microbial contamination to determine if
bacteria were present in the raw materials used to formulate ASD. Alginates, unlike PEG, are
obtained from natural sources such as kelp and brown algae.[343] During harvesting and
processing, bacteria from the sea can become entrapped and remain in the raw material where it
becomes passed on to the final product.[344] This presents a concern for wounds which may
become infected, but also for the insulin which is entrapped within the alginate sponge matrix.
Bacteria such as Escherichia coli can secrete insulin degrading enzymes (IDE), also known as
protease III, which are capable of hydrolyzing insulin causing the insulin to lose its therapeutic
properties.[207]
Distilled water and 2% M-alginate solutions were tested by plating samples on to tryptase
and blood agar plates and counting colonies reported in Figure 48. Control plates did not
produce any colonies. Only 1 colony was observed on 1 out of 3 plates, on both tryptase and the
blood agar plates, treated with distilled water, meaning that the distilled water had very low
contamination. Aqueous M-alginate solutions plated on tryptase and blood agar resulted in 100
+ 43 and 53 + 16 colonies/mL respectively. M-alginates used in ASD, are sourced from marine
brown algae and considered pharmaceutical grade.[345] Prior to formulating the ASD, the
alginate was not filtered or sterilized, thereby allowing bacteria to remain in the ASD. Leinfeld
et al. (2003) reported that when raw alginate was placed into complete growth medium with 10%
bovine serum albumin and 1% human growth serum, bacterial growth was detected, even after
rigorous post-purification. ASD sterilization will have to be completed, prior to being placed on
a wound to prevent infection.

140
Figure 48. Microbial contamination measured in colonies/mL for distilled water and 2% alginate solutions plated on tryptase and blood agar.
5.2.9 ASD Summary
ASD formulated with 2% M-alginate and 1% 1.45 kDa PEG yielded porous sponges with
favourable flexibility and water handling characteristics necessary for wound dressings. Insulin
was released from these dressings for up to 21 days, while maintaining bioactivity for up to 10
days and potentially longer, with the addition of a small quantity of PEG. In conclusion, an M-
alginate-PEG sponge dressing (P/M-ASD) containing PLGA insulin-loaded microparticles is
capable of delivering bioactive insulin in a sustained and controlled manner over a prolonged
period of time. As a result, this dressing will serve as a candidate ASD in animal trials in the
next phase of testing.
Blank Control Distilled Water 2% Alginate0
50
100
150 Tryptase AgarBlood Agar
Co
lon
ies/
mL

141
5.3 Phase 3 – Animal Studies
A 2% M-alginate and 1% 1.45 kDa PEG candidate dressing was selected to advance into
animal trials using a rodent, partial-thickness burn model. The goal of this study section was to
test the biocompatibility, determine the therapeutic insulin dosing window and assess the
physiological response to insulin delivery through blood glucose monitoring, wound
measurements and histology. Using this information, the effectiveness of alginate sponge
dressings (ASD) was evaluated. In vivo studies were conducted in the laboratory and under the
supervision of Prof. Manuela Martins-Green in the Department of Cell Biology and
Neuroscience at the University of California, Riverside. The animal care protocol established at
the University of California was followed. The initial experiments establishing the test protocols
that were subsequently followed were conducted jointly by Michael Hrynyk with Dr. Yan Liu
(burn surgeon) under the direct supervision of Prof. Martins-Green. For subsequent experiments,
dressings were prepared by Michael Hrynyk, and the wound testing was conducted either by Dr.
Yan Liu, or by Sandeep Dhall under the direct supervision of Prof. Martins-Green. The
responsibilities associated with each experiment are noted in the appropriate sections.
5.3.1 Microparticle Biocompatibility
PLGA microparticles loaded with 10% crystalline insulin were provided to Prof. Martins-
Green who tested for biocompatibility by applying a small, 10mg sample to 7 mm punch wounds
made on the dorsal side of a single Sprague Dawley rat. Changes in wound morphology,
increased swelling, redness, and animal discomfort were monitored as indicators of microparticle
incompatibility. During the first 72h, no signs or symptoms of distress were visible in the animal
after the microparticles had been applied. Shortly after 72h, the rat died from hypoglycemia due
to a sudden release of insulin from the microparticles. The sudden release of insulin was a result

142
of the burst effect from the microparticles and high dose of insulin used. Although this result
ended in death, it gave an early indication that the insulin being released was bioactive, and that
a dose of 26µg/mm2 (a 1 mg insulin dose spread equally over a 7 mm diameter punch wound) is
beyond what a rat can tolerate. The study also demonstrated that applying microparticles in a
saline suspension was difficult. Some microparticles adhered to the administering syringe, thus
resulting in a smaller portion of the sample being transferred to the wound. A matrix material
(dressing) would consequently have to be designed to secure the microparticles uniformly in
place, enabling the diffusion of insulin to the wound.
5.3.2 ASD Biocompatibility
Insulin-free M-ASD pre-treated with and without cross-linking with calcium were
provided to Prof. Martins-Green, who tested for biocompatibility using a similar, 4 circular
punch wound model previously discussed. Four wounds were made on the dorsal side of a
single rat, approximately 1-2 cm apart as seen in Figure 49. Five days later, the control wound in
Figure 50A, was compared to wounds treated with uncross-linked M-ASD in position C, and M-
ASD treated with 100 (B) and 200 mM CaCl2 (D). Wound morphology and signs of
inflammation were examined for any signs of M-ASD incompatibility, or infection. The control
wound (Figure 50A) maintained all adhesive tissue connections around the circumference of the
wound, showing no separation of subcutaneous tissues from the wound margins, or infection. In
contrast, wounds in Figure 50B-D had all become detached, resulting in a skin pocket forming
underneath the margins of the wound. Inflammation and necrosis are also apparent in wounds B
and D, suggesting the presence of an infection. A magnified view shown in Figure 51A shows
the margins of the control wound in comparison to Figure 51B which shows the appearance a
wound treated with the M-ASD alone, and the loss of tissue adhesion. In surgical punch wounds,

143
like the ones used in this study, loss of tissue adhesion, or dehiscence, often result from wound
infections, or high levels of tension applied to the surrounding skin.[346],[347] Since no tension
was applied to the wound, the cause of the dehiscence was most likely attributed to bacteria
which had not been killed during the sterilization process. Ultraviolet (UV) sterilization for this
study was only performed for a maximum of 5 min, and may not have been sufficient to sterilize
the M-ASD. UV sterilization was increased to 20 min/side for all subsequent studies. No
advantage was observed in pre-treating M-ASD with solutions of CaCl2 as well. The additional
fluid retained by the M-ASD made it more difficult to secure, resulting in tearing and loss of the
sample. The M-ASD would have to be applied with a minimal amount of moisture, prior to
application.
Figure 49. Four punch wounds formed on the dorsal side of a Sprague Dawley rat. Wound A) was the blank control, B) 100 mM CaCl2 pre-treatment, C) M-ASD, and D) 200 mM CaCl2.
A B
C D

144
Figure 50. Wounds A) blank control, B) M-ASD 100 mM CaCl2 pre-treatment, C) M-ASD, and D) M-ASD 200 mM CaCl2 pre-treatment 5 days post injury.
A B
C D

145
Figure 51. Wounds 5 days post-injury showing in panel A) a strong connection between subcutaneous tissues and wound margins, in comparison with panel B) showing a separation between the skin and underlying tissues treated with M-ASD.
5.3.3 ASD Pilot Study
The study described in the following sections 5.3.3 - 5.4.3, was conducted by Michael
Hrynyk and burn surgeon Dr. Yan Lin, under the supervision of Prof. Martins-Green. A partial-
thickness scald wound as seen in Figure 52, was produced on the dorsal side of two anesthetised
rats by pressing a heated brass cylinder for 6 sec on the surface of the skin. Prior to placement,
the dressings were sterilized for 20min/side using UV light and secured over the wound using a
single tegaderm patch as seen in Figure 53A-B. The two types of dressings tested, included a
P/M-ASD loaded with 0.25mg insulin and a blank control P/M-ASD.
A
B

146
Figure 52. A partial-thickness scald burn, formed after the application of a brass cylinder held firmly over the skin for 6 sec.
Blood glucose levels were recorded every hour for 7h, followed by two single
measurements taken at 10 and 23h as shown in Figure 54. Baseline blood glucose levels
measured for control and insulin treated rats were 255 and 249mg/dL respectively. Elevated
blood sugar levels are common after anaesthesia, and are attributed to eating prior to surgery.
Saha et al., (2005), reported blood glucose levels of 300mg/dL after providing food and
anaesthetics to rats undergoing minor surgery. The blood glucose levels remained elevated for
up to ten hours, before returning back to 100-168mg/dL without any harm to the animals.[348]
At 23h, the experiment was stopped and the animal was re-evaluated. The blank animal
control showed positive signs of recovery and was unaffected by the burn, or dressing. The
insulin treated animal on the other hand, appeared lethargic and had a drop in blood glucose
levels near 99mg/dL. This was significantly lower than the 168mg/dL measured in the control
animal. This combination of lethargy and low blood glucose indicated that the insulin dose was
too high for the animal, resulting in an adverse reaction. An ASD with a lower insulin dose
would have to be used to avoid such reactions. Another observation revealed that repeated tail-

147
vein bleeding resulted in tail atrophy and added animal stress. The blood sampling method was
discontinued, and moved to other parts of the body such as the paws to minimize localized vein
atrophy.
Figure 53. A P/M-ASD placed over a burn wound covered without a tegaderm patch (A) and with a tegaderm patch (B).
A B

148
Figure 54. Blood glucose levels for control and insulin treatment group over a 23h period. Basal blood glucose levels were recorded at time 0, and continuously measured post P/M-ASD application.
5.3.4 ASD Dosing
The previous results showed that an insulin dose of 0.25mg was too high and needed be
reduced to prevent hypoglycemia. A P/M-ASD with 0.25mg insulin was tested again, but only
allowed to cover 50% and 75% of the total wound surface area. A control rat received a blank
P/M-ASD applied to the entire wound surface area. Blood glucose was monitored for 3 days and
plotted in Figure 55. All three rats had a basal blood glucose level ranging from 190-240mg/dL
after being given anaesthesia. Blood glucose levels in all animals rose to 300mg/dL within 2h
after dressing application and remained steady for several hours. A sharp decrease in blood
glucose levels to 100mg/dL was observed 8h later in all rats, followed by a return to basal levels
54h later. A dressing change performed on all animals after 2 days revealed no signs of infection,
0 5 10 15 20 250
100
200
300
400
500Blank Control0.25mg Insulin P/M ASD
Time (h)
Blo
od
Glu
cos
e (
mg
/dL
)

149
or inflammation suggesting that the sterilization method used, was sufficient to prevent
contamination of the wound. The dressing did however appear dry and nearly completely free of
exudate or blood. Rat skin produces no exudate following a burn injury, unlike human skin
which produces large amounts of exudate to cleanse the wound.[349] Without any exudate to
facilitate the formation of a hydrogel, PLGA degradation and insulin release was limited. A
method of pre-wetting the P/M-ASD would therefore be needed to facilitate hydrogel formation
and insulin diffusion.
Consequently, the blank and 50% P/M-ASD animal subjects were discontinued, while the
rat receiving 75% ASD treatment remained. A dressing change was performed, replacing the
current P/M-ASD with a lower insulin dose (0.125 mg), pre-treated with 75µL sterile saline.
This was performed to provide additional fluid which would help form a hydrogel and facilitate
insulin release from the PLGA microparticles. Blood sugar levels measured 7h after dressing
reapplication had decreased to 100mg/dL, 7h later, suggesting that insulin was diffusing out of
the dressing as intended. A photo of the wound 24h (Day 5 post injury) after applying the wet
dressing showed no signs of infection and only slight inflammation around the margins of the
wound as seen in Figure 56. The experiment was stopped after 144h (6 days), with no obvious
signs of infection or rejection. Moistening the P/M-ASD prior to placement prevented the rat
from removing the dressing overnight and prevented itching. Therefore, a 0.125mg insulin
dressing, pre-moistened with sterile saline was determined to be the best treatment to be carried
forward.

150
Figure 55. Blood glucose levels measured from control and treatment rats over a 72h period. All P/M-ASD formulations resulted in similar blood glucose profiles, with no significant deviations in rats treated with insulin or blank controls. The black arrow indicates the point at which dressings were changed without addition of saline. The red arrow indicates a dressing change along with 75µL of sterile saline.
Figure 56. A photograph of a partial-thickness scald burn, 5 days post injury after being 75% covered with a 0.25mg insulin P/M-ASD. A red ring of inflammation around the margins of the wound is visible as part of the normal healing response. No infection is visible in the wound.
0 50 100 150 2000
100
200
300
400Blank Control50% ASD Wound Coverage75% ASD Wound Coverage
Time (h)
Blo
od
Glu
cose
(m
g/d
L)

151
5.4 Saline Moistened ASD Application with 0.125mg Insulin Dose
5.4.1 Wound Measurements
P/M-ASD loaded with and without 0.125mg insulin were sterilized, pre-moistened with
100 µL sterile saline and applied to three rats in two separate groups. Dressings were changed
every 3 days, until wounds had completely re-epithelialized. Direct wound traces obtained
during dressing changes were compiled into Figures 57A-D and used to plot re-epithelialization
over time in Figure 58. Both control and insulin treated animal groups maintained a steady rate
of re-epithelialization for the first 9 days of healing. On day 12, the insulin treated animals
maintained a steady rate of wound closure of approximately 7% per day until full re-
epithelialization on day 15. This was significantly different than the control animals which
exhibited a period of stagnation between days 12 and 15, resulting in full re-epithelialization by
day 16. Photographs of the wound were taken from animals N4 (control) and N5 (insulin treated)
and shown in Figure 59. Animal I2 in the insulin treatment group did develop an infection on
day 12, which persisted until day 23. The infection resulted in a slower mean re-epithelialization
rate than in the other 2 test animals, which had healed by day 15. Topical insulin delivery
enhanced wound healing and reduced healing times by a full day.

152
A

153
B

154
C

155
D
Figure 57A-D. Wound traces obtained from control group rats treated with P/M-ASD and treatment rats receiving 0.125mg P/M-ASD, following dressing changes every 3 days. Animal I2 had developed a wound infection by day 15, slowing re-epithelialization.

156
0 3 6 9 12 15 18 21 240
20
40
60
80
100
Control0.125mg Insulin P/M-ASD
*
Time (days)
Wo
un
d
Are
a (%
)
Figure 58. Normalized wound areas measurements for control group rats treated with P/M-ASD and treatment rats receiving 0.125mg P/M-ASD with 3 animals in each treatment group. The asterisk denotes significance of p <0.05.

157
Figure 59. Photographs of the burn wounds in both the blank control and insulin treated groups. Note the difference on day 15, where the insulin treated wound is nearly completely healed, while the control wound remains over a significant surface area.

158
5.4.2 Blood Glucose
Blood glucose was recorded and showed no difference between treatment groups within
the first 12h as seen in Figure 60A-B. Normalized blood glucose levels increased within 3 hours
post dressing application, followed by a steady rate of decrease after 12h. The following day,
blood glucose levels leveled in all test groups over a period of 12 days, without significant
deviation. Insulin loaded P/M-ASD therefore, had no systemic effects on lowering blood
glucose levels compared to the control.

159
A
B
Figure 60. Graph (A) shows the normalized blood glucose levels for a period of 12h after the application of the control and insulin loaded P/M-ASD. Graph (B) shows normalized blood glucose levels for the same groups over a 12 day period.
0 3 6 9 120.0
0.5
1.0
1.5Blank ControlInsulin Treatment
Time (h)
No
rmal
ized
Blo
od
Glu
cose
(%
)
0 3 6 9 120.0
0.5
1.0
1.5 Blank ControlInsulin Treatment
Time (Days)
No
rmal
ized
Blo
od
Glu
cose
(%
)
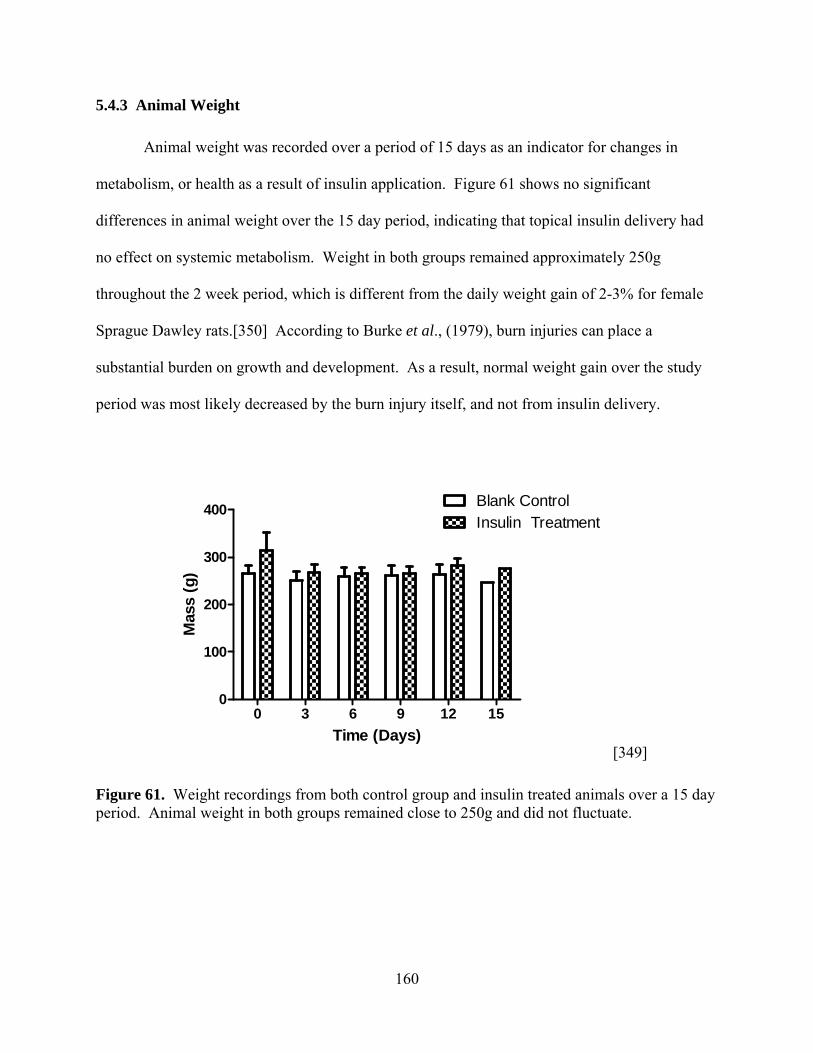
160
5.4.3 Animal Weight
Animal weight was recorded over a period of 15 days as an indicator for changes in
metabolism, or health as a result of insulin application. Figure 61 shows no significant
differences in animal weight over the 15 day period, indicating that topical insulin delivery had
no effect on systemic metabolism. Weight in both groups remained approximately 250g
throughout the 2 week period, which is different from the daily weight gain of 2-3% for female
Sprague Dawley rats.[350] According to Burke et al., (1979), burn injuries can place a
substantial burden on growth and development. As a result, normal weight gain over the study
period was most likely decreased by the burn injury itself, and not from insulin delivery.
[349]
Figure 61. Weight recordings from both control group and insulin treated animals over a 15 day period. Animal weight in both groups remained close to 250g and did not fluctuate.
0 3 6 9 12 150
100
200
300
400Blank ControlInsulin Treatment
Time (Days)
Mas
s (g
)

161
5.4.4 Histology
Hematoxylin and eosin (H&E) staining was performed by Prof. Martins-Green, on tissue
samples obtained from Dr. Yan Liu and Michael Hrynyk at the conclusion of the study period.
Figure 62 shows the position of the epidermal migration tongue which is migrating into the
wound. Rats treated with 0.125mg insulin, applied every 3 days over a 15 day period, resulted in
a longer and thicker migration tongue than control animals. According to Liu et al., (2009)
insulin stimulates keratinocyte migration, resulting in enhanced re-epithelialization. The exact
mechanism is still unknown, however insulin has been shown to stimulate DNA replication and
protein synthesis within keratinocytes.[264],[266] Topical insulin delivery resulted in enhanced
re-epithelialization through faster keratinocyte migration as compared to blank control dressings,
as seen in H&E tissue sections.
Figure 62. H&E stained wound tissue from rats treated with a blank control and insulin loaded P/M-ASD. The blue bar indicates the length of the epidermal migration tongue.

162
Wound tissues obtained at the end of the study from both control and insulin treated
groups were stained with Mason’s trichrome stain for collagen as seen in Figure 63 by Dr. Yan
Liu and analyzed by Prof. Martins-Green. In the insulin treated group, collagen fibers stained
blue, appear thicker, denser and more oriented than compared to the control. In the control
group, collagen fibers appear thinner and not as well organized. According to Bashey et al.,
(1972) insulin is known to increase protein synthesis, either by enhancing the incorporation of
amino acids through the cell membrane, or by an action which is independent of amino acid
transport. Bashey showed that insulin enhanced collagen biosynthesis in vitro, through the
stimulation of proline and lysine hydroxylases, which help with the biosynthesis of collagen.[351]
Topical insulin delivery through the P/M-ASD was able to promote greater biosynthesis of
collagen, potentially promoting keratinocyte migration through the provision of a dense collagen
network.

163
Figure 63. Mason’s trichrome staining performed on tissue samples obtained from control and insulin treated animals. Collagen has been stained blue, and appears in dense, thick and oriented fibers in tissues exposed to insulin, as compared to controls.
5.5 ASD with Low Insulin Dose (0.0625mg)
The present study was performed by Dr. Yan Liu and Sandeep Dhall, under the
supervision of Prof. Martins-Green with samples made by Michael Hrynyk. A half dose of
insulin (0.0625mg) was administered by cutting a P/M-ASD loaded with 0.125mg insulin in half.
Dressings were applied to the same partial-thickness wounds and separated into 2 control rats
and 2 insulin treated rats. Dressings were changed every 3 days for 15 days. Wound surface
area measurements were recorded and plotted in Figure 64. Between day 0 and 3, animals dosed
with insulin showed nearly 10% more epithelialization as compared to control animals. By day 6,
both study groups remained at approximately 75% non-epithelialized. On days 6 to 15, re-
epithelialization was re-established in insulin treated animals, achieving a 30% reduction in

164
wound surface area as compared to the blank control group. A large difference was observed
between control and insulin treatment groups, but was not statistically significant. A possible
reason for this could have been attributed to an inconsistent delivery of insulin. Since the
microparticles are heterogeneously distributed within the dressing, each half would have an
unequal amount of insulin.
Consequently, new P/M-ASD were made with 0.0625mg insulin, relieving the need to
adjust the dose by cutting the dressing in half. Wound surface area measurements were recorded
and plotted in Figure 65, showing the wound area for 4 separate control and 4 insulin treated rats.
Both control and insulin loaded P/M-ASD animal groups had the same rate of recovery
throughout the 22 day period, of approximately 4.5%/day. No significant difference in wound
healing was observed between treated groups, suggesting that the insulin dose was below the
therapeutic threshold to stimulate measurable re-epithelialization. It was decided that full area
dressings would therefore need at least 0.125mg, or 0.04mg/cm2 insulin to induce faster re-
epithelialization when compared to a blank P/M-ASD control.

165
0 5 10 15 200
20
40
60
80
100Blank Control0.06 mg Insulin P/M-ASD
Time (Days)
Wo
un
d A
rea
(%)
Figure 64. A plot of the wound healing response over a 15 day period with 2 control animals treated with blank and 2 control animals treated with insulin-loaded P/M-ASD.
0 5 10 15 20 250
20
40
60
80
100Blank Control0.06 mg Insulin P/M-ASD
Time (Days)
Wo
un
d A
rea
(%)
Figure 65. The wound healing response over a 22 day period of animals treated with full P/M-ASD loaded with 0.0625mg insulin, and blank controls. None of the P/M-ASD were cut. Animal study groups contained 4 rats each.

166
5.6 ASD Repeat Study with 0.125mg Insulin Dose
The present study was performed by Dr. Yan Liu, under the supervision of Prof. Martins-
Green with samples made by Michael Hrynyk. P/M-ASD insulin loaded with 0.125 mg insulin
were tested as full wound area dressings. Dressing changes were performed every three days for
all test groups, at which point wound measurements were also determined. As seen in Figure 66
between days 0 to 3, wound re-epithelialization was significantly greater by 15% in the control
group, as compared to the insulin treated group. From days 3 to 9, wound re-epithelialization
was comparable between both groups, with no significant difference. After day 9, re-
epithelialization in the insulin treated group was comparable to that of the control group. At the
end of the study on day 15, 20% less wound area was measured in the insulin treated group as
compared to the control group. This was a significant difference, however complete wound
healing was not achieved in any of the test groups because the trial was terminated. The results
are comparable to those in section 5.4 supporting the conclusion that a dose of 0.125 mg, or 0.04
mg/cm2 is sufficient to stimulate significant differences in wound recovery over a 2 week period.

167
0 5 10 15 200
20
40
60
80
100Blank Control0.125 mg Insulin P/M-ASD
*
*
Time (Days)
Wo
un
d A
rea
(%)
Figure 66. Wound area plotted over a 15 day period, comparing P/M-ASD loaded with 0.125 mg insulin and blank controls. Dressings were changed every 3 days. Asterisks indicate significance with a p <0.05.
5.7 Verification of ASD Dose and Application Protocol
The present study was performed by Dr. Yan Liu, under the supervision of Prof. Martins-
Green with samples made by Michael Hrynyk. P/M-ASD loaded with 0.125 mg insulin dose
was tested on a group of 4 control and 4 insulin treated animals to verify the effectiveness of the
dose. Wound dressings were changed every 3 days, along with wound area measurements
plotted in Figure 67. Wound re-epithelialization was similar between both control and insulin
treated groups for the first 6 days, with an overall recovery of 45-55% across both groups. On
days 9-12, significant improvements of nearly 10% in wound healing were observed in animals
treated with insulin, as compared to blank P/M-ASD. By the end of the study on Day 22, only 4%
of the wound area remained, as compared to 17% in the control with no significant difference
observed. Overall, the insulin treated animal achieved 13% more re-epithelialization than the
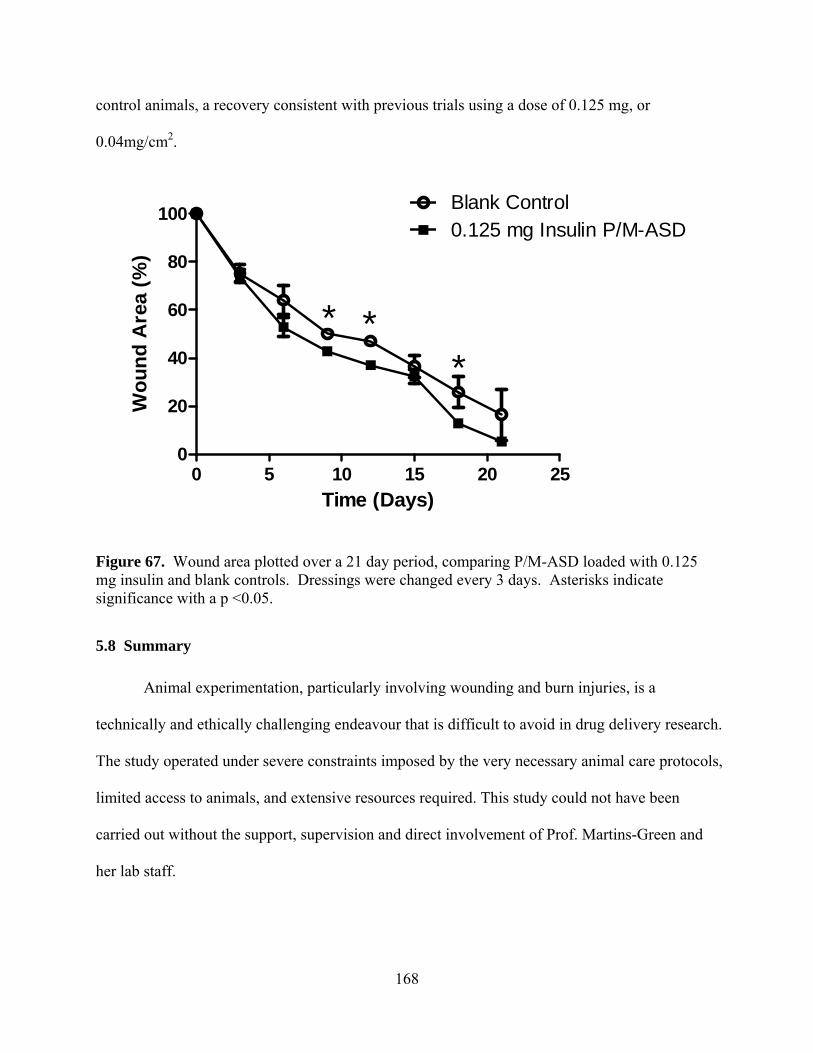
168
control animals, a recovery consistent with previous trials using a dose of 0.125 mg, or
0.04mg/cm2.
0 5 10 15 20 250
20
40
60
80
100Blank Control0.125 mg Insulin P/M-ASD
**
*
Time (Days)
Wo
un
d A
rea
(%)
Figure 67. Wound area plotted over a 21 day period, comparing P/M-ASD loaded with 0.125 mg insulin and blank controls. Dressings were changed every 3 days. Asterisks indicate significance with a p <0.05.
5.8 Summary
Animal experimentation, particularly involving wounding and burn injuries, is a
technically and ethically challenging endeavour that is difficult to avoid in drug delivery research.
The study operated under severe constraints imposed by the very necessary animal care protocols,
limited access to animals, and extensive resources required. This study could not have been
carried out without the support, supervision and direct involvement of Prof. Martins-Green and
her lab staff.
169
In this study, insulin-loaded PLGA microparticles and alginate/PEG sponge dressings
were tested on rats to determine the biocompatibility of the dressing materials, the method of
application and the insulin dose required to stimulate healing. Histology, blood glucose and
animal weight measurements provided information about the healing response on a molecular
level and information about the animal’s ability to cope with exogenous insulin delivery.
Overall, a dose of 0.125 mg, or 0.04mg/cm2 was able to reduce healing times by approximately
25% when applied every 3 days to partial-thickness scald burn wounds.
Burn wound injury itself, is a destructive injury that can causes pain that must be
managed on a constant basis. As a result, the study was limited by the number of study animals
available, thus each experiment and test animal was very carefully considered and planned.
Without having access to large study groups, we have still been able to show that P/M-ASD
containing insulin-loaded PLGA microparticles are capable of improving wound healing as
compared to a blank control dressing. The current P/M-ASD has therefore, demonstrated the
potential for sustained, controlled release of therapeutic peptides, as well as other growth factors,
antibiotics, and pain killers which will be the subject of future studies.

170
Chapter 6
CONCLUSIONS, CONTRIBUTIONS TO KNOWLEDGE AND FUTURE DIRECTIONS
Skin is a dynamic and complex organ that relies on the interaction of different cell types,
biomacromolecules and signaling molecules. When the skin becomes injured, a cascade of
events is triggered to quickly restore the integrity of the skin. Depending on the size and severity
of the wound, a dressing is typically used to provide a temporary barrier to protect the wound
from dehydration, microorganisms and debris. Modern dressings are passive devices comprised
of natural or synthetic fibers. Commonly, pharmaceuticals such as antibiotics and pain killers
are used in conjunction to help with the recovery process. Unfortunately, modern dressings do
not have the ability to promote faster recovery beyond the natural rate of healing. Consequently,
for the first time, a PEG-alginate sponge wound dressing incorporating an insulin delivery device
has been developed to address this issue. Although insulin has been documented to promote
wound healing for the past century, no one has developed a successful delivery system for
insulin to wound administration. As a result, the polymeric microparticle system developed in
this study, has enabled the delivery of bioactive insulin for up to a 1 month period. The
polymeric microparticles have been integrated into a composite wound dressing that supports
moist wound healing, and enables insulin diffusion from the microparticles to the wound.
Partial-thickness rodent burn models have shown that P/M-ASD reduced healing time by about
25%, thereby enabling a faster recovery and restoration of the skin’s integrity.
This study has achieved the four main research goals originally outlined. Using PLGA
microparticles, bioactive insulin delivery was sustained for a period of 25 days and demonstrated
to have the ability to stimulate human keratinocyte migration in vitro. A dressing made from
PEG and alginate was formulated incorporating the insulin-loaded PLGA microparticles.
171
Bioactive insulin release was achieved for nearly 3 weeks, along with favourable water handling
and physical properties conducive for wound healing. Finally, animal testing confirmed that a
constant dose of insulin from P/M-ASD loaded with 0.125mg, or 0.04mg/cm2 insulin, with
dressing changes every 3 days was sufficient to significantly improve wound healing as
compared to an ASD without insulin.
The impact of this technology is significant in several areas of wound care. Firstly, P/M-
ASD was demonstrated to be an effective drug delivery platform from which bioactive insulin
can be released for an extended period of time, an accomplishment that has previously not been
shown. The ability to stabilize bioactive insulin in a harsh wound environment for an extended
period of time was achieved through the use of a highly stable crystalline form of the drug,
which resists degradation during the liberation of acidic by-products during the polymer erosion
process. Subsequently, a major hurdle in microencapsulating peptides in PLGA has been
overcome through the development of this method. The significance of this discovery is that
P/M-ASD can be adapted to deliver not only insulin, but other growth factors, analgesics and
antimicrobials as well. No wound dressing on the market today is capable of providing this
ability. Furthermore, the combination of alginate and PEG have enabled the dressing to be
applied and removed without disturbing de novo tissue formed during the healing process. This
is a substantial improvement over gauze or hydrocolloid dressings that often disturb the wound
bed during dressing changes and contribute to increased scar tissue and pain for the patient.
Therefore, this technology has advanced wound care in two major areas, both in modernizing the
materials from which dressings are made, but also in the delivery of biologicals to ameliorate the
healing process.

172
In future studies, three major areas of research focus will have to be examined to further
refine this technology. The first area of research is examining the dissolution mechanism by
which crystalline insulin dissolves and becomes released from the polymer. Our current
understanding of the insulin release kinetics considers slow influx of water during polymer
erosion results and a gradual dissolution of the crystals over extended period. To understand the
impact of this on the release kinetics, a future study using soluble forms of insulin could help to
elucidate the exact mechanism by which insulin is released, and how it could be further
attenuated. The second area of focus is examining the biochemical events that take place during
the wound healing process during insulin chemotherapy. The current focus has been on the role
of keratinocytes and does not examine the role that fibroblasts have on the wound healing
process. By examining the temporal release of insulin and the biochemical events that stimulate
keratinocyte and fibroblast migration, a better determination of the therapeutic window can be
established. This refinement in dose level and timing can help determine the optimal conditions
under which insulin is released from P/M-ASD to be effective. Finally, the introduction of other
growth factors such as EGF and PDG, along with antimicrobials would be the next step in
advancing the current P/M-ASD formulation. The incorporation of additional growth factors
would enable amplification of insulin’s effects by stimulating different arms of the migration and
proliferation pathways in keratinocytes and fibroblasts. Likewise, the incorporation of
antimicrobials such as peptoids, antibiotics and silver sulfadiazine would help to maintain a
microorganism-free environment and decrease the risk of developing a chronic wound. In
addition, a slow release of pain killers such as lidocaine would reduce pain and improve patient
well-being. As such, the P/M-ASDs are an excellent topical drug delivery platform that offers
the potential to incorporate other molecules to accelerate wound healing.

173
References
Reference List
[1] T. Velnar, T. Bailey, V. Smrkolj, The Wound Healing Process: An Overview Of The Cellular And Molecular Mechanisms, Journal Of International Medical Research. 37 (2009) 1528-1542.
[2] American Burn Association National Burn Repository, Burn Incidence And Treatment In The United States: 2011 Fact Sheet, (2011).
[3] J. Wardrope, J.A. Edhouse, The Management Of Wounds And Burns, 2nd Ed., Oxford University Press, New York, 1999.
[4] J.P. Barret-Nerin, D.N. Herndon, Principles And Practice Of Burn Surgery, 1st Ed., Marcel Dekker, New York, 2005.
[5] D. Queen, J.H. Evans, J.D.S. Gaylor, J.M. Courtney, W.H. Reid, Burn Wound Dressings—A Review, Burns. 13 (1987) 218-228.
[6] G.D. Winter, Formation Of The Scab And The Rate Of Epithelization Of Superficial Wounds In The Skin Of The Young Domestic Pig, Nature. 193 (1962) 293-294.
[7] K.J. Quinn, J.M. Courtney, J.H. Evans, J.D.S. Gaylor, W.H. Reid, Principles Of Burn Dressings, Biomaterials. 6 (1985) 369-377.
[8] J.B. Holcomb, A.E. Pusateri, J.R. Hess, S.P. Hetz, R.A. Harris, B.B. Tock, W.N. Drohan, M.J. Macphee, Implications Of New Dry Fibrin Sealant Technology For Trauma Surgery, Surgical Clinics Of North America. 77 (1997) 943-952.
[9] E.A. Gantwerker, D.B. Hom, Skin: Histology and Physiology of Wound Healing, Facial Plastic Surgery Clinics of North America. 19 (2011) 441-453.
[10] A.J. Vander, J. Sherman, D.S. Luciano, E.P. Widmaier, H. Raff, H. Strang, Human Physiology: The Mechanisms Of Body Function, 9th Ed, Mcgraw-Hill, Boston, 2004.
[11] J. Hardwicke, D. Schmaljohann, D. Boyce, D. Thomas, Epidermal Growth Factor Therapy And Wound Healing — Past, Present And Future Perspectives, Surgeon. 6 (2008) 172-177.
[12] S. Barrientos, O. Stojadinovic, M.S. Golinko, H. Brem, M. Tomic-Canic, Growth Factors And Cytokines In Wound Healing, Wound Repair And Regeneration. 16 (2008) 585-601.
[13] Sigma-Aldrich Inc., Srp4037-50ug Fgf-2 Human, Recombinant Expressed In E. Coli, Http://Www. Sigmaaldrich. Com/Catalog/Product/Sigma/Srp4037?Lang=En&Region=Ca. 2012 (2012).

174
[14] N.G. Markova, L.N. Marekov, C.C. Chipev, S.Q. Gan, W.W. Idler, P.M. Steinert, Profilaggrin Is A Major Epidermal Calcium-Binding Protein, Molecular And Cell Biology. 13 (1993) 613-625.
[15] N.H. Nicol, Anatomy And Physiology Of The Skin, Dermatology Nursing. 17 (2005) 62.
[16] J.G. Marks, J.J. Miller, Structure And Function Of Skin, In: B. Kuhn (Ed.), Principles Of Dermatology, Saunders Elsevier, China, 2006.
[17] R.B. Campen, Blueprints Dermatology, Blackwell Publishing Inc., Malden, Usa, 2004.
[18] S. Rajiv, Achauer And Sood’s Burn Surgery Reconstruction And Rehabilitation, Saunders Elsevier, Philadelphia, 2006.
[19] D.P. Lookingbill, R. Horton, L.M. Demers, N. Egan, J.G. Marks, R.J. Santen, Tissue Production Of Androgens In Women With Acne, Journal Of The American Academy Of Dermatology. 12 (1985) 481-487.
[20] M.F. Holick, Environmental Factors That Influence The Cutaneous Production Of Vitamin D, The American Journal Of Clinical Nutrition. 61 (1995) 638s-645s.
[21] D.F. Brebner, D.M.C.K. Kerslake, J.L. Waddell, The Diffusion Of Water Vapour Through Human Skin, Journal Of Physiology. 132 (1956) 225-231.
[22] G.W. Frame, W.G. Strauss, H.I. Maibach, Carbon Dioxide Emission Of The Human Arm And Hand, Journal Of Investigative Dermatology. 59 (1972) 155-159.
[23] D.N. Herndon, Total Burn Care, Elsevier, China, 2007.
[24] R.M. Lavker, T. Sun, Epidermal Stem Cells: Properties, Markers, And Location, Proceedings Of The National Academy Of Sciences. 97 (2000) 13473-13475.
[25] J.A. Mcgrath, R.A.J. Eady, F.M. Pope, Rook's Textbook Of Dermatology, 7th Ed, Blackwell Publishing, Usa, 2008.
[26] K.M. Halprin, Epidermal Turnover Time - A Re-Examination, British Journal Of Dermatology. 86 (1972) 14-19.
[27] N.G. Jablonski, The Evolution Of Human Skin And Skin Color, Annual Review Of Anthropology. 33 (2004) 585-623.
[28] A.A. Shvedova, C. Kommineni, B.A. Jeffries, V. Castranova, Y.Y. Tyurina, V.A. Tyurin, E.A. Serbinova, J.P. Fabisiak, V.E. Kagan, Redox Cycling Of Phenol Induces Oxidative Stress In Human Epidermal Keratinocytes, Journal Of Investigative Dermatology. 114 (2000) 354-364.

175
[29] J.N.W.N. Barker, C.E.M. Griffiths, B.J. Nickoloff, R.S. Mitra, V.M. Dixit, B.J. Nickoloff, Keratinocytes As Initiators Of Inflammation, The Lancet. 337 (1991) 211-214.
[30] T.S. Kupper, The Activated Keratinocyte: A Model For Inducible Cytokine Production By Non-Bone-Marrow-Derived Cells In Cutaneous Inflammatory And Immune Responses, Journal Of Investigative Dermatology. 94 (1990) 146s-150s.
[31] W.F. Lever, Histopathology Of The Skin, 7th Ed., J.B. Lipponcott Co., Philadelphia, Usa, 1990.
[32] C.R. Goding, Melanocytes: The New Black, International Journal Of Biochemistry And Cell Biology. 39 (2007) 275-279.
[33] J.P. Ortonne, The Effects Of Ultraviolet Exposure On Skin Melanin Pigmentation, Journal Of International Medical Research. 18 (1990) 8c-17c.
[34] C.G. Burkhart, C.N. Burkhart, The Mole Theory: Primary Function Of Melanocytes And Melanin May Be Antimicrobial Defense And Immunomodulation (Not Solar Protection), International Journal Of Dermatology. 44 (2005) 340-342.
[35] T.F.C.S. Warner, H. Uno, R. Hafez, J. Burgess, C. Bolles, R.V. Lloyd, M. Oka, Merkel Cells And Merkel Cell Tumors Ultrastructure, Immunocytochemistry And Review Of The Literature, Cancer. 52 (1983) 238-245.
[36] T. Tachibana, The Merkel Cell: Recent Findings And Unresolved Problems, Archives Of Histology And Cytology. 58 (1995) 379-396.
[37] C.A. Janeway, P. Travers, M. Walport, J.D. Capra, Immunobiology The Immune System In Health And Disease, 4th Ed., Elsevier Science Ltd, New York, Usa, 1999.
[38] S.I. Katz, K. Tamaki, D.H. Sachs, Epidermal Langerhans Cells Are Derived From Cells Originating In Bone Marrow, Nature. 282 (1979) 324-326.
[39] G. Rowden, M.G. Lewis, A.K. Sullivan, Ia Antigen Expression On Human Epidermal Langerhans Cells, Nature. 268 (1977) 247-248.
[40] B. De Saint-Vis, I. Fugier-Vivier, C. Massacrier, C. Gaillard, B. Vanbervliet, S. Aït-Yahia, J. Banchereau, Y. Liu, S. Lebecque, C. Caux, The Cytokine Profile Expressed By Human Dendritic Cells Is Dependent On Cell Subtype And Mode Of Activation, Journal Of Immunology. 160 (1998) 1666-1676.
[41] J.Y. Niederkorn, Effect Of Cytokine-Induced Migration Of Langerhans Cells On Corneal Allograft Survival, Eye. 9 (1995) 215-218.

176
[42] S.D. Bruel, K.H. Bradley, B.A. Hance, M.P. Schafer, R.A. Berg, R.G. Crystal, Control Of Collagen Production By Human Diploid Lung Fibroblasts, Journal Of Biological Chemistry. 255 (1980) 5250-5260.
[43] B. Alberts, A. Johnson, J. Lewis, M. Raff, K. Roberts, P. Walter, Molecular Biology Of The Cell, 4th Ed., Garland Science, New York, Usa, 2002.
[44] G. Erdag, R.L. Sheridan, Fibroblasts Improve Performance Of Cultured Composite Skin Substitutes On Athymic Mice, Burns. 30 (2004) 322-328.
[45] J.M. Sorrell, A.I. Caplan, Fibroblast Heterogeneity: More Than Skin Deep, Journal Of Cell Science. 117 (2004) 667-675.
[46] I. Brody, The Ultrastructure Of The Epidermis In Psoriasis Vulgaris As Revealed By Electron Microscopy, Journal Of Ultrastructure Research. 6 (1963) 595-606.
[47] R.M. Lavker, T. Sun, Heterogeneity In Epidermal Basal Keratinocytes: Morphological And Functional Correlations, Science. 215 (1982) 1239-1241.
[48] R.M. Lavker, T. Sun, Epidermal Stem Cells, Journal Of Investigative Dermatology. 81 (1983) 121s-127s.
[49] I. Brody, The Ultrastructure Of The Tonofibrils In The Keratinization Process Of Normal Human Epidermis, Journal Of Ultrastructure Research. 4 (1960) 264-297.
[50] A.G. Matoltsy, M.N. Matoltsy, The Chemical Nature Of Keratohyalin Granules Of The Epidermis, Journal Of Cell Biology. 47 (1970) 593-603.
[51] F.M. Watt, Involucrin And Other Markers Of Keratinocyte Terminal Differentiation, Journal Of Investigative Dermatology. 81 (1983) 100s-103s.
[52] P.M. Elias, D.S. Friend, The Permeability Barrier In Mammalian Epidermis, Journal Of Cell Biology. 65 (1975) 180-191.
[53] A.V. Rawlings, I.R. Scott, C.R. Harding, P.A. Bowser, Stratum Corneum Moisturization At The Molecular Level, Journal Of Investigative Dermatology. 103 (1994) 731-740.
[54] H.K. Kleinman, M.L. Mcgarvey, J.R. Hassell, V.L. Star, F.B. Cannon, G.W. Laurie, G.R. Martin, Basement Membrane Complexes With Biological Activity, Biochemistry. 25 (1986) 312-318.
[55] C.M. Dipersio, K.M. Hodivala-Dilke, R. Jaenisch, J.A. Kreidberg, R.O. Hynes, Α3β1 Integrin Is Required For Normal Development Of The Epidermal Basement Membrane, The Journal Of Cell Biology. 137 (1997) 729-742.

177
[56] F.L. Chan, S. Inoue, Lamina Lucida Of Basement Membrane: An Artefact, Microscopy Research And Technique. 28 (1994) 48-59.
[57] A. Yen, I.M. Braverman, Ultrastructure Of The Human Dermal Microcirculation: The Horizontal Plexus Of The Papillary Dermis, Journal Of Investigative Dermatology. 66 (1976) 131-142.
[58] H. Bjorklund, C.J. Dalsgaard, C.E. Jonsson, A. Hermansson, Sensory And Autonomic Innervation Of Non-Hairy And Hairy Human Skin, Cell And Tissue Research. 243 (1986) 51-57.
[59] D. Lubach, W. Ludemann, D. Berens Von Rautenfeld, Recent Findings On The Angioarchitecture Of The Lymph Vessel System Of Human Skin, British Journal Of Dermatology. 135 (1996) 733-737.
[60] C.R. Lovell, K.A. Smolenski, V.C. Duance, N.D. Light, S. Young, M. Dyson, Type I And Iii Collagen Content And Fibre Distribution In Normal Human Skin During Ageing, British Journal Of Dermatology. 117 (1987) 419-428.
[61] F.H. Silver, J.W. Freeman, D. Devore, Viscoelastic Properties Of Human Skin And Processed Dermis, Skin Research And Technology. 7 (2001) 18-23.
[62] C. Prost-Squarcioni, S. Fraitag, M. Heller, N. Boehm, Functional Histology Of Dermis, Annales De Dermatologie Et De Venereologie. 135 (2008) 1s5-20.
[63] P.G. Scott, C.M. Dodd, E.E. Tredget, A. Ghahary, F. Rahemtulla, Immunohistochemical Localization Of The Proteoglycans Decorin, Biglycan And Versican And Transforming Growth Factor-Β In Human Post-Burn Hypertrophic And Mature Scars, Histopathology. 26 (1995) 423-431.
[64] S.D. Breul, K.H. Bradley, A.J. Hance, M.P. Schafer, R.A. Berg, R.G. Crystal, Control Of Collagen Production By Human Diploid Lung Fibroblasts. Journal Of Biological Chemistry. 255 (1980) 5250-5260.
[65] K. Sato, The Physiology, Pharmacology, And Biochemistry Of The Eccrine Sweat Glands, Reviews Of Physiology, Biochemistry And Pharmacology. 79 (1977) 51-131.
[66] H.J. Hurley, W.B. Shelley, The Human Aprocrine Sweat Gland: Two Secretions? British Journal Of Dermatology. 66 (1954) 43-48.
[67] M.R. Harkey, The Anatomy And Physiology Of Hair, Forensic Science International. 63 (1993) 9-18.
[68] N. Mandt, A. Troilius, M. Drosner, Epilation Today: Physiology Of The Hair Follicle And Clinical Photo-Epilation, Journal Of Investigative Dermatology. Symposium Proceedings. 10 (2005) 271-274.

178
[69] L.E. Flynn, K.A. Woodhouse, Chapter 14 Burn Dressing Materials And Tissue Engineering, In: R. Narayan (Ed.), Biomedical Materials, Springer, China, 2009.
[70] R.J. Siegle, N.A. Swanson, Nail Surgery: A Review, Journal Of Dermatological Surgery And Oncology. 8 (1982) 659-666.
[71] R.E. Clark, S. Madani, M.S. Bettencourt, Nail Surgery, Dermatology Clinics. 16 (1998) 145-164.
[72] P. Fleckman, C. Allan, Surgical Anatomy Of The Nail Unit, Dermatologic Surgery. 27 (2008) 257-260.
[73] P.J. Franks, C.J. Moffat, Quality Of Life In Patients With Chronic Wounds, Wounds. 10 (1998) 1e-9e.
[74] P. Martin, Wound Healing--Aiming For Perfect Skin Regeneration, Science. 276 (1997) 75.
[75] C. Sussman, B. Bates-Johnson, Wound Care A Collaborative Practice Manual For Health Professionals, Lippincott Williams & Wilkins, Philadelphia, 2007.
[76] J.D. Whitney, Overview: Acute And Chronic Wounds, Nursing Clinics Of North America. 40 (2005) 191-205.
[77] P. Zahedi, I. Rezaeian, S. Ranaei-Siadat, S. Jafari, P. Supaphol, A Review On Wound Dressings With An Emphasis On Electrospun Nanofibrous Polymeric Bandages, Polymer Advanced Techologies. 21 (2010) 77-95.
[78] D. Church, S. Elsayed, O. Reid, B. Winston, R. Lindsay, Burn Wound Infections, American Society For Microbiology. 19 (2006) 403-434.
[79] J.L. Monaco, W.T. Lawrence, Acute Wound Healing: An Overview, Clinics In Plastic Surgery. 30 (2003) 1-12.
[80] H.J. Degreef, How To Heal A Wound Fast, Dermatologic Clinics. 16 (1998) 365-375.
[81] M.A. Fonder, G.S. Lazarus, D.A. Cowan, B. Aronson-Cook, A.R. Kohli, A.J. Mamelak, Treating The Chronic Wound: A Practical Approach To The Care Of Nonhealing Wounds And Wound Care Dressings, Journal Of The American Academy Of Dermatology. 58 (2008) 185-206.
[82] J.F. Byers, S. Bridges, J. Kijek, P. Laborde, Burn Patients' Pain And Anxiety Experiences, Journal Of Burn Care & Rehabilitation. 22 (2001) 144-149.
[83] The Canadian Burn Foundation, The Canadian Burn Foundation: Who We Are. 2012.

179
[84] A. Spinks, J. Wasiak, H. Cleland, N. Beben, A.K. Macpherson, Ten-Year Epidemiological Study Of Pediatric Burns In Canada, Journal Of Burn Care And Research. 29 (2008) 482-488.
[85] J.J. Lorette Jr, J.A. Wilkinson, Alkaline Chemical Burn To The Face Requiring Full-Thickness Skin Grafting, Annals Of Emergency Medicine. 17 (1988) 739-741.
[86] S. Lautenschlager, H.C. Wulf, M.R. Pittelkow, Photoprotection, The Lancet. 370 (2007) 528-537.
[87] B.J. Duffy, P.M. Mclaughlin, M.R. Eichelberger, Assessment, Triage, And Early Management Of Burns In Children, Clinical Pediatric Emergency Medicine. 7 (2006) 82-93.
[88] M.C. Spires, B.M. Kelly, P.H. Pangilinan Jr., Rehabilitation Methods For The Burn Injured Individual, Physical Medicine And Rehabilitation Clinics Of North America. 18 (2007) 925-948.
[89] J.B. Petri, S. König, B. Haupt, U.-. Haustein, K. Herrmann, Molecular Analysis Of Different Phases In Human Wound Healing, Experimental Dermatology. 6 (1997) 133-139.
[90] S. Guo, L.A. Dipietro, Factors Affecting Wound Healing, Journal Of Dental Research. 89 (2010) 219-229.
[91] J.S. Boateng, K.H. Matthews, H.N.E. Stevens, G.M. Eccleston, Wound Healing Dressings And Drug Delivery Systems: A Review, Journal Of Pharmaceutical Science. 97 (2008) 2892-2923.
[92] D. Queen, J.D.S. Gaylor, J.H. Evans, J.M. Courtney, W.H. Reid, The Preclinical Evaluation Of The Water Vapour Transmission Rate Through Burn Wound Dressings, Biomaterials. 8 (1987) 367-371.
[93] L. Lamke, G.E. Nilsson, H.L. Reithner, The Evaporative Water Loss From Burns And The Water-Vapour Permeability Of Grafts And Artificial Membranes Used In The Treatment Of Burns, Burns. 3 (1977) 159-165.
[94] I.T. Degim, N. Çelebi, Controlled Delivery Of Peptides And Proteins, Current Pharmaceutical Design. 13 (2007) 99-117.
[95] S. Werner, R. Grose, Regulation Of Wound Healing By Growth Factors And Cytokines, Physiological Reviews. 83 (2003) 835-870.
[96] G.M. Gordillo, C.K. Sen, Revisiting The Essential Role Of Oxygen In Wound Healing, The American Journal Of Surgery. 186 (2003) 259-263.
[97] A.J. Singer, R.A.F. Clark, Cutaneous Wound Healing, The New England Journal Of Medicine. 341 (1999) 738-747.

180
[98] P. Ten Dijke, K.K. Iwate, Growth Factors For Wound Healing, Nature Biotechnology. 7 (1989) 793-798.
[99] R.F. Diegelman, M.C. Evans, Wound Healing: An Overview Of Acute, Fibrotic And Delayed Healing. Frontiers In Bioscience. 9 (2004) 283-289.
[100] P.A. Efron, L.L. Moldawer, Cytokines And Wound Healing: The Role Of Cytokine And Anticytokine Therapy In The Repair Response, Journal Of Wound Care And Rehabilitation. 25 (2004) 149-160.
[101] S.S. Cheon, P. Nadesan, R. Poon, B.A. Alman, Growth Factors Regulate Β-Catenin-Mediated Tcf-Dependent Transcriptional Activation In Fibroblasts During The Proliferative Phase Of Wound Healing, Experimental Cell Research. 293 (2004) 267-274.
[102] M.B. Witte, A. Barbul, General Principles Of Wound Healing, Surgical Clinics Of North America. 77 (1997) 509-528.
[103] S. Barrientos, O. Stojandinovic, M.S. Golinko, H. Brem, M. Tomic-Canic, Growth Factors And Cytokines In Wound Healing, Wound Repair And Regeneration. 16 (2008) 585-601.
[104] M.C. Miller, J. Nanchahal, Advances In The Modulation Of Cutaneous Wound Healing And Scarring, Biodrugs. 19 (2005) 363-381.
[105] D. Shin, K.W. Minn, The Effect Of Myofibroblasts On Contracture Of Hypertrophic Scar, Plastic And Reconstructive Surgery. 113 (2004) 633-640.
[106] D. Queen, J.D.S. Gaylor, J.H. Evans, J.M. Courtney, W.H. Reid, The Preclinical Evaluation Of The Water Vapour Transmission Rate Through Burn Wound Dressings, Biomaterials. 8 (1987) 367-371.
[107] G. Majno, The Healing Hand: Man And Wound In The Ancient World, Harvard University Press, Cambridge, 1975.
[108] C.K. Field, M.D. Kerstein, Overview Of Wound Healing In A Moist Environment, The American Journal Of Surgery. 167 (1994) S2-S6.
[109] S. Seaman, Dressing Selection In Chronic Wound Management, Journal Of The American Podiatric Medical Association. 92 (2002) 24-33.
[110] H.C. Segal, B.J. Hunt, K. Gilding, The Effects Of Alginate And Non-Alginate Wound Dressings On Blood Coagulation And Platelet Activation, Journal Of Biomaterials Applications. 12 (1998) 249-257.
[111] Y. Qin, Alginate Fibres: An Overview Of The Production Processes And Applications In Wound Management, Polymer International. 57 (2008) 171-180.
181
[112] H. James, Wound Dressings In Accident And Emergency Departments, Accident And Emergency Medicine. 2 (1994) 87-93.
[113] J.A. Rowley, G. Madlambayan, D.J. Mooney, Alginate Hydrogels As Synthetic Extracellular Matrix Materials, Biomaterials. 20 (1999) 45-53.
[114] G.T. Grant, E.R. Morris, D.A. Rees, Biological Interactions Between Polysaccharides And Divalent Cations: The Egg Box Model, Febs Letters. 32 (1973) 195-198.
[115] T. Gilchrist, A.M. Martin, Wound Treatment With Sorbsan — An Alginate Fibre Dressing, Biomaterials. 4 (1983) 317-320.
[116] S.E. Barnett, S.J. Varley, The Effects Of Calcium Alginate On Wound Healing, Annals Of The Royal College Of Surgeons Of England. 69 (1987) 153-155.
[117] A. Thomas, K.G. Harding, K. Moore, Alginates From Wound Dressings Activate Human Macrophages To Secrete Tumour Necrosis Factor-Α, Biomaterials. 21 (2000) 1797-1802.
[118] J.M. Porter, A Comparative Investigation Of Re-Epithelialisation Of Split Skin Graft Donor Areas After Application Of Hydrocolloid And Alginate Dressings, British Journal Of Plastic Surgery. 44 (1991) 333-337.
[119] D. Walker, Back To Basics: Choosing The Correct Wound Dressing, American Journal Of Nursing. 96 (1996) 35-39.
[120] S. Safi, M. Morshed, S.A. Hosseini Ravandi, M. Ghiaci, Study Of Electrospinning Of Sodium Alginate, Blended Solutions Of Sodium Alginate/Poly(Vinyl Alcohol) And Sodium Alginate/Poly(Ethylene Oxide), Journal Of Aplied Polymer Science. 104 (2007) 3245-3255.
[121] Y.S. Choi, S.R. Hong, Y.M. Lee, K.W. Song, M.H. Park, Y.S. Nam, Study On Gelatin-Containing Artificial Skin: I. Preparation And Characteristics Of Novel Gelatin-Alginate Sponge, Biomaterials. 20 (1999) 409-417.
[122] H.L. Lai, A. Abu'khalil, D.Q.M. Craig, The Preparation And Characterisation Of Drug-Loaded Alginate And Chitosan Sponges, International Journal Of Pharmaceutics. 251 (2003) 175-181.
[123] D. Roh, S. Kang, J. Kim, Y. Kwon, H. Young Kweon, K. Lee, Y. Park, R. Baek, C. Heo, J. Choe, J. Lee, Wound Healing Effect Of Silk Fibroin/Alginate-Blended Sponge In Full Thickness Skin Defect Of Rat, Journal Of Materials Science. Materials In Medicine. 17 (2006) 547-552.
[124] C.P. Reis, A.J. Ribeiro, S. Houng, F. Veiga, R.J. Neufeld, Nanoparticulate Delivery System For Insulin: Design, Characterization And In Vitro/In Vivo Bioactivity, European Journal Of Pharmaceutical Sciences. 30 (2007) 392-397.

182
[125] J.M. Liptak, An Overview Of The Topical Management Of Wounds, Australian Veterinary Journal. 75 (1997) 408-413.
[126] L. Heller, S.L. Levin, C.E. Butler, Management Of Abdominal Wound Dehiscence Using Vacuum Assisted Closure In Patients With Compromised Healing, The American Journal Of Surgery. 191 (2006) 165-172.
[127] G. Winter, Epidermal Wound Healing Under A New Polyurethane Foam Dressing (Lyofoam), Plastic & Reconstructive Surgery. 56 (1975) 531-537.
[128] C.A. Worley, So, What Do I Put On This Wound? Making Sense Of The Wound Dressing Puzzle: Part Ii, Dermatology Nursing. 17 (2005) 204-205.
[129] G.T. Lionelli, W.T. Lawrence, Wound Dressings, Surgical Clinics Of North America. 83 (2003) 617-638.
[130] J.C. Lawrence, Dressings And Wound Infection, American Journal Of Surgery. 167 (1994) 21s-24s.
[131] L.G. Ovington, Hanging Wet-To-Dry Dressings Out To Dry, Home Healthcare Nurse. 15 (2001) 477-483.
[132] R.B. Ponder, D. Krasner, Gauzes And Related Dressings, Ostomy Wound Management. 39 (1993) 48-60.
[133] S. Baranoski, Choosing A Wound Dressing, Part 1, Nursing. 38 (2008) 60-61.
[134] S.M.E. Cockbill, T.D. Turner, The Development Of Wound Management Products. In Chronic Wound Care: A Clinical Source Book For Professionals, 4th Ed., Hmp Communications, (2007).
[135] T. Helfman, L. Ovington, V. Falanga, Occlusive Dressings And Wound Healing, Clinical Dermatology. 12 (1994) 121-127.
[136] K.E. Campbell, D. Keast, G. Woodbury, P. Houghton, Wear Time In Two Hydrocolloid Dressings Using A Novel In-Vivo Model, Wounds. 15 (2003) 40-48.
[137] M.C. Varghese, A.K. Balin, D.M. Carter, D. Caldwell, Local Environment Of Chronic Wounds Under Synthetic Dressings, Archives Of Dermatology. 122 (1986) 52-57.
[138] J.L. Drury, D.J. Mooney, Hydrogels For Tissue Engineering: Scaffold Design Variables And Applications, Biomaterials. 24 (2003) 4337-4351.
[139] D.A. Morgan, Wound Management Products In The Drug Tariff, The Pharmaceutical Journal. 263 (1999) 820-825.

183
[140] J.S. Boateng, K.H. Matthews, H.N.E. Stevens, G.M. Eccleston, Wound Healing Dressings And Drug Delivery Systems: A Review, Journal Of Pharmaceutical Science. 97 (2008) 2892-2923.
[141] Z. Ajji, I. Othman, J.M. Rosiak, Production Of Hydrogel Wound Dressings Using Gamma Radiation, Nuclear Instruments And Methods In Physics Research, Section B. 229 (2005) 375-380.
[142] P.H. Corkhill, C.J. Hamilton, B.J. Tighe, Synthetic Hydrogels Vi. Hydrogel Composites As Wound Dressings And Implant Materials, Biomaterials. 10 (1989) 3-10.
[143] J.M. Harris, Poly(Ethylene Glycol) Chemistry: Biotechnical And Biomedical Applications, Plenum Press, New York, 1992.
[144] C. Lin, K. Anseth, Peg Hydrogels For The Controlled Release Of Biomolecules In Regenerative Medicine, Pharmaceutical Research. 26 (2009) 631-643.
[145] D.T. Rovee, Evolution Of Wound Dressings And Their Effects On The Healing Process, Clinical Materials. 8 (1991) 183-188.
[146] D. Queen, J.D.S. Gaylor, J.H. Evans, J.M. Courtney, W.H. Reid, Evaluation Of Gaseous Transmission (O2 And Co2) Through Burn Wound Dressings, Burns, Including Thermal Injury. 13 (1987) 357-364.
[147] P. Wu, A.C. Fisher, P.P. Foo, D. Queen, J.D.S. Gaylor, In Vitro Assessment Of Water Vapour Transmission Of Synthetic Wound Dressings, Biomaterials. 16 (1995) 171-175.
[148] W.H. Eaglstein, Experiences With Biosynthetic Dressings, Journal Of The American Academy Of Dermatology. 12 (1985) 434-440.
[149] G. Walsh, Biopharmaceuticals: Recent Approvals And Likely Directions, Trends In Biotechnology. 23 (2005) 553-558.
[150] F.N. Aberra, G.R. Lichtenstein, Infliximab In Ulcerative Colitis, Gastroenterol. Gastroenterol Clinics Of North America. 35 (2006) 821-836.
[151] M. Golzio, L. Mazzolini, P. Moller, M.P. Rols, J. Teissié, Inhibition Of Gene Expression In Mice Muscle By In Vivo Electrically Mediated Sirna Delivery, Gene Therapy. 12 (2005) 246-251.
[152] N. Ferrer-Miralles, J. Domingo-Espin, J. Corchero, E. Vazquez, A. Villaverde, Microbial Factories For Recombinant Pharmaceuticals, Microbial Cell Factories. 8 (2009) 17.
[153] Y. Liu, M. Petreaca, M. Yao, M. Martins-Green, Cell And Molecular Mechanisms Of Keratinocyte Function Stimulated By Insulin During Wound Healing, Bmc Cell Biology. 10 (2009) 1.

184
[154] C.L. Stevenson, Advances In Peptide Pharmaceuticals, Current Pharmaceutical Biotechnology. 10 (2009) 122-137.
[155] D.A. Thomas, S. O'brien, H.M. Kantarjian, Monoclonal Antibody Therapy With Rituximab For Acute Lymphoblastic Leukemia, Hematology/Oncology Clinics Of North America. 23 (2009) 949-971.
[156] M.H. Parker, E. Birck-Wilson, G. Allard, N. Masiello, M. Day, K.P. Murphy, V. Paragas, S. Silver, M.D. Moody, Purification And Characterization Of A Recombinant Version Of Human Α-Fetoprotein Expressed In The Milk Of Transgenic Goats, Protein Expression And Purification. 38 (2004) 177-183.
[157] S.F.N.P.B.C. Dudleybrown, A.B.P. Nag, C.B.S.N. Cullinan C.C.R.N., M.B.S.N. Ayers, S. Hass, S. Panjabi, Health-Related Quality-Of-Life Evaluation Of Crohn Disease Patients After Receiving Natalizumab Therapy, Gastroenterology Nursing. 32 (2009) 327-339.
[158] M.E. Nimni, Polypeptide Growth Factors: Targeted Delivery Systems, Biomaterials. 18 (1997) 1201-1225.
[159] Y. Tabata, M. Yamamoto, Y. Ikada, Biodegradable Hydrogels For Bone Regeneration Through Growth Factor Release, Pure & Applied Chemistry. 70 (1998) 1277-1282.
[160] D. Orgill, R.H. Demling, Current Concepts And Approaches To Wound Healing, Critical Care Medicine. 16 (1988) 899-908.
[161] A. Tanaka, T. Nagate, H. Matsuda, Acceleration Of Wound Healing By Gelatin Film Dressings With Epidermal Growth Factor, Journal Of Veterinary Medical Science. 67 (2005) 909-913.
[162] P.A. Puolakkainen, D.R. Twardzik, J.E. Ranchalis, S.C. Pankey, M.J. Reed, W.R. Gombotz, The Enhancement In Wound Healing By Transforming Growth Factor-Β1 (Tgf-Β1) Depends On The Topical Delivery System, Journal Of Surgical Research. 58 (1995) 321-329.
[163] R. Judith, M. Nithya, C. Rose, A.B. Mandal, Application Of A Pdgf-Containing Novel Gel For Cutaneous Wound Healing, Life Sciences. 87 (2010) 1-8.
[164] C.H. Schein, Production Of Soluble Recombinant Proteins In Bacteria, Nature. 7 (1989) 1141-1149.
[165] J.S. Robertson, Changes In Biological Source Material, Biologicals. 34 (2006) 61-63.
[166] Peprotech Inc., Recombinant Human Egf, Tgf-B And Pdgf, (2005).
[167] G. Carpenter, S. Cohen, Human Epidermal Growth Factor And The Proliferation Of Human Fibroblasts, J. Cellular Physiology. 88 (1976) 227-237.

185
[168] H. Ogiso, R. Ishitani, O. Nureki, S. Fukai, M. Yamanaka, J. Kim, K. Saito, A. Sakamoto, M. Inoue, M. Shirouzu, S. Yokoyama, Crystal Structure Of The Complex Of Human Epidermal Growth Factor And Receptor Extracellular Domains, Cell. 110 (2002) 775-787.
[169] B. Gusterson, G. Cowley, J.A. Smith, B. Ozanne, Cellular Localization Of Human Epidermal Growth Factor Receptor, Cell Biology International Reports. 8 (1984) 649-658.
[170] J.M. Taylor, S. Cohen, W.M. Mitchell, Epidermal Growth Factor: High And Low Molecular Weight Forms, Proceedings Of The National Academy Of Sciences. 67 (1970) 164-171.
[171] J.D. Franklin, J.B. Lynch, Effects Of Topical Applications Of Epidermal Growth Factor On Wound Healing, Plastic And Reconstructive Surgery. 64 (1979) 766-770.
[172] L.B. Nanney, Epidermal And Dermal Effects Of Epidermal Growth Factor During Wound Repair, Journal Of Investigative Dermatology. 94 (1990) 624-629.
[173] M.B. Sporn, A.B. Roberts, L.M. Wakefield, R.K. Assoian, Transforming Growth Factor-B: Biological Function And Chemical Structure, Science. 233 (1986) 532-534.
[174] L.M. Wakefield, D.M. Smith, T. Masui, C.C. Harris, M.B. Sporn, Distribution And Modulation Of The Cellular Receptor For Transforming Growth Factor-Beta, Journal Of Cell Biology. 105 (1987) 965-975.
[175] S. Cheifetz, B. Like, J. Massagues, Cellular Distribution Of Type I And Type Ii Receptors For Transforming Growth Factor-B, Journal Of Biological Chemistry. 261 (1986) 9972-9978.
[176] A. Pandit, R. Ashar, D. Feldman, The Effect Of Tgf-Beta Delivered Through A Collagen Scaffold On Wound Healing, Journal Of Investigative Surgery. 12 (1999) 89-100.
[177] G.L. Brown, L.J. Curtsinger, R.O. Mitchell, J. Pietsch, R. Nordquist, A. Von Fraunhofer, G.S. Schultz, Acceleration Of Tensile Strength Of Incisions Treated With Egf And Tgf-Β, Annals Of Surgery. 208 (1988) 788-794.
[178] T.F. Deuel, J.S. Huang, Plalet-Derived Growth Factor, Journal Of Clinical Investigation. 74 (1984) 669-676.
[179] B. Westermark, C.H. Heldin, Platelet-Derived Growth Factor In Autocrine Transformation, Cancer Research. 51 (1991) 5087-5092.
[180] G.F. Pierce, T.A. Mustoe, B.W. Altrock, T.F. Deuel, A. Thomason, Role Of Platelet-Derived Growth Factor In Wound Healing, Journal Of Cellular Biochemistry. 45 (1991) 319-326.

186
[181] B. Li, J.M. Davidson, S.A. Guelcher, The Effect Of The Local Delivery Of Platelet-Derived Growth Factor From Reactive Two-Component Polyurethane Scaffolds On The Healing In Rat Skin Excisional Wounds, Biomaterials. 30 (2009) 3486-3494.
[182] Q. Jin, G. Wei, Z. Lin, J.V. Sugai, S.E. Lynch, P.X. Ma, W.V. Giannobile, Nanofibrous Scaffolds Incorporating Pdgf-Bb Microspheres Induce Chemokine Expression And Tissue Neogenesis In Vivo, Plos One. 3 (2008) E1729.
[183] Sigma-Aldrich Inc., E9644-5x.2mg Recombinant, Expressed In E. Coli, Lyophilized Powder, Suitable For Cell Culture (Sigma), Http://Www.Sigmaaldrich.Com/Catalog/Search?Interface=Product+Name&Term=Epidermal+Growth+Factor+Human&Lang=En&Region=Ca&N=220003048+219853082+219853286+0+4294964377&Focus=Product&Mode=Mode+Matchpartialmax (2012).
[184] Peprotech Inc., Recombinant Human Tgf-B1 (Mammalian Derived), Https://Www.Peprotech. Com/En-Gb/Pages/Product. Aspx?Productid=100-21. (2012).
[185] Peprotech Inc., Recombinant Hman Pdgf-Aa, Https://Www. Peprotech. Com/En-Gb/Pages/Product. Aspx?Productid=Af-100-13a. (2012).
[186] Peprotech Inc., Recombinant Human Vegf121, Https://Www.Peprotech. Com/En-Gb/Pages/Product. Aspx?Productid=Af-100-20a. (2012).
[187] Peprotech Inc., Recombinant Human Il-1alpha, Https://Www. Peprotech. Com/En-Gb/Pages/Product. Aspx?Productid=200-01a. (2012).
[188] Peprotech Inc., Recombinant Human Il-6, Https://Www. Peprotech. Com/En-Gb/Pages/Product. Aspx?Productid=200-06. (2012).
[189] Peprotech Inc., Recombinant Human Tnf-Alpha, Https://Www.Peprotech. Com/En-Gb/Pages/Product. Aspx?Productid=300-01a. (2012).
[190] Sigma-Aldrich Inc., 91077c-100mg Insulin, Recombinant Human, Https://Www. Sigmaaldrich. Com/Catalog/Product/Sigma/91077c?Lang=En&Region=Ca. (2012).
[191] F.N. Allan, Diabetes Before And After Insulin. Medical History. 16 (1972) 266-273.
[192] F.M. Allen, E.F. Du Bois, Clinical Calorimetry, Archives Of Internal Medicine. 17 (1916) 1010-1059.
[193] P. De Meyts, Insulin And Its Receptor: Structure, Function And Evolution, Bioessays. 26 (2004) 1351-1362.
[194] M. Bliss, The Discovery Of Insulin, Mcclelland And Stewart Ltd., Toronto, 1982.

187
[195] J.J. Abel, Crystalline Insulin, Proceedings Of The National Academy Of Science. 12 (1926) 132-136.
[196] F. Sanger, E.O.P. Thompson, R. Kitai, The Amide Groups Of Insulin, Biochemical Journal. 59 (1955) 509-518.
[197] D.F. Steiner, D. Cunningham, L. Spigelman, B. Aten, Insulin Biosynthesis: Evidence For A Precursor, Science. 157 (1967) 697-700.
[198] M.J. Adams, T.L. Blundell, E.J. Dodson, G.G. Dodson, M. Vijayan, E.N. Baker, M.M. Harding, D.C. Hodgkin, B. Rimmer, S. Sheat, Structure Of Rhombohedral 2 Zinc Insulin Crystals, Nature. 224 (1969) 491-495.
[199] A. Ullrich, A. Gray, A. Tam, T. Yangfeng, M. Tsubokawa, C. Collins, W. Henzel, T. Lebon, S. Kathuria, E. Chen, S. Jacobs, U. Francke, J. Ramachandran, Y. Fujitayamaguchi, Insulin-Like Growth Factor-I Receptor Primary Structure - Comparison With Insulin-Receptor Suggests Structural Determinants That Define Functional Specificity, Embo Journal. 5 (1986) 2503-2512.
[200] P. Watkins, Choice Of Insulin, British Medical Journal. 287 (1983) 1571-1572.
[201] F.M. Ashcroft, S.J.H. Ashcroft, Insulin: Molecular Biology To Pathology, Oxford Univeristy Press, New York, 1992.
[202] K. Catt, Abc Of Endocrinology Insulin And Glucose Homoeostasis, Lancet. 2 (1970) 353-358.
[203] D. Nielsen, M. Welsh, M. Casadaban, D. Steiner, Control Of Insulin Gene-Expression In Pancreatic Beta-Cells And In An Insulin-Producing Cell-Line, Rin-5f Cells .1. Effects Of Glucose And Cyclic-Amp On The Transcription Of Insulin Messenger-Rna, Journal Of Biological Chemistry. 260 (1985) 3585-3589.
[204] P.A. Halban, Proinsulin Trafckin And Processing In The Pancreatic B Cell, Trends In Endocrinology & Metabolism. 1 (1990) 261-265.
[205] G.M. Cooper, The Cell: A Molecular Approach, Sunderland, Usa, 2000.
[206] S. Emdin, G. Dodson, J. Cutfield, S. Cutfield, Role Of Zinc In Insulin Biosynthesis. Some Possible Zinc-Insulin Interactions In The Pancreatic B-Cell, Diabetologia. 19 (1980) 174-182.
[207] W.C. Duckworth, R.G. Bennett, F.G. Hamel, Insulin Degradation: Progress And Potential, Endocrine Reviews. 19 (1998) 608-624.
[208] W.C. Duckworth, J. Fawcett, S. Reddy, J.C. Page, Insulin-Degrading Activity In Wound Fluid, Journal Of Clinical Endocrinology & Metabolism. 89 (2004) 847-851.

188
[209] R. Vimalavathini, B. Gitanjali, Effect Of Temperature On The Potency And Pharmacological Action Of Insulin, Indian Journal Of Medical Research. 130 (2009) 166-169.
[210] R.G. Strickley, B.D. Anderson, Solid-State Stability Of Human Insulin I. Mechanism And The Effect Of Water On The Kinetics Of Degradation In Lyophiles From Ph 2–5 Solutions, Pharmaceutical Research. 13 (1996) 1142-1153.
[211] M.R. Ladisch, K.L. Kohlmann, Recombinant Human Insulin, Biotechnology Progress. 8 (1992) 469-478.
[212] D. Petrides, E. Sapidou, J. Calandranis, Computer‐Aided Process Analysis And Economic Evaluation For Biosynthetic Human Insulin Production—A Case Study, Biotechnology And Bioengineering. 48 (1995) 529-541.
[213] G. Smith, D. Swenson, E. Dodson, G. Dodson, C. Reynolds, Structural Stability In The 4-Zinc Human Insulin Hexamer, Proceedings Of The National Academy Of Sciences Of The United States Of America-Biological Sciences. 81 (1984) 7093-7097.
[214] D. Scott, A. Fisher, Crystalline Insulin. Biochemical Journal. 29 (1935) 1048-1054.
[215] A. Wagner, J. Diez, C. Schulze-Briese, G. Schluckebier, Crystal Structure Of Ultralente—A Microcrystalline Insulin Suspension, Proteins. 74 (2009) 1018-1027.
[216] J. Lee, P.F. Pilch, The Insulin Receptor: Structure, Function, And Signaling, American Journal Of Physiology - Cell Physiology. 266 (1994) C319-C334.
[217] M. Watanabe, H. Hayasaki, T. Tamayama, M. Shimada, Histological Distribution Of Insulin And Glucagon Receptors, Brazilian Journal Of Medical And Biological Research. 31 (1998) 243-256.
[218] D.D. Soderman, J. Germershausen, H.M. Katzen, Affinity Binding Of Intact Fat Cells And Their Ghosts To Immobilized Insulin, Proceedings Of The National Academy Of Science. 70 (1973) 792-796.
[219] R. Soda, M. Tavassoli, Distribution Of Insulin Receptors In Liver Cell Suspensions Using A Minibead Probe, Experimental Cell Research. 145 (1983) 389-395.
[220] R.F. Dons, L.M. Corash, P. Gorden , The Insulin Receptor Is An Age-Dependent Integral Component Of The Human Erythrocyte Membrane. Journal Of Biological Chemistry. 256 (1981) 2982-2987.
[221] J.R. Gavin, J. Roth, P. Jen, P. Freychet, Insulin Receptors In Human Circulating Cells And Fibroblasts, Proceedings Of The National Academy Of Science. 69 (1972) 747-751.
[222] M.D. Hollenberg, P. Cuatrecasas, Insulin And Epidermal Growth Factor, The Journal Of Biological Chemistry. 250 (1975) 3845-3853.

189
[223] P. Verrando, J.P. Ortonne, Insulin Receptors In Cultured Human Keratinocytes, British Journal Of Dermatology. 111 (1984) 232-234.
[224] L.J. Elsas, F. Endo, E. Strumlauf, J. Elders, J.H. Priest, Leprechaunism: An Inherited Defect In A High-Affinity Insulin Receptor, American Journal Of Human Genetics. 37 (1985) 73-88.
[225] E. Wertheimer, M. Trebicz, T Eldar, M. Gartsbein, S. Nofeh-Moses, T. Tennenbaum, Differential Roles Of Insulin Receptor And Insulin-Like Growth Factor-1 Receptor In Differentiation Of Murine Skin Keratinocytes, Journal Of Investigative Dermatology. 115 (2000) 24-29.
[226] A.R. Saltiel, J.E. Pessin, Mechanism Of Insulin Action, Springer, Usa, 2007.
[227] D.A. Bravo, J.B. Gleason, B.I. Sanchez, R.A. Roth, R.S. Fuller, Accurate And Efficient Cleavage Of The Human Insulin Proreceptor By The Human Proprotein-Processing Protease Furin, Journal Of Biological Chemistry. 269 (1994) 25830-25837.
[228] S. Seino, G.I. Bell, Alternative Splicing Of Human Insulin Receptor Messenger Rna, Biochemical And Biophysical Research Communications. 159 (1989) 312-316.
[229] A. Ullrich, J.R. Bell, E.Y. Chen, R. Herrera, M. Petruzelli, T.J. Dull, A. Gray, L. Coussens, Y.C. Liao, M. Tsubokawa, A. Mason, P.H. Seeburg, C. Grunfeld, O.M. Rosen, J. Ramachandran, Human Insulin Receptor And Its Relationship To The Tyronsine Kinase Family Of Oncogenes, Nature. 313 (1985) 756-761.
[230] S. Wang, L. Wang, Y. Shan, Y. Wang, W. Li, C. Sun, Binding Mode Of Insulin Receptor And Agonist Peptide, Chemical Research In Chinese Universities. 22 (2006) 242-244.
[231] W.J. Fantl, D.E. Johnson, L.T. Williams, Signalling By Receptor Tyrosine Kinases, Annual Reviews Of Biochemistry. 62 (1993) 453-481.
[232] M.C. Lawrence, N.M. Mckern, C.W. Ward, Insulin Receptor Structure And Its Implications For The Igf-1 Receptor, Current Opinion In Structural Biology. 17 (2007) 699-705.
[233] C. Ward, M. Lawrence, V. Streltsov, T. Garret, N. Mckern, M.Z. Lou, G. Lovrecz, T. Adams, Structural Insights Into Ligand-Induced Activation Of The Insulin Receptor, Acta Physiologica. 192 (2008) 3-9.
[234] J.G. Menting, C.W. Ward, M.B. Margetts, M.C. Lawrence, A Thermodynamic Study Of Ligand Binding To The First Three Domains Of The Human Insulin Receptor: Relationship Between The Receptor Α-Chain C-Terminal Peptide And The Site 1 Insulin Mimetic Peptides, Biochemistry. 48 (2009) 5492-5500.

190
[235] A.B. Becker, R.A. Rother, Insulin Receptor Structure And Function In Normal And Pathological Conditions, Annual Reviews In Medicine. 41 (1990) 99-115.
[236] M.E. Patti, C.R. Kahn, The Insulin Receptor--A Critical Link In Glucose Homeostasis And Insulin Action, Journal Of Basic And Clinical Physiology And Pharmacology. 9 (1998) 89-109.
[237] A.R. Saltiel, C.R. Kahn, Insulin Signalling And The Regulation Of Glucose And Lipid Metabolism, Nature. 414 (2001) 799-806.
[238] J.E. Pessin, A.R. Saltiel, Signaling Pathways In Insulin Action: Molecular Targets Of Insulin Resistance, Journal Of Clinical Investigation. 106 (2000) 165-169.
[239] M.R. Kuhné, T. Pawson, G.E. Lienhard, G.S. Feng, The Insulin Receptor Substrate 1 Associates With The Sh2-Containing Phosphotyrosine Phosphatase Syp. Journal Of Biological Chemistry. 268 (1993) 11479-11481.
[240] X.J. Sun, P. Rothenberg, C.R. Kahn, J.M. Backer, E. Araki, P.A. Wilden, D.A. Cahill, B.J. Goldstein, M. White, Structure Of The Insulin Receptor Substrate Irs-1 Defines A Unique Signal Transduction Protein, Nature. 352 (1991) 73-77.
[241] R.T. Watson, J.E. Pessin, Intracellular Organization Of Insulin Signaling And Glut4 Translocation, Recent Progress In Hormone Research. 56 (2001) 175-193.
[242] G.M. Di Guglielmo, P.C. Baass, F. Authier, B.I. Posner, J.M. Bergeron, Insulin Receptor Internalization And Signaling, Molecular And Cellular Biochemistry. 182 (1998) 59-63.
[243] B.J. Goldstein, A. Bittner-Kowalczyk, M.F. White, M. Harbeck, Tyrosine Dephosphorylation And Deactivation Of Insulin Receptor Substrate-1 By Protein-Tyrosine Phosphatase 1b, Journal Of Biological Chemistry. 275 (2000) 4283-4289.
[244] F.B. Gurd, Postoperative Use Of Insulin In The Nondiabetic, Annals Of Surgery. 106 (1937) 761-769.
[245] W. Thalhimer, Insulin Treatment Of Postoperative (Nondiabetic) Acidosis, Journal Of The American Medical Association. 81 (1923) 383-385.
[246] N.B. Foster, Diabetic Coma, Journal Of The American Medical Association. 84 (1925) 719-722.
[247] B.A. Schazzillo, M.J. Ksendowsky, Der Wirkung Des Insulins Auf Die Regeneration. Die Biologische Rolle Der K-Und Ca-Ionen Bei Diesem Vorgange, Pflugers Archiv European Journal Of Physiology. 220 (1928) 774-781.
[248] B. Joseph, Insulin In The Treatment Of Non-Diabetic Bed Sores. Annals Of Surgery. 92 (1930) 318-319.

191
[249] I.M. Rabinowitch, On The Mortality Resulting From Surgical Treatment Of Chronic Gall-Bladder Disease In Diabetes Mellitus, Annals Of Surgery. 96 (1932) 70-74.
[250] W. Stuck, The Effect Of Insulin On Healing Of Experimental Fractures In The Rabbit, Journal Of Bone And Joint Surgery. 14 (1932) 109-115.
[251] R.T. Lawrence, J.M. Salter, C.H. Best, The Effect Of Insulin On Nitrogen Retention In The Hypophysectomized Rat, British Medical Journal. 2 (1954) 437-9.
[252] G.B. Bolli, R.D. Di Marchi, G.D. Park, S. Pramming, V.A. Koivisto, Insulin Analogues And Their Potential In The Management Of Diabetes Mellitus, Diabetologia. 42 (1999) 1151-1167.
[253] G. Stunkle, J.B. Wray, The Effect Of Exogenous Insulin On Fracture Healing In The Intact Rat, Clinical Orthopaedics And Related Research. 40 (1965) 30-4.
[254] W.B. Gregory, Effect Of Insulin On The Healing Of Bone Wounds In Albino Rats, Journal Of Dental Research. 44 (1965) 487-92.
[255] T.N. Paul, Treatment By Local Application Of Insulin Of An Infected Wound In A Diabetic, Lancet. 2 (1966) 574-6.
[256] S.P. Rosenthal, Acceleration Of Primary Wound Healing By Insulin, Archives Of Surgery. 96 (1968) 53-5.
[257] W.O. Belfield, S. Golinsky, M.D. Compton, The Use Of Insulin In Open-Wound Healing, Veterinary Medicine & Small Animal Clinician. 65 (1970) 455-460.
[258] K.N. Udupa, J.P.N. Chansouria, The Role Of Protamine Zinc Insulin In Accelerating Wound Healing In The Rat, British Journal Of Surgery. 58 (1971) 673-675.
[259] W.H. Goodson, T.K. Hunt, Wound-Healing In Experimental Diabetes-Mellitus - Importance Of Early Insulin Therapy, Surgical Forum. 29 (1978) 95-98.
[260] E.J. Weringer, J.M. Kelso, I.Y. Tamai, E.R. Arquilla, Effects Of Insulin On Wound Healing In Diabetic Mice. Acta Endocrinologica (Copenh). 99 (1982) 101-108.
[261] Y. Sakurai, A. Aarsland, D.N. Herndon, D.L. Chinkes, E.J. Pierre, T.T. Nguyen, B.W. Patterson, R.R. Wolfe, Stimulation Of Muscle Protein Synthesis By Long-Term Insulin Infusion In Severely Burned Patients, Annals Of Surgery. 222 (1995) 283-297.
[262] E.J. Pierre, R.E. Barrow, H.K. Hawkins, T.T. Nguyen, Y. Sakurai, M. Desai, R.R. Wolfe, D.N. Herndon, Effects Of Insulin On Wound Healing, Journal Of Trauma. 44 (1998) 342-5.

192
[263] X.J. Zhang, D.L. Chinkes, S.E. Wolf, R.R. Wolfe, Insulin But Not Growth Hormone Stimulates Protein Anabolism In Skin Wound And Muscle, American Journal Of Physiology Endocrinology And Metabolism. 276 (1999) E712-E720.
[264] X.J. Zhang, D.L. Chinkes, O. Irtun, R.R. Wolfe, Anabolic Action Of Insulin On Skin Wound Protein Is Augmented By Exogenous Amino Acids, American Journal Of Physiology Endocrinology And Metabolism. 282 (2002) E1308-E1315.
[265] I. Gore, S.E. Wolfe, D.N. Herndon, R.R. Wolfe, Relative Influence Of Glucose And Insulin On Peripheral Amino Acid Metabolism In Severely Burned Patients, Journal Of Parenteral And Enteral Nutrition. 26 (2002) 271-277.
[266] X. Zhang, D.L. Chinkes, V.M. Sadagopa Ramanujam, R.R. Wolfe, Local Injection Of Insulin-Zinc Stimulates Dna Synthesis In Skin Donor Site Wound, Wound Repair And Regeneration. 15 (2007) 258-265.
[267] X.J. Zhang, X. Wu, S.E. Wolf, H.K. Hawkins, D.L. Chinkes, R.R. Wolfe, Local Insulin-Zinc Injection Accelerates Skin Donor Site Wound Healing, Journal Of Surgical Research. 142 (2007) 90-96.
[268] X. Zhang, C. Meng, D.L. Chinkes, D.N. Herndon, Beneficial Effects Of Insulin On Cell Proliferation And Protein Metabolism In Skin Donor Site Wound, Journal Of Surgical Research. 168 (2011) E155-E161.
[269] I.S. Zagon, J.W. Sassani, P.J. Mclaughlin, Insulin Treatment Ameliorates Impaired Corneal Reepithelialization In Diabetic Rats, Diabetes. 55 (2006) 1141-1147.
[270] I.S. Zagon, M.S. Klocek, J.W. Sassani, P.J. Mclaughlin, Use Of Topical Insulin To Normalize Corneal Epithelial Healing In Diabetes Mellitus, Archives Of Ophthalmology. 125 (2007) 1082-1088.
[271] O. Rezvani, E. Shabbak, A. Aslani, R. Bidar, M. Jafari, S. Safarnezhad, A Randomized, Double-Blind, Placebo-Controlled Trial To Determine The Effects Of Topical Insulin On Wound Healing, Ostomy Wound Management. 55 (2009) 22-28.
[272] J.M. Wilson, R. Baines, E.D. Babu, C.J. Kelley, A Role For Topical Insulin In The Management Problematic Surgical Wounds, Annals Of The Royal College Of Surgeons Of England. 90 (2008) 160.
[273] R.Y. Fram, M.G. Cree, R.R. Wolfe, R.P. Mlcak, T. Qian, D.L. Chinkes, D.N. Herndon, Intensive Insulin Therapy Improves Insulin Sensitivity And Mitochondrial Function In Severely Burned Children, Prediatric Clinical Care. 38 (2010) 1475-1483.
[274] C.L. Scimeca, M. Bharara, T.K. Fisher, H. Kimbriel, J.L. Mills, D.G. Armstrong, Novel Use Of Insulin In Continous-Instillation Negative Pressure Wound Therapy As "Wound Chemotherapy", Journal Of Diabetes Science And Technology. 4 (2010) 820-824.

193
[275] D. Tuvdendorj, X. Zhang, D.L. Chinkes, A. Aarsland, G.A. Kulp, M.G. Jeschke, D.N. Herndon, Intensive Insulin Treatment Increases Donor Site Wound Protein Synthesis In Burn Patients, Surgery. 149 (2011) 512-518.
[276] J.S. Huang, J.J. Mukherjee, T. Chung, K.S. Crilly, Z. Kiss, Extracellular Calcium Stimulates Dna Synthesis In Synergism With Zinc, Insulin And Insulin-Like Growth Factor I In Fibroblasts, European Journal Of Biochemistry. 266 (1999) 943-951.
[277] L.J. Shanley, C.D. Mccaig, J.V. Forrester, M. Zhao, Insulin, Not Leptin, Promotes In Vitro Cell Migration To Heal Monolayer Wounds In Human Corneal Epithelium, Investigative Ophthalmology & Visual Science. 45 (2004) 1088-1094.
[278] Y. Liu, M. Petreaca, M. Martins-Green, Cell And Molecular Mechanisms Of Insulin-Induced Angiogenesis, Journal Of Cellular And Molecular Medicine. 13 (2008) 4492 - 4504.
[279] A.S. Rathore, Follow-On Protein Products: Scientific Issues, Developments And Challenges, Trends In Biotechnology. 27 (2009) 698-705.
[280] W. Wang, Protein Aggregation And Its Inhibition In Biopharmaceutics, International Journal Of Pharmaceutics. 289 (2005) 1-30.
[281] Coen Maas, Suzanne Hermeling, Barend Bouma, Wim Jiskoot, And Martijn F. B. G. Gebbink, A Role For Protein Misfolding In Immunogenicity Of Biopharmaceuticals, Journal Of Biological Chemistry. 282 (2007) 2229-2236.
[282] S. Chen, J. Singh, Controlled Release Of Growth Hormone From Thermosensitive Triblock Copolymer Systems: In Vitro And In Vivo Evaluation, International Journal Of Pharmaceutics. 352 (2008) 58-65.
[283] U. Bilati, E. Allémann, E. Doelker, Strategic Approaches For Overcoming Peptide And Protein Instability Within Biodegradable Nano- And Microparticles, European Journal Of Pharmaceutics And Biopharmaceutics. 59 (2005) 375-388.
[284] C. Lin, R. Gokhale, J.S. Trivedi, V. Ranade, Recent Strategies And Methods For Improving Insulin Delivery, Drug Development Research. 63 (2004) 151-160.
[285] F. Kang, J. Singh, Preparation, In Vitro Release, In Vivo Absorption, And Bioacompatibility Studies Of Insulin-Loaded Microspheres In Rabbits, Aaps Pharmscitech. 6 (2005) E487-E494.
[286] C. Witschi, E. Doelker, Influence Of The Microencapsulation Method And Peptide Loading On Poly(Lactic Acid) And Poly(Lactic-Co-Glycolic Acid) Degradation During In Vitro Testing, Journal Of Controlled Release. 51 (1998) 327-341.

194
[287] E. Walter, K. Moelling, J. Pavlovic, H.P. Merkle, Microencapsulation Of Dna Using Poly(Dl-Lactide-Co-Glycolide): Stability Issues And Release Characteristics, Journal Of Controlled Release. 61 (1999) 361-374.
[288] E. Walter, D. Dreher, M. Kok, L. Thiele, S.G. Kiama, P. Gehr, H.P. Merkle, Hydrophilic Poly(Dl-Lactide-Co-Glycolide) Microspheres For The Delivery Of DNA To Human-Derived Macrophages And Dendritic Cells, Journal of Controlled Release. 76 (2001) 149-168.
[289] S. Díez, C. Tros De Ilarduya, Versatility Of Biodegradable Poly(D,L-Lactic-Co-Glycolic Acid) Microspheres For Plasmid Dna Delivery, European Journal Of Pharmaceutics and Biopharmaceutics. 63 (2006) 188-197.
[290] V.R. Sinha, A. Trehan, Biodegradable Microspheres For Protein Delivery, Journal Of Controlled Release. 90 (2003) 261-280.
[291] C. Dai, B. Wang, H. Zhao, Microencapsulation Peptide and Protein Drugs Delivery System, Colloids and Surfaces B: Biointerfaces. 41 (2005) 117-120.
[292] M. Ferrari, Biomems And Biomedical Technology, Biological and Biomed Nanotech. 1 (2006) 1-522.
[293] R. Singh, S. Sing, J.W. Lillard, Past, Present and Future Technologies For Oral Delivery Of Therapeutic Proteins, Journal of Pharmaceutical Science. 97 (2008) 2497-2523.
[294] M. Bohmer, A. Mol, A. Balguid, Delivery Of Bioactive Agents To Tissue-Engineered Constructs Using Polymeric Microparticles, Philips Industries - Molecular Medicine Sector Technical Bulletin. Bmte07 (2007) 1-28.
[295] M.A. Ibrahim, A. Ismail, M.I. Fetouh, A. Göpferich, Stability Of Insulin During The Erosion Of Poly(Lactic Acid) And Poly(Lactic-Co-Glycolic Acid) Microspheres, Journal of Controlled Release. 106 (2005) 241-252.
[296] W.T. Leach, D.T. Simpson, T.B. Val, Z. Yu, K.T. Lim, E.J. Park, R.O. Williames, K.P. Johnston, Encapsulation Of Protein Nanoparticles Into Uniform-Sized Microspheres Formed In A Spinning Oil Film, AAPS Pharscitech. 6 (2005) E605-E617.
[297] M. Murillo, C. Gamazo, M.M. Goñi, J.M. Irache, M.J. Blanco-Prı́eto, Development Of Microparticles Prepared By Spray-Drying As A Vaccine Delivery System Against Brucellosis, International Journal of Pharmaceutics. 242 (2002) 341-344.
[298] Y. Yang, H. Chia, T. Chungcorresponding Author., Effect Of Preparation Temperature On The Characteristics And Release Profiles Of Plga Microspheres Containing Protein Fabricated By Double-Emulsion Solvent Extraction/Evaporation Method, Journal of Controlled Release. 69 (2000) 81-96.

195
[299] R.A. Jain, The Manufacturing Techniques Of Various Drug Loaded Biodegradable Poly(Lactide-Co-Glycolide) (Plga) Devices, Biomaterials. 21 (2000) 2475-2490.
[300] M. Chaubul, Polylactides/Glycolides - Excipients For Injectable Drug Delivery And Beyond, Drug Delivery Technology. 2 (2002) 34-36.
[301] J.L. Cleland, E. Duenas, A. Daugherty, M. Marian, J. Yang, M. Wilson, A.C. Celniker, A. Shahzamani, V. Quarmby, H. Chu, V. Mukku, A. Mac, M. Roussakis, N. Gillette, B. Boyd, D. Yeung, D. Brooks, Y. Maa, C. Hsu, A.J.S. Jones, Recombinant Human Growth Hormone Poly(Lactic-Co-Glycolic Acid) (PLGA) Microspheres Provide A Long Lasting Effect, Journal of . Controlled Release. 49 (1997) 193-205.
[302] S. Diez, C. Tros de Llarduya, Versatility of biodegradable poly(D,L-lactic-co-glycolic acid) microspheres for plasmid DNA delivery, European Journal of Pharmaceutics and Biopharmaceutics. 63 (2006) 188-197.
[303] S.M. Azouz, J. Walpole, S. Amirifeli, K.N. Taylor, M.W. Grinstaff, Y.L. Colson, Prevention Of Local Tumor Growth With Paclitaxel-Loaded Microspheres, Journal of Thoracic and Cardiovascular Surgery. 135 (2008) 1014-1021.
[304] J.M. Lu, X. Wang, C. Marin-Muller, H. Wang, P.H. Lin, Q. Yao, C. Chen, Current Advances in Research and Clinical Applications of PLGA-Based Nanotechnology, Expert Reviews in Molecular Diagnostics. 9 (2009) 325-341.
[305] J.H. Park, M. Ye, K. Park, Biodegradable Polymers For Microencapsulation Of Drugs, Molecules. 10 (2005) 146-161.
[306] L. Li, S.P. Schwendeman, Mapping Neutral Microclimate pH In PLGA Microspheres, Journal of Controlled Release. 101 (2005) 163-173.
[307] A.R. Ahmed, R. Bodmeier, Preparation Of Preformed Porous PLGA Microparticles And Antisense Oligonucleotides Loading, European Journal of Pharmaceutics and Biopharmaceutics. 71 (2009) 264-270.
[308] H.K. Makadia, S.J. Siegel, Poly Lactic-Co-Glycolic Acid (PLGA) As Biodegradable Controlled Drug Delivery Carrier, Polymers. 3 (2011) 1377-1397.
[309] M.L. Houchin, E.M. Topp, Chemical Degradation Of Peptides And Proteins In PLGA: A Review Of Reactions And Mechanisms, Journal of Pharmaceutical Science. 97 (2008) 2395-2404.
[310] J. Emami, H. Hamishehkar, A.R. Najafabadi, K. Gilani, M. Minaiyan, H. Mahdavi, A. Nokhodchi, A Novel Approach To Prepare Insulin-Loaded Poly(Lactic-Co-Glycolic Acid) Microcapsules And The Protein Stability Study, Journal of Pharmaceutical Science. 98 (2009) 1712-1731.

196
[311] C. Manoharan, J. Singh, Insulin Loaded PLGA Microspheres: Effect Of Zinc Salts On Encapsulation, Release, And Stability, Journal of Pharmaceutical Science. 98 (2009) 529-542.
[312] R. Krishnamurthy, M.C. Manning, The Stability Factor: Importance In Formulation Development, Current Pharmaceutical Biotechnology. 3 (2002) 361-371.
[313] E.Y. Chi, S. Krishnan, T.W. Randolph, J.F. Carpenter, Physical Stability Of Proteins In Aqueous Solution: Mechanism And Driving Forces In Nonnative Protein Aggregation, Pharmaceutical Research. 20 (2003) 1325-1336.
[314] L.L. Chang, M.J. Pikal, Mechanisms Of Protein Stabilization In The Solid State, Journal of Pharmaceutical Science. 98 (2009) 2886-2908.
[315] R.M. Daniel, The Upper Limits Of Enzyme Thermal Stability, Enzyme and Microbial Technology. 19 (1996) 74-79.
[316] P. Shao, L. Bailey, Stabilization Of pH-Induced Degradation Of Porcine Insulin In Biodegradable Polyester Microspheres, Pharmaceutical Development & Technology. 4 (1999) 633.
[317] G.D. Rosa, R. Iommelli, M.I. La Rotonda, A. Miro, F. Quaglia, Influence Of The Co-Encapsulation Of Different Non-Ionic Surfactants On The Properties Of PLGA Insulin-Loaded Microspheres, Journal of Controlled Release. 69 (2000) 283-295.
[318] M. Yeh, The Stability Of Insulin In Biodegradable Microparticles Based On Blends Of Lactide Polymers And Polyethylene Glycol, Journal of Microencapsulation. 17 (2000) 743-756.
[319] B. Balakrishnan, M. Mohanty, P.R. Umashankar, A. Jayakrishnan, Evaluation Of An In Situ Forming Hydrogel Wound Dressing Based On Oxidized Alginate And Gelatin, Biomaterials. 26 (2005) 6335-6342.
[320] C.T. Chiu, J.S. Lee, C.S. Chu, Y.P. Chang, Y.J. Wang, Development Of Two Alginate-Based Wound Dressings, Journal Of Materials Science: Materials In Medicine. 19 (2008).
[321] British Pharmacopoeia, Alginates Addendum, 1995.
[322] T. Paragkumar N, D. Edith, J. Six, Surface Characteristics Of PLA And PLGA Films, Applied Surface Science. 253 (2006) 2758-2764.
[323] J.M. Barichello, M. Morishita, K. Takayama, T. Nagai, Encapsulation Of Hydrophilic And Lipophilic Drugs In PLGA Nanoparticles By The Nanoprecipitation Method, Drug Development and Industrial Pharmacy. 25 (1999) 471-476.
[324] C. Bouissou, J.J. Rouse, R. Price, C.F. Walle, The Influence Of Surfactant On PLGA Microsphere Glass Transition And Water Sorption: Remodeling The Surface Morphology To Attenuate The Burst Release, Pharmaceutical Research. 23 (2006) 1295-1305.

197
[325] H. Okada, Y. Doken, Y. Ogawa, H. Toguchi, Preparation of three-month depot injectable microspheres of leuprorelin acetate using biodegradable polymers, Pharmaceutical Research. 11 (1994) 1143-1147.
[326] S.W. Cho, S.H. Song, Y.W. Choi, Effects Of Solvent Selection And Fabrication Method On The Characteristics Of Biodegradable Poly(Lactide-Co-Glycolide) Microspheres Containing Ovalbumin, Archives Of Pharmacal Research. 23 (2000) 385-390.
[327] J. Li, G. Jiang, F. Ding, Effects Of Polymer Degradation On Drug Release From PLGA‐Mpeg Microparticles: A Dynamic Study Of Microparticle Morphological And Physicochemical Properties, Journal of Applied Polymer Science. 108 (2008) 2458-2466.
[328] S.S. Shah, Y. Cha, C.G. Pitt, Poly (Glycolic Acid-Co-DL-Lactic Acid): Diffusion Or Degradation Controlled Drug Delivery? Journal of Controlled Release. 18 (1992) 261-270.
[329] M. Sandor, D. Enscore, P. Weston, E. Mathiowitz, Effect Of Protein Molecular Weight On Release From Micron-Sized PLGA Microspheres, Journal of Controlled Release. 76 (2001) 297-311.
[330] N. Faisant, J. Siepmann, J.P. Benoit, Plga-Based Microparticles: Elucidation Of Mechanisms And A New, Simple Mathematical Model Quantifying Drug Release, European Journal Of Pharmaceutical Sciences. 15 (2002) 355-366.
[331] E. Van Obberghen, The Insulin Receptor: Its Structure And Function, Biochemical Pharmacology. 33 (1984) 889-896.
[332] I. Goren, E. Muller, J. Pfeilschifter, S. Frank, Thr308 Determines Akt1 Nuclear Localization In Insulin-Stimulated Keratinocytes, Biochemical and Biophysical Research Communications. 372 (2008) 103-107.
[333] H. Chen, G.C. Yan, M.L. Gishizky, Identification Of Structural Characteristics That Contribute To A Difference In Antiapoptotic Function Between Human Insulin And Insulin-Like Growth Factor I Receptors, Cell Growth & Differentiation. 9 (1998) 939-947.
[334] C.P. Reis, A.J. Ribeiro, R.J. Neufeld, F. Veiga, Alginate Microparticles As Novel Carrier For Oral Insulin Delivery, Biotechnology and Bioengineering. 96 (2007) 977-989.
[335] Naha P.C., Kanchan V., Panda A.K., Evaluation Of Parenteral Depot Insulin Formulation Using PLGA And PLA Microparticles, Journal of Biomaterial Applications. 24 (2009) 309-325.
[336] L. Shapiro, S. Cohen, Novel Alginate Sponges For Cell Culture And Transplantation, Biomaterials. 18 (1997) 583-590.
[337] M. Livnat, R. Beyar, D. Seliktar, Endoluminal Hydrogel Films Made Of Alginate And Polyethylene Glycol: Physical Characteristics And Drug‐Eluting Properties, J. Biomed. Mater. Res. 75a (2005) 710-722.

198
[338] D. Mccoll, B. Cartlidge, P. Connolly, Real-Time Monitoring Of Moisture Levels In Wound Dressings In Vitro: An Experimental Study, International Journal Of Surgery. 5 (2007) 316-322.
[339] F.L. Mi, Y.B. Wu, S. Shyu, J.Y. Schoung, Y.B. Huang, Y.H. Tsai, J.Y. Hao, Control Of Wound Infections Using A Bilayer Chitosan Wound Dressing With Sustainable Antibiotic Delivery, Journal Of Biomedical Materials Research. 59 (2002) 438-449.
[340] L.C.D. Novaes, P.G. Mazzola, A. Pessoa, T.C.V. Penna, Effect Of Polyethylene Glycol On The Thermal Stability Of Green Fluorescent Protein, Biotechnology Progress. 26 (2010) 252-256.
[341] G. Thurow, K. Geisen, Stabilisation Of Dissolved Proteins Against Denaturation At Hydrophobie Interfaces, Diabetologia. 27 (1984) 212-218.
[342] N.A. Peppas, Hydrogels And Drug Delivery, Current Opinion In Colloid & Interface Science. 2 (1997) 531-537.
[343] A. Haug, B. Larsen, O. Smidsrød, Uronic Acid Sequence In Alginate From Different Sources, Carbohydrate Research. 32 (1974) 217-225.
[344] C.D. Rice, M.A. Dykstra, P.H. Feil, Microbial Contamination In Two Antimicrobial And Four Control Brands Of Alginate Impression Material, Journal of Prosthetic Dentistry. 67 (1992) 535-540.
[345] FMC Corporation, Introducing Protanal And Protacid, Fmc Biopolymer. Protanal - 11/99 (1999) 1-10.
[346] S. Wahie, C.M. Lawrence, Wound Complications Following Diagnostic Skin Biopsies In Dermatology Inpatients, Arch Dermatol. 143 (2007) 1267-1271.
[347] P.C. Alguire, B.M. Mathes, Skin Biopsy Techniques For The Internist, Journal of General Internal Medicine. 13 (1998) 46-54.
[348] J.K. Saha, J. Xia, J.M. Grondin, S.K. Engle, J.A. Jakubowski, Acute Hyperglycemia Induced By Ketamine/Xylazine Anesthesia In Rats: Mechanisms And Implications For Preclinical Models, Experimental Biology And Medicine. 230 (2005) 777-784.
[349] W.A. Dorsett-Martin, Rat Models Of Skin Wound Healing: A Review, Wound Repair and Regeneration. 12 (2004) 591-599.
[350] L.E. Lillie, N.J. Temple, L.Z. Florence, Reference Values For Young Normal Sprague-Dawley Rats: Weight Gain, Hematology And Clinical Chemistry, Human & Experimental Toxicology. 15 (1996) 612-616.

199
[351] R.I. Bashey, J.S. Perlish, R. Fleischmajer, Stimulation Of Collagen Synthesis In Embryonic Chick Skin By Insulin, Connective Tissue Research. 1 (1972) 189-193.