
English Language Acquisition Professional Development FY10
67
Report to the Legislature: English Language Acquisition Professional Development Pursuant to line item 7027-1004 and M.G.L. ch. 69 § 9I, March 2010 Massachusetts Department of Elementary and Secondary Education 75 Pleasant Street, Malden, MA 02148-4906 Phone 781-338-3000 TTY: N.E.T. Relay 800-439-2370 www.doe.mass.edu
Transcript of English Language Acquisition Professional Development FY10
Report to the Legislature English Language Acquisition Professional Development
Pursuant to line item 7027-1004 and MGL ch 69 sect 9I March 2010
Massachusetts Department of Elementary and Secondary Education 75 Pleasant Street Malden MA 02148-4906 Phone 781-338-3000 TTY NET Relay 800-439-2370 wwwdoemassedu
This document was prepared by the Massachusetts Department of Elementary and Secondary Education
Mitchell D Chester EdD Commissioner
Board of Elementary and Secondary Education Members Ms Maura Banta Chair Melrose
Ms Harneen Chernow Jamaica Plain Mr Gerald Chertavian Cambridge
Mr Michael DrsquoOrtenzio Jr Chair Student Advisory Council Wellesley Dr Thomas E Fortmann Lexington
Ms Beverly Holmes Springfield Dr Jeff Howard Reading
Ms Ruth Kaplan Brookline Dr Dana Mohler-Faria Bridgewater
Mr Paul Reville Secretary of Education Worcester Dr Sandra L Stotsky Brookline
Mitchell D Chester EdD Commissioner and Secretary to the Board
The Massachusetts Department of Elementary and Secondary Education an affirmative action employer is committed to
ensuring that all of its programs and facilities are accessible to all members of the public We do not discriminate on the basis of age color disability national origin race religion sex or sexual orientation
Inquiries regarding the Departmentrsquos compliance with Title IX and other civil rights laws may be directed to the Human Resources Director 75 Pleasant St Malden MA 02148 781-338-6105
copy 2010 Massachusetts Department of Elementary and Secondary Education Permission is hereby granted to copy any or all parts of this document for non-commercial educational purposes Please
credit the ldquoMassachusetts Department of Elementary and Secondary Educationrdquo
This document printed on recycled paper
Massachusetts Department of Elementary and Secondary Education 75 Pleasant Street Malden MA 02148-4906
Phone 781-338-3000 TTY NET Relay 800-439-2370 wwwdoemassedu
Massachusetts Department of
Elementary amp Secondary Education 75 Pleasant Street Malden Massachusetts 02148-4906 Telephone (781) 338-3000 TTY NET Relay 1-800-439-2370
Mitchell D Chester EdD
Commissioner
March 2010 Dear Members of the General Court The Department of Elementary and Secondary Education respectfully submits this Report to the Legislature English Language Acquisition Professional Development pursuant to Chapter 27 of the Acts of 2009 line item 7027-1004 addressing professional development to improve the academic performance of English language learners and effectively implement sheltered English immersion as outlined in Chapter 386 of the Acts of 2002 It also responds to the requirements of MGL ch69 sect 1I to annually analyze and publish data reported by school districts regarding English language learners programs and limited English proficient students According to the Departmentrsquos FY10 Student Information Management System (SIMS) data collection on October 1 2009 there were 59158 limited English proficient (LEP) students enrolled in the Commonwealthrsquos public school districts This number represents an increase of 2156 LEP students since last year while the total enrollment of public school students in the Commonwealth decreased by 1857 from 958910 to 957053 In 59 districts in the Commonwealth there are 100 or more English language learners (ELL) enrolled ranging from 104 ELLs in Chelmsford and Weymouth to 11271 ELLs in Boston There are 315 ldquolow incidencerdquo districts that report at least one English language learner More districts throughout the Commonwealth have English language learners in their classrooms than ever before See Attachments 1 and 2 for district details and trends from school year 2006 to school year 2010 The demand for quality educator training and student services is growing The change in law in 2002 from Transitional Bilingual Education (TBE) to Sheltered English Immersion (SEI) has resulted in a substantial impact on the skills and knowledge needed by elementary and secondary content teachers of English language learners Under TBE most English language learners had the opportunity to learn content (eg mathematics and science) through instruction in their first language while they took classes to develop proficiency in English With the Commonwealthrsquos SEI mandate most English language learners must now learn content through instruction delivered in English with all printed materials in English Classroom content teachers must adjust or ldquoshelterrdquo their instruction to make it comprehensible to students not yet proficient in English Few teachers in Massachusetts knew how to do this when the new law took effect SEI has two components English as a Second Language (ESL) instruction and sheltered content instruction taught in English This change calls for an emphasis on improving the quality and quantity of ESL instruction and has led to the recognition that we continue to have a critical shortage of licensed ESL teachers in the Commonwealth
There is growing consensus in the literature regarding both the elements of effective professional development for all teachers and the additional elements necessary for teachers of English language learners To be effective professional development must provide an opportunity for timely application of new skills and knowledge and integration in the context of the daily experience of a teacherrsquos work Department staff have identified the most common gaps in the knowledge and skills of educators implementing Sheltered English Immersion and organized them into four categories with the appropriate number of hours of professional development needed to cover each topic in sufficient depth to be successful Over the six-year history of the state grant the Department has offered professional development to teachers of English language learners These funds have been used to design professional development curricula to train teams of teachers to deliver these curricula in their home districts through ldquoTraining of Trainerrdquo (ToT) opportunities and to train teachers to become certified in ESL To date nearly 22000 trainers and teachers have participated in one or more of the category trainings representing 459 individual teachers and administrators In FY10 in order to increase the capacity of districts to provide Sheltered English Immersion professional development the Department developed and implemented the largest-ever ToT effort Educators from across the Commonwealth were selected to become trainers each successfully completed approximately 20-40 hours of ToT professional development These trained educators have been delivering category trainings to teachers across the Commonwealth during the current school year Attachments 4 and 5 list the districts and collaboratives that have participated in these professional development opportunities since 2004 Thirteen more trainings are expected to occur before the end of the school year with capacity for 40 teachers at each session It is anticipated that over 1000 total teachers and administrators will have received training by June 30 2010 The Department piloted the first administratorsrsquo SEI professional development training during the 2009-2010 academic year The module was based on the skills and knowledge and incorporated data review on English language learnersrsquo MEPA and MCAS performance Principals learned about the factors that influence second language acquisition research-based strategies specifically designed for ELLs and lessons based on content and language objectives This training also facilitated communication between ELL directors and principals regarding equitable education for ELLs The future need for category training to comply with the requirement that each elementary and secondary educator who teaches English language learners have the knowledge and skills to effectively support English language development and deliver sheltered content instruction is estimated to be at least 50000 teachers In addition to receiving sheltered content by qualified teachers all English language learners must receive instruction based on English language development delivered by a teacher licensed in ESL or ELL There is a need to increase access to daily ESL instruction for English language learners and consequently a need in most districts for additional licensed ESL teachers In September 2009 the Department updated its Guidance on Using MEPA Results to Plan Sheltered English Immersion Instruction and Make Reclassification Decisions for Limited English Proficient (LEP) Students and made recommendations for the number of hours of ESL instruction English language learners ought to receive at each of the five levels of English proficiency
To address professional development for ESL teachers the Department has used a combination of state and federal funds to support four cohorts of the Massachusetts English Language Teacher Initiative (MELT) which is designed to provide instruction support and mentoring to licensed teachers who wish to become licensed ESL teachers Teachers from Boston and Worcester Public Schools have participated The first cohort took the Massachusetts Test for Educator Licensure (MTEL) in spring 2007 with 73 percent of those who participated obtaining a passing rate and becoming licensed ESL teachers Of the most recent cohort 92 percent of the teachers who completed the training and took the MTEL in ESL passed The future need for ESL teachers is approximately an additional 1300 ESL or ELL licensed teachers based on the assumption that one ESL teacher is needed for every 30 ESL students We estimate approximately 2000 ESL teachers to teach the nearly 60000 ELLs in our public schools To close the achievement gap with our English language learners professional development for all teachers of English language learners along with increasing the number of ESL licensed teachers is a key component to achieving success In short the need for teacher training ESL certification and ELL services is growing at a time when fiscal support is declining The Department has advocated for increased resources to serve the growing population of ELLs In the meantime we continue to pursue initiatives that maximize the impact of the limited resources available If you would like to discuss this further I would be happy to do so Sincerely Mitchell D Chester EdD Commissioner of Elementary and Secondary Education
Table of Contents
Introduction 1
Background 1
I English Language Learners in Massachusetts 3
II Educators Implementing Sheltered English Immersion Elementary and Secondary Content Teachers of English Language Learners 7
Research on Professional Development for Educators of English Language Learners 7
Gaps in Knowledge 8
III Use of Funds for Category Training 8
Future Need for Category Training 10
IV Educators Implementing Sheltered English Immersion English as a Second Language (ESL) Teachers 11
ESL Teacher Shortage 11
V Use of Funds ESL Teachers and ESL Curriculum Development 13
Massachusetts English Language Teacher Initiative (MELT) 13
Improvement of Sheltered English Immersion Content-based ESL Instruction 14
Future Need for ESL teachers 14
VI Budget 16
Attachments 17
Attachment 1 All Massachusetts public school districts and changes in LEP population compared to changes in overall student population - SY 2006-SY 2010 17
Attachment 1 Massachusetts public school districts and changes in LEP population compared to changes in overall student population - SY 2006-SY 2010 18
Attachment 2 Massachusetts public school districts with large changes in LEP population compared to changes in overall student population - SY 2006-SY 2010 28
Attachment 3 Bibliography Professional Development for Teachers of English Language Learners 31
Attachment 4 Excerpts from the Commissionerrsquos Memorandum of June 2004 Guidance on Qualifications for Teachers of Limited English Proficient Students in Sheltered English Immersion Classrooms 32
Attachment 5 Districts Receiving Sheltered English Immersion Professional Development 2004-2010 35
Attachment 6 Collaboratives that have received grants for Sheltered English Immersion Professional Development 2004-2010 37
Attachment 7 English Language Learners in Massachusetts District and Program Type October 2009 38
Attachment 8 English Language Learners in Massachusetts District and First Language October 2009 50
1
Introduction The Department of Elementary and Secondary Education respectfully submits this Report to the Legislature English Language Acquisition Professional Development pursuant to Chapter 27 of the Acts of 2009 line item 7027-1004 and pursuant to MGL C 69 s9I addressing the following provisions
ldquoFor English language acquisition professional development to improve the academic performance of English language learners and effectively implement sheltered English immersion as outlined in chapter 386 of the acts of 2002 provided that the department shall only approve professional development courses and offerings with proven replicable results in improving teacher performance and which shall have demonstrated the use of best practices as determined by the department including data comparing pre-training and post-training knowledge provided further that the department shall not later than February 15 2010 provide a report on the number of educators who have received such training since passage of said chapter 386 the estimated number who need such additional training and a review and analysis of the most effective types of professional development and the most common gaps in the knowledge base of educators implementing English immersion and teaching English language acquisition along with legislative or regulatory recommendations of the department provided further that said report shall be provided to the secretary of administration and finance the senate president the speaker of the house the chairs of the house and senate ways and means committees and the house and senate chairs of the joint committee on education and provided further that no funds shall be expended for personnel costsrdquo (Line-item 7027-1004) and ldquoThe commissioner annually shall analyze and publish data reported by school districts under this section regarding English language learners programs and limited English proficient students Publication shall include but need not be limited to availability on the departmentrsquos worldwide web site The commissioner shall submit annually a report to the joint committee on education arts and humanities on such data on a statewide and school district basis including but not limited to by language group and type of English language learners program (MGL ch69 sect 1I)
In FY10 the legislature appropriated $397937 in Chapter 27 of the Acts of 2009 line-item 7027-1004 to support professional development for educators of English language learners to implement Sheltered English Immersion and to teach English language acquisition In FY09 and FY08 the legislature appropriated $470987 and in FY07 $500000 was appropriated In FY06 and FY05 $1000000 was appropriated each year for similar purposes
Background Sheltered English Immersion is the program model that has been required for most English language learners in Massachusetts public schools since a change in the state law in 2002 This change in law resulted from Chapter 386 of the Acts of 2002 (known as Question 2) an initiative petition on the November 5 2002 ballot approved by Massachusetts voters Question 2
2
amended in its entirety the Transitional Bilingual Education (TBE) statute GL c 71A the state statute which governs the education of English language learners (ELLs) In July 2003 the legislature passed further amendments to G L c 71A as part of the FY04 budget The new law was implemented in school districts beginning in September 2003 Sheltered English Immersion (SEI) is defined in Chapter 71A as
ldquoan English language acquisition process for young children in which nearly all classroom instruction is in English with the curriculum and presentation designed for children who are learning the language Books and instruction materials are in English and all reading writing and subject matter are taught in English Although teachers may use a minimal amount of the childrsquos native language when necessary no subject matter shall be taught in any language other than English and children in this program learn to read and write solely in English This educational methodology represents the standard definition of lsquosheltered Englishrsquo or lsquostructured Englishrsquo found in educational literaturerdquo See MGL ch 71A sect 2
SEI has two components English as a Second Language (ESL) instruction and sheltered content instruction taught in English The change from TBE to SEI has resulted in a substantial impact on the skills and knowledge needed by elementary and secondary content teachers of English language learners Under TBE most English language learners had the opportunity to learn content (eg mathematics and science) through instruction in their first language while they took classes to develop proficiency in English With the Commonwealthrsquos SEI mandate most English language learners must now learn content through instruction delivered in English with all printed materials in English Content teachers must adjust or ldquoshelterrdquo their instruction to make it comprehensible to students not yet proficient in English Few teachers in Massachusetts knew how to do this when the new law took effect Another consequence of the new law has been that English language learners must acquire academic levels of English proficiency more quickly than before If they do not their ability to successfully comprehend content instruction delivered in English will be compromised This calls for an emphasis on improving the quality and quantity of ESL instruction and has led to the recognition that we continue to have a critical shortage of licensed ESL teachers in the Commonwealth
3
I English Language Learners in Massachusetts According to the Departmentrsquos Student Information Management System (SIMS) data collection October 1 2009 report there were then 59158 limited English proficient (LEP) students enrolled in the Commonwealthrsquos public school districts This number represents an increase of 2156 LEP students since last year while the total enrollment of public school students in the Commonwealth decreased from 958910 to 957053 (a 1857 difference) since last year As of October 1 2009 59 districts in the Commonwealth reported an enrollment of 100 or more English language learners while 315 districts report at least one English language learner1 The LEP student population has continued to grow while the overall student population has decreased in Massachusetts Table 1 compares the growth in the LEP population to the decrease in the student population overall since SY 2006 Table 1 Increase in LEP population in MA public school districts compared to overall student population
SY 2006 SY 2010 Change All LEP All LEP All LEP State 972371 51618 957053 59158 -15318 7540 Source The Department Student Information Management System 2009
As the number of LEP students has increased the number of districts in which LEP students are enrolled has also increased Of the public school districts in the Commonwealth who currently enroll LEP students 62 reported zero enrolled LEP students in SY 2006 Currently 53 of these districts report between 1 and 10 LEP students and 9 of these districts enroll between 11 and 35 LEP students Districts that enroll fewer than 100 English language learners are often referred to as ldquolow incidencerdquo districts and within these low-incidence districts English language learners may be distributed across all grades and all schools within the district Of the 59 public school districts that enrolled more than 100 LEP students as of the October 1 2009 SIMS data collection these numbers range from 104 in Chelmsford and Weymouth to 11271 in Boston See Attachment 2 for more detail Table 3 details the districts with the highest percentage of LEP students (as a percentage of the overall student population) according to 2010 SIMS data Table 4 details the twenty districts with the largest numbers of LEP students Of note is that the districts with the top ten LEP student populations only include eight of the ten Commissionerrsquos urban districts
1 Per last yearrsquos legislative report in FY09 303 districts reported at least one LEP student and 57 districts reported over 100 LEP students
4
Table 2 MA public school districts with the highest percentage of LEP enrollment and change in LEP enrollment from SY 2006 to SY 2010
2010 Student Enrollment LEP Change 2006-
10
District All LEP LEP Lawrence Family Development Charter School 596 252 42 28 13 Lowell 13331 4321 32 463 12 Community Day Charter Public School 331 98 30 -5 -5 Worcester 23988 6388 27 2768 76 Lowell Community Charter Public School 946 247 26 48 24 Lynn 13373 3465 26 468 16 Holyoke 5901 1377 23 -153 -10 Lawrence 12284 2835 23 83 3 Boston 55371 11271 20 2071 23 Brockton 15502 2737 18 995 57 Chelsea 5638 922 16 -236 -20 Seven Hills Charter Public School 673 110 16 65 144 Somerville 4842 777 16 -107 -12 Framingham 8153 1271 16 -128 -9 Phoenix Charter Academy 164 25 15 25 Conservatory Lab Charter School 153 21 14 -1 -5 Amherst 1321 175 13 -18 -9 Springfield 25141 3288 13 -164 -5 Fitchburg 4997 593 12 -564 -49 Quincy 8969 1044 12 37 4
Source The Department Student Information Management System 2009
Table 3 MA public school districts with the largest numbers of LEP students and change from SY 2006 to SY 2010
2006 2010 Change 2006-10 Change 2006-10
District All LEP All LEP All LEP All LEP Boston 57349 9200 55371 11271 -1978 2071 -3 23 Worcester 24023 3620 23988 6388 -35 2768 0 76 Lowell 14096 3858 13331 4321 -765 463 -5 12 Lynn 13955 2997 13373 3465 -582 468 -4 16 Springfield 25206 3452 25141 3288 -65 -164 0 -5 Lawrence 12273 2752 12284 2835 11 83 0 3 Brockton 15896 1742 15502 2737 -394 995 -2 57 Holyoke 6485 1530 5901 1377 -584 -153 -9 -10 Framingham 8124 1399 8153 1271 29 -128 0 -9 Quincy 8763 1007 8969 1044 206 37 2 4 Chelsea 5495 1158 5638 922 143 -236 3 -20 Somerville 5136 884 4842 777 -294 -107 -6 -12 Malden 6287 601 6332 706 45 105 1 17 Newton 11567 565 11765 688 198 123 2 22 Revere 5839 658 6145 625 306 -33 5 -5 Fitchburg 5682 1157 4997 593 -685 -564 -12 -49 Everett 5262 604 5889 580 627 -24 12 -4 Fall River 10969 684 9886 514 -1083 -170 -10 -25 Marlborough 4662 509 4539 509 -123 0 -3 0 New Bedford 13441 591 12636 461 -805 -130 -6 -22
Source The Department Student Information Management System 2009
denotes Commissionerrsquos districts
5
Finally the change in LEP student populations in some of the Commonwealthrsquos largest and smallest districts is of note including increases and decreases in numbers of LEP students as a percentage of districtsrsquo student populations Table 4 below details the districts with the largest changes in LEP student population since SY 2006 For a listing of all Massachusetts school districts and changes in LEP student enrollment please see Attachment 1 For a listing of additional districts with large changes in enrollment please see Attachment 2 Table 4 MA public school districts with the largest changes in LEP student enrollment
Student
Enrollment 2006 2010 Change Change 2006
District All LEP All LEP All LEP All LEP Saugus 3188 5 2866 68 -322 63 -10 1260 Holliston 2971 3 2864 37 -107 34 -4 1133 Harwich 1441 4 1334 48 -107 44 -7 1100 Leicester 1950 2 1881 21 -69 19 -4 950 Lunenburg 1836 1 1702 10 -134 9 -7 900 Hopedale 1302 1 1308 9 6 8 0 800 Hamilton-Wenham 2177 5 2026 43 -151 38 -7 760 Westport 1905 2 1895 15 -10 13 -1 650 Lenox 850 1 829 7 -21 6 -2 600 Sabis International Charter School 1374 4 1573 25 199 21 14 525 Auburn 2310 9 2399 56 89 47 4 522 Boston Renaissance Charter Public School 1268 10 1206 58 -62 48 -5 480 Wilmington 3828 4 3783 22 -45 18 -1 450 Blackstone-Millville 2177 2 2064 11 -113 9 -5 450 Melrose 3537 14 3767 76 230 62 7 443 Hadley 635 3 714 16 79 13 12 433 Hingham 3764 2 4058 10 294 8 8 400
Source The Department Student Information Management System 2009
The maps on the next page illustrate the Commonwealthrsquos LEP student enrollment and illustrate the changes in the LEP student population throughout the Commonwealth As is indicated LEP student is widespread
6
7
Attachment 7 displays English language learners by number district and program type using October 2009 SIMS data A brief summary appears below Table 5 English Language Learners Program Enrollment
No ELL Program
(not enrolled)
Sheltered English
Immersion
Two-way Bilingual
Education
Other Bilingual
Education
Parental opt-out (No ELL
Program)
Total LEP
Students
1113 49096 1229 1342 6378 59158
Source The Department Student Information Management System 2009 Attachment 8 displays data on English language learners by number district and first language Discrete numbers are provided for the five most common first languages of English language learners in Massachusetts All other languages are aggregated in the ldquoOtherrdquo column A complete file with all languages disaggregated by district is available from the Massachusetts Department of Elementary and Secondary Education A brief summary appears below Table 6 English Language Learnersrsquo Most Common First Languages
Spanish Portuguese Cape
Verdean Haitian Creole Vietnamese Other
31793 4209 2458 2433 2423 15842
Source The Department Student Information Management System 2009
II Educators Implementing Sheltered English Immersion Elementary and Secondary Content Teachers of English Language Learners Most classroom teachers in Massachusetts did not acquire the skills and knowledge required to effectively teach English language learners and shelter content instruction during their teacher preparation programs The change in our state law mandating that schools adopt a sheltered English Immersion instructional model and the legal requirement that English language learners be taught by teachers with appropriate qualifications created an urgent need for teachers of English language learners to acquire new skills and knowledge
Research on Professional Development for Educators of English Language Learners There is growing consensus in the literature regarding both the elements of effective professional development for all teachers and the additional elements necessary for teachers of English language learners To be effective professional development must provide an opportunity for timely application of new skills and knowledge and integration into the context of the daily experience of a teacherrsquos work Also high quality professional development must be internally coherent rigorous and aligned with the principles of effective teaching and learning
8
In addition to embodying these more universal characteristics of high quality professional development professional development for teachers of English language learners must include specific knowledge relevant to teaching English language learners including the basic tenets of bilingualism and second language acquisition definitions of language proficiency the role of first language and culture in learning and teaching and the demands of academic language spoken and written in content classrooms (Clair 1993) A short bibliography of this research is included as Attachment 3
Gaps in Knowledge After reviewing relevant research and consulting with leaders in the field of English language learners educators in Massachusetts and nationally Department staff identified the most common gaps in the knowledge and skills of educators implementing Sheltered English Immersion In a memorandum issued in June 2004 Qualifications of Teachers of Limited English Proficient (LEP) Students in Sheltered English Immersion (SEI) Classrooms the Commissioner of Education described the skills and knowledge required to effectively shelter content instruction See Attachment 2 Skills and knowledge were organized into four categories and the appropriate number of hours of professional development needed to cover each topic in sufficient depth was identified Category 1 Second Language Learning and Teaching 10-15 hours of professional development Category 2 Sheltering Content Instruction 30-40 hours of professional development Category 3 Assessing Speaking and Listening 10 hours of professional development Category 4 Reading and Writing in the Sheltered Content Classroom 15-20 hours of professional development
III Use of Funds for Category Training Over the six-year period FY05 to FY10 the Department received a total of nearly $37 million through the state budget to offer professional development to teachers of English language learners These funds have been used to design professional development curricula to train teams of teachers to deliver these curricula in their home districts through ldquoTraining of Trainerrdquo (ToT) opportunities and to train teachers to become certified in ESL The funds have also provided category training for additional teachers (including those conducted at the Commonwealthrsquos regional educational collaboratives) All of the professional development designed and delivered with these funds has been aligned with the categories of teacher knowledge and skills described above A chart detailing the professional development delivered to date is presented below
9
Table 7 Category Training2
SEI Professional Development Categories3
2004-2005
2005-2006
2006-2007
2007-2008
2008-2009
2009-2010
Total Participants
(by Category)
Category 1 Teachers 516 1338 2567 2998 1873 1529 10821 Trainers 35 43 43 39 0 0 160 Total 551 1381 2610 3037 1873 1529 10981
Category 2 Teachers 712 1199 1378 1373 1000 1119 6781 Trainers 0 36 92 48 0 82 258 Total 712 1235 1470 1421 1000 1201 7039
Category 4 Teachers 36 202 276 447 598 2124 3683 Trainers 0 0 41 46 42 66 195 Total 36 202 317 493 640 2190 3878 Total (by Year)4 1299 2818 4397 4951 3513 4920 21898 Total Teachers Trained (2004-2010)3 Total Trainers Trained (2004-2010)3 Total3
21285 613 21898 Source The Department Office of Language Acquisition and Academic Achievement 2010 In FY10 the Department was able to offer professional development through all of the aforementioned initiatives In order to increase the capacity of districts to provide their own trainings in the four categories of SEI professional development the Department developed and implemented the largest-ever ToT effort Through a Department application process educators from across the Commonwealth were selected to become trainers for categories 2 and 4 Each successfully completed approximately 20-40 hours of ToT professional development in these categories These trained educators have been delivering category trainings to teachers across the Commonwealth during the current school year In addition during FY10 thus far professional development in categories 1 2 and 4 has been delivered to teachers in 52 school districts in association with 17 educational collaboratives
2 Note that this chart reflects trainings that have resulted from the expenditure of this line item Additional category trainings have been provided through universities colleges district-based professional development groups and other agencies The syllabi for most of these courses have been submitted to the Department for determination that they are aligned with the skills and knowledge for SEI category training 3 These data represent both completed category trainings as well as a small number of category trainings that are scheduled during the remainder of this school year at individual districts and through the collaborative training initiative by June 30 2010 The numbers are expected to increase as the Department requires data to be submitted only after category training has been completed 4 These totals do not signify that 21285 different teachers or 613 different trainers have been trained Many teachers and trainers participated in more than one category training
10
Attachments 4 and 5 list the districts and collaboratives that have participated in these professional development opportunities since 2004 Thus far 459 teachers and administrators have received training through this in initiative Thirteen more trainings are expected to occur before the end of the school year through this initiative with capacity for 40 teachers at each It is anticipated that over 1000 total teachers and administrators will have received Category training through this initiative by June 30 2010 The Department has also used a combination of state and federal funds to support English as a Second Language (ESL) curriculum development ESL curriculum development workshops were also offered in Malden and Northampton to educators from 19 districts during FY10 These two and one-half day workshops were designed to assist teachers in developing plans for content-based ESL instruction In response to the need for district and school administratorsrsquo understanding of and support for Sheltered English Immersion and related professional development the Department piloted the first administratorsrsquo SEI professional development training during the 2009-2010 academic year The module was based on the skills and knowledge of the four categories and incorporated data review on English language learnersrsquo MEPA and MCAS performance Principals learned about the factors that influence second language acquisition research-based strategies specifically designed for ELLs and lessons based on content and language objectives The texts activities and structure of this training also facilitated communication between ELL directors and principals regarding equitable education for ELLs The training was well-received and a second pilot has begun The Department has developed an application process for lead instructors to conduct the first administratorsrsquo SEI professional development ToT in order to continue and advance the initiative
Future Need for Category Training As has been detailed in section I of the report English language learners are widely distributed in schools and districts throughout Massachusetts As has been mentioned there were 59158 limited English proficient (LEP) students enrolled in the Commonwealth as of the October 1 2009 SIMS data collection As has also been mentioned as of October 1 2009 59 districts in the Commonwealth reported an enrollment of 100 or more English language learners while 315 districts report at least one English language learner Again districts that enroll fewer than 100 English language learners are often referred to as ldquolow incidencerdquo districts and within these low-incidence districts English language learners may be distributed across all grades and all schools within the district It is within this complex context that we must attempt to estimate future need for SEI professional development
We base our estimate on the following data and assumptions
1) Each elementary and secondary educator who teaches English language learners must complete all four categories of professional development in order to develop the knowledge and skills required to effectively support English language development and deliver sheltered content instruction
11
2) In order for an educator to be qualified to teach sheltered content and prepared for an English language learner to enter his or her classroom each educator must complete all four categories of professional development 3) The acquisition of the knowledge and skills on which the four categories are based on average requires approximately 65 to 85 hours of training 4) There are 70395 educators in the Commonwealth 5) To date approximately 20000 teachers have received or will receive training in one or more categories by the end of the 2009-2010 school year 6) At least 50000 teachers need to be trained in one or more of the four categories in order to be prepared for an English language learner entering their classroom
To address the need for future category training the budget requested below seeks state funds to continue regional category trainings and to continue ToT initiatives in categories 2 and 4 and a ToT for administrators In addition the budget requested below seeks state funds to design the remaining module of Category 4 (Teaching Reading and Writing in Sheltered Content Classes) The original blueprint for the Department-created Category 4 included three distinct modules Category 4C was designed in 2007 for secondary students Category 4B was likewise designed in 2009 for teaching reading and writing in elementary sheltered content classes Category 4A will be designed to address the unique reading and writing needs of beginning ELLs at the preschool level and preliterate ELLs in early elementary grades
IV Educators Implementing Sheltered English Immersion English as a Second Language (ESL) Teachers
ESL Teacher Shortage Most English language learners in Massachusetts must now learn all subject matter content in English as they acquire English language and literacy skills In addition to receiving sheltered content by qualified (trained in categories 1-4) teachers all English language learners must receive instruction based on English language development delivered by a teacher licensed in ESL or ELL There is a need to increase the hours of daily ESL instruction for English language learners and consequently a need in most districts of the Commonwealth for additional licensed ESL teachers5 Some districts employ no teachers licensed in ESL or ELL The Department has previously emphasized this need for more ESL instruction in a memorandum of guidance in June 2005 The document stated appropriate recommendations for the number of hours of ESL instruction English language learners ought to receive at each level of English proficiency6 This guidance was updated in September 2009 to consider newly developed proficiency levels of the Massachusetts English Proficiency Assessment (MEPA) the statersquos annual assessment of English language proficiency for English language learners in
5 Additionally Section 24 of Chapter 218 of the Acts of 2002 mandates that by July 2008 each school district will have at least one teacher who is certified in English as a second language bilingual education 6 Guidelines for Using MEPA Results to Plan SEI Instructional Programming June 2005
12
kindergarten through grade 12 See Guidance on Using MEPA Results to Plan Sheltered English Immersion Instruction and Make Reclassification Decisions for Limited English Proficient (LEP) Students available at httpwwwdoemassedumcasmepa2009guidancepdf An excerpt from this guidance appears below
Recommended Instructional Programming for LEP Students at Each MEPA Performance Level Level 1 and Level 2 Students at Level 1 and Level 2 MEPA performance levels generally produce and understand very little if any spoken or written English or may have only very basic English skills It is important that these students receive English language development instruction for a substantial portion of their school day because sheltered content instruction the other component of SEI will be challenging for students at lower levels of English proficiency Recommended Instruction for LEP Students at Level 1 and Level 2 (Elementary Middle and High School) bull English as a Second Language (ESL) instruction 25 hoursday to a full day of direct ESL instruction delivered by a licensed ESL teacher bull Content instruction other hours as available outside of ESL instruction delivered by a teacher qualified7 to teach LEP students and licensed in the appropriate content area bull Specialselectives eg physical education art music same schedule as for other students in the grade level Level 3 Students at Level 3 MEPA performance level generally demonstrate a range of mid-level English proficiency in speaking listening reading and writing but have not yet developed academic proficiency in English Sheltered content instruction should be tailored to provide comprehensive content instruction and engaging learning tasks to students at Level 3 who have wide ranging English proficiency Students at Level 3 should also receive ESL instruction as outlined below Recommended Instruction for LEP Students at Level 3 (Elementary Middle and High School) bull English as a Second Language (ESL) instruction 1-2 hours of direct ESL instruction per day delivered by a licensed ESL teacher bull ELA or reading instruction 1-2 hours per day delivered by a teacher qualified to teach LEP students and licensed in ELA or reading bull Content instruction other available hours outside of ESL instruction delivered by a teacher qualified to teach LEP students and licensed in the appropriate content area bull Specialselectives eg physical education art music same schedule as for other students in the grade level
7 See Commissionerrsquos June 15 2004 memo wwwdoemasseduellseiqualificationspdf which discusses the four categories of skills and knowledge applicable to teachers of LEP students The language ldquoa teacher qualified to teach LEP studentsrdquo when used in this report and in the cited guidance refers to teachers meeting the criteria set forth in the Commissionerrsquos June 15 2004 memo
13
Level 4 and Level 5 (for students not yet reclassified as non-LEP) Students at Level 4 and in the low range of Level 5 MEPA performance levels generally demonstrate good English proficiency However a student performing overall at Level 5 may not have all the skills associated with a Level 5 student in all four areas of the MEPA A student should either be ldquoAt or Aboverdquo or ldquoApproachingrdquo in all four areas before being considered for reclassification (see MEPA parentguardian reports or electronic data files to obtain this information about each student) Increasingly complex and varied language demands on LEP students in late elementary middle and high school may also support the decision by school-based teams to delay the reclassification of certain students at Level 4 and Level 5 who are aspiring to achieve academic parity with English-speaking peers Recommended Instruction for LEP Students at Level 4 and Level 5 (Elementary Middle and High School) bull English as a Second Language (ESL) instruction a minimum of 25 hours of direct ESL instruction per week delivered by a licensed ESL teacher bull Content instruction other available hours outside of ESL instruction delivered by a teacher qualified to teach LEP students and licensed in the appropriate content area
bull Specialselectives eg physical education art music same schedule as for other students in the grade level In addition to this guidance concerning recommended hours of ESL instruction the provisions of Section 24 of Chapter 218 of the Acts of 2002 which took effect in July of 2008 mandate that districts shall have at least one teacher who is certified in English as a second language bilingual education or other English language learners program(s) under Section 38G of Chapter 71 or regulations promulgated theretordquo
V Use of Funds ESL Teachers and ESL Curriculum Development
Massachusetts English Language Teacher Initiative (MELT) The Department has used a combination of state and federal funds to support four cohorts of the Massachusetts English Language Teacher Initiative (MELT) MELT is designed to provide instruction support and mentoring to licensed teachers who wish to become licensed ESL teachers The MELT curriculum is based on the competencies as outlined in the Massachusetts teacher licensure regulations linguistics second language acquisition sociolinguistics second language pedagogy literacy instruction and assessment of English language learners over a period of 10 months Participants spend a total of 13 days in face-to-face classes do weekly assigned readings and submit weekly online summaries of reading and responses to reflective prompts There are also formal written assignments At the conclusion of the training programs each participating teacher engages in a mentored practicum followed by a clinical classroom evaluation Teachers from Boston Public Schools and Worcester Public Schools have participated in the Departmentrsquos MELT initiatives to date The first cohort of MELT participants took the Massachusetts Test for Educator Licensure (MTEL) in spring 2007 Seventy-three percent of those who participated obtained a passing rate and became licensed ESL teachers The second cohort took the MTEL in March 2008 and 75 percent obtained a passing score A third cohort
14
was run during FY 09 and 92 percent of the teachers who completed the training and took the MTEL in ESL passed A fourth cohort began in July 2009 and will conclude in June 2010 Fourteen teachers from the Boston Public Schools are participating in this cohort and most of these teachers are expected to take the MTEL in June or July 2010 There has been a very positive response to this initiative at both the district and teacher levels
Improvement of Sheltered English Immersion Content-based ESL Instruction As stated above most of the over 59000 English language learners in Massachusetts are required to learn subject matter content in English The Department has determined a need to provide more hours of daily ESL instruction to English language learners and consequently a need for more licensed ESL teachers throughout the state MEPA results and the number of years students actually need to acquire English proficiency have placed urgency on reexamining and defining the role of the ESL teacher and the exact content of ESL instruction Mastery of subject matter standards depends on students having a relatively high level of English language proficiency Therefore English language teaching (ie ESL instruction) must be intentionally curriculum-based and must develop academic vocabulary and language structures It is essential that content-based ESL instruction become the orientation to most ESL instruction in Massachusetts During FY09 the Department completed a web-based tool that supports districts as they develop their district ESL Curriculum This tool Guidelines for Developing a Content-based ESL Curriculum can be found at the following link httpwwwdoemasseduellcdguide In addition and as was mentioned previously the Department used a combination of state and federal funds to offer ESL Curriculum Development workshops during FY10
Future Need for ESL teachers As reported earlier in this document there are currently 59158 limited English proficient students in the Commonwealth Though 315 school districts report at least one English language learner ESL teachers are employed in only 129 districts Again the provisions of Section 24 of Chapter 218 of the Acts of 2002 which took effect in July of 2008 mandate that districts shall have at least one teacher who is certified in English as a second language bilingual education or other English language learners program(s) under Section 38G of Chapter 71 or regulations promulgated theretordquo Due to steadily increasing numbers of English language learners in Massachusetts changing demographics and the requirements of the law more districts need ESL teachers To estimate future need the Department examined two data sets that look at this issue from two different perspectives The first data set comes from the Educator Personnel Information Management System (EPIMS) The Department uses EPIMS to collect demographic data and work assignment information on individual public school educators The first statewide EPIMS data collection period was from October 1ndashDecember 31 2007 In order to teach English as a second language (ESL) a teacher must be licensed in ESL or ELL EPIMS data indicates that there are approximately 8825 FTE teachers in Massachusetts that
15
report their assignment as ESL teacher8 Of these FTEs 2068 (or 23 percent) do not have ESL or ELL licenses9 If we assume that one ESL teacher is needed for every 30 ESL students then the Commonwealth needs approximately 1972 teachers certified in ESL or ELL (or approximately 1300 additional ESL or ELL licensed teachers assigned to teach ESL) The second data set comes from districts reporting 100 or more English language learners and that receive Title IIINCLB funds In FY10 58 districts were eligible for Title III funds As part of their Title III grant applications for the 2009-2010 school year the Department asked these 58 districts to report the number of hours of ESL instruction received by ELL students at different levels of English language proficiency at different grades According to these reports
Approximately 11409 English language learners receive no ESL instruction10 Approximately 1757 English language learners at the lowest levels of English
proficiency (beginning and early intermediate) receive no ESL instruction11
It is important to note that these numbers do not reflect any potential deficiencies in the ESL instruction provided to English language learners in the Commonwealthrsquos low incidence districts If the expectation is that all English language learners will achieve academic levels of English proficiency that enable them to reach high academic performance there is a critical need to provide robust programs of ESL instruction At present this is not happening in many districts and for many students in the Commonwealth To address the shortage of licensed ESL teachers and by extension the lack of adequate ESL instruction in our state the budget requested below seeks state funds to expand the MELT initiative to additional school districts with high populations of English language learners
8 This number includes teachers whose primary assignment is reported as ldquoESL teacherrdquo (2928 FTEs at the elementary level and 2904 FTEs at the secondary level) as well as teachers who hold an ESL or ELL license but are reported as teaching sheltered content work assignments (and who may not be teaching ESL) (2128 FTEs) 9 An additional 2128 teachers who hold licensure in ESL or ELL are reported as having job assignments as sheltered content teachers 10 These students are from the following public school districts Attleboro Boston Brockton Haverhill Lawrence Lynn Norwood Peabody Pittsfield Quincy Salem Springfield Taunton and Worcester Numbers of ESL students who do not receive ESL instruction range from 15 students in Taunton to 3791 students in Boston 11 These students are from the following public school districts Attleboro Boston Brockton Haverhill Lynn Springfield and Worcester Numbers of beginner ESL students who reportedly do not receive ESL instruction range from four students in Attleboro to 397 students in Boston
16
VI Budget The Board of Elementary and Secondary Education in its FY10 budget proposal recommended funding this line item at $470987 The legislature funded the line item at $397937 The Board of Education has identified English learner education as a high priority area for funding given the growing need for teachers to work with the growing population of English language learners Funding from the legislature will enable the Department to continue training elementary and secondary content teachers of English language learners to shelter content instruction as required by state law and would also permit the Department to continue and expand the ESL teacher training initiative and prepare 40 additional licensed teachers to become qualified ESL teachers A proposal for expenditure of level funding follows
SEI Professional Developmenthelliphelliphelliphelliphelliphelliphelliphelliphelliphelliphelliphellip $277937 Category 4B Training of Trainers (2)helliphelliphellip$30000 Category 4C Training of Trainershelliphelliphelliphelliphellip$15000 Category 1 Training of Trainers (2)helliphelliphelliphellip$30000 Category 4A ndash Development of Traininghelliphellip$15000 Administrators SEI PD Training of Trainershellip$15000 Regional trainings for teachers in Categories 1 2 and 4helliphelliphelliphelliphellip$172937
ESL Teacher Licensure Initiativehelliphelliphelliphelliphelliphelliphelliphelliphelliphelliphelliphelliphellip $120000 Training of 40 licensed ESL Teachers _______________ Totalhelliphelliphelliphelliphelliphelliphelliphelliphelliphelliphelliphelliphelliphelliphelliphelliphelliphelliphelliphelliphelliphelliphelliphellip $397937
17
Attachments
Attachment 1 All Massachusetts public school districts and changes in LEP population compared to changes in overall student population - SY 2006-SY 2010 Attachment 2 Public school districts with large changes in LEP population compared to changes in overall student population - SY 2006-SY 2010 Attachment 3 Bibliography Professional Development for Teachers of English Language Learners Attachment 4 Excerpts from the Commissionerrsquos Memorandum of June 2004 Guidance on Qualifications for Teachers of Limited English Proficient Students in Sheltered English Immersion Classrooms Attachment 5 Districts Receiving Sheltered English Immersion Professional Development 2004-2010 Attachment 6 Collaboratives that have received grants for Sheltered English Immersion Professional Development 2004-2010 Attachment 7 English Language Learners in Massachusetts District and Program Type October 2009 Attachment 8 English Language Learners in Massachusetts District and First Language October 2009
18
Attachment 1 Massachusetts public school districts and changes in LEP population compared to changes in overall student population - SY 2006-SY 2010
Student Enrollment SY 2006
Student Enrollment SY 2010
Change Change
District All LEP All LEP All LEP All LEP
State 972371 51618 957053 59158 -15318 7540 -2 15 Abington 2358 4 2189 10 -169 6 -7 150 Acton 2546 19 2614 81 68 62 3 326 Acushnet 1087 0 996 1 -91 1 -8 Agawam 4364 60 4273 97 -91 37 -2 62 Amesbury 2503 5 2424 21 -79 16 -3 320 Amherst 1470 193 1321 175 -149 -18 -10 -9 Andover 6017 48 6163 83 146 35 2 73 Arlington 4522 249 4713 192 191 -57 4 -23 Ashland 2654 61 2640 67 -14 6 -1 10 Attleboro 6196 407 5933 267 -263 -140 -4 -34 Auburn 2310 9 2399 56 89 47 4 522 Avon 757 0 748 1 -9 1 -1 Ayer 1325 19 1197 60 -128 41 -10 216 Barnstable 4728 195 4293 176 -435 -19 -9 -10 Bedford 2282 35 2429 49 147 14 6 40 Belchertown 2602 20 2610 24 8 4 0 20 Bellingham 2599 9 2635 27 36 18 1 200 Belmont 3694 99 3974 92 280 -7 8 -7 Berkley 1009 0 921 0 -88 0 -9 Berlin 249 1 212 1 -37 0 -15 0 Beverly 4459 45 4269 39 -190 -6 -4 -13 Billerica 6406 61 5940 81 -466 20 -7 33 Boston 57349 9200 55371 11271 -1978 2071 -3 23 Bourne 2602 5 2372 1 -230 -4 -9 -80 Boxborough 560 0 495 6 -65 6 -12 Boxford 988 0 917 4 -71 4 -7 Boylston 383 0 377 10 -6 10 -2 Braintree 5195 56 5377 111 182 55 4 98 Brewster 478 2 503 9 25 7 5 350 Brimfield 366 0 344 0 -22 0 -6 Brockton 15896 1742 15502 2737 -394 995 -2 57 Brookfield 296 0 304 0 8 0 3 Brookline 6014 357 6472 496 458 139 8 39 Burlington 3551 57 3711 64 160 7 5 12 Cambridge 5803 547 5950 303 147 -244 3 -45 Canton 3073 34 3125 36 52 2 2 6 Carlisle 808 0 698 11 -110 11 -14 Carver 2043 5 1847 2 -196 -3 -10 -60 Chatham 700 19 674 19 -26 0 -4 0 Chelmsford 5693 48 5418 104 -275 56 -5 117 Chelsea 5495 1158 5638 922 143 -236 3 -20 Chicopee 7527 404 7845 354 318 -50 4 -12
19
Student Enrollment SY 2006
Student Enrollment SY 2010
Change Change
District All LEP All LEP All LEP All LEP
Clarksburg 196 0 175 0 -21 0 -11 Clinton 2046 92 1996 144 -50 52 -2 57 Cohasset 1515 0 1496 0 -19 0 -1 Concord 1930 26 1894 36 -36 10 -2 38 Conway 158 0 175 0 17 0 11 Danvers 3592 23 3617 16 25 -7 1 -30 Dartmouth 4295 33 4017 39 -278 6 -6 18 Dedham 2897 100 2910 114 13 14 0 14 Deerfield 468 0 490 7 22 7 5 Douglas 1746 2 1771 3 25 1 1 50 Dover 619 3 572 9 -47 6 -8 200 Dracut 4211 66 4107 43 -104 -23 -2 -35 Duxbury 3345 0 3298 0 -47 0 -1 East Bridgewater 2522 8 2375 0 -147 -8 -6 -100 Eastham 207 0 225 1 18 1 9 Easthampton 1611 18 1575 40 -36 22 -2 122 East Longmeadow 2818 0 2850 2 32 2 1 Easton 3875 16 3906 37 31 21 1 131 Edgartown 350 23 328 26 -22 3 -6 13 Erving 185 0 174 0 -11 0 -6 Everett 5262 604 5889 580 627 -24 12 -4 Fairhaven 2180 5 1986 3 -194 -2 -9 -40 Fall River 10969 684 9886 514 -1083 -170 -10 -25 Falmouth 4144 35 3750 44 -394 9 -10 26 Fitchburg 5682 1157 4997 593 -685 -564 -12 -49 Florida 115 0 115 0 0 0 0 Foxborough 2991 18 2867 14 -124 -4 -4 -22 Framingham 8124 1399 8153 1271 29 -128 0 -9 Franklin 6136 21 6120 55 -16 34 0 162 Freetown 542 0 533 0 -9 0 -2 Gardner 3067 100 2600 95 -467 -5 -15 -5 Georgetown 1723 0 1688 2 -35 2 -2 Gloucester 3803 63 3372 75 -431 12 -11 19 Gosnold 2 0 4 0 2 0 100 Grafton 2675 17 2902 14 227 -3 8 -18 Granby 1154 0 1125 13 -29 13 -3 Granville 256 1 163 0 -93 -1 -36 -100 Greenfield 1861 98 1496 54 -365 -44 -20 -45 Hadley 635 3 714 16 79 13 12 433 Halifax 718 0 654 0 -64 0 -9 Hancock 44 0 41 0 -3 0 -7 Hanover 2794 2 2698 8 -96 6 -3 300 Harvard 1300 0 1277 2 -23 2 -2 Harwich 1441 4 1334 48 -107 44 -7 1100 Hatfield 459 2 456 0 -3 -2 -1 -100 Haverhill 7590 426 6845 461 -745 35 -10 8 Hingham 3764 2 4058 10 294 8 8 400 Holbrook 1398 43 1161 26 -237 -17 -17 -40 Holland 269 0 251 1 -18 1 -7 Holliston 2971 3 2864 37 -107 34 -4 1133
20
Student Enrollment SY 2006
Student Enrollment SY 2010
Change Change
District All LEP All LEP All LEP All LEP
Holyoke 6485 1530 5901 1377 -584 -153 -9 -10 Hopedale 1302 1 1308 9 6 8 0 800 Hopkinton 3432 9 3453 38 21 29 1 322 Hudson 2820 125 3071 114 251 -11 9 -9 Hull 1255 0 1202 3 -53 3 -4 Ipswich 2085 10 2137 18 52 8 2 80 Kingston 1175 0 1180 3 5 3 0 Lakeville 797 2 742 0 -55 -2 -7 -100 Lanesborough 303 0 270 2 -33 2 -11 Lawrence 12273 2752 12284 2835 11 83 0 3 Lee 895 29 839 18 -56 -11 -6 -38 Leicester 1950 2 1881 21 -69 19 -4 950 Lenox 850 1 829 7 -21 6 -2 600 Leominster 6114 654 6290 398 176 -256 3 -39 Leverett 165 0 165 0 0 0 0 Lexington 6253 240 6182 296 -71 56 -1 23 Lincoln 1256 24 1050 26 -206 2 -16 8 Littleton 1562 0 1607 15 45 15 3 Longmeadow 3318 28 3102 39 -216 11 -7 39 Lowell 14096 3858 13331 4321 -765 463 -5 12 Ludlow 3124 27 3050 42 -74 15 -2 56 Lunenburg 1836 1 1702 10 -134 9 -7 900 Lynn 13955 2997 13373 3465 -582 468 -4 16 Lynnfield 2202 2 2353 4 151 2 7 100 Malden 6287 601 6332 706 45 105 1 17 Mansfield 4839 24 4888 44 49 20 1 83 Marblehead 3115 48 3232 19 117 -29 4 -60 Marion 463 0 441 1 -22 1 -5 Marlborough 4662 509 4539 509 -123 0 -3 0 Marshfield 4679 7 4746 23 67 16 1 229 Mashpee 2007 5 1856 18 -151 13 -8 260 Mattapoisett 520 0 514 2 -6 2 -1 Maynard 1363 22 1328 33 -35 11 -3 50 Medfield 3063 2 3020 6 -43 4 -1 200 Medford 4727 236 4854 299 127 63 3 27 Medway 2879 6 2693 8 -186 2 -6 33 Melrose 3537 14 3767 76 230 62 7 443 Methuen 7441 445 7230 413 -211 -32 -3 -7 Middleborough 3676 4 3506 13 -170 9 -5 225 Middleton 857 6 858 13 1 7 0 117 Milford 4192 187 4122 227 -70 40 -2 21 Millbury 1973 0 1893 13 -80 13 -4 Millis 1325 0 1435 2 110 2 8 Milton 3651 24 3952 34 301 10 8 42 Monson 1595 9 1419 10 -176 1 -11 11 Nahant 201 0 239 0 38 0 19 Nantucket 1243 41 1234 67 -9 26 -1 63 Natick 4620 51 4734 36 114 -15 2 -29 Needham 4914 42 5311 50 397 8 8 19 New Bedford 13441 591 12636 461 -805 -130 -6 -22
21
Student Enrollment SY 2006
Student Enrollment SY 2010
Change Change
District All LEP All LEP All LEP All LEP
Newburyport 2374 8 2251 12 -123 4 -5 50 Newton 11567 565 11765 688 198 123 2 22 Norfolk 1109 0 1071 0 -38 0 -3 North Adams 1819 30 1612 28 -207 -2 -11 -7 Northampton 2940 68 2692 50 -248 -18 -8 -26 North Andover 4671 59 4614 49 -57 -10 -1 -17 North Attleborough 4748 50 4750 38 2 -12 0 -24 Northborough 1924 41 1883 66 -41 25 -2 61 Northbridge 2629 14 2539 12 -90 -2 -3 -14 North Brookfield 759 0 627 3 -132 3 -17 North Reading 2780 14 2735 11 -45 -3 -2 -21 Norton 3161 0 2829 5 -332 5 -11 Norwell 2217 1 2345 3 128 2 6 200 Norwood 3616 202 3437 175 -179 -27 -5 -13 Oak Bluffs 397 21 406 20 9 -1 2 -5 Orange 810 0 840 0 30 0 4 Orleans 215 3 189 2 -26 -1 -12 -33 Oxford 2193 11 2042 5 -151 -6 -7 -55 Palmer 1960 11 1748 17 -212 6 -11 55 Peabody 6548 260 6093 356 -455 96 -7 37 Pelham 118 0 125 0 7 0 6 Pembroke 3298 2 3441 0 143 -2 4 -100 Petersham 129 0 107 0 -22 0 -17 Pittsfield 6472 233 6072 233 -400 0 -6 0 Plainville 863 0 823 0 -40 0 -5 Plymouth 8451 44 8240 47 -211 3 -2 7 Plympton 234 0 245 0 11 0 5 Provincetown 236 9 152 7 -84 -2 -36 -22 Quincy 8763 1007 8969 1044 206 37 2 4 Randolph 3643 240 2851 184 -792 -56 -22 -23 Reading 4282 17 4392 16 110 -1 3 -6 Revere 5839 658 6145 625 306 -33 5 -5 Richmond 177 0 172 0 -5 0 -3 Rochester 581 0 599 0 18 0 3 Rockland 2609 27 2278 28 -331 1 -13 4 Rockport 1030 2 977 5 -53 3 -5 150 Rowe 61 0 65 0 4 0 7 Salem 4638 364 4496 507 -142 143 -3 39 Sandwich 3951 4 3579 1 -372 -3 -9 -75 Saugus 3188 5 2866 68 -322 63 -10 1260 Savoy 76 0 42 0 -34 0 -45 Scituate 3243 41 3278 14 35 -27 1 -66 Seekonk 2282 11 2154 23 -128 12 -6 109 Sharon 3498 30 3426 44 -72 14 -2 47 Sherborn 475 0 450 1 -25 1 -5 Shirley 662 4 533 5 -129 1 -19 25 Shrewsbury 5873 130 5841 144 -32 14 -1 11 Shutesbury 165 0 154 0 -11 0 -7 Somerset 2841 1 2729 2 -112 1 -4 100 Somerville 5136 884 4842 777 -294 -107 -6 -12
22
Student Enrollment SY 2006
Student Enrollment SY 2010
Change Change
District All LEP All LEP All LEP All LEP
Southampton 518 0 559 3 41 3 8 Southborough 1607 18 1556 47 -51 29 -3 161 Southbridge 2286 115 2166 232 -120 117 -5 102 South Hadley 2291 4 2132 15 -159 11 -7 275 Springfield 25206 3452 25141 3288 -65 -164 0 -5 Stoneham 2952 49 2650 58 -302 9 -10 18 Stoughton 3980 97 3776 166 -204 69 -5 71 Sturbridge 871 0 920 3 49 3 6 Sudbury 3246 48 3164 18 -82 -30 -3 -63 Sunderland 228 4 186 3 -42 -1 -18 -25 Sutton 1668 0 1643 0 -25 0 -1 Swampscott 2395 20 2256 52 -139 32 -6 160 Swansea 2123 6 2078 10 -45 4 -2 67 Taunton 8245 96 7920 159 -325 63 -4 66 Tewksbury 4838 14 4217 12 -621 -2 -13 -14 Tisbury 309 32 305 28 -4 -4 -1 -13 Topsfield 713 0 660 2 -53 2 -7 Truro 119 0 146 0 27 0 23 Tyngsborough 2247 2 2031 0 -216 -2 -10 -100 Uxbridge 2106 11 2002 30 -104 19 -5 173 Wakefield 3473 26 3360 18 -113 -8 -3 -31 Wales 180 0 169 1 -11 1 -6 Walpole 3851 39 3954 82 103 43 3 110 Waltham 4731 322 4763 475 32 153 1 48 Ware 1263 9 1309 11 46 2 4 22 Wareham 3399 5 3142 17 -257 12 -8 240 Watertown 2447 255 2613 268 166 13 7 5 Wayland 2925 9 2738 15 -187 6 -6 67 Webster 1879 50 1942 49 63 -1 3 -2 Wellesley 4559 33 4868 71 309 38 7 115 Wellfleet 136 0 147 0 11 0 8 Westborough 3490 216 3581 256 91 40 3 19 West Boylston 1137 0 1013 3 -124 3 -11 West Bridgewater 1165 1 1292 2 127 1 11 100 Westfield 6482 251 6100 211 -382 -40 -6 -16 Westford 5216 32 5273 33 57 1 1 3 Westhampton 146 0 140 0 -6 0 -4 Weston 2355 30 2388 51 33 21 1 70 Westport 1905 2 1895 15 -10 13 -1 650 West Springfield 3998 266 3954 276 -44 10 -1 4 Westwood 2915 19 3100 31 185 12 6 63 Weymouth 6881 74 6919 104 38 30 1 41 Whately 123 0 132 0 9 0 7 Williamsburg 202 0 165 2 -37 2 -18 Williamstown 484 5 426 9 -58 4 -12 80 Wilmington 3828 4 3783 22 -45 18 -1 450 Winchendon 1754 11 1626 11 -128 0 -7 0 Winchester 3802 62 4198 141 396 79 10 127 Winthrop 2052 73 1970 66 -82 -7 -4 -10 Woburn 4667 139 4769 196 102 57 2 41
23
Student Enrollment SY 2006
Student Enrollment SY 2010
Change Change
District All LEP All LEP All LEP All LEP
Worcester 24023 3620 23988 6388 -35 2768 0 76 Wrentham 1271 0 1274 8 3 8 0 Northampton-Smith Vocational 457 0 464 5 7 5 2 Excel Academy Charter School 170 4 212 9 42 5 25 125 Academy of the Pacific Rim Charter Public School
352 4 482 5 130 1 37 25
Four Rivers Charter Public School
138 0 193 0 55 0 40
Berkshire Arts and Technology Charter School
143 0 216 0 73 0 51
Academy of Strategic Learning HM Charter School
50 0 50 0 0 0 0
Boston Preparatory Charter Public School
147 0 335 5 188 5 128
Christa McAuliffe Regional Charter Public School
260 9 202 2 -58 -7 -22 -78
Smith Leadership Academy Charter Public School
208 1 165 1 -43 0 -21 0
Benjamin Banneker Charter Public School
300 31 326 22 26 -9 9 -29
Barnstable Horace Mann Charter School
919 25 793 31 -126 6 -14 24
Boston Day and Evening Academy Charter School
311 0 279 0 -32 0 -10
Marstons Mills East Horace Mann Charter School
434 0 335 35 -99 35 -23
Edward Brooke Charter School 276 6 440 3 164 -3 59 -50 KIPP Academy Lynn Charter School
153 2 352 4 199 2 130 100
Advanced Math and Science Academy Charter School
239 0 801 0 562 0 235
Cape Cod Lighthouse Charter School
196 0 228 0 32 0 16
Innovation Academy Charter School
266 0 536 1 270 1 102
Community Charter School of Cambridge
161 5 279 10 118 5 73 100
City On A Hill Charter Public School
269 0 285 4 16 4 6
Codman Academy Charter Public School
107 0 126 1 19 1 18
Conservatory Lab Charter School 127 22 153 21 26 -1 20 -5
Community Day Charter Public School
306 103 331 98 25 -5 8 -5
Sabis International Charter School
1374 4 1573 25 199 21 14 525
Neighborhood House Charter School
322 0 400 9 78 9 24
Abby Kelley Foster Charter Public School
1175 15 1426 28 251 13 21 87
24
Student Enrollment SY 2006
Student Enrollment SY 2010
Change Change
District All LEP All LEP All LEP All LEP
Foxboro Regional Charter School 984 0 1139 29 155 29 16
Benjamin Franklin Classical Charter Public School
384 0 432 0 48 0 13
Boston Collegiate Charter School 381 0 510 0 129 0 34
Hilltown Cooperative Charter Public School
154 0 162 1 8 1 5
Robert M Hughes Academy Charter School
182 1 186 0 4 -1 2 -100
Health Careers Academy Charter Public School
203 0 211 2 8 2 4
Holyoke Community Charter School
617 0 705 32 88 32 14
Lawrence Family Development Charter School
517 224 596 252 79 28 15 13
Hill View Montessori Charter Public School
156 0 272 7 116 7 74
Lowell Community Charter Public School
703 199 946 247 243 48 35 24
Lowell Middlesex Academy Charter School
111 8 121 0 10 -8 9 -100
Marblehead Community Charter School
230 1 230 0 0 -1 0 -100
Marthas Vineyard Charter School 158 0 181 4 23 4 15
MA Academy for Math and Science
92 0 91 0 -1 0 -1
Media and Technology Charter Public High School
187 0 382 0 195 0 104
Mystic Valley Regional Charter School
1144 0 1352 0 208 0 18
New Leadership Charter School 419 0 450 4 31 4 7
North Central Charter Essential School
368 0 375 3 7 3 2
Dorchester Collegiate Academy Charter
0 0 40 0 40 0
Silver Hill Horace Mann Charter School
0 0 561 31 561 31
Francis W Parker Charter Essential School
362 0 393 0 31 0 9
Pioneer Valley Performing Arts Charter School
403 0 410 1 7 1 2
Boston Renaissance Charter Public School
1268 10 1206 58 -62 48 -5 480
River Valley Charter School 288 0 287 0 -1 0 0 Rising Tide Charter Public School 274 0 312 0 38 0 14
Roxbury Preparatory Charter School
195 4 246 6 51 2 26 50
25
Student Enrollment SY 2006
Student Enrollment SY 2010
Change Change
District All LEP All LEP All LEP All LEP
Salem Academy Charter School 174 10 311 16 137 6 79 60 Seven Hills Charter Public School 661 45 673 110 12 65 2 144
Prospect Hill Academy Charter School
784 12 975 29 191 17 24 142
South Shore Charter Public School
464 0 524 0 60 0 13
Sturgis Charter Public School 326 0 401 0 75 0 23 Atlantis Charter School 684 0 733 0 49 0 7 Martin Luther King Jr Charter School of Excellence
0 0 376 20 376 20
Phoenix Charter Academy 0 0 164 25 164 25 Pioneer Charter School of Science
0 0 235 7 235 7
Global Learning Charter Public School
0 0 436 1 436 1
Pioneer Valley Chinese Immersion Charter School
0 0 151 1 151 1
Hampden Charter School of Science
0 0 191 0 191 0
Acton-Boxborough 2797 11 2930 20 133 9 5 82 Adams-Cheshire 1687 0 1554 3 -133 3 -8 Amherst-Pelham 1893 56 1661 67 -232 11 -12 20 Ashburnham-Westminster 2434 0 2388 15 -46 15 -2 Athol-Royalston 2057 10 1682 15 -375 5 -18 50 Berkshire Hills 1466 16 1377 29 -89 13 -6 81 Berlin-Boylston 475 1 444 1 -31 0 -7 0 Blackstone-Millville 2177 2 2064 11 -113 9 -5 450 Bridgewater-Raynham 5790 0 5804 22 14 22 0 Chesterfield-Goshen 166 0 187 0 21 0 13 Central Berkshire 2167 12 1987 1 -180 -11 -8 -92 Concord-Carlisle 1243 2 1245 3 2 1 0 50 Dennis-Yarmouth 3956 151 3349 146 -607 -5 -15 -3 Dighton-Rehoboth 3396 2 3235 8 -161 6 -5 300 Dover-Sherborn 1053 2 1150 3 97 1 9 50 Dudley-Charlton 4392 14 4348 50 -44 36 -1 257 Nauset 1766 5 1535 13 -231 8 -13 160 Farmington River 171 0 148 0 -23 0 -13 Freetown-Lakeville 1882 2 1922 1 40 -1 2 -50 Frontier 727 2 705 9 -22 7 -3 350 Gateway 1391 7 1202 11 -189 4 -14 57 Groton-Dunstable 2966 7 2798 11 -168 4 -6 57 Gill-Montague 1225 28 1085 45 -140 17 -11 61 Hamilton-Wenham 2177 5 2026 43 -151 38 -7 760 Hampden-Wilbraham 3793 21 3600 24 -193 3 -5 14 Hampshire 865 0 814 0 -51 0 -6 Hawlemont 129 0 109 1 -20 1 -16 King Philip 2008 0 2079 2 71 2 4 Lincoln-Sudbury 1577 6 1615 4 38 -2 2 -33 Manchester Essex 1308 0 1457 3 149 3 11
26
Student Enrollment SY 2006
Student Enrollment SY 2010
Change Change
District All LEP All LEP All LEP All LEP
Marthas Vineyard 810 30 699 16 -111 -14 -14 -47 Masconomet 2159 2 2085 2 -74 0 -3 0 Mendon-Upton 2809 7 2856 10 47 3 2 43 Mount Greylock 667 1 641 2 -26 1 -4 100 Mohawk Trail 1314 0 1130 7 -184 7 -14 Narragansett 1748 2 1575 3 -173 1 -10 50 Nashoba 3226 22 3433 17 207 -5 6 -23 New Salem-Wendell 147 0 144 0 -3 0 -2 Northboro-Southboro 1341 6 1409 7 68 1 5 17 North Middlesex 4560 6 4074 16 -486 10 -11 167 Old Rochester 1216 0 1151 1 -65 1 -5 Pentucket 3457 4 3226 3 -231 -1 -7 -25 Pioneer Valley 1094 0 1167 0 73 0 7 Quabbin 3253 0 3012 4 -241 4 -7 Ralph Mahar 710 0 778 8 68 8 10 Silver Lake 1835 0 1903 1 68 1 4 Southern Berkshire 914 3 900 4 -14 1 -2 33 Southwick-Tolland 1931 7 1797 14 -134 7 -7 100 Spencer-East Brookfield 2218 5 1957 7 -261 2 -12 40 Tantasqua 1880 4 1782 0 -98 -4 -5 -100 Triton 3416 26 3171 24 -245 -2 -7 -8 Up-Island 348 8 320 5 -28 -3 -8 -38 Wachusett 7085 39 7428 47 343 8 5 21 Quaboag 1478 1 1452 1 -26 0 -2 0 Whitman-Hanson 4483 4 4463 9 -20 5 0 125 Assabet Valley RVTSD 916 7 963 9 47 2 5 29 Blackstone Valley RVSD 923 1 1136 0 213 -1 23 -100 Blue Hills RVTSD 826 4 842 5 16 1 2 25 Bristol-Plymouth RVTSD 1079 0 1206 2 127 2 12 Cape Cod RVTSD 721 8 685 5 -36 -3 -5 -38 Franklin County RVTSD 543 0 512 0 -31 0 -6 Greater Fall River RVTSD 1311 0 1352 2 41 2 3 Greater Lawrence RVTSD 1485 54 1195 34 -290 -20 -20 -37 Greater New Bedford RVTSD 1994 13 2106 20 112 7 6 54 Greater Lowell RVTSD 1940 28 2014 46 74 18 4 64 South Middlesex RVTSD 717 43 642 40 -75 -3 -10 -7 Minuteman RVTSD 703 0 583 3 -120 3 -17 Montachusett RVTSD 1269 28 1355 8 86 -20 7 -71 Northern Berkshire RVTSD 491 0 500 0 9 0 2 Nashoba Valley RVTSD 561 0 662 0 101 0 18 Northeast Metropolitan RVTSD 1209 75 1249 57 40 -18 3 -24 North Shore RVTSD 457 2 451 3 -6 1 -1 50 Old Colony RVTSD 558 0 583 0 25 0 4 Pathfinder RVTSD 669 0 660 0 -9 0 -1 Shawsheen Valley RTSD 1226 0 1300 0 74 0 6 Southeastern RVTSD 1219 16 1257 9 38 -7 3 -44 South Shore RVTSD 592 0 595 0 3 0 1 Southern Worcester County RVTSD
1061 3 1115 4 54 1 5 33
Tri-County RVTSD 851 0 964 1 113 1 13
27
Student Enrollment SY 2006
Student Enrollment SY 2010
Change Change
District All LEP All LEP All LEP All LEP
Upper Cape Cod Regional Technical District
627 0 672 0 45 0 7
Whittier RVTSD 1145 12 1206 6 61 -6 5 -50 Bristol County Agricultural School District
430 0 441 0 11 0 3
Essex Agricultural and Technical District
420 0 462 0 42 0 10
Norfolk County Agricultural School District
457 0 470 0 13 0 3
28
Attachment 2 Massachusetts public school districts with large changes in LEP population compared to changes in overall student population - SY 2006-SY 2010
Student Enrollment SY
2006
Student Enrollment SY
2010 Change Change
District All LEP All LEP All LEP All LEP Saugus 3188 5 2866 68 -322 63 -10 1260 Holliston 2971 3 2864 37 -107 34 -4 1133 Harwich 1441 4 1334 48 -107 44 -7 1100 Leicester 1950 2 1881 21 -69 19 -4 950 Lunenburg 1836 1 1702 10 -134 9 -7 900 Hopedale 1302 1 1308 9 6 8 0 800 Hamilton-Wenham 2177 5 2026 43 -151 38 -7 760 Westport 1905 2 1895 15 -10 13 -1 650 Lenox 850 1 829 7 -21 6 -2 600 Sabis International Charter School 1374 4 1573 25 199 21 14 525 Auburn 2310 9 2399 56 89 47 4 522 Boston Renaissance Charter Public School 1268 10 1206 58 -62 48 -5 480 Wilmington 3828 4 3783 22 -45 18 -1 450 Blackstone-Millville 2177 2 2064 11 -113 9 -5 450 Melrose 3537 14 3767 76 230 62 7 443 Hadley 635 3 714 16 79 13 12 433 Hingham 3764 2 4058 10 294 8 8 400 Brewster 478 2 503 9 25 7 5 350 Frontier 727 2 705 9 -22 7 -3 350 Acton 2546 19 2614 81 68 62 3 326 Hopkinton 3432 9 3453 38 21 29 1 322 Amesbury 2503 5 2424 21 -79 16 -3 320 Hanover 2794 2 2698 8 -96 6 -3 300 Dighton-Rehoboth 3396 2 3235 8 -161 6 -5 300 South Hadley 2291 4 2132 15 -159 11 -7 275 Mashpee 2007 5 1856 18 -151 13 -8 260 Dudley-Charlton 4392 14 4348 50 -44 36 -1 257 Wareham 3399 5 3142 17 -257 12 -8 240 Marshfield 4679 7 4746 23 67 16 1 229 Middleborough 3676 4 3506 13 -170 9 -5 225 Ayer 1325 19 1197 60 -128 41 -10 216 Bellingham 2599 9 2635 27 36 18 1 200 Dover 619 3 572 9 -47 6 -8 200 Medfield 3063 2 3020 6 -43 4 -1 200 Norwell 2217 1 2345 3 128 2 6 200 Uxbridge 2106 11 2002 30 -104 19 -5 173 North Middlesex 4560 6 4074 16 -486 10 -11 167 Franklin 6136 21 6120 55 -16 34 0 162 Southborough 1607 18 1556 47 -51 29 -3 161 Swampscott 2395 20 2256 52 -139 32 -6 160
29
Student Enrollment SY
2006
Student Enrollment SY
2010 Change Change
District All LEP All LEP All LEP All LEP Nauset 1766 5 1535 13 -231 8 -13 160 Abington 2358 4 2189 10 -169 6 -7 150 Rockport 1030 2 977 5 -53 3 -5 150 Seven Hills Charter Public School 661 45 673 110 12 65 2 144 Prospect Hill Academy Charter School 784 12 975 29 191 17 24 142 Easton 3875 16 3906 37 31 21 1 131 Winchester 3802 62 4198 141 396 79 10 127 Excel Academy Charter School 170 4 212 9 42 5 25 125 Whitman-Hanson 4483 4 4463 9 -20 5 0 125 Easthampton 1611 18 1575 40 -36 22 -2 122 Chelmsford 5693 48 5418 104 -275 56 -5 117 Middleton 857 6 858 13 1 7 0 117 Wellesley 4559 33 4868 71 309 38 7 115 Walpole 3851 39 3954 82 103 43 3 110 Seekonk 2282 11 2154 23 -128 12 -6 109 Southbridge 2286 115 2166 232 -120 117 -5 102 Lynnfield 2202 2 2353 4 151 2 7 100 Somerset 2841 1 2729 2 -112 1 -4 100 West Bridgewater 1165 1 1292 2 127 1 11 100 KIPP Academy Lynn Charter School 153 2 352 4 199 2 130 100 Community Charter School of Cambridge 161 5 279 10 118 5 73 100 Mount Greylock 667 1 641 2 -26 1 -4 100 Southwick-Tolland 1931 7 1797 14 -134 7 -7 100 Edward Brooke Charter School 276 6 440 3 164 -3 59 -50 Freetown-Lakeville 1882 2 1922 1 40 -1 2 -50 Whittier RVTSD 1145 12 1206 6 61 -6 5 -50 Oxford 2193 11 2042 5 -151 -6 -7 -55 Carver 2043 5 1847 2 -196 -3 -10 -60 Marblehead 3115 48 3232 19 117 -29 4 -60 Sudbury 3246 48 3164 18 -82 -30 -3 -63 Scituate 3243 41 3278 14 35 -27 1 -66 Montachusett RVTSD 1269 28 1355 8 86 -20 7 -71 Sandwich 3951 4 3579 1 -372 -3 -9 -75 Christa McAuliffe Regional Charter Public School 260 9 202 2 -58 -7 -22 -78 Bourne 2602 5 2372 1 -230 -4 -9 -80 Central Berkshire 2167 12 1987 1 -180 -11 -8 -92 East Bridgewater 2522 8 2375 0 -147 -8 -6 -100 Granville 256 1 163 0 -93 -1 -36 -100 Hatfield 459 2 456 0 -3 -2 -1 -100 Lakeville 797 2 742 0 -55 -2 -7 -100 Pembroke 3298 2 3441 0 143 -2 4 -100 Tyngsborough 2247 2 2031 0 -216 -2 -10 -100
30
Student Enrollment SY
2006
Student Enrollment SY
2010 Change Change
District All LEP All LEP All LEP All LEP
Robert M Hughes Academy Charter School 182 1 186 0 4 -1 2 -100 Lowell Middlesex Academy Charter School 111 8 121 0 10 -8 9 -100 Marblehead Community Charter School 230 1 230 0 0 -1 0 -100 Tantasqua 1880 4 1782 0 -98 -4 -5 -100 Blackstone Valley RVSD 923 1 1136 0 213 -1 23 -100
31
Attachment 3 Bibliography Professional Development for Teachers of English Language Learners
Brown H Douglas Principles of Language Learning and Teaching 4th Edition Addison Wesley Longman Inc 2000 August D and Hakuta K 1997 Improving Schooling for Language-Minority Children A Research Agenda Washington DC National Academy Press Freeman D (Ed) (1993) New ways in teacher education Alexandria VA TESOL Garcia G Lessons from Research What is the length of time it takes limited English proficient students to acquire English and succeed in an all-English classroom (Issue Brief No 5) Washington DC National Clearinghouse for Bilingual Education 2000 Effective reading programs for English language learners A best-evidence synthesis by Robert E Slavin Johns Hopkins University Center for Research Review of Educational Research (2003) at httpwwwucfeducfedu Walqui A (1999 July) ldquoProfessional development for teachers of English language learnersrdquo Paper presented at an invitational conference wwwericdigestsorg2004-1englishhtm Clair Nancy and Adger Carolyn Temple Adger ldquoProfessional Development for Teachers in Culturally Diverse Schoolsrdquo CAL Digests October 1999 httpwwwcalorgresourcesdigestprofdvpthtml Knight Stephanie L ldquoInvestigating the Impact of Professional Development for Teachers of Culturally and Linguistically Diverse Studentsrdquo Texas AampM University Synthesis Team Executive Summary available through the Center for Research on Education Diversity amp Excellence (CREDE) at httpcredeberkeleyeduresearchcredesynthesispdpd_exsumhtml Professional Development Guidelines Handbook on Planning for Limited English Proficient (LEP) Student Success Colorado State DOE March 1997 Frutiger Eliso ldquoSelected Strategies and Activities to Provide Challenging Instruction to ESOL Students in Content Area Coursesrdquo KeKalb County School System Decatur GA 1999 Baker Colin and Hornberger Nancy An Introductory Reader to the Writings of Jim Cummins Multilingual Matters Ltd 2001 Approaches to Writing Instruction for Adolescent English Language Learners A discussion of recent research and practice literature in relation to nationwide standards on writing The Education Alliance at Brown University 2005
32
Attachment 4 Excerpts from the Commissionerrsquos Memorandum of June 2004 Guidance on Qualifications for Teachers of Limited English Proficient Students in Sheltered English Immersion Classrooms
Memorandum Attachment 1 Skills and Knowledge for Teachers of Limited English Proficient Students in sheltered English immersion Classrooms12 Part A For all teachers of limited English proficient students in Sheltered English Immersion classrooms Category 1 Second Language Learning and Teaching Knowledge
a Key factors affecting second language acquisition b Implications of these factors on classroom organization and instruction c The implications of cultural difference for classroom organization and instruction d Organization content and performance levels in the Massachusetts English Language Proficiency Benchmarks and Outcomes
SkillsObservable Outcomes bull Teacher can analyze hisher own classroom as a site for second language acquisition and
make appropriate adjustments bull Teacher can use knowledge of factors affecting second language acquisition to modify
instruction for students who are having difficulty in learning English andor subject matter content
Note Suggested number of professional development hours for Category 1 is 10-15 Category 2 Sheltering Content Instruction Knowledge a Curriculum and Lesson Planning Teachers will be able to
1 Plan lessons appropriate for LEP students at the four levels of proficiency described in the Massachusetts English Language Proficiency Benchmarks and Outcomes 2 Plan lessons that are guided by both language and content objectives appropriate for LEP students who are at different grade levels and different English proficiency levels and that are aligned with the Massachusetts Curriculum Frameworks and the Massachusetts English Language Proficiency Benchmarks and Outcomes 3 Plan lessons that are characterized by student interaction students questions and appropriate group work
b Instructional Strategies While teaching teachers will be able to 1 make language objectives content objectives and academic tasks explicit
12 httpwwwdoemasseduellseiqualificationspdf
33
2 use supplementary materials including graphic organizers visuals and manipulatives to make content more comprehensible 3 group students so that all LEP students can participate 4 integrate language instruction and content instruction
c Student Tasks Teachers will be able to 1 plan learning tasks that have a product and that enable all students including LEP students to work and ask questions in small groups 2 provide opportunities for students to display their knowledge in various ways
d Lesson Delivery While teaching teachers will be able to 1 assess student comprehension and learning throughout the lesson 2 pace and organize learning activities so that students are engaged 90-100 of the time
SkillsObservable Outcomes
Teacher can plan and conduct content classes that are based on standards contained in the Massachusetts Curriculum Frameworks and that engage LEP students who are at different levels of English proficiency in learning throughout the duration of the class
Teacher can assess content learning of students who are at different levels of English proficiency
Note Suggested number of professional development hours for Category 2 is 30-40 Teachers with ESL and TBE licenses may possess these skills but this cannot be assumed solely from the possession of either license Category 3 Assessment of Speaking and Listening Knowledge
a Multiple dimensions of oral proficiency comprehension production fluency pronunciation grammar and vocabulary
b Concept of communicative competence and its role in assessment c The six levels of oral proficiency assessed by the MELA-O and their relation to
the four levels of English language proficiency as described in the Massachusetts English Language Proficiency Benchmarks and Outcomes
SkillsObservable Outcomes bull Teacher can place students in the six-level continuum of oral proficiency as assessed by the
MELA-O bull Teacher is a Qualified MELA-O Administrator (QMA) Note Teachers who have participated in 8-10 hours of MELA-O training and passed the calibration test have met all Category 3 components Part B For teachers who teach English language arts to LEP students at any grade level in Sheltered English Instruction classrooms Category 4 Reading and Writing in the Sheltered Content Classroom
34
Knowledge a Basic concepts of linguistics including phonology and syntax of English b Significant theories and practices for developing reading skills and reading
comprehension in English for limited English proficient students who are at different English proficiency levels
c A variety of strategies for teaching vocabulary d Approaches and practices for developing writing skills in limited English
proficient students e Initial reading instruction including phonemic awareness phonics fluency
vocabulary and text comprehension The differences in initial reading instruction in English designed for those students who have no or limited oral proficiency in English compared to those who do have oral proficiency in English
f The performance criteria and scoring system used in the MEPA (Massachusetts English Proficiency Assessment) and based on the Massachusetts English Language Proficiency Benchmarks and Outcomes
SkillsObservable Outcomes
bull Teacher can plan and deliver reading instruction appropriate for limited English proficient students who are at different levels of English language proficiency
bull Teacher can plan and deliver writing instruction and activities appropriate for limited English proficient students who are at different levels of English language proficiency
bull Teacher can use the scoring rubric and test results of the MEPA to plan reading and writing instruction for limited English proficient students who are at different proficiency levels
bull Teacher can plan and deliver early literacy instruction for students who have no or limited oral proficiency or literacy in English
Note Suggested number of professional development hours for Category 4 is 30-40
35
Attachment 5 Districts Receiving Sheltered English Immersion Professional Development 2004-2010
Abby Kelley Foster Charter Abington Acad Of the Pacific Rim Charter Acton Acton-Boxborough Acushnet Adams-Cheshire Agawam Amesbury Amherst Pelham Amherst Pelham RVT Ashburnham-Westminster Andover Arlington AtholRoyalston Ashland Assabet Valley Atlantis Charter Belmont Benjamin Banneker Charter Berlin Berlin-Boylston Berkshire Hills Beverly Billerica Blackstone Valley Reg Blackstone-Millville Blue Hills Voc Boston Boston Renaissance Charter Bourne Boylston Boxborough Braintree Bridgewater Bridgewater-Raynham Bristol-Plymouth Voc Tech Brockton Brookline Burlington Cambridge Canton Cape Cod Region Voc Tech Carlisle Carver Central Berkshire Charlton Chatham Chelmsford Chelsea Christa McAuliffe Regional Charter Chicopee Clarksburg Clinton Cohasset Concord Concord-Carlisle Danvers Dartmouth Dedham Dennis-Yarmouth Dighton Dighton-Rehoboth Douglas Dover Dover-Sherborn Dudley Dudley Charlton Duxbury East Bridgewater East Longmeadow Easthampton Edgartown Essex Everett Fall River Fitchburg Foxboro Regional Charter Foxborough Framingham Franklin Gardner Georgetown Gloucester Grafton Granby Greater Fall River Greater Lawrence RVT Greater Lowell Technical Greater New Bedford Greenfield Groton-Dunstable Hamilton-Wenham Hanover Harvard Hampden-Wilbraham Haverhill Hill View Montessori Charter Harwich Holbrook Hopkinton Hingham Hyde Park Ipswich Hudson Kingston Lawrence King Philip Lee Leicester Lawrence Family Dev Charter Leominster Lexington Lenox Lincoln-Sudbury Littleton Lincoln Lowell Lowell Community Charter Longmeadow Lunenburg Lynn Ludlow Malden Manchester Essex Regional Marlborough Marblehead Marion Mansfield Marshfield Martharsquos Vineyard Marlboro
36
Masconomet Mashpee Martharsquos Vineyard Charter Maynard Medfield Mattapoisett Medway Melrose Medford Methuen Middleboro Mendon-Upton Milford Millbury Middleton Milton Monson Millis Nantucket Narragansett Montachusett Reg Voc Tech Natick Nauset Nashoba New Bedford New Bedford Global Learning Charter Needham Newburyport Newton New Leadership Charter Norfolk North Adams North Andover North Attleborough North Central Charter Essential School North Middlesex North Quincy Northampton Northbridge Northern Berkshire Voc Northeast Metro Voc North Shore Reg Voc Northboro-Southboro Northborough Norton Norwell Norwood Oak Bluffs Orange Oxford Peabody Pembroke Pentucket Petersham Pittsfield Plainville Plymouth Prospect Hill Academy Charter Provincetown Quabbin Quincy Randolph Raynham Reading Rehoboth Revere Rochester Rockland Rockport Richmond Saugus Salem Scituate Seven Hills Charter Sherborn Shirley Shrewsbury Silver Lake Smith Leadership AcadCharter So Middlesex Voc Tech Reg Somerset Somerville South Shore Charter Southborough Southbridge Southeastern Reg Voc Tech Southern Berkshire Southwick Southwick-Tolland Spencer-E Brookfield Springfield Stoneham Sturgis Charter Sudbury Sutton Swampscott Swansea Tantasqua Taunton Tisbury Townsend Tri County Triton Tyngsborough Up-Island Regional Upper Cape Cod Voc Tech Uxbridge Wachusett Walpole Waltham Ware Wareham Wayland Watertown Webster Wellesley West Boylston West Bridgewater West Springfield Westborough Westfield Westminster Weston Westport Westwood Weymouth Whitman-Hanson Wilbraham Williamstown Wilmington Winchendon Winchester Winthrop Woburn Worcester Wrentham
-Source The Department Office of Language Acquisition and Academic Achievement 2010
37
Attachment 6 Collaboratives that have received grants for Sheltered English Immersion Professional Development 2004-2010 ACCEPT Collaborative
Assabet Valley Collaborative
Bi-County Collaborative
Cape Cod Collaborative
CHARMS Collaborative
Greater Lawrence Educational Collaborative
EDCO Collaborative
FLLAC Collaborative
Merrimack Education Collaborative
North River Collaborative
Pilgrim Area Collaborative
Shore Educational Collaborative
South Coast Collaborative
South Shore Educational Collaborative
Southern Berkshire Educational Collaborative
Southeastern MA Educational Collaborative
The Education Cooperative (TEC) Source The Department Office of Language Acquisition and Academic Achievement 2010
Attachment 7 English Language Learners in Massachusetts District and Program Type October 2009
District Name No ELL
Program Sheltered English
Immersion Two-Way Bilingual
Other Bilingual Education
Parental Opt Out
Total LEP Population
Abington 0 10 0 0 0 10 Acton 0 80 0 0 1 81 Acushnet 0 1 0 0 0 1 Agawam 1 96 0 0 0 97 Amesbury 0 21 0 0 0 21 Amherst 0 175 0 0 0 175 Andover 0 83 0 0 0 83 Arlington 3 184 0 0 5 192 Ashland 0 67 0 0 0 67 Attleboro 1 266 0 0 0 267 Auburn 0 56 0 0 0 56 Avon 0 1 0 0 0 1 Ayer 0 60 0 0 0 60 Barnstable 14 162 0 0 0 176 Bedford 0 49 0 0 0 49 Belchertown 0 24 0 0 0 24 Bellingham 0 27 0 0 0 27 Belmont 5 83 0 0 4 92 Berkley 0 0 0 0 0 0 Berlin 0 1 0 0 0 1 Beverly 10 29 0 0 0 39 Billerica 0 69 0 0 12 81 Boston 0 5856 357 386 4672 11271 Bourne 0 1 0 0 0 1 Boxborough 0 6 0 0 0 6 Boxford 0 4 0 0 0 4 Boylston 0 10 0 0 0 10 Braintree 0 111 0 0 0 111 Brewster 0 9 0 0 0 9 Brimfield 0 0 0 0 0 0 Brockton 207 1851 88 422 169 2737 Brookfield 0 0 0 0 0 0
38
District Name No ELL
Program Sheltered English
Immersion Two-Way Bilingual
Other Bilingual Education
Parental Opt Total LEP Out Population
Brookline 0 494 0 0 2 496 Burlington 1 63 0 0 0 64 Cambridge 0 266 37 0 0 303 Canton 3 33 0 0 0 36 Carlisle 0 11 0 0 0 11 Carver 0 2 0 0 0 2 Chatham 0 19 0 0 0 19 Chelmsford 0 90 0 10 4 104 Chelsea 0 922 0 0 0 922 Chicopee 2 351 0 0 1 354 Clarksburg 0 0 0 0 0 0 Clinton 1 117 0 0 26 144 Cohasset 0 0 0 0 0 0 Concord 0 36 0 0 0 36 Conway 0 0 0 0 0 0 Danvers 6 9 0 0 1 16 Dartmouth 1 38 0 0 0 39 Dedham 0 114 0 0 0 114 Deerfield 4 3 0 0 0 7 Douglas 2 1 0 0 0 3 Dover 1 8 0 0 0 9 Dracut 0 43 0 0 0 43 Duxbury 0 0 0 0 0 0 East Bridgewater 0 0 0 0 0 0 Eastham 0 1 0 0 0 1 Easthampton 40 0 0 0 0 40 East Longmeadow 2 0 0 0 0 2 Easton 0 37 0 0 0 37 Edgartown 0 26 0 0 0 26 Erving 0 0 0 0 0 0 Everett 72 251 0 0 257 580 Fairhaven 0 3 0 0 0 3 Fall River 0 339 0 175 0 514 Falmouth 0 44 0 0 0 44
39
District Name No ELL
Program Sheltered English
Immersion Two-Way Bilingual
Other Bilingual Education
Parental Opt Total LEP Out Population
Fitchburg 2 591 0 0 0 593 Florida 0 0 0 0 0 0 Foxborough 0 14 0 0 0 14 Framingham 0 822 248 85 116 1271 Franklin 0 54 0 0 1 55 Freetown 0 0 0 0 0 0 Gardner 0 95 0 0 0 95 Georgetown 0 2 0 0 0 2 Gloucester 2 73 0 0 0 75 Gosnold 0 0 0 0 0 0 Grafton 0 14 0 0 0 14 Granby 0 13 0 0 0 13 Granville 0 0 0 0 0 0 Greenfield 0 54 0 0 0 54 Hadley 2 14 0 0 0 16 Halifax 0 0 0 0 0 0 Hancock 0 0 0 0 0 0 Hanover 0 7 0 0 1 8 Harvard 1 0 1 0 0 2 Harwich 0 48 0 0 0 48 Hatfield 0 0 0 0 0 0 Haverhill 2 457 0 0 2 461 Hingham 0 10 0 0 0 10 Holbrook 0 26 0 0 0 26 Holland 0 1 0 0 0 1 Holliston 0 37 0 0 0 37 Holyoke 0 1372 1 0 4 1377 Hopedale 3 6 0 0 0 9 Hopkinton 0 36 0 0 2 38 Hudson 0 114 0 0 0 114 Hull 2 1 0 0 0 3 Ipswich 13 4 0 1 0 18 Kingston 3 0 0 0 0 3 Lakeville 0 0 0 0 0 0
40
District Name No ELL
Program Sheltered English
Immersion Two-Way Bilingual
Other Bilingual Education
Parental Opt Out
Total LEP Population
Lanesborough 0 0 0 0 2 2 Lawrence 0 2835 0 0 0 2835 Lee 0 18 0 0 0 18 Leicester 4 16 1 0 0 21 Lenox 0 7 0 0 0 7 Leominster 0 398 0 0 0 398 Leverett 0 0 0 0 0 0 Lexington 0 286 0 0 10 296 Lincoln 0 26 0 0 0 26 Littleton 2 13 0 0 0 15 Longmeadow 1 36 0 0 2 39 Lowell 17 4228 0 3 73 4321 Ludlow 0 42 0 0 0 42 Lunenburg 1 9 0 0 0 10 Lynn 1 3071 0 35 358 3465 Lynnfield 0 4 0 0 0 4 Malden 0 675 12 0 19 706 Mansfield 0 44 0 0 0 44 Marblehead 18 1 0 0 0 19 Marion 0 1 0 0 0 1 Marlborough 68 441 0 0 0 509 Marshfield 4 15 1 0 3 23 Mashpee 3 15 0 0 0 18 Mattapoisett 0 2 0 0 0 2 Maynard 0 33 0 0 0 33 Medfield 0 6 0 0 0 6 Medford 0 299 0 0 0 299 Medway 0 8 0 0 0 8 Melrose 43 32 1 0 0 76 Methuen 0 408 0 0 5 413 Middleborough 0 13 0 0 0 13 Middleton 0 13 0 0 0 13 Milford 0 227 0 0 0 227 Millbury 11 2 0 0 0 13
41
District Name No ELL
Program Sheltered English
Immersion Two-Way Bilingual
Other Bilingual Education
Parental Opt Out
Total LEP Population
Millis 2 0 0 0 0 2 Milton 2 32 0 0 0 34 Monson 0 10 0 0 0 10 Nahant 0 0 0 0 0 0 Nantucket 5 61 0 0 1 67 Natick 1 35 0 0 0 36 Needham 0 50 0 0 0 50 New Bedford 0 461 0 0 0 461 Newburyport 0 12 0 0 0 12 Newton 7 680 0 0 1 688 Norfolk 0 0 0 0 0 0 North Adams 0 28 0 0 0 28 Northampton 0 50 0 0 0 50 North Andover 0 45 0 0 4 49 North Attleborough 0 38 0 0 0 38 Northborough 0 66 0 0 0 66 Northbridge 0 12 0 0 0 12 North Brookfield 0 3 0 0 0 3 North Reading 0 11 0 0 0 11 Norton 0 5 0 0 0 5 Norwell 1 2 0 0 0 3 Norwood 2 169 0 0 4 175 Oak Bluffs 20 0 0 0 0 20 Orange 0 0 0 0 0 0 Orleans 0 2 0 0 0 2 Oxford 0 5 0 0 0 5 Palmer 3 14 0 0 0 17 Peabody 0 356 0 0 0 356 Pelham 0 0 0 0 0 0 Pembroke 0 0 0 0 0 0 Petersham 0 0 0 0 0 0 Pittsfield 0 233 0 0 0 233 Plainville 0 0 0 0 0 0 Plymouth 2 45 0 0 0 47
42
District Name No ELL
Program Sheltered English
Immersion Two-Way Bilingual
Other Bilingual Education
Parental Opt Out
Total LEP Population
Plympton 0 0 0 0 0 0 Provincetown 0 7 0 0 0 7 Quincy 0 1044 0 0 0 1044 Randolph 4 179 1 0 0 184 Reading 0 16 0 0 0 16 Revere 2 623 0 0 0 625 Richmond 0 0 0 0 0 0 Rochester 0 0 0 0 0 0 Rockland 0 28 0 0 0 28 Rockport 0 5 0 0 0 5 Rowe 0 0 0 0 0 0 Salem 6 418 72 0 11 507 Sandwich 0 0 0 0 1 1 Saugus 18 50 0 0 0 68 Savoy 0 0 0 0 0 0 Scituate 0 14 0 0 0 14 Seekonk 0 23 0 0 0 23 Sharon 0 44 0 0 0 44 Sherborn 0 1 0 0 0 1 Shirley 0 5 0 0 0 5 Shrewsbury 0 144 0 0 0 144 Shutesbury 0 0 0 0 0 0 Somerset 1 0 0 1 0 2 Somerville 6 612 124 35 0 777 Southampton 0 3 0 0 0 3 Southborough 0 47 0 0 0 47 Southbridge 6 225 0 0 1 232 South Hadley 14 1 0 0 0 15 Springfield 0 2926 0 0 362 3288 Stoneham 0 58 0 0 0 58 Stoughton 0 129 0 0 37 166 Sturbridge 0 3 0 0 0 3 Sudbury 0 18 0 0 0 18 Sunderland 0 3 0 0 0 3
43
District Name No ELL
Program Sheltered English
Immersion Two-Way Bilingual
Other Bilingual Education
Parental Opt Out
Total LEP Population
Sutton 0 0 0 0 0 0 Swampscott 25 27 0 0 0 52 Swansea 0 10 0 0 0 10 Taunton 0 159 0 0 0 159 Tewksbury 0 12 0 0 0 12 Tisbury 0 28 0 0 0 28 Topsfield 2 0 0 0 0 2 Truro 0 0 0 0 0 0 Tyngsborough 0 0 0 0 0 0 Uxbridge 0 28 1 0 1 30 Wakefield 0 17 0 0 1 18 Wales 0 0 0 0 1 1 Walpole 0 82 0 0 0 82 Waltham 1 383 0 0 91 475 Ware 0 11 0 0 0 11 Wareham 1 14 0 0 2 17 Watertown 1 264 0 0 3 268 Wayland 0 13 0 0 2 15 Webster 1 48 0 0 0 49 Wellesley 1 53 0 0 17 71 Wellfleet 0 0 0 0 0 0 Westborough 2 253 0 0 1 256 West Boylston 0 3 0 0 0 3 West Bridgewater 0 2 0 0 0 2 Westfield 25 185 0 0 1 211 Westford 0 31 0 0 2 33 Westhampton 0 0 0 0 0 0 Weston 0 51 0 0 0 51 Westport 0 15 0 0 0 15 West Springfield 0 276 0 0 0 276 Westwood 6 25 0 0 0 31 Weymouth 0 101 0 0 3 104 Whately 0 0 0 0 0 0 Williamsburg 0 0 0 0 2 2
44
District Name No ELL
Program Sheltered English
Immersion Two-Way Bilingual
Other Bilingual Education
Parental Opt Out
Total LEP Population
Williamstown 0 9 0 0 0 9 Wilmington 0 22 0 0 0 22 Winchendon 0 11 0 0 0 11 Winchester 1 140 0 0 0 141 Winthrop 0 66 0 0 0 66 Woburn 1 195 0 0 0 196 Worcester 206 5922 27 177 56 6388 Wrentham 7 1 0 0 0 8 Northampton-Smith Voc Agr 0 0 0 5 0 5 Excel Academy CS 4 5 0 0 0 9 Four Rivers Charter Public 0 5 0 0 0 5 Berkshire Arts and TechCS 0 0 0 0 0 0 Amesbury Academy CS 0 0 0 0 0 0 Boston Preparatory CS 0 0 0 0 0 0 Christa McAuliffe Reg 0 5 0 0 0 5 Smith Leadership Academy CS 0 0 0 0 2 2 Benjamin Banneker CS 0 1 0 0 0 1 Barnstable Horace Mann CS 0 22 0 0 0 22 Boston Day and Eve CS 4 25 1 1 0 31 Barnstable Com Hrce Mann CS 0 35 0 0 0 35 Edward Brooke Charter 0 3 0 0 0 3 KIPP Academy Lynn Charter 0 3 0 0 1 4 Advanced Math and Science CS 0 0 0 0 0 0 Cape Cod Lighthouse Charter 0 0 0 0 0 0 Innovation Academy Charter 0 1 0 0 0 1 Community CS of Cambridge 0 7 0 0 3 10 City On A Hill Charter Public 0 4 0 0 0 4 Codman Academy CS 1 0 0 0 0 1 Conservatory Lab Charter 0 21 0 0 0 21 Community Day Charter Public 0 98 0 0 0 98 Sabis International Charter 25 0 0 0 0 25 Neighborhood House Charter 0 9 0 0 0 9 Abby Kelley Foster CS 0 27 0 0 1 28 Foxborough Regional CS 0 29 0 0 0 29
45
District Name No ELL
Program Sheltered English
Immersion Two-Way Bilingual
Other Bilingual Education
Parental Opt Out
Total LEP Population
Benjamin Franklin Classical CS 0 0 0 0 0 0 Boston Collegiate Charter 0 0 0 0 0 0 Hilltown Cooperative CS 0 1 0 0 0 1 Robert M Hughes Acad CS 0 0 0 0 0 0 EM Kennedy Acad Health Careers Horace Mann CS 0 2 0 0 0 2 Holyoke Community Charter 0 32 0 0 0 32 Lawrence Family Dev CS 0 0 252 0 0 252 Hill View Montessori CS 0 7 0 0 0 7 Lowell Community CS 0 247 0 0 0 247 Lowell Middlesex Acad CS 0 0 0 0 0 0 Marblehead Community CS 0 0 0 0 0 0 Marthas Vineyard CS 0 4 0 0 0 4 Ma Acad for Math and Science 0 0 0 0 0 0 MATCH Charter Public High 0 0 0 0 0 0 Mystic Valley Regional Charter 0 0 0 0 0 0 New Leadership Charter 0 4 0 0 0 4 North Central Charter Essential 0 3 0 0 0 3 Dorchester Collegiate Acad CS 0 0 0 0 0 0 Silver Hill Horace Mann Charter 0 31 0 0 0 31 Francis W Parker Ch Essential 0 0 0 0 0 0 Pioneer Valley Perf Arts CS 0 1 0 0 0 1 Boston Renaissance CS 0 58 0 0 0 58 River Valley Charter 0 0 0 0 0 0 Rising Tide Charter Public 0 0 0 0 0 0 Roxbury Preparatory Charter 0 6 0 0 0 6 Salem Academy Charter 0 16 0 0 0 16 Seven Hills Charter Public 0 108 0 0 2 110 Prospect Hill Academy Charter 0 29 0 0 0 29 South Shore Charter Public 0 0 0 0 0 0 Sturgis Charter Public 0 0 0 0 0 0 Atlantis Charter 0 0 0 0 0 0 MLK Jr CS of Excellence 0 20 0 0 0 20 Phoenix Charter Academy 0 25 0 0 0 25 Pioneer CS of Science 0 7 0 0 0 7
46
District Name No ELL
Program Sheltered English
Immersion Two-Way Bilingual
Other Bilingual Education
Parental Opt Out
Total LEP Population
29
Global Learning Charter Public 1 0 0 0 0 1 Pioneer Valley Chinese Imm CS 0 0 0 0 1 1 Hampden CS of Science 0 0 0 0 0 0 Acton-Boxborough 0 20 0 0 0 20 Adams-Cheshire 0 3 0 0 0 3 Amherst-Pelham 0 67 0 0 0 67 Ashburnham-Westminster 0 15 0 0 0 15 Athol-Royalston 0 13 0 2 0 15 Berkshire Hills 0 0 0 0 29 Berlin-Boylston 0 1 0 0 0 1 Blackstone-Millville 0 10 0 0 1 11 Bridgewater-Raynham 13 9 0 0 0 22 Chesterfield-Goshen 0 0 0 0 0 0 Central Berkshire 1 0 0 0 0 1 Concord-Carlisle 0 3 0 0 0 3 Dennis-Yarmouth 0 146 0 0 0 146 Dighton-Rehoboth 0 8 0 0 0 8 Dover-Sherborn 0 3 0 0 0 3 Dudley-Charlton Reg 2 47 0 0 1 50 Nauset 3 10 0 0 0 13 Farmington River Reg 0 0 0 0 0 0 Freetown-Lakeville 1 0 0 0 0 1 Frontier 0 9 0 0 0 9 Gateway 0 11 0 0 0 11 Groton-Dunstable 0 11 0 0 0 11 Gill-Montague 43 2 0 0 0 45 Hamilton-Wenham 35 5 0 1 2 43 Hampden-Wilbraham 0 24 0 0 0 24 Hampshire 0 0 0 0 0 0 Hawlemont 0 0 1 0 0 1 King Philip 0 2 0 0 0 2 Lincoln-Sudbury 0 4 0 0 0 4 Manchester Essex Regional 0 3 0 0 0 3 Marthas Vineyard 0 16 0 0 0 16
47
District Name No ELL
Program Sheltered English
Immersion Two-Way Bilingual
Other Bilingual Education
Parental Opt Out
Total LEP Population
Masconomet 2 0 0 0 0 2 Mendon-Upton 0 10 0 0 0 10 Mount Greylock 0 2 0 0 0 2 Mohawk Trail 2 4 1 0 0 7 Narragansett 0 3 0 0 0 3 Nashoba 0 17 0 0 0 17 New Salem-Wendell 0 0 0 0 0 0 Northboro-Southboro 1 6 0 0 0 7 North Middlesex 7 5 0 0 4 16 Old Rochester 1 0 0 0 0 1 Pentucket 0 3 0 0 0 3 Pioneer Valley 0 0 0 0 0 0 Quabbin 1 1 0 0 2 4 Ralph C Mahar 1 7 0 0 0 8 Silver Lake 1 0 0 0 0 1 Southern Berkshire 0 4 0 0 0 4 Southwick-Tolland 0 14 0 0 0 14 Spencer-E Brookfield 0 7 0 0 0 7 Tantasqua 0 0 0 0 0 0 Triton 0 24 0 0 0 24 Up-Island Regional 0 5 0 0 0 5 Wachusett 0 47 0 0 0 47 Quaboag Regional 0 1 0 0 0 1 Whitman-Hanson 0 9 0 0 0 9 Assabet Valley Reg Voc Tech 0 9 0 0 0 9 Blackstone Val Reg Voc Tech 0 0 0 0 0 0 Blue Hills Regional Voc Tech 0 5 0 0 0 5 Bristol-Plym Reg Voc Tech 0 2 0 0 0 2 Cape Cod Regional Voc Tech 0 5 0 0 0 5 Franklin County Reg Voc Tech 0 0 0 0 0 0 Grtr Fall River Reg Voc Tech 2 0 0 0 0 2 Grtr Lawrence Reg Voc Tech 0 31 2 0 1 34 Grtr Nw Bdfrd Reg Voc Tech 0 20 0 0 0 20 Grtr Lowell Reg Voc Tech 0 46 0 0 0 46
48
District Name No ELL
Program Sheltered English
Immersion Two-Way Bilingual
Other Bilingual Education
Parental Opt Out
Total LEP Population
S Middlesex Reg Voc Tech 0 40 0 0 0 40 Minuteman Reg Voc Tech 0 3 0 0 0 3 Montachusett Reg Voc Tech 0 8 0 0 0 8 N Berkshire Reg Voc Tech 0 0 0 0 0 0 Nashoba Valley Reg Voc 0 0 0 0 0 0 NE Metro Reg Voc Tech 0 57 0 0 0 57 North Shore Reg Voc Tech 0 3 0 0 0 3 Old Colony Reg Voc Tech 0 0 0 0 0 0 Pathfinder Reg Voc Tech 0 0 0 0 0 0 Shawsheen Val Reg Voc Tech 0 0 0 0 0 0 Southeastern Reg Voc Tech 0 9 0 0 0 9 South Shore Reg Voc Tech 0 0 0 0 0 0 S Worcester C Reg Voc Tech 1 0 0 3 0 4 Tri County Reg Voc Tech 0 1 0 0 0 1 Uppr Cape Cod Reg Voc Tech 0 0 0 0 0 0 Whittier Reg Voc Tech 0 6 0 0 0 6 Bristol County Agricultural 0 0 0 0 0 0 Essex Agricultural Technical 0 0 0 0 0 0 Norfolk County Agricultural 0 0 0 0 0 0 TOTALS 1113 49096 1229 1342 6378 59158
Source The Department Student Information Management System 2009
49
Attachment 8 English Language Learners in Massachusetts District and First Language October 2009
District Name Spanish Portuguese Cape
Verdean Creole Haitian Vietnamese Other LEP
Abington 3 3 0 0 0 4 10 Acton 8 7 0 0 0 66 81 Acushnet 0 1 0 0 0 0 1 Agawam 15 0 0 0 1 81 97 Amesbury 5 8 0 0 0 8 21 Amherst 60 4 2 0 2 107 175 Andover 12 3 0 0 1 67 83 Arlington 26 17 2 11 1 135 192 Ashland 9 35 0 0 1 22 67 Attleboro 170 9 1 1 2 84 267 Auburn 12 5 0 3 12 24 56 Avon 0 0 0 1 0 0 1 Ayer 36 13 0 0 0 11 60 Barnstable 39 111 0 2 0 24 176 Bedford 9 0 0 0 2 38 49 Belchertown 7 1 0 0 1 15 24 Bellingham 8 3 0 0 3 13 27 Belmont 5 2 0 0 0 85 92 Berlin 0 1 0 0 0 0 1 Beverly 6 8 0 0 1 24 39 Billerica 13 6 0 2 3 57 81 Boston 6434 210 900 947 723 2057 11271 Bourne 1 0 0 0 0 0 1 Boxborough 1 2 0 0 0 3 6 Boxford 1 0 0 0 0 3 4 Boylston 1 0 0 0 1 8 10 Braintree 13 3 4 1 13 77 111 Brewster 6 0 0 0 0 3 9 Brockton 484 131 1465 453 37 167 2737
50
District Name Spanish Portuguese Cape
Verdean Creole Haitian Vietnamese Other LEP
Brookline 43 16 2 2 6 427 496 Burlington 2 3 0 2 0 57 64 Cambridge 58 23 6 67 2 147 303 Canton 4 1 0 3 5 23 36 Carlisle 0 0 0 0 0 11 11 Carver 0 0 0 0 0 2 2 Chatham 10 2 0 3 0 4 19 Chelmsford 9 5 0 0 8 82 104 Chelsea 766 29 2 13 9 103 922 Chicopee 201 4 0 0 1 148 354 Clinton 106 17 0 11 0 10 144 Concord 13 1 0 0 2 20 36 Danvers 4 0 0 1 0 11 16 Dartmouth 2 19 0 0 0 18 39 Dedham 47 3 0 13 9 42 114 Deerfield 4 0 0 0 2 1 7 Douglas 0 2 0 0 0 1 3 Dover 0 0 0 2 0 7 9 Dracut 13 6 0 0 0 24 43 Eastham 1 0 0 0 0 0 1 Easthampton 12 0 0 0 1 27 40 East Longmeadow 0 0 0 0 0 2 2 Easton 4 7 1 3 4 18 37 Edgartown 2 24 0 0 0 0 26 Everett 308 119 1 96 12 44 580 Fairhaven 1 2 0 0 0 0 3 Fall River 297 122 16 2 10 67 514 Falmouth 5 12 0 0 4 23 44 Fitchburg 487 2 0 2 11 91 593 Foxborough 5 3 0 0 1 5 14 Framingham 589 553 0 17 3 109 1271
51
District Name Spanish Portuguese Cape
Verdean Creole Haitian Vietnamese Other LEP
Franklin 13 5 0 1 4 32 55 Gardner 80 1 0 3 2 9 95 Georgetown 0 0 0 0 0 2 2 Gloucester 38 20 0 0 4 13 75 Grafton 3 0 0 0 0 11 14 Granby 3 0 0 0 0 10 13 Greenfield 18 0 0 0 1 35 54 Hadley 8 0 0 0 0 8 16 Hanover 1 0 0 0 1 6 8 Harvard 1 0 0 0 0 1 2 Harwich 12 3 0 8 1 24 48 Haverhill 407 11 0 3 7 33 461 Hingham 0 1 0 0 0 9 10 Holbrook 8 4 0 5 1 8 26 Holland 0 1 0 0 0 0 1 Holliston 7 14 0 0 0 16 37 Holyoke 1361 0 0 0 2 14 1377 Hopedale 2 2 0 0 0 5 9 Hopkinton 7 1 0 0 0 30 38 Hudson 32 67 0 1 1 13 114 Hull 0 1 1 0 0 1 3 Ipswich 5 3 0 0 0 10 18 Kingston 0 2 0 0 0 1 3 Lanesborough 0 0 0 0 0 2 2 Lawrence 2732 3 0 5 32 63 2835 Lee 13 1 0 0 0 4 18 Leicester 7 0 0 0 6 8 21 Lenox 1 0 0 0 0 6 7 Leominster 277 44 0 2 3 72 398 Lexington 21 5 0 4 0 266 296 Lincoln 4 0 0 1 0 21 26
52
District Name Spanish Portuguese Cape
Verdean Creole Haitian Vietnamese Other LEP
Littleton 1 3 1 0 0 10 15 Longmeadow 5 2 0 0 1 31 39 Lowell 1595 324 3 14 131 2254 4321 Ludlow 6 11 0 0 0 25 42 Lunenburg 2 4 0 0 0 4 10 Lynn 2662 30 1 67 62 643 3465 Lynnfield 1 0 0 0 0 3 4 Malden 120 99 0 116 51 320 706 Mansfield 10 6 0 0 0 28 44 Marblehead 3 1 0 0 0 15 19 Marion 0 0 0 0 0 1 1 Marlborough 261 211 0 2 4 31 509 Marshfield 3 11 0 0 0 9 23 Mashpee 0 0 0 0 1 17 18 Mattapoisett 0 0 0 0 0 2 2 Maynard 14 11 0 2 0 6 33 Medfield 0 2 0 0 0 4 6 Medford 28 80 0 96 12 83 299 Medway 3 0 0 1 0 4 8 Melrose 4 5 0 7 2 58 76 Methuen 340 3 0 7 11 52 413 Middleborough 7 0 0 0 1 5 13 Middleton 2 1 0 0 0 10 13 Milford 100 101 0 0 2 24 227 Millbury 2 4 0 0 3 4 13 Millis 0 0 0 0 0 2 2 Milton 3 3 0 15 3 10 34 Monson 0 0 0 0 0 10 10 Nantucket 60 5 0 0 0 2 67 Natick 4 2 0 0 2 28 36 Needham 13 1 2 1 1 32 50
53
District Name Spanish Portuguese Cape
Verdean Creole Haitian Vietnamese Other LEP
New Bedford 289 31 1 2 5 133 461 Newburyport 4 3 0 0 0 5 12 Newton 112 22 0 7 11 536 688 North Adams 19 2 0 0 0 7 28 Northampton 40 0 0 0 0 10 50 North Andover 18 1 0 0 4 26 49 North Attleborough 19 0 0 0 1 18 38 Northborough 16 13 0 0 0 37 66 Northbridge 6 0 0 0 0 6 12 North Brookfield 0 0 0 0 0 3 3 North Reading 2 0 0 0 0 9 11 Norton 0 0 0 0 0 5 5 Norwell 2 0 0 0 0 1 3 Norwood 38 39 0 11 5 82 175 Oak Bluffs 0 19 0 0 0 1 20 Orleans 0 0 0 0 0 2 2 Oxford 3 0 0 0 0 2 5 Palmer 4 2 0 0 0 11 17 Peabody 175 100 0 0 11 70 356 Pittsfield 168 1 0 0 8 56 233 Plymouth 9 26 0 1 2 9 47 Provincetown 7 0 0 0 0 0 7 Quincy 41 31 0 6 126 840 1044 Randolph 17 6 3 71 54 33 184 Reading 1 3 0 0 1 11 16 Revere 392 39 0 8 31 155 625 Rockland 3 22 0 0 2 1 28 Rockport 1 0 0 0 0 4 5 Salem 430 9 0 5 7 56 507 Sandwich 0 0 0 0 0 1 1 Saugus 22 15 0 6 6 19 68
54
District Name Spanish Portuguese Cape
Verdean Creole Haitian Vietnamese Other LEP
Scituate 1 5 6 0 0 2 14 Seekonk 5 1 0 0 2 15 23 Sharon 1 0 0 5 6 32 44 Sherborn 0 0 0 0 0 1 1 Shirley 2 1 0 0 0 2 5 Shrewsbury 15 39 0 0 6 84 144 Somerset 0 0 0 0 0 2 2 Somerville 372 170 5 73 5 152 777 Southampton 1 0 0 0 0 2 3 Southborough 5 4 0 0 0 38 47 Southbridge 219 0 0 0 0 13 232 South Hadley 11 0 0 0 1 3 15 Springfield 2970 2 0 4 87 225 3288 Stoneham 17 11 0 1 3 26 58 Stoughton 21 60 8 17 9 51 166 Sturbridge 1 2 0 0 0 0 3 Sudbury 8 2 0 0 1 7 18 Sunderland 2 0 0 0 0 1 3 Swampscott 8 4 1 2 2 35 52 Swansea 3 2 0 0 0 5 10 Taunton 72 43 5 9 1 29 159 Tewksbury 2 1 0 0 2 7 12 Tisbury 0 26 0 0 0 2 28 Topsfield 0 0 0 0 0 2 2 Uxbridge 11 3 0 0 0 16 30 Wakefield 8 2 0 0 2 6 18 Wales 0 0 0 0 0 1 1 Walpole 18 14 0 13 1 36 82 Waltham 333 27 0 26 3 86 475 Ware 7 0 0 0 0 4 11 Wareham 4 2 0 0 2 9 17
55
District Name Spanish Portuguese Cape
Verdean Creole Haitian Vietnamese Other LEP
Watertown 52 32 0 2 0 182 268 Wayland 1 0 0 0 0 14 15 Webster 32 4 0 0 1 12 49 Wellesley 16 0 0 0 0 55 71 Westborough 43 38 0 1 0 174 256 West Boylston 0 1 0 0 0 2 3 West Bridgewater 0 0 0 2 0 0 2 Westfield 34 0 0 0 0 177 211 Westford 3 0 0 1 2 27 33 Weston 5 0 1 3 1 41 51 Westport 1 9 0 0 4 1 15 West Springfield 29 2 0 0 3 242 276 Westwood 3 0 0 0 0 28 31 Weymouth 12 49 0 1 4 38 104 Williamsburg 0 2 0 0 0 0 2 Williamstown 2 3 0 0 0 4 9 Wilmington 1 3 0 0 4 14 22 Winchendon 4 2 0 0 0 5 11 Winchester 10 10 0 2 2 117 141 Winthrop 18 9 0 1 0 38 66 Woburn 27 44 0 8 8 109 196 Worcester 3636 297 4 44 703 1704 6388 Wrentham 2 3 0 0 0 3 8 Northampton-Smith Voc Agr 5 0 0 0 0 0 5 Excel Academy CS 9 0 0 0 0 0 9 Academy Of the Pacific Rim CS 3 1 0 1 0 0 5 Boston Preparatory CS 3 0 0 2 0 0 5 Christa McAuliffe Regional CS 2 0 0 0 0 0 2 Smith Leadership Academy CS 1 0 0 0 0 0 1 Benjamin Banneker CS 5 0 0 16 0 1 22 Barnstable Horace Mann CS 6 16 0 0 0 9 31
56
District Name Spanish Portuguese Cape
Verdean Creole Haitian Vietnamese Other LEP
Barnstable Com Horace Mann CS 17 17 0 0 0 1 35 Edward Brooke CS 3 0 0 0 0 0 3 KIPP Academy Lynn CS 4 0 0 0 0 0 4 Innovation Academy CS 1 0 0 0 0 0 1 Community CS of Cambridge 3 0 0 5 0 2 10 City On A Hill CS 3 0 0 0 0 1 4 Codman Academy CS 1 0 0 0 0 0 1 Conservatory Lab Charter (District) 14 4 0 0 0 3 21 Community Day CS 96 0 0 2 0 0 98 Sabis International CS 17 0 0 0 4 4 25 Neighborhood House CS 3 0 1 1 3 1 9 Abby Kelley Foster CS 12 5 0 0 0 11 28 Foxborough Reg CS 2 0 0 5 0 22 29 Hilltown Cooperative CS 0 0 0 0 0 1 1 EM Kennedy Acad Health Careers HMCS 1 0 1 0 0 0 2 Holyoke Com CS 32 0 0 0 0 0 32 Lawrence Family Development CS 251 0 0 0 0 1 252 Hill View Montessori CS 6 0 0 0 0 1 7 Lowell Community CS 100 19 0 4 3 121 247 Marthas Vineyard CS 0 3 0 0 0 1 4 New Leadership Charter 3 0 0 0 0 1 4 North Central Charter Essential 2 0 0 0 0 1 3 Silver Hill Horace Mann Charter 25 1 0 1 0 4 31 Pioneer Valley Performing Arts CS 1 0 0 0 0 0 1 Boston Renaissance CS 43 1 2 4 1 7 58 Roxbury Preparatory CS 3 0 3 0 0 0 6 Salem Academy CS 13 0 0 0 0 3 16 Seven Hills CS 89 0 0 0 0 21 110 Prospect Hill Academy CS 9 4 0 11 0 5 29 MLK Jr CS of Excellence 19 0 0 1 0 0 20 Phoenix Charter Academy 23 0 0 1 0 1 25
57
District Name Spanish Portuguese Cape
Verdean Creole Haitian Vietnamese Other LEP
Pioneer Charter School of Science 2 3 0 2 0 0 7 Global Learning Charter Public 1 0 0 0 0 0 1 Pioneer Valley Chinese Imm CS 0 0 0 0 0 1 1 Acton-Boxborough 4 6 0 0 0 10 20 Adams-Cheshire 0 0 0 0 0 3 3 Amherst-Pelham 24 3 3 0 1 36 67 Ashburnham-Westminster 8 0 0 2 0 5 15 Athol-Royalston 8 0 0 0 0 7 15 Berkshire Hills 23 0 0 0 0 6 29 Berlin-Boylston 0 0 0 0 0 1 1 Blackstone-Millville 4 1 0 0 0 6 11 Bridgewater-Raynham 2 2 0 2 1 15 22 Central Berkshire 0 0 0 0 0 1 1 Concord-Carlisle 0 0 0 1 0 2 3 Dennis-Yarmouth 34 62 1 13 3 33 146 Dighton-Rehoboth 5 1 0 0 0 2 8 Dover-Sherborn 0 1 0 0 0 2 3 Dudley-Charlton Reg 14 4 0 0 0 32 50 Nauset 5 1 0 0 0 7 13 Freetown-Lakeville 0 1 0 0 0 0 1 Frontier 3 1 0 0 1 4 9 Gateway 1 0 0 0 0 10 11 Groton-Dunstable 6 1 0 0 0 4 11 Gill-Montague 24 0 0 1 0 20 45 Hamilton-Wenham 0 1 0 0 0 42 43 Hampden-Wilbraham 1 0 0 0 2 21 24 Hawlemont 0 1 0 0 0 0 1 King Philip 1 0 0 0 0 1 2 Lincoln-Sudbury 0 0 0 0 0 4 4 Manchester Essex Regional 0 0 0 0 0 3 3 Marthas Vineyard 0 16 0 0 0 0 16
58
District Name Spanish Portuguese Cape
Verdean Creole Haitian Vietnamese Other LEP
0 Masconomet 0 0 0 0 2 2 Mendon-Upton 1 1 0 0 0 8 10 Mount Greylock 0 0 0 0 0 2 2 Mohawk Trail 0 0 0 0 2 5 7 Narragansett 0 0 0 0 0 3 3 Nashoba 7 4 0 1 0 5 17 Northboro-Southboro 1 1 0 1 0 4 7 North Middlesex 11 1 0 0 0 4 16 Old Rochester 0 0 0 0 0 1 1 Pentucket 1 0 0 0 0 2 3 Quabbin 0 0 0 0 0 4 4 Ralph C Mahar 1 0 0 0 0 7 8 Silver Lake 0 0 0 0 0 1 1 Southern Berkshire 4 0 0 0 0 0 4 Southwick-Tolland 0 0 0 0 0 14 14 Spencer-E Brookfield 5 0 0 0 0 2 7 Triton 4 2 0 0 10 8 24 Up-Island Regional 2 1 0 0 0 2 5 Wachusett 3 3 0 0 7 34 47 Quaboag Regional 0 0 0 0 0 1 1 Whitman-Hanson 5 1 0 0 0 3 9 Assabet Valley Reg Voc Tech 8 1 0 0 0 0 9 Blue Hills Regional Vocational Technical 1 2 0 2 0 0 5 Bristol-Plymouth Reg Voc Tech 0 2 0 0 0 0 2 Cape Cod Reg Voc Tech 2 2 0 0 0 1 5 Greater Fall River Reg Voc Tech 1 1 0 0 0 0 2 Greater Lawrence Reg Voc Tech 33 0 0 0 0 1 34 GrNew Bedford Reg Voc Tech 14 6 0 0 0 0 20 Greater Lowell Reg Voc Tech 20 8 0 0 0 18 46 South Middlesex Reg Voc Tech 23 14 0 0 0 3 40 Minuteman Reg Voc Tech 2 0 0 0 0 1 3
59
60
District Name Spanish Portuguese Cape
Verdean Creole Haitian Vietnamese Other LEP
Montachusett Reg Voc Tech 4 0 0 0 0 4 8 Northeast Metro Reg Voc Tech 55 0 0 0 0 2 57 North Shore Reg Voc Tech 3 0 0 0 0 0 3 Southeastern Reg Voc Tech 0 2 3 3 0 1 9 Southern Worcester County Reg Voc Tech 3 0 0 0 0 1 4 Tri County Reg Voc Tech 0 1 0 0 0 0 1 Whittier Reg Voc Tech 6 0 0 0 0 0 6 TOTALS 31793 4209 2458 2433 2423 15842 59158
Source The Department Student Information Management System 2009
- Introduction
-
- Background
-
- I English Language Learners in Massachusetts
- II Educators Implementing Sheltered English Immersion Elementary and Secondary Content Teachers of English Language Learners
-
- Research on Professional Development for Educators of English Language Learners
- Gaps in Knowledge
-
- III Use of Funds for Category Training
-
- Future Need for Category Training
-
- IV Educators Implementing Sheltered English Immersion English as a Second Language (ESL) Teachers
-
- ESL Teacher Shortage
-
- V Use of Funds ESL Teachers and ESL Curriculum Development
-
- Massachusetts English Language Teacher Initiative (MELT)
- Improvement of Sheltered English Immersion Content-based ESL Instruction
- Future Need for ESL teachers
-
- VI Budget
- Attachments
-
- Attachment 1 All Massachusetts public school districts and changes in LEP population compared to changes in overall student population - SY 2006-SY 2010
- Attachment 1 Massachusetts public school districts and changes in LEP population compared to changes in overall student population - SY 2006-SY 2010
- Attachment 2 Massachusetts public school districts with large changes in LEP population compared to changes in overall student population - SY 2006-SY 2010
- Attachment 3 Bibliography Professional Development for Teachers of English Language Learners
- Attachment 4 Excerpts from the Commissionerrsquos Memorandum of June 2004 Guidance on Qualifications for Teachers of Limited English Proficient Students in Sheltered English Immersion Classrooms
- Attachment 5 Districts Receiving Sheltered English Immersion Professional Development 2004-2010
- Attachment 6 Collaboratives that have received grants for Sheltered English Immersion Professional Development 2004-2010
- Attachment 7 English Language Learners in Massachusetts District and Program Type October 2009
- Attachment 8 English Language Learners in Massachusetts District and First Language October 2009
-
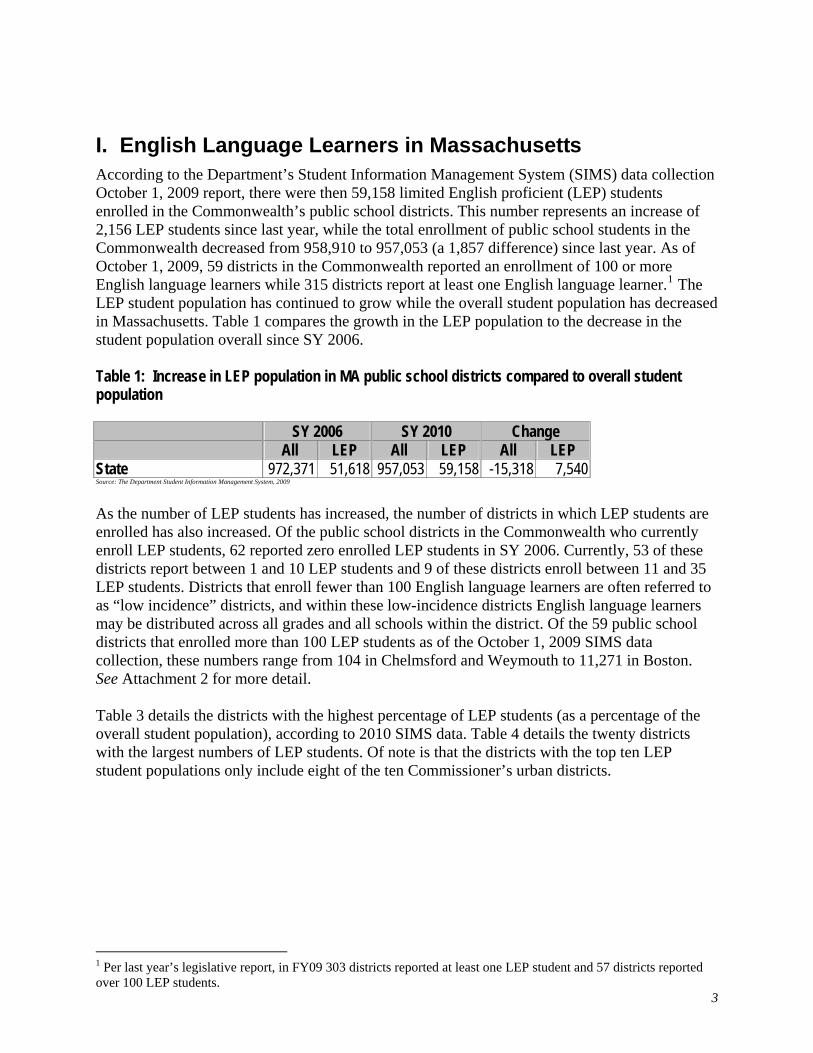
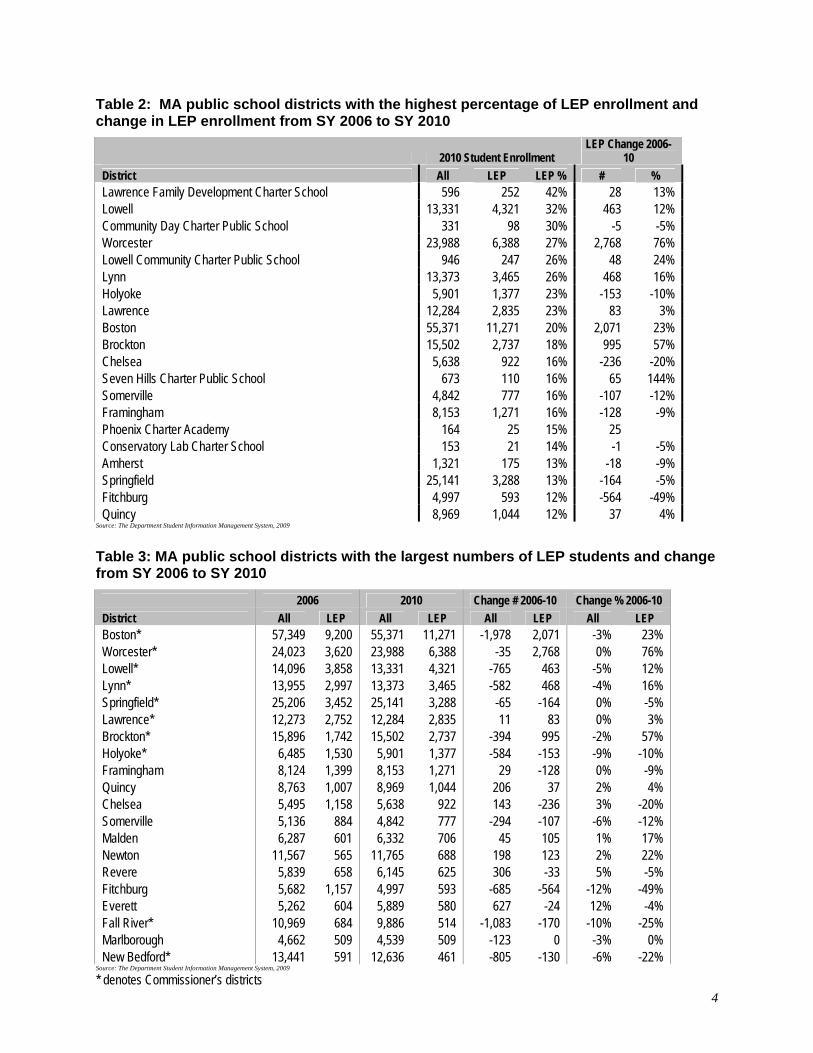
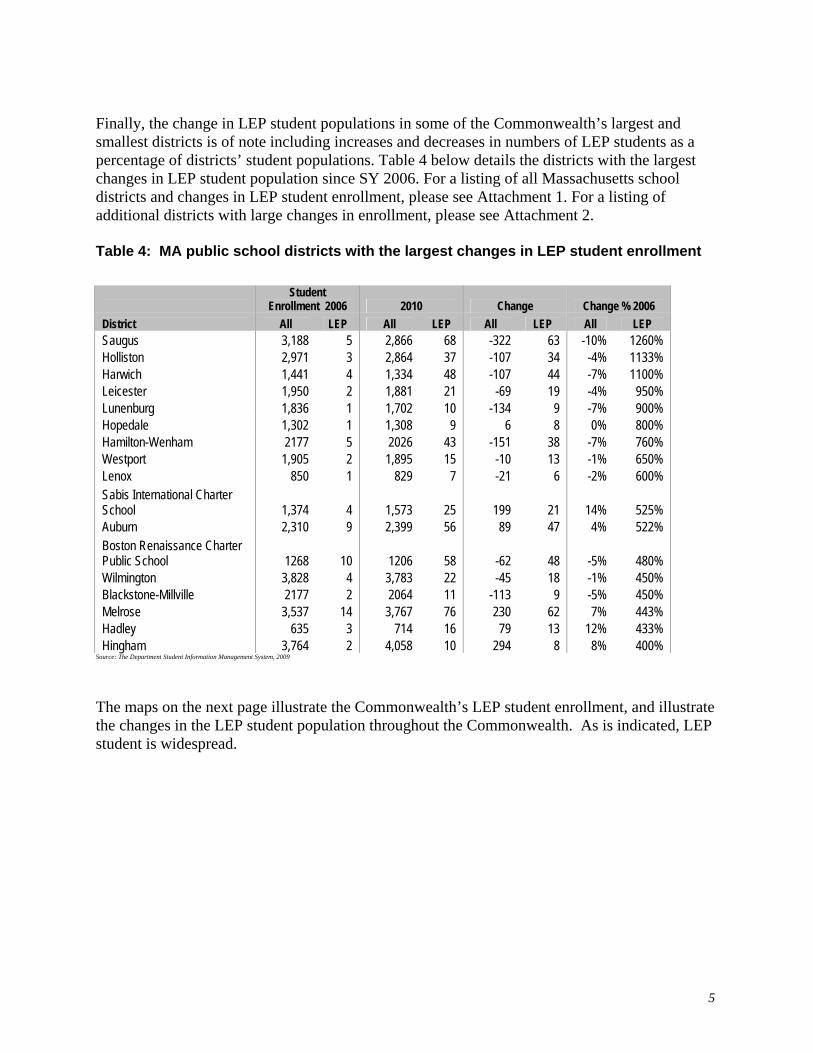
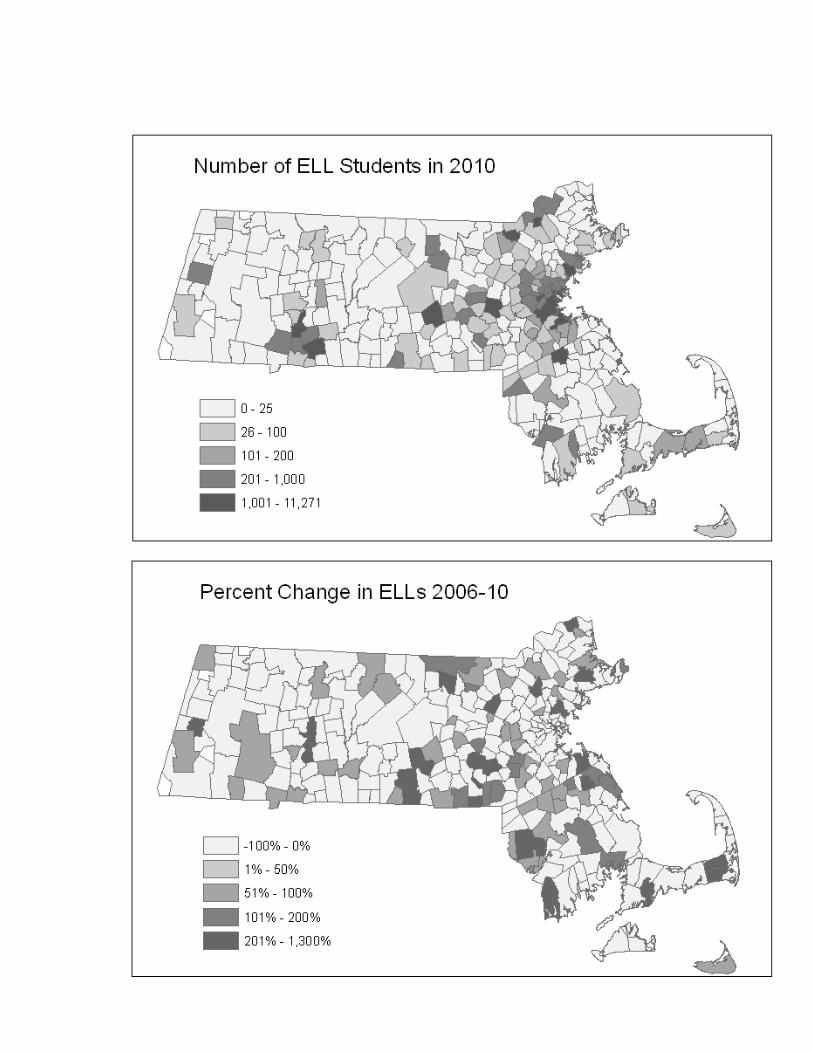
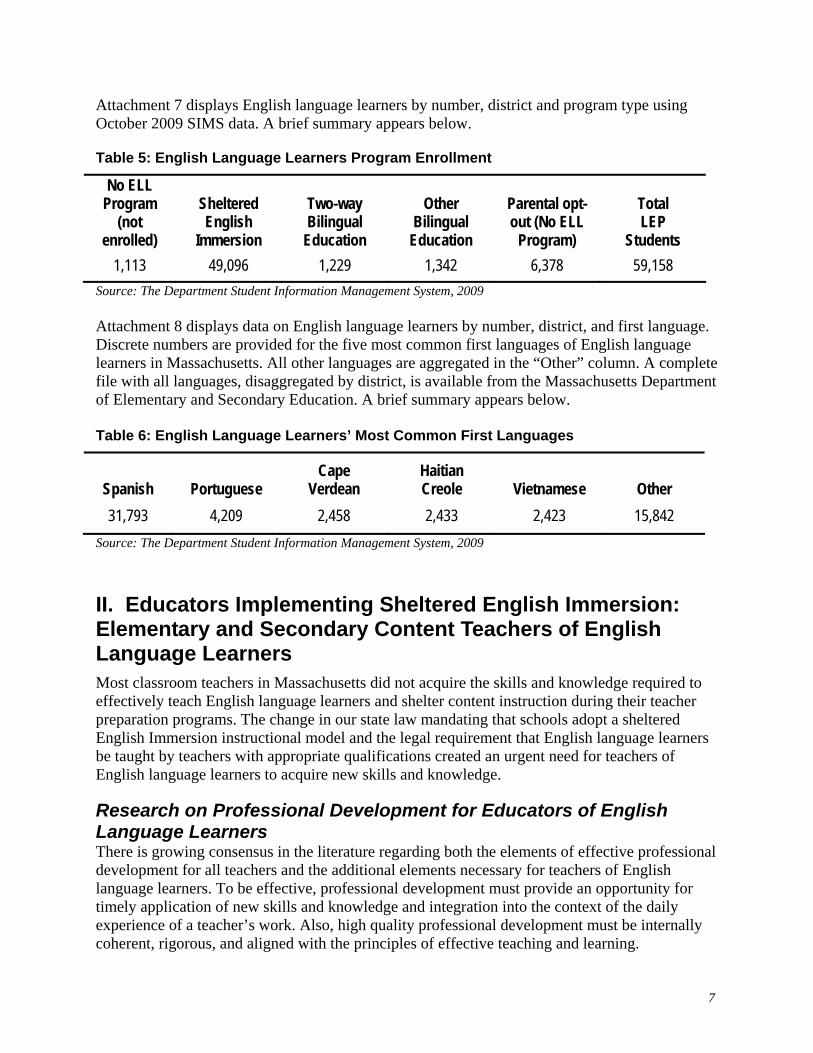
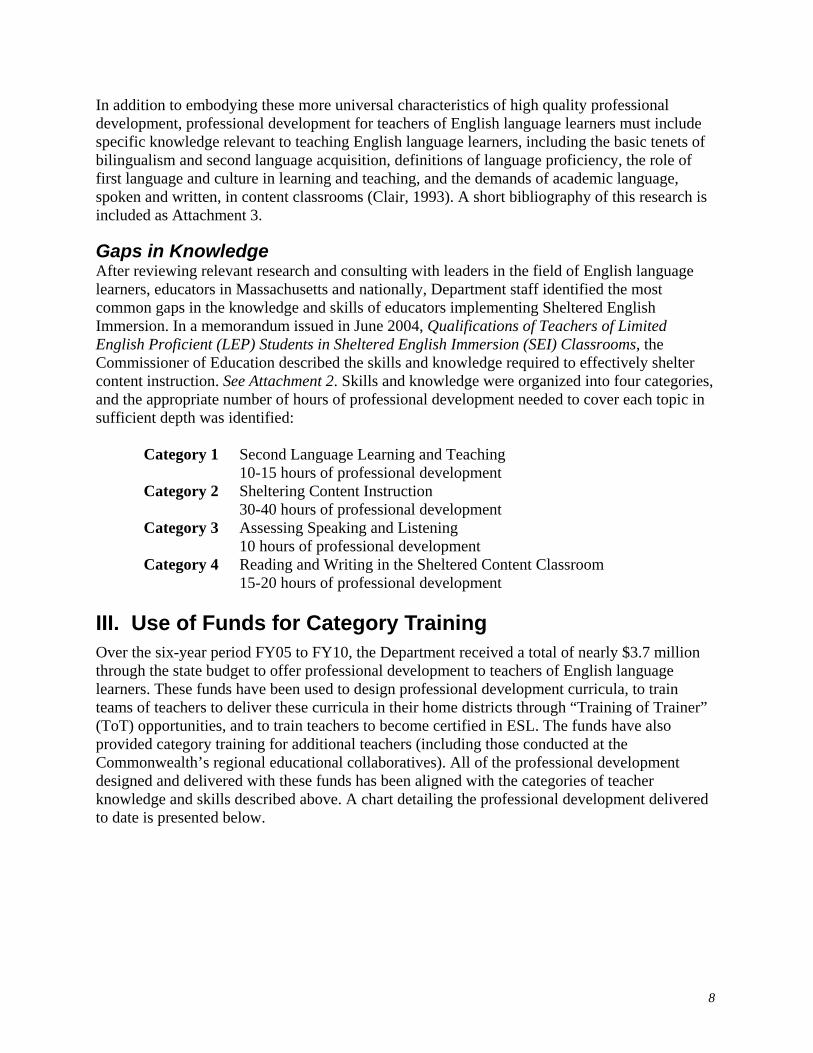
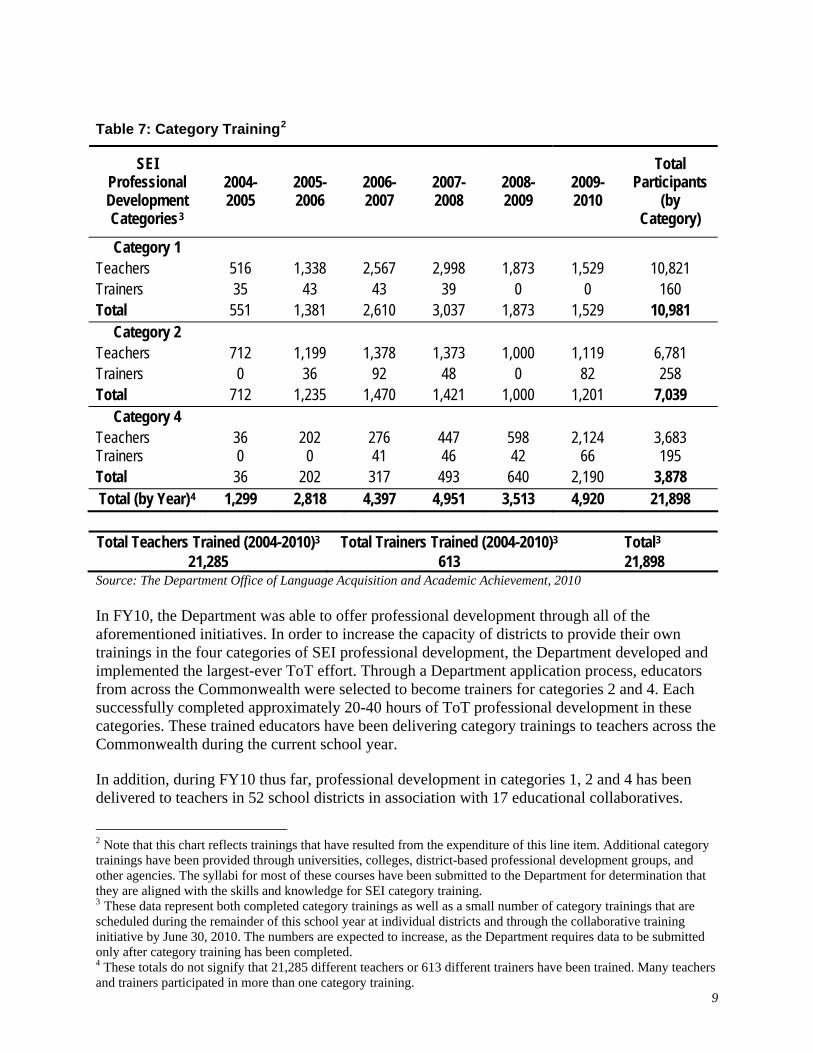
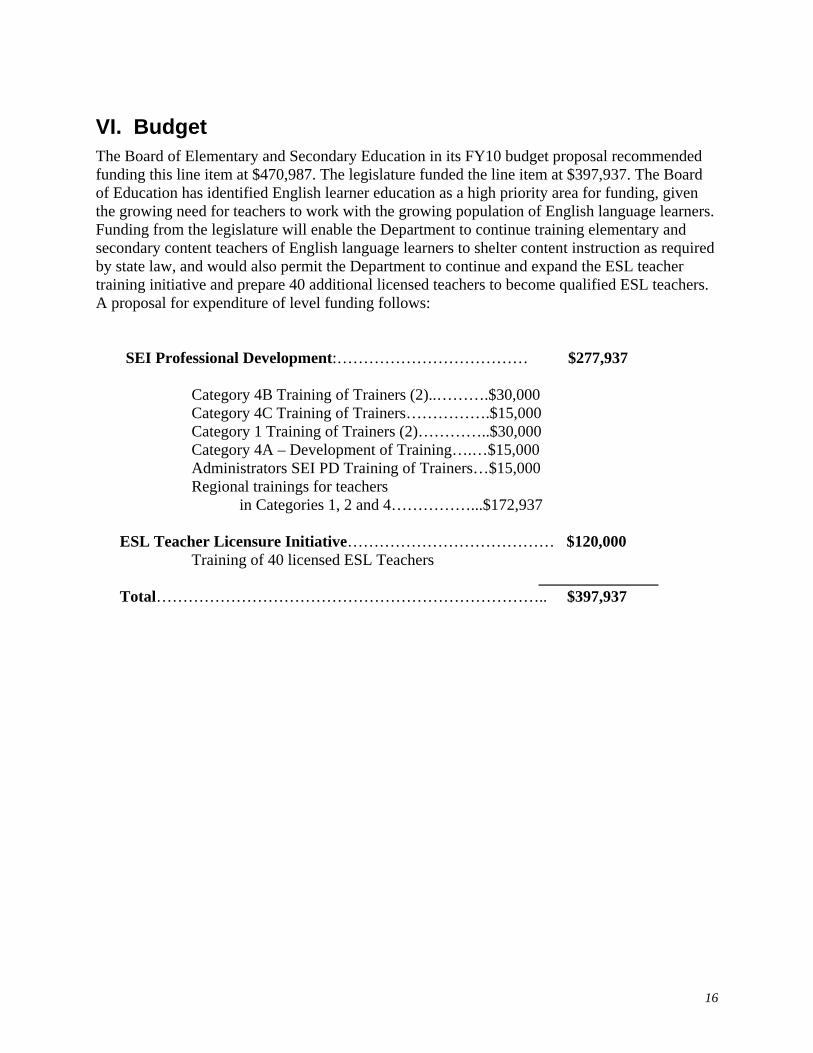
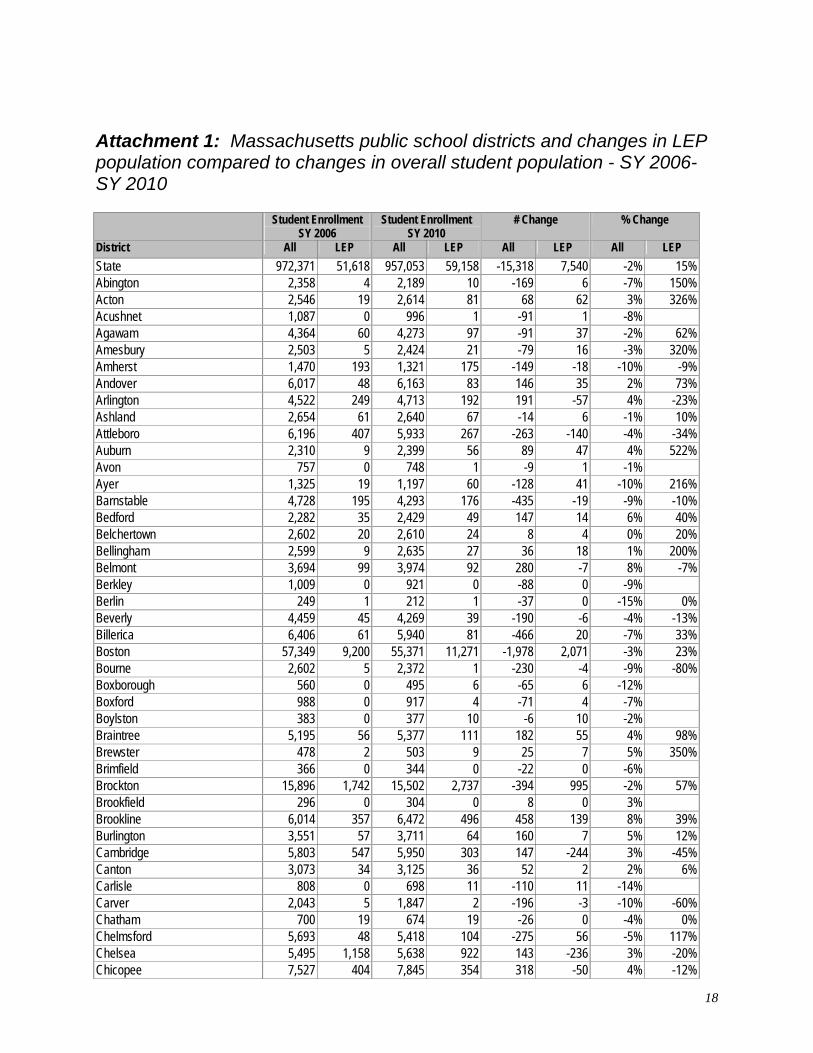
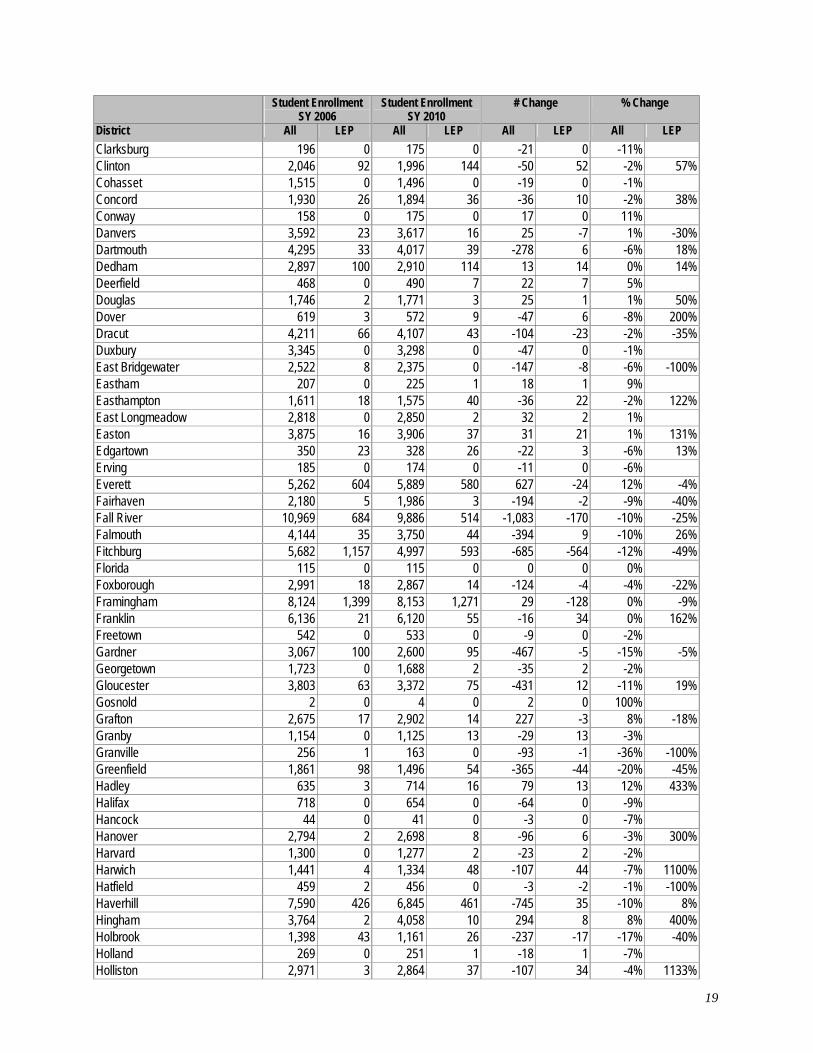
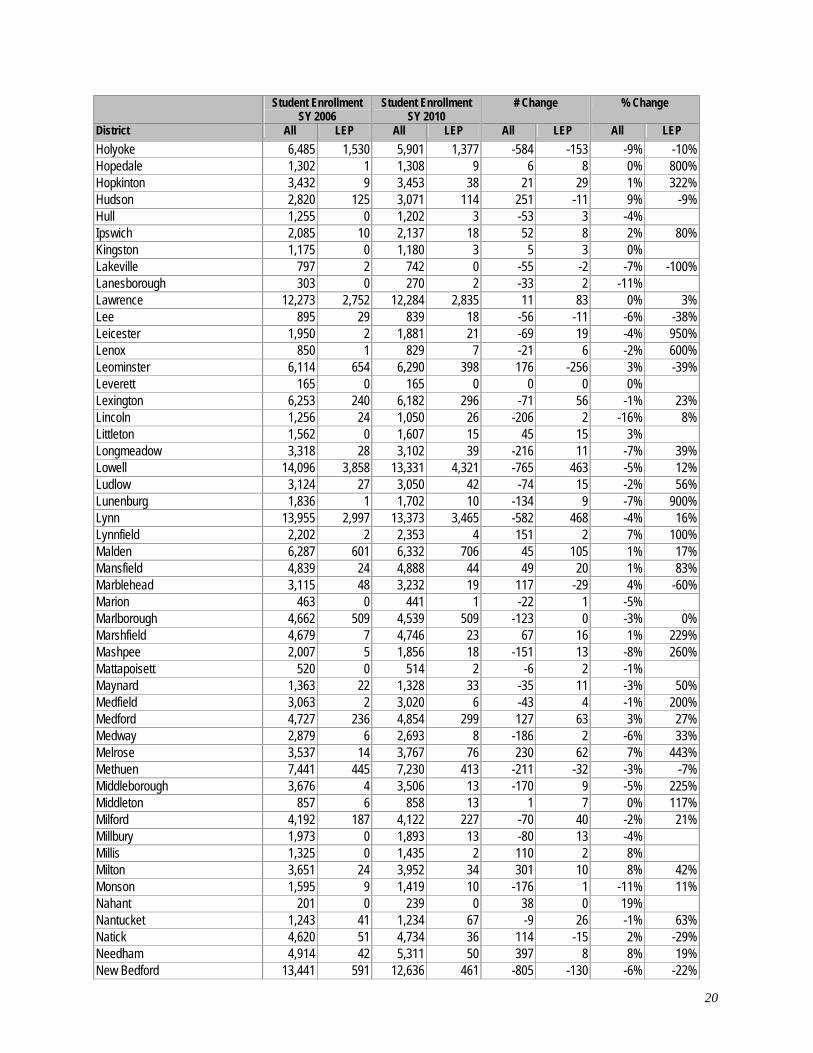
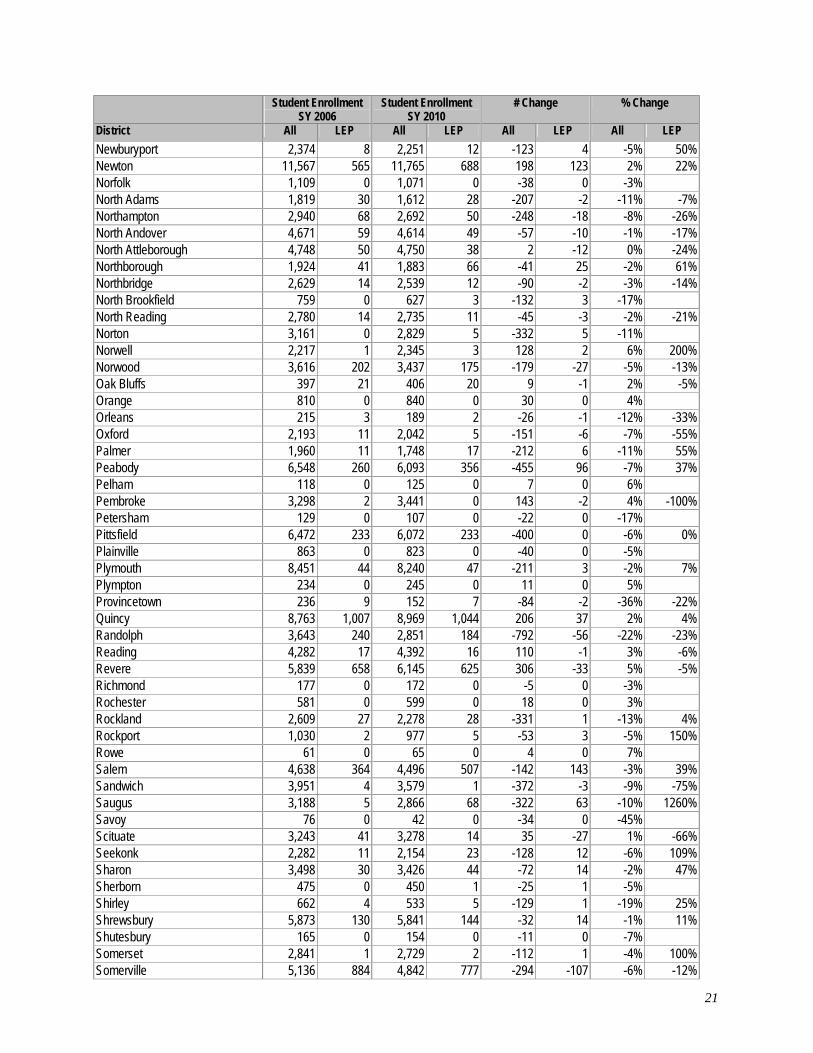
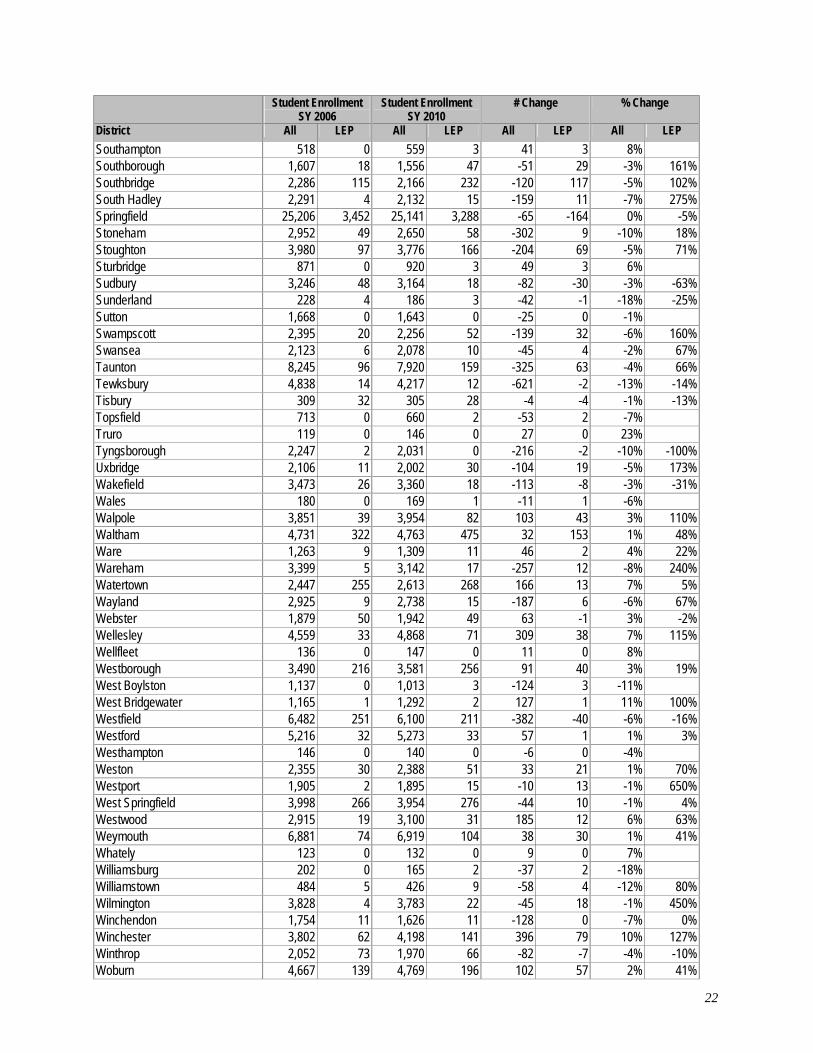
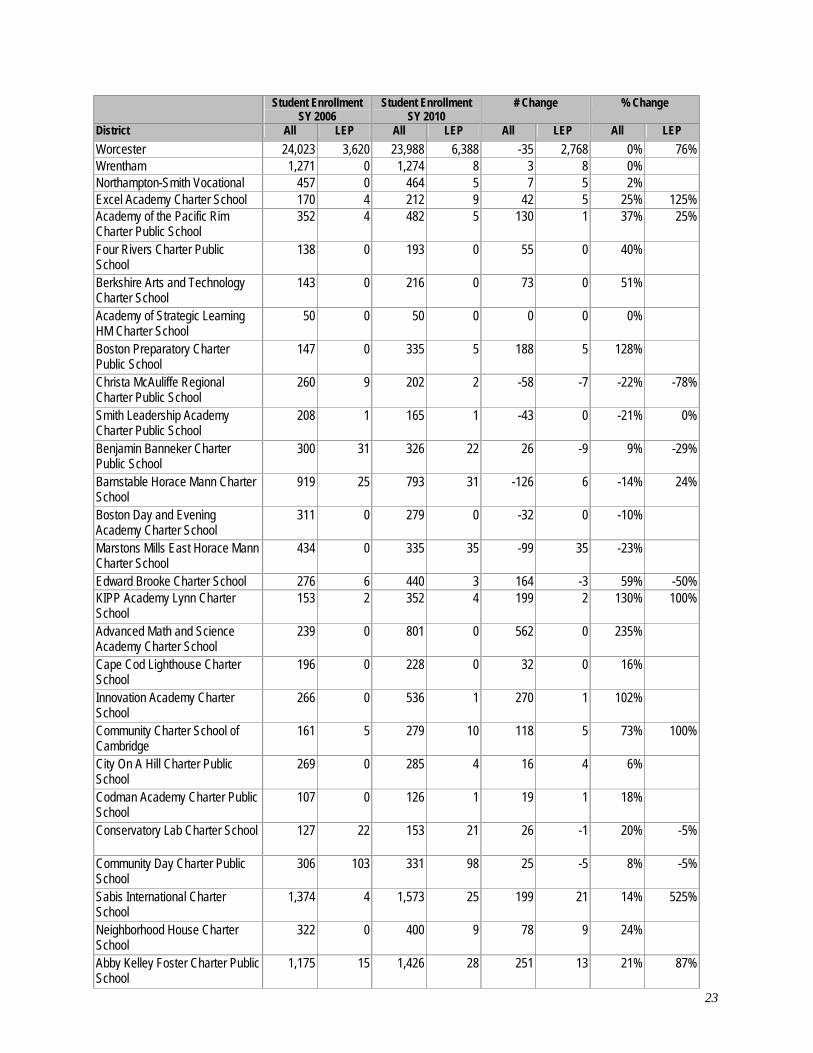
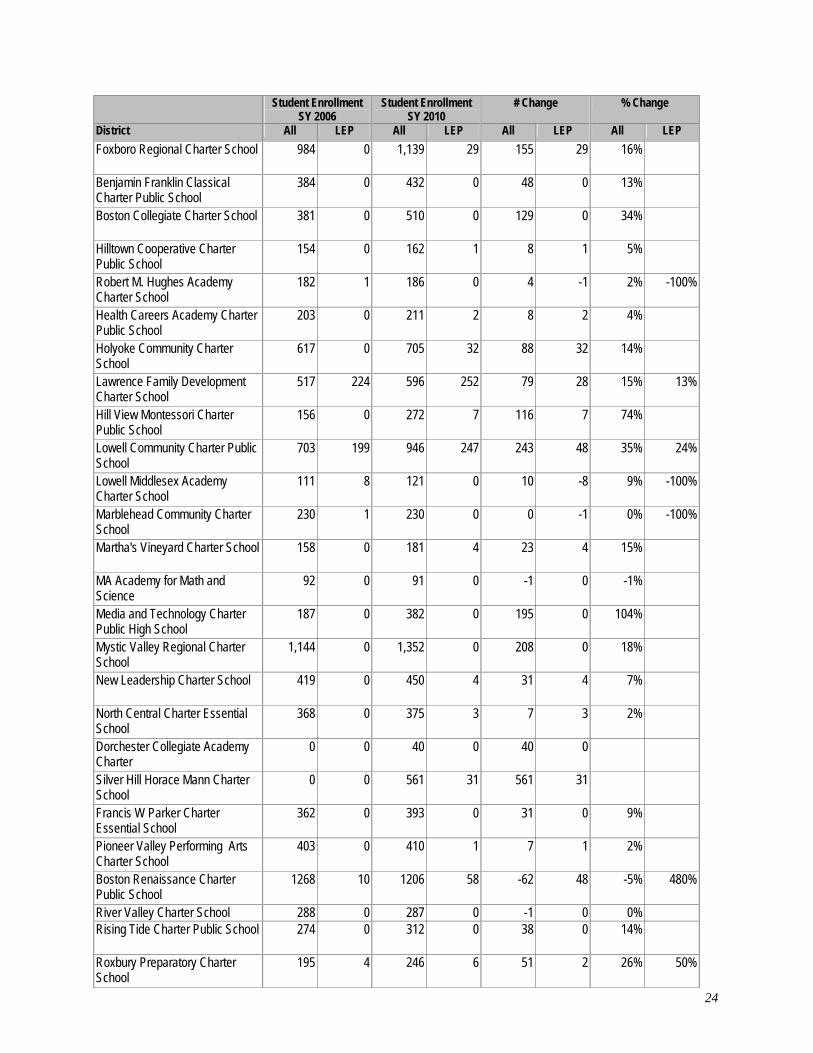
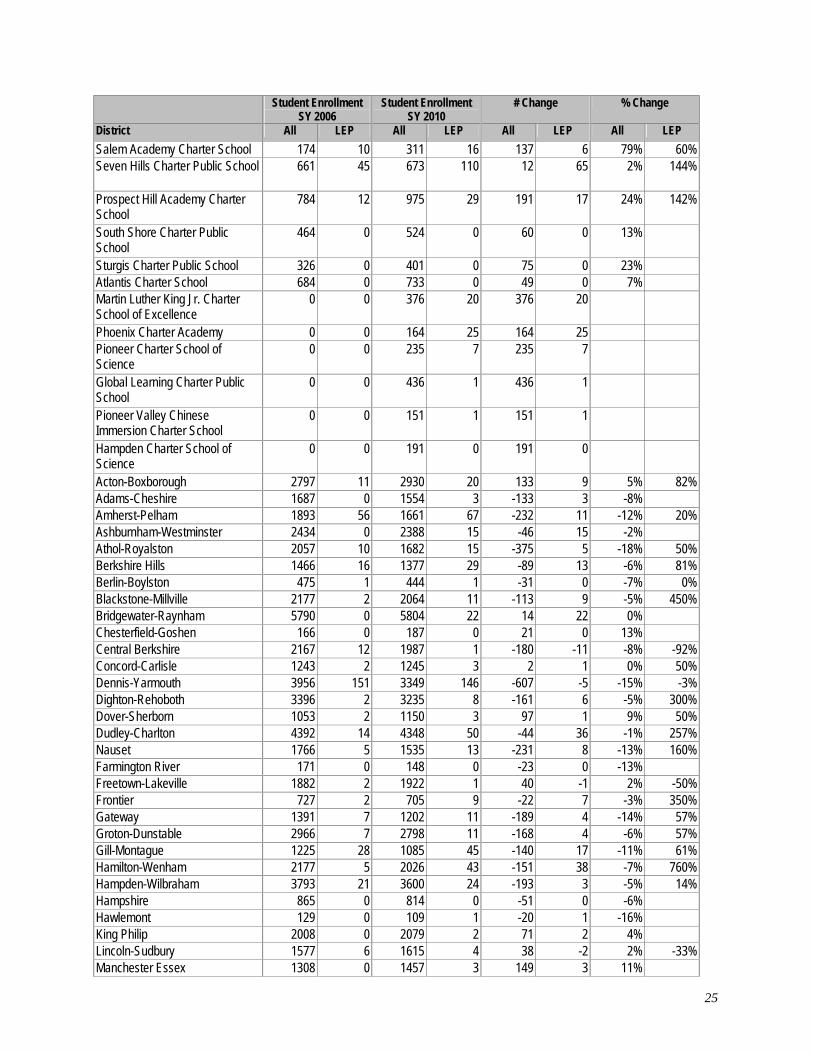
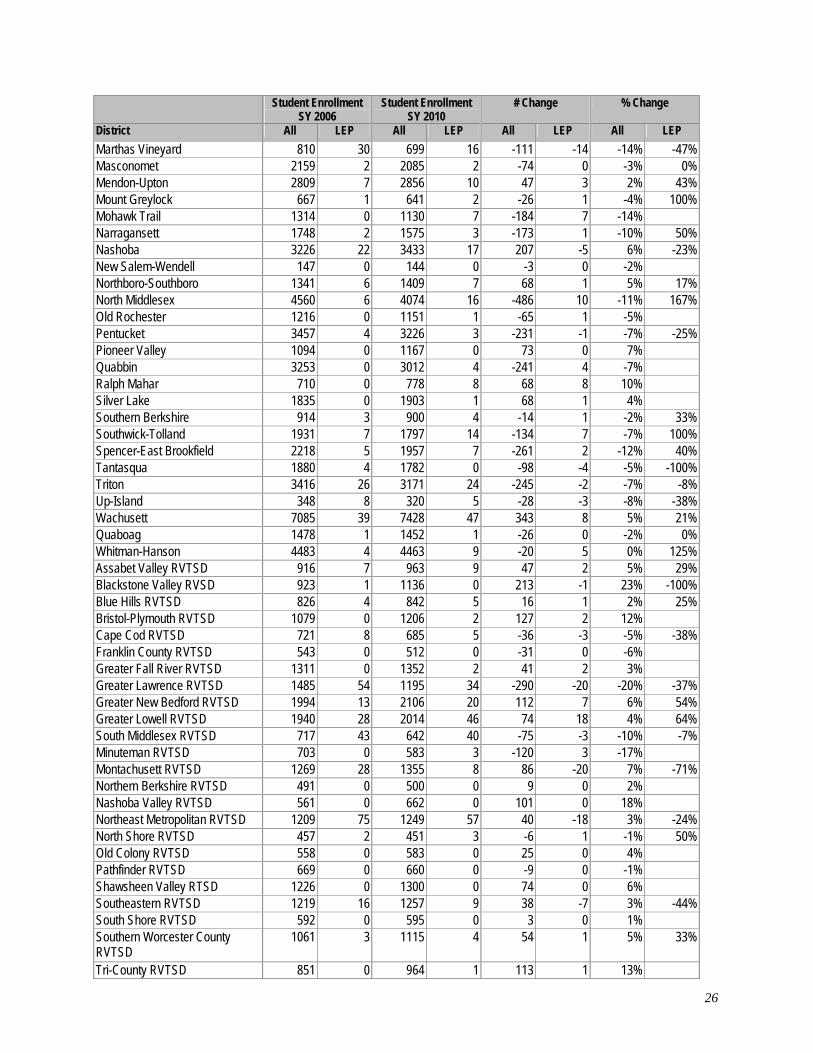
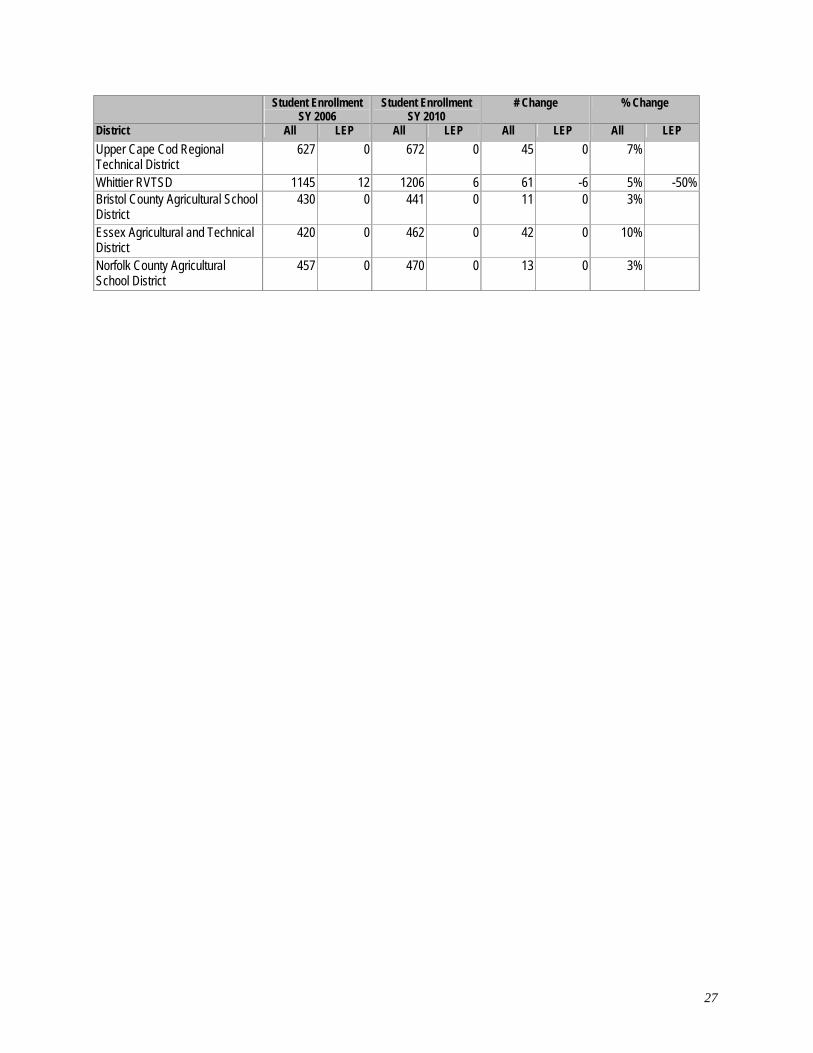
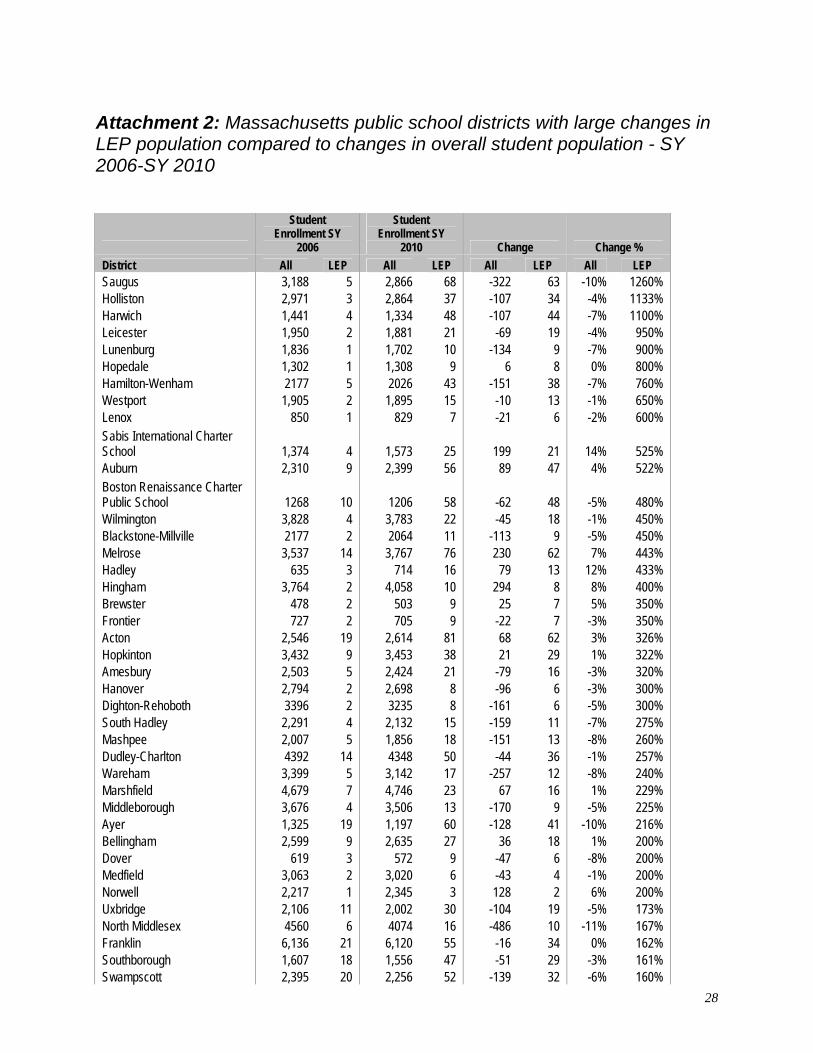
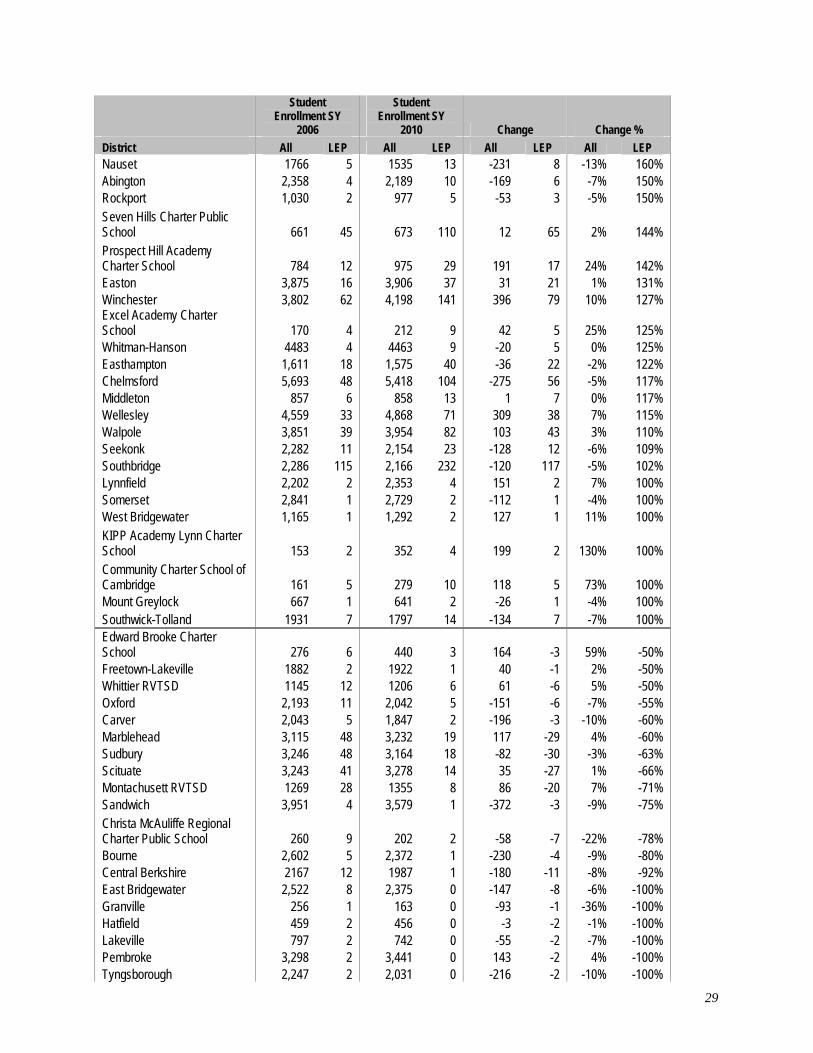
29
Student Enrollment SY
2006
Student Enrollment SY
2010 Change Change
District All LEP All LEP All LEP All LEP Nauset 1766 5 1535 13 -231 8 -13 160 Abington 2358 4 2189 10 -169 6 -7 150 Rockport 1030 2 977 5 -53 3 -5 150 Seven Hills Charter Public School 661 45 673 110 12 65 2 144 Prospect Hill Academy Charter School 784 12 975 29 191 17 24 142 Easton 3875 16 3906 37 31 21 1 131 Winchester 3802 62 4198 141 396 79 10 127 Excel Academy Charter School 170 4 212 9 42 5 25 125 Whitman-Hanson 4483 4 4463 9 -20 5 0 125 Easthampton 1611 18 1575 40 -36 22 -2 122 Chelmsford 5693 48 5418 104 -275 56 -5 117 Middleton 857 6 858 13 1 7 0 117 Wellesley 4559 33 4868 71 309 38 7 115 Walpole 3851 39 3954 82 103 43 3 110 Seekonk 2282 11 2154 23 -128 12 -6 109 Southbridge 2286 115 2166 232 -120 117 -5 102 Lynnfield 2202 2 2353 4 151 2 7 100 Somerset 2841 1 2729 2 -112 1 -4 100 West Bridgewater 1165 1 1292 2 127 1 11 100 KIPP Academy Lynn Charter School 153 2 352 4 199 2 130 100 Community Charter School of Cambridge 161 5 279 10 118 5 73 100 Mount Greylock 667 1 641 2 -26 1 -4 100 Southwick-Tolland 1931 7 1797 14 -134 7 -7 100 Edward Brooke Charter School 276 6 440 3 164 -3 59 -50 Freetown-Lakeville 1882 2 1922 1 40 -1 2 -50 Whittier RVTSD 1145 12 1206 6 61 -6 5 -50 Oxford 2193 11 2042 5 -151 -6 -7 -55 Carver 2043 5 1847 2 -196 -3 -10 -60 Marblehead 3115 48 3232 19 117 -29 4 -60 Sudbury 3246 48 3164 18 -82 -30 -3 -63 Scituate 3243 41 3278 14 35 -27 1 -66 Montachusett RVTSD 1269 28 1355 8 86 -20 7 -71 Sandwich 3951 4 3579 1 -372 -3 -9 -75 Christa McAuliffe Regional Charter Public School 260 9 202 2 -58 -7 -22 -78 Bourne 2602 5 2372 1 -230 -4 -9 -80 Central Berkshire 2167 12 1987 1 -180 -11 -8 -92 East Bridgewater 2522 8 2375 0 -147 -8 -6 -100 Granville 256 1 163 0 -93 -1 -36 -100 Hatfield 459 2 456 0 -3 -2 -1 -100 Lakeville 797 2 742 0 -55 -2 -7 -100 Pembroke 3298 2 3441 0 143 -2 4 -100 Tyngsborough 2247 2 2031 0 -216 -2 -10 -100
30
Student Enrollment SY
2006
Student Enrollment SY
2010 Change Change
District All LEP All LEP All LEP All LEP
Robert M Hughes Academy Charter School 182 1 186 0 4 -1 2 -100 Lowell Middlesex Academy Charter School 111 8 121 0 10 -8 9 -100 Marblehead Community Charter School 230 1 230 0 0 -1 0 -100 Tantasqua 1880 4 1782 0 -98 -4 -5 -100 Blackstone Valley RVSD 923 1 1136 0 213 -1 23 -100
31
Attachment 3 Bibliography Professional Development for Teachers of English Language Learners
Brown H Douglas Principles of Language Learning and Teaching 4th Edition Addison Wesley Longman Inc 2000 August D and Hakuta K 1997 Improving Schooling for Language-Minority Children A Research Agenda Washington DC National Academy Press Freeman D (Ed) (1993) New ways in teacher education Alexandria VA TESOL Garcia G Lessons from Research What is the length of time it takes limited English proficient students to acquire English and succeed in an all-English classroom (Issue Brief No 5) Washington DC National Clearinghouse for Bilingual Education 2000 Effective reading programs for English language learners A best-evidence synthesis by Robert E Slavin Johns Hopkins University Center for Research Review of Educational Research (2003) at httpwwwucfeducfedu Walqui A (1999 July) ldquoProfessional development for teachers of English language learnersrdquo Paper presented at an invitational conference wwwericdigestsorg2004-1englishhtm Clair Nancy and Adger Carolyn Temple Adger ldquoProfessional Development for Teachers in Culturally Diverse Schoolsrdquo CAL Digests October 1999 httpwwwcalorgresourcesdigestprofdvpthtml Knight Stephanie L ldquoInvestigating the Impact of Professional Development for Teachers of Culturally and Linguistically Diverse Studentsrdquo Texas AampM University Synthesis Team Executive Summary available through the Center for Research on Education Diversity amp Excellence (CREDE) at httpcredeberkeleyeduresearchcredesynthesispdpd_exsumhtml Professional Development Guidelines Handbook on Planning for Limited English Proficient (LEP) Student Success Colorado State DOE March 1997 Frutiger Eliso ldquoSelected Strategies and Activities to Provide Challenging Instruction to ESOL Students in Content Area Coursesrdquo KeKalb County School System Decatur GA 1999 Baker Colin and Hornberger Nancy An Introductory Reader to the Writings of Jim Cummins Multilingual Matters Ltd 2001 Approaches to Writing Instruction for Adolescent English Language Learners A discussion of recent research and practice literature in relation to nationwide standards on writing The Education Alliance at Brown University 2005
32
Attachment 4 Excerpts from the Commissionerrsquos Memorandum of June 2004 Guidance on Qualifications for Teachers of Limited English Proficient Students in Sheltered English Immersion Classrooms
Memorandum Attachment 1 Skills and Knowledge for Teachers of Limited English Proficient Students in sheltered English immersion Classrooms12 Part A For all teachers of limited English proficient students in Sheltered English Immersion classrooms Category 1 Second Language Learning and Teaching Knowledge
a Key factors affecting second language acquisition b Implications of these factors on classroom organization and instruction c The implications of cultural difference for classroom organization and instruction d Organization content and performance levels in the Massachusetts English Language Proficiency Benchmarks and Outcomes
SkillsObservable Outcomes bull Teacher can analyze hisher own classroom as a site for second language acquisition and
make appropriate adjustments bull Teacher can use knowledge of factors affecting second language acquisition to modify
instruction for students who are having difficulty in learning English andor subject matter content
Note Suggested number of professional development hours for Category 1 is 10-15 Category 2 Sheltering Content Instruction Knowledge a Curriculum and Lesson Planning Teachers will be able to
1 Plan lessons appropriate for LEP students at the four levels of proficiency described in the Massachusetts English Language Proficiency Benchmarks and Outcomes 2 Plan lessons that are guided by both language and content objectives appropriate for LEP students who are at different grade levels and different English proficiency levels and that are aligned with the Massachusetts Curriculum Frameworks and the Massachusetts English Language Proficiency Benchmarks and Outcomes 3 Plan lessons that are characterized by student interaction students questions and appropriate group work
b Instructional Strategies While teaching teachers will be able to 1 make language objectives content objectives and academic tasks explicit
12 httpwwwdoemasseduellseiqualificationspdf
33
2 use supplementary materials including graphic organizers visuals and manipulatives to make content more comprehensible 3 group students so that all LEP students can participate 4 integrate language instruction and content instruction
c Student Tasks Teachers will be able to 1 plan learning tasks that have a product and that enable all students including LEP students to work and ask questions in small groups 2 provide opportunities for students to display their knowledge in various ways
d Lesson Delivery While teaching teachers will be able to 1 assess student comprehension and learning throughout the lesson 2 pace and organize learning activities so that students are engaged 90-100 of the time
SkillsObservable Outcomes
Teacher can plan and conduct content classes that are based on standards contained in the Massachusetts Curriculum Frameworks and that engage LEP students who are at different levels of English proficiency in learning throughout the duration of the class
Teacher can assess content learning of students who are at different levels of English proficiency
Note Suggested number of professional development hours for Category 2 is 30-40 Teachers with ESL and TBE licenses may possess these skills but this cannot be assumed solely from the possession of either license Category 3 Assessment of Speaking and Listening Knowledge
a Multiple dimensions of oral proficiency comprehension production fluency pronunciation grammar and vocabulary
b Concept of communicative competence and its role in assessment c The six levels of oral proficiency assessed by the MELA-O and their relation to
the four levels of English language proficiency as described in the Massachusetts English Language Proficiency Benchmarks and Outcomes
SkillsObservable Outcomes bull Teacher can place students in the six-level continuum of oral proficiency as assessed by the
MELA-O bull Teacher is a Qualified MELA-O Administrator (QMA) Note Teachers who have participated in 8-10 hours of MELA-O training and passed the calibration test have met all Category 3 components Part B For teachers who teach English language arts to LEP students at any grade level in Sheltered English Instruction classrooms Category 4 Reading and Writing in the Sheltered Content Classroom
34
Knowledge a Basic concepts of linguistics including phonology and syntax of English b Significant theories and practices for developing reading skills and reading
comprehension in English for limited English proficient students who are at different English proficiency levels
c A variety of strategies for teaching vocabulary d Approaches and practices for developing writing skills in limited English
proficient students e Initial reading instruction including phonemic awareness phonics fluency
vocabulary and text comprehension The differences in initial reading instruction in English designed for those students who have no or limited oral proficiency in English compared to those who do have oral proficiency in English
f The performance criteria and scoring system used in the MEPA (Massachusetts English Proficiency Assessment) and based on the Massachusetts English Language Proficiency Benchmarks and Outcomes
SkillsObservable Outcomes
bull Teacher can plan and deliver reading instruction appropriate for limited English proficient students who are at different levels of English language proficiency
bull Teacher can plan and deliver writing instruction and activities appropriate for limited English proficient students who are at different levels of English language proficiency
bull Teacher can use the scoring rubric and test results of the MEPA to plan reading and writing instruction for limited English proficient students who are at different proficiency levels
bull Teacher can plan and deliver early literacy instruction for students who have no or limited oral proficiency or literacy in English
Note Suggested number of professional development hours for Category 4 is 30-40
35
Attachment 5 Districts Receiving Sheltered English Immersion Professional Development 2004-2010
Abby Kelley Foster Charter Abington Acad Of the Pacific Rim Charter Acton Acton-Boxborough Acushnet Adams-Cheshire Agawam Amesbury Amherst Pelham Amherst Pelham RVT Ashburnham-Westminster Andover Arlington AtholRoyalston Ashland Assabet Valley Atlantis Charter Belmont Benjamin Banneker Charter Berlin Berlin-Boylston Berkshire Hills Beverly Billerica Blackstone Valley Reg Blackstone-Millville Blue Hills Voc Boston Boston Renaissance Charter Bourne Boylston Boxborough Braintree Bridgewater Bridgewater-Raynham Bristol-Plymouth Voc Tech Brockton Brookline Burlington Cambridge Canton Cape Cod Region Voc Tech Carlisle Carver Central Berkshire Charlton Chatham Chelmsford Chelsea Christa McAuliffe Regional Charter Chicopee Clarksburg Clinton Cohasset Concord Concord-Carlisle Danvers Dartmouth Dedham Dennis-Yarmouth Dighton Dighton-Rehoboth Douglas Dover Dover-Sherborn Dudley Dudley Charlton Duxbury East Bridgewater East Longmeadow Easthampton Edgartown Essex Everett Fall River Fitchburg Foxboro Regional Charter Foxborough Framingham Franklin Gardner Georgetown Gloucester Grafton Granby Greater Fall River Greater Lawrence RVT Greater Lowell Technical Greater New Bedford Greenfield Groton-Dunstable Hamilton-Wenham Hanover Harvard Hampden-Wilbraham Haverhill Hill View Montessori Charter Harwich Holbrook Hopkinton Hingham Hyde Park Ipswich Hudson Kingston Lawrence King Philip Lee Leicester Lawrence Family Dev Charter Leominster Lexington Lenox Lincoln-Sudbury Littleton Lincoln Lowell Lowell Community Charter Longmeadow Lunenburg Lynn Ludlow Malden Manchester Essex Regional Marlborough Marblehead Marion Mansfield Marshfield Martharsquos Vineyard Marlboro
36
Masconomet Mashpee Martharsquos Vineyard Charter Maynard Medfield Mattapoisett Medway Melrose Medford Methuen Middleboro Mendon-Upton Milford Millbury Middleton Milton Monson Millis Nantucket Narragansett Montachusett Reg Voc Tech Natick Nauset Nashoba New Bedford New Bedford Global Learning Charter Needham Newburyport Newton New Leadership Charter Norfolk North Adams North Andover North Attleborough North Central Charter Essential School North Middlesex North Quincy Northampton Northbridge Northern Berkshire Voc Northeast Metro Voc North Shore Reg Voc Northboro-Southboro Northborough Norton Norwell Norwood Oak Bluffs Orange Oxford Peabody Pembroke Pentucket Petersham Pittsfield Plainville Plymouth Prospect Hill Academy Charter Provincetown Quabbin Quincy Randolph Raynham Reading Rehoboth Revere Rochester Rockland Rockport Richmond Saugus Salem Scituate Seven Hills Charter Sherborn Shirley Shrewsbury Silver Lake Smith Leadership AcadCharter So Middlesex Voc Tech Reg Somerset Somerville South Shore Charter Southborough Southbridge Southeastern Reg Voc Tech Southern Berkshire Southwick Southwick-Tolland Spencer-E Brookfield Springfield Stoneham Sturgis Charter Sudbury Sutton Swampscott Swansea Tantasqua Taunton Tisbury Townsend Tri County Triton Tyngsborough Up-Island Regional Upper Cape Cod Voc Tech Uxbridge Wachusett Walpole Waltham Ware Wareham Wayland Watertown Webster Wellesley West Boylston West Bridgewater West Springfield Westborough Westfield Westminster Weston Westport Westwood Weymouth Whitman-Hanson Wilbraham Williamstown Wilmington Winchendon Winchester Winthrop Woburn Worcester Wrentham
-Source The Department Office of Language Acquisition and Academic Achievement 2010
37
Attachment 6 Collaboratives that have received grants for Sheltered English Immersion Professional Development 2004-2010 ACCEPT Collaborative
Assabet Valley Collaborative
Bi-County Collaborative
Cape Cod Collaborative
CHARMS Collaborative
Greater Lawrence Educational Collaborative
EDCO Collaborative
FLLAC Collaborative
Merrimack Education Collaborative
North River Collaborative
Pilgrim Area Collaborative
Shore Educational Collaborative
South Coast Collaborative
South Shore Educational Collaborative
Southern Berkshire Educational Collaborative
Southeastern MA Educational Collaborative
The Education Cooperative (TEC) Source The Department Office of Language Acquisition and Academic Achievement 2010
Attachment 7 English Language Learners in Massachusetts District and Program Type October 2009
District Name No ELL
Program Sheltered English
Immersion Two-Way Bilingual
Other Bilingual Education
Parental Opt Out
Total LEP Population
Abington 0 10 0 0 0 10 Acton 0 80 0 0 1 81 Acushnet 0 1 0 0 0 1 Agawam 1 96 0 0 0 97 Amesbury 0 21 0 0 0 21 Amherst 0 175 0 0 0 175 Andover 0 83 0 0 0 83 Arlington 3 184 0 0 5 192 Ashland 0 67 0 0 0 67 Attleboro 1 266 0 0 0 267 Auburn 0 56 0 0 0 56 Avon 0 1 0 0 0 1 Ayer 0 60 0 0 0 60 Barnstable 14 162 0 0 0 176 Bedford 0 49 0 0 0 49 Belchertown 0 24 0 0 0 24 Bellingham 0 27 0 0 0 27 Belmont 5 83 0 0 4 92 Berkley 0 0 0 0 0 0 Berlin 0 1 0 0 0 1 Beverly 10 29 0 0 0 39 Billerica 0 69 0 0 12 81 Boston 0 5856 357 386 4672 11271 Bourne 0 1 0 0 0 1 Boxborough 0 6 0 0 0 6 Boxford 0 4 0 0 0 4 Boylston 0 10 0 0 0 10 Braintree 0 111 0 0 0 111 Brewster 0 9 0 0 0 9 Brimfield 0 0 0 0 0 0 Brockton 207 1851 88 422 169 2737 Brookfield 0 0 0 0 0 0
38
District Name No ELL
Program Sheltered English
Immersion Two-Way Bilingual
Other Bilingual Education
Parental Opt Total LEP Out Population
Brookline 0 494 0 0 2 496 Burlington 1 63 0 0 0 64 Cambridge 0 266 37 0 0 303 Canton 3 33 0 0 0 36 Carlisle 0 11 0 0 0 11 Carver 0 2 0 0 0 2 Chatham 0 19 0 0 0 19 Chelmsford 0 90 0 10 4 104 Chelsea 0 922 0 0 0 922 Chicopee 2 351 0 0 1 354 Clarksburg 0 0 0 0 0 0 Clinton 1 117 0 0 26 144 Cohasset 0 0 0 0 0 0 Concord 0 36 0 0 0 36 Conway 0 0 0 0 0 0 Danvers 6 9 0 0 1 16 Dartmouth 1 38 0 0 0 39 Dedham 0 114 0 0 0 114 Deerfield 4 3 0 0 0 7 Douglas 2 1 0 0 0 3 Dover 1 8 0 0 0 9 Dracut 0 43 0 0 0 43 Duxbury 0 0 0 0 0 0 East Bridgewater 0 0 0 0 0 0 Eastham 0 1 0 0 0 1 Easthampton 40 0 0 0 0 40 East Longmeadow 2 0 0 0 0 2 Easton 0 37 0 0 0 37 Edgartown 0 26 0 0 0 26 Erving 0 0 0 0 0 0 Everett 72 251 0 0 257 580 Fairhaven 0 3 0 0 0 3 Fall River 0 339 0 175 0 514 Falmouth 0 44 0 0 0 44
39
District Name No ELL
Program Sheltered English
Immersion Two-Way Bilingual
Other Bilingual Education
Parental Opt Total LEP Out Population
Fitchburg 2 591 0 0 0 593 Florida 0 0 0 0 0 0 Foxborough 0 14 0 0 0 14 Framingham 0 822 248 85 116 1271 Franklin 0 54 0 0 1 55 Freetown 0 0 0 0 0 0 Gardner 0 95 0 0 0 95 Georgetown 0 2 0 0 0 2 Gloucester 2 73 0 0 0 75 Gosnold 0 0 0 0 0 0 Grafton 0 14 0 0 0 14 Granby 0 13 0 0 0 13 Granville 0 0 0 0 0 0 Greenfield 0 54 0 0 0 54 Hadley 2 14 0 0 0 16 Halifax 0 0 0 0 0 0 Hancock 0 0 0 0 0 0 Hanover 0 7 0 0 1 8 Harvard 1 0 1 0 0 2 Harwich 0 48 0 0 0 48 Hatfield 0 0 0 0 0 0 Haverhill 2 457 0 0 2 461 Hingham 0 10 0 0 0 10 Holbrook 0 26 0 0 0 26 Holland 0 1 0 0 0 1 Holliston 0 37 0 0 0 37 Holyoke 0 1372 1 0 4 1377 Hopedale 3 6 0 0 0 9 Hopkinton 0 36 0 0 2 38 Hudson 0 114 0 0 0 114 Hull 2 1 0 0 0 3 Ipswich 13 4 0 1 0 18 Kingston 3 0 0 0 0 3 Lakeville 0 0 0 0 0 0
40
District Name No ELL
Program Sheltered English
Immersion Two-Way Bilingual
Other Bilingual Education
Parental Opt Out
Total LEP Population
Lanesborough 0 0 0 0 2 2 Lawrence 0 2835 0 0 0 2835 Lee 0 18 0 0 0 18 Leicester 4 16 1 0 0 21 Lenox 0 7 0 0 0 7 Leominster 0 398 0 0 0 398 Leverett 0 0 0 0 0 0 Lexington 0 286 0 0 10 296 Lincoln 0 26 0 0 0 26 Littleton 2 13 0 0 0 15 Longmeadow 1 36 0 0 2 39 Lowell 17 4228 0 3 73 4321 Ludlow 0 42 0 0 0 42 Lunenburg 1 9 0 0 0 10 Lynn 1 3071 0 35 358 3465 Lynnfield 0 4 0 0 0 4 Malden 0 675 12 0 19 706 Mansfield 0 44 0 0 0 44 Marblehead 18 1 0 0 0 19 Marion 0 1 0 0 0 1 Marlborough 68 441 0 0 0 509 Marshfield 4 15 1 0 3 23 Mashpee 3 15 0 0 0 18 Mattapoisett 0 2 0 0 0 2 Maynard 0 33 0 0 0 33 Medfield 0 6 0 0 0 6 Medford 0 299 0 0 0 299 Medway 0 8 0 0 0 8 Melrose 43 32 1 0 0 76 Methuen 0 408 0 0 5 413 Middleborough 0 13 0 0 0 13 Middleton 0 13 0 0 0 13 Milford 0 227 0 0 0 227 Millbury 11 2 0 0 0 13
41
District Name No ELL
Program Sheltered English
Immersion Two-Way Bilingual
Other Bilingual Education
Parental Opt Out
Total LEP Population
Millis 2 0 0 0 0 2 Milton 2 32 0 0 0 34 Monson 0 10 0 0 0 10 Nahant 0 0 0 0 0 0 Nantucket 5 61 0 0 1 67 Natick 1 35 0 0 0 36 Needham 0 50 0 0 0 50 New Bedford 0 461 0 0 0 461 Newburyport 0 12 0 0 0 12 Newton 7 680 0 0 1 688 Norfolk 0 0 0 0 0 0 North Adams 0 28 0 0 0 28 Northampton 0 50 0 0 0 50 North Andover 0 45 0 0 4 49 North Attleborough 0 38 0 0 0 38 Northborough 0 66 0 0 0 66 Northbridge 0 12 0 0 0 12 North Brookfield 0 3 0 0 0 3 North Reading 0 11 0 0 0 11 Norton 0 5 0 0 0 5 Norwell 1 2 0 0 0 3 Norwood 2 169 0 0 4 175 Oak Bluffs 20 0 0 0 0 20 Orange 0 0 0 0 0 0 Orleans 0 2 0 0 0 2 Oxford 0 5 0 0 0 5 Palmer 3 14 0 0 0 17 Peabody 0 356 0 0 0 356 Pelham 0 0 0 0 0 0 Pembroke 0 0 0 0 0 0 Petersham 0 0 0 0 0 0 Pittsfield 0 233 0 0 0 233 Plainville 0 0 0 0 0 0 Plymouth 2 45 0 0 0 47
42
District Name No ELL
Program Sheltered English
Immersion Two-Way Bilingual
Other Bilingual Education
Parental Opt Out
Total LEP Population
Plympton 0 0 0 0 0 0 Provincetown 0 7 0 0 0 7 Quincy 0 1044 0 0 0 1044 Randolph 4 179 1 0 0 184 Reading 0 16 0 0 0 16 Revere 2 623 0 0 0 625 Richmond 0 0 0 0 0 0 Rochester 0 0 0 0 0 0 Rockland 0 28 0 0 0 28 Rockport 0 5 0 0 0 5 Rowe 0 0 0 0 0 0 Salem 6 418 72 0 11 507 Sandwich 0 0 0 0 1 1 Saugus 18 50 0 0 0 68 Savoy 0 0 0 0 0 0 Scituate 0 14 0 0 0 14 Seekonk 0 23 0 0 0 23 Sharon 0 44 0 0 0 44 Sherborn 0 1 0 0 0 1 Shirley 0 5 0 0 0 5 Shrewsbury 0 144 0 0 0 144 Shutesbury 0 0 0 0 0 0 Somerset 1 0 0 1 0 2 Somerville 6 612 124 35 0 777 Southampton 0 3 0 0 0 3 Southborough 0 47 0 0 0 47 Southbridge 6 225 0 0 1 232 South Hadley 14 1 0 0 0 15 Springfield 0 2926 0 0 362 3288 Stoneham 0 58 0 0 0 58 Stoughton 0 129 0 0 37 166 Sturbridge 0 3 0 0 0 3 Sudbury 0 18 0 0 0 18 Sunderland 0 3 0 0 0 3
43
District Name No ELL
Program Sheltered English
Immersion Two-Way Bilingual
Other Bilingual Education
Parental Opt Out
Total LEP Population
Sutton 0 0 0 0 0 0 Swampscott 25 27 0 0 0 52 Swansea 0 10 0 0 0 10 Taunton 0 159 0 0 0 159 Tewksbury 0 12 0 0 0 12 Tisbury 0 28 0 0 0 28 Topsfield 2 0 0 0 0 2 Truro 0 0 0 0 0 0 Tyngsborough 0 0 0 0 0 0 Uxbridge 0 28 1 0 1 30 Wakefield 0 17 0 0 1 18 Wales 0 0 0 0 1 1 Walpole 0 82 0 0 0 82 Waltham 1 383 0 0 91 475 Ware 0 11 0 0 0 11 Wareham 1 14 0 0 2 17 Watertown 1 264 0 0 3 268 Wayland 0 13 0 0 2 15 Webster 1 48 0 0 0 49 Wellesley 1 53 0 0 17 71 Wellfleet 0 0 0 0 0 0 Westborough 2 253 0 0 1 256 West Boylston 0 3 0 0 0 3 West Bridgewater 0 2 0 0 0 2 Westfield 25 185 0 0 1 211 Westford 0 31 0 0 2 33 Westhampton 0 0 0 0 0 0 Weston 0 51 0 0 0 51 Westport 0 15 0 0 0 15 West Springfield 0 276 0 0 0 276 Westwood 6 25 0 0 0 31 Weymouth 0 101 0 0 3 104 Whately 0 0 0 0 0 0 Williamsburg 0 0 0 0 2 2
44
District Name No ELL
Program Sheltered English
Immersion Two-Way Bilingual
Other Bilingual Education
Parental Opt Out
Total LEP Population
Williamstown 0 9 0 0 0 9 Wilmington 0 22 0 0 0 22 Winchendon 0 11 0 0 0 11 Winchester 1 140 0 0 0 141 Winthrop 0 66 0 0 0 66 Woburn 1 195 0 0 0 196 Worcester 206 5922 27 177 56 6388 Wrentham 7 1 0 0 0 8 Northampton-Smith Voc Agr 0 0 0 5 0 5 Excel Academy CS 4 5 0 0 0 9 Four Rivers Charter Public 0 5 0 0 0 5 Berkshire Arts and TechCS 0 0 0 0 0 0 Amesbury Academy CS 0 0 0 0 0 0 Boston Preparatory CS 0 0 0 0 0 0 Christa McAuliffe Reg 0 5 0 0 0 5 Smith Leadership Academy CS 0 0 0 0 2 2 Benjamin Banneker CS 0 1 0 0 0 1 Barnstable Horace Mann CS 0 22 0 0 0 22 Boston Day and Eve CS 4 25 1 1 0 31 Barnstable Com Hrce Mann CS 0 35 0 0 0 35 Edward Brooke Charter 0 3 0 0 0 3 KIPP Academy Lynn Charter 0 3 0 0 1 4 Advanced Math and Science CS 0 0 0 0 0 0 Cape Cod Lighthouse Charter 0 0 0 0 0 0 Innovation Academy Charter 0 1 0 0 0 1 Community CS of Cambridge 0 7 0 0 3 10 City On A Hill Charter Public 0 4 0 0 0 4 Codman Academy CS 1 0 0 0 0 1 Conservatory Lab Charter 0 21 0 0 0 21 Community Day Charter Public 0 98 0 0 0 98 Sabis International Charter 25 0 0 0 0 25 Neighborhood House Charter 0 9 0 0 0 9 Abby Kelley Foster CS 0 27 0 0 1 28 Foxborough Regional CS 0 29 0 0 0 29
45
District Name No ELL
Program Sheltered English
Immersion Two-Way Bilingual
Other Bilingual Education
Parental Opt Out
Total LEP Population
Benjamin Franklin Classical CS 0 0 0 0 0 0 Boston Collegiate Charter 0 0 0 0 0 0 Hilltown Cooperative CS 0 1 0 0 0 1 Robert M Hughes Acad CS 0 0 0 0 0 0 EM Kennedy Acad Health Careers Horace Mann CS 0 2 0 0 0 2 Holyoke Community Charter 0 32 0 0 0 32 Lawrence Family Dev CS 0 0 252 0 0 252 Hill View Montessori CS 0 7 0 0 0 7 Lowell Community CS 0 247 0 0 0 247 Lowell Middlesex Acad CS 0 0 0 0 0 0 Marblehead Community CS 0 0 0 0 0 0 Marthas Vineyard CS 0 4 0 0 0 4 Ma Acad for Math and Science 0 0 0 0 0 0 MATCH Charter Public High 0 0 0 0 0 0 Mystic Valley Regional Charter 0 0 0 0 0 0 New Leadership Charter 0 4 0 0 0 4 North Central Charter Essential 0 3 0 0 0 3 Dorchester Collegiate Acad CS 0 0 0 0 0 0 Silver Hill Horace Mann Charter 0 31 0 0 0 31 Francis W Parker Ch Essential 0 0 0 0 0 0 Pioneer Valley Perf Arts CS 0 1 0 0 0 1 Boston Renaissance CS 0 58 0 0 0 58 River Valley Charter 0 0 0 0 0 0 Rising Tide Charter Public 0 0 0 0 0 0 Roxbury Preparatory Charter 0 6 0 0 0 6 Salem Academy Charter 0 16 0 0 0 16 Seven Hills Charter Public 0 108 0 0 2 110 Prospect Hill Academy Charter 0 29 0 0 0 29 South Shore Charter Public 0 0 0 0 0 0 Sturgis Charter Public 0 0 0 0 0 0 Atlantis Charter 0 0 0 0 0 0 MLK Jr CS of Excellence 0 20 0 0 0 20 Phoenix Charter Academy 0 25 0 0 0 25 Pioneer CS of Science 0 7 0 0 0 7
46
District Name No ELL
Program Sheltered English
Immersion Two-Way Bilingual
Other Bilingual Education
Parental Opt Out
Total LEP Population
29
Global Learning Charter Public 1 0 0 0 0 1 Pioneer Valley Chinese Imm CS 0 0 0 0 1 1 Hampden CS of Science 0 0 0 0 0 0 Acton-Boxborough 0 20 0 0 0 20 Adams-Cheshire 0 3 0 0 0 3 Amherst-Pelham 0 67 0 0 0 67 Ashburnham-Westminster 0 15 0 0 0 15 Athol-Royalston 0 13 0 2 0 15 Berkshire Hills 0 0 0 0 29 Berlin-Boylston 0 1 0 0 0 1 Blackstone-Millville 0 10 0 0 1 11 Bridgewater-Raynham 13 9 0 0 0 22 Chesterfield-Goshen 0 0 0 0 0 0 Central Berkshire 1 0 0 0 0 1 Concord-Carlisle 0 3 0 0 0 3 Dennis-Yarmouth 0 146 0 0 0 146 Dighton-Rehoboth 0 8 0 0 0 8 Dover-Sherborn 0 3 0 0 0 3 Dudley-Charlton Reg 2 47 0 0 1 50 Nauset 3 10 0 0 0 13 Farmington River Reg 0 0 0 0 0 0 Freetown-Lakeville 1 0 0 0 0 1 Frontier 0 9 0 0 0 9 Gateway 0 11 0 0 0 11 Groton-Dunstable 0 11 0 0 0 11 Gill-Montague 43 2 0 0 0 45 Hamilton-Wenham 35 5 0 1 2 43 Hampden-Wilbraham 0 24 0 0 0 24 Hampshire 0 0 0 0 0 0 Hawlemont 0 0 1 0 0 1 King Philip 0 2 0 0 0 2 Lincoln-Sudbury 0 4 0 0 0 4 Manchester Essex Regional 0 3 0 0 0 3 Marthas Vineyard 0 16 0 0 0 16
47
District Name No ELL
Program Sheltered English
Immersion Two-Way Bilingual
Other Bilingual Education
Parental Opt Out
Total LEP Population
Masconomet 2 0 0 0 0 2 Mendon-Upton 0 10 0 0 0 10 Mount Greylock 0 2 0 0 0 2 Mohawk Trail 2 4 1 0 0 7 Narragansett 0 3 0 0 0 3 Nashoba 0 17 0 0 0 17 New Salem-Wendell 0 0 0 0 0 0 Northboro-Southboro 1 6 0 0 0 7 North Middlesex 7 5 0 0 4 16 Old Rochester 1 0 0 0 0 1 Pentucket 0 3 0 0 0 3 Pioneer Valley 0 0 0 0 0 0 Quabbin 1 1 0 0 2 4 Ralph C Mahar 1 7 0 0 0 8 Silver Lake 1 0 0 0 0 1 Southern Berkshire 0 4 0 0 0 4 Southwick-Tolland 0 14 0 0 0 14 Spencer-E Brookfield 0 7 0 0 0 7 Tantasqua 0 0 0 0 0 0 Triton 0 24 0 0 0 24 Up-Island Regional 0 5 0 0 0 5 Wachusett 0 47 0 0 0 47 Quaboag Regional 0 1 0 0 0 1 Whitman-Hanson 0 9 0 0 0 9 Assabet Valley Reg Voc Tech 0 9 0 0 0 9 Blackstone Val Reg Voc Tech 0 0 0 0 0 0 Blue Hills Regional Voc Tech 0 5 0 0 0 5 Bristol-Plym Reg Voc Tech 0 2 0 0 0 2 Cape Cod Regional Voc Tech 0 5 0 0 0 5 Franklin County Reg Voc Tech 0 0 0 0 0 0 Grtr Fall River Reg Voc Tech 2 0 0 0 0 2 Grtr Lawrence Reg Voc Tech 0 31 2 0 1 34 Grtr Nw Bdfrd Reg Voc Tech 0 20 0 0 0 20 Grtr Lowell Reg Voc Tech 0 46 0 0 0 46
48
District Name No ELL
Program Sheltered English
Immersion Two-Way Bilingual
Other Bilingual Education
Parental Opt Out
Total LEP Population
S Middlesex Reg Voc Tech 0 40 0 0 0 40 Minuteman Reg Voc Tech 0 3 0 0 0 3 Montachusett Reg Voc Tech 0 8 0 0 0 8 N Berkshire Reg Voc Tech 0 0 0 0 0 0 Nashoba Valley Reg Voc 0 0 0 0 0 0 NE Metro Reg Voc Tech 0 57 0 0 0 57 North Shore Reg Voc Tech 0 3 0 0 0 3 Old Colony Reg Voc Tech 0 0 0 0 0 0 Pathfinder Reg Voc Tech 0 0 0 0 0 0 Shawsheen Val Reg Voc Tech 0 0 0 0 0 0 Southeastern Reg Voc Tech 0 9 0 0 0 9 South Shore Reg Voc Tech 0 0 0 0 0 0 S Worcester C Reg Voc Tech 1 0 0 3 0 4 Tri County Reg Voc Tech 0 1 0 0 0 1 Uppr Cape Cod Reg Voc Tech 0 0 0 0 0 0 Whittier Reg Voc Tech 0 6 0 0 0 6 Bristol County Agricultural 0 0 0 0 0 0 Essex Agricultural Technical 0 0 0 0 0 0 Norfolk County Agricultural 0 0 0 0 0 0 TOTALS 1113 49096 1229 1342 6378 59158
Source The Department Student Information Management System 2009
49
Attachment 8 English Language Learners in Massachusetts District and First Language October 2009
District Name Spanish Portuguese Cape
Verdean Creole Haitian Vietnamese Other LEP
Abington 3 3 0 0 0 4 10 Acton 8 7 0 0 0 66 81 Acushnet 0 1 0 0 0 0 1 Agawam 15 0 0 0 1 81 97 Amesbury 5 8 0 0 0 8 21 Amherst 60 4 2 0 2 107 175 Andover 12 3 0 0 1 67 83 Arlington 26 17 2 11 1 135 192 Ashland 9 35 0 0 1 22 67 Attleboro 170 9 1 1 2 84 267 Auburn 12 5 0 3 12 24 56 Avon 0 0 0 1 0 0 1 Ayer 36 13 0 0 0 11 60 Barnstable 39 111 0 2 0 24 176 Bedford 9 0 0 0 2 38 49 Belchertown 7 1 0 0 1 15 24 Bellingham 8 3 0 0 3 13 27 Belmont 5 2 0 0 0 85 92 Berlin 0 1 0 0 0 0 1 Beverly 6 8 0 0 1 24 39 Billerica 13 6 0 2 3 57 81 Boston 6434 210 900 947 723 2057 11271 Bourne 1 0 0 0 0 0 1 Boxborough 1 2 0 0 0 3 6 Boxford 1 0 0 0 0 3 4 Boylston 1 0 0 0 1 8 10 Braintree 13 3 4 1 13 77 111 Brewster 6 0 0 0 0 3 9 Brockton 484 131 1465 453 37 167 2737
50
District Name Spanish Portuguese Cape
Verdean Creole Haitian Vietnamese Other LEP
Brookline 43 16 2 2 6 427 496 Burlington 2 3 0 2 0 57 64 Cambridge 58 23 6 67 2 147 303 Canton 4 1 0 3 5 23 36 Carlisle 0 0 0 0 0 11 11 Carver 0 0 0 0 0 2 2 Chatham 10 2 0 3 0 4 19 Chelmsford 9 5 0 0 8 82 104 Chelsea 766 29 2 13 9 103 922 Chicopee 201 4 0 0 1 148 354 Clinton 106 17 0 11 0 10 144 Concord 13 1 0 0 2 20 36 Danvers 4 0 0 1 0 11 16 Dartmouth 2 19 0 0 0 18 39 Dedham 47 3 0 13 9 42 114 Deerfield 4 0 0 0 2 1 7 Douglas 0 2 0 0 0 1 3 Dover 0 0 0 2 0 7 9 Dracut 13 6 0 0 0 24 43 Eastham 1 0 0 0 0 0 1 Easthampton 12 0 0 0 1 27 40 East Longmeadow 0 0 0 0 0 2 2 Easton 4 7 1 3 4 18 37 Edgartown 2 24 0 0 0 0 26 Everett 308 119 1 96 12 44 580 Fairhaven 1 2 0 0 0 0 3 Fall River 297 122 16 2 10 67 514 Falmouth 5 12 0 0 4 23 44 Fitchburg 487 2 0 2 11 91 593 Foxborough 5 3 0 0 1 5 14 Framingham 589 553 0 17 3 109 1271
51
District Name Spanish Portuguese Cape
Verdean Creole Haitian Vietnamese Other LEP
Franklin 13 5 0 1 4 32 55 Gardner 80 1 0 3 2 9 95 Georgetown 0 0 0 0 0 2 2 Gloucester 38 20 0 0 4 13 75 Grafton 3 0 0 0 0 11 14 Granby 3 0 0 0 0 10 13 Greenfield 18 0 0 0 1 35 54 Hadley 8 0 0 0 0 8 16 Hanover 1 0 0 0 1 6 8 Harvard 1 0 0 0 0 1 2 Harwich 12 3 0 8 1 24 48 Haverhill 407 11 0 3 7 33 461 Hingham 0 1 0 0 0 9 10 Holbrook 8 4 0 5 1 8 26 Holland 0 1 0 0 0 0 1 Holliston 7 14 0 0 0 16 37 Holyoke 1361 0 0 0 2 14 1377 Hopedale 2 2 0 0 0 5 9 Hopkinton 7 1 0 0 0 30 38 Hudson 32 67 0 1 1 13 114 Hull 0 1 1 0 0 1 3 Ipswich 5 3 0 0 0 10 18 Kingston 0 2 0 0 0 1 3 Lanesborough 0 0 0 0 0 2 2 Lawrence 2732 3 0 5 32 63 2835 Lee 13 1 0 0 0 4 18 Leicester 7 0 0 0 6 8 21 Lenox 1 0 0 0 0 6 7 Leominster 277 44 0 2 3 72 398 Lexington 21 5 0 4 0 266 296 Lincoln 4 0 0 1 0 21 26
52
District Name Spanish Portuguese Cape
Verdean Creole Haitian Vietnamese Other LEP
Littleton 1 3 1 0 0 10 15 Longmeadow 5 2 0 0 1 31 39 Lowell 1595 324 3 14 131 2254 4321 Ludlow 6 11 0 0 0 25 42 Lunenburg 2 4 0 0 0 4 10 Lynn 2662 30 1 67 62 643 3465 Lynnfield 1 0 0 0 0 3 4 Malden 120 99 0 116 51 320 706 Mansfield 10 6 0 0 0 28 44 Marblehead 3 1 0 0 0 15 19 Marion 0 0 0 0 0 1 1 Marlborough 261 211 0 2 4 31 509 Marshfield 3 11 0 0 0 9 23 Mashpee 0 0 0 0 1 17 18 Mattapoisett 0 0 0 0 0 2 2 Maynard 14 11 0 2 0 6 33 Medfield 0 2 0 0 0 4 6 Medford 28 80 0 96 12 83 299 Medway 3 0 0 1 0 4 8 Melrose 4 5 0 7 2 58 76 Methuen 340 3 0 7 11 52 413 Middleborough 7 0 0 0 1 5 13 Middleton 2 1 0 0 0 10 13 Milford 100 101 0 0 2 24 227 Millbury 2 4 0 0 3 4 13 Millis 0 0 0 0 0 2 2 Milton 3 3 0 15 3 10 34 Monson 0 0 0 0 0 10 10 Nantucket 60 5 0 0 0 2 67 Natick 4 2 0 0 2 28 36 Needham 13 1 2 1 1 32 50
53
District Name Spanish Portuguese Cape
Verdean Creole Haitian Vietnamese Other LEP
New Bedford 289 31 1 2 5 133 461 Newburyport 4 3 0 0 0 5 12 Newton 112 22 0 7 11 536 688 North Adams 19 2 0 0 0 7 28 Northampton 40 0 0 0 0 10 50 North Andover 18 1 0 0 4 26 49 North Attleborough 19 0 0 0 1 18 38 Northborough 16 13 0 0 0 37 66 Northbridge 6 0 0 0 0 6 12 North Brookfield 0 0 0 0 0 3 3 North Reading 2 0 0 0 0 9 11 Norton 0 0 0 0 0 5 5 Norwell 2 0 0 0 0 1 3 Norwood 38 39 0 11 5 82 175 Oak Bluffs 0 19 0 0 0 1 20 Orleans 0 0 0 0 0 2 2 Oxford 3 0 0 0 0 2 5 Palmer 4 2 0 0 0 11 17 Peabody 175 100 0 0 11 70 356 Pittsfield 168 1 0 0 8 56 233 Plymouth 9 26 0 1 2 9 47 Provincetown 7 0 0 0 0 0 7 Quincy 41 31 0 6 126 840 1044 Randolph 17 6 3 71 54 33 184 Reading 1 3 0 0 1 11 16 Revere 392 39 0 8 31 155 625 Rockland 3 22 0 0 2 1 28 Rockport 1 0 0 0 0 4 5 Salem 430 9 0 5 7 56 507 Sandwich 0 0 0 0 0 1 1 Saugus 22 15 0 6 6 19 68
54
District Name Spanish Portuguese Cape
Verdean Creole Haitian Vietnamese Other LEP
Scituate 1 5 6 0 0 2 14 Seekonk 5 1 0 0 2 15 23 Sharon 1 0 0 5 6 32 44 Sherborn 0 0 0 0 0 1 1 Shirley 2 1 0 0 0 2 5 Shrewsbury 15 39 0 0 6 84 144 Somerset 0 0 0 0 0 2 2 Somerville 372 170 5 73 5 152 777 Southampton 1 0 0 0 0 2 3 Southborough 5 4 0 0 0 38 47 Southbridge 219 0 0 0 0 13 232 South Hadley 11 0 0 0 1 3 15 Springfield 2970 2 0 4 87 225 3288 Stoneham 17 11 0 1 3 26 58 Stoughton 21 60 8 17 9 51 166 Sturbridge 1 2 0 0 0 0 3 Sudbury 8 2 0 0 1 7 18 Sunderland 2 0 0 0 0 1 3 Swampscott 8 4 1 2 2 35 52 Swansea 3 2 0 0 0 5 10 Taunton 72 43 5 9 1 29 159 Tewksbury 2 1 0 0 2 7 12 Tisbury 0 26 0 0 0 2 28 Topsfield 0 0 0 0 0 2 2 Uxbridge 11 3 0 0 0 16 30 Wakefield 8 2 0 0 2 6 18 Wales 0 0 0 0 0 1 1 Walpole 18 14 0 13 1 36 82 Waltham 333 27 0 26 3 86 475 Ware 7 0 0 0 0 4 11 Wareham 4 2 0 0 2 9 17
55
District Name Spanish Portuguese Cape
Verdean Creole Haitian Vietnamese Other LEP
Watertown 52 32 0 2 0 182 268 Wayland 1 0 0 0 0 14 15 Webster 32 4 0 0 1 12 49 Wellesley 16 0 0 0 0 55 71 Westborough 43 38 0 1 0 174 256 West Boylston 0 1 0 0 0 2 3 West Bridgewater 0 0 0 2 0 0 2 Westfield 34 0 0 0 0 177 211 Westford 3 0 0 1 2 27 33 Weston 5 0 1 3 1 41 51 Westport 1 9 0 0 4 1 15 West Springfield 29 2 0 0 3 242 276 Westwood 3 0 0 0 0 28 31 Weymouth 12 49 0 1 4 38 104 Williamsburg 0 2 0 0 0 0 2 Williamstown 2 3 0 0 0 4 9 Wilmington 1 3 0 0 4 14 22 Winchendon 4 2 0 0 0 5 11 Winchester 10 10 0 2 2 117 141 Winthrop 18 9 0 1 0 38 66 Woburn 27 44 0 8 8 109 196 Worcester 3636 297 4 44 703 1704 6388 Wrentham 2 3 0 0 0 3 8 Northampton-Smith Voc Agr 5 0 0 0 0 0 5 Excel Academy CS 9 0 0 0 0 0 9 Academy Of the Pacific Rim CS 3 1 0 1 0 0 5 Boston Preparatory CS 3 0 0 2 0 0 5 Christa McAuliffe Regional CS 2 0 0 0 0 0 2 Smith Leadership Academy CS 1 0 0 0 0 0 1 Benjamin Banneker CS 5 0 0 16 0 1 22 Barnstable Horace Mann CS 6 16 0 0 0 9 31
56
District Name Spanish Portuguese Cape
Verdean Creole Haitian Vietnamese Other LEP
Barnstable Com Horace Mann CS 17 17 0 0 0 1 35 Edward Brooke CS 3 0 0 0 0 0 3 KIPP Academy Lynn CS 4 0 0 0 0 0 4 Innovation Academy CS 1 0 0 0 0 0 1 Community CS of Cambridge 3 0 0 5 0 2 10 City On A Hill CS 3 0 0 0 0 1 4 Codman Academy CS 1 0 0 0 0 0 1 Conservatory Lab Charter (District) 14 4 0 0 0 3 21 Community Day CS 96 0 0 2 0 0 98 Sabis International CS 17 0 0 0 4 4 25 Neighborhood House CS 3 0 1 1 3 1 9 Abby Kelley Foster CS 12 5 0 0 0 11 28 Foxborough Reg CS 2 0 0 5 0 22 29 Hilltown Cooperative CS 0 0 0 0 0 1 1 EM Kennedy Acad Health Careers HMCS 1 0 1 0 0 0 2 Holyoke Com CS 32 0 0 0 0 0 32 Lawrence Family Development CS 251 0 0 0 0 1 252 Hill View Montessori CS 6 0 0 0 0 1 7 Lowell Community CS 100 19 0 4 3 121 247 Marthas Vineyard CS 0 3 0 0 0 1 4 New Leadership Charter 3 0 0 0 0 1 4 North Central Charter Essential 2 0 0 0 0 1 3 Silver Hill Horace Mann Charter 25 1 0 1 0 4 31 Pioneer Valley Performing Arts CS 1 0 0 0 0 0 1 Boston Renaissance CS 43 1 2 4 1 7 58 Roxbury Preparatory CS 3 0 3 0 0 0 6 Salem Academy CS 13 0 0 0 0 3 16 Seven Hills CS 89 0 0 0 0 21 110 Prospect Hill Academy CS 9 4 0 11 0 5 29 MLK Jr CS of Excellence 19 0 0 1 0 0 20 Phoenix Charter Academy 23 0 0 1 0 1 25
57
District Name Spanish Portuguese Cape
Verdean Creole Haitian Vietnamese Other LEP
Pioneer Charter School of Science 2 3 0 2 0 0 7 Global Learning Charter Public 1 0 0 0 0 0 1 Pioneer Valley Chinese Imm CS 0 0 0 0 0 1 1 Acton-Boxborough 4 6 0 0 0 10 20 Adams-Cheshire 0 0 0 0 0 3 3 Amherst-Pelham 24 3 3 0 1 36 67 Ashburnham-Westminster 8 0 0 2 0 5 15 Athol-Royalston 8 0 0 0 0 7 15 Berkshire Hills 23 0 0 0 0 6 29 Berlin-Boylston 0 0 0 0 0 1 1 Blackstone-Millville 4 1 0 0 0 6 11 Bridgewater-Raynham 2 2 0 2 1 15 22 Central Berkshire 0 0 0 0 0 1 1 Concord-Carlisle 0 0 0 1 0 2 3 Dennis-Yarmouth 34 62 1 13 3 33 146 Dighton-Rehoboth 5 1 0 0 0 2 8 Dover-Sherborn 0 1 0 0 0 2 3 Dudley-Charlton Reg 14 4 0 0 0 32 50 Nauset 5 1 0 0 0 7 13 Freetown-Lakeville 0 1 0 0 0 0 1 Frontier 3 1 0 0 1 4 9 Gateway 1 0 0 0 0 10 11 Groton-Dunstable 6 1 0 0 0 4 11 Gill-Montague 24 0 0 1 0 20 45 Hamilton-Wenham 0 1 0 0 0 42 43 Hampden-Wilbraham 1 0 0 0 2 21 24 Hawlemont 0 1 0 0 0 0 1 King Philip 1 0 0 0 0 1 2 Lincoln-Sudbury 0 0 0 0 0 4 4 Manchester Essex Regional 0 0 0 0 0 3 3 Marthas Vineyard 0 16 0 0 0 0 16
58
District Name Spanish Portuguese Cape
Verdean Creole Haitian Vietnamese Other LEP
0 Masconomet 0 0 0 0 2 2 Mendon-Upton 1 1 0 0 0 8 10 Mount Greylock 0 0 0 0 0 2 2 Mohawk Trail 0 0 0 0 2 5 7 Narragansett 0 0 0 0 0 3 3 Nashoba 7 4 0 1 0 5 17 Northboro-Southboro 1 1 0 1 0 4 7 North Middlesex 11 1 0 0 0 4 16 Old Rochester 0 0 0 0 0 1 1 Pentucket 1 0 0 0 0 2 3 Quabbin 0 0 0 0 0 4 4 Ralph C Mahar 1 0 0 0 0 7 8 Silver Lake 0 0 0 0 0 1 1 Southern Berkshire 4 0 0 0 0 0 4 Southwick-Tolland 0 0 0 0 0 14 14 Spencer-E Brookfield 5 0 0 0 0 2 7 Triton 4 2 0 0 10 8 24 Up-Island Regional 2 1 0 0 0 2 5 Wachusett 3 3 0 0 7 34 47 Quaboag Regional 0 0 0 0 0 1 1 Whitman-Hanson 5 1 0 0 0 3 9 Assabet Valley Reg Voc Tech 8 1 0 0 0 0 9 Blue Hills Regional Vocational Technical 1 2 0 2 0 0 5 Bristol-Plymouth Reg Voc Tech 0 2 0 0 0 0 2 Cape Cod Reg Voc Tech 2 2 0 0 0 1 5 Greater Fall River Reg Voc Tech 1 1 0 0 0 0 2 Greater Lawrence Reg Voc Tech 33 0 0 0 0 1 34 GrNew Bedford Reg Voc Tech 14 6 0 0 0 0 20 Greater Lowell Reg Voc Tech 20 8 0 0 0 18 46 South Middlesex Reg Voc Tech 23 14 0 0 0 3 40 Minuteman Reg Voc Tech 2 0 0 0 0 1 3
59
60
District Name Spanish Portuguese Cape
Verdean Creole Haitian Vietnamese Other LEP
Montachusett Reg Voc Tech 4 0 0 0 0 4 8 Northeast Metro Reg Voc Tech 55 0 0 0 0 2 57 North Shore Reg Voc Tech 3 0 0 0 0 0 3 Southeastern Reg Voc Tech 0 2 3 3 0 1 9 Southern Worcester County Reg Voc Tech 3 0 0 0 0 1 4 Tri County Reg Voc Tech 0 1 0 0 0 0 1 Whittier Reg Voc Tech 6 0 0 0 0 0 6 TOTALS 31793 4209 2458 2433 2423 15842 59158
Source The Department Student Information Management System 2009
- Introduction
-
- Background
-
- I English Language Learners in Massachusetts
- II Educators Implementing Sheltered English Immersion Elementary and Secondary Content Teachers of English Language Learners
-
- Research on Professional Development for Educators of English Language Learners
- Gaps in Knowledge
-
- III Use of Funds for Category Training
-
- Future Need for Category Training
-
- IV Educators Implementing Sheltered English Immersion English as a Second Language (ESL) Teachers
-
- ESL Teacher Shortage
-
- V Use of Funds ESL Teachers and ESL Curriculum Development
-
- Massachusetts English Language Teacher Initiative (MELT)
- Improvement of Sheltered English Immersion Content-based ESL Instruction
- Future Need for ESL teachers
-
- VI Budget
- Attachments
-
- Attachment 1 All Massachusetts public school districts and changes in LEP population compared to changes in overall student population - SY 2006-SY 2010
- Attachment 1 Massachusetts public school districts and changes in LEP population compared to changes in overall student population - SY 2006-SY 2010
- Attachment 2 Massachusetts public school districts with large changes in LEP population compared to changes in overall student population - SY 2006-SY 2010
- Attachment 3 Bibliography Professional Development for Teachers of English Language Learners
- Attachment 4 Excerpts from the Commissionerrsquos Memorandum of June 2004 Guidance on Qualifications for Teachers of Limited English Proficient Students in Sheltered English Immersion Classrooms
- Attachment 5 Districts Receiving Sheltered English Immersion Professional Development 2004-2010
- Attachment 6 Collaboratives that have received grants for Sheltered English Immersion Professional Development 2004-2010
- Attachment 7 English Language Learners in Massachusetts District and Program Type October 2009
- Attachment 8 English Language Learners in Massachusetts District and First Language October 2009
-
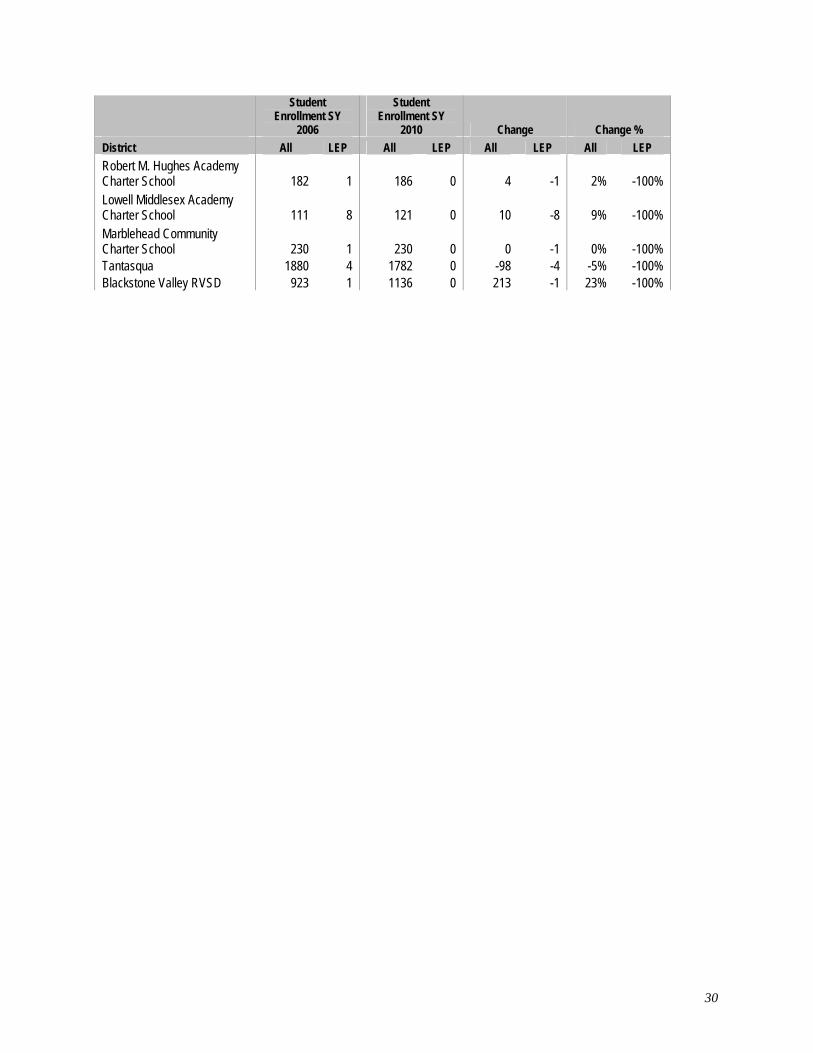
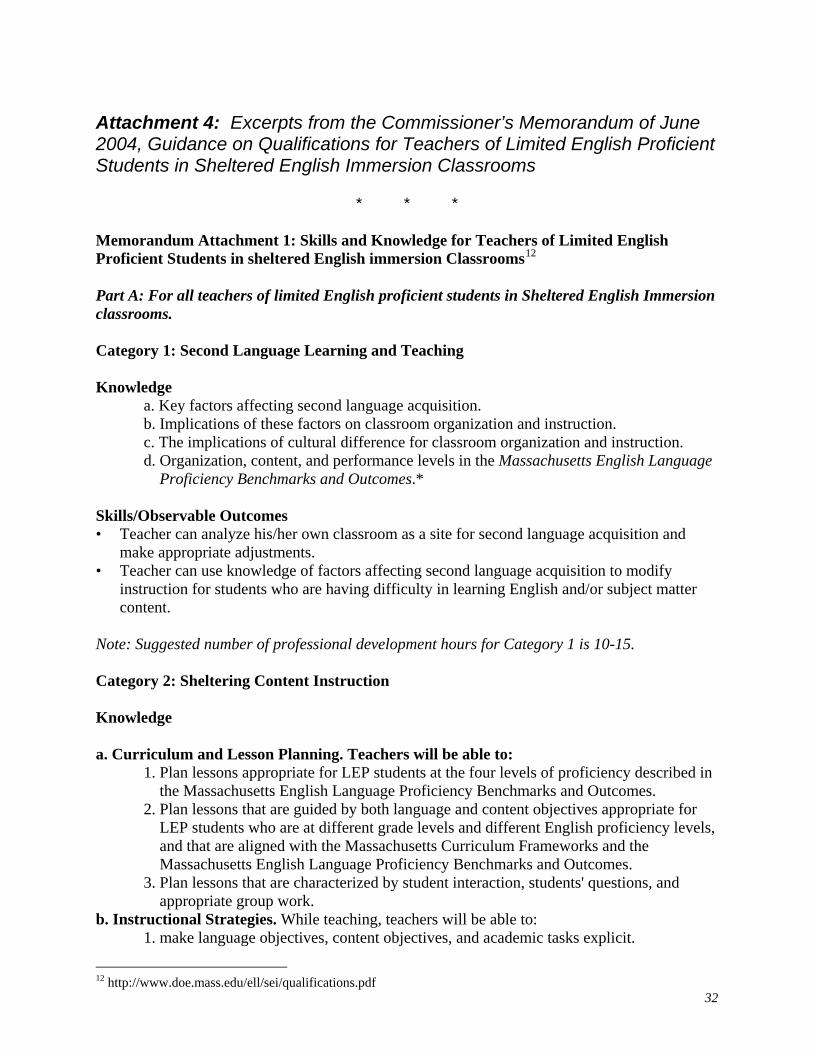
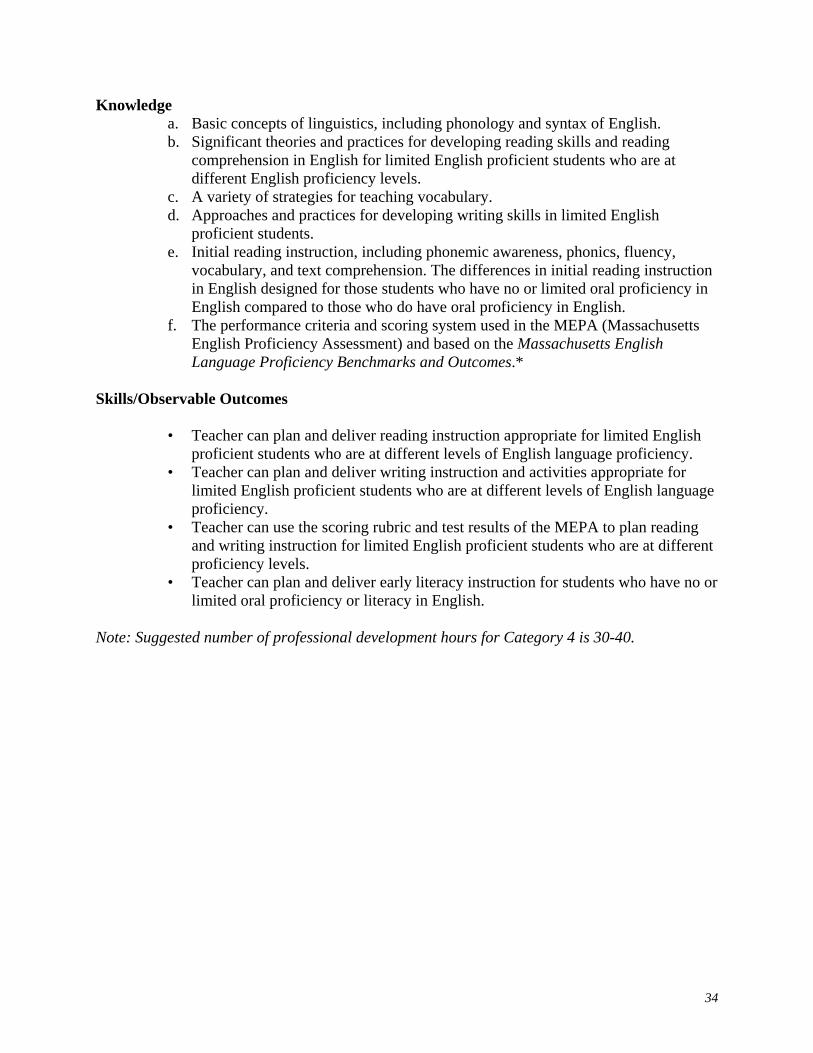
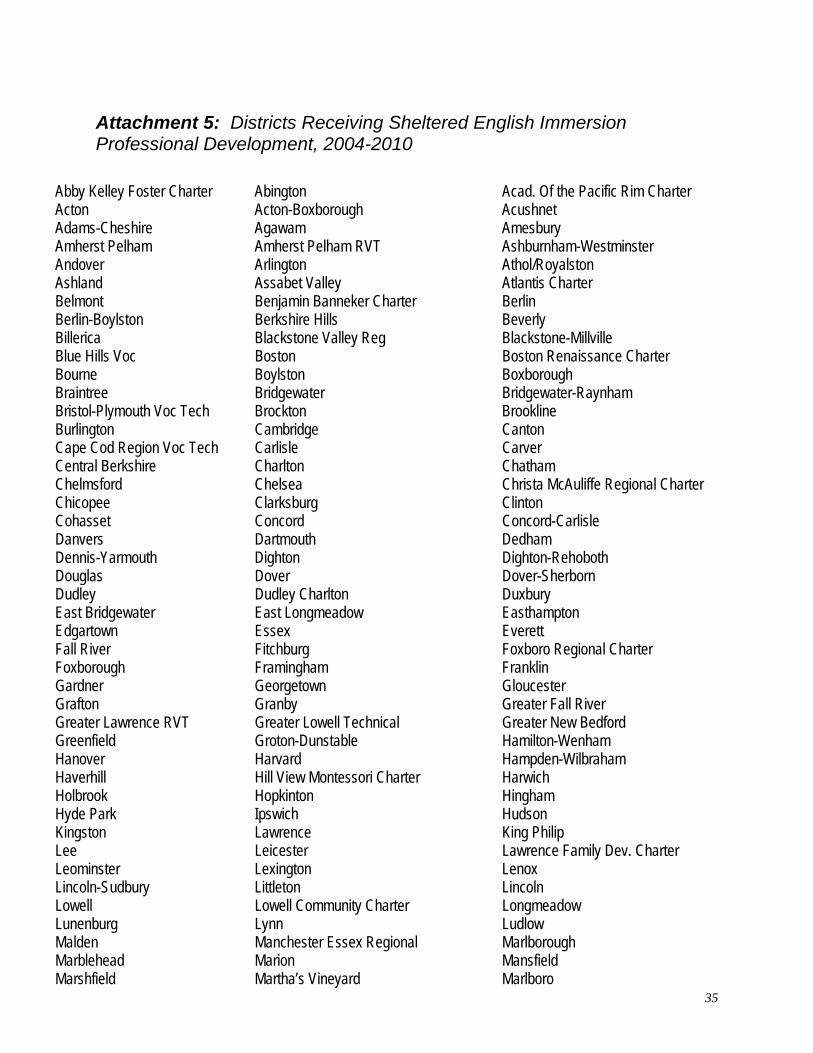
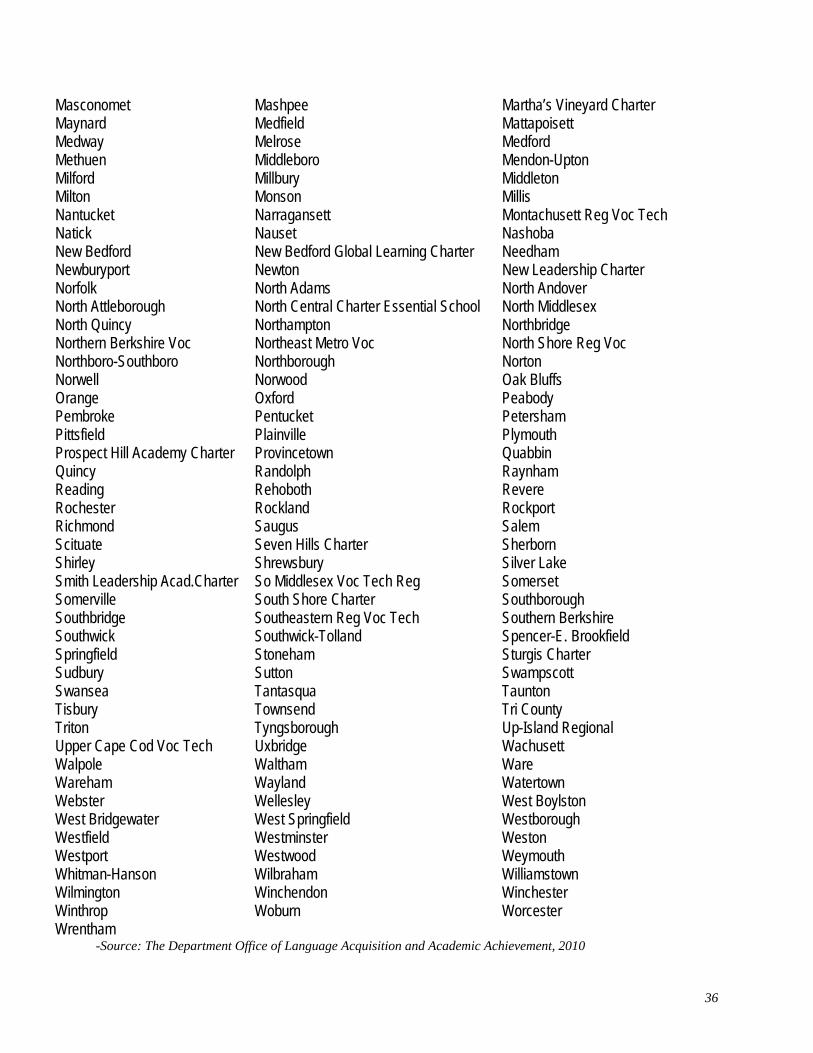
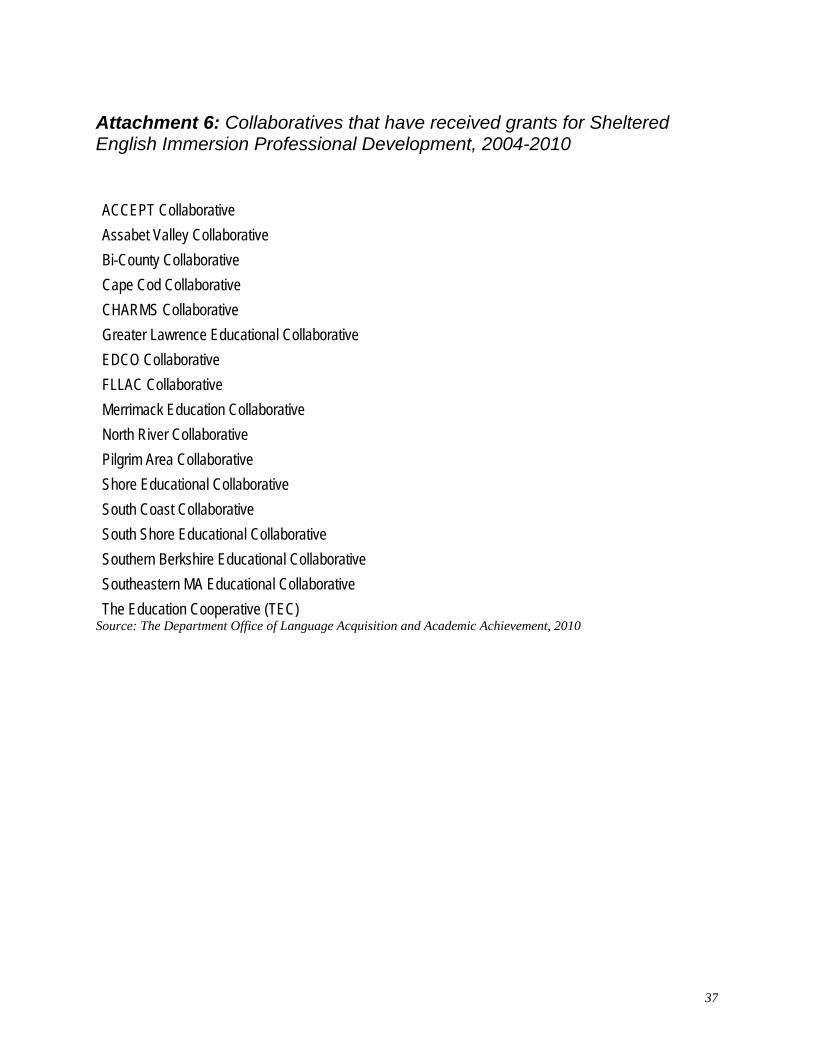
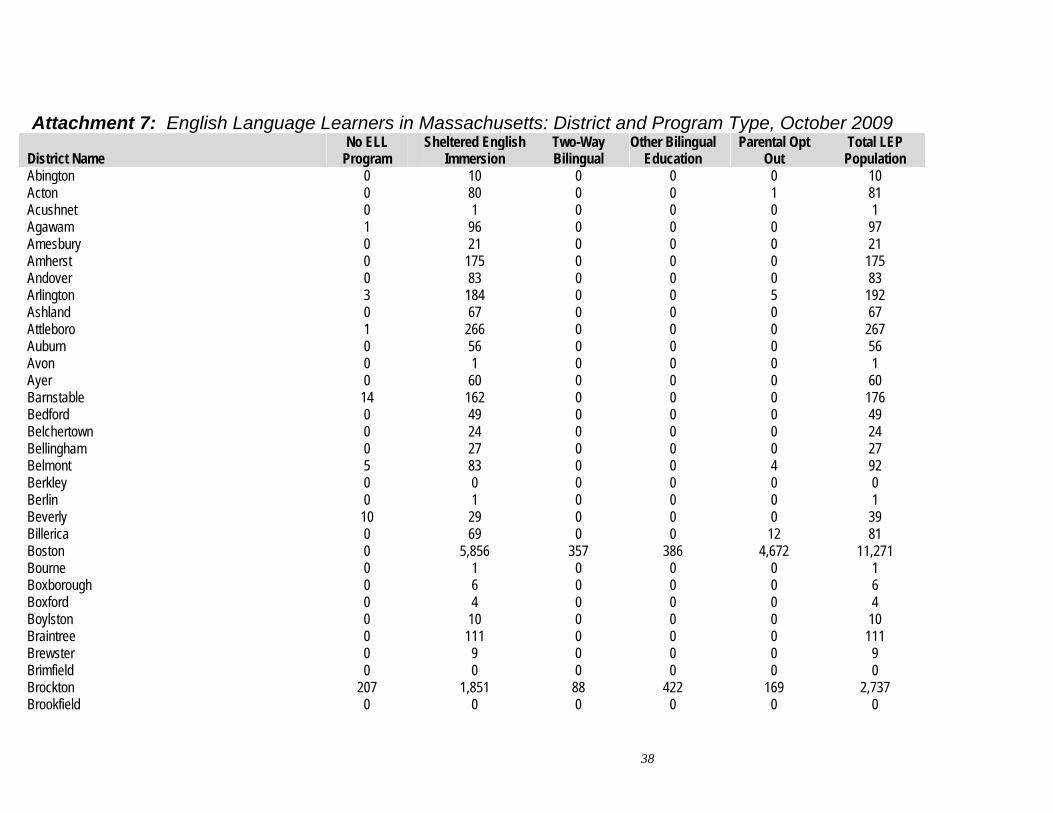
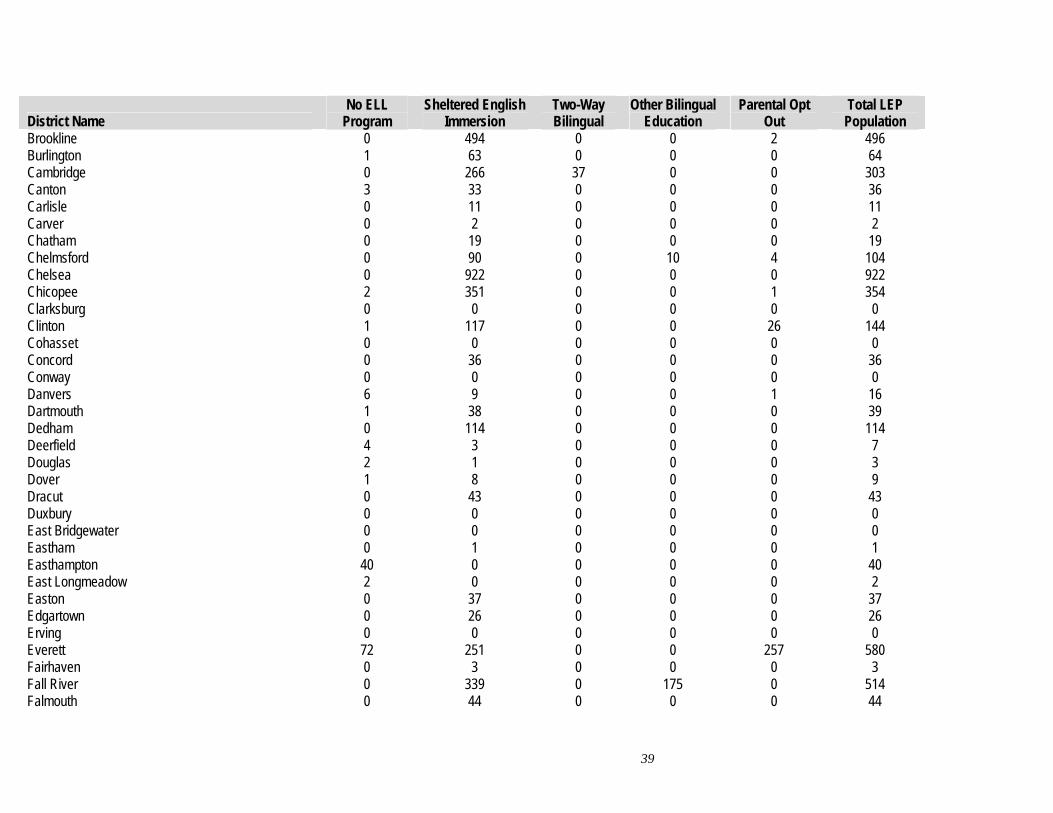
District Name No ELL
Program Sheltered English
Immersion Two-Way Bilingual
Other Bilingual Education
Parental Opt Total LEP Out Population
Brookline 0 494 0 0 2 496 Burlington 1 63 0 0 0 64 Cambridge 0 266 37 0 0 303 Canton 3 33 0 0 0 36 Carlisle 0 11 0 0 0 11 Carver 0 2 0 0 0 2 Chatham 0 19 0 0 0 19 Chelmsford 0 90 0 10 4 104 Chelsea 0 922 0 0 0 922 Chicopee 2 351 0 0 1 354 Clarksburg 0 0 0 0 0 0 Clinton 1 117 0 0 26 144 Cohasset 0 0 0 0 0 0 Concord 0 36 0 0 0 36 Conway 0 0 0 0 0 0 Danvers 6 9 0 0 1 16 Dartmouth 1 38 0 0 0 39 Dedham 0 114 0 0 0 114 Deerfield 4 3 0 0 0 7 Douglas 2 1 0 0 0 3 Dover 1 8 0 0 0 9 Dracut 0 43 0 0 0 43 Duxbury 0 0 0 0 0 0 East Bridgewater 0 0 0 0 0 0 Eastham 0 1 0 0 0 1 Easthampton 40 0 0 0 0 40 East Longmeadow 2 0 0 0 0 2 Easton 0 37 0 0 0 37 Edgartown 0 26 0 0 0 26 Erving 0 0 0 0 0 0 Everett 72 251 0 0 257 580 Fairhaven 0 3 0 0 0 3 Fall River 0 339 0 175 0 514 Falmouth 0 44 0 0 0 44
39
District Name No ELL
Program Sheltered English
Immersion Two-Way Bilingual
Other Bilingual Education
Parental Opt Total LEP Out Population
Fitchburg 2 591 0 0 0 593 Florida 0 0 0 0 0 0 Foxborough 0 14 0 0 0 14 Framingham 0 822 248 85 116 1271 Franklin 0 54 0 0 1 55 Freetown 0 0 0 0 0 0 Gardner 0 95 0 0 0 95 Georgetown 0 2 0 0 0 2 Gloucester 2 73 0 0 0 75 Gosnold 0 0 0 0 0 0 Grafton 0 14 0 0 0 14 Granby 0 13 0 0 0 13 Granville 0 0 0 0 0 0 Greenfield 0 54 0 0 0 54 Hadley 2 14 0 0 0 16 Halifax 0 0 0 0 0 0 Hancock 0 0 0 0 0 0 Hanover 0 7 0 0 1 8 Harvard 1 0 1 0 0 2 Harwich 0 48 0 0 0 48 Hatfield 0 0 0 0 0 0 Haverhill 2 457 0 0 2 461 Hingham 0 10 0 0 0 10 Holbrook 0 26 0 0 0 26 Holland 0 1 0 0 0 1 Holliston 0 37 0 0 0 37 Holyoke 0 1372 1 0 4 1377 Hopedale 3 6 0 0 0 9 Hopkinton 0 36 0 0 2 38 Hudson 0 114 0 0 0 114 Hull 2 1 0 0 0 3 Ipswich 13 4 0 1 0 18 Kingston 3 0 0 0 0 3 Lakeville 0 0 0 0 0 0
40
District Name No ELL
Program Sheltered English
Immersion Two-Way Bilingual
Other Bilingual Education
Parental Opt Out
Total LEP Population
Lanesborough 0 0 0 0 2 2 Lawrence 0 2835 0 0 0 2835 Lee 0 18 0 0 0 18 Leicester 4 16 1 0 0 21 Lenox 0 7 0 0 0 7 Leominster 0 398 0 0 0 398 Leverett 0 0 0 0 0 0 Lexington 0 286 0 0 10 296 Lincoln 0 26 0 0 0 26 Littleton 2 13 0 0 0 15 Longmeadow 1 36 0 0 2 39 Lowell 17 4228 0 3 73 4321 Ludlow 0 42 0 0 0 42 Lunenburg 1 9 0 0 0 10 Lynn 1 3071 0 35 358 3465 Lynnfield 0 4 0 0 0 4 Malden 0 675 12 0 19 706 Mansfield 0 44 0 0 0 44 Marblehead 18 1 0 0 0 19 Marion 0 1 0 0 0 1 Marlborough 68 441 0 0 0 509 Marshfield 4 15 1 0 3 23 Mashpee 3 15 0 0 0 18 Mattapoisett 0 2 0 0 0 2 Maynard 0 33 0 0 0 33 Medfield 0 6 0 0 0 6 Medford 0 299 0 0 0 299 Medway 0 8 0 0 0 8 Melrose 43 32 1 0 0 76 Methuen 0 408 0 0 5 413 Middleborough 0 13 0 0 0 13 Middleton 0 13 0 0 0 13 Milford 0 227 0 0 0 227 Millbury 11 2 0 0 0 13
41
District Name No ELL
Program Sheltered English
Immersion Two-Way Bilingual
Other Bilingual Education
Parental Opt Out
Total LEP Population
Millis 2 0 0 0 0 2 Milton 2 32 0 0 0 34 Monson 0 10 0 0 0 10 Nahant 0 0 0 0 0 0 Nantucket 5 61 0 0 1 67 Natick 1 35 0 0 0 36 Needham 0 50 0 0 0 50 New Bedford 0 461 0 0 0 461 Newburyport 0 12 0 0 0 12 Newton 7 680 0 0 1 688 Norfolk 0 0 0 0 0 0 North Adams 0 28 0 0 0 28 Northampton 0 50 0 0 0 50 North Andover 0 45 0 0 4 49 North Attleborough 0 38 0 0 0 38 Northborough 0 66 0 0 0 66 Northbridge 0 12 0 0 0 12 North Brookfield 0 3 0 0 0 3 North Reading 0 11 0 0 0 11 Norton 0 5 0 0 0 5 Norwell 1 2 0 0 0 3 Norwood 2 169 0 0 4 175 Oak Bluffs 20 0 0 0 0 20 Orange 0 0 0 0 0 0 Orleans 0 2 0 0 0 2 Oxford 0 5 0 0 0 5 Palmer 3 14 0 0 0 17 Peabody 0 356 0 0 0 356 Pelham 0 0 0 0 0 0 Pembroke 0 0 0 0 0 0 Petersham 0 0 0 0 0 0 Pittsfield 0 233 0 0 0 233 Plainville 0 0 0 0 0 0 Plymouth 2 45 0 0 0 47
42
District Name No ELL
Program Sheltered English
Immersion Two-Way Bilingual
Other Bilingual Education
Parental Opt Out
Total LEP Population
Plympton 0 0 0 0 0 0 Provincetown 0 7 0 0 0 7 Quincy 0 1044 0 0 0 1044 Randolph 4 179 1 0 0 184 Reading 0 16 0 0 0 16 Revere 2 623 0 0 0 625 Richmond 0 0 0 0 0 0 Rochester 0 0 0 0 0 0 Rockland 0 28 0 0 0 28 Rockport 0 5 0 0 0 5 Rowe 0 0 0 0 0 0 Salem 6 418 72 0 11 507 Sandwich 0 0 0 0 1 1 Saugus 18 50 0 0 0 68 Savoy 0 0 0 0 0 0 Scituate 0 14 0 0 0 14 Seekonk 0 23 0 0 0 23 Sharon 0 44 0 0 0 44 Sherborn 0 1 0 0 0 1 Shirley 0 5 0 0 0 5 Shrewsbury 0 144 0 0 0 144 Shutesbury 0 0 0 0 0 0 Somerset 1 0 0 1 0 2 Somerville 6 612 124 35 0 777 Southampton 0 3 0 0 0 3 Southborough 0 47 0 0 0 47 Southbridge 6 225 0 0 1 232 South Hadley 14 1 0 0 0 15 Springfield 0 2926 0 0 362 3288 Stoneham 0 58 0 0 0 58 Stoughton 0 129 0 0 37 166 Sturbridge 0 3 0 0 0 3 Sudbury 0 18 0 0 0 18 Sunderland 0 3 0 0 0 3
43
District Name No ELL
Program Sheltered English
Immersion Two-Way Bilingual
Other Bilingual Education
Parental Opt Out
Total LEP Population
Sutton 0 0 0 0 0 0 Swampscott 25 27 0 0 0 52 Swansea 0 10 0 0 0 10 Taunton 0 159 0 0 0 159 Tewksbury 0 12 0 0 0 12 Tisbury 0 28 0 0 0 28 Topsfield 2 0 0 0 0 2 Truro 0 0 0 0 0 0 Tyngsborough 0 0 0 0 0 0 Uxbridge 0 28 1 0 1 30 Wakefield 0 17 0 0 1 18 Wales 0 0 0 0 1 1 Walpole 0 82 0 0 0 82 Waltham 1 383 0 0 91 475 Ware 0 11 0 0 0 11 Wareham 1 14 0 0 2 17 Watertown 1 264 0 0 3 268 Wayland 0 13 0 0 2 15 Webster 1 48 0 0 0 49 Wellesley 1 53 0 0 17 71 Wellfleet 0 0 0 0 0 0 Westborough 2 253 0 0 1 256 West Boylston 0 3 0 0 0 3 West Bridgewater 0 2 0 0 0 2 Westfield 25 185 0 0 1 211 Westford 0 31 0 0 2 33 Westhampton 0 0 0 0 0 0 Weston 0 51 0 0 0 51 Westport 0 15 0 0 0 15 West Springfield 0 276 0 0 0 276 Westwood 6 25 0 0 0 31 Weymouth 0 101 0 0 3 104 Whately 0 0 0 0 0 0 Williamsburg 0 0 0 0 2 2
44
District Name No ELL
Program Sheltered English
Immersion Two-Way Bilingual
Other Bilingual Education
Parental Opt Out
Total LEP Population
Williamstown 0 9 0 0 0 9 Wilmington 0 22 0 0 0 22 Winchendon 0 11 0 0 0 11 Winchester 1 140 0 0 0 141 Winthrop 0 66 0 0 0 66 Woburn 1 195 0 0 0 196 Worcester 206 5922 27 177 56 6388 Wrentham 7 1 0 0 0 8 Northampton-Smith Voc Agr 0 0 0 5 0 5 Excel Academy CS 4 5 0 0 0 9 Four Rivers Charter Public 0 5 0 0 0 5 Berkshire Arts and TechCS 0 0 0 0 0 0 Amesbury Academy CS 0 0 0 0 0 0 Boston Preparatory CS 0 0 0 0 0 0 Christa McAuliffe Reg 0 5 0 0 0 5 Smith Leadership Academy CS 0 0 0 0 2 2 Benjamin Banneker CS 0 1 0 0 0 1 Barnstable Horace Mann CS 0 22 0 0 0 22 Boston Day and Eve CS 4 25 1 1 0 31 Barnstable Com Hrce Mann CS 0 35 0 0 0 35 Edward Brooke Charter 0 3 0 0 0 3 KIPP Academy Lynn Charter 0 3 0 0 1 4 Advanced Math and Science CS 0 0 0 0 0 0 Cape Cod Lighthouse Charter 0 0 0 0 0 0 Innovation Academy Charter 0 1 0 0 0 1 Community CS of Cambridge 0 7 0 0 3 10 City On A Hill Charter Public 0 4 0 0 0 4 Codman Academy CS 1 0 0 0 0 1 Conservatory Lab Charter 0 21 0 0 0 21 Community Day Charter Public 0 98 0 0 0 98 Sabis International Charter 25 0 0 0 0 25 Neighborhood House Charter 0 9 0 0 0 9 Abby Kelley Foster CS 0 27 0 0 1 28 Foxborough Regional CS 0 29 0 0 0 29
45
District Name No ELL
Program Sheltered English
Immersion Two-Way Bilingual
Other Bilingual Education
Parental Opt Out
Total LEP Population
Benjamin Franklin Classical CS 0 0 0 0 0 0 Boston Collegiate Charter 0 0 0 0 0 0 Hilltown Cooperative CS 0 1 0 0 0 1 Robert M Hughes Acad CS 0 0 0 0 0 0 EM Kennedy Acad Health Careers Horace Mann CS 0 2 0 0 0 2 Holyoke Community Charter 0 32 0 0 0 32 Lawrence Family Dev CS 0 0 252 0 0 252 Hill View Montessori CS 0 7 0 0 0 7 Lowell Community CS 0 247 0 0 0 247 Lowell Middlesex Acad CS 0 0 0 0 0 0 Marblehead Community CS 0 0 0 0 0 0 Marthas Vineyard CS 0 4 0 0 0 4 Ma Acad for Math and Science 0 0 0 0 0 0 MATCH Charter Public High 0 0 0 0 0 0 Mystic Valley Regional Charter 0 0 0 0 0 0 New Leadership Charter 0 4 0 0 0 4 North Central Charter Essential 0 3 0 0 0 3 Dorchester Collegiate Acad CS 0 0 0 0 0 0 Silver Hill Horace Mann Charter 0 31 0 0 0 31 Francis W Parker Ch Essential 0 0 0 0 0 0 Pioneer Valley Perf Arts CS 0 1 0 0 0 1 Boston Renaissance CS 0 58 0 0 0 58 River Valley Charter 0 0 0 0 0 0 Rising Tide Charter Public 0 0 0 0 0 0 Roxbury Preparatory Charter 0 6 0 0 0 6 Salem Academy Charter 0 16 0 0 0 16 Seven Hills Charter Public 0 108 0 0 2 110 Prospect Hill Academy Charter 0 29 0 0 0 29 South Shore Charter Public 0 0 0 0 0 0 Sturgis Charter Public 0 0 0 0 0 0 Atlantis Charter 0 0 0 0 0 0 MLK Jr CS of Excellence 0 20 0 0 0 20 Phoenix Charter Academy 0 25 0 0 0 25 Pioneer CS of Science 0 7 0 0 0 7
46
District Name No ELL
Program Sheltered English
Immersion Two-Way Bilingual
Other Bilingual Education
Parental Opt Out
Total LEP Population
29
Global Learning Charter Public 1 0 0 0 0 1 Pioneer Valley Chinese Imm CS 0 0 0 0 1 1 Hampden CS of Science 0 0 0 0 0 0 Acton-Boxborough 0 20 0 0 0 20 Adams-Cheshire 0 3 0 0 0 3 Amherst-Pelham 0 67 0 0 0 67 Ashburnham-Westminster 0 15 0 0 0 15 Athol-Royalston 0 13 0 2 0 15 Berkshire Hills 0 0 0 0 29 Berlin-Boylston 0 1 0 0 0 1 Blackstone-Millville 0 10 0 0 1 11 Bridgewater-Raynham 13 9 0 0 0 22 Chesterfield-Goshen 0 0 0 0 0 0 Central Berkshire 1 0 0 0 0 1 Concord-Carlisle 0 3 0 0 0 3 Dennis-Yarmouth 0 146 0 0 0 146 Dighton-Rehoboth 0 8 0 0 0 8 Dover-Sherborn 0 3 0 0 0 3 Dudley-Charlton Reg 2 47 0 0 1 50 Nauset 3 10 0 0 0 13 Farmington River Reg 0 0 0 0 0 0 Freetown-Lakeville 1 0 0 0 0 1 Frontier 0 9 0 0 0 9 Gateway 0 11 0 0 0 11 Groton-Dunstable 0 11 0 0 0 11 Gill-Montague 43 2 0 0 0 45 Hamilton-Wenham 35 5 0 1 2 43 Hampden-Wilbraham 0 24 0 0 0 24 Hampshire 0 0 0 0 0 0 Hawlemont 0 0 1 0 0 1 King Philip 0 2 0 0 0 2 Lincoln-Sudbury 0 4 0 0 0 4 Manchester Essex Regional 0 3 0 0 0 3 Marthas Vineyard 0 16 0 0 0 16
47
District Name No ELL
Program Sheltered English
Immersion Two-Way Bilingual
Other Bilingual Education
Parental Opt Out
Total LEP Population
Masconomet 2 0 0 0 0 2 Mendon-Upton 0 10 0 0 0 10 Mount Greylock 0 2 0 0 0 2 Mohawk Trail 2 4 1 0 0 7 Narragansett 0 3 0 0 0 3 Nashoba 0 17 0 0 0 17 New Salem-Wendell 0 0 0 0 0 0 Northboro-Southboro 1 6 0 0 0 7 North Middlesex 7 5 0 0 4 16 Old Rochester 1 0 0 0 0 1 Pentucket 0 3 0 0 0 3 Pioneer Valley 0 0 0 0 0 0 Quabbin 1 1 0 0 2 4 Ralph C Mahar 1 7 0 0 0 8 Silver Lake 1 0 0 0 0 1 Southern Berkshire 0 4 0 0 0 4 Southwick-Tolland 0 14 0 0 0 14 Spencer-E Brookfield 0 7 0 0 0 7 Tantasqua 0 0 0 0 0 0 Triton 0 24 0 0 0 24 Up-Island Regional 0 5 0 0 0 5 Wachusett 0 47 0 0 0 47 Quaboag Regional 0 1 0 0 0 1 Whitman-Hanson 0 9 0 0 0 9 Assabet Valley Reg Voc Tech 0 9 0 0 0 9 Blackstone Val Reg Voc Tech 0 0 0 0 0 0 Blue Hills Regional Voc Tech 0 5 0 0 0 5 Bristol-Plym Reg Voc Tech 0 2 0 0 0 2 Cape Cod Regional Voc Tech 0 5 0 0 0 5 Franklin County Reg Voc Tech 0 0 0 0 0 0 Grtr Fall River Reg Voc Tech 2 0 0 0 0 2 Grtr Lawrence Reg Voc Tech 0 31 2 0 1 34 Grtr Nw Bdfrd Reg Voc Tech 0 20 0 0 0 20 Grtr Lowell Reg Voc Tech 0 46 0 0 0 46
48
District Name No ELL
Program Sheltered English
Immersion Two-Way Bilingual
Other Bilingual Education
Parental Opt Out
Total LEP Population
S Middlesex Reg Voc Tech 0 40 0 0 0 40 Minuteman Reg Voc Tech 0 3 0 0 0 3 Montachusett Reg Voc Tech 0 8 0 0 0 8 N Berkshire Reg Voc Tech 0 0 0 0 0 0 Nashoba Valley Reg Voc 0 0 0 0 0 0 NE Metro Reg Voc Tech 0 57 0 0 0 57 North Shore Reg Voc Tech 0 3 0 0 0 3 Old Colony Reg Voc Tech 0 0 0 0 0 0 Pathfinder Reg Voc Tech 0 0 0 0 0 0 Shawsheen Val Reg Voc Tech 0 0 0 0 0 0 Southeastern Reg Voc Tech 0 9 0 0 0 9 South Shore Reg Voc Tech 0 0 0 0 0 0 S Worcester C Reg Voc Tech 1 0 0 3 0 4 Tri County Reg Voc Tech 0 1 0 0 0 1 Uppr Cape Cod Reg Voc Tech 0 0 0 0 0 0 Whittier Reg Voc Tech 0 6 0 0 0 6 Bristol County Agricultural 0 0 0 0 0 0 Essex Agricultural Technical 0 0 0 0 0 0 Norfolk County Agricultural 0 0 0 0 0 0 TOTALS 1113 49096 1229 1342 6378 59158
Source The Department Student Information Management System 2009
49
Attachment 8 English Language Learners in Massachusetts District and First Language October 2009
District Name Spanish Portuguese Cape
Verdean Creole Haitian Vietnamese Other LEP
Abington 3 3 0 0 0 4 10 Acton 8 7 0 0 0 66 81 Acushnet 0 1 0 0 0 0 1 Agawam 15 0 0 0 1 81 97 Amesbury 5 8 0 0 0 8 21 Amherst 60 4 2 0 2 107 175 Andover 12 3 0 0 1 67 83 Arlington 26 17 2 11 1 135 192 Ashland 9 35 0 0 1 22 67 Attleboro 170 9 1 1 2 84 267 Auburn 12 5 0 3 12 24 56 Avon 0 0 0 1 0 0 1 Ayer 36 13 0 0 0 11 60 Barnstable 39 111 0 2 0 24 176 Bedford 9 0 0 0 2 38 49 Belchertown 7 1 0 0 1 15 24 Bellingham 8 3 0 0 3 13 27 Belmont 5 2 0 0 0 85 92 Berlin 0 1 0 0 0 0 1 Beverly 6 8 0 0 1 24 39 Billerica 13 6 0 2 3 57 81 Boston 6434 210 900 947 723 2057 11271 Bourne 1 0 0 0 0 0 1 Boxborough 1 2 0 0 0 3 6 Boxford 1 0 0 0 0 3 4 Boylston 1 0 0 0 1 8 10 Braintree 13 3 4 1 13 77 111 Brewster 6 0 0 0 0 3 9 Brockton 484 131 1465 453 37 167 2737
50
District Name Spanish Portuguese Cape
Verdean Creole Haitian Vietnamese Other LEP
Brookline 43 16 2 2 6 427 496 Burlington 2 3 0 2 0 57 64 Cambridge 58 23 6 67 2 147 303 Canton 4 1 0 3 5 23 36 Carlisle 0 0 0 0 0 11 11 Carver 0 0 0 0 0 2 2 Chatham 10 2 0 3 0 4 19 Chelmsford 9 5 0 0 8 82 104 Chelsea 766 29 2 13 9 103 922 Chicopee 201 4 0 0 1 148 354 Clinton 106 17 0 11 0 10 144 Concord 13 1 0 0 2 20 36 Danvers 4 0 0 1 0 11 16 Dartmouth 2 19 0 0 0 18 39 Dedham 47 3 0 13 9 42 114 Deerfield 4 0 0 0 2 1 7 Douglas 0 2 0 0 0 1 3 Dover 0 0 0 2 0 7 9 Dracut 13 6 0 0 0 24 43 Eastham 1 0 0 0 0 0 1 Easthampton 12 0 0 0 1 27 40 East Longmeadow 0 0 0 0 0 2 2 Easton 4 7 1 3 4 18 37 Edgartown 2 24 0 0 0 0 26 Everett 308 119 1 96 12 44 580 Fairhaven 1 2 0 0 0 0 3 Fall River 297 122 16 2 10 67 514 Falmouth 5 12 0 0 4 23 44 Fitchburg 487 2 0 2 11 91 593 Foxborough 5 3 0 0 1 5 14 Framingham 589 553 0 17 3 109 1271
51
District Name Spanish Portuguese Cape
Verdean Creole Haitian Vietnamese Other LEP
Franklin 13 5 0 1 4 32 55 Gardner 80 1 0 3 2 9 95 Georgetown 0 0 0 0 0 2 2 Gloucester 38 20 0 0 4 13 75 Grafton 3 0 0 0 0 11 14 Granby 3 0 0 0 0 10 13 Greenfield 18 0 0 0 1 35 54 Hadley 8 0 0 0 0 8 16 Hanover 1 0 0 0 1 6 8 Harvard 1 0 0 0 0 1 2 Harwich 12 3 0 8 1 24 48 Haverhill 407 11 0 3 7 33 461 Hingham 0 1 0 0 0 9 10 Holbrook 8 4 0 5 1 8 26 Holland 0 1 0 0 0 0 1 Holliston 7 14 0 0 0 16 37 Holyoke 1361 0 0 0 2 14 1377 Hopedale 2 2 0 0 0 5 9 Hopkinton 7 1 0 0 0 30 38 Hudson 32 67 0 1 1 13 114 Hull 0 1 1 0 0 1 3 Ipswich 5 3 0 0 0 10 18 Kingston 0 2 0 0 0 1 3 Lanesborough 0 0 0 0 0 2 2 Lawrence 2732 3 0 5 32 63 2835 Lee 13 1 0 0 0 4 18 Leicester 7 0 0 0 6 8 21 Lenox 1 0 0 0 0 6 7 Leominster 277 44 0 2 3 72 398 Lexington 21 5 0 4 0 266 296 Lincoln 4 0 0 1 0 21 26
52
District Name Spanish Portuguese Cape
Verdean Creole Haitian Vietnamese Other LEP
Littleton 1 3 1 0 0 10 15 Longmeadow 5 2 0 0 1 31 39 Lowell 1595 324 3 14 131 2254 4321 Ludlow 6 11 0 0 0 25 42 Lunenburg 2 4 0 0 0 4 10 Lynn 2662 30 1 67 62 643 3465 Lynnfield 1 0 0 0 0 3 4 Malden 120 99 0 116 51 320 706 Mansfield 10 6 0 0 0 28 44 Marblehead 3 1 0 0 0 15 19 Marion 0 0 0 0 0 1 1 Marlborough 261 211 0 2 4 31 509 Marshfield 3 11 0 0 0 9 23 Mashpee 0 0 0 0 1 17 18 Mattapoisett 0 0 0 0 0 2 2 Maynard 14 11 0 2 0 6 33 Medfield 0 2 0 0 0 4 6 Medford 28 80 0 96 12 83 299 Medway 3 0 0 1 0 4 8 Melrose 4 5 0 7 2 58 76 Methuen 340 3 0 7 11 52 413 Middleborough 7 0 0 0 1 5 13 Middleton 2 1 0 0 0 10 13 Milford 100 101 0 0 2 24 227 Millbury 2 4 0 0 3 4 13 Millis 0 0 0 0 0 2 2 Milton 3 3 0 15 3 10 34 Monson 0 0 0 0 0 10 10 Nantucket 60 5 0 0 0 2 67 Natick 4 2 0 0 2 28 36 Needham 13 1 2 1 1 32 50
53
District Name Spanish Portuguese Cape
Verdean Creole Haitian Vietnamese Other LEP
New Bedford 289 31 1 2 5 133 461 Newburyport 4 3 0 0 0 5 12 Newton 112 22 0 7 11 536 688 North Adams 19 2 0 0 0 7 28 Northampton 40 0 0 0 0 10 50 North Andover 18 1 0 0 4 26 49 North Attleborough 19 0 0 0 1 18 38 Northborough 16 13 0 0 0 37 66 Northbridge 6 0 0 0 0 6 12 North Brookfield 0 0 0 0 0 3 3 North Reading 2 0 0 0 0 9 11 Norton 0 0 0 0 0 5 5 Norwell 2 0 0 0 0 1 3 Norwood 38 39 0 11 5 82 175 Oak Bluffs 0 19 0 0 0 1 20 Orleans 0 0 0 0 0 2 2 Oxford 3 0 0 0 0 2 5 Palmer 4 2 0 0 0 11 17 Peabody 175 100 0 0 11 70 356 Pittsfield 168 1 0 0 8 56 233 Plymouth 9 26 0 1 2 9 47 Provincetown 7 0 0 0 0 0 7 Quincy 41 31 0 6 126 840 1044 Randolph 17 6 3 71 54 33 184 Reading 1 3 0 0 1 11 16 Revere 392 39 0 8 31 155 625 Rockland 3 22 0 0 2 1 28 Rockport 1 0 0 0 0 4 5 Salem 430 9 0 5 7 56 507 Sandwich 0 0 0 0 0 1 1 Saugus 22 15 0 6 6 19 68
54
District Name Spanish Portuguese Cape
Verdean Creole Haitian Vietnamese Other LEP
Scituate 1 5 6 0 0 2 14 Seekonk 5 1 0 0 2 15 23 Sharon 1 0 0 5 6 32 44 Sherborn 0 0 0 0 0 1 1 Shirley 2 1 0 0 0 2 5 Shrewsbury 15 39 0 0 6 84 144 Somerset 0 0 0 0 0 2 2 Somerville 372 170 5 73 5 152 777 Southampton 1 0 0 0 0 2 3 Southborough 5 4 0 0 0 38 47 Southbridge 219 0 0 0 0 13 232 South Hadley 11 0 0 0 1 3 15 Springfield 2970 2 0 4 87 225 3288 Stoneham 17 11 0 1 3 26 58 Stoughton 21 60 8 17 9 51 166 Sturbridge 1 2 0 0 0 0 3 Sudbury 8 2 0 0 1 7 18 Sunderland 2 0 0 0 0 1 3 Swampscott 8 4 1 2 2 35 52 Swansea 3 2 0 0 0 5 10 Taunton 72 43 5 9 1 29 159 Tewksbury 2 1 0 0 2 7 12 Tisbury 0 26 0 0 0 2 28 Topsfield 0 0 0 0 0 2 2 Uxbridge 11 3 0 0 0 16 30 Wakefield 8 2 0 0 2 6 18 Wales 0 0 0 0 0 1 1 Walpole 18 14 0 13 1 36 82 Waltham 333 27 0 26 3 86 475 Ware 7 0 0 0 0 4 11 Wareham 4 2 0 0 2 9 17
55
District Name Spanish Portuguese Cape
Verdean Creole Haitian Vietnamese Other LEP
Watertown 52 32 0 2 0 182 268 Wayland 1 0 0 0 0 14 15 Webster 32 4 0 0 1 12 49 Wellesley 16 0 0 0 0 55 71 Westborough 43 38 0 1 0 174 256 West Boylston 0 1 0 0 0 2 3 West Bridgewater 0 0 0 2 0 0 2 Westfield 34 0 0 0 0 177 211 Westford 3 0 0 1 2 27 33 Weston 5 0 1 3 1 41 51 Westport 1 9 0 0 4 1 15 West Springfield 29 2 0 0 3 242 276 Westwood 3 0 0 0 0 28 31 Weymouth 12 49 0 1 4 38 104 Williamsburg 0 2 0 0 0 0 2 Williamstown 2 3 0 0 0 4 9 Wilmington 1 3 0 0 4 14 22 Winchendon 4 2 0 0 0 5 11 Winchester 10 10 0 2 2 117 141 Winthrop 18 9 0 1 0 38 66 Woburn 27 44 0 8 8 109 196 Worcester 3636 297 4 44 703 1704 6388 Wrentham 2 3 0 0 0 3 8 Northampton-Smith Voc Agr 5 0 0 0 0 0 5 Excel Academy CS 9 0 0 0 0 0 9 Academy Of the Pacific Rim CS 3 1 0 1 0 0 5 Boston Preparatory CS 3 0 0 2 0 0 5 Christa McAuliffe Regional CS 2 0 0 0 0 0 2 Smith Leadership Academy CS 1 0 0 0 0 0 1 Benjamin Banneker CS 5 0 0 16 0 1 22 Barnstable Horace Mann CS 6 16 0 0 0 9 31
56
District Name Spanish Portuguese Cape
Verdean Creole Haitian Vietnamese Other LEP
Barnstable Com Horace Mann CS 17 17 0 0 0 1 35 Edward Brooke CS 3 0 0 0 0 0 3 KIPP Academy Lynn CS 4 0 0 0 0 0 4 Innovation Academy CS 1 0 0 0 0 0 1 Community CS of Cambridge 3 0 0 5 0 2 10 City On A Hill CS 3 0 0 0 0 1 4 Codman Academy CS 1 0 0 0 0 0 1 Conservatory Lab Charter (District) 14 4 0 0 0 3 21 Community Day CS 96 0 0 2 0 0 98 Sabis International CS 17 0 0 0 4 4 25 Neighborhood House CS 3 0 1 1 3 1 9 Abby Kelley Foster CS 12 5 0 0 0 11 28 Foxborough Reg CS 2 0 0 5 0 22 29 Hilltown Cooperative CS 0 0 0 0 0 1 1 EM Kennedy Acad Health Careers HMCS 1 0 1 0 0 0 2 Holyoke Com CS 32 0 0 0 0 0 32 Lawrence Family Development CS 251 0 0 0 0 1 252 Hill View Montessori CS 6 0 0 0 0 1 7 Lowell Community CS 100 19 0 4 3 121 247 Marthas Vineyard CS 0 3 0 0 0 1 4 New Leadership Charter 3 0 0 0 0 1 4 North Central Charter Essential 2 0 0 0 0 1 3 Silver Hill Horace Mann Charter 25 1 0 1 0 4 31 Pioneer Valley Performing Arts CS 1 0 0 0 0 0 1 Boston Renaissance CS 43 1 2 4 1 7 58 Roxbury Preparatory CS 3 0 3 0 0 0 6 Salem Academy CS 13 0 0 0 0 3 16 Seven Hills CS 89 0 0 0 0 21 110 Prospect Hill Academy CS 9 4 0 11 0 5 29 MLK Jr CS of Excellence 19 0 0 1 0 0 20 Phoenix Charter Academy 23 0 0 1 0 1 25
57
District Name Spanish Portuguese Cape
Verdean Creole Haitian Vietnamese Other LEP
Pioneer Charter School of Science 2 3 0 2 0 0 7 Global Learning Charter Public 1 0 0 0 0 0 1 Pioneer Valley Chinese Imm CS 0 0 0 0 0 1 1 Acton-Boxborough 4 6 0 0 0 10 20 Adams-Cheshire 0 0 0 0 0 3 3 Amherst-Pelham 24 3 3 0 1 36 67 Ashburnham-Westminster 8 0 0 2 0 5 15 Athol-Royalston 8 0 0 0 0 7 15 Berkshire Hills 23 0 0 0 0 6 29 Berlin-Boylston 0 0 0 0 0 1 1 Blackstone-Millville 4 1 0 0 0 6 11 Bridgewater-Raynham 2 2 0 2 1 15 22 Central Berkshire 0 0 0 0 0 1 1 Concord-Carlisle 0 0 0 1 0 2 3 Dennis-Yarmouth 34 62 1 13 3 33 146 Dighton-Rehoboth 5 1 0 0 0 2 8 Dover-Sherborn 0 1 0 0 0 2 3 Dudley-Charlton Reg 14 4 0 0 0 32 50 Nauset 5 1 0 0 0 7 13 Freetown-Lakeville 0 1 0 0 0 0 1 Frontier 3 1 0 0 1 4 9 Gateway 1 0 0 0 0 10 11 Groton-Dunstable 6 1 0 0 0 4 11 Gill-Montague 24 0 0 1 0 20 45 Hamilton-Wenham 0 1 0 0 0 42 43 Hampden-Wilbraham 1 0 0 0 2 21 24 Hawlemont 0 1 0 0 0 0 1 King Philip 1 0 0 0 0 1 2 Lincoln-Sudbury 0 0 0 0 0 4 4 Manchester Essex Regional 0 0 0 0 0 3 3 Marthas Vineyard 0 16 0 0 0 0 16
58
District Name Spanish Portuguese Cape
Verdean Creole Haitian Vietnamese Other LEP
0 Masconomet 0 0 0 0 2 2 Mendon-Upton 1 1 0 0 0 8 10 Mount Greylock 0 0 0 0 0 2 2 Mohawk Trail 0 0 0 0 2 5 7 Narragansett 0 0 0 0 0 3 3 Nashoba 7 4 0 1 0 5 17 Northboro-Southboro 1 1 0 1 0 4 7 North Middlesex 11 1 0 0 0 4 16 Old Rochester 0 0 0 0 0 1 1 Pentucket 1 0 0 0 0 2 3 Quabbin 0 0 0 0 0 4 4 Ralph C Mahar 1 0 0 0 0 7 8 Silver Lake 0 0 0 0 0 1 1 Southern Berkshire 4 0 0 0 0 0 4 Southwick-Tolland 0 0 0 0 0 14 14 Spencer-E Brookfield 5 0 0 0 0 2 7 Triton 4 2 0 0 10 8 24 Up-Island Regional 2 1 0 0 0 2 5 Wachusett 3 3 0 0 7 34 47 Quaboag Regional 0 0 0 0 0 1 1 Whitman-Hanson 5 1 0 0 0 3 9 Assabet Valley Reg Voc Tech 8 1 0 0 0 0 9 Blue Hills Regional Vocational Technical 1 2 0 2 0 0 5 Bristol-Plymouth Reg Voc Tech 0 2 0 0 0 0 2 Cape Cod Reg Voc Tech 2 2 0 0 0 1 5 Greater Fall River Reg Voc Tech 1 1 0 0 0 0 2 Greater Lawrence Reg Voc Tech 33 0 0 0 0 1 34 GrNew Bedford Reg Voc Tech 14 6 0 0 0 0 20 Greater Lowell Reg Voc Tech 20 8 0 0 0 18 46 South Middlesex Reg Voc Tech 23 14 0 0 0 3 40 Minuteman Reg Voc Tech 2 0 0 0 0 1 3
59
60
District Name Spanish Portuguese Cape
Verdean Creole Haitian Vietnamese Other LEP
Montachusett Reg Voc Tech 4 0 0 0 0 4 8 Northeast Metro Reg Voc Tech 55 0 0 0 0 2 57 North Shore Reg Voc Tech 3 0 0 0 0 0 3 Southeastern Reg Voc Tech 0 2 3 3 0 1 9 Southern Worcester County Reg Voc Tech 3 0 0 0 0 1 4 Tri County Reg Voc Tech 0 1 0 0 0 0 1 Whittier Reg Voc Tech 6 0 0 0 0 0 6 TOTALS 31793 4209 2458 2433 2423 15842 59158
Source The Department Student Information Management System 2009
- Introduction
-
- Background
-
- I English Language Learners in Massachusetts
- II Educators Implementing Sheltered English Immersion Elementary and Secondary Content Teachers of English Language Learners
-
- Research on Professional Development for Educators of English Language Learners
- Gaps in Knowledge
-
- III Use of Funds for Category Training
-
- Future Need for Category Training
-
- IV Educators Implementing Sheltered English Immersion English as a Second Language (ESL) Teachers
-
- ESL Teacher Shortage
-
- V Use of Funds ESL Teachers and ESL Curriculum Development
-
- Massachusetts English Language Teacher Initiative (MELT)
- Improvement of Sheltered English Immersion Content-based ESL Instruction
- Future Need for ESL teachers
-
- VI Budget
- Attachments
-
- Attachment 1 All Massachusetts public school districts and changes in LEP population compared to changes in overall student population - SY 2006-SY 2010
- Attachment 1 Massachusetts public school districts and changes in LEP population compared to changes in overall student population - SY 2006-SY 2010
- Attachment 2 Massachusetts public school districts with large changes in LEP population compared to changes in overall student population - SY 2006-SY 2010
- Attachment 3 Bibliography Professional Development for Teachers of English Language Learners
- Attachment 4 Excerpts from the Commissionerrsquos Memorandum of June 2004 Guidance on Qualifications for Teachers of Limited English Proficient Students in Sheltered English Immersion Classrooms
- Attachment 5 Districts Receiving Sheltered English Immersion Professional Development 2004-2010
- Attachment 6 Collaboratives that have received grants for Sheltered English Immersion Professional Development 2004-2010
- Attachment 7 English Language Learners in Massachusetts District and Program Type October 2009
- Attachment 8 English Language Learners in Massachusetts District and First Language October 2009
-
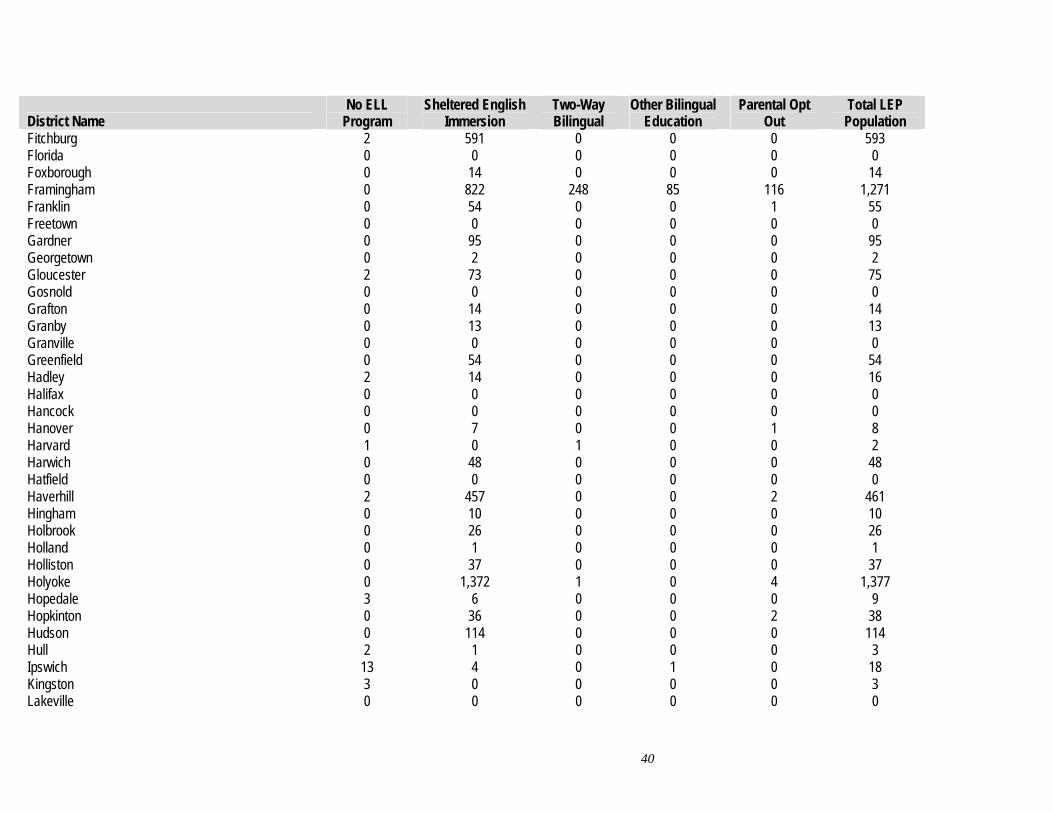
District Name No ELL
Program Sheltered English
Immersion Two-Way Bilingual
Other Bilingual Education
Parental Opt Total LEP Out Population
Fitchburg 2 591 0 0 0 593 Florida 0 0 0 0 0 0 Foxborough 0 14 0 0 0 14 Framingham 0 822 248 85 116 1271 Franklin 0 54 0 0 1 55 Freetown 0 0 0 0 0 0 Gardner 0 95 0 0 0 95 Georgetown 0 2 0 0 0 2 Gloucester 2 73 0 0 0 75 Gosnold 0 0 0 0 0 0 Grafton 0 14 0 0 0 14 Granby 0 13 0 0 0 13 Granville 0 0 0 0 0 0 Greenfield 0 54 0 0 0 54 Hadley 2 14 0 0 0 16 Halifax 0 0 0 0 0 0 Hancock 0 0 0 0 0 0 Hanover 0 7 0 0 1 8 Harvard 1 0 1 0 0 2 Harwich 0 48 0 0 0 48 Hatfield 0 0 0 0 0 0 Haverhill 2 457 0 0 2 461 Hingham 0 10 0 0 0 10 Holbrook 0 26 0 0 0 26 Holland 0 1 0 0 0 1 Holliston 0 37 0 0 0 37 Holyoke 0 1372 1 0 4 1377 Hopedale 3 6 0 0 0 9 Hopkinton 0 36 0 0 2 38 Hudson 0 114 0 0 0 114 Hull 2 1 0 0 0 3 Ipswich 13 4 0 1 0 18 Kingston 3 0 0 0 0 3 Lakeville 0 0 0 0 0 0
40
District Name No ELL
Program Sheltered English
Immersion Two-Way Bilingual
Other Bilingual Education
Parental Opt Out
Total LEP Population
Lanesborough 0 0 0 0 2 2 Lawrence 0 2835 0 0 0 2835 Lee 0 18 0 0 0 18 Leicester 4 16 1 0 0 21 Lenox 0 7 0 0 0 7 Leominster 0 398 0 0 0 398 Leverett 0 0 0 0 0 0 Lexington 0 286 0 0 10 296 Lincoln 0 26 0 0 0 26 Littleton 2 13 0 0 0 15 Longmeadow 1 36 0 0 2 39 Lowell 17 4228 0 3 73 4321 Ludlow 0 42 0 0 0 42 Lunenburg 1 9 0 0 0 10 Lynn 1 3071 0 35 358 3465 Lynnfield 0 4 0 0 0 4 Malden 0 675 12 0 19 706 Mansfield 0 44 0 0 0 44 Marblehead 18 1 0 0 0 19 Marion 0 1 0 0 0 1 Marlborough 68 441 0 0 0 509 Marshfield 4 15 1 0 3 23 Mashpee 3 15 0 0 0 18 Mattapoisett 0 2 0 0 0 2 Maynard 0 33 0 0 0 33 Medfield 0 6 0 0 0 6 Medford 0 299 0 0 0 299 Medway 0 8 0 0 0 8 Melrose 43 32 1 0 0 76 Methuen 0 408 0 0 5 413 Middleborough 0 13 0 0 0 13 Middleton 0 13 0 0 0 13 Milford 0 227 0 0 0 227 Millbury 11 2 0 0 0 13
41
District Name No ELL
Program Sheltered English
Immersion Two-Way Bilingual
Other Bilingual Education
Parental Opt Out
Total LEP Population
Millis 2 0 0 0 0 2 Milton 2 32 0 0 0 34 Monson 0 10 0 0 0 10 Nahant 0 0 0 0 0 0 Nantucket 5 61 0 0 1 67 Natick 1 35 0 0 0 36 Needham 0 50 0 0 0 50 New Bedford 0 461 0 0 0 461 Newburyport 0 12 0 0 0 12 Newton 7 680 0 0 1 688 Norfolk 0 0 0 0 0 0 North Adams 0 28 0 0 0 28 Northampton 0 50 0 0 0 50 North Andover 0 45 0 0 4 49 North Attleborough 0 38 0 0 0 38 Northborough 0 66 0 0 0 66 Northbridge 0 12 0 0 0 12 North Brookfield 0 3 0 0 0 3 North Reading 0 11 0 0 0 11 Norton 0 5 0 0 0 5 Norwell 1 2 0 0 0 3 Norwood 2 169 0 0 4 175 Oak Bluffs 20 0 0 0 0 20 Orange 0 0 0 0 0 0 Orleans 0 2 0 0 0 2 Oxford 0 5 0 0 0 5 Palmer 3 14 0 0 0 17 Peabody 0 356 0 0 0 356 Pelham 0 0 0 0 0 0 Pembroke 0 0 0 0 0 0 Petersham 0 0 0 0 0 0 Pittsfield 0 233 0 0 0 233 Plainville 0 0 0 0 0 0 Plymouth 2 45 0 0 0 47
42
District Name No ELL
Program Sheltered English
Immersion Two-Way Bilingual
Other Bilingual Education
Parental Opt Out
Total LEP Population
Plympton 0 0 0 0 0 0 Provincetown 0 7 0 0 0 7 Quincy 0 1044 0 0 0 1044 Randolph 4 179 1 0 0 184 Reading 0 16 0 0 0 16 Revere 2 623 0 0 0 625 Richmond 0 0 0 0 0 0 Rochester 0 0 0 0 0 0 Rockland 0 28 0 0 0 28 Rockport 0 5 0 0 0 5 Rowe 0 0 0 0 0 0 Salem 6 418 72 0 11 507 Sandwich 0 0 0 0 1 1 Saugus 18 50 0 0 0 68 Savoy 0 0 0 0 0 0 Scituate 0 14 0 0 0 14 Seekonk 0 23 0 0 0 23 Sharon 0 44 0 0 0 44 Sherborn 0 1 0 0 0 1 Shirley 0 5 0 0 0 5 Shrewsbury 0 144 0 0 0 144 Shutesbury 0 0 0 0 0 0 Somerset 1 0 0 1 0 2 Somerville 6 612 124 35 0 777 Southampton 0 3 0 0 0 3 Southborough 0 47 0 0 0 47 Southbridge 6 225 0 0 1 232 South Hadley 14 1 0 0 0 15 Springfield 0 2926 0 0 362 3288 Stoneham 0 58 0 0 0 58 Stoughton 0 129 0 0 37 166 Sturbridge 0 3 0 0 0 3 Sudbury 0 18 0 0 0 18 Sunderland 0 3 0 0 0 3
43
District Name No ELL
Program Sheltered English
Immersion Two-Way Bilingual
Other Bilingual Education
Parental Opt Out
Total LEP Population
Sutton 0 0 0 0 0 0 Swampscott 25 27 0 0 0 52 Swansea 0 10 0 0 0 10 Taunton 0 159 0 0 0 159 Tewksbury 0 12 0 0 0 12 Tisbury 0 28 0 0 0 28 Topsfield 2 0 0 0 0 2 Truro 0 0 0 0 0 0 Tyngsborough 0 0 0 0 0 0 Uxbridge 0 28 1 0 1 30 Wakefield 0 17 0 0 1 18 Wales 0 0 0 0 1 1 Walpole 0 82 0 0 0 82 Waltham 1 383 0 0 91 475 Ware 0 11 0 0 0 11 Wareham 1 14 0 0 2 17 Watertown 1 264 0 0 3 268 Wayland 0 13 0 0 2 15 Webster 1 48 0 0 0 49 Wellesley 1 53 0 0 17 71 Wellfleet 0 0 0 0 0 0 Westborough 2 253 0 0 1 256 West Boylston 0 3 0 0 0 3 West Bridgewater 0 2 0 0 0 2 Westfield 25 185 0 0 1 211 Westford 0 31 0 0 2 33 Westhampton 0 0 0 0 0 0 Weston 0 51 0 0 0 51 Westport 0 15 0 0 0 15 West Springfield 0 276 0 0 0 276 Westwood 6 25 0 0 0 31 Weymouth 0 101 0 0 3 104 Whately 0 0 0 0 0 0 Williamsburg 0 0 0 0 2 2
44
District Name No ELL
Program Sheltered English
Immersion Two-Way Bilingual
Other Bilingual Education
Parental Opt Out
Total LEP Population
Williamstown 0 9 0 0 0 9 Wilmington 0 22 0 0 0 22 Winchendon 0 11 0 0 0 11 Winchester 1 140 0 0 0 141 Winthrop 0 66 0 0 0 66 Woburn 1 195 0 0 0 196 Worcester 206 5922 27 177 56 6388 Wrentham 7 1 0 0 0 8 Northampton-Smith Voc Agr 0 0 0 5 0 5 Excel Academy CS 4 5 0 0 0 9 Four Rivers Charter Public 0 5 0 0 0 5 Berkshire Arts and TechCS 0 0 0 0 0 0 Amesbury Academy CS 0 0 0 0 0 0 Boston Preparatory CS 0 0 0 0 0 0 Christa McAuliffe Reg 0 5 0 0 0 5 Smith Leadership Academy CS 0 0 0 0 2 2 Benjamin Banneker CS 0 1 0 0 0 1 Barnstable Horace Mann CS 0 22 0 0 0 22 Boston Day and Eve CS 4 25 1 1 0 31 Barnstable Com Hrce Mann CS 0 35 0 0 0 35 Edward Brooke Charter 0 3 0 0 0 3 KIPP Academy Lynn Charter 0 3 0 0 1 4 Advanced Math and Science CS 0 0 0 0 0 0 Cape Cod Lighthouse Charter 0 0 0 0 0 0 Innovation Academy Charter 0 1 0 0 0 1 Community CS of Cambridge 0 7 0 0 3 10 City On A Hill Charter Public 0 4 0 0 0 4 Codman Academy CS 1 0 0 0 0 1 Conservatory Lab Charter 0 21 0 0 0 21 Community Day Charter Public 0 98 0 0 0 98 Sabis International Charter 25 0 0 0 0 25 Neighborhood House Charter 0 9 0 0 0 9 Abby Kelley Foster CS 0 27 0 0 1 28 Foxborough Regional CS 0 29 0 0 0 29
45
District Name No ELL
Program Sheltered English
Immersion Two-Way Bilingual
Other Bilingual Education
Parental Opt Out
Total LEP Population
Benjamin Franklin Classical CS 0 0 0 0 0 0 Boston Collegiate Charter 0 0 0 0 0 0 Hilltown Cooperative CS 0 1 0 0 0 1 Robert M Hughes Acad CS 0 0 0 0 0 0 EM Kennedy Acad Health Careers Horace Mann CS 0 2 0 0 0 2 Holyoke Community Charter 0 32 0 0 0 32 Lawrence Family Dev CS 0 0 252 0 0 252 Hill View Montessori CS 0 7 0 0 0 7 Lowell Community CS 0 247 0 0 0 247 Lowell Middlesex Acad CS 0 0 0 0 0 0 Marblehead Community CS 0 0 0 0 0 0 Marthas Vineyard CS 0 4 0 0 0 4 Ma Acad for Math and Science 0 0 0 0 0 0 MATCH Charter Public High 0 0 0 0 0 0 Mystic Valley Regional Charter 0 0 0 0 0 0 New Leadership Charter 0 4 0 0 0 4 North Central Charter Essential 0 3 0 0 0 3 Dorchester Collegiate Acad CS 0 0 0 0 0 0 Silver Hill Horace Mann Charter 0 31 0 0 0 31 Francis W Parker Ch Essential 0 0 0 0 0 0 Pioneer Valley Perf Arts CS 0 1 0 0 0 1 Boston Renaissance CS 0 58 0 0 0 58 River Valley Charter 0 0 0 0 0 0 Rising Tide Charter Public 0 0 0 0 0 0 Roxbury Preparatory Charter 0 6 0 0 0 6 Salem Academy Charter 0 16 0 0 0 16 Seven Hills Charter Public 0 108 0 0 2 110 Prospect Hill Academy Charter 0 29 0 0 0 29 South Shore Charter Public 0 0 0 0 0 0 Sturgis Charter Public 0 0 0 0 0 0 Atlantis Charter 0 0 0 0 0 0 MLK Jr CS of Excellence 0 20 0 0 0 20 Phoenix Charter Academy 0 25 0 0 0 25 Pioneer CS of Science 0 7 0 0 0 7
46
District Name No ELL
Program Sheltered English
Immersion Two-Way Bilingual
Other Bilingual Education
Parental Opt Out
Total LEP Population
29
Global Learning Charter Public 1 0 0 0 0 1 Pioneer Valley Chinese Imm CS 0 0 0 0 1 1 Hampden CS of Science 0 0 0 0 0 0 Acton-Boxborough 0 20 0 0 0 20 Adams-Cheshire 0 3 0 0 0 3 Amherst-Pelham 0 67 0 0 0 67 Ashburnham-Westminster 0 15 0 0 0 15 Athol-Royalston 0 13 0 2 0 15 Berkshire Hills 0 0 0 0 29 Berlin-Boylston 0 1 0 0 0 1 Blackstone-Millville 0 10 0 0 1 11 Bridgewater-Raynham 13 9 0 0 0 22 Chesterfield-Goshen 0 0 0 0 0 0 Central Berkshire 1 0 0 0 0 1 Concord-Carlisle 0 3 0 0 0 3 Dennis-Yarmouth 0 146 0 0 0 146 Dighton-Rehoboth 0 8 0 0 0 8 Dover-Sherborn 0 3 0 0 0 3 Dudley-Charlton Reg 2 47 0 0 1 50 Nauset 3 10 0 0 0 13 Farmington River Reg 0 0 0 0 0 0 Freetown-Lakeville 1 0 0 0 0 1 Frontier 0 9 0 0 0 9 Gateway 0 11 0 0 0 11 Groton-Dunstable 0 11 0 0 0 11 Gill-Montague 43 2 0 0 0 45 Hamilton-Wenham 35 5 0 1 2 43 Hampden-Wilbraham 0 24 0 0 0 24 Hampshire 0 0 0 0 0 0 Hawlemont 0 0 1 0 0 1 King Philip 0 2 0 0 0 2 Lincoln-Sudbury 0 4 0 0 0 4 Manchester Essex Regional 0 3 0 0 0 3 Marthas Vineyard 0 16 0 0 0 16
47
District Name No ELL
Program Sheltered English
Immersion Two-Way Bilingual
Other Bilingual Education
Parental Opt Out
Total LEP Population
Masconomet 2 0 0 0 0 2 Mendon-Upton 0 10 0 0 0 10 Mount Greylock 0 2 0 0 0 2 Mohawk Trail 2 4 1 0 0 7 Narragansett 0 3 0 0 0 3 Nashoba 0 17 0 0 0 17 New Salem-Wendell 0 0 0 0 0 0 Northboro-Southboro 1 6 0 0 0 7 North Middlesex 7 5 0 0 4 16 Old Rochester 1 0 0 0 0 1 Pentucket 0 3 0 0 0 3 Pioneer Valley 0 0 0 0 0 0 Quabbin 1 1 0 0 2 4 Ralph C Mahar 1 7 0 0 0 8 Silver Lake 1 0 0 0 0 1 Southern Berkshire 0 4 0 0 0 4 Southwick-Tolland 0 14 0 0 0 14 Spencer-E Brookfield 0 7 0 0 0 7 Tantasqua 0 0 0 0 0 0 Triton 0 24 0 0 0 24 Up-Island Regional 0 5 0 0 0 5 Wachusett 0 47 0 0 0 47 Quaboag Regional 0 1 0 0 0 1 Whitman-Hanson 0 9 0 0 0 9 Assabet Valley Reg Voc Tech 0 9 0 0 0 9 Blackstone Val Reg Voc Tech 0 0 0 0 0 0 Blue Hills Regional Voc Tech 0 5 0 0 0 5 Bristol-Plym Reg Voc Tech 0 2 0 0 0 2 Cape Cod Regional Voc Tech 0 5 0 0 0 5 Franklin County Reg Voc Tech 0 0 0 0 0 0 Grtr Fall River Reg Voc Tech 2 0 0 0 0 2 Grtr Lawrence Reg Voc Tech 0 31 2 0 1 34 Grtr Nw Bdfrd Reg Voc Tech 0 20 0 0 0 20 Grtr Lowell Reg Voc Tech 0 46 0 0 0 46
48
District Name No ELL
Program Sheltered English
Immersion Two-Way Bilingual
Other Bilingual Education
Parental Opt Out
Total LEP Population
S Middlesex Reg Voc Tech 0 40 0 0 0 40 Minuteman Reg Voc Tech 0 3 0 0 0 3 Montachusett Reg Voc Tech 0 8 0 0 0 8 N Berkshire Reg Voc Tech 0 0 0 0 0 0 Nashoba Valley Reg Voc 0 0 0 0 0 0 NE Metro Reg Voc Tech 0 57 0 0 0 57 North Shore Reg Voc Tech 0 3 0 0 0 3 Old Colony Reg Voc Tech 0 0 0 0 0 0 Pathfinder Reg Voc Tech 0 0 0 0 0 0 Shawsheen Val Reg Voc Tech 0 0 0 0 0 0 Southeastern Reg Voc Tech 0 9 0 0 0 9 South Shore Reg Voc Tech 0 0 0 0 0 0 S Worcester C Reg Voc Tech 1 0 0 3 0 4 Tri County Reg Voc Tech 0 1 0 0 0 1 Uppr Cape Cod Reg Voc Tech 0 0 0 0 0 0 Whittier Reg Voc Tech 0 6 0 0 0 6 Bristol County Agricultural 0 0 0 0 0 0 Essex Agricultural Technical 0 0 0 0 0 0 Norfolk County Agricultural 0 0 0 0 0 0 TOTALS 1113 49096 1229 1342 6378 59158
Source The Department Student Information Management System 2009
49
Attachment 8 English Language Learners in Massachusetts District and First Language October 2009
District Name Spanish Portuguese Cape
Verdean Creole Haitian Vietnamese Other LEP
Abington 3 3 0 0 0 4 10 Acton 8 7 0 0 0 66 81 Acushnet 0 1 0 0 0 0 1 Agawam 15 0 0 0 1 81 97 Amesbury 5 8 0 0 0 8 21 Amherst 60 4 2 0 2 107 175 Andover 12 3 0 0 1 67 83 Arlington 26 17 2 11 1 135 192 Ashland 9 35 0 0 1 22 67 Attleboro 170 9 1 1 2 84 267 Auburn 12 5 0 3 12 24 56 Avon 0 0 0 1 0 0 1 Ayer 36 13 0 0 0 11 60 Barnstable 39 111 0 2 0 24 176 Bedford 9 0 0 0 2 38 49 Belchertown 7 1 0 0 1 15 24 Bellingham 8 3 0 0 3 13 27 Belmont 5 2 0 0 0 85 92 Berlin 0 1 0 0 0 0 1 Beverly 6 8 0 0 1 24 39 Billerica 13 6 0 2 3 57 81 Boston 6434 210 900 947 723 2057 11271 Bourne 1 0 0 0 0 0 1 Boxborough 1 2 0 0 0 3 6 Boxford 1 0 0 0 0 3 4 Boylston 1 0 0 0 1 8 10 Braintree 13 3 4 1 13 77 111 Brewster 6 0 0 0 0 3 9 Brockton 484 131 1465 453 37 167 2737
50
District Name Spanish Portuguese Cape
Verdean Creole Haitian Vietnamese Other LEP
Brookline 43 16 2 2 6 427 496 Burlington 2 3 0 2 0 57 64 Cambridge 58 23 6 67 2 147 303 Canton 4 1 0 3 5 23 36 Carlisle 0 0 0 0 0 11 11 Carver 0 0 0 0 0 2 2 Chatham 10 2 0 3 0 4 19 Chelmsford 9 5 0 0 8 82 104 Chelsea 766 29 2 13 9 103 922 Chicopee 201 4 0 0 1 148 354 Clinton 106 17 0 11 0 10 144 Concord 13 1 0 0 2 20 36 Danvers 4 0 0 1 0 11 16 Dartmouth 2 19 0 0 0 18 39 Dedham 47 3 0 13 9 42 114 Deerfield 4 0 0 0 2 1 7 Douglas 0 2 0 0 0 1 3 Dover 0 0 0 2 0 7 9 Dracut 13 6 0 0 0 24 43 Eastham 1 0 0 0 0 0 1 Easthampton 12 0 0 0 1 27 40 East Longmeadow 0 0 0 0 0 2 2 Easton 4 7 1 3 4 18 37 Edgartown 2 24 0 0 0 0 26 Everett 308 119 1 96 12 44 580 Fairhaven 1 2 0 0 0 0 3 Fall River 297 122 16 2 10 67 514 Falmouth 5 12 0 0 4 23 44 Fitchburg 487 2 0 2 11 91 593 Foxborough 5 3 0 0 1 5 14 Framingham 589 553 0 17 3 109 1271
51
District Name Spanish Portuguese Cape
Verdean Creole Haitian Vietnamese Other LEP
Franklin 13 5 0 1 4 32 55 Gardner 80 1 0 3 2 9 95 Georgetown 0 0 0 0 0 2 2 Gloucester 38 20 0 0 4 13 75 Grafton 3 0 0 0 0 11 14 Granby 3 0 0 0 0 10 13 Greenfield 18 0 0 0 1 35 54 Hadley 8 0 0 0 0 8 16 Hanover 1 0 0 0 1 6 8 Harvard 1 0 0 0 0 1 2 Harwich 12 3 0 8 1 24 48 Haverhill 407 11 0 3 7 33 461 Hingham 0 1 0 0 0 9 10 Holbrook 8 4 0 5 1 8 26 Holland 0 1 0 0 0 0 1 Holliston 7 14 0 0 0 16 37 Holyoke 1361 0 0 0 2 14 1377 Hopedale 2 2 0 0 0 5 9 Hopkinton 7 1 0 0 0 30 38 Hudson 32 67 0 1 1 13 114 Hull 0 1 1 0 0 1 3 Ipswich 5 3 0 0 0 10 18 Kingston 0 2 0 0 0 1 3 Lanesborough 0 0 0 0 0 2 2 Lawrence 2732 3 0 5 32 63 2835 Lee 13 1 0 0 0 4 18 Leicester 7 0 0 0 6 8 21 Lenox 1 0 0 0 0 6 7 Leominster 277 44 0 2 3 72 398 Lexington 21 5 0 4 0 266 296 Lincoln 4 0 0 1 0 21 26
52
District Name Spanish Portuguese Cape
Verdean Creole Haitian Vietnamese Other LEP
Littleton 1 3 1 0 0 10 15 Longmeadow 5 2 0 0 1 31 39 Lowell 1595 324 3 14 131 2254 4321 Ludlow 6 11 0 0 0 25 42 Lunenburg 2 4 0 0 0 4 10 Lynn 2662 30 1 67 62 643 3465 Lynnfield 1 0 0 0 0 3 4 Malden 120 99 0 116 51 320 706 Mansfield 10 6 0 0 0 28 44 Marblehead 3 1 0 0 0 15 19 Marion 0 0 0 0 0 1 1 Marlborough 261 211 0 2 4 31 509 Marshfield 3 11 0 0 0 9 23 Mashpee 0 0 0 0 1 17 18 Mattapoisett 0 0 0 0 0 2 2 Maynard 14 11 0 2 0 6 33 Medfield 0 2 0 0 0 4 6 Medford 28 80 0 96 12 83 299 Medway 3 0 0 1 0 4 8 Melrose 4 5 0 7 2 58 76 Methuen 340 3 0 7 11 52 413 Middleborough 7 0 0 0 1 5 13 Middleton 2 1 0 0 0 10 13 Milford 100 101 0 0 2 24 227 Millbury 2 4 0 0 3 4 13 Millis 0 0 0 0 0 2 2 Milton 3 3 0 15 3 10 34 Monson 0 0 0 0 0 10 10 Nantucket 60 5 0 0 0 2 67 Natick 4 2 0 0 2 28 36 Needham 13 1 2 1 1 32 50
53
District Name Spanish Portuguese Cape
Verdean Creole Haitian Vietnamese Other LEP
New Bedford 289 31 1 2 5 133 461 Newburyport 4 3 0 0 0 5 12 Newton 112 22 0 7 11 536 688 North Adams 19 2 0 0 0 7 28 Northampton 40 0 0 0 0 10 50 North Andover 18 1 0 0 4 26 49 North Attleborough 19 0 0 0 1 18 38 Northborough 16 13 0 0 0 37 66 Northbridge 6 0 0 0 0 6 12 North Brookfield 0 0 0 0 0 3 3 North Reading 2 0 0 0 0 9 11 Norton 0 0 0 0 0 5 5 Norwell 2 0 0 0 0 1 3 Norwood 38 39 0 11 5 82 175 Oak Bluffs 0 19 0 0 0 1 20 Orleans 0 0 0 0 0 2 2 Oxford 3 0 0 0 0 2 5 Palmer 4 2 0 0 0 11 17 Peabody 175 100 0 0 11 70 356 Pittsfield 168 1 0 0 8 56 233 Plymouth 9 26 0 1 2 9 47 Provincetown 7 0 0 0 0 0 7 Quincy 41 31 0 6 126 840 1044 Randolph 17 6 3 71 54 33 184 Reading 1 3 0 0 1 11 16 Revere 392 39 0 8 31 155 625 Rockland 3 22 0 0 2 1 28 Rockport 1 0 0 0 0 4 5 Salem 430 9 0 5 7 56 507 Sandwich 0 0 0 0 0 1 1 Saugus 22 15 0 6 6 19 68
54
District Name Spanish Portuguese Cape
Verdean Creole Haitian Vietnamese Other LEP
Scituate 1 5 6 0 0 2 14 Seekonk 5 1 0 0 2 15 23 Sharon 1 0 0 5 6 32 44 Sherborn 0 0 0 0 0 1 1 Shirley 2 1 0 0 0 2 5 Shrewsbury 15 39 0 0 6 84 144 Somerset 0 0 0 0 0 2 2 Somerville 372 170 5 73 5 152 777 Southampton 1 0 0 0 0 2 3 Southborough 5 4 0 0 0 38 47 Southbridge 219 0 0 0 0 13 232 South Hadley 11 0 0 0 1 3 15 Springfield 2970 2 0 4 87 225 3288 Stoneham 17 11 0 1 3 26 58 Stoughton 21 60 8 17 9 51 166 Sturbridge 1 2 0 0 0 0 3 Sudbury 8 2 0 0 1 7 18 Sunderland 2 0 0 0 0 1 3 Swampscott 8 4 1 2 2 35 52 Swansea 3 2 0 0 0 5 10 Taunton 72 43 5 9 1 29 159 Tewksbury 2 1 0 0 2 7 12 Tisbury 0 26 0 0 0 2 28 Topsfield 0 0 0 0 0 2 2 Uxbridge 11 3 0 0 0 16 30 Wakefield 8 2 0 0 2 6 18 Wales 0 0 0 0 0 1 1 Walpole 18 14 0 13 1 36 82 Waltham 333 27 0 26 3 86 475 Ware 7 0 0 0 0 4 11 Wareham 4 2 0 0 2 9 17
55
District Name Spanish Portuguese Cape
Verdean Creole Haitian Vietnamese Other LEP
Watertown 52 32 0 2 0 182 268 Wayland 1 0 0 0 0 14 15 Webster 32 4 0 0 1 12 49 Wellesley 16 0 0 0 0 55 71 Westborough 43 38 0 1 0 174 256 West Boylston 0 1 0 0 0 2 3 West Bridgewater 0 0 0 2 0 0 2 Westfield 34 0 0 0 0 177 211 Westford 3 0 0 1 2 27 33 Weston 5 0 1 3 1 41 51 Westport 1 9 0 0 4 1 15 West Springfield 29 2 0 0 3 242 276 Westwood 3 0 0 0 0 28 31 Weymouth 12 49 0 1 4 38 104 Williamsburg 0 2 0 0 0 0 2 Williamstown 2 3 0 0 0 4 9 Wilmington 1 3 0 0 4 14 22 Winchendon 4 2 0 0 0 5 11 Winchester 10 10 0 2 2 117 141 Winthrop 18 9 0 1 0 38 66 Woburn 27 44 0 8 8 109 196 Worcester 3636 297 4 44 703 1704 6388 Wrentham 2 3 0 0 0 3 8 Northampton-Smith Voc Agr 5 0 0 0 0 0 5 Excel Academy CS 9 0 0 0 0 0 9 Academy Of the Pacific Rim CS 3 1 0 1 0 0 5 Boston Preparatory CS 3 0 0 2 0 0 5 Christa McAuliffe Regional CS 2 0 0 0 0 0 2 Smith Leadership Academy CS 1 0 0 0 0 0 1 Benjamin Banneker CS 5 0 0 16 0 1 22 Barnstable Horace Mann CS 6 16 0 0 0 9 31
56
District Name Spanish Portuguese Cape
Verdean Creole Haitian Vietnamese Other LEP
Barnstable Com Horace Mann CS 17 17 0 0 0 1 35 Edward Brooke CS 3 0 0 0 0 0 3 KIPP Academy Lynn CS 4 0 0 0 0 0 4 Innovation Academy CS 1 0 0 0 0 0 1 Community CS of Cambridge 3 0 0 5 0 2 10 City On A Hill CS 3 0 0 0 0 1 4 Codman Academy CS 1 0 0 0 0 0 1 Conservatory Lab Charter (District) 14 4 0 0 0 3 21 Community Day CS 96 0 0 2 0 0 98 Sabis International CS 17 0 0 0 4 4 25 Neighborhood House CS 3 0 1 1 3 1 9 Abby Kelley Foster CS 12 5 0 0 0 11 28 Foxborough Reg CS 2 0 0 5 0 22 29 Hilltown Cooperative CS 0 0 0 0 0 1 1 EM Kennedy Acad Health Careers HMCS 1 0 1 0 0 0 2 Holyoke Com CS 32 0 0 0 0 0 32 Lawrence Family Development CS 251 0 0 0 0 1 252 Hill View Montessori CS 6 0 0 0 0 1 7 Lowell Community CS 100 19 0 4 3 121 247 Marthas Vineyard CS 0 3 0 0 0 1 4 New Leadership Charter 3 0 0 0 0 1 4 North Central Charter Essential 2 0 0 0 0 1 3 Silver Hill Horace Mann Charter 25 1 0 1 0 4 31 Pioneer Valley Performing Arts CS 1 0 0 0 0 0 1 Boston Renaissance CS 43 1 2 4 1 7 58 Roxbury Preparatory CS 3 0 3 0 0 0 6 Salem Academy CS 13 0 0 0 0 3 16 Seven Hills CS 89 0 0 0 0 21 110 Prospect Hill Academy CS 9 4 0 11 0 5 29 MLK Jr CS of Excellence 19 0 0 1 0 0 20 Phoenix Charter Academy 23 0 0 1 0 1 25
57
District Name Spanish Portuguese Cape
Verdean Creole Haitian Vietnamese Other LEP
Pioneer Charter School of Science 2 3 0 2 0 0 7 Global Learning Charter Public 1 0 0 0 0 0 1 Pioneer Valley Chinese Imm CS 0 0 0 0 0 1 1 Acton-Boxborough 4 6 0 0 0 10 20 Adams-Cheshire 0 0 0 0 0 3 3 Amherst-Pelham 24 3 3 0 1 36 67 Ashburnham-Westminster 8 0 0 2 0 5 15 Athol-Royalston 8 0 0 0 0 7 15 Berkshire Hills 23 0 0 0 0 6 29 Berlin-Boylston 0 0 0 0 0 1 1 Blackstone-Millville 4 1 0 0 0 6 11 Bridgewater-Raynham 2 2 0 2 1 15 22 Central Berkshire 0 0 0 0 0 1 1 Concord-Carlisle 0 0 0 1 0 2 3 Dennis-Yarmouth 34 62 1 13 3 33 146 Dighton-Rehoboth 5 1 0 0 0 2 8 Dover-Sherborn 0 1 0 0 0 2 3 Dudley-Charlton Reg 14 4 0 0 0 32 50 Nauset 5 1 0 0 0 7 13 Freetown-Lakeville 0 1 0 0 0 0 1 Frontier 3 1 0 0 1 4 9 Gateway 1 0 0 0 0 10 11 Groton-Dunstable 6 1 0 0 0 4 11 Gill-Montague 24 0 0 1 0 20 45 Hamilton-Wenham 0 1 0 0 0 42 43 Hampden-Wilbraham 1 0 0 0 2 21 24 Hawlemont 0 1 0 0 0 0 1 King Philip 1 0 0 0 0 1 2 Lincoln-Sudbury 0 0 0 0 0 4 4 Manchester Essex Regional 0 0 0 0 0 3 3 Marthas Vineyard 0 16 0 0 0 0 16
58
District Name Spanish Portuguese Cape
Verdean Creole Haitian Vietnamese Other LEP
0 Masconomet 0 0 0 0 2 2 Mendon-Upton 1 1 0 0 0 8 10 Mount Greylock 0 0 0 0 0 2 2 Mohawk Trail 0 0 0 0 2 5 7 Narragansett 0 0 0 0 0 3 3 Nashoba 7 4 0 1 0 5 17 Northboro-Southboro 1 1 0 1 0 4 7 North Middlesex 11 1 0 0 0 4 16 Old Rochester 0 0 0 0 0 1 1 Pentucket 1 0 0 0 0 2 3 Quabbin 0 0 0 0 0 4 4 Ralph C Mahar 1 0 0 0 0 7 8 Silver Lake 0 0 0 0 0 1 1 Southern Berkshire 4 0 0 0 0 0 4 Southwick-Tolland 0 0 0 0 0 14 14 Spencer-E Brookfield 5 0 0 0 0 2 7 Triton 4 2 0 0 10 8 24 Up-Island Regional 2 1 0 0 0 2 5 Wachusett 3 3 0 0 7 34 47 Quaboag Regional 0 0 0 0 0 1 1 Whitman-Hanson 5 1 0 0 0 3 9 Assabet Valley Reg Voc Tech 8 1 0 0 0 0 9 Blue Hills Regional Vocational Technical 1 2 0 2 0 0 5 Bristol-Plymouth Reg Voc Tech 0 2 0 0 0 0 2 Cape Cod Reg Voc Tech 2 2 0 0 0 1 5 Greater Fall River Reg Voc Tech 1 1 0 0 0 0 2 Greater Lawrence Reg Voc Tech 33 0 0 0 0 1 34 GrNew Bedford Reg Voc Tech 14 6 0 0 0 0 20 Greater Lowell Reg Voc Tech 20 8 0 0 0 18 46 South Middlesex Reg Voc Tech 23 14 0 0 0 3 40 Minuteman Reg Voc Tech 2 0 0 0 0 1 3
59
60
District Name Spanish Portuguese Cape
Verdean Creole Haitian Vietnamese Other LEP
Montachusett Reg Voc Tech 4 0 0 0 0 4 8 Northeast Metro Reg Voc Tech 55 0 0 0 0 2 57 North Shore Reg Voc Tech 3 0 0 0 0 0 3 Southeastern Reg Voc Tech 0 2 3 3 0 1 9 Southern Worcester County Reg Voc Tech 3 0 0 0 0 1 4 Tri County Reg Voc Tech 0 1 0 0 0 0 1 Whittier Reg Voc Tech 6 0 0 0 0 0 6 TOTALS 31793 4209 2458 2433 2423 15842 59158
Source The Department Student Information Management System 2009
- Introduction
-
- Background
-
- I English Language Learners in Massachusetts
- II Educators Implementing Sheltered English Immersion Elementary and Secondary Content Teachers of English Language Learners
-
- Research on Professional Development for Educators of English Language Learners
- Gaps in Knowledge
-
- III Use of Funds for Category Training
-
- Future Need for Category Training
-
- IV Educators Implementing Sheltered English Immersion English as a Second Language (ESL) Teachers
-
- ESL Teacher Shortage
-
- V Use of Funds ESL Teachers and ESL Curriculum Development
-
- Massachusetts English Language Teacher Initiative (MELT)
- Improvement of Sheltered English Immersion Content-based ESL Instruction
- Future Need for ESL teachers
-
- VI Budget
- Attachments
-
- Attachment 1 All Massachusetts public school districts and changes in LEP population compared to changes in overall student population - SY 2006-SY 2010
- Attachment 1 Massachusetts public school districts and changes in LEP population compared to changes in overall student population - SY 2006-SY 2010
- Attachment 2 Massachusetts public school districts with large changes in LEP population compared to changes in overall student population - SY 2006-SY 2010
- Attachment 3 Bibliography Professional Development for Teachers of English Language Learners
- Attachment 4 Excerpts from the Commissionerrsquos Memorandum of June 2004 Guidance on Qualifications for Teachers of Limited English Proficient Students in Sheltered English Immersion Classrooms
- Attachment 5 Districts Receiving Sheltered English Immersion Professional Development 2004-2010
- Attachment 6 Collaboratives that have received grants for Sheltered English Immersion Professional Development 2004-2010
- Attachment 7 English Language Learners in Massachusetts District and Program Type October 2009
- Attachment 8 English Language Learners in Massachusetts District and First Language October 2009
-

District Name No ELL
Program Sheltered English
Immersion Two-Way Bilingual
Other Bilingual Education
Parental Opt Out
Total LEP Population
Lanesborough 0 0 0 0 2 2 Lawrence 0 2835 0 0 0 2835 Lee 0 18 0 0 0 18 Leicester 4 16 1 0 0 21 Lenox 0 7 0 0 0 7 Leominster 0 398 0 0 0 398 Leverett 0 0 0 0 0 0 Lexington 0 286 0 0 10 296 Lincoln 0 26 0 0 0 26 Littleton 2 13 0 0 0 15 Longmeadow 1 36 0 0 2 39 Lowell 17 4228 0 3 73 4321 Ludlow 0 42 0 0 0 42 Lunenburg 1 9 0 0 0 10 Lynn 1 3071 0 35 358 3465 Lynnfield 0 4 0 0 0 4 Malden 0 675 12 0 19 706 Mansfield 0 44 0 0 0 44 Marblehead 18 1 0 0 0 19 Marion 0 1 0 0 0 1 Marlborough 68 441 0 0 0 509 Marshfield 4 15 1 0 3 23 Mashpee 3 15 0 0 0 18 Mattapoisett 0 2 0 0 0 2 Maynard 0 33 0 0 0 33 Medfield 0 6 0 0 0 6 Medford 0 299 0 0 0 299 Medway 0 8 0 0 0 8 Melrose 43 32 1 0 0 76 Methuen 0 408 0 0 5 413 Middleborough 0 13 0 0 0 13 Middleton 0 13 0 0 0 13 Milford 0 227 0 0 0 227 Millbury 11 2 0 0 0 13
41
District Name No ELL
Program Sheltered English
Immersion Two-Way Bilingual
Other Bilingual Education
Parental Opt Out
Total LEP Population
Millis 2 0 0 0 0 2 Milton 2 32 0 0 0 34 Monson 0 10 0 0 0 10 Nahant 0 0 0 0 0 0 Nantucket 5 61 0 0 1 67 Natick 1 35 0 0 0 36 Needham 0 50 0 0 0 50 New Bedford 0 461 0 0 0 461 Newburyport 0 12 0 0 0 12 Newton 7 680 0 0 1 688 Norfolk 0 0 0 0 0 0 North Adams 0 28 0 0 0 28 Northampton 0 50 0 0 0 50 North Andover 0 45 0 0 4 49 North Attleborough 0 38 0 0 0 38 Northborough 0 66 0 0 0 66 Northbridge 0 12 0 0 0 12 North Brookfield 0 3 0 0 0 3 North Reading 0 11 0 0 0 11 Norton 0 5 0 0 0 5 Norwell 1 2 0 0 0 3 Norwood 2 169 0 0 4 175 Oak Bluffs 20 0 0 0 0 20 Orange 0 0 0 0 0 0 Orleans 0 2 0 0 0 2 Oxford 0 5 0 0 0 5 Palmer 3 14 0 0 0 17 Peabody 0 356 0 0 0 356 Pelham 0 0 0 0 0 0 Pembroke 0 0 0 0 0 0 Petersham 0 0 0 0 0 0 Pittsfield 0 233 0 0 0 233 Plainville 0 0 0 0 0 0 Plymouth 2 45 0 0 0 47
42
District Name No ELL
Program Sheltered English
Immersion Two-Way Bilingual
Other Bilingual Education
Parental Opt Out
Total LEP Population
Plympton 0 0 0 0 0 0 Provincetown 0 7 0 0 0 7 Quincy 0 1044 0 0 0 1044 Randolph 4 179 1 0 0 184 Reading 0 16 0 0 0 16 Revere 2 623 0 0 0 625 Richmond 0 0 0 0 0 0 Rochester 0 0 0 0 0 0 Rockland 0 28 0 0 0 28 Rockport 0 5 0 0 0 5 Rowe 0 0 0 0 0 0 Salem 6 418 72 0 11 507 Sandwich 0 0 0 0 1 1 Saugus 18 50 0 0 0 68 Savoy 0 0 0 0 0 0 Scituate 0 14 0 0 0 14 Seekonk 0 23 0 0 0 23 Sharon 0 44 0 0 0 44 Sherborn 0 1 0 0 0 1 Shirley 0 5 0 0 0 5 Shrewsbury 0 144 0 0 0 144 Shutesbury 0 0 0 0 0 0 Somerset 1 0 0 1 0 2 Somerville 6 612 124 35 0 777 Southampton 0 3 0 0 0 3 Southborough 0 47 0 0 0 47 Southbridge 6 225 0 0 1 232 South Hadley 14 1 0 0 0 15 Springfield 0 2926 0 0 362 3288 Stoneham 0 58 0 0 0 58 Stoughton 0 129 0 0 37 166 Sturbridge 0 3 0 0 0 3 Sudbury 0 18 0 0 0 18 Sunderland 0 3 0 0 0 3
43
District Name No ELL
Program Sheltered English
Immersion Two-Way Bilingual
Other Bilingual Education
Parental Opt Out
Total LEP Population
Sutton 0 0 0 0 0 0 Swampscott 25 27 0 0 0 52 Swansea 0 10 0 0 0 10 Taunton 0 159 0 0 0 159 Tewksbury 0 12 0 0 0 12 Tisbury 0 28 0 0 0 28 Topsfield 2 0 0 0 0 2 Truro 0 0 0 0 0 0 Tyngsborough 0 0 0 0 0 0 Uxbridge 0 28 1 0 1 30 Wakefield 0 17 0 0 1 18 Wales 0 0 0 0 1 1 Walpole 0 82 0 0 0 82 Waltham 1 383 0 0 91 475 Ware 0 11 0 0 0 11 Wareham 1 14 0 0 2 17 Watertown 1 264 0 0 3 268 Wayland 0 13 0 0 2 15 Webster 1 48 0 0 0 49 Wellesley 1 53 0 0 17 71 Wellfleet 0 0 0 0 0 0 Westborough 2 253 0 0 1 256 West Boylston 0 3 0 0 0 3 West Bridgewater 0 2 0 0 0 2 Westfield 25 185 0 0 1 211 Westford 0 31 0 0 2 33 Westhampton 0 0 0 0 0 0 Weston 0 51 0 0 0 51 Westport 0 15 0 0 0 15 West Springfield 0 276 0 0 0 276 Westwood 6 25 0 0 0 31 Weymouth 0 101 0 0 3 104 Whately 0 0 0 0 0 0 Williamsburg 0 0 0 0 2 2
44
District Name No ELL
Program Sheltered English
Immersion Two-Way Bilingual
Other Bilingual Education
Parental Opt Out
Total LEP Population
Williamstown 0 9 0 0 0 9 Wilmington 0 22 0 0 0 22 Winchendon 0 11 0 0 0 11 Winchester 1 140 0 0 0 141 Winthrop 0 66 0 0 0 66 Woburn 1 195 0 0 0 196 Worcester 206 5922 27 177 56 6388 Wrentham 7 1 0 0 0 8 Northampton-Smith Voc Agr 0 0 0 5 0 5 Excel Academy CS 4 5 0 0 0 9 Four Rivers Charter Public 0 5 0 0 0 5 Berkshire Arts and TechCS 0 0 0 0 0 0 Amesbury Academy CS 0 0 0 0 0 0 Boston Preparatory CS 0 0 0 0 0 0 Christa McAuliffe Reg 0 5 0 0 0 5 Smith Leadership Academy CS 0 0 0 0 2 2 Benjamin Banneker CS 0 1 0 0 0 1 Barnstable Horace Mann CS 0 22 0 0 0 22 Boston Day and Eve CS 4 25 1 1 0 31 Barnstable Com Hrce Mann CS 0 35 0 0 0 35 Edward Brooke Charter 0 3 0 0 0 3 KIPP Academy Lynn Charter 0 3 0 0 1 4 Advanced Math and Science CS 0 0 0 0 0 0 Cape Cod Lighthouse Charter 0 0 0 0 0 0 Innovation Academy Charter 0 1 0 0 0 1 Community CS of Cambridge 0 7 0 0 3 10 City On A Hill Charter Public 0 4 0 0 0 4 Codman Academy CS 1 0 0 0 0 1 Conservatory Lab Charter 0 21 0 0 0 21 Community Day Charter Public 0 98 0 0 0 98 Sabis International Charter 25 0 0 0 0 25 Neighborhood House Charter 0 9 0 0 0 9 Abby Kelley Foster CS 0 27 0 0 1 28 Foxborough Regional CS 0 29 0 0 0 29
45
District Name No ELL
Program Sheltered English
Immersion Two-Way Bilingual
Other Bilingual Education
Parental Opt Out
Total LEP Population
Benjamin Franklin Classical CS 0 0 0 0 0 0 Boston Collegiate Charter 0 0 0 0 0 0 Hilltown Cooperative CS 0 1 0 0 0 1 Robert M Hughes Acad CS 0 0 0 0 0 0 EM Kennedy Acad Health Careers Horace Mann CS 0 2 0 0 0 2 Holyoke Community Charter 0 32 0 0 0 32 Lawrence Family Dev CS 0 0 252 0 0 252 Hill View Montessori CS 0 7 0 0 0 7 Lowell Community CS 0 247 0 0 0 247 Lowell Middlesex Acad CS 0 0 0 0 0 0 Marblehead Community CS 0 0 0 0 0 0 Marthas Vineyard CS 0 4 0 0 0 4 Ma Acad for Math and Science 0 0 0 0 0 0 MATCH Charter Public High 0 0 0 0 0 0 Mystic Valley Regional Charter 0 0 0 0 0 0 New Leadership Charter 0 4 0 0 0 4 North Central Charter Essential 0 3 0 0 0 3 Dorchester Collegiate Acad CS 0 0 0 0 0 0 Silver Hill Horace Mann Charter 0 31 0 0 0 31 Francis W Parker Ch Essential 0 0 0 0 0 0 Pioneer Valley Perf Arts CS 0 1 0 0 0 1 Boston Renaissance CS 0 58 0 0 0 58 River Valley Charter 0 0 0 0 0 0 Rising Tide Charter Public 0 0 0 0 0 0 Roxbury Preparatory Charter 0 6 0 0 0 6 Salem Academy Charter 0 16 0 0 0 16 Seven Hills Charter Public 0 108 0 0 2 110 Prospect Hill Academy Charter 0 29 0 0 0 29 South Shore Charter Public 0 0 0 0 0 0 Sturgis Charter Public 0 0 0 0 0 0 Atlantis Charter 0 0 0 0 0 0 MLK Jr CS of Excellence 0 20 0 0 0 20 Phoenix Charter Academy 0 25 0 0 0 25 Pioneer CS of Science 0 7 0 0 0 7
46
District Name No ELL
Program Sheltered English
Immersion Two-Way Bilingual
Other Bilingual Education
Parental Opt Out
Total LEP Population
29
Global Learning Charter Public 1 0 0 0 0 1 Pioneer Valley Chinese Imm CS 0 0 0 0 1 1 Hampden CS of Science 0 0 0 0 0 0 Acton-Boxborough 0 20 0 0 0 20 Adams-Cheshire 0 3 0 0 0 3 Amherst-Pelham 0 67 0 0 0 67 Ashburnham-Westminster 0 15 0 0 0 15 Athol-Royalston 0 13 0 2 0 15 Berkshire Hills 0 0 0 0 29 Berlin-Boylston 0 1 0 0 0 1 Blackstone-Millville 0 10 0 0 1 11 Bridgewater-Raynham 13 9 0 0 0 22 Chesterfield-Goshen 0 0 0 0 0 0 Central Berkshire 1 0 0 0 0 1 Concord-Carlisle 0 3 0 0 0 3 Dennis-Yarmouth 0 146 0 0 0 146 Dighton-Rehoboth 0 8 0 0 0 8 Dover-Sherborn 0 3 0 0 0 3 Dudley-Charlton Reg 2 47 0 0 1 50 Nauset 3 10 0 0 0 13 Farmington River Reg 0 0 0 0 0 0 Freetown-Lakeville 1 0 0 0 0 1 Frontier 0 9 0 0 0 9 Gateway 0 11 0 0 0 11 Groton-Dunstable 0 11 0 0 0 11 Gill-Montague 43 2 0 0 0 45 Hamilton-Wenham 35 5 0 1 2 43 Hampden-Wilbraham 0 24 0 0 0 24 Hampshire 0 0 0 0 0 0 Hawlemont 0 0 1 0 0 1 King Philip 0 2 0 0 0 2 Lincoln-Sudbury 0 4 0 0 0 4 Manchester Essex Regional 0 3 0 0 0 3 Marthas Vineyard 0 16 0 0 0 16
47
District Name No ELL
Program Sheltered English
Immersion Two-Way Bilingual
Other Bilingual Education
Parental Opt Out
Total LEP Population
Masconomet 2 0 0 0 0 2 Mendon-Upton 0 10 0 0 0 10 Mount Greylock 0 2 0 0 0 2 Mohawk Trail 2 4 1 0 0 7 Narragansett 0 3 0 0 0 3 Nashoba 0 17 0 0 0 17 New Salem-Wendell 0 0 0 0 0 0 Northboro-Southboro 1 6 0 0 0 7 North Middlesex 7 5 0 0 4 16 Old Rochester 1 0 0 0 0 1 Pentucket 0 3 0 0 0 3 Pioneer Valley 0 0 0 0 0 0 Quabbin 1 1 0 0 2 4 Ralph C Mahar 1 7 0 0 0 8 Silver Lake 1 0 0 0 0 1 Southern Berkshire 0 4 0 0 0 4 Southwick-Tolland 0 14 0 0 0 14 Spencer-E Brookfield 0 7 0 0 0 7 Tantasqua 0 0 0 0 0 0 Triton 0 24 0 0 0 24 Up-Island Regional 0 5 0 0 0 5 Wachusett 0 47 0 0 0 47 Quaboag Regional 0 1 0 0 0 1 Whitman-Hanson 0 9 0 0 0 9 Assabet Valley Reg Voc Tech 0 9 0 0 0 9 Blackstone Val Reg Voc Tech 0 0 0 0 0 0 Blue Hills Regional Voc Tech 0 5 0 0 0 5 Bristol-Plym Reg Voc Tech 0 2 0 0 0 2 Cape Cod Regional Voc Tech 0 5 0 0 0 5 Franklin County Reg Voc Tech 0 0 0 0 0 0 Grtr Fall River Reg Voc Tech 2 0 0 0 0 2 Grtr Lawrence Reg Voc Tech 0 31 2 0 1 34 Grtr Nw Bdfrd Reg Voc Tech 0 20 0 0 0 20 Grtr Lowell Reg Voc Tech 0 46 0 0 0 46
48
District Name No ELL
Program Sheltered English
Immersion Two-Way Bilingual
Other Bilingual Education
Parental Opt Out
Total LEP Population
S Middlesex Reg Voc Tech 0 40 0 0 0 40 Minuteman Reg Voc Tech 0 3 0 0 0 3 Montachusett Reg Voc Tech 0 8 0 0 0 8 N Berkshire Reg Voc Tech 0 0 0 0 0 0 Nashoba Valley Reg Voc 0 0 0 0 0 0 NE Metro Reg Voc Tech 0 57 0 0 0 57 North Shore Reg Voc Tech 0 3 0 0 0 3 Old Colony Reg Voc Tech 0 0 0 0 0 0 Pathfinder Reg Voc Tech 0 0 0 0 0 0 Shawsheen Val Reg Voc Tech 0 0 0 0 0 0 Southeastern Reg Voc Tech 0 9 0 0 0 9 South Shore Reg Voc Tech 0 0 0 0 0 0 S Worcester C Reg Voc Tech 1 0 0 3 0 4 Tri County Reg Voc Tech 0 1 0 0 0 1 Uppr Cape Cod Reg Voc Tech 0 0 0 0 0 0 Whittier Reg Voc Tech 0 6 0 0 0 6 Bristol County Agricultural 0 0 0 0 0 0 Essex Agricultural Technical 0 0 0 0 0 0 Norfolk County Agricultural 0 0 0 0 0 0 TOTALS 1113 49096 1229 1342 6378 59158
Source The Department Student Information Management System 2009
49
Attachment 8 English Language Learners in Massachusetts District and First Language October 2009
District Name Spanish Portuguese Cape
Verdean Creole Haitian Vietnamese Other LEP
Abington 3 3 0 0 0 4 10 Acton 8 7 0 0 0 66 81 Acushnet 0 1 0 0 0 0 1 Agawam 15 0 0 0 1 81 97 Amesbury 5 8 0 0 0 8 21 Amherst 60 4 2 0 2 107 175 Andover 12 3 0 0 1 67 83 Arlington 26 17 2 11 1 135 192 Ashland 9 35 0 0 1 22 67 Attleboro 170 9 1 1 2 84 267 Auburn 12 5 0 3 12 24 56 Avon 0 0 0 1 0 0 1 Ayer 36 13 0 0 0 11 60 Barnstable 39 111 0 2 0 24 176 Bedford 9 0 0 0 2 38 49 Belchertown 7 1 0 0 1 15 24 Bellingham 8 3 0 0 3 13 27 Belmont 5 2 0 0 0 85 92 Berlin 0 1 0 0 0 0 1 Beverly 6 8 0 0 1 24 39 Billerica 13 6 0 2 3 57 81 Boston 6434 210 900 947 723 2057 11271 Bourne 1 0 0 0 0 0 1 Boxborough 1 2 0 0 0 3 6 Boxford 1 0 0 0 0 3 4 Boylston 1 0 0 0 1 8 10 Braintree 13 3 4 1 13 77 111 Brewster 6 0 0 0 0 3 9 Brockton 484 131 1465 453 37 167 2737
50
District Name Spanish Portuguese Cape
Verdean Creole Haitian Vietnamese Other LEP
Brookline 43 16 2 2 6 427 496 Burlington 2 3 0 2 0 57 64 Cambridge 58 23 6 67 2 147 303 Canton 4 1 0 3 5 23 36 Carlisle 0 0 0 0 0 11 11 Carver 0 0 0 0 0 2 2 Chatham 10 2 0 3 0 4 19 Chelmsford 9 5 0 0 8 82 104 Chelsea 766 29 2 13 9 103 922 Chicopee 201 4 0 0 1 148 354 Clinton 106 17 0 11 0 10 144 Concord 13 1 0 0 2 20 36 Danvers 4 0 0 1 0 11 16 Dartmouth 2 19 0 0 0 18 39 Dedham 47 3 0 13 9 42 114 Deerfield 4 0 0 0 2 1 7 Douglas 0 2 0 0 0 1 3 Dover 0 0 0 2 0 7 9 Dracut 13 6 0 0 0 24 43 Eastham 1 0 0 0 0 0 1 Easthampton 12 0 0 0 1 27 40 East Longmeadow 0 0 0 0 0 2 2 Easton 4 7 1 3 4 18 37 Edgartown 2 24 0 0 0 0 26 Everett 308 119 1 96 12 44 580 Fairhaven 1 2 0 0 0 0 3 Fall River 297 122 16 2 10 67 514 Falmouth 5 12 0 0 4 23 44 Fitchburg 487 2 0 2 11 91 593 Foxborough 5 3 0 0 1 5 14 Framingham 589 553 0 17 3 109 1271
51
District Name Spanish Portuguese Cape
Verdean Creole Haitian Vietnamese Other LEP
Franklin 13 5 0 1 4 32 55 Gardner 80 1 0 3 2 9 95 Georgetown 0 0 0 0 0 2 2 Gloucester 38 20 0 0 4 13 75 Grafton 3 0 0 0 0 11 14 Granby 3 0 0 0 0 10 13 Greenfield 18 0 0 0 1 35 54 Hadley 8 0 0 0 0 8 16 Hanover 1 0 0 0 1 6 8 Harvard 1 0 0 0 0 1 2 Harwich 12 3 0 8 1 24 48 Haverhill 407 11 0 3 7 33 461 Hingham 0 1 0 0 0 9 10 Holbrook 8 4 0 5 1 8 26 Holland 0 1 0 0 0 0 1 Holliston 7 14 0 0 0 16 37 Holyoke 1361 0 0 0 2 14 1377 Hopedale 2 2 0 0 0 5 9 Hopkinton 7 1 0 0 0 30 38 Hudson 32 67 0 1 1 13 114 Hull 0 1 1 0 0 1 3 Ipswich 5 3 0 0 0 10 18 Kingston 0 2 0 0 0 1 3 Lanesborough 0 0 0 0 0 2 2 Lawrence 2732 3 0 5 32 63 2835 Lee 13 1 0 0 0 4 18 Leicester 7 0 0 0 6 8 21 Lenox 1 0 0 0 0 6 7 Leominster 277 44 0 2 3 72 398 Lexington 21 5 0 4 0 266 296 Lincoln 4 0 0 1 0 21 26
52
District Name Spanish Portuguese Cape
Verdean Creole Haitian Vietnamese Other LEP
Littleton 1 3 1 0 0 10 15 Longmeadow 5 2 0 0 1 31 39 Lowell 1595 324 3 14 131 2254 4321 Ludlow 6 11 0 0 0 25 42 Lunenburg 2 4 0 0 0 4 10 Lynn 2662 30 1 67 62 643 3465 Lynnfield 1 0 0 0 0 3 4 Malden 120 99 0 116 51 320 706 Mansfield 10 6 0 0 0 28 44 Marblehead 3 1 0 0 0 15 19 Marion 0 0 0 0 0 1 1 Marlborough 261 211 0 2 4 31 509 Marshfield 3 11 0 0 0 9 23 Mashpee 0 0 0 0 1 17 18 Mattapoisett 0 0 0 0 0 2 2 Maynard 14 11 0 2 0 6 33 Medfield 0 2 0 0 0 4 6 Medford 28 80 0 96 12 83 299 Medway 3 0 0 1 0 4 8 Melrose 4 5 0 7 2 58 76 Methuen 340 3 0 7 11 52 413 Middleborough 7 0 0 0 1 5 13 Middleton 2 1 0 0 0 10 13 Milford 100 101 0 0 2 24 227 Millbury 2 4 0 0 3 4 13 Millis 0 0 0 0 0 2 2 Milton 3 3 0 15 3 10 34 Monson 0 0 0 0 0 10 10 Nantucket 60 5 0 0 0 2 67 Natick 4 2 0 0 2 28 36 Needham 13 1 2 1 1 32 50
53
District Name Spanish Portuguese Cape
Verdean Creole Haitian Vietnamese Other LEP
New Bedford 289 31 1 2 5 133 461 Newburyport 4 3 0 0 0 5 12 Newton 112 22 0 7 11 536 688 North Adams 19 2 0 0 0 7 28 Northampton 40 0 0 0 0 10 50 North Andover 18 1 0 0 4 26 49 North Attleborough 19 0 0 0 1 18 38 Northborough 16 13 0 0 0 37 66 Northbridge 6 0 0 0 0 6 12 North Brookfield 0 0 0 0 0 3 3 North Reading 2 0 0 0 0 9 11 Norton 0 0 0 0 0 5 5 Norwell 2 0 0 0 0 1 3 Norwood 38 39 0 11 5 82 175 Oak Bluffs 0 19 0 0 0 1 20 Orleans 0 0 0 0 0 2 2 Oxford 3 0 0 0 0 2 5 Palmer 4 2 0 0 0 11 17 Peabody 175 100 0 0 11 70 356 Pittsfield 168 1 0 0 8 56 233 Plymouth 9 26 0 1 2 9 47 Provincetown 7 0 0 0 0 0 7 Quincy 41 31 0 6 126 840 1044 Randolph 17 6 3 71 54 33 184 Reading 1 3 0 0 1 11 16 Revere 392 39 0 8 31 155 625 Rockland 3 22 0 0 2 1 28 Rockport 1 0 0 0 0 4 5 Salem 430 9 0 5 7 56 507 Sandwich 0 0 0 0 0 1 1 Saugus 22 15 0 6 6 19 68
54
District Name Spanish Portuguese Cape
Verdean Creole Haitian Vietnamese Other LEP
Scituate 1 5 6 0 0 2 14 Seekonk 5 1 0 0 2 15 23 Sharon 1 0 0 5 6 32 44 Sherborn 0 0 0 0 0 1 1 Shirley 2 1 0 0 0 2 5 Shrewsbury 15 39 0 0 6 84 144 Somerset 0 0 0 0 0 2 2 Somerville 372 170 5 73 5 152 777 Southampton 1 0 0 0 0 2 3 Southborough 5 4 0 0 0 38 47 Southbridge 219 0 0 0 0 13 232 South Hadley 11 0 0 0 1 3 15 Springfield 2970 2 0 4 87 225 3288 Stoneham 17 11 0 1 3 26 58 Stoughton 21 60 8 17 9 51 166 Sturbridge 1 2 0 0 0 0 3 Sudbury 8 2 0 0 1 7 18 Sunderland 2 0 0 0 0 1 3 Swampscott 8 4 1 2 2 35 52 Swansea 3 2 0 0 0 5 10 Taunton 72 43 5 9 1 29 159 Tewksbury 2 1 0 0 2 7 12 Tisbury 0 26 0 0 0 2 28 Topsfield 0 0 0 0 0 2 2 Uxbridge 11 3 0 0 0 16 30 Wakefield 8 2 0 0 2 6 18 Wales 0 0 0 0 0 1 1 Walpole 18 14 0 13 1 36 82 Waltham 333 27 0 26 3 86 475 Ware 7 0 0 0 0 4 11 Wareham 4 2 0 0 2 9 17
55
District Name Spanish Portuguese Cape
Verdean Creole Haitian Vietnamese Other LEP
Watertown 52 32 0 2 0 182 268 Wayland 1 0 0 0 0 14 15 Webster 32 4 0 0 1 12 49 Wellesley 16 0 0 0 0 55 71 Westborough 43 38 0 1 0 174 256 West Boylston 0 1 0 0 0 2 3 West Bridgewater 0 0 0 2 0 0 2 Westfield 34 0 0 0 0 177 211 Westford 3 0 0 1 2 27 33 Weston 5 0 1 3 1 41 51 Westport 1 9 0 0 4 1 15 West Springfield 29 2 0 0 3 242 276 Westwood 3 0 0 0 0 28 31 Weymouth 12 49 0 1 4 38 104 Williamsburg 0 2 0 0 0 0 2 Williamstown 2 3 0 0 0 4 9 Wilmington 1 3 0 0 4 14 22 Winchendon 4 2 0 0 0 5 11 Winchester 10 10 0 2 2 117 141 Winthrop 18 9 0 1 0 38 66 Woburn 27 44 0 8 8 109 196 Worcester 3636 297 4 44 703 1704 6388 Wrentham 2 3 0 0 0 3 8 Northampton-Smith Voc Agr 5 0 0 0 0 0 5 Excel Academy CS 9 0 0 0 0 0 9 Academy Of the Pacific Rim CS 3 1 0 1 0 0 5 Boston Preparatory CS 3 0 0 2 0 0 5 Christa McAuliffe Regional CS 2 0 0 0 0 0 2 Smith Leadership Academy CS 1 0 0 0 0 0 1 Benjamin Banneker CS 5 0 0 16 0 1 22 Barnstable Horace Mann CS 6 16 0 0 0 9 31
56
District Name Spanish Portuguese Cape
Verdean Creole Haitian Vietnamese Other LEP
Barnstable Com Horace Mann CS 17 17 0 0 0 1 35 Edward Brooke CS 3 0 0 0 0 0 3 KIPP Academy Lynn CS 4 0 0 0 0 0 4 Innovation Academy CS 1 0 0 0 0 0 1 Community CS of Cambridge 3 0 0 5 0 2 10 City On A Hill CS 3 0 0 0 0 1 4 Codman Academy CS 1 0 0 0 0 0 1 Conservatory Lab Charter (District) 14 4 0 0 0 3 21 Community Day CS 96 0 0 2 0 0 98 Sabis International CS 17 0 0 0 4 4 25 Neighborhood House CS 3 0 1 1 3 1 9 Abby Kelley Foster CS 12 5 0 0 0 11 28 Foxborough Reg CS 2 0 0 5 0 22 29 Hilltown Cooperative CS 0 0 0 0 0 1 1 EM Kennedy Acad Health Careers HMCS 1 0 1 0 0 0 2 Holyoke Com CS 32 0 0 0 0 0 32 Lawrence Family Development CS 251 0 0 0 0 1 252 Hill View Montessori CS 6 0 0 0 0 1 7 Lowell Community CS 100 19 0 4 3 121 247 Marthas Vineyard CS 0 3 0 0 0 1 4 New Leadership Charter 3 0 0 0 0 1 4 North Central Charter Essential 2 0 0 0 0 1 3 Silver Hill Horace Mann Charter 25 1 0 1 0 4 31 Pioneer Valley Performing Arts CS 1 0 0 0 0 0 1 Boston Renaissance CS 43 1 2 4 1 7 58 Roxbury Preparatory CS 3 0 3 0 0 0 6 Salem Academy CS 13 0 0 0 0 3 16 Seven Hills CS 89 0 0 0 0 21 110 Prospect Hill Academy CS 9 4 0 11 0 5 29 MLK Jr CS of Excellence 19 0 0 1 0 0 20 Phoenix Charter Academy 23 0 0 1 0 1 25
57
District Name Spanish Portuguese Cape
Verdean Creole Haitian Vietnamese Other LEP
Pioneer Charter School of Science 2 3 0 2 0 0 7 Global Learning Charter Public 1 0 0 0 0 0 1 Pioneer Valley Chinese Imm CS 0 0 0 0 0 1 1 Acton-Boxborough 4 6 0 0 0 10 20 Adams-Cheshire 0 0 0 0 0 3 3 Amherst-Pelham 24 3 3 0 1 36 67 Ashburnham-Westminster 8 0 0 2 0 5 15 Athol-Royalston 8 0 0 0 0 7 15 Berkshire Hills 23 0 0 0 0 6 29 Berlin-Boylston 0 0 0 0 0 1 1 Blackstone-Millville 4 1 0 0 0 6 11 Bridgewater-Raynham 2 2 0 2 1 15 22 Central Berkshire 0 0 0 0 0 1 1 Concord-Carlisle 0 0 0 1 0 2 3 Dennis-Yarmouth 34 62 1 13 3 33 146 Dighton-Rehoboth 5 1 0 0 0 2 8 Dover-Sherborn 0 1 0 0 0 2 3 Dudley-Charlton Reg 14 4 0 0 0 32 50 Nauset 5 1 0 0 0 7 13 Freetown-Lakeville 0 1 0 0 0 0 1 Frontier 3 1 0 0 1 4 9 Gateway 1 0 0 0 0 10 11 Groton-Dunstable 6 1 0 0 0 4 11 Gill-Montague 24 0 0 1 0 20 45 Hamilton-Wenham 0 1 0 0 0 42 43 Hampden-Wilbraham 1 0 0 0 2 21 24 Hawlemont 0 1 0 0 0 0 1 King Philip 1 0 0 0 0 1 2 Lincoln-Sudbury 0 0 0 0 0 4 4 Manchester Essex Regional 0 0 0 0 0 3 3 Marthas Vineyard 0 16 0 0 0 0 16
58
District Name Spanish Portuguese Cape
Verdean Creole Haitian Vietnamese Other LEP
0 Masconomet 0 0 0 0 2 2 Mendon-Upton 1 1 0 0 0 8 10 Mount Greylock 0 0 0 0 0 2 2 Mohawk Trail 0 0 0 0 2 5 7 Narragansett 0 0 0 0 0 3 3 Nashoba 7 4 0 1 0 5 17 Northboro-Southboro 1 1 0 1 0 4 7 North Middlesex 11 1 0 0 0 4 16 Old Rochester 0 0 0 0 0 1 1 Pentucket 1 0 0 0 0 2 3 Quabbin 0 0 0 0 0 4 4 Ralph C Mahar 1 0 0 0 0 7 8 Silver Lake 0 0 0 0 0 1 1 Southern Berkshire 4 0 0 0 0 0 4 Southwick-Tolland 0 0 0 0 0 14 14 Spencer-E Brookfield 5 0 0 0 0 2 7 Triton 4 2 0 0 10 8 24 Up-Island Regional 2 1 0 0 0 2 5 Wachusett 3 3 0 0 7 34 47 Quaboag Regional 0 0 0 0 0 1 1 Whitman-Hanson 5 1 0 0 0 3 9 Assabet Valley Reg Voc Tech 8 1 0 0 0 0 9 Blue Hills Regional Vocational Technical 1 2 0 2 0 0 5 Bristol-Plymouth Reg Voc Tech 0 2 0 0 0 0 2 Cape Cod Reg Voc Tech 2 2 0 0 0 1 5 Greater Fall River Reg Voc Tech 1 1 0 0 0 0 2 Greater Lawrence Reg Voc Tech 33 0 0 0 0 1 34 GrNew Bedford Reg Voc Tech 14 6 0 0 0 0 20 Greater Lowell Reg Voc Tech 20 8 0 0 0 18 46 South Middlesex Reg Voc Tech 23 14 0 0 0 3 40 Minuteman Reg Voc Tech 2 0 0 0 0 1 3
59
60
District Name Spanish Portuguese Cape
Verdean Creole Haitian Vietnamese Other LEP
Montachusett Reg Voc Tech 4 0 0 0 0 4 8 Northeast Metro Reg Voc Tech 55 0 0 0 0 2 57 North Shore Reg Voc Tech 3 0 0 0 0 0 3 Southeastern Reg Voc Tech 0 2 3 3 0 1 9 Southern Worcester County Reg Voc Tech 3 0 0 0 0 1 4 Tri County Reg Voc Tech 0 1 0 0 0 0 1 Whittier Reg Voc Tech 6 0 0 0 0 0 6 TOTALS 31793 4209 2458 2433 2423 15842 59158
Source The Department Student Information Management System 2009
- Introduction
-
- Background
-
- I English Language Learners in Massachusetts
- II Educators Implementing Sheltered English Immersion Elementary and Secondary Content Teachers of English Language Learners
-
- Research on Professional Development for Educators of English Language Learners
- Gaps in Knowledge
-
- III Use of Funds for Category Training
-
- Future Need for Category Training
-
- IV Educators Implementing Sheltered English Immersion English as a Second Language (ESL) Teachers
-
- ESL Teacher Shortage
-
- V Use of Funds ESL Teachers and ESL Curriculum Development
-
- Massachusetts English Language Teacher Initiative (MELT)
- Improvement of Sheltered English Immersion Content-based ESL Instruction
- Future Need for ESL teachers
-
- VI Budget
- Attachments
-
- Attachment 1 All Massachusetts public school districts and changes in LEP population compared to changes in overall student population - SY 2006-SY 2010
- Attachment 1 Massachusetts public school districts and changes in LEP population compared to changes in overall student population - SY 2006-SY 2010
- Attachment 2 Massachusetts public school districts with large changes in LEP population compared to changes in overall student population - SY 2006-SY 2010
- Attachment 3 Bibliography Professional Development for Teachers of English Language Learners
- Attachment 4 Excerpts from the Commissionerrsquos Memorandum of June 2004 Guidance on Qualifications for Teachers of Limited English Proficient Students in Sheltered English Immersion Classrooms
- Attachment 5 Districts Receiving Sheltered English Immersion Professional Development 2004-2010
- Attachment 6 Collaboratives that have received grants for Sheltered English Immersion Professional Development 2004-2010
- Attachment 7 English Language Learners in Massachusetts District and Program Type October 2009
- Attachment 8 English Language Learners in Massachusetts District and First Language October 2009
-
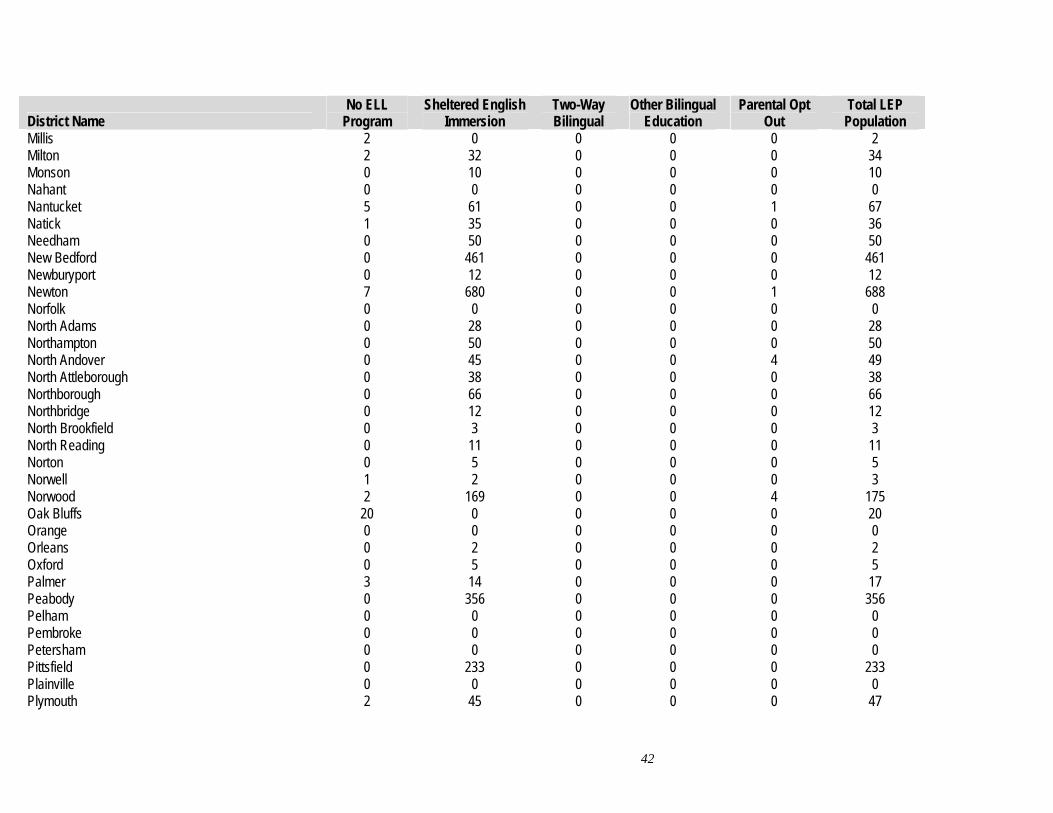
District Name No ELL
Program Sheltered English
Immersion Two-Way Bilingual
Other Bilingual Education
Parental Opt Out
Total LEP Population
Millis 2 0 0 0 0 2 Milton 2 32 0 0 0 34 Monson 0 10 0 0 0 10 Nahant 0 0 0 0 0 0 Nantucket 5 61 0 0 1 67 Natick 1 35 0 0 0 36 Needham 0 50 0 0 0 50 New Bedford 0 461 0 0 0 461 Newburyport 0 12 0 0 0 12 Newton 7 680 0 0 1 688 Norfolk 0 0 0 0 0 0 North Adams 0 28 0 0 0 28 Northampton 0 50 0 0 0 50 North Andover 0 45 0 0 4 49 North Attleborough 0 38 0 0 0 38 Northborough 0 66 0 0 0 66 Northbridge 0 12 0 0 0 12 North Brookfield 0 3 0 0 0 3 North Reading 0 11 0 0 0 11 Norton 0 5 0 0 0 5 Norwell 1 2 0 0 0 3 Norwood 2 169 0 0 4 175 Oak Bluffs 20 0 0 0 0 20 Orange 0 0 0 0 0 0 Orleans 0 2 0 0 0 2 Oxford 0 5 0 0 0 5 Palmer 3 14 0 0 0 17 Peabody 0 356 0 0 0 356 Pelham 0 0 0 0 0 0 Pembroke 0 0 0 0 0 0 Petersham 0 0 0 0 0 0 Pittsfield 0 233 0 0 0 233 Plainville 0 0 0 0 0 0 Plymouth 2 45 0 0 0 47
42
District Name No ELL
Program Sheltered English
Immersion Two-Way Bilingual
Other Bilingual Education
Parental Opt Out
Total LEP Population
Plympton 0 0 0 0 0 0 Provincetown 0 7 0 0 0 7 Quincy 0 1044 0 0 0 1044 Randolph 4 179 1 0 0 184 Reading 0 16 0 0 0 16 Revere 2 623 0 0 0 625 Richmond 0 0 0 0 0 0 Rochester 0 0 0 0 0 0 Rockland 0 28 0 0 0 28 Rockport 0 5 0 0 0 5 Rowe 0 0 0 0 0 0 Salem 6 418 72 0 11 507 Sandwich 0 0 0 0 1 1 Saugus 18 50 0 0 0 68 Savoy 0 0 0 0 0 0 Scituate 0 14 0 0 0 14 Seekonk 0 23 0 0 0 23 Sharon 0 44 0 0 0 44 Sherborn 0 1 0 0 0 1 Shirley 0 5 0 0 0 5 Shrewsbury 0 144 0 0 0 144 Shutesbury 0 0 0 0 0 0 Somerset 1 0 0 1 0 2 Somerville 6 612 124 35 0 777 Southampton 0 3 0 0 0 3 Southborough 0 47 0 0 0 47 Southbridge 6 225 0 0 1 232 South Hadley 14 1 0 0 0 15 Springfield 0 2926 0 0 362 3288 Stoneham 0 58 0 0 0 58 Stoughton 0 129 0 0 37 166 Sturbridge 0 3 0 0 0 3 Sudbury 0 18 0 0 0 18 Sunderland 0 3 0 0 0 3
43
District Name No ELL
Program Sheltered English
Immersion Two-Way Bilingual
Other Bilingual Education
Parental Opt Out
Total LEP Population
Sutton 0 0 0 0 0 0 Swampscott 25 27 0 0 0 52 Swansea 0 10 0 0 0 10 Taunton 0 159 0 0 0 159 Tewksbury 0 12 0 0 0 12 Tisbury 0 28 0 0 0 28 Topsfield 2 0 0 0 0 2 Truro 0 0 0 0 0 0 Tyngsborough 0 0 0 0 0 0 Uxbridge 0 28 1 0 1 30 Wakefield 0 17 0 0 1 18 Wales 0 0 0 0 1 1 Walpole 0 82 0 0 0 82 Waltham 1 383 0 0 91 475 Ware 0 11 0 0 0 11 Wareham 1 14 0 0 2 17 Watertown 1 264 0 0 3 268 Wayland 0 13 0 0 2 15 Webster 1 48 0 0 0 49 Wellesley 1 53 0 0 17 71 Wellfleet 0 0 0 0 0 0 Westborough 2 253 0 0 1 256 West Boylston 0 3 0 0 0 3 West Bridgewater 0 2 0 0 0 2 Westfield 25 185 0 0 1 211 Westford 0 31 0 0 2 33 Westhampton 0 0 0 0 0 0 Weston 0 51 0 0 0 51 Westport 0 15 0 0 0 15 West Springfield 0 276 0 0 0 276 Westwood 6 25 0 0 0 31 Weymouth 0 101 0 0 3 104 Whately 0 0 0 0 0 0 Williamsburg 0 0 0 0 2 2
44
District Name No ELL
Program Sheltered English
Immersion Two-Way Bilingual
Other Bilingual Education
Parental Opt Out
Total LEP Population
Williamstown 0 9 0 0 0 9 Wilmington 0 22 0 0 0 22 Winchendon 0 11 0 0 0 11 Winchester 1 140 0 0 0 141 Winthrop 0 66 0 0 0 66 Woburn 1 195 0 0 0 196 Worcester 206 5922 27 177 56 6388 Wrentham 7 1 0 0 0 8 Northampton-Smith Voc Agr 0 0 0 5 0 5 Excel Academy CS 4 5 0 0 0 9 Four Rivers Charter Public 0 5 0 0 0 5 Berkshire Arts and TechCS 0 0 0 0 0 0 Amesbury Academy CS 0 0 0 0 0 0 Boston Preparatory CS 0 0 0 0 0 0 Christa McAuliffe Reg 0 5 0 0 0 5 Smith Leadership Academy CS 0 0 0 0 2 2 Benjamin Banneker CS 0 1 0 0 0 1 Barnstable Horace Mann CS 0 22 0 0 0 22 Boston Day and Eve CS 4 25 1 1 0 31 Barnstable Com Hrce Mann CS 0 35 0 0 0 35 Edward Brooke Charter 0 3 0 0 0 3 KIPP Academy Lynn Charter 0 3 0 0 1 4 Advanced Math and Science CS 0 0 0 0 0 0 Cape Cod Lighthouse Charter 0 0 0 0 0 0 Innovation Academy Charter 0 1 0 0 0 1 Community CS of Cambridge 0 7 0 0 3 10 City On A Hill Charter Public 0 4 0 0 0 4 Codman Academy CS 1 0 0 0 0 1 Conservatory Lab Charter 0 21 0 0 0 21 Community Day Charter Public 0 98 0 0 0 98 Sabis International Charter 25 0 0 0 0 25 Neighborhood House Charter 0 9 0 0 0 9 Abby Kelley Foster CS 0 27 0 0 1 28 Foxborough Regional CS 0 29 0 0 0 29
45
District Name No ELL
Program Sheltered English
Immersion Two-Way Bilingual
Other Bilingual Education
Parental Opt Out
Total LEP Population
Benjamin Franklin Classical CS 0 0 0 0 0 0 Boston Collegiate Charter 0 0 0 0 0 0 Hilltown Cooperative CS 0 1 0 0 0 1 Robert M Hughes Acad CS 0 0 0 0 0 0 EM Kennedy Acad Health Careers Horace Mann CS 0 2 0 0 0 2 Holyoke Community Charter 0 32 0 0 0 32 Lawrence Family Dev CS 0 0 252 0 0 252 Hill View Montessori CS 0 7 0 0 0 7 Lowell Community CS 0 247 0 0 0 247 Lowell Middlesex Acad CS 0 0 0 0 0 0 Marblehead Community CS 0 0 0 0 0 0 Marthas Vineyard CS 0 4 0 0 0 4 Ma Acad for Math and Science 0 0 0 0 0 0 MATCH Charter Public High 0 0 0 0 0 0 Mystic Valley Regional Charter 0 0 0 0 0 0 New Leadership Charter 0 4 0 0 0 4 North Central Charter Essential 0 3 0 0 0 3 Dorchester Collegiate Acad CS 0 0 0 0 0 0 Silver Hill Horace Mann Charter 0 31 0 0 0 31 Francis W Parker Ch Essential 0 0 0 0 0 0 Pioneer Valley Perf Arts CS 0 1 0 0 0 1 Boston Renaissance CS 0 58 0 0 0 58 River Valley Charter 0 0 0 0 0 0 Rising Tide Charter Public 0 0 0 0 0 0 Roxbury Preparatory Charter 0 6 0 0 0 6 Salem Academy Charter 0 16 0 0 0 16 Seven Hills Charter Public 0 108 0 0 2 110 Prospect Hill Academy Charter 0 29 0 0 0 29 South Shore Charter Public 0 0 0 0 0 0 Sturgis Charter Public 0 0 0 0 0 0 Atlantis Charter 0 0 0 0 0 0 MLK Jr CS of Excellence 0 20 0 0 0 20 Phoenix Charter Academy 0 25 0 0 0 25 Pioneer CS of Science 0 7 0 0 0 7
46
District Name No ELL
Program Sheltered English
Immersion Two-Way Bilingual
Other Bilingual Education
Parental Opt Out
Total LEP Population
29
Global Learning Charter Public 1 0 0 0 0 1 Pioneer Valley Chinese Imm CS 0 0 0 0 1 1 Hampden CS of Science 0 0 0 0 0 0 Acton-Boxborough 0 20 0 0 0 20 Adams-Cheshire 0 3 0 0 0 3 Amherst-Pelham 0 67 0 0 0 67 Ashburnham-Westminster 0 15 0 0 0 15 Athol-Royalston 0 13 0 2 0 15 Berkshire Hills 0 0 0 0 29 Berlin-Boylston 0 1 0 0 0 1 Blackstone-Millville 0 10 0 0 1 11 Bridgewater-Raynham 13 9 0 0 0 22 Chesterfield-Goshen 0 0 0 0 0 0 Central Berkshire 1 0 0 0 0 1 Concord-Carlisle 0 3 0 0 0 3 Dennis-Yarmouth 0 146 0 0 0 146 Dighton-Rehoboth 0 8 0 0 0 8 Dover-Sherborn 0 3 0 0 0 3 Dudley-Charlton Reg 2 47 0 0 1 50 Nauset 3 10 0 0 0 13 Farmington River Reg 0 0 0 0 0 0 Freetown-Lakeville 1 0 0 0 0 1 Frontier 0 9 0 0 0 9 Gateway 0 11 0 0 0 11 Groton-Dunstable 0 11 0 0 0 11 Gill-Montague 43 2 0 0 0 45 Hamilton-Wenham 35 5 0 1 2 43 Hampden-Wilbraham 0 24 0 0 0 24 Hampshire 0 0 0 0 0 0 Hawlemont 0 0 1 0 0 1 King Philip 0 2 0 0 0 2 Lincoln-Sudbury 0 4 0 0 0 4 Manchester Essex Regional 0 3 0 0 0 3 Marthas Vineyard 0 16 0 0 0 16
47
District Name No ELL
Program Sheltered English
Immersion Two-Way Bilingual
Other Bilingual Education
Parental Opt Out
Total LEP Population
Masconomet 2 0 0 0 0 2 Mendon-Upton 0 10 0 0 0 10 Mount Greylock 0 2 0 0 0 2 Mohawk Trail 2 4 1 0 0 7 Narragansett 0 3 0 0 0 3 Nashoba 0 17 0 0 0 17 New Salem-Wendell 0 0 0 0 0 0 Northboro-Southboro 1 6 0 0 0 7 North Middlesex 7 5 0 0 4 16 Old Rochester 1 0 0 0 0 1 Pentucket 0 3 0 0 0 3 Pioneer Valley 0 0 0 0 0 0 Quabbin 1 1 0 0 2 4 Ralph C Mahar 1 7 0 0 0 8 Silver Lake 1 0 0 0 0 1 Southern Berkshire 0 4 0 0 0 4 Southwick-Tolland 0 14 0 0 0 14 Spencer-E Brookfield 0 7 0 0 0 7 Tantasqua 0 0 0 0 0 0 Triton 0 24 0 0 0 24 Up-Island Regional 0 5 0 0 0 5 Wachusett 0 47 0 0 0 47 Quaboag Regional 0 1 0 0 0 1 Whitman-Hanson 0 9 0 0 0 9 Assabet Valley Reg Voc Tech 0 9 0 0 0 9 Blackstone Val Reg Voc Tech 0 0 0 0 0 0 Blue Hills Regional Voc Tech 0 5 0 0 0 5 Bristol-Plym Reg Voc Tech 0 2 0 0 0 2 Cape Cod Regional Voc Tech 0 5 0 0 0 5 Franklin County Reg Voc Tech 0 0 0 0 0 0 Grtr Fall River Reg Voc Tech 2 0 0 0 0 2 Grtr Lawrence Reg Voc Tech 0 31 2 0 1 34 Grtr Nw Bdfrd Reg Voc Tech 0 20 0 0 0 20 Grtr Lowell Reg Voc Tech 0 46 0 0 0 46
48
District Name No ELL
Program Sheltered English
Immersion Two-Way Bilingual
Other Bilingual Education
Parental Opt Out
Total LEP Population
S Middlesex Reg Voc Tech 0 40 0 0 0 40 Minuteman Reg Voc Tech 0 3 0 0 0 3 Montachusett Reg Voc Tech 0 8 0 0 0 8 N Berkshire Reg Voc Tech 0 0 0 0 0 0 Nashoba Valley Reg Voc 0 0 0 0 0 0 NE Metro Reg Voc Tech 0 57 0 0 0 57 North Shore Reg Voc Tech 0 3 0 0 0 3 Old Colony Reg Voc Tech 0 0 0 0 0 0 Pathfinder Reg Voc Tech 0 0 0 0 0 0 Shawsheen Val Reg Voc Tech 0 0 0 0 0 0 Southeastern Reg Voc Tech 0 9 0 0 0 9 South Shore Reg Voc Tech 0 0 0 0 0 0 S Worcester C Reg Voc Tech 1 0 0 3 0 4 Tri County Reg Voc Tech 0 1 0 0 0 1 Uppr Cape Cod Reg Voc Tech 0 0 0 0 0 0 Whittier Reg Voc Tech 0 6 0 0 0 6 Bristol County Agricultural 0 0 0 0 0 0 Essex Agricultural Technical 0 0 0 0 0 0 Norfolk County Agricultural 0 0 0 0 0 0 TOTALS 1113 49096 1229 1342 6378 59158
Source The Department Student Information Management System 2009
49
Attachment 8 English Language Learners in Massachusetts District and First Language October 2009
District Name Spanish Portuguese Cape
Verdean Creole Haitian Vietnamese Other LEP
Abington 3 3 0 0 0 4 10 Acton 8 7 0 0 0 66 81 Acushnet 0 1 0 0 0 0 1 Agawam 15 0 0 0 1 81 97 Amesbury 5 8 0 0 0 8 21 Amherst 60 4 2 0 2 107 175 Andover 12 3 0 0 1 67 83 Arlington 26 17 2 11 1 135 192 Ashland 9 35 0 0 1 22 67 Attleboro 170 9 1 1 2 84 267 Auburn 12 5 0 3 12 24 56 Avon 0 0 0 1 0 0 1 Ayer 36 13 0 0 0 11 60 Barnstable 39 111 0 2 0 24 176 Bedford 9 0 0 0 2 38 49 Belchertown 7 1 0 0 1 15 24 Bellingham 8 3 0 0 3 13 27 Belmont 5 2 0 0 0 85 92 Berlin 0 1 0 0 0 0 1 Beverly 6 8 0 0 1 24 39 Billerica 13 6 0 2 3 57 81 Boston 6434 210 900 947 723 2057 11271 Bourne 1 0 0 0 0 0 1 Boxborough 1 2 0 0 0 3 6 Boxford 1 0 0 0 0 3 4 Boylston 1 0 0 0 1 8 10 Braintree 13 3 4 1 13 77 111 Brewster 6 0 0 0 0 3 9 Brockton 484 131 1465 453 37 167 2737
50
District Name Spanish Portuguese Cape
Verdean Creole Haitian Vietnamese Other LEP
Brookline 43 16 2 2 6 427 496 Burlington 2 3 0 2 0 57 64 Cambridge 58 23 6 67 2 147 303 Canton 4 1 0 3 5 23 36 Carlisle 0 0 0 0 0 11 11 Carver 0 0 0 0 0 2 2 Chatham 10 2 0 3 0 4 19 Chelmsford 9 5 0 0 8 82 104 Chelsea 766 29 2 13 9 103 922 Chicopee 201 4 0 0 1 148 354 Clinton 106 17 0 11 0 10 144 Concord 13 1 0 0 2 20 36 Danvers 4 0 0 1 0 11 16 Dartmouth 2 19 0 0 0 18 39 Dedham 47 3 0 13 9 42 114 Deerfield 4 0 0 0 2 1 7 Douglas 0 2 0 0 0 1 3 Dover 0 0 0 2 0 7 9 Dracut 13 6 0 0 0 24 43 Eastham 1 0 0 0 0 0 1 Easthampton 12 0 0 0 1 27 40 East Longmeadow 0 0 0 0 0 2 2 Easton 4 7 1 3 4 18 37 Edgartown 2 24 0 0 0 0 26 Everett 308 119 1 96 12 44 580 Fairhaven 1 2 0 0 0 0 3 Fall River 297 122 16 2 10 67 514 Falmouth 5 12 0 0 4 23 44 Fitchburg 487 2 0 2 11 91 593 Foxborough 5 3 0 0 1 5 14 Framingham 589 553 0 17 3 109 1271
51
District Name Spanish Portuguese Cape
Verdean Creole Haitian Vietnamese Other LEP
Franklin 13 5 0 1 4 32 55 Gardner 80 1 0 3 2 9 95 Georgetown 0 0 0 0 0 2 2 Gloucester 38 20 0 0 4 13 75 Grafton 3 0 0 0 0 11 14 Granby 3 0 0 0 0 10 13 Greenfield 18 0 0 0 1 35 54 Hadley 8 0 0 0 0 8 16 Hanover 1 0 0 0 1 6 8 Harvard 1 0 0 0 0 1 2 Harwich 12 3 0 8 1 24 48 Haverhill 407 11 0 3 7 33 461 Hingham 0 1 0 0 0 9 10 Holbrook 8 4 0 5 1 8 26 Holland 0 1 0 0 0 0 1 Holliston 7 14 0 0 0 16 37 Holyoke 1361 0 0 0 2 14 1377 Hopedale 2 2 0 0 0 5 9 Hopkinton 7 1 0 0 0 30 38 Hudson 32 67 0 1 1 13 114 Hull 0 1 1 0 0 1 3 Ipswich 5 3 0 0 0 10 18 Kingston 0 2 0 0 0 1 3 Lanesborough 0 0 0 0 0 2 2 Lawrence 2732 3 0 5 32 63 2835 Lee 13 1 0 0 0 4 18 Leicester 7 0 0 0 6 8 21 Lenox 1 0 0 0 0 6 7 Leominster 277 44 0 2 3 72 398 Lexington 21 5 0 4 0 266 296 Lincoln 4 0 0 1 0 21 26
52
District Name Spanish Portuguese Cape
Verdean Creole Haitian Vietnamese Other LEP
Littleton 1 3 1 0 0 10 15 Longmeadow 5 2 0 0 1 31 39 Lowell 1595 324 3 14 131 2254 4321 Ludlow 6 11 0 0 0 25 42 Lunenburg 2 4 0 0 0 4 10 Lynn 2662 30 1 67 62 643 3465 Lynnfield 1 0 0 0 0 3 4 Malden 120 99 0 116 51 320 706 Mansfield 10 6 0 0 0 28 44 Marblehead 3 1 0 0 0 15 19 Marion 0 0 0 0 0 1 1 Marlborough 261 211 0 2 4 31 509 Marshfield 3 11 0 0 0 9 23 Mashpee 0 0 0 0 1 17 18 Mattapoisett 0 0 0 0 0 2 2 Maynard 14 11 0 2 0 6 33 Medfield 0 2 0 0 0 4 6 Medford 28 80 0 96 12 83 299 Medway 3 0 0 1 0 4 8 Melrose 4 5 0 7 2 58 76 Methuen 340 3 0 7 11 52 413 Middleborough 7 0 0 0 1 5 13 Middleton 2 1 0 0 0 10 13 Milford 100 101 0 0 2 24 227 Millbury 2 4 0 0 3 4 13 Millis 0 0 0 0 0 2 2 Milton 3 3 0 15 3 10 34 Monson 0 0 0 0 0 10 10 Nantucket 60 5 0 0 0 2 67 Natick 4 2 0 0 2 28 36 Needham 13 1 2 1 1 32 50
53
District Name Spanish Portuguese Cape
Verdean Creole Haitian Vietnamese Other LEP
New Bedford 289 31 1 2 5 133 461 Newburyport 4 3 0 0 0 5 12 Newton 112 22 0 7 11 536 688 North Adams 19 2 0 0 0 7 28 Northampton 40 0 0 0 0 10 50 North Andover 18 1 0 0 4 26 49 North Attleborough 19 0 0 0 1 18 38 Northborough 16 13 0 0 0 37 66 Northbridge 6 0 0 0 0 6 12 North Brookfield 0 0 0 0 0 3 3 North Reading 2 0 0 0 0 9 11 Norton 0 0 0 0 0 5 5 Norwell 2 0 0 0 0 1 3 Norwood 38 39 0 11 5 82 175 Oak Bluffs 0 19 0 0 0 1 20 Orleans 0 0 0 0 0 2 2 Oxford 3 0 0 0 0 2 5 Palmer 4 2 0 0 0 11 17 Peabody 175 100 0 0 11 70 356 Pittsfield 168 1 0 0 8 56 233 Plymouth 9 26 0 1 2 9 47 Provincetown 7 0 0 0 0 0 7 Quincy 41 31 0 6 126 840 1044 Randolph 17 6 3 71 54 33 184 Reading 1 3 0 0 1 11 16 Revere 392 39 0 8 31 155 625 Rockland 3 22 0 0 2 1 28 Rockport 1 0 0 0 0 4 5 Salem 430 9 0 5 7 56 507 Sandwich 0 0 0 0 0 1 1 Saugus 22 15 0 6 6 19 68
54
District Name Spanish Portuguese Cape
Verdean Creole Haitian Vietnamese Other LEP
Scituate 1 5 6 0 0 2 14 Seekonk 5 1 0 0 2 15 23 Sharon 1 0 0 5 6 32 44 Sherborn 0 0 0 0 0 1 1 Shirley 2 1 0 0 0 2 5 Shrewsbury 15 39 0 0 6 84 144 Somerset 0 0 0 0 0 2 2 Somerville 372 170 5 73 5 152 777 Southampton 1 0 0 0 0 2 3 Southborough 5 4 0 0 0 38 47 Southbridge 219 0 0 0 0 13 232 South Hadley 11 0 0 0 1 3 15 Springfield 2970 2 0 4 87 225 3288 Stoneham 17 11 0 1 3 26 58 Stoughton 21 60 8 17 9 51 166 Sturbridge 1 2 0 0 0 0 3 Sudbury 8 2 0 0 1 7 18 Sunderland 2 0 0 0 0 1 3 Swampscott 8 4 1 2 2 35 52 Swansea 3 2 0 0 0 5 10 Taunton 72 43 5 9 1 29 159 Tewksbury 2 1 0 0 2 7 12 Tisbury 0 26 0 0 0 2 28 Topsfield 0 0 0 0 0 2 2 Uxbridge 11 3 0 0 0 16 30 Wakefield 8 2 0 0 2 6 18 Wales 0 0 0 0 0 1 1 Walpole 18 14 0 13 1 36 82 Waltham 333 27 0 26 3 86 475 Ware 7 0 0 0 0 4 11 Wareham 4 2 0 0 2 9 17
55
District Name Spanish Portuguese Cape
Verdean Creole Haitian Vietnamese Other LEP
Watertown 52 32 0 2 0 182 268 Wayland 1 0 0 0 0 14 15 Webster 32 4 0 0 1 12 49 Wellesley 16 0 0 0 0 55 71 Westborough 43 38 0 1 0 174 256 West Boylston 0 1 0 0 0 2 3 West Bridgewater 0 0 0 2 0 0 2 Westfield 34 0 0 0 0 177 211 Westford 3 0 0 1 2 27 33 Weston 5 0 1 3 1 41 51 Westport 1 9 0 0 4 1 15 West Springfield 29 2 0 0 3 242 276 Westwood 3 0 0 0 0 28 31 Weymouth 12 49 0 1 4 38 104 Williamsburg 0 2 0 0 0 0 2 Williamstown 2 3 0 0 0 4 9 Wilmington 1 3 0 0 4 14 22 Winchendon 4 2 0 0 0 5 11 Winchester 10 10 0 2 2 117 141 Winthrop 18 9 0 1 0 38 66 Woburn 27 44 0 8 8 109 196 Worcester 3636 297 4 44 703 1704 6388 Wrentham 2 3 0 0 0 3 8 Northampton-Smith Voc Agr 5 0 0 0 0 0 5 Excel Academy CS 9 0 0 0 0 0 9 Academy Of the Pacific Rim CS 3 1 0 1 0 0 5 Boston Preparatory CS 3 0 0 2 0 0 5 Christa McAuliffe Regional CS 2 0 0 0 0 0 2 Smith Leadership Academy CS 1 0 0 0 0 0 1 Benjamin Banneker CS 5 0 0 16 0 1 22 Barnstable Horace Mann CS 6 16 0 0 0 9 31
56
District Name Spanish Portuguese Cape
Verdean Creole Haitian Vietnamese Other LEP
Barnstable Com Horace Mann CS 17 17 0 0 0 1 35 Edward Brooke CS 3 0 0 0 0 0 3 KIPP Academy Lynn CS 4 0 0 0 0 0 4 Innovation Academy CS 1 0 0 0 0 0 1 Community CS of Cambridge 3 0 0 5 0 2 10 City On A Hill CS 3 0 0 0 0 1 4 Codman Academy CS 1 0 0 0 0 0 1 Conservatory Lab Charter (District) 14 4 0 0 0 3 21 Community Day CS 96 0 0 2 0 0 98 Sabis International CS 17 0 0 0 4 4 25 Neighborhood House CS 3 0 1 1 3 1 9 Abby Kelley Foster CS 12 5 0 0 0 11 28 Foxborough Reg CS 2 0 0 5 0 22 29 Hilltown Cooperative CS 0 0 0 0 0 1 1 EM Kennedy Acad Health Careers HMCS 1 0 1 0 0 0 2 Holyoke Com CS 32 0 0 0 0 0 32 Lawrence Family Development CS 251 0 0 0 0 1 252 Hill View Montessori CS 6 0 0 0 0 1 7 Lowell Community CS 100 19 0 4 3 121 247 Marthas Vineyard CS 0 3 0 0 0 1 4 New Leadership Charter 3 0 0 0 0 1 4 North Central Charter Essential 2 0 0 0 0 1 3 Silver Hill Horace Mann Charter 25 1 0 1 0 4 31 Pioneer Valley Performing Arts CS 1 0 0 0 0 0 1 Boston Renaissance CS 43 1 2 4 1 7 58 Roxbury Preparatory CS 3 0 3 0 0 0 6 Salem Academy CS 13 0 0 0 0 3 16 Seven Hills CS 89 0 0 0 0 21 110 Prospect Hill Academy CS 9 4 0 11 0 5 29 MLK Jr CS of Excellence 19 0 0 1 0 0 20 Phoenix Charter Academy 23 0 0 1 0 1 25
57
District Name Spanish Portuguese Cape
Verdean Creole Haitian Vietnamese Other LEP
Pioneer Charter School of Science 2 3 0 2 0 0 7 Global Learning Charter Public 1 0 0 0 0 0 1 Pioneer Valley Chinese Imm CS 0 0 0 0 0 1 1 Acton-Boxborough 4 6 0 0 0 10 20 Adams-Cheshire 0 0 0 0 0 3 3 Amherst-Pelham 24 3 3 0 1 36 67 Ashburnham-Westminster 8 0 0 2 0 5 15 Athol-Royalston 8 0 0 0 0 7 15 Berkshire Hills 23 0 0 0 0 6 29 Berlin-Boylston 0 0 0 0 0 1 1 Blackstone-Millville 4 1 0 0 0 6 11 Bridgewater-Raynham 2 2 0 2 1 15 22 Central Berkshire 0 0 0 0 0 1 1 Concord-Carlisle 0 0 0 1 0 2 3 Dennis-Yarmouth 34 62 1 13 3 33 146 Dighton-Rehoboth 5 1 0 0 0 2 8 Dover-Sherborn 0 1 0 0 0 2 3 Dudley-Charlton Reg 14 4 0 0 0 32 50 Nauset 5 1 0 0 0 7 13 Freetown-Lakeville 0 1 0 0 0 0 1 Frontier 3 1 0 0 1 4 9 Gateway 1 0 0 0 0 10 11 Groton-Dunstable 6 1 0 0 0 4 11 Gill-Montague 24 0 0 1 0 20 45 Hamilton-Wenham 0 1 0 0 0 42 43 Hampden-Wilbraham 1 0 0 0 2 21 24 Hawlemont 0 1 0 0 0 0 1 King Philip 1 0 0 0 0 1 2 Lincoln-Sudbury 0 0 0 0 0 4 4 Manchester Essex Regional 0 0 0 0 0 3 3 Marthas Vineyard 0 16 0 0 0 0 16
58
District Name Spanish Portuguese Cape
Verdean Creole Haitian Vietnamese Other LEP
0 Masconomet 0 0 0 0 2 2 Mendon-Upton 1 1 0 0 0 8 10 Mount Greylock 0 0 0 0 0 2 2 Mohawk Trail 0 0 0 0 2 5 7 Narragansett 0 0 0 0 0 3 3 Nashoba 7 4 0 1 0 5 17 Northboro-Southboro 1 1 0 1 0 4 7 North Middlesex 11 1 0 0 0 4 16 Old Rochester 0 0 0 0 0 1 1 Pentucket 1 0 0 0 0 2 3 Quabbin 0 0 0 0 0 4 4 Ralph C Mahar 1 0 0 0 0 7 8 Silver Lake 0 0 0 0 0 1 1 Southern Berkshire 4 0 0 0 0 0 4 Southwick-Tolland 0 0 0 0 0 14 14 Spencer-E Brookfield 5 0 0 0 0 2 7 Triton 4 2 0 0 10 8 24 Up-Island Regional 2 1 0 0 0 2 5 Wachusett 3 3 0 0 7 34 47 Quaboag Regional 0 0 0 0 0 1 1 Whitman-Hanson 5 1 0 0 0 3 9 Assabet Valley Reg Voc Tech 8 1 0 0 0 0 9 Blue Hills Regional Vocational Technical 1 2 0 2 0 0 5 Bristol-Plymouth Reg Voc Tech 0 2 0 0 0 0 2 Cape Cod Reg Voc Tech 2 2 0 0 0 1 5 Greater Fall River Reg Voc Tech 1 1 0 0 0 0 2 Greater Lawrence Reg Voc Tech 33 0 0 0 0 1 34 GrNew Bedford Reg Voc Tech 14 6 0 0 0 0 20 Greater Lowell Reg Voc Tech 20 8 0 0 0 18 46 South Middlesex Reg Voc Tech 23 14 0 0 0 3 40 Minuteman Reg Voc Tech 2 0 0 0 0 1 3
59
60
District Name Spanish Portuguese Cape
Verdean Creole Haitian Vietnamese Other LEP
Montachusett Reg Voc Tech 4 0 0 0 0 4 8 Northeast Metro Reg Voc Tech 55 0 0 0 0 2 57 North Shore Reg Voc Tech 3 0 0 0 0 0 3 Southeastern Reg Voc Tech 0 2 3 3 0 1 9 Southern Worcester County Reg Voc Tech 3 0 0 0 0 1 4 Tri County Reg Voc Tech 0 1 0 0 0 0 1 Whittier Reg Voc Tech 6 0 0 0 0 0 6 TOTALS 31793 4209 2458 2433 2423 15842 59158
Source The Department Student Information Management System 2009
- Introduction
-
- Background
-
- I English Language Learners in Massachusetts
- II Educators Implementing Sheltered English Immersion Elementary and Secondary Content Teachers of English Language Learners
-
- Research on Professional Development for Educators of English Language Learners
- Gaps in Knowledge
-
- III Use of Funds for Category Training
-
- Future Need for Category Training
-
- IV Educators Implementing Sheltered English Immersion English as a Second Language (ESL) Teachers
-
- ESL Teacher Shortage
-
- V Use of Funds ESL Teachers and ESL Curriculum Development
-
- Massachusetts English Language Teacher Initiative (MELT)
- Improvement of Sheltered English Immersion Content-based ESL Instruction
- Future Need for ESL teachers
-
- VI Budget
- Attachments
-
- Attachment 1 All Massachusetts public school districts and changes in LEP population compared to changes in overall student population - SY 2006-SY 2010
- Attachment 1 Massachusetts public school districts and changes in LEP population compared to changes in overall student population - SY 2006-SY 2010
- Attachment 2 Massachusetts public school districts with large changes in LEP population compared to changes in overall student population - SY 2006-SY 2010
- Attachment 3 Bibliography Professional Development for Teachers of English Language Learners
- Attachment 4 Excerpts from the Commissionerrsquos Memorandum of June 2004 Guidance on Qualifications for Teachers of Limited English Proficient Students in Sheltered English Immersion Classrooms
- Attachment 5 Districts Receiving Sheltered English Immersion Professional Development 2004-2010
- Attachment 6 Collaboratives that have received grants for Sheltered English Immersion Professional Development 2004-2010
- Attachment 7 English Language Learners in Massachusetts District and Program Type October 2009
- Attachment 8 English Language Learners in Massachusetts District and First Language October 2009
-
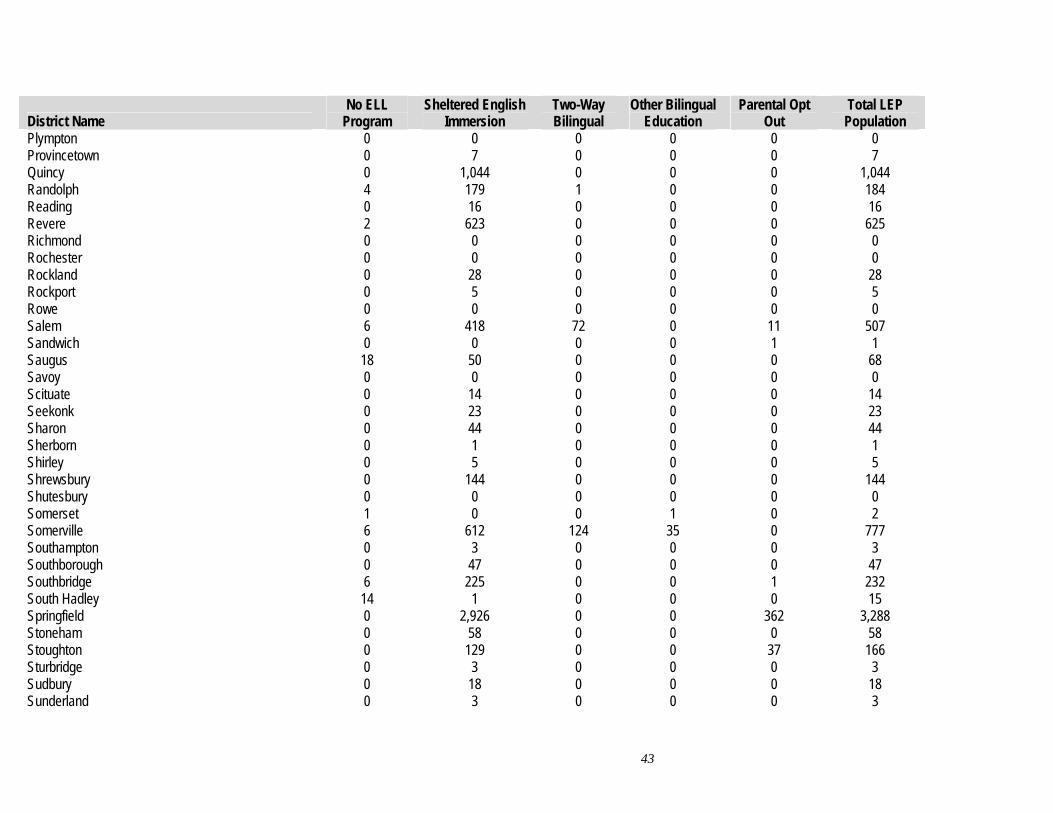
District Name No ELL
Program Sheltered English
Immersion Two-Way Bilingual
Other Bilingual Education
Parental Opt Out
Total LEP Population
Plympton 0 0 0 0 0 0 Provincetown 0 7 0 0 0 7 Quincy 0 1044 0 0 0 1044 Randolph 4 179 1 0 0 184 Reading 0 16 0 0 0 16 Revere 2 623 0 0 0 625 Richmond 0 0 0 0 0 0 Rochester 0 0 0 0 0 0 Rockland 0 28 0 0 0 28 Rockport 0 5 0 0 0 5 Rowe 0 0 0 0 0 0 Salem 6 418 72 0 11 507 Sandwich 0 0 0 0 1 1 Saugus 18 50 0 0 0 68 Savoy 0 0 0 0 0 0 Scituate 0 14 0 0 0 14 Seekonk 0 23 0 0 0 23 Sharon 0 44 0 0 0 44 Sherborn 0 1 0 0 0 1 Shirley 0 5 0 0 0 5 Shrewsbury 0 144 0 0 0 144 Shutesbury 0 0 0 0 0 0 Somerset 1 0 0 1 0 2 Somerville 6 612 124 35 0 777 Southampton 0 3 0 0 0 3 Southborough 0 47 0 0 0 47 Southbridge 6 225 0 0 1 232 South Hadley 14 1 0 0 0 15 Springfield 0 2926 0 0 362 3288 Stoneham 0 58 0 0 0 58 Stoughton 0 129 0 0 37 166 Sturbridge 0 3 0 0 0 3 Sudbury 0 18 0 0 0 18 Sunderland 0 3 0 0 0 3
43
District Name No ELL
Program Sheltered English
Immersion Two-Way Bilingual
Other Bilingual Education
Parental Opt Out
Total LEP Population
Sutton 0 0 0 0 0 0 Swampscott 25 27 0 0 0 52 Swansea 0 10 0 0 0 10 Taunton 0 159 0 0 0 159 Tewksbury 0 12 0 0 0 12 Tisbury 0 28 0 0 0 28 Topsfield 2 0 0 0 0 2 Truro 0 0 0 0 0 0 Tyngsborough 0 0 0 0 0 0 Uxbridge 0 28 1 0 1 30 Wakefield 0 17 0 0 1 18 Wales 0 0 0 0 1 1 Walpole 0 82 0 0 0 82 Waltham 1 383 0 0 91 475 Ware 0 11 0 0 0 11 Wareham 1 14 0 0 2 17 Watertown 1 264 0 0 3 268 Wayland 0 13 0 0 2 15 Webster 1 48 0 0 0 49 Wellesley 1 53 0 0 17 71 Wellfleet 0 0 0 0 0 0 Westborough 2 253 0 0 1 256 West Boylston 0 3 0 0 0 3 West Bridgewater 0 2 0 0 0 2 Westfield 25 185 0 0 1 211 Westford 0 31 0 0 2 33 Westhampton 0 0 0 0 0 0 Weston 0 51 0 0 0 51 Westport 0 15 0 0 0 15 West Springfield 0 276 0 0 0 276 Westwood 6 25 0 0 0 31 Weymouth 0 101 0 0 3 104 Whately 0 0 0 0 0 0 Williamsburg 0 0 0 0 2 2
44
District Name No ELL
Program Sheltered English
Immersion Two-Way Bilingual
Other Bilingual Education
Parental Opt Out
Total LEP Population
Williamstown 0 9 0 0 0 9 Wilmington 0 22 0 0 0 22 Winchendon 0 11 0 0 0 11 Winchester 1 140 0 0 0 141 Winthrop 0 66 0 0 0 66 Woburn 1 195 0 0 0 196 Worcester 206 5922 27 177 56 6388 Wrentham 7 1 0 0 0 8 Northampton-Smith Voc Agr 0 0 0 5 0 5 Excel Academy CS 4 5 0 0 0 9 Four Rivers Charter Public 0 5 0 0 0 5 Berkshire Arts and TechCS 0 0 0 0 0 0 Amesbury Academy CS 0 0 0 0 0 0 Boston Preparatory CS 0 0 0 0 0 0 Christa McAuliffe Reg 0 5 0 0 0 5 Smith Leadership Academy CS 0 0 0 0 2 2 Benjamin Banneker CS 0 1 0 0 0 1 Barnstable Horace Mann CS 0 22 0 0 0 22 Boston Day and Eve CS 4 25 1 1 0 31 Barnstable Com Hrce Mann CS 0 35 0 0 0 35 Edward Brooke Charter 0 3 0 0 0 3 KIPP Academy Lynn Charter 0 3 0 0 1 4 Advanced Math and Science CS 0 0 0 0 0 0 Cape Cod Lighthouse Charter 0 0 0 0 0 0 Innovation Academy Charter 0 1 0 0 0 1 Community CS of Cambridge 0 7 0 0 3 10 City On A Hill Charter Public 0 4 0 0 0 4 Codman Academy CS 1 0 0 0 0 1 Conservatory Lab Charter 0 21 0 0 0 21 Community Day Charter Public 0 98 0 0 0 98 Sabis International Charter 25 0 0 0 0 25 Neighborhood House Charter 0 9 0 0 0 9 Abby Kelley Foster CS 0 27 0 0 1 28 Foxborough Regional CS 0 29 0 0 0 29
45
District Name No ELL
Program Sheltered English
Immersion Two-Way Bilingual
Other Bilingual Education
Parental Opt Out
Total LEP Population
Benjamin Franklin Classical CS 0 0 0 0 0 0 Boston Collegiate Charter 0 0 0 0 0 0 Hilltown Cooperative CS 0 1 0 0 0 1 Robert M Hughes Acad CS 0 0 0 0 0 0 EM Kennedy Acad Health Careers Horace Mann CS 0 2 0 0 0 2 Holyoke Community Charter 0 32 0 0 0 32 Lawrence Family Dev CS 0 0 252 0 0 252 Hill View Montessori CS 0 7 0 0 0 7 Lowell Community CS 0 247 0 0 0 247 Lowell Middlesex Acad CS 0 0 0 0 0 0 Marblehead Community CS 0 0 0 0 0 0 Marthas Vineyard CS 0 4 0 0 0 4 Ma Acad for Math and Science 0 0 0 0 0 0 MATCH Charter Public High 0 0 0 0 0 0 Mystic Valley Regional Charter 0 0 0 0 0 0 New Leadership Charter 0 4 0 0 0 4 North Central Charter Essential 0 3 0 0 0 3 Dorchester Collegiate Acad CS 0 0 0 0 0 0 Silver Hill Horace Mann Charter 0 31 0 0 0 31 Francis W Parker Ch Essential 0 0 0 0 0 0 Pioneer Valley Perf Arts CS 0 1 0 0 0 1 Boston Renaissance CS 0 58 0 0 0 58 River Valley Charter 0 0 0 0 0 0 Rising Tide Charter Public 0 0 0 0 0 0 Roxbury Preparatory Charter 0 6 0 0 0 6 Salem Academy Charter 0 16 0 0 0 16 Seven Hills Charter Public 0 108 0 0 2 110 Prospect Hill Academy Charter 0 29 0 0 0 29 South Shore Charter Public 0 0 0 0 0 0 Sturgis Charter Public 0 0 0 0 0 0 Atlantis Charter 0 0 0 0 0 0 MLK Jr CS of Excellence 0 20 0 0 0 20 Phoenix Charter Academy 0 25 0 0 0 25 Pioneer CS of Science 0 7 0 0 0 7
46
District Name No ELL
Program Sheltered English
Immersion Two-Way Bilingual
Other Bilingual Education
Parental Opt Out
Total LEP Population
29
Global Learning Charter Public 1 0 0 0 0 1 Pioneer Valley Chinese Imm CS 0 0 0 0 1 1 Hampden CS of Science 0 0 0 0 0 0 Acton-Boxborough 0 20 0 0 0 20 Adams-Cheshire 0 3 0 0 0 3 Amherst-Pelham 0 67 0 0 0 67 Ashburnham-Westminster 0 15 0 0 0 15 Athol-Royalston 0 13 0 2 0 15 Berkshire Hills 0 0 0 0 29 Berlin-Boylston 0 1 0 0 0 1 Blackstone-Millville 0 10 0 0 1 11 Bridgewater-Raynham 13 9 0 0 0 22 Chesterfield-Goshen 0 0 0 0 0 0 Central Berkshire 1 0 0 0 0 1 Concord-Carlisle 0 3 0 0 0 3 Dennis-Yarmouth 0 146 0 0 0 146 Dighton-Rehoboth 0 8 0 0 0 8 Dover-Sherborn 0 3 0 0 0 3 Dudley-Charlton Reg 2 47 0 0 1 50 Nauset 3 10 0 0 0 13 Farmington River Reg 0 0 0 0 0 0 Freetown-Lakeville 1 0 0 0 0 1 Frontier 0 9 0 0 0 9 Gateway 0 11 0 0 0 11 Groton-Dunstable 0 11 0 0 0 11 Gill-Montague 43 2 0 0 0 45 Hamilton-Wenham 35 5 0 1 2 43 Hampden-Wilbraham 0 24 0 0 0 24 Hampshire 0 0 0 0 0 0 Hawlemont 0 0 1 0 0 1 King Philip 0 2 0 0 0 2 Lincoln-Sudbury 0 4 0 0 0 4 Manchester Essex Regional 0 3 0 0 0 3 Marthas Vineyard 0 16 0 0 0 16
47
District Name No ELL
Program Sheltered English
Immersion Two-Way Bilingual
Other Bilingual Education
Parental Opt Out
Total LEP Population
Masconomet 2 0 0 0 0 2 Mendon-Upton 0 10 0 0 0 10 Mount Greylock 0 2 0 0 0 2 Mohawk Trail 2 4 1 0 0 7 Narragansett 0 3 0 0 0 3 Nashoba 0 17 0 0 0 17 New Salem-Wendell 0 0 0 0 0 0 Northboro-Southboro 1 6 0 0 0 7 North Middlesex 7 5 0 0 4 16 Old Rochester 1 0 0 0 0 1 Pentucket 0 3 0 0 0 3 Pioneer Valley 0 0 0 0 0 0 Quabbin 1 1 0 0 2 4 Ralph C Mahar 1 7 0 0 0 8 Silver Lake 1 0 0 0 0 1 Southern Berkshire 0 4 0 0 0 4 Southwick-Tolland 0 14 0 0 0 14 Spencer-E Brookfield 0 7 0 0 0 7 Tantasqua 0 0 0 0 0 0 Triton 0 24 0 0 0 24 Up-Island Regional 0 5 0 0 0 5 Wachusett 0 47 0 0 0 47 Quaboag Regional 0 1 0 0 0 1 Whitman-Hanson 0 9 0 0 0 9 Assabet Valley Reg Voc Tech 0 9 0 0 0 9 Blackstone Val Reg Voc Tech 0 0 0 0 0 0 Blue Hills Regional Voc Tech 0 5 0 0 0 5 Bristol-Plym Reg Voc Tech 0 2 0 0 0 2 Cape Cod Regional Voc Tech 0 5 0 0 0 5 Franklin County Reg Voc Tech 0 0 0 0 0 0 Grtr Fall River Reg Voc Tech 2 0 0 0 0 2 Grtr Lawrence Reg Voc Tech 0 31 2 0 1 34 Grtr Nw Bdfrd Reg Voc Tech 0 20 0 0 0 20 Grtr Lowell Reg Voc Tech 0 46 0 0 0 46
48
District Name No ELL
Program Sheltered English
Immersion Two-Way Bilingual
Other Bilingual Education
Parental Opt Out
Total LEP Population
S Middlesex Reg Voc Tech 0 40 0 0 0 40 Minuteman Reg Voc Tech 0 3 0 0 0 3 Montachusett Reg Voc Tech 0 8 0 0 0 8 N Berkshire Reg Voc Tech 0 0 0 0 0 0 Nashoba Valley Reg Voc 0 0 0 0 0 0 NE Metro Reg Voc Tech 0 57 0 0 0 57 North Shore Reg Voc Tech 0 3 0 0 0 3 Old Colony Reg Voc Tech 0 0 0 0 0 0 Pathfinder Reg Voc Tech 0 0 0 0 0 0 Shawsheen Val Reg Voc Tech 0 0 0 0 0 0 Southeastern Reg Voc Tech 0 9 0 0 0 9 South Shore Reg Voc Tech 0 0 0 0 0 0 S Worcester C Reg Voc Tech 1 0 0 3 0 4 Tri County Reg Voc Tech 0 1 0 0 0 1 Uppr Cape Cod Reg Voc Tech 0 0 0 0 0 0 Whittier Reg Voc Tech 0 6 0 0 0 6 Bristol County Agricultural 0 0 0 0 0 0 Essex Agricultural Technical 0 0 0 0 0 0 Norfolk County Agricultural 0 0 0 0 0 0 TOTALS 1113 49096 1229 1342 6378 59158
Source The Department Student Information Management System 2009
49
Attachment 8 English Language Learners in Massachusetts District and First Language October 2009
District Name Spanish Portuguese Cape
Verdean Creole Haitian Vietnamese Other LEP
Abington 3 3 0 0 0 4 10 Acton 8 7 0 0 0 66 81 Acushnet 0 1 0 0 0 0 1 Agawam 15 0 0 0 1 81 97 Amesbury 5 8 0 0 0 8 21 Amherst 60 4 2 0 2 107 175 Andover 12 3 0 0 1 67 83 Arlington 26 17 2 11 1 135 192 Ashland 9 35 0 0 1 22 67 Attleboro 170 9 1 1 2 84 267 Auburn 12 5 0 3 12 24 56 Avon 0 0 0 1 0 0 1 Ayer 36 13 0 0 0 11 60 Barnstable 39 111 0 2 0 24 176 Bedford 9 0 0 0 2 38 49 Belchertown 7 1 0 0 1 15 24 Bellingham 8 3 0 0 3 13 27 Belmont 5 2 0 0 0 85 92 Berlin 0 1 0 0 0 0 1 Beverly 6 8 0 0 1 24 39 Billerica 13 6 0 2 3 57 81 Boston 6434 210 900 947 723 2057 11271 Bourne 1 0 0 0 0 0 1 Boxborough 1 2 0 0 0 3 6 Boxford 1 0 0 0 0 3 4 Boylston 1 0 0 0 1 8 10 Braintree 13 3 4 1 13 77 111 Brewster 6 0 0 0 0 3 9 Brockton 484 131 1465 453 37 167 2737
50
District Name Spanish Portuguese Cape
Verdean Creole Haitian Vietnamese Other LEP
Brookline 43 16 2 2 6 427 496 Burlington 2 3 0 2 0 57 64 Cambridge 58 23 6 67 2 147 303 Canton 4 1 0 3 5 23 36 Carlisle 0 0 0 0 0 11 11 Carver 0 0 0 0 0 2 2 Chatham 10 2 0 3 0 4 19 Chelmsford 9 5 0 0 8 82 104 Chelsea 766 29 2 13 9 103 922 Chicopee 201 4 0 0 1 148 354 Clinton 106 17 0 11 0 10 144 Concord 13 1 0 0 2 20 36 Danvers 4 0 0 1 0 11 16 Dartmouth 2 19 0 0 0 18 39 Dedham 47 3 0 13 9 42 114 Deerfield 4 0 0 0 2 1 7 Douglas 0 2 0 0 0 1 3 Dover 0 0 0 2 0 7 9 Dracut 13 6 0 0 0 24 43 Eastham 1 0 0 0 0 0 1 Easthampton 12 0 0 0 1 27 40 East Longmeadow 0 0 0 0 0 2 2 Easton 4 7 1 3 4 18 37 Edgartown 2 24 0 0 0 0 26 Everett 308 119 1 96 12 44 580 Fairhaven 1 2 0 0 0 0 3 Fall River 297 122 16 2 10 67 514 Falmouth 5 12 0 0 4 23 44 Fitchburg 487 2 0 2 11 91 593 Foxborough 5 3 0 0 1 5 14 Framingham 589 553 0 17 3 109 1271
51
District Name Spanish Portuguese Cape
Verdean Creole Haitian Vietnamese Other LEP
Franklin 13 5 0 1 4 32 55 Gardner 80 1 0 3 2 9 95 Georgetown 0 0 0 0 0 2 2 Gloucester 38 20 0 0 4 13 75 Grafton 3 0 0 0 0 11 14 Granby 3 0 0 0 0 10 13 Greenfield 18 0 0 0 1 35 54 Hadley 8 0 0 0 0 8 16 Hanover 1 0 0 0 1 6 8 Harvard 1 0 0 0 0 1 2 Harwich 12 3 0 8 1 24 48 Haverhill 407 11 0 3 7 33 461 Hingham 0 1 0 0 0 9 10 Holbrook 8 4 0 5 1 8 26 Holland 0 1 0 0 0 0 1 Holliston 7 14 0 0 0 16 37 Holyoke 1361 0 0 0 2 14 1377 Hopedale 2 2 0 0 0 5 9 Hopkinton 7 1 0 0 0 30 38 Hudson 32 67 0 1 1 13 114 Hull 0 1 1 0 0 1 3 Ipswich 5 3 0 0 0 10 18 Kingston 0 2 0 0 0 1 3 Lanesborough 0 0 0 0 0 2 2 Lawrence 2732 3 0 5 32 63 2835 Lee 13 1 0 0 0 4 18 Leicester 7 0 0 0 6 8 21 Lenox 1 0 0 0 0 6 7 Leominster 277 44 0 2 3 72 398 Lexington 21 5 0 4 0 266 296 Lincoln 4 0 0 1 0 21 26
52
District Name Spanish Portuguese Cape
Verdean Creole Haitian Vietnamese Other LEP
Littleton 1 3 1 0 0 10 15 Longmeadow 5 2 0 0 1 31 39 Lowell 1595 324 3 14 131 2254 4321 Ludlow 6 11 0 0 0 25 42 Lunenburg 2 4 0 0 0 4 10 Lynn 2662 30 1 67 62 643 3465 Lynnfield 1 0 0 0 0 3 4 Malden 120 99 0 116 51 320 706 Mansfield 10 6 0 0 0 28 44 Marblehead 3 1 0 0 0 15 19 Marion 0 0 0 0 0 1 1 Marlborough 261 211 0 2 4 31 509 Marshfield 3 11 0 0 0 9 23 Mashpee 0 0 0 0 1 17 18 Mattapoisett 0 0 0 0 0 2 2 Maynard 14 11 0 2 0 6 33 Medfield 0 2 0 0 0 4 6 Medford 28 80 0 96 12 83 299 Medway 3 0 0 1 0 4 8 Melrose 4 5 0 7 2 58 76 Methuen 340 3 0 7 11 52 413 Middleborough 7 0 0 0 1 5 13 Middleton 2 1 0 0 0 10 13 Milford 100 101 0 0 2 24 227 Millbury 2 4 0 0 3 4 13 Millis 0 0 0 0 0 2 2 Milton 3 3 0 15 3 10 34 Monson 0 0 0 0 0 10 10 Nantucket 60 5 0 0 0 2 67 Natick 4 2 0 0 2 28 36 Needham 13 1 2 1 1 32 50
53
District Name Spanish Portuguese Cape
Verdean Creole Haitian Vietnamese Other LEP
New Bedford 289 31 1 2 5 133 461 Newburyport 4 3 0 0 0 5 12 Newton 112 22 0 7 11 536 688 North Adams 19 2 0 0 0 7 28 Northampton 40 0 0 0 0 10 50 North Andover 18 1 0 0 4 26 49 North Attleborough 19 0 0 0 1 18 38 Northborough 16 13 0 0 0 37 66 Northbridge 6 0 0 0 0 6 12 North Brookfield 0 0 0 0 0 3 3 North Reading 2 0 0 0 0 9 11 Norton 0 0 0 0 0 5 5 Norwell 2 0 0 0 0 1 3 Norwood 38 39 0 11 5 82 175 Oak Bluffs 0 19 0 0 0 1 20 Orleans 0 0 0 0 0 2 2 Oxford 3 0 0 0 0 2 5 Palmer 4 2 0 0 0 11 17 Peabody 175 100 0 0 11 70 356 Pittsfield 168 1 0 0 8 56 233 Plymouth 9 26 0 1 2 9 47 Provincetown 7 0 0 0 0 0 7 Quincy 41 31 0 6 126 840 1044 Randolph 17 6 3 71 54 33 184 Reading 1 3 0 0 1 11 16 Revere 392 39 0 8 31 155 625 Rockland 3 22 0 0 2 1 28 Rockport 1 0 0 0 0 4 5 Salem 430 9 0 5 7 56 507 Sandwich 0 0 0 0 0 1 1 Saugus 22 15 0 6 6 19 68
54
District Name Spanish Portuguese Cape
Verdean Creole Haitian Vietnamese Other LEP
Scituate 1 5 6 0 0 2 14 Seekonk 5 1 0 0 2 15 23 Sharon 1 0 0 5 6 32 44 Sherborn 0 0 0 0 0 1 1 Shirley 2 1 0 0 0 2 5 Shrewsbury 15 39 0 0 6 84 144 Somerset 0 0 0 0 0 2 2 Somerville 372 170 5 73 5 152 777 Southampton 1 0 0 0 0 2 3 Southborough 5 4 0 0 0 38 47 Southbridge 219 0 0 0 0 13 232 South Hadley 11 0 0 0 1 3 15 Springfield 2970 2 0 4 87 225 3288 Stoneham 17 11 0 1 3 26 58 Stoughton 21 60 8 17 9 51 166 Sturbridge 1 2 0 0 0 0 3 Sudbury 8 2 0 0 1 7 18 Sunderland 2 0 0 0 0 1 3 Swampscott 8 4 1 2 2 35 52 Swansea 3 2 0 0 0 5 10 Taunton 72 43 5 9 1 29 159 Tewksbury 2 1 0 0 2 7 12 Tisbury 0 26 0 0 0 2 28 Topsfield 0 0 0 0 0 2 2 Uxbridge 11 3 0 0 0 16 30 Wakefield 8 2 0 0 2 6 18 Wales 0 0 0 0 0 1 1 Walpole 18 14 0 13 1 36 82 Waltham 333 27 0 26 3 86 475 Ware 7 0 0 0 0 4 11 Wareham 4 2 0 0 2 9 17
55
District Name Spanish Portuguese Cape
Verdean Creole Haitian Vietnamese Other LEP
Watertown 52 32 0 2 0 182 268 Wayland 1 0 0 0 0 14 15 Webster 32 4 0 0 1 12 49 Wellesley 16 0 0 0 0 55 71 Westborough 43 38 0 1 0 174 256 West Boylston 0 1 0 0 0 2 3 West Bridgewater 0 0 0 2 0 0 2 Westfield 34 0 0 0 0 177 211 Westford 3 0 0 1 2 27 33 Weston 5 0 1 3 1 41 51 Westport 1 9 0 0 4 1 15 West Springfield 29 2 0 0 3 242 276 Westwood 3 0 0 0 0 28 31 Weymouth 12 49 0 1 4 38 104 Williamsburg 0 2 0 0 0 0 2 Williamstown 2 3 0 0 0 4 9 Wilmington 1 3 0 0 4 14 22 Winchendon 4 2 0 0 0 5 11 Winchester 10 10 0 2 2 117 141 Winthrop 18 9 0 1 0 38 66 Woburn 27 44 0 8 8 109 196 Worcester 3636 297 4 44 703 1704 6388 Wrentham 2 3 0 0 0 3 8 Northampton-Smith Voc Agr 5 0 0 0 0 0 5 Excel Academy CS 9 0 0 0 0 0 9 Academy Of the Pacific Rim CS 3 1 0 1 0 0 5 Boston Preparatory CS 3 0 0 2 0 0 5 Christa McAuliffe Regional CS 2 0 0 0 0 0 2 Smith Leadership Academy CS 1 0 0 0 0 0 1 Benjamin Banneker CS 5 0 0 16 0 1 22 Barnstable Horace Mann CS 6 16 0 0 0 9 31
56
District Name Spanish Portuguese Cape
Verdean Creole Haitian Vietnamese Other LEP
Barnstable Com Horace Mann CS 17 17 0 0 0 1 35 Edward Brooke CS 3 0 0 0 0 0 3 KIPP Academy Lynn CS 4 0 0 0 0 0 4 Innovation Academy CS 1 0 0 0 0 0 1 Community CS of Cambridge 3 0 0 5 0 2 10 City On A Hill CS 3 0 0 0 0 1 4 Codman Academy CS 1 0 0 0 0 0 1 Conservatory Lab Charter (District) 14 4 0 0 0 3 21 Community Day CS 96 0 0 2 0 0 98 Sabis International CS 17 0 0 0 4 4 25 Neighborhood House CS 3 0 1 1 3 1 9 Abby Kelley Foster CS 12 5 0 0 0 11 28 Foxborough Reg CS 2 0 0 5 0 22 29 Hilltown Cooperative CS 0 0 0 0 0 1 1 EM Kennedy Acad Health Careers HMCS 1 0 1 0 0 0 2 Holyoke Com CS 32 0 0 0 0 0 32 Lawrence Family Development CS 251 0 0 0 0 1 252 Hill View Montessori CS 6 0 0 0 0 1 7 Lowell Community CS 100 19 0 4 3 121 247 Marthas Vineyard CS 0 3 0 0 0 1 4 New Leadership Charter 3 0 0 0 0 1 4 North Central Charter Essential 2 0 0 0 0 1 3 Silver Hill Horace Mann Charter 25 1 0 1 0 4 31 Pioneer Valley Performing Arts CS 1 0 0 0 0 0 1 Boston Renaissance CS 43 1 2 4 1 7 58 Roxbury Preparatory CS 3 0 3 0 0 0 6 Salem Academy CS 13 0 0 0 0 3 16 Seven Hills CS 89 0 0 0 0 21 110 Prospect Hill Academy CS 9 4 0 11 0 5 29 MLK Jr CS of Excellence 19 0 0 1 0 0 20 Phoenix Charter Academy 23 0 0 1 0 1 25
57
District Name Spanish Portuguese Cape
Verdean Creole Haitian Vietnamese Other LEP
Pioneer Charter School of Science 2 3 0 2 0 0 7 Global Learning Charter Public 1 0 0 0 0 0 1 Pioneer Valley Chinese Imm CS 0 0 0 0 0 1 1 Acton-Boxborough 4 6 0 0 0 10 20 Adams-Cheshire 0 0 0 0 0 3 3 Amherst-Pelham 24 3 3 0 1 36 67 Ashburnham-Westminster 8 0 0 2 0 5 15 Athol-Royalston 8 0 0 0 0 7 15 Berkshire Hills 23 0 0 0 0 6 29 Berlin-Boylston 0 0 0 0 0 1 1 Blackstone-Millville 4 1 0 0 0 6 11 Bridgewater-Raynham 2 2 0 2 1 15 22 Central Berkshire 0 0 0 0 0 1 1 Concord-Carlisle 0 0 0 1 0 2 3 Dennis-Yarmouth 34 62 1 13 3 33 146 Dighton-Rehoboth 5 1 0 0 0 2 8 Dover-Sherborn 0 1 0 0 0 2 3 Dudley-Charlton Reg 14 4 0 0 0 32 50 Nauset 5 1 0 0 0 7 13 Freetown-Lakeville 0 1 0 0 0 0 1 Frontier 3 1 0 0 1 4 9 Gateway 1 0 0 0 0 10 11 Groton-Dunstable 6 1 0 0 0 4 11 Gill-Montague 24 0 0 1 0 20 45 Hamilton-Wenham 0 1 0 0 0 42 43 Hampden-Wilbraham 1 0 0 0 2 21 24 Hawlemont 0 1 0 0 0 0 1 King Philip 1 0 0 0 0 1 2 Lincoln-Sudbury 0 0 0 0 0 4 4 Manchester Essex Regional 0 0 0 0 0 3 3 Marthas Vineyard 0 16 0 0 0 0 16
58
District Name Spanish Portuguese Cape
Verdean Creole Haitian Vietnamese Other LEP
0 Masconomet 0 0 0 0 2 2 Mendon-Upton 1 1 0 0 0 8 10 Mount Greylock 0 0 0 0 0 2 2 Mohawk Trail 0 0 0 0 2 5 7 Narragansett 0 0 0 0 0 3 3 Nashoba 7 4 0 1 0 5 17 Northboro-Southboro 1 1 0 1 0 4 7 North Middlesex 11 1 0 0 0 4 16 Old Rochester 0 0 0 0 0 1 1 Pentucket 1 0 0 0 0 2 3 Quabbin 0 0 0 0 0 4 4 Ralph C Mahar 1 0 0 0 0 7 8 Silver Lake 0 0 0 0 0 1 1 Southern Berkshire 4 0 0 0 0 0 4 Southwick-Tolland 0 0 0 0 0 14 14 Spencer-E Brookfield 5 0 0 0 0 2 7 Triton 4 2 0 0 10 8 24 Up-Island Regional 2 1 0 0 0 2 5 Wachusett 3 3 0 0 7 34 47 Quaboag Regional 0 0 0 0 0 1 1 Whitman-Hanson 5 1 0 0 0 3 9 Assabet Valley Reg Voc Tech 8 1 0 0 0 0 9 Blue Hills Regional Vocational Technical 1 2 0 2 0 0 5 Bristol-Plymouth Reg Voc Tech 0 2 0 0 0 0 2 Cape Cod Reg Voc Tech 2 2 0 0 0 1 5 Greater Fall River Reg Voc Tech 1 1 0 0 0 0 2 Greater Lawrence Reg Voc Tech 33 0 0 0 0 1 34 GrNew Bedford Reg Voc Tech 14 6 0 0 0 0 20 Greater Lowell Reg Voc Tech 20 8 0 0 0 18 46 South Middlesex Reg Voc Tech 23 14 0 0 0 3 40 Minuteman Reg Voc Tech 2 0 0 0 0 1 3
59
60
District Name Spanish Portuguese Cape
Verdean Creole Haitian Vietnamese Other LEP
Montachusett Reg Voc Tech 4 0 0 0 0 4 8 Northeast Metro Reg Voc Tech 55 0 0 0 0 2 57 North Shore Reg Voc Tech 3 0 0 0 0 0 3 Southeastern Reg Voc Tech 0 2 3 3 0 1 9 Southern Worcester County Reg Voc Tech 3 0 0 0 0 1 4 Tri County Reg Voc Tech 0 1 0 0 0 0 1 Whittier Reg Voc Tech 6 0 0 0 0 0 6 TOTALS 31793 4209 2458 2433 2423 15842 59158
Source The Department Student Information Management System 2009
- Introduction
-
- Background
-
- I English Language Learners in Massachusetts
- II Educators Implementing Sheltered English Immersion Elementary and Secondary Content Teachers of English Language Learners
-
- Research on Professional Development for Educators of English Language Learners
- Gaps in Knowledge
-
- III Use of Funds for Category Training
-
- Future Need for Category Training
-
- IV Educators Implementing Sheltered English Immersion English as a Second Language (ESL) Teachers
-
- ESL Teacher Shortage
-
- V Use of Funds ESL Teachers and ESL Curriculum Development
-
- Massachusetts English Language Teacher Initiative (MELT)
- Improvement of Sheltered English Immersion Content-based ESL Instruction
- Future Need for ESL teachers
-
- VI Budget
- Attachments
-
- Attachment 1 All Massachusetts public school districts and changes in LEP population compared to changes in overall student population - SY 2006-SY 2010
- Attachment 1 Massachusetts public school districts and changes in LEP population compared to changes in overall student population - SY 2006-SY 2010
- Attachment 2 Massachusetts public school districts with large changes in LEP population compared to changes in overall student population - SY 2006-SY 2010
- Attachment 3 Bibliography Professional Development for Teachers of English Language Learners
- Attachment 4 Excerpts from the Commissionerrsquos Memorandum of June 2004 Guidance on Qualifications for Teachers of Limited English Proficient Students in Sheltered English Immersion Classrooms
- Attachment 5 Districts Receiving Sheltered English Immersion Professional Development 2004-2010
- Attachment 6 Collaboratives that have received grants for Sheltered English Immersion Professional Development 2004-2010
- Attachment 7 English Language Learners in Massachusetts District and Program Type October 2009
- Attachment 8 English Language Learners in Massachusetts District and First Language October 2009
-
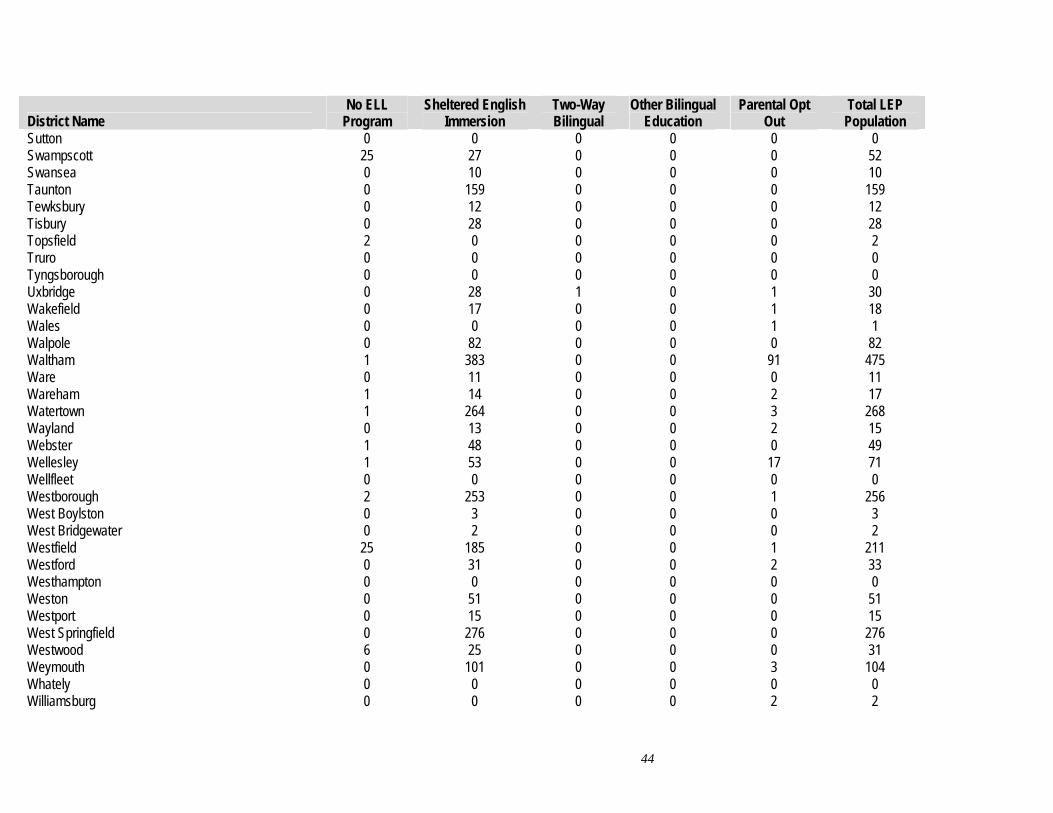
District Name No ELL
Program Sheltered English
Immersion Two-Way Bilingual
Other Bilingual Education
Parental Opt Out
Total LEP Population
Williamstown 0 9 0 0 0 9 Wilmington 0 22 0 0 0 22 Winchendon 0 11 0 0 0 11 Winchester 1 140 0 0 0 141 Winthrop 0 66 0 0 0 66 Woburn 1 195 0 0 0 196 Worcester 206 5922 27 177 56 6388 Wrentham 7 1 0 0 0 8 Northampton-Smith Voc Agr 0 0 0 5 0 5 Excel Academy CS 4 5 0 0 0 9 Four Rivers Charter Public 0 5 0 0 0 5 Berkshire Arts and TechCS 0 0 0 0 0 0 Amesbury Academy CS 0 0 0 0 0 0 Boston Preparatory CS 0 0 0 0 0 0 Christa McAuliffe Reg 0 5 0 0 0 5 Smith Leadership Academy CS 0 0 0 0 2 2 Benjamin Banneker CS 0 1 0 0 0 1 Barnstable Horace Mann CS 0 22 0 0 0 22 Boston Day and Eve CS 4 25 1 1 0 31 Barnstable Com Hrce Mann CS 0 35 0 0 0 35 Edward Brooke Charter 0 3 0 0 0 3 KIPP Academy Lynn Charter 0 3 0 0 1 4 Advanced Math and Science CS 0 0 0 0 0 0 Cape Cod Lighthouse Charter 0 0 0 0 0 0 Innovation Academy Charter 0 1 0 0 0 1 Community CS of Cambridge 0 7 0 0 3 10 City On A Hill Charter Public 0 4 0 0 0 4 Codman Academy CS 1 0 0 0 0 1 Conservatory Lab Charter 0 21 0 0 0 21 Community Day Charter Public 0 98 0 0 0 98 Sabis International Charter 25 0 0 0 0 25 Neighborhood House Charter 0 9 0 0 0 9 Abby Kelley Foster CS 0 27 0 0 1 28 Foxborough Regional CS 0 29 0 0 0 29
45
District Name No ELL
Program Sheltered English
Immersion Two-Way Bilingual
Other Bilingual Education
Parental Opt Out
Total LEP Population
Benjamin Franklin Classical CS 0 0 0 0 0 0 Boston Collegiate Charter 0 0 0 0 0 0 Hilltown Cooperative CS 0 1 0 0 0 1 Robert M Hughes Acad CS 0 0 0 0 0 0 EM Kennedy Acad Health Careers Horace Mann CS 0 2 0 0 0 2 Holyoke Community Charter 0 32 0 0 0 32 Lawrence Family Dev CS 0 0 252 0 0 252 Hill View Montessori CS 0 7 0 0 0 7 Lowell Community CS 0 247 0 0 0 247 Lowell Middlesex Acad CS 0 0 0 0 0 0 Marblehead Community CS 0 0 0 0 0 0 Marthas Vineyard CS 0 4 0 0 0 4 Ma Acad for Math and Science 0 0 0 0 0 0 MATCH Charter Public High 0 0 0 0 0 0 Mystic Valley Regional Charter 0 0 0 0 0 0 New Leadership Charter 0 4 0 0 0 4 North Central Charter Essential 0 3 0 0 0 3 Dorchester Collegiate Acad CS 0 0 0 0 0 0 Silver Hill Horace Mann Charter 0 31 0 0 0 31 Francis W Parker Ch Essential 0 0 0 0 0 0 Pioneer Valley Perf Arts CS 0 1 0 0 0 1 Boston Renaissance CS 0 58 0 0 0 58 River Valley Charter 0 0 0 0 0 0 Rising Tide Charter Public 0 0 0 0 0 0 Roxbury Preparatory Charter 0 6 0 0 0 6 Salem Academy Charter 0 16 0 0 0 16 Seven Hills Charter Public 0 108 0 0 2 110 Prospect Hill Academy Charter 0 29 0 0 0 29 South Shore Charter Public 0 0 0 0 0 0 Sturgis Charter Public 0 0 0 0 0 0 Atlantis Charter 0 0 0 0 0 0 MLK Jr CS of Excellence 0 20 0 0 0 20 Phoenix Charter Academy 0 25 0 0 0 25 Pioneer CS of Science 0 7 0 0 0 7
46
District Name No ELL
Program Sheltered English
Immersion Two-Way Bilingual
Other Bilingual Education
Parental Opt Out
Total LEP Population
29
Global Learning Charter Public 1 0 0 0 0 1 Pioneer Valley Chinese Imm CS 0 0 0 0 1 1 Hampden CS of Science 0 0 0 0 0 0 Acton-Boxborough 0 20 0 0 0 20 Adams-Cheshire 0 3 0 0 0 3 Amherst-Pelham 0 67 0 0 0 67 Ashburnham-Westminster 0 15 0 0 0 15 Athol-Royalston 0 13 0 2 0 15 Berkshire Hills 0 0 0 0 29 Berlin-Boylston 0 1 0 0 0 1 Blackstone-Millville 0 10 0 0 1 11 Bridgewater-Raynham 13 9 0 0 0 22 Chesterfield-Goshen 0 0 0 0 0 0 Central Berkshire 1 0 0 0 0 1 Concord-Carlisle 0 3 0 0 0 3 Dennis-Yarmouth 0 146 0 0 0 146 Dighton-Rehoboth 0 8 0 0 0 8 Dover-Sherborn 0 3 0 0 0 3 Dudley-Charlton Reg 2 47 0 0 1 50 Nauset 3 10 0 0 0 13 Farmington River Reg 0 0 0 0 0 0 Freetown-Lakeville 1 0 0 0 0 1 Frontier 0 9 0 0 0 9 Gateway 0 11 0 0 0 11 Groton-Dunstable 0 11 0 0 0 11 Gill-Montague 43 2 0 0 0 45 Hamilton-Wenham 35 5 0 1 2 43 Hampden-Wilbraham 0 24 0 0 0 24 Hampshire 0 0 0 0 0 0 Hawlemont 0 0 1 0 0 1 King Philip 0 2 0 0 0 2 Lincoln-Sudbury 0 4 0 0 0 4 Manchester Essex Regional 0 3 0 0 0 3 Marthas Vineyard 0 16 0 0 0 16
47
District Name No ELL
Program Sheltered English
Immersion Two-Way Bilingual
Other Bilingual Education
Parental Opt Out
Total LEP Population
Masconomet 2 0 0 0 0 2 Mendon-Upton 0 10 0 0 0 10 Mount Greylock 0 2 0 0 0 2 Mohawk Trail 2 4 1 0 0 7 Narragansett 0 3 0 0 0 3 Nashoba 0 17 0 0 0 17 New Salem-Wendell 0 0 0 0 0 0 Northboro-Southboro 1 6 0 0 0 7 North Middlesex 7 5 0 0 4 16 Old Rochester 1 0 0 0 0 1 Pentucket 0 3 0 0 0 3 Pioneer Valley 0 0 0 0 0 0 Quabbin 1 1 0 0 2 4 Ralph C Mahar 1 7 0 0 0 8 Silver Lake 1 0 0 0 0 1 Southern Berkshire 0 4 0 0 0 4 Southwick-Tolland 0 14 0 0 0 14 Spencer-E Brookfield 0 7 0 0 0 7 Tantasqua 0 0 0 0 0 0 Triton 0 24 0 0 0 24 Up-Island Regional 0 5 0 0 0 5 Wachusett 0 47 0 0 0 47 Quaboag Regional 0 1 0 0 0 1 Whitman-Hanson 0 9 0 0 0 9 Assabet Valley Reg Voc Tech 0 9 0 0 0 9 Blackstone Val Reg Voc Tech 0 0 0 0 0 0 Blue Hills Regional Voc Tech 0 5 0 0 0 5 Bristol-Plym Reg Voc Tech 0 2 0 0 0 2 Cape Cod Regional Voc Tech 0 5 0 0 0 5 Franklin County Reg Voc Tech 0 0 0 0 0 0 Grtr Fall River Reg Voc Tech 2 0 0 0 0 2 Grtr Lawrence Reg Voc Tech 0 31 2 0 1 34 Grtr Nw Bdfrd Reg Voc Tech 0 20 0 0 0 20 Grtr Lowell Reg Voc Tech 0 46 0 0 0 46
48
District Name No ELL
Program Sheltered English
Immersion Two-Way Bilingual
Other Bilingual Education
Parental Opt Out
Total LEP Population
S Middlesex Reg Voc Tech 0 40 0 0 0 40 Minuteman Reg Voc Tech 0 3 0 0 0 3 Montachusett Reg Voc Tech 0 8 0 0 0 8 N Berkshire Reg Voc Tech 0 0 0 0 0 0 Nashoba Valley Reg Voc 0 0 0 0 0 0 NE Metro Reg Voc Tech 0 57 0 0 0 57 North Shore Reg Voc Tech 0 3 0 0 0 3 Old Colony Reg Voc Tech 0 0 0 0 0 0 Pathfinder Reg Voc Tech 0 0 0 0 0 0 Shawsheen Val Reg Voc Tech 0 0 0 0 0 0 Southeastern Reg Voc Tech 0 9 0 0 0 9 South Shore Reg Voc Tech 0 0 0 0 0 0 S Worcester C Reg Voc Tech 1 0 0 3 0 4 Tri County Reg Voc Tech 0 1 0 0 0 1 Uppr Cape Cod Reg Voc Tech 0 0 0 0 0 0 Whittier Reg Voc Tech 0 6 0 0 0 6 Bristol County Agricultural 0 0 0 0 0 0 Essex Agricultural Technical 0 0 0 0 0 0 Norfolk County Agricultural 0 0 0 0 0 0 TOTALS 1113 49096 1229 1342 6378 59158
Source The Department Student Information Management System 2009
49
Attachment 8 English Language Learners in Massachusetts District and First Language October 2009
District Name Spanish Portuguese Cape
Verdean Creole Haitian Vietnamese Other LEP
Abington 3 3 0 0 0 4 10 Acton 8 7 0 0 0 66 81 Acushnet 0 1 0 0 0 0 1 Agawam 15 0 0 0 1 81 97 Amesbury 5 8 0 0 0 8 21 Amherst 60 4 2 0 2 107 175 Andover 12 3 0 0 1 67 83 Arlington 26 17 2 11 1 135 192 Ashland 9 35 0 0 1 22 67 Attleboro 170 9 1 1 2 84 267 Auburn 12 5 0 3 12 24 56 Avon 0 0 0 1 0 0 1 Ayer 36 13 0 0 0 11 60 Barnstable 39 111 0 2 0 24 176 Bedford 9 0 0 0 2 38 49 Belchertown 7 1 0 0 1 15 24 Bellingham 8 3 0 0 3 13 27 Belmont 5 2 0 0 0 85 92 Berlin 0 1 0 0 0 0 1 Beverly 6 8 0 0 1 24 39 Billerica 13 6 0 2 3 57 81 Boston 6434 210 900 947 723 2057 11271 Bourne 1 0 0 0 0 0 1 Boxborough 1 2 0 0 0 3 6 Boxford 1 0 0 0 0 3 4 Boylston 1 0 0 0 1 8 10 Braintree 13 3 4 1 13 77 111 Brewster 6 0 0 0 0 3 9 Brockton 484 131 1465 453 37 167 2737
50
District Name Spanish Portuguese Cape
Verdean Creole Haitian Vietnamese Other LEP
Brookline 43 16 2 2 6 427 496 Burlington 2 3 0 2 0 57 64 Cambridge 58 23 6 67 2 147 303 Canton 4 1 0 3 5 23 36 Carlisle 0 0 0 0 0 11 11 Carver 0 0 0 0 0 2 2 Chatham 10 2 0 3 0 4 19 Chelmsford 9 5 0 0 8 82 104 Chelsea 766 29 2 13 9 103 922 Chicopee 201 4 0 0 1 148 354 Clinton 106 17 0 11 0 10 144 Concord 13 1 0 0 2 20 36 Danvers 4 0 0 1 0 11 16 Dartmouth 2 19 0 0 0 18 39 Dedham 47 3 0 13 9 42 114 Deerfield 4 0 0 0 2 1 7 Douglas 0 2 0 0 0 1 3 Dover 0 0 0 2 0 7 9 Dracut 13 6 0 0 0 24 43 Eastham 1 0 0 0 0 0 1 Easthampton 12 0 0 0 1 27 40 East Longmeadow 0 0 0 0 0 2 2 Easton 4 7 1 3 4 18 37 Edgartown 2 24 0 0 0 0 26 Everett 308 119 1 96 12 44 580 Fairhaven 1 2 0 0 0 0 3 Fall River 297 122 16 2 10 67 514 Falmouth 5 12 0 0 4 23 44 Fitchburg 487 2 0 2 11 91 593 Foxborough 5 3 0 0 1 5 14 Framingham 589 553 0 17 3 109 1271
51
District Name Spanish Portuguese Cape
Verdean Creole Haitian Vietnamese Other LEP
Franklin 13 5 0 1 4 32 55 Gardner 80 1 0 3 2 9 95 Georgetown 0 0 0 0 0 2 2 Gloucester 38 20 0 0 4 13 75 Grafton 3 0 0 0 0 11 14 Granby 3 0 0 0 0 10 13 Greenfield 18 0 0 0 1 35 54 Hadley 8 0 0 0 0 8 16 Hanover 1 0 0 0 1 6 8 Harvard 1 0 0 0 0 1 2 Harwich 12 3 0 8 1 24 48 Haverhill 407 11 0 3 7 33 461 Hingham 0 1 0 0 0 9 10 Holbrook 8 4 0 5 1 8 26 Holland 0 1 0 0 0 0 1 Holliston 7 14 0 0 0 16 37 Holyoke 1361 0 0 0 2 14 1377 Hopedale 2 2 0 0 0 5 9 Hopkinton 7 1 0 0 0 30 38 Hudson 32 67 0 1 1 13 114 Hull 0 1 1 0 0 1 3 Ipswich 5 3 0 0 0 10 18 Kingston 0 2 0 0 0 1 3 Lanesborough 0 0 0 0 0 2 2 Lawrence 2732 3 0 5 32 63 2835 Lee 13 1 0 0 0 4 18 Leicester 7 0 0 0 6 8 21 Lenox 1 0 0 0 0 6 7 Leominster 277 44 0 2 3 72 398 Lexington 21 5 0 4 0 266 296 Lincoln 4 0 0 1 0 21 26
52
District Name Spanish Portuguese Cape
Verdean Creole Haitian Vietnamese Other LEP
Littleton 1 3 1 0 0 10 15 Longmeadow 5 2 0 0 1 31 39 Lowell 1595 324 3 14 131 2254 4321 Ludlow 6 11 0 0 0 25 42 Lunenburg 2 4 0 0 0 4 10 Lynn 2662 30 1 67 62 643 3465 Lynnfield 1 0 0 0 0 3 4 Malden 120 99 0 116 51 320 706 Mansfield 10 6 0 0 0 28 44 Marblehead 3 1 0 0 0 15 19 Marion 0 0 0 0 0 1 1 Marlborough 261 211 0 2 4 31 509 Marshfield 3 11 0 0 0 9 23 Mashpee 0 0 0 0 1 17 18 Mattapoisett 0 0 0 0 0 2 2 Maynard 14 11 0 2 0 6 33 Medfield 0 2 0 0 0 4 6 Medford 28 80 0 96 12 83 299 Medway 3 0 0 1 0 4 8 Melrose 4 5 0 7 2 58 76 Methuen 340 3 0 7 11 52 413 Middleborough 7 0 0 0 1 5 13 Middleton 2 1 0 0 0 10 13 Milford 100 101 0 0 2 24 227 Millbury 2 4 0 0 3 4 13 Millis 0 0 0 0 0 2 2 Milton 3 3 0 15 3 10 34 Monson 0 0 0 0 0 10 10 Nantucket 60 5 0 0 0 2 67 Natick 4 2 0 0 2 28 36 Needham 13 1 2 1 1 32 50
53
District Name Spanish Portuguese Cape
Verdean Creole Haitian Vietnamese Other LEP
New Bedford 289 31 1 2 5 133 461 Newburyport 4 3 0 0 0 5 12 Newton 112 22 0 7 11 536 688 North Adams 19 2 0 0 0 7 28 Northampton 40 0 0 0 0 10 50 North Andover 18 1 0 0 4 26 49 North Attleborough 19 0 0 0 1 18 38 Northborough 16 13 0 0 0 37 66 Northbridge 6 0 0 0 0 6 12 North Brookfield 0 0 0 0 0 3 3 North Reading 2 0 0 0 0 9 11 Norton 0 0 0 0 0 5 5 Norwell 2 0 0 0 0 1 3 Norwood 38 39 0 11 5 82 175 Oak Bluffs 0 19 0 0 0 1 20 Orleans 0 0 0 0 0 2 2 Oxford 3 0 0 0 0 2 5 Palmer 4 2 0 0 0 11 17 Peabody 175 100 0 0 11 70 356 Pittsfield 168 1 0 0 8 56 233 Plymouth 9 26 0 1 2 9 47 Provincetown 7 0 0 0 0 0 7 Quincy 41 31 0 6 126 840 1044 Randolph 17 6 3 71 54 33 184 Reading 1 3 0 0 1 11 16 Revere 392 39 0 8 31 155 625 Rockland 3 22 0 0 2 1 28 Rockport 1 0 0 0 0 4 5 Salem 430 9 0 5 7 56 507 Sandwich 0 0 0 0 0 1 1 Saugus 22 15 0 6 6 19 68
54
District Name Spanish Portuguese Cape
Verdean Creole Haitian Vietnamese Other LEP
Scituate 1 5 6 0 0 2 14 Seekonk 5 1 0 0 2 15 23 Sharon 1 0 0 5 6 32 44 Sherborn 0 0 0 0 0 1 1 Shirley 2 1 0 0 0 2 5 Shrewsbury 15 39 0 0 6 84 144 Somerset 0 0 0 0 0 2 2 Somerville 372 170 5 73 5 152 777 Southampton 1 0 0 0 0 2 3 Southborough 5 4 0 0 0 38 47 Southbridge 219 0 0 0 0 13 232 South Hadley 11 0 0 0 1 3 15 Springfield 2970 2 0 4 87 225 3288 Stoneham 17 11 0 1 3 26 58 Stoughton 21 60 8 17 9 51 166 Sturbridge 1 2 0 0 0 0 3 Sudbury 8 2 0 0 1 7 18 Sunderland 2 0 0 0 0 1 3 Swampscott 8 4 1 2 2 35 52 Swansea 3 2 0 0 0 5 10 Taunton 72 43 5 9 1 29 159 Tewksbury 2 1 0 0 2 7 12 Tisbury 0 26 0 0 0 2 28 Topsfield 0 0 0 0 0 2 2 Uxbridge 11 3 0 0 0 16 30 Wakefield 8 2 0 0 2 6 18 Wales 0 0 0 0 0 1 1 Walpole 18 14 0 13 1 36 82 Waltham 333 27 0 26 3 86 475 Ware 7 0 0 0 0 4 11 Wareham 4 2 0 0 2 9 17
55
District Name Spanish Portuguese Cape
Verdean Creole Haitian Vietnamese Other LEP
Watertown 52 32 0 2 0 182 268 Wayland 1 0 0 0 0 14 15 Webster 32 4 0 0 1 12 49 Wellesley 16 0 0 0 0 55 71 Westborough 43 38 0 1 0 174 256 West Boylston 0 1 0 0 0 2 3 West Bridgewater 0 0 0 2 0 0 2 Westfield 34 0 0 0 0 177 211 Westford 3 0 0 1 2 27 33 Weston 5 0 1 3 1 41 51 Westport 1 9 0 0 4 1 15 West Springfield 29 2 0 0 3 242 276 Westwood 3 0 0 0 0 28 31 Weymouth 12 49 0 1 4 38 104 Williamsburg 0 2 0 0 0 0 2 Williamstown 2 3 0 0 0 4 9 Wilmington 1 3 0 0 4 14 22 Winchendon 4 2 0 0 0 5 11 Winchester 10 10 0 2 2 117 141 Winthrop 18 9 0 1 0 38 66 Woburn 27 44 0 8 8 109 196 Worcester 3636 297 4 44 703 1704 6388 Wrentham 2 3 0 0 0 3 8 Northampton-Smith Voc Agr 5 0 0 0 0 0 5 Excel Academy CS 9 0 0 0 0 0 9 Academy Of the Pacific Rim CS 3 1 0 1 0 0 5 Boston Preparatory CS 3 0 0 2 0 0 5 Christa McAuliffe Regional CS 2 0 0 0 0 0 2 Smith Leadership Academy CS 1 0 0 0 0 0 1 Benjamin Banneker CS 5 0 0 16 0 1 22 Barnstable Horace Mann CS 6 16 0 0 0 9 31
56
District Name Spanish Portuguese Cape
Verdean Creole Haitian Vietnamese Other LEP
Barnstable Com Horace Mann CS 17 17 0 0 0 1 35 Edward Brooke CS 3 0 0 0 0 0 3 KIPP Academy Lynn CS 4 0 0 0 0 0 4 Innovation Academy CS 1 0 0 0 0 0 1 Community CS of Cambridge 3 0 0 5 0 2 10 City On A Hill CS 3 0 0 0 0 1 4 Codman Academy CS 1 0 0 0 0 0 1 Conservatory Lab Charter (District) 14 4 0 0 0 3 21 Community Day CS 96 0 0 2 0 0 98 Sabis International CS 17 0 0 0 4 4 25 Neighborhood House CS 3 0 1 1 3 1 9 Abby Kelley Foster CS 12 5 0 0 0 11 28 Foxborough Reg CS 2 0 0 5 0 22 29 Hilltown Cooperative CS 0 0 0 0 0 1 1 EM Kennedy Acad Health Careers HMCS 1 0 1 0 0 0 2 Holyoke Com CS 32 0 0 0 0 0 32 Lawrence Family Development CS 251 0 0 0 0 1 252 Hill View Montessori CS 6 0 0 0 0 1 7 Lowell Community CS 100 19 0 4 3 121 247 Marthas Vineyard CS 0 3 0 0 0 1 4 New Leadership Charter 3 0 0 0 0 1 4 North Central Charter Essential 2 0 0 0 0 1 3 Silver Hill Horace Mann Charter 25 1 0 1 0 4 31 Pioneer Valley Performing Arts CS 1 0 0 0 0 0 1 Boston Renaissance CS 43 1 2 4 1 7 58 Roxbury Preparatory CS 3 0 3 0 0 0 6 Salem Academy CS 13 0 0 0 0 3 16 Seven Hills CS 89 0 0 0 0 21 110 Prospect Hill Academy CS 9 4 0 11 0 5 29 MLK Jr CS of Excellence 19 0 0 1 0 0 20 Phoenix Charter Academy 23 0 0 1 0 1 25
57
District Name Spanish Portuguese Cape
Verdean Creole Haitian Vietnamese Other LEP
Pioneer Charter School of Science 2 3 0 2 0 0 7 Global Learning Charter Public 1 0 0 0 0 0 1 Pioneer Valley Chinese Imm CS 0 0 0 0 0 1 1 Acton-Boxborough 4 6 0 0 0 10 20 Adams-Cheshire 0 0 0 0 0 3 3 Amherst-Pelham 24 3 3 0 1 36 67 Ashburnham-Westminster 8 0 0 2 0 5 15 Athol-Royalston 8 0 0 0 0 7 15 Berkshire Hills 23 0 0 0 0 6 29 Berlin-Boylston 0 0 0 0 0 1 1 Blackstone-Millville 4 1 0 0 0 6 11 Bridgewater-Raynham 2 2 0 2 1 15 22 Central Berkshire 0 0 0 0 0 1 1 Concord-Carlisle 0 0 0 1 0 2 3 Dennis-Yarmouth 34 62 1 13 3 33 146 Dighton-Rehoboth 5 1 0 0 0 2 8 Dover-Sherborn 0 1 0 0 0 2 3 Dudley-Charlton Reg 14 4 0 0 0 32 50 Nauset 5 1 0 0 0 7 13 Freetown-Lakeville 0 1 0 0 0 0 1 Frontier 3 1 0 0 1 4 9 Gateway 1 0 0 0 0 10 11 Groton-Dunstable 6 1 0 0 0 4 11 Gill-Montague 24 0 0 1 0 20 45 Hamilton-Wenham 0 1 0 0 0 42 43 Hampden-Wilbraham 1 0 0 0 2 21 24 Hawlemont 0 1 0 0 0 0 1 King Philip 1 0 0 0 0 1 2 Lincoln-Sudbury 0 0 0 0 0 4 4 Manchester Essex Regional 0 0 0 0 0 3 3 Marthas Vineyard 0 16 0 0 0 0 16
58
District Name Spanish Portuguese Cape
Verdean Creole Haitian Vietnamese Other LEP
0 Masconomet 0 0 0 0 2 2 Mendon-Upton 1 1 0 0 0 8 10 Mount Greylock 0 0 0 0 0 2 2 Mohawk Trail 0 0 0 0 2 5 7 Narragansett 0 0 0 0 0 3 3 Nashoba 7 4 0 1 0 5 17 Northboro-Southboro 1 1 0 1 0 4 7 North Middlesex 11 1 0 0 0 4 16 Old Rochester 0 0 0 0 0 1 1 Pentucket 1 0 0 0 0 2 3 Quabbin 0 0 0 0 0 4 4 Ralph C Mahar 1 0 0 0 0 7 8 Silver Lake 0 0 0 0 0 1 1 Southern Berkshire 4 0 0 0 0 0 4 Southwick-Tolland 0 0 0 0 0 14 14 Spencer-E Brookfield 5 0 0 0 0 2 7 Triton 4 2 0 0 10 8 24 Up-Island Regional 2 1 0 0 0 2 5 Wachusett 3 3 0 0 7 34 47 Quaboag Regional 0 0 0 0 0 1 1 Whitman-Hanson 5 1 0 0 0 3 9 Assabet Valley Reg Voc Tech 8 1 0 0 0 0 9 Blue Hills Regional Vocational Technical 1 2 0 2 0 0 5 Bristol-Plymouth Reg Voc Tech 0 2 0 0 0 0 2 Cape Cod Reg Voc Tech 2 2 0 0 0 1 5 Greater Fall River Reg Voc Tech 1 1 0 0 0 0 2 Greater Lawrence Reg Voc Tech 33 0 0 0 0 1 34 GrNew Bedford Reg Voc Tech 14 6 0 0 0 0 20 Greater Lowell Reg Voc Tech 20 8 0 0 0 18 46 South Middlesex Reg Voc Tech 23 14 0 0 0 3 40 Minuteman Reg Voc Tech 2 0 0 0 0 1 3
59
60
District Name Spanish Portuguese Cape
Verdean Creole Haitian Vietnamese Other LEP
Montachusett Reg Voc Tech 4 0 0 0 0 4 8 Northeast Metro Reg Voc Tech 55 0 0 0 0 2 57 North Shore Reg Voc Tech 3 0 0 0 0 0 3 Southeastern Reg Voc Tech 0 2 3 3 0 1 9 Southern Worcester County Reg Voc Tech 3 0 0 0 0 1 4 Tri County Reg Voc Tech 0 1 0 0 0 0 1 Whittier Reg Voc Tech 6 0 0 0 0 0 6 TOTALS 31793 4209 2458 2433 2423 15842 59158
Source The Department Student Information Management System 2009
- Introduction
-
- Background
-
- I English Language Learners in Massachusetts
- II Educators Implementing Sheltered English Immersion Elementary and Secondary Content Teachers of English Language Learners
-
- Research on Professional Development for Educators of English Language Learners
- Gaps in Knowledge
-
- III Use of Funds for Category Training
-
- Future Need for Category Training
-
- IV Educators Implementing Sheltered English Immersion English as a Second Language (ESL) Teachers
-
- ESL Teacher Shortage
-
- V Use of Funds ESL Teachers and ESL Curriculum Development
-
- Massachusetts English Language Teacher Initiative (MELT)
- Improvement of Sheltered English Immersion Content-based ESL Instruction
- Future Need for ESL teachers
-
- VI Budget
- Attachments
-
- Attachment 1 All Massachusetts public school districts and changes in LEP population compared to changes in overall student population - SY 2006-SY 2010
- Attachment 1 Massachusetts public school districts and changes in LEP population compared to changes in overall student population - SY 2006-SY 2010
- Attachment 2 Massachusetts public school districts with large changes in LEP population compared to changes in overall student population - SY 2006-SY 2010
- Attachment 3 Bibliography Professional Development for Teachers of English Language Learners
- Attachment 4 Excerpts from the Commissionerrsquos Memorandum of June 2004 Guidance on Qualifications for Teachers of Limited English Proficient Students in Sheltered English Immersion Classrooms
- Attachment 5 Districts Receiving Sheltered English Immersion Professional Development 2004-2010
- Attachment 6 Collaboratives that have received grants for Sheltered English Immersion Professional Development 2004-2010
- Attachment 7 English Language Learners in Massachusetts District and Program Type October 2009
- Attachment 8 English Language Learners in Massachusetts District and First Language October 2009
-
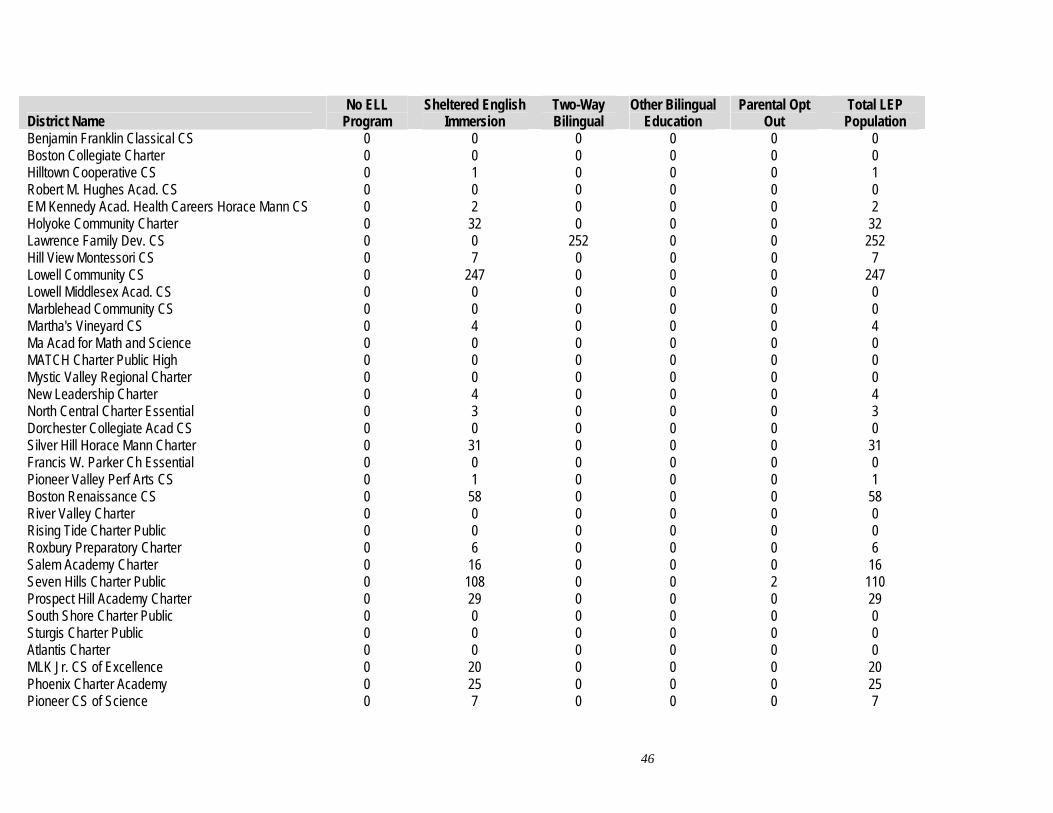
District Name No ELL
Program Sheltered English
Immersion Two-Way Bilingual
Other Bilingual Education
Parental Opt Out
Total LEP Population
Benjamin Franklin Classical CS 0 0 0 0 0 0 Boston Collegiate Charter 0 0 0 0 0 0 Hilltown Cooperative CS 0 1 0 0 0 1 Robert M Hughes Acad CS 0 0 0 0 0 0 EM Kennedy Acad Health Careers Horace Mann CS 0 2 0 0 0 2 Holyoke Community Charter 0 32 0 0 0 32 Lawrence Family Dev CS 0 0 252 0 0 252 Hill View Montessori CS 0 7 0 0 0 7 Lowell Community CS 0 247 0 0 0 247 Lowell Middlesex Acad CS 0 0 0 0 0 0 Marblehead Community CS 0 0 0 0 0 0 Marthas Vineyard CS 0 4 0 0 0 4 Ma Acad for Math and Science 0 0 0 0 0 0 MATCH Charter Public High 0 0 0 0 0 0 Mystic Valley Regional Charter 0 0 0 0 0 0 New Leadership Charter 0 4 0 0 0 4 North Central Charter Essential 0 3 0 0 0 3 Dorchester Collegiate Acad CS 0 0 0 0 0 0 Silver Hill Horace Mann Charter 0 31 0 0 0 31 Francis W Parker Ch Essential 0 0 0 0 0 0 Pioneer Valley Perf Arts CS 0 1 0 0 0 1 Boston Renaissance CS 0 58 0 0 0 58 River Valley Charter 0 0 0 0 0 0 Rising Tide Charter Public 0 0 0 0 0 0 Roxbury Preparatory Charter 0 6 0 0 0 6 Salem Academy Charter 0 16 0 0 0 16 Seven Hills Charter Public 0 108 0 0 2 110 Prospect Hill Academy Charter 0 29 0 0 0 29 South Shore Charter Public 0 0 0 0 0 0 Sturgis Charter Public 0 0 0 0 0 0 Atlantis Charter 0 0 0 0 0 0 MLK Jr CS of Excellence 0 20 0 0 0 20 Phoenix Charter Academy 0 25 0 0 0 25 Pioneer CS of Science 0 7 0 0 0 7
46
District Name No ELL
Program Sheltered English
Immersion Two-Way Bilingual
Other Bilingual Education
Parental Opt Out
Total LEP Population
29
Global Learning Charter Public 1 0 0 0 0 1 Pioneer Valley Chinese Imm CS 0 0 0 0 1 1 Hampden CS of Science 0 0 0 0 0 0 Acton-Boxborough 0 20 0 0 0 20 Adams-Cheshire 0 3 0 0 0 3 Amherst-Pelham 0 67 0 0 0 67 Ashburnham-Westminster 0 15 0 0 0 15 Athol-Royalston 0 13 0 2 0 15 Berkshire Hills 0 0 0 0 29 Berlin-Boylston 0 1 0 0 0 1 Blackstone-Millville 0 10 0 0 1 11 Bridgewater-Raynham 13 9 0 0 0 22 Chesterfield-Goshen 0 0 0 0 0 0 Central Berkshire 1 0 0 0 0 1 Concord-Carlisle 0 3 0 0 0 3 Dennis-Yarmouth 0 146 0 0 0 146 Dighton-Rehoboth 0 8 0 0 0 8 Dover-Sherborn 0 3 0 0 0 3 Dudley-Charlton Reg 2 47 0 0 1 50 Nauset 3 10 0 0 0 13 Farmington River Reg 0 0 0 0 0 0 Freetown-Lakeville 1 0 0 0 0 1 Frontier 0 9 0 0 0 9 Gateway 0 11 0 0 0 11 Groton-Dunstable 0 11 0 0 0 11 Gill-Montague 43 2 0 0 0 45 Hamilton-Wenham 35 5 0 1 2 43 Hampden-Wilbraham 0 24 0 0 0 24 Hampshire 0 0 0 0 0 0 Hawlemont 0 0 1 0 0 1 King Philip 0 2 0 0 0 2 Lincoln-Sudbury 0 4 0 0 0 4 Manchester Essex Regional 0 3 0 0 0 3 Marthas Vineyard 0 16 0 0 0 16
47
District Name No ELL
Program Sheltered English
Immersion Two-Way Bilingual
Other Bilingual Education
Parental Opt Out
Total LEP Population
Masconomet 2 0 0 0 0 2 Mendon-Upton 0 10 0 0 0 10 Mount Greylock 0 2 0 0 0 2 Mohawk Trail 2 4 1 0 0 7 Narragansett 0 3 0 0 0 3 Nashoba 0 17 0 0 0 17 New Salem-Wendell 0 0 0 0 0 0 Northboro-Southboro 1 6 0 0 0 7 North Middlesex 7 5 0 0 4 16 Old Rochester 1 0 0 0 0 1 Pentucket 0 3 0 0 0 3 Pioneer Valley 0 0 0 0 0 0 Quabbin 1 1 0 0 2 4 Ralph C Mahar 1 7 0 0 0 8 Silver Lake 1 0 0 0 0 1 Southern Berkshire 0 4 0 0 0 4 Southwick-Tolland 0 14 0 0 0 14 Spencer-E Brookfield 0 7 0 0 0 7 Tantasqua 0 0 0 0 0 0 Triton 0 24 0 0 0 24 Up-Island Regional 0 5 0 0 0 5 Wachusett 0 47 0 0 0 47 Quaboag Regional 0 1 0 0 0 1 Whitman-Hanson 0 9 0 0 0 9 Assabet Valley Reg Voc Tech 0 9 0 0 0 9 Blackstone Val Reg Voc Tech 0 0 0 0 0 0 Blue Hills Regional Voc Tech 0 5 0 0 0 5 Bristol-Plym Reg Voc Tech 0 2 0 0 0 2 Cape Cod Regional Voc Tech 0 5 0 0 0 5 Franklin County Reg Voc Tech 0 0 0 0 0 0 Grtr Fall River Reg Voc Tech 2 0 0 0 0 2 Grtr Lawrence Reg Voc Tech 0 31 2 0 1 34 Grtr Nw Bdfrd Reg Voc Tech 0 20 0 0 0 20 Grtr Lowell Reg Voc Tech 0 46 0 0 0 46
48
District Name No ELL
Program Sheltered English
Immersion Two-Way Bilingual
Other Bilingual Education
Parental Opt Out
Total LEP Population
S Middlesex Reg Voc Tech 0 40 0 0 0 40 Minuteman Reg Voc Tech 0 3 0 0 0 3 Montachusett Reg Voc Tech 0 8 0 0 0 8 N Berkshire Reg Voc Tech 0 0 0 0 0 0 Nashoba Valley Reg Voc 0 0 0 0 0 0 NE Metro Reg Voc Tech 0 57 0 0 0 57 North Shore Reg Voc Tech 0 3 0 0 0 3 Old Colony Reg Voc Tech 0 0 0 0 0 0 Pathfinder Reg Voc Tech 0 0 0 0 0 0 Shawsheen Val Reg Voc Tech 0 0 0 0 0 0 Southeastern Reg Voc Tech 0 9 0 0 0 9 South Shore Reg Voc Tech 0 0 0 0 0 0 S Worcester C Reg Voc Tech 1 0 0 3 0 4 Tri County Reg Voc Tech 0 1 0 0 0 1 Uppr Cape Cod Reg Voc Tech 0 0 0 0 0 0 Whittier Reg Voc Tech 0 6 0 0 0 6 Bristol County Agricultural 0 0 0 0 0 0 Essex Agricultural Technical 0 0 0 0 0 0 Norfolk County Agricultural 0 0 0 0 0 0 TOTALS 1113 49096 1229 1342 6378 59158
Source The Department Student Information Management System 2009
49
Attachment 8 English Language Learners in Massachusetts District and First Language October 2009
District Name Spanish Portuguese Cape
Verdean Creole Haitian Vietnamese Other LEP
Abington 3 3 0 0 0 4 10 Acton 8 7 0 0 0 66 81 Acushnet 0 1 0 0 0 0 1 Agawam 15 0 0 0 1 81 97 Amesbury 5 8 0 0 0 8 21 Amherst 60 4 2 0 2 107 175 Andover 12 3 0 0 1 67 83 Arlington 26 17 2 11 1 135 192 Ashland 9 35 0 0 1 22 67 Attleboro 170 9 1 1 2 84 267 Auburn 12 5 0 3 12 24 56 Avon 0 0 0 1 0 0 1 Ayer 36 13 0 0 0 11 60 Barnstable 39 111 0 2 0 24 176 Bedford 9 0 0 0 2 38 49 Belchertown 7 1 0 0 1 15 24 Bellingham 8 3 0 0 3 13 27 Belmont 5 2 0 0 0 85 92 Berlin 0 1 0 0 0 0 1 Beverly 6 8 0 0 1 24 39 Billerica 13 6 0 2 3 57 81 Boston 6434 210 900 947 723 2057 11271 Bourne 1 0 0 0 0 0 1 Boxborough 1 2 0 0 0 3 6 Boxford 1 0 0 0 0 3 4 Boylston 1 0 0 0 1 8 10 Braintree 13 3 4 1 13 77 111 Brewster 6 0 0 0 0 3 9 Brockton 484 131 1465 453 37 167 2737
50
District Name Spanish Portuguese Cape
Verdean Creole Haitian Vietnamese Other LEP
Brookline 43 16 2 2 6 427 496 Burlington 2 3 0 2 0 57 64 Cambridge 58 23 6 67 2 147 303 Canton 4 1 0 3 5 23 36 Carlisle 0 0 0 0 0 11 11 Carver 0 0 0 0 0 2 2 Chatham 10 2 0 3 0 4 19 Chelmsford 9 5 0 0 8 82 104 Chelsea 766 29 2 13 9 103 922 Chicopee 201 4 0 0 1 148 354 Clinton 106 17 0 11 0 10 144 Concord 13 1 0 0 2 20 36 Danvers 4 0 0 1 0 11 16 Dartmouth 2 19 0 0 0 18 39 Dedham 47 3 0 13 9 42 114 Deerfield 4 0 0 0 2 1 7 Douglas 0 2 0 0 0 1 3 Dover 0 0 0 2 0 7 9 Dracut 13 6 0 0 0 24 43 Eastham 1 0 0 0 0 0 1 Easthampton 12 0 0 0 1 27 40 East Longmeadow 0 0 0 0 0 2 2 Easton 4 7 1 3 4 18 37 Edgartown 2 24 0 0 0 0 26 Everett 308 119 1 96 12 44 580 Fairhaven 1 2 0 0 0 0 3 Fall River 297 122 16 2 10 67 514 Falmouth 5 12 0 0 4 23 44 Fitchburg 487 2 0 2 11 91 593 Foxborough 5 3 0 0 1 5 14 Framingham 589 553 0 17 3 109 1271
51
District Name Spanish Portuguese Cape
Verdean Creole Haitian Vietnamese Other LEP
Franklin 13 5 0 1 4 32 55 Gardner 80 1 0 3 2 9 95 Georgetown 0 0 0 0 0 2 2 Gloucester 38 20 0 0 4 13 75 Grafton 3 0 0 0 0 11 14 Granby 3 0 0 0 0 10 13 Greenfield 18 0 0 0 1 35 54 Hadley 8 0 0 0 0 8 16 Hanover 1 0 0 0 1 6 8 Harvard 1 0 0 0 0 1 2 Harwich 12 3 0 8 1 24 48 Haverhill 407 11 0 3 7 33 461 Hingham 0 1 0 0 0 9 10 Holbrook 8 4 0 5 1 8 26 Holland 0 1 0 0 0 0 1 Holliston 7 14 0 0 0 16 37 Holyoke 1361 0 0 0 2 14 1377 Hopedale 2 2 0 0 0 5 9 Hopkinton 7 1 0 0 0 30 38 Hudson 32 67 0 1 1 13 114 Hull 0 1 1 0 0 1 3 Ipswich 5 3 0 0 0 10 18 Kingston 0 2 0 0 0 1 3 Lanesborough 0 0 0 0 0 2 2 Lawrence 2732 3 0 5 32 63 2835 Lee 13 1 0 0 0 4 18 Leicester 7 0 0 0 6 8 21 Lenox 1 0 0 0 0 6 7 Leominster 277 44 0 2 3 72 398 Lexington 21 5 0 4 0 266 296 Lincoln 4 0 0 1 0 21 26
52
District Name Spanish Portuguese Cape
Verdean Creole Haitian Vietnamese Other LEP
Littleton 1 3 1 0 0 10 15 Longmeadow 5 2 0 0 1 31 39 Lowell 1595 324 3 14 131 2254 4321 Ludlow 6 11 0 0 0 25 42 Lunenburg 2 4 0 0 0 4 10 Lynn 2662 30 1 67 62 643 3465 Lynnfield 1 0 0 0 0 3 4 Malden 120 99 0 116 51 320 706 Mansfield 10 6 0 0 0 28 44 Marblehead 3 1 0 0 0 15 19 Marion 0 0 0 0 0 1 1 Marlborough 261 211 0 2 4 31 509 Marshfield 3 11 0 0 0 9 23 Mashpee 0 0 0 0 1 17 18 Mattapoisett 0 0 0 0 0 2 2 Maynard 14 11 0 2 0 6 33 Medfield 0 2 0 0 0 4 6 Medford 28 80 0 96 12 83 299 Medway 3 0 0 1 0 4 8 Melrose 4 5 0 7 2 58 76 Methuen 340 3 0 7 11 52 413 Middleborough 7 0 0 0 1 5 13 Middleton 2 1 0 0 0 10 13 Milford 100 101 0 0 2 24 227 Millbury 2 4 0 0 3 4 13 Millis 0 0 0 0 0 2 2 Milton 3 3 0 15 3 10 34 Monson 0 0 0 0 0 10 10 Nantucket 60 5 0 0 0 2 67 Natick 4 2 0 0 2 28 36 Needham 13 1 2 1 1 32 50
53
District Name Spanish Portuguese Cape
Verdean Creole Haitian Vietnamese Other LEP
New Bedford 289 31 1 2 5 133 461 Newburyport 4 3 0 0 0 5 12 Newton 112 22 0 7 11 536 688 North Adams 19 2 0 0 0 7 28 Northampton 40 0 0 0 0 10 50 North Andover 18 1 0 0 4 26 49 North Attleborough 19 0 0 0 1 18 38 Northborough 16 13 0 0 0 37 66 Northbridge 6 0 0 0 0 6 12 North Brookfield 0 0 0 0 0 3 3 North Reading 2 0 0 0 0 9 11 Norton 0 0 0 0 0 5 5 Norwell 2 0 0 0 0 1 3 Norwood 38 39 0 11 5 82 175 Oak Bluffs 0 19 0 0 0 1 20 Orleans 0 0 0 0 0 2 2 Oxford 3 0 0 0 0 2 5 Palmer 4 2 0 0 0 11 17 Peabody 175 100 0 0 11 70 356 Pittsfield 168 1 0 0 8 56 233 Plymouth 9 26 0 1 2 9 47 Provincetown 7 0 0 0 0 0 7 Quincy 41 31 0 6 126 840 1044 Randolph 17 6 3 71 54 33 184 Reading 1 3 0 0 1 11 16 Revere 392 39 0 8 31 155 625 Rockland 3 22 0 0 2 1 28 Rockport 1 0 0 0 0 4 5 Salem 430 9 0 5 7 56 507 Sandwich 0 0 0 0 0 1 1 Saugus 22 15 0 6 6 19 68
54
District Name Spanish Portuguese Cape
Verdean Creole Haitian Vietnamese Other LEP
Scituate 1 5 6 0 0 2 14 Seekonk 5 1 0 0 2 15 23 Sharon 1 0 0 5 6 32 44 Sherborn 0 0 0 0 0 1 1 Shirley 2 1 0 0 0 2 5 Shrewsbury 15 39 0 0 6 84 144 Somerset 0 0 0 0 0 2 2 Somerville 372 170 5 73 5 152 777 Southampton 1 0 0 0 0 2 3 Southborough 5 4 0 0 0 38 47 Southbridge 219 0 0 0 0 13 232 South Hadley 11 0 0 0 1 3 15 Springfield 2970 2 0 4 87 225 3288 Stoneham 17 11 0 1 3 26 58 Stoughton 21 60 8 17 9 51 166 Sturbridge 1 2 0 0 0 0 3 Sudbury 8 2 0 0 1 7 18 Sunderland 2 0 0 0 0 1 3 Swampscott 8 4 1 2 2 35 52 Swansea 3 2 0 0 0 5 10 Taunton 72 43 5 9 1 29 159 Tewksbury 2 1 0 0 2 7 12 Tisbury 0 26 0 0 0 2 28 Topsfield 0 0 0 0 0 2 2 Uxbridge 11 3 0 0 0 16 30 Wakefield 8 2 0 0 2 6 18 Wales 0 0 0 0 0 1 1 Walpole 18 14 0 13 1 36 82 Waltham 333 27 0 26 3 86 475 Ware 7 0 0 0 0 4 11 Wareham 4 2 0 0 2 9 17
55
District Name Spanish Portuguese Cape
Verdean Creole Haitian Vietnamese Other LEP
Watertown 52 32 0 2 0 182 268 Wayland 1 0 0 0 0 14 15 Webster 32 4 0 0 1 12 49 Wellesley 16 0 0 0 0 55 71 Westborough 43 38 0 1 0 174 256 West Boylston 0 1 0 0 0 2 3 West Bridgewater 0 0 0 2 0 0 2 Westfield 34 0 0 0 0 177 211 Westford 3 0 0 1 2 27 33 Weston 5 0 1 3 1 41 51 Westport 1 9 0 0 4 1 15 West Springfield 29 2 0 0 3 242 276 Westwood 3 0 0 0 0 28 31 Weymouth 12 49 0 1 4 38 104 Williamsburg 0 2 0 0 0 0 2 Williamstown 2 3 0 0 0 4 9 Wilmington 1 3 0 0 4 14 22 Winchendon 4 2 0 0 0 5 11 Winchester 10 10 0 2 2 117 141 Winthrop 18 9 0 1 0 38 66 Woburn 27 44 0 8 8 109 196 Worcester 3636 297 4 44 703 1704 6388 Wrentham 2 3 0 0 0 3 8 Northampton-Smith Voc Agr 5 0 0 0 0 0 5 Excel Academy CS 9 0 0 0 0 0 9 Academy Of the Pacific Rim CS 3 1 0 1 0 0 5 Boston Preparatory CS 3 0 0 2 0 0 5 Christa McAuliffe Regional CS 2 0 0 0 0 0 2 Smith Leadership Academy CS 1 0 0 0 0 0 1 Benjamin Banneker CS 5 0 0 16 0 1 22 Barnstable Horace Mann CS 6 16 0 0 0 9 31
56
District Name Spanish Portuguese Cape
Verdean Creole Haitian Vietnamese Other LEP
Barnstable Com Horace Mann CS 17 17 0 0 0 1 35 Edward Brooke CS 3 0 0 0 0 0 3 KIPP Academy Lynn CS 4 0 0 0 0 0 4 Innovation Academy CS 1 0 0 0 0 0 1 Community CS of Cambridge 3 0 0 5 0 2 10 City On A Hill CS 3 0 0 0 0 1 4 Codman Academy CS 1 0 0 0 0 0 1 Conservatory Lab Charter (District) 14 4 0 0 0 3 21 Community Day CS 96 0 0 2 0 0 98 Sabis International CS 17 0 0 0 4 4 25 Neighborhood House CS 3 0 1 1 3 1 9 Abby Kelley Foster CS 12 5 0 0 0 11 28 Foxborough Reg CS 2 0 0 5 0 22 29 Hilltown Cooperative CS 0 0 0 0 0 1 1 EM Kennedy Acad Health Careers HMCS 1 0 1 0 0 0 2 Holyoke Com CS 32 0 0 0 0 0 32 Lawrence Family Development CS 251 0 0 0 0 1 252 Hill View Montessori CS 6 0 0 0 0 1 7 Lowell Community CS 100 19 0 4 3 121 247 Marthas Vineyard CS 0 3 0 0 0 1 4 New Leadership Charter 3 0 0 0 0 1 4 North Central Charter Essential 2 0 0 0 0 1 3 Silver Hill Horace Mann Charter 25 1 0 1 0 4 31 Pioneer Valley Performing Arts CS 1 0 0 0 0 0 1 Boston Renaissance CS 43 1 2 4 1 7 58 Roxbury Preparatory CS 3 0 3 0 0 0 6 Salem Academy CS 13 0 0 0 0 3 16 Seven Hills CS 89 0 0 0 0 21 110 Prospect Hill Academy CS 9 4 0 11 0 5 29 MLK Jr CS of Excellence 19 0 0 1 0 0 20 Phoenix Charter Academy 23 0 0 1 0 1 25
57
District Name Spanish Portuguese Cape
Verdean Creole Haitian Vietnamese Other LEP
Pioneer Charter School of Science 2 3 0 2 0 0 7 Global Learning Charter Public 1 0 0 0 0 0 1 Pioneer Valley Chinese Imm CS 0 0 0 0 0 1 1 Acton-Boxborough 4 6 0 0 0 10 20 Adams-Cheshire 0 0 0 0 0 3 3 Amherst-Pelham 24 3 3 0 1 36 67 Ashburnham-Westminster 8 0 0 2 0 5 15 Athol-Royalston 8 0 0 0 0 7 15 Berkshire Hills 23 0 0 0 0 6 29 Berlin-Boylston 0 0 0 0 0 1 1 Blackstone-Millville 4 1 0 0 0 6 11 Bridgewater-Raynham 2 2 0 2 1 15 22 Central Berkshire 0 0 0 0 0 1 1 Concord-Carlisle 0 0 0 1 0 2 3 Dennis-Yarmouth 34 62 1 13 3 33 146 Dighton-Rehoboth 5 1 0 0 0 2 8 Dover-Sherborn 0 1 0 0 0 2 3 Dudley-Charlton Reg 14 4 0 0 0 32 50 Nauset 5 1 0 0 0 7 13 Freetown-Lakeville 0 1 0 0 0 0 1 Frontier 3 1 0 0 1 4 9 Gateway 1 0 0 0 0 10 11 Groton-Dunstable 6 1 0 0 0 4 11 Gill-Montague 24 0 0 1 0 20 45 Hamilton-Wenham 0 1 0 0 0 42 43 Hampden-Wilbraham 1 0 0 0 2 21 24 Hawlemont 0 1 0 0 0 0 1 King Philip 1 0 0 0 0 1 2 Lincoln-Sudbury 0 0 0 0 0 4 4 Manchester Essex Regional 0 0 0 0 0 3 3 Marthas Vineyard 0 16 0 0 0 0 16
58
District Name Spanish Portuguese Cape
Verdean Creole Haitian Vietnamese Other LEP
0 Masconomet 0 0 0 0 2 2 Mendon-Upton 1 1 0 0 0 8 10 Mount Greylock 0 0 0 0 0 2 2 Mohawk Trail 0 0 0 0 2 5 7 Narragansett 0 0 0 0 0 3 3 Nashoba 7 4 0 1 0 5 17 Northboro-Southboro 1 1 0 1 0 4 7 North Middlesex 11 1 0 0 0 4 16 Old Rochester 0 0 0 0 0 1 1 Pentucket 1 0 0 0 0 2 3 Quabbin 0 0 0 0 0 4 4 Ralph C Mahar 1 0 0 0 0 7 8 Silver Lake 0 0 0 0 0 1 1 Southern Berkshire 4 0 0 0 0 0 4 Southwick-Tolland 0 0 0 0 0 14 14 Spencer-E Brookfield 5 0 0 0 0 2 7 Triton 4 2 0 0 10 8 24 Up-Island Regional 2 1 0 0 0 2 5 Wachusett 3 3 0 0 7 34 47 Quaboag Regional 0 0 0 0 0 1 1 Whitman-Hanson 5 1 0 0 0 3 9 Assabet Valley Reg Voc Tech 8 1 0 0 0 0 9 Blue Hills Regional Vocational Technical 1 2 0 2 0 0 5 Bristol-Plymouth Reg Voc Tech 0 2 0 0 0 0 2 Cape Cod Reg Voc Tech 2 2 0 0 0 1 5 Greater Fall River Reg Voc Tech 1 1 0 0 0 0 2 Greater Lawrence Reg Voc Tech 33 0 0 0 0 1 34 GrNew Bedford Reg Voc Tech 14 6 0 0 0 0 20 Greater Lowell Reg Voc Tech 20 8 0 0 0 18 46 South Middlesex Reg Voc Tech 23 14 0 0 0 3 40 Minuteman Reg Voc Tech 2 0 0 0 0 1 3
59
60
District Name Spanish Portuguese Cape
Verdean Creole Haitian Vietnamese Other LEP
Montachusett Reg Voc Tech 4 0 0 0 0 4 8 Northeast Metro Reg Voc Tech 55 0 0 0 0 2 57 North Shore Reg Voc Tech 3 0 0 0 0 0 3 Southeastern Reg Voc Tech 0 2 3 3 0 1 9 Southern Worcester County Reg Voc Tech 3 0 0 0 0 1 4 Tri County Reg Voc Tech 0 1 0 0 0 0 1 Whittier Reg Voc Tech 6 0 0 0 0 0 6 TOTALS 31793 4209 2458 2433 2423 15842 59158
Source The Department Student Information Management System 2009
- Introduction
-
- Background
-
- I English Language Learners in Massachusetts
- II Educators Implementing Sheltered English Immersion Elementary and Secondary Content Teachers of English Language Learners
-
- Research on Professional Development for Educators of English Language Learners
- Gaps in Knowledge
-
- III Use of Funds for Category Training
-
- Future Need for Category Training
-
- IV Educators Implementing Sheltered English Immersion English as a Second Language (ESL) Teachers
-
- ESL Teacher Shortage
-
- V Use of Funds ESL Teachers and ESL Curriculum Development
-
- Massachusetts English Language Teacher Initiative (MELT)
- Improvement of Sheltered English Immersion Content-based ESL Instruction
- Future Need for ESL teachers
-
- VI Budget
- Attachments
-
- Attachment 1 All Massachusetts public school districts and changes in LEP population compared to changes in overall student population - SY 2006-SY 2010
- Attachment 1 Massachusetts public school districts and changes in LEP population compared to changes in overall student population - SY 2006-SY 2010
- Attachment 2 Massachusetts public school districts with large changes in LEP population compared to changes in overall student population - SY 2006-SY 2010
- Attachment 3 Bibliography Professional Development for Teachers of English Language Learners
- Attachment 4 Excerpts from the Commissionerrsquos Memorandum of June 2004 Guidance on Qualifications for Teachers of Limited English Proficient Students in Sheltered English Immersion Classrooms
- Attachment 5 Districts Receiving Sheltered English Immersion Professional Development 2004-2010
- Attachment 6 Collaboratives that have received grants for Sheltered English Immersion Professional Development 2004-2010
- Attachment 7 English Language Learners in Massachusetts District and Program Type October 2009
- Attachment 8 English Language Learners in Massachusetts District and First Language October 2009
-
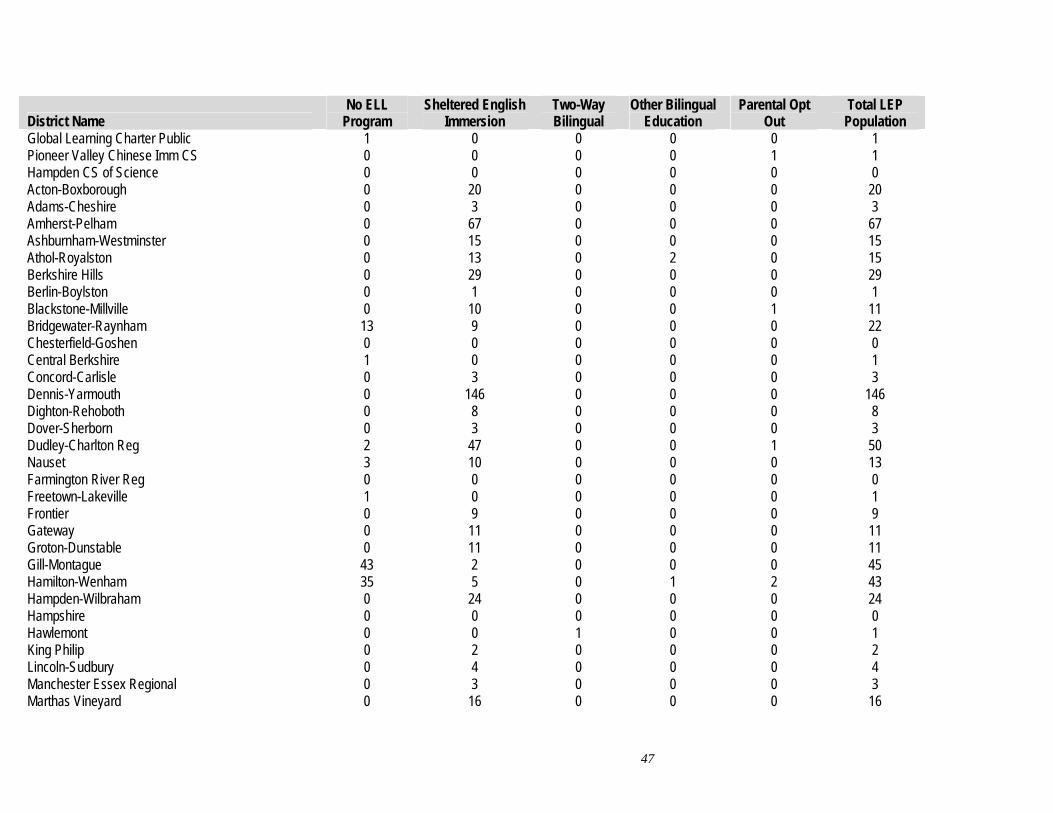
District Name No ELL
Program Sheltered English
Immersion Two-Way Bilingual
Other Bilingual Education
Parental Opt Out
Total LEP Population
29
Global Learning Charter Public 1 0 0 0 0 1 Pioneer Valley Chinese Imm CS 0 0 0 0 1 1 Hampden CS of Science 0 0 0 0 0 0 Acton-Boxborough 0 20 0 0 0 20 Adams-Cheshire 0 3 0 0 0 3 Amherst-Pelham 0 67 0 0 0 67 Ashburnham-Westminster 0 15 0 0 0 15 Athol-Royalston 0 13 0 2 0 15 Berkshire Hills 0 0 0 0 29 Berlin-Boylston 0 1 0 0 0 1 Blackstone-Millville 0 10 0 0 1 11 Bridgewater-Raynham 13 9 0 0 0 22 Chesterfield-Goshen 0 0 0 0 0 0 Central Berkshire 1 0 0 0 0 1 Concord-Carlisle 0 3 0 0 0 3 Dennis-Yarmouth 0 146 0 0 0 146 Dighton-Rehoboth 0 8 0 0 0 8 Dover-Sherborn 0 3 0 0 0 3 Dudley-Charlton Reg 2 47 0 0 1 50 Nauset 3 10 0 0 0 13 Farmington River Reg 0 0 0 0 0 0 Freetown-Lakeville 1 0 0 0 0 1 Frontier 0 9 0 0 0 9 Gateway 0 11 0 0 0 11 Groton-Dunstable 0 11 0 0 0 11 Gill-Montague 43 2 0 0 0 45 Hamilton-Wenham 35 5 0 1 2 43 Hampden-Wilbraham 0 24 0 0 0 24 Hampshire 0 0 0 0 0 0 Hawlemont 0 0 1 0 0 1 King Philip 0 2 0 0 0 2 Lincoln-Sudbury 0 4 0 0 0 4 Manchester Essex Regional 0 3 0 0 0 3 Marthas Vineyard 0 16 0 0 0 16
47
District Name No ELL
Program Sheltered English
Immersion Two-Way Bilingual
Other Bilingual Education
Parental Opt Out
Total LEP Population
Masconomet 2 0 0 0 0 2 Mendon-Upton 0 10 0 0 0 10 Mount Greylock 0 2 0 0 0 2 Mohawk Trail 2 4 1 0 0 7 Narragansett 0 3 0 0 0 3 Nashoba 0 17 0 0 0 17 New Salem-Wendell 0 0 0 0 0 0 Northboro-Southboro 1 6 0 0 0 7 North Middlesex 7 5 0 0 4 16 Old Rochester 1 0 0 0 0 1 Pentucket 0 3 0 0 0 3 Pioneer Valley 0 0 0 0 0 0 Quabbin 1 1 0 0 2 4 Ralph C Mahar 1 7 0 0 0 8 Silver Lake 1 0 0 0 0 1 Southern Berkshire 0 4 0 0 0 4 Southwick-Tolland 0 14 0 0 0 14 Spencer-E Brookfield 0 7 0 0 0 7 Tantasqua 0 0 0 0 0 0 Triton 0 24 0 0 0 24 Up-Island Regional 0 5 0 0 0 5 Wachusett 0 47 0 0 0 47 Quaboag Regional 0 1 0 0 0 1 Whitman-Hanson 0 9 0 0 0 9 Assabet Valley Reg Voc Tech 0 9 0 0 0 9 Blackstone Val Reg Voc Tech 0 0 0 0 0 0 Blue Hills Regional Voc Tech 0 5 0 0 0 5 Bristol-Plym Reg Voc Tech 0 2 0 0 0 2 Cape Cod Regional Voc Tech 0 5 0 0 0 5 Franklin County Reg Voc Tech 0 0 0 0 0 0 Grtr Fall River Reg Voc Tech 2 0 0 0 0 2 Grtr Lawrence Reg Voc Tech 0 31 2 0 1 34 Grtr Nw Bdfrd Reg Voc Tech 0 20 0 0 0 20 Grtr Lowell Reg Voc Tech 0 46 0 0 0 46
48
District Name No ELL
Program Sheltered English
Immersion Two-Way Bilingual
Other Bilingual Education
Parental Opt Out
Total LEP Population
S Middlesex Reg Voc Tech 0 40 0 0 0 40 Minuteman Reg Voc Tech 0 3 0 0 0 3 Montachusett Reg Voc Tech 0 8 0 0 0 8 N Berkshire Reg Voc Tech 0 0 0 0 0 0 Nashoba Valley Reg Voc 0 0 0 0 0 0 NE Metro Reg Voc Tech 0 57 0 0 0 57 North Shore Reg Voc Tech 0 3 0 0 0 3 Old Colony Reg Voc Tech 0 0 0 0 0 0 Pathfinder Reg Voc Tech 0 0 0 0 0 0 Shawsheen Val Reg Voc Tech 0 0 0 0 0 0 Southeastern Reg Voc Tech 0 9 0 0 0 9 South Shore Reg Voc Tech 0 0 0 0 0 0 S Worcester C Reg Voc Tech 1 0 0 3 0 4 Tri County Reg Voc Tech 0 1 0 0 0 1 Uppr Cape Cod Reg Voc Tech 0 0 0 0 0 0 Whittier Reg Voc Tech 0 6 0 0 0 6 Bristol County Agricultural 0 0 0 0 0 0 Essex Agricultural Technical 0 0 0 0 0 0 Norfolk County Agricultural 0 0 0 0 0 0 TOTALS 1113 49096 1229 1342 6378 59158
Source The Department Student Information Management System 2009
49
Attachment 8 English Language Learners in Massachusetts District and First Language October 2009
District Name Spanish Portuguese Cape
Verdean Creole Haitian Vietnamese Other LEP
Abington 3 3 0 0 0 4 10 Acton 8 7 0 0 0 66 81 Acushnet 0 1 0 0 0 0 1 Agawam 15 0 0 0 1 81 97 Amesbury 5 8 0 0 0 8 21 Amherst 60 4 2 0 2 107 175 Andover 12 3 0 0 1 67 83 Arlington 26 17 2 11 1 135 192 Ashland 9 35 0 0 1 22 67 Attleboro 170 9 1 1 2 84 267 Auburn 12 5 0 3 12 24 56 Avon 0 0 0 1 0 0 1 Ayer 36 13 0 0 0 11 60 Barnstable 39 111 0 2 0 24 176 Bedford 9 0 0 0 2 38 49 Belchertown 7 1 0 0 1 15 24 Bellingham 8 3 0 0 3 13 27 Belmont 5 2 0 0 0 85 92 Berlin 0 1 0 0 0 0 1 Beverly 6 8 0 0 1 24 39 Billerica 13 6 0 2 3 57 81 Boston 6434 210 900 947 723 2057 11271 Bourne 1 0 0 0 0 0 1 Boxborough 1 2 0 0 0 3 6 Boxford 1 0 0 0 0 3 4 Boylston 1 0 0 0 1 8 10 Braintree 13 3 4 1 13 77 111 Brewster 6 0 0 0 0 3 9 Brockton 484 131 1465 453 37 167 2737
50
District Name Spanish Portuguese Cape
Verdean Creole Haitian Vietnamese Other LEP
Brookline 43 16 2 2 6 427 496 Burlington 2 3 0 2 0 57 64 Cambridge 58 23 6 67 2 147 303 Canton 4 1 0 3 5 23 36 Carlisle 0 0 0 0 0 11 11 Carver 0 0 0 0 0 2 2 Chatham 10 2 0 3 0 4 19 Chelmsford 9 5 0 0 8 82 104 Chelsea 766 29 2 13 9 103 922 Chicopee 201 4 0 0 1 148 354 Clinton 106 17 0 11 0 10 144 Concord 13 1 0 0 2 20 36 Danvers 4 0 0 1 0 11 16 Dartmouth 2 19 0 0 0 18 39 Dedham 47 3 0 13 9 42 114 Deerfield 4 0 0 0 2 1 7 Douglas 0 2 0 0 0 1 3 Dover 0 0 0 2 0 7 9 Dracut 13 6 0 0 0 24 43 Eastham 1 0 0 0 0 0 1 Easthampton 12 0 0 0 1 27 40 East Longmeadow 0 0 0 0 0 2 2 Easton 4 7 1 3 4 18 37 Edgartown 2 24 0 0 0 0 26 Everett 308 119 1 96 12 44 580 Fairhaven 1 2 0 0 0 0 3 Fall River 297 122 16 2 10 67 514 Falmouth 5 12 0 0 4 23 44 Fitchburg 487 2 0 2 11 91 593 Foxborough 5 3 0 0 1 5 14 Framingham 589 553 0 17 3 109 1271
51
District Name Spanish Portuguese Cape
Verdean Creole Haitian Vietnamese Other LEP
Franklin 13 5 0 1 4 32 55 Gardner 80 1 0 3 2 9 95 Georgetown 0 0 0 0 0 2 2 Gloucester 38 20 0 0 4 13 75 Grafton 3 0 0 0 0 11 14 Granby 3 0 0 0 0 10 13 Greenfield 18 0 0 0 1 35 54 Hadley 8 0 0 0 0 8 16 Hanover 1 0 0 0 1 6 8 Harvard 1 0 0 0 0 1 2 Harwich 12 3 0 8 1 24 48 Haverhill 407 11 0 3 7 33 461 Hingham 0 1 0 0 0 9 10 Holbrook 8 4 0 5 1 8 26 Holland 0 1 0 0 0 0 1 Holliston 7 14 0 0 0 16 37 Holyoke 1361 0 0 0 2 14 1377 Hopedale 2 2 0 0 0 5 9 Hopkinton 7 1 0 0 0 30 38 Hudson 32 67 0 1 1 13 114 Hull 0 1 1 0 0 1 3 Ipswich 5 3 0 0 0 10 18 Kingston 0 2 0 0 0 1 3 Lanesborough 0 0 0 0 0 2 2 Lawrence 2732 3 0 5 32 63 2835 Lee 13 1 0 0 0 4 18 Leicester 7 0 0 0 6 8 21 Lenox 1 0 0 0 0 6 7 Leominster 277 44 0 2 3 72 398 Lexington 21 5 0 4 0 266 296 Lincoln 4 0 0 1 0 21 26
52
District Name Spanish Portuguese Cape
Verdean Creole Haitian Vietnamese Other LEP
Littleton 1 3 1 0 0 10 15 Longmeadow 5 2 0 0 1 31 39 Lowell 1595 324 3 14 131 2254 4321 Ludlow 6 11 0 0 0 25 42 Lunenburg 2 4 0 0 0 4 10 Lynn 2662 30 1 67 62 643 3465 Lynnfield 1 0 0 0 0 3 4 Malden 120 99 0 116 51 320 706 Mansfield 10 6 0 0 0 28 44 Marblehead 3 1 0 0 0 15 19 Marion 0 0 0 0 0 1 1 Marlborough 261 211 0 2 4 31 509 Marshfield 3 11 0 0 0 9 23 Mashpee 0 0 0 0 1 17 18 Mattapoisett 0 0 0 0 0 2 2 Maynard 14 11 0 2 0 6 33 Medfield 0 2 0 0 0 4 6 Medford 28 80 0 96 12 83 299 Medway 3 0 0 1 0 4 8 Melrose 4 5 0 7 2 58 76 Methuen 340 3 0 7 11 52 413 Middleborough 7 0 0 0 1 5 13 Middleton 2 1 0 0 0 10 13 Milford 100 101 0 0 2 24 227 Millbury 2 4 0 0 3 4 13 Millis 0 0 0 0 0 2 2 Milton 3 3 0 15 3 10 34 Monson 0 0 0 0 0 10 10 Nantucket 60 5 0 0 0 2 67 Natick 4 2 0 0 2 28 36 Needham 13 1 2 1 1 32 50
53
District Name Spanish Portuguese Cape
Verdean Creole Haitian Vietnamese Other LEP
New Bedford 289 31 1 2 5 133 461 Newburyport 4 3 0 0 0 5 12 Newton 112 22 0 7 11 536 688 North Adams 19 2 0 0 0 7 28 Northampton 40 0 0 0 0 10 50 North Andover 18 1 0 0 4 26 49 North Attleborough 19 0 0 0 1 18 38 Northborough 16 13 0 0 0 37 66 Northbridge 6 0 0 0 0 6 12 North Brookfield 0 0 0 0 0 3 3 North Reading 2 0 0 0 0 9 11 Norton 0 0 0 0 0 5 5 Norwell 2 0 0 0 0 1 3 Norwood 38 39 0 11 5 82 175 Oak Bluffs 0 19 0 0 0 1 20 Orleans 0 0 0 0 0 2 2 Oxford 3 0 0 0 0 2 5 Palmer 4 2 0 0 0 11 17 Peabody 175 100 0 0 11 70 356 Pittsfield 168 1 0 0 8 56 233 Plymouth 9 26 0 1 2 9 47 Provincetown 7 0 0 0 0 0 7 Quincy 41 31 0 6 126 840 1044 Randolph 17 6 3 71 54 33 184 Reading 1 3 0 0 1 11 16 Revere 392 39 0 8 31 155 625 Rockland 3 22 0 0 2 1 28 Rockport 1 0 0 0 0 4 5 Salem 430 9 0 5 7 56 507 Sandwich 0 0 0 0 0 1 1 Saugus 22 15 0 6 6 19 68
54
District Name Spanish Portuguese Cape
Verdean Creole Haitian Vietnamese Other LEP
Scituate 1 5 6 0 0 2 14 Seekonk 5 1 0 0 2 15 23 Sharon 1 0 0 5 6 32 44 Sherborn 0 0 0 0 0 1 1 Shirley 2 1 0 0 0 2 5 Shrewsbury 15 39 0 0 6 84 144 Somerset 0 0 0 0 0 2 2 Somerville 372 170 5 73 5 152 777 Southampton 1 0 0 0 0 2 3 Southborough 5 4 0 0 0 38 47 Southbridge 219 0 0 0 0 13 232 South Hadley 11 0 0 0 1 3 15 Springfield 2970 2 0 4 87 225 3288 Stoneham 17 11 0 1 3 26 58 Stoughton 21 60 8 17 9 51 166 Sturbridge 1 2 0 0 0 0 3 Sudbury 8 2 0 0 1 7 18 Sunderland 2 0 0 0 0 1 3 Swampscott 8 4 1 2 2 35 52 Swansea 3 2 0 0 0 5 10 Taunton 72 43 5 9 1 29 159 Tewksbury 2 1 0 0 2 7 12 Tisbury 0 26 0 0 0 2 28 Topsfield 0 0 0 0 0 2 2 Uxbridge 11 3 0 0 0 16 30 Wakefield 8 2 0 0 2 6 18 Wales 0 0 0 0 0 1 1 Walpole 18 14 0 13 1 36 82 Waltham 333 27 0 26 3 86 475 Ware 7 0 0 0 0 4 11 Wareham 4 2 0 0 2 9 17
55
District Name Spanish Portuguese Cape
Verdean Creole Haitian Vietnamese Other LEP
Watertown 52 32 0 2 0 182 268 Wayland 1 0 0 0 0 14 15 Webster 32 4 0 0 1 12 49 Wellesley 16 0 0 0 0 55 71 Westborough 43 38 0 1 0 174 256 West Boylston 0 1 0 0 0 2 3 West Bridgewater 0 0 0 2 0 0 2 Westfield 34 0 0 0 0 177 211 Westford 3 0 0 1 2 27 33 Weston 5 0 1 3 1 41 51 Westport 1 9 0 0 4 1 15 West Springfield 29 2 0 0 3 242 276 Westwood 3 0 0 0 0 28 31 Weymouth 12 49 0 1 4 38 104 Williamsburg 0 2 0 0 0 0 2 Williamstown 2 3 0 0 0 4 9 Wilmington 1 3 0 0 4 14 22 Winchendon 4 2 0 0 0 5 11 Winchester 10 10 0 2 2 117 141 Winthrop 18 9 0 1 0 38 66 Woburn 27 44 0 8 8 109 196 Worcester 3636 297 4 44 703 1704 6388 Wrentham 2 3 0 0 0 3 8 Northampton-Smith Voc Agr 5 0 0 0 0 0 5 Excel Academy CS 9 0 0 0 0 0 9 Academy Of the Pacific Rim CS 3 1 0 1 0 0 5 Boston Preparatory CS 3 0 0 2 0 0 5 Christa McAuliffe Regional CS 2 0 0 0 0 0 2 Smith Leadership Academy CS 1 0 0 0 0 0 1 Benjamin Banneker CS 5 0 0 16 0 1 22 Barnstable Horace Mann CS 6 16 0 0 0 9 31
56
District Name Spanish Portuguese Cape
Verdean Creole Haitian Vietnamese Other LEP
Barnstable Com Horace Mann CS 17 17 0 0 0 1 35 Edward Brooke CS 3 0 0 0 0 0 3 KIPP Academy Lynn CS 4 0 0 0 0 0 4 Innovation Academy CS 1 0 0 0 0 0 1 Community CS of Cambridge 3 0 0 5 0 2 10 City On A Hill CS 3 0 0 0 0 1 4 Codman Academy CS 1 0 0 0 0 0 1 Conservatory Lab Charter (District) 14 4 0 0 0 3 21 Community Day CS 96 0 0 2 0 0 98 Sabis International CS 17 0 0 0 4 4 25 Neighborhood House CS 3 0 1 1 3 1 9 Abby Kelley Foster CS 12 5 0 0 0 11 28 Foxborough Reg CS 2 0 0 5 0 22 29 Hilltown Cooperative CS 0 0 0 0 0 1 1 EM Kennedy Acad Health Careers HMCS 1 0 1 0 0 0 2 Holyoke Com CS 32 0 0 0 0 0 32 Lawrence Family Development CS 251 0 0 0 0 1 252 Hill View Montessori CS 6 0 0 0 0 1 7 Lowell Community CS 100 19 0 4 3 121 247 Marthas Vineyard CS 0 3 0 0 0 1 4 New Leadership Charter 3 0 0 0 0 1 4 North Central Charter Essential 2 0 0 0 0 1 3 Silver Hill Horace Mann Charter 25 1 0 1 0 4 31 Pioneer Valley Performing Arts CS 1 0 0 0 0 0 1 Boston Renaissance CS 43 1 2 4 1 7 58 Roxbury Preparatory CS 3 0 3 0 0 0 6 Salem Academy CS 13 0 0 0 0 3 16 Seven Hills CS 89 0 0 0 0 21 110 Prospect Hill Academy CS 9 4 0 11 0 5 29 MLK Jr CS of Excellence 19 0 0 1 0 0 20 Phoenix Charter Academy 23 0 0 1 0 1 25
57
District Name Spanish Portuguese Cape
Verdean Creole Haitian Vietnamese Other LEP
Pioneer Charter School of Science 2 3 0 2 0 0 7 Global Learning Charter Public 1 0 0 0 0 0 1 Pioneer Valley Chinese Imm CS 0 0 0 0 0 1 1 Acton-Boxborough 4 6 0 0 0 10 20 Adams-Cheshire 0 0 0 0 0 3 3 Amherst-Pelham 24 3 3 0 1 36 67 Ashburnham-Westminster 8 0 0 2 0 5 15 Athol-Royalston 8 0 0 0 0 7 15 Berkshire Hills 23 0 0 0 0 6 29 Berlin-Boylston 0 0 0 0 0 1 1 Blackstone-Millville 4 1 0 0 0 6 11 Bridgewater-Raynham 2 2 0 2 1 15 22 Central Berkshire 0 0 0 0 0 1 1 Concord-Carlisle 0 0 0 1 0 2 3 Dennis-Yarmouth 34 62 1 13 3 33 146 Dighton-Rehoboth 5 1 0 0 0 2 8 Dover-Sherborn 0 1 0 0 0 2 3 Dudley-Charlton Reg 14 4 0 0 0 32 50 Nauset 5 1 0 0 0 7 13 Freetown-Lakeville 0 1 0 0 0 0 1 Frontier 3 1 0 0 1 4 9 Gateway 1 0 0 0 0 10 11 Groton-Dunstable 6 1 0 0 0 4 11 Gill-Montague 24 0 0 1 0 20 45 Hamilton-Wenham 0 1 0 0 0 42 43 Hampden-Wilbraham 1 0 0 0 2 21 24 Hawlemont 0 1 0 0 0 0 1 King Philip 1 0 0 0 0 1 2 Lincoln-Sudbury 0 0 0 0 0 4 4 Manchester Essex Regional 0 0 0 0 0 3 3 Marthas Vineyard 0 16 0 0 0 0 16
58
District Name Spanish Portuguese Cape
Verdean Creole Haitian Vietnamese Other LEP
0 Masconomet 0 0 0 0 2 2 Mendon-Upton 1 1 0 0 0 8 10 Mount Greylock 0 0 0 0 0 2 2 Mohawk Trail 0 0 0 0 2 5 7 Narragansett 0 0 0 0 0 3 3 Nashoba 7 4 0 1 0 5 17 Northboro-Southboro 1 1 0 1 0 4 7 North Middlesex 11 1 0 0 0 4 16 Old Rochester 0 0 0 0 0 1 1 Pentucket 1 0 0 0 0 2 3 Quabbin 0 0 0 0 0 4 4 Ralph C Mahar 1 0 0 0 0 7 8 Silver Lake 0 0 0 0 0 1 1 Southern Berkshire 4 0 0 0 0 0 4 Southwick-Tolland 0 0 0 0 0 14 14 Spencer-E Brookfield 5 0 0 0 0 2 7 Triton 4 2 0 0 10 8 24 Up-Island Regional 2 1 0 0 0 2 5 Wachusett 3 3 0 0 7 34 47 Quaboag Regional 0 0 0 0 0 1 1 Whitman-Hanson 5 1 0 0 0 3 9 Assabet Valley Reg Voc Tech 8 1 0 0 0 0 9 Blue Hills Regional Vocational Technical 1 2 0 2 0 0 5 Bristol-Plymouth Reg Voc Tech 0 2 0 0 0 0 2 Cape Cod Reg Voc Tech 2 2 0 0 0 1 5 Greater Fall River Reg Voc Tech 1 1 0 0 0 0 2 Greater Lawrence Reg Voc Tech 33 0 0 0 0 1 34 GrNew Bedford Reg Voc Tech 14 6 0 0 0 0 20 Greater Lowell Reg Voc Tech 20 8 0 0 0 18 46 South Middlesex Reg Voc Tech 23 14 0 0 0 3 40 Minuteman Reg Voc Tech 2 0 0 0 0 1 3
59
60
District Name Spanish Portuguese Cape
Verdean Creole Haitian Vietnamese Other LEP
Montachusett Reg Voc Tech 4 0 0 0 0 4 8 Northeast Metro Reg Voc Tech 55 0 0 0 0 2 57 North Shore Reg Voc Tech 3 0 0 0 0 0 3 Southeastern Reg Voc Tech 0 2 3 3 0 1 9 Southern Worcester County Reg Voc Tech 3 0 0 0 0 1 4 Tri County Reg Voc Tech 0 1 0 0 0 0 1 Whittier Reg Voc Tech 6 0 0 0 0 0 6 TOTALS 31793 4209 2458 2433 2423 15842 59158
Source The Department Student Information Management System 2009
- Introduction
-
- Background
-
- I English Language Learners in Massachusetts
- II Educators Implementing Sheltered English Immersion Elementary and Secondary Content Teachers of English Language Learners
-
- Research on Professional Development for Educators of English Language Learners
- Gaps in Knowledge
-
- III Use of Funds for Category Training
-
- Future Need for Category Training
-
- IV Educators Implementing Sheltered English Immersion English as a Second Language (ESL) Teachers
-
- ESL Teacher Shortage
-
- V Use of Funds ESL Teachers and ESL Curriculum Development
-
- Massachusetts English Language Teacher Initiative (MELT)
- Improvement of Sheltered English Immersion Content-based ESL Instruction
- Future Need for ESL teachers
-
- VI Budget
- Attachments
-
- Attachment 1 All Massachusetts public school districts and changes in LEP population compared to changes in overall student population - SY 2006-SY 2010
- Attachment 1 Massachusetts public school districts and changes in LEP population compared to changes in overall student population - SY 2006-SY 2010
- Attachment 2 Massachusetts public school districts with large changes in LEP population compared to changes in overall student population - SY 2006-SY 2010
- Attachment 3 Bibliography Professional Development for Teachers of English Language Learners
- Attachment 4 Excerpts from the Commissionerrsquos Memorandum of June 2004 Guidance on Qualifications for Teachers of Limited English Proficient Students in Sheltered English Immersion Classrooms
- Attachment 5 Districts Receiving Sheltered English Immersion Professional Development 2004-2010
- Attachment 6 Collaboratives that have received grants for Sheltered English Immersion Professional Development 2004-2010
- Attachment 7 English Language Learners in Massachusetts District and Program Type October 2009
- Attachment 8 English Language Learners in Massachusetts District and First Language October 2009
-
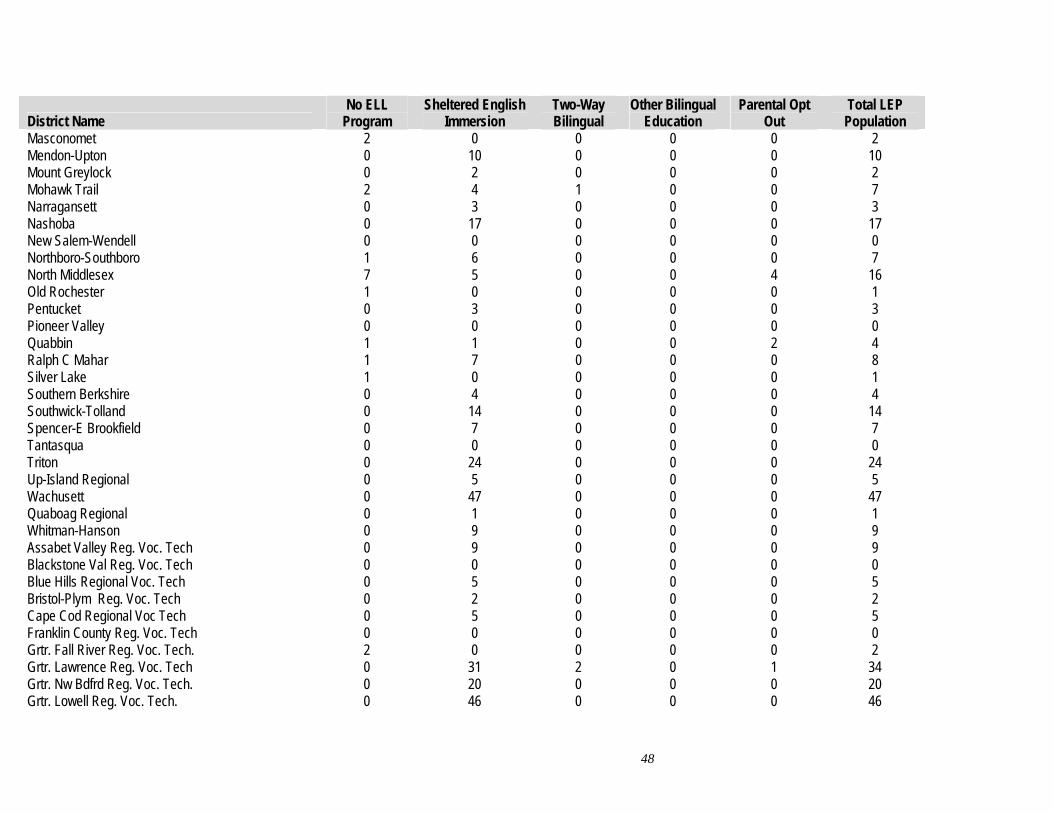
District Name No ELL
Program Sheltered English
Immersion Two-Way Bilingual
Other Bilingual Education
Parental Opt Out
Total LEP Population
Masconomet 2 0 0 0 0 2 Mendon-Upton 0 10 0 0 0 10 Mount Greylock 0 2 0 0 0 2 Mohawk Trail 2 4 1 0 0 7 Narragansett 0 3 0 0 0 3 Nashoba 0 17 0 0 0 17 New Salem-Wendell 0 0 0 0 0 0 Northboro-Southboro 1 6 0 0 0 7 North Middlesex 7 5 0 0 4 16 Old Rochester 1 0 0 0 0 1 Pentucket 0 3 0 0 0 3 Pioneer Valley 0 0 0 0 0 0 Quabbin 1 1 0 0 2 4 Ralph C Mahar 1 7 0 0 0 8 Silver Lake 1 0 0 0 0 1 Southern Berkshire 0 4 0 0 0 4 Southwick-Tolland 0 14 0 0 0 14 Spencer-E Brookfield 0 7 0 0 0 7 Tantasqua 0 0 0 0 0 0 Triton 0 24 0 0 0 24 Up-Island Regional 0 5 0 0 0 5 Wachusett 0 47 0 0 0 47 Quaboag Regional 0 1 0 0 0 1 Whitman-Hanson 0 9 0 0 0 9 Assabet Valley Reg Voc Tech 0 9 0 0 0 9 Blackstone Val Reg Voc Tech 0 0 0 0 0 0 Blue Hills Regional Voc Tech 0 5 0 0 0 5 Bristol-Plym Reg Voc Tech 0 2 0 0 0 2 Cape Cod Regional Voc Tech 0 5 0 0 0 5 Franklin County Reg Voc Tech 0 0 0 0 0 0 Grtr Fall River Reg Voc Tech 2 0 0 0 0 2 Grtr Lawrence Reg Voc Tech 0 31 2 0 1 34 Grtr Nw Bdfrd Reg Voc Tech 0 20 0 0 0 20 Grtr Lowell Reg Voc Tech 0 46 0 0 0 46
48
District Name No ELL
Program Sheltered English
Immersion Two-Way Bilingual
Other Bilingual Education
Parental Opt Out
Total LEP Population
S Middlesex Reg Voc Tech 0 40 0 0 0 40 Minuteman Reg Voc Tech 0 3 0 0 0 3 Montachusett Reg Voc Tech 0 8 0 0 0 8 N Berkshire Reg Voc Tech 0 0 0 0 0 0 Nashoba Valley Reg Voc 0 0 0 0 0 0 NE Metro Reg Voc Tech 0 57 0 0 0 57 North Shore Reg Voc Tech 0 3 0 0 0 3 Old Colony Reg Voc Tech 0 0 0 0 0 0 Pathfinder Reg Voc Tech 0 0 0 0 0 0 Shawsheen Val Reg Voc Tech 0 0 0 0 0 0 Southeastern Reg Voc Tech 0 9 0 0 0 9 South Shore Reg Voc Tech 0 0 0 0 0 0 S Worcester C Reg Voc Tech 1 0 0 3 0 4 Tri County Reg Voc Tech 0 1 0 0 0 1 Uppr Cape Cod Reg Voc Tech 0 0 0 0 0 0 Whittier Reg Voc Tech 0 6 0 0 0 6 Bristol County Agricultural 0 0 0 0 0 0 Essex Agricultural Technical 0 0 0 0 0 0 Norfolk County Agricultural 0 0 0 0 0 0 TOTALS 1113 49096 1229 1342 6378 59158
Source The Department Student Information Management System 2009
49
Attachment 8 English Language Learners in Massachusetts District and First Language October 2009
District Name Spanish Portuguese Cape
Verdean Creole Haitian Vietnamese Other LEP
Abington 3 3 0 0 0 4 10 Acton 8 7 0 0 0 66 81 Acushnet 0 1 0 0 0 0 1 Agawam 15 0 0 0 1 81 97 Amesbury 5 8 0 0 0 8 21 Amherst 60 4 2 0 2 107 175 Andover 12 3 0 0 1 67 83 Arlington 26 17 2 11 1 135 192 Ashland 9 35 0 0 1 22 67 Attleboro 170 9 1 1 2 84 267 Auburn 12 5 0 3 12 24 56 Avon 0 0 0 1 0 0 1 Ayer 36 13 0 0 0 11 60 Barnstable 39 111 0 2 0 24 176 Bedford 9 0 0 0 2 38 49 Belchertown 7 1 0 0 1 15 24 Bellingham 8 3 0 0 3 13 27 Belmont 5 2 0 0 0 85 92 Berlin 0 1 0 0 0 0 1 Beverly 6 8 0 0 1 24 39 Billerica 13 6 0 2 3 57 81 Boston 6434 210 900 947 723 2057 11271 Bourne 1 0 0 0 0 0 1 Boxborough 1 2 0 0 0 3 6 Boxford 1 0 0 0 0 3 4 Boylston 1 0 0 0 1 8 10 Braintree 13 3 4 1 13 77 111 Brewster 6 0 0 0 0 3 9 Brockton 484 131 1465 453 37 167 2737
50
District Name Spanish Portuguese Cape
Verdean Creole Haitian Vietnamese Other LEP
Brookline 43 16 2 2 6 427 496 Burlington 2 3 0 2 0 57 64 Cambridge 58 23 6 67 2 147 303 Canton 4 1 0 3 5 23 36 Carlisle 0 0 0 0 0 11 11 Carver 0 0 0 0 0 2 2 Chatham 10 2 0 3 0 4 19 Chelmsford 9 5 0 0 8 82 104 Chelsea 766 29 2 13 9 103 922 Chicopee 201 4 0 0 1 148 354 Clinton 106 17 0 11 0 10 144 Concord 13 1 0 0 2 20 36 Danvers 4 0 0 1 0 11 16 Dartmouth 2 19 0 0 0 18 39 Dedham 47 3 0 13 9 42 114 Deerfield 4 0 0 0 2 1 7 Douglas 0 2 0 0 0 1 3 Dover 0 0 0 2 0 7 9 Dracut 13 6 0 0 0 24 43 Eastham 1 0 0 0 0 0 1 Easthampton 12 0 0 0 1 27 40 East Longmeadow 0 0 0 0 0 2 2 Easton 4 7 1 3 4 18 37 Edgartown 2 24 0 0 0 0 26 Everett 308 119 1 96 12 44 580 Fairhaven 1 2 0 0 0 0 3 Fall River 297 122 16 2 10 67 514 Falmouth 5 12 0 0 4 23 44 Fitchburg 487 2 0 2 11 91 593 Foxborough 5 3 0 0 1 5 14 Framingham 589 553 0 17 3 109 1271
51
District Name Spanish Portuguese Cape
Verdean Creole Haitian Vietnamese Other LEP
Franklin 13 5 0 1 4 32 55 Gardner 80 1 0 3 2 9 95 Georgetown 0 0 0 0 0 2 2 Gloucester 38 20 0 0 4 13 75 Grafton 3 0 0 0 0 11 14 Granby 3 0 0 0 0 10 13 Greenfield 18 0 0 0 1 35 54 Hadley 8 0 0 0 0 8 16 Hanover 1 0 0 0 1 6 8 Harvard 1 0 0 0 0 1 2 Harwich 12 3 0 8 1 24 48 Haverhill 407 11 0 3 7 33 461 Hingham 0 1 0 0 0 9 10 Holbrook 8 4 0 5 1 8 26 Holland 0 1 0 0 0 0 1 Holliston 7 14 0 0 0 16 37 Holyoke 1361 0 0 0 2 14 1377 Hopedale 2 2 0 0 0 5 9 Hopkinton 7 1 0 0 0 30 38 Hudson 32 67 0 1 1 13 114 Hull 0 1 1 0 0 1 3 Ipswich 5 3 0 0 0 10 18 Kingston 0 2 0 0 0 1 3 Lanesborough 0 0 0 0 0 2 2 Lawrence 2732 3 0 5 32 63 2835 Lee 13 1 0 0 0 4 18 Leicester 7 0 0 0 6 8 21 Lenox 1 0 0 0 0 6 7 Leominster 277 44 0 2 3 72 398 Lexington 21 5 0 4 0 266 296 Lincoln 4 0 0 1 0 21 26
52
District Name Spanish Portuguese Cape
Verdean Creole Haitian Vietnamese Other LEP
Littleton 1 3 1 0 0 10 15 Longmeadow 5 2 0 0 1 31 39 Lowell 1595 324 3 14 131 2254 4321 Ludlow 6 11 0 0 0 25 42 Lunenburg 2 4 0 0 0 4 10 Lynn 2662 30 1 67 62 643 3465 Lynnfield 1 0 0 0 0 3 4 Malden 120 99 0 116 51 320 706 Mansfield 10 6 0 0 0 28 44 Marblehead 3 1 0 0 0 15 19 Marion 0 0 0 0 0 1 1 Marlborough 261 211 0 2 4 31 509 Marshfield 3 11 0 0 0 9 23 Mashpee 0 0 0 0 1 17 18 Mattapoisett 0 0 0 0 0 2 2 Maynard 14 11 0 2 0 6 33 Medfield 0 2 0 0 0 4 6 Medford 28 80 0 96 12 83 299 Medway 3 0 0 1 0 4 8 Melrose 4 5 0 7 2 58 76 Methuen 340 3 0 7 11 52 413 Middleborough 7 0 0 0 1 5 13 Middleton 2 1 0 0 0 10 13 Milford 100 101 0 0 2 24 227 Millbury 2 4 0 0 3 4 13 Millis 0 0 0 0 0 2 2 Milton 3 3 0 15 3 10 34 Monson 0 0 0 0 0 10 10 Nantucket 60 5 0 0 0 2 67 Natick 4 2 0 0 2 28 36 Needham 13 1 2 1 1 32 50
53
District Name Spanish Portuguese Cape
Verdean Creole Haitian Vietnamese Other LEP
New Bedford 289 31 1 2 5 133 461 Newburyport 4 3 0 0 0 5 12 Newton 112 22 0 7 11 536 688 North Adams 19 2 0 0 0 7 28 Northampton 40 0 0 0 0 10 50 North Andover 18 1 0 0 4 26 49 North Attleborough 19 0 0 0 1 18 38 Northborough 16 13 0 0 0 37 66 Northbridge 6 0 0 0 0 6 12 North Brookfield 0 0 0 0 0 3 3 North Reading 2 0 0 0 0 9 11 Norton 0 0 0 0 0 5 5 Norwell 2 0 0 0 0 1 3 Norwood 38 39 0 11 5 82 175 Oak Bluffs 0 19 0 0 0 1 20 Orleans 0 0 0 0 0 2 2 Oxford 3 0 0 0 0 2 5 Palmer 4 2 0 0 0 11 17 Peabody 175 100 0 0 11 70 356 Pittsfield 168 1 0 0 8 56 233 Plymouth 9 26 0 1 2 9 47 Provincetown 7 0 0 0 0 0 7 Quincy 41 31 0 6 126 840 1044 Randolph 17 6 3 71 54 33 184 Reading 1 3 0 0 1 11 16 Revere 392 39 0 8 31 155 625 Rockland 3 22 0 0 2 1 28 Rockport 1 0 0 0 0 4 5 Salem 430 9 0 5 7 56 507 Sandwich 0 0 0 0 0 1 1 Saugus 22 15 0 6 6 19 68
54
District Name Spanish Portuguese Cape
Verdean Creole Haitian Vietnamese Other LEP
Scituate 1 5 6 0 0 2 14 Seekonk 5 1 0 0 2 15 23 Sharon 1 0 0 5 6 32 44 Sherborn 0 0 0 0 0 1 1 Shirley 2 1 0 0 0 2 5 Shrewsbury 15 39 0 0 6 84 144 Somerset 0 0 0 0 0 2 2 Somerville 372 170 5 73 5 152 777 Southampton 1 0 0 0 0 2 3 Southborough 5 4 0 0 0 38 47 Southbridge 219 0 0 0 0 13 232 South Hadley 11 0 0 0 1 3 15 Springfield 2970 2 0 4 87 225 3288 Stoneham 17 11 0 1 3 26 58 Stoughton 21 60 8 17 9 51 166 Sturbridge 1 2 0 0 0 0 3 Sudbury 8 2 0 0 1 7 18 Sunderland 2 0 0 0 0 1 3 Swampscott 8 4 1 2 2 35 52 Swansea 3 2 0 0 0 5 10 Taunton 72 43 5 9 1 29 159 Tewksbury 2 1 0 0 2 7 12 Tisbury 0 26 0 0 0 2 28 Topsfield 0 0 0 0 0 2 2 Uxbridge 11 3 0 0 0 16 30 Wakefield 8 2 0 0 2 6 18 Wales 0 0 0 0 0 1 1 Walpole 18 14 0 13 1 36 82 Waltham 333 27 0 26 3 86 475 Ware 7 0 0 0 0 4 11 Wareham 4 2 0 0 2 9 17
55
District Name Spanish Portuguese Cape
Verdean Creole Haitian Vietnamese Other LEP
Watertown 52 32 0 2 0 182 268 Wayland 1 0 0 0 0 14 15 Webster 32 4 0 0 1 12 49 Wellesley 16 0 0 0 0 55 71 Westborough 43 38 0 1 0 174 256 West Boylston 0 1 0 0 0 2 3 West Bridgewater 0 0 0 2 0 0 2 Westfield 34 0 0 0 0 177 211 Westford 3 0 0 1 2 27 33 Weston 5 0 1 3 1 41 51 Westport 1 9 0 0 4 1 15 West Springfield 29 2 0 0 3 242 276 Westwood 3 0 0 0 0 28 31 Weymouth 12 49 0 1 4 38 104 Williamsburg 0 2 0 0 0 0 2 Williamstown 2 3 0 0 0 4 9 Wilmington 1 3 0 0 4 14 22 Winchendon 4 2 0 0 0 5 11 Winchester 10 10 0 2 2 117 141 Winthrop 18 9 0 1 0 38 66 Woburn 27 44 0 8 8 109 196 Worcester 3636 297 4 44 703 1704 6388 Wrentham 2 3 0 0 0 3 8 Northampton-Smith Voc Agr 5 0 0 0 0 0 5 Excel Academy CS 9 0 0 0 0 0 9 Academy Of the Pacific Rim CS 3 1 0 1 0 0 5 Boston Preparatory CS 3 0 0 2 0 0 5 Christa McAuliffe Regional CS 2 0 0 0 0 0 2 Smith Leadership Academy CS 1 0 0 0 0 0 1 Benjamin Banneker CS 5 0 0 16 0 1 22 Barnstable Horace Mann CS 6 16 0 0 0 9 31
56
District Name Spanish Portuguese Cape
Verdean Creole Haitian Vietnamese Other LEP
Barnstable Com Horace Mann CS 17 17 0 0 0 1 35 Edward Brooke CS 3 0 0 0 0 0 3 KIPP Academy Lynn CS 4 0 0 0 0 0 4 Innovation Academy CS 1 0 0 0 0 0 1 Community CS of Cambridge 3 0 0 5 0 2 10 City On A Hill CS 3 0 0 0 0 1 4 Codman Academy CS 1 0 0 0 0 0 1 Conservatory Lab Charter (District) 14 4 0 0 0 3 21 Community Day CS 96 0 0 2 0 0 98 Sabis International CS 17 0 0 0 4 4 25 Neighborhood House CS 3 0 1 1 3 1 9 Abby Kelley Foster CS 12 5 0 0 0 11 28 Foxborough Reg CS 2 0 0 5 0 22 29 Hilltown Cooperative CS 0 0 0 0 0 1 1 EM Kennedy Acad Health Careers HMCS 1 0 1 0 0 0 2 Holyoke Com CS 32 0 0 0 0 0 32 Lawrence Family Development CS 251 0 0 0 0 1 252 Hill View Montessori CS 6 0 0 0 0 1 7 Lowell Community CS 100 19 0 4 3 121 247 Marthas Vineyard CS 0 3 0 0 0 1 4 New Leadership Charter 3 0 0 0 0 1 4 North Central Charter Essential 2 0 0 0 0 1 3 Silver Hill Horace Mann Charter 25 1 0 1 0 4 31 Pioneer Valley Performing Arts CS 1 0 0 0 0 0 1 Boston Renaissance CS 43 1 2 4 1 7 58 Roxbury Preparatory CS 3 0 3 0 0 0 6 Salem Academy CS 13 0 0 0 0 3 16 Seven Hills CS 89 0 0 0 0 21 110 Prospect Hill Academy CS 9 4 0 11 0 5 29 MLK Jr CS of Excellence 19 0 0 1 0 0 20 Phoenix Charter Academy 23 0 0 1 0 1 25
57
District Name Spanish Portuguese Cape
Verdean Creole Haitian Vietnamese Other LEP
Pioneer Charter School of Science 2 3 0 2 0 0 7 Global Learning Charter Public 1 0 0 0 0 0 1 Pioneer Valley Chinese Imm CS 0 0 0 0 0 1 1 Acton-Boxborough 4 6 0 0 0 10 20 Adams-Cheshire 0 0 0 0 0 3 3 Amherst-Pelham 24 3 3 0 1 36 67 Ashburnham-Westminster 8 0 0 2 0 5 15 Athol-Royalston 8 0 0 0 0 7 15 Berkshire Hills 23 0 0 0 0 6 29 Berlin-Boylston 0 0 0 0 0 1 1 Blackstone-Millville 4 1 0 0 0 6 11 Bridgewater-Raynham 2 2 0 2 1 15 22 Central Berkshire 0 0 0 0 0 1 1 Concord-Carlisle 0 0 0 1 0 2 3 Dennis-Yarmouth 34 62 1 13 3 33 146 Dighton-Rehoboth 5 1 0 0 0 2 8 Dover-Sherborn 0 1 0 0 0 2 3 Dudley-Charlton Reg 14 4 0 0 0 32 50 Nauset 5 1 0 0 0 7 13 Freetown-Lakeville 0 1 0 0 0 0 1 Frontier 3 1 0 0 1 4 9 Gateway 1 0 0 0 0 10 11 Groton-Dunstable 6 1 0 0 0 4 11 Gill-Montague 24 0 0 1 0 20 45 Hamilton-Wenham 0 1 0 0 0 42 43 Hampden-Wilbraham 1 0 0 0 2 21 24 Hawlemont 0 1 0 0 0 0 1 King Philip 1 0 0 0 0 1 2 Lincoln-Sudbury 0 0 0 0 0 4 4 Manchester Essex Regional 0 0 0 0 0 3 3 Marthas Vineyard 0 16 0 0 0 0 16
58
District Name Spanish Portuguese Cape
Verdean Creole Haitian Vietnamese Other LEP
0 Masconomet 0 0 0 0 2 2 Mendon-Upton 1 1 0 0 0 8 10 Mount Greylock 0 0 0 0 0 2 2 Mohawk Trail 0 0 0 0 2 5 7 Narragansett 0 0 0 0 0 3 3 Nashoba 7 4 0 1 0 5 17 Northboro-Southboro 1 1 0 1 0 4 7 North Middlesex 11 1 0 0 0 4 16 Old Rochester 0 0 0 0 0 1 1 Pentucket 1 0 0 0 0 2 3 Quabbin 0 0 0 0 0 4 4 Ralph C Mahar 1 0 0 0 0 7 8 Silver Lake 0 0 0 0 0 1 1 Southern Berkshire 4 0 0 0 0 0 4 Southwick-Tolland 0 0 0 0 0 14 14 Spencer-E Brookfield 5 0 0 0 0 2 7 Triton 4 2 0 0 10 8 24 Up-Island Regional 2 1 0 0 0 2 5 Wachusett 3 3 0 0 7 34 47 Quaboag Regional 0 0 0 0 0 1 1 Whitman-Hanson 5 1 0 0 0 3 9 Assabet Valley Reg Voc Tech 8 1 0 0 0 0 9 Blue Hills Regional Vocational Technical 1 2 0 2 0 0 5 Bristol-Plymouth Reg Voc Tech 0 2 0 0 0 0 2 Cape Cod Reg Voc Tech 2 2 0 0 0 1 5 Greater Fall River Reg Voc Tech 1 1 0 0 0 0 2 Greater Lawrence Reg Voc Tech 33 0 0 0 0 1 34 GrNew Bedford Reg Voc Tech 14 6 0 0 0 0 20 Greater Lowell Reg Voc Tech 20 8 0 0 0 18 46 South Middlesex Reg Voc Tech 23 14 0 0 0 3 40 Minuteman Reg Voc Tech 2 0 0 0 0 1 3
59
60
District Name Spanish Portuguese Cape
Verdean Creole Haitian Vietnamese Other LEP
Montachusett Reg Voc Tech 4 0 0 0 0 4 8 Northeast Metro Reg Voc Tech 55 0 0 0 0 2 57 North Shore Reg Voc Tech 3 0 0 0 0 0 3 Southeastern Reg Voc Tech 0 2 3 3 0 1 9 Southern Worcester County Reg Voc Tech 3 0 0 0 0 1 4 Tri County Reg Voc Tech 0 1 0 0 0 0 1 Whittier Reg Voc Tech 6 0 0 0 0 0 6 TOTALS 31793 4209 2458 2433 2423 15842 59158
Source The Department Student Information Management System 2009
- Introduction
-
- Background
-
- I English Language Learners in Massachusetts
- II Educators Implementing Sheltered English Immersion Elementary and Secondary Content Teachers of English Language Learners
-
- Research on Professional Development for Educators of English Language Learners
- Gaps in Knowledge
-
- III Use of Funds for Category Training
-
- Future Need for Category Training
-
- IV Educators Implementing Sheltered English Immersion English as a Second Language (ESL) Teachers
-
- ESL Teacher Shortage
-
- V Use of Funds ESL Teachers and ESL Curriculum Development
-
- Massachusetts English Language Teacher Initiative (MELT)
- Improvement of Sheltered English Immersion Content-based ESL Instruction
- Future Need for ESL teachers
-
- VI Budget
- Attachments
-
- Attachment 1 All Massachusetts public school districts and changes in LEP population compared to changes in overall student population - SY 2006-SY 2010
- Attachment 1 Massachusetts public school districts and changes in LEP population compared to changes in overall student population - SY 2006-SY 2010
- Attachment 2 Massachusetts public school districts with large changes in LEP population compared to changes in overall student population - SY 2006-SY 2010
- Attachment 3 Bibliography Professional Development for Teachers of English Language Learners
- Attachment 4 Excerpts from the Commissionerrsquos Memorandum of June 2004 Guidance on Qualifications for Teachers of Limited English Proficient Students in Sheltered English Immersion Classrooms
- Attachment 5 Districts Receiving Sheltered English Immersion Professional Development 2004-2010
- Attachment 6 Collaboratives that have received grants for Sheltered English Immersion Professional Development 2004-2010
- Attachment 7 English Language Learners in Massachusetts District and Program Type October 2009
- Attachment 8 English Language Learners in Massachusetts District and First Language October 2009
-
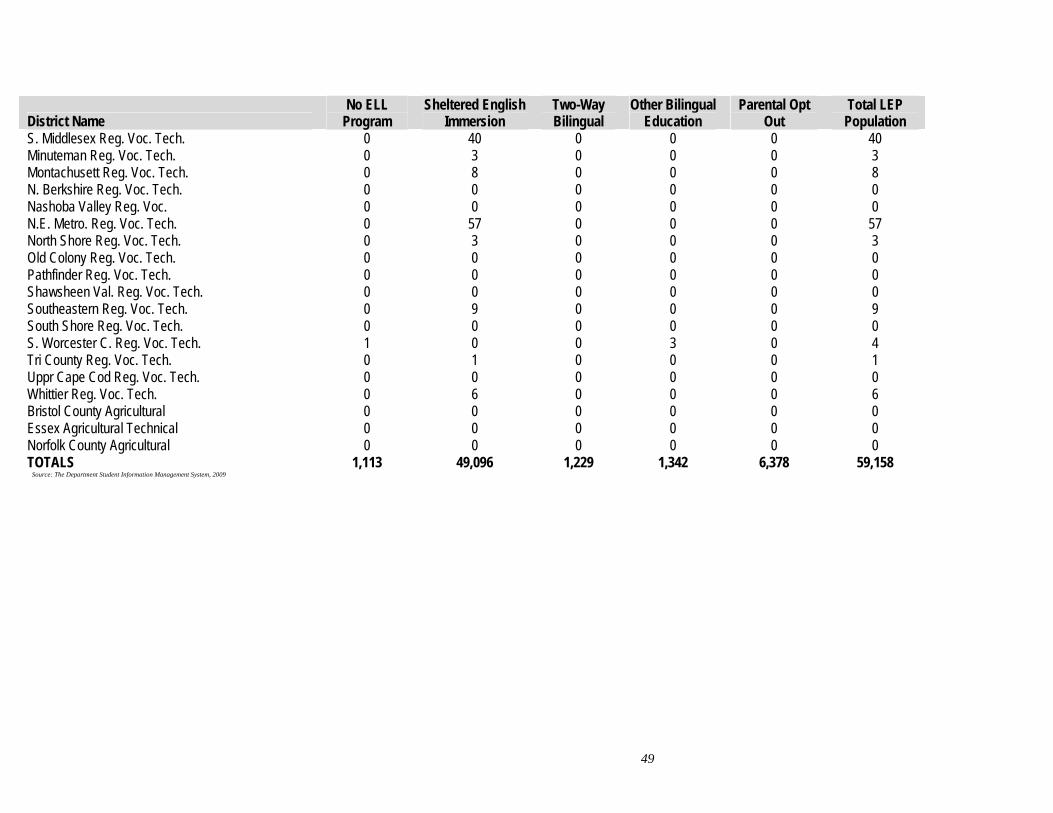
District Name No ELL
Program Sheltered English
Immersion Two-Way Bilingual
Other Bilingual Education
Parental Opt Out
Total LEP Population
S Middlesex Reg Voc Tech 0 40 0 0 0 40 Minuteman Reg Voc Tech 0 3 0 0 0 3 Montachusett Reg Voc Tech 0 8 0 0 0 8 N Berkshire Reg Voc Tech 0 0 0 0 0 0 Nashoba Valley Reg Voc 0 0 0 0 0 0 NE Metro Reg Voc Tech 0 57 0 0 0 57 North Shore Reg Voc Tech 0 3 0 0 0 3 Old Colony Reg Voc Tech 0 0 0 0 0 0 Pathfinder Reg Voc Tech 0 0 0 0 0 0 Shawsheen Val Reg Voc Tech 0 0 0 0 0 0 Southeastern Reg Voc Tech 0 9 0 0 0 9 South Shore Reg Voc Tech 0 0 0 0 0 0 S Worcester C Reg Voc Tech 1 0 0 3 0 4 Tri County Reg Voc Tech 0 1 0 0 0 1 Uppr Cape Cod Reg Voc Tech 0 0 0 0 0 0 Whittier Reg Voc Tech 0 6 0 0 0 6 Bristol County Agricultural 0 0 0 0 0 0 Essex Agricultural Technical 0 0 0 0 0 0 Norfolk County Agricultural 0 0 0 0 0 0 TOTALS 1113 49096 1229 1342 6378 59158
Source The Department Student Information Management System 2009
49
Attachment 8 English Language Learners in Massachusetts District and First Language October 2009
District Name Spanish Portuguese Cape
Verdean Creole Haitian Vietnamese Other LEP
Abington 3 3 0 0 0 4 10 Acton 8 7 0 0 0 66 81 Acushnet 0 1 0 0 0 0 1 Agawam 15 0 0 0 1 81 97 Amesbury 5 8 0 0 0 8 21 Amherst 60 4 2 0 2 107 175 Andover 12 3 0 0 1 67 83 Arlington 26 17 2 11 1 135 192 Ashland 9 35 0 0 1 22 67 Attleboro 170 9 1 1 2 84 267 Auburn 12 5 0 3 12 24 56 Avon 0 0 0 1 0 0 1 Ayer 36 13 0 0 0 11 60 Barnstable 39 111 0 2 0 24 176 Bedford 9 0 0 0 2 38 49 Belchertown 7 1 0 0 1 15 24 Bellingham 8 3 0 0 3 13 27 Belmont 5 2 0 0 0 85 92 Berlin 0 1 0 0 0 0 1 Beverly 6 8 0 0 1 24 39 Billerica 13 6 0 2 3 57 81 Boston 6434 210 900 947 723 2057 11271 Bourne 1 0 0 0 0 0 1 Boxborough 1 2 0 0 0 3 6 Boxford 1 0 0 0 0 3 4 Boylston 1 0 0 0 1 8 10 Braintree 13 3 4 1 13 77 111 Brewster 6 0 0 0 0 3 9 Brockton 484 131 1465 453 37 167 2737
50
District Name Spanish Portuguese Cape
Verdean Creole Haitian Vietnamese Other LEP
Brookline 43 16 2 2 6 427 496 Burlington 2 3 0 2 0 57 64 Cambridge 58 23 6 67 2 147 303 Canton 4 1 0 3 5 23 36 Carlisle 0 0 0 0 0 11 11 Carver 0 0 0 0 0 2 2 Chatham 10 2 0 3 0 4 19 Chelmsford 9 5 0 0 8 82 104 Chelsea 766 29 2 13 9 103 922 Chicopee 201 4 0 0 1 148 354 Clinton 106 17 0 11 0 10 144 Concord 13 1 0 0 2 20 36 Danvers 4 0 0 1 0 11 16 Dartmouth 2 19 0 0 0 18 39 Dedham 47 3 0 13 9 42 114 Deerfield 4 0 0 0 2 1 7 Douglas 0 2 0 0 0 1 3 Dover 0 0 0 2 0 7 9 Dracut 13 6 0 0 0 24 43 Eastham 1 0 0 0 0 0 1 Easthampton 12 0 0 0 1 27 40 East Longmeadow 0 0 0 0 0 2 2 Easton 4 7 1 3 4 18 37 Edgartown 2 24 0 0 0 0 26 Everett 308 119 1 96 12 44 580 Fairhaven 1 2 0 0 0 0 3 Fall River 297 122 16 2 10 67 514 Falmouth 5 12 0 0 4 23 44 Fitchburg 487 2 0 2 11 91 593 Foxborough 5 3 0 0 1 5 14 Framingham 589 553 0 17 3 109 1271
51
District Name Spanish Portuguese Cape
Verdean Creole Haitian Vietnamese Other LEP
Franklin 13 5 0 1 4 32 55 Gardner 80 1 0 3 2 9 95 Georgetown 0 0 0 0 0 2 2 Gloucester 38 20 0 0 4 13 75 Grafton 3 0 0 0 0 11 14 Granby 3 0 0 0 0 10 13 Greenfield 18 0 0 0 1 35 54 Hadley 8 0 0 0 0 8 16 Hanover 1 0 0 0 1 6 8 Harvard 1 0 0 0 0 1 2 Harwich 12 3 0 8 1 24 48 Haverhill 407 11 0 3 7 33 461 Hingham 0 1 0 0 0 9 10 Holbrook 8 4 0 5 1 8 26 Holland 0 1 0 0 0 0 1 Holliston 7 14 0 0 0 16 37 Holyoke 1361 0 0 0 2 14 1377 Hopedale 2 2 0 0 0 5 9 Hopkinton 7 1 0 0 0 30 38 Hudson 32 67 0 1 1 13 114 Hull 0 1 1 0 0 1 3 Ipswich 5 3 0 0 0 10 18 Kingston 0 2 0 0 0 1 3 Lanesborough 0 0 0 0 0 2 2 Lawrence 2732 3 0 5 32 63 2835 Lee 13 1 0 0 0 4 18 Leicester 7 0 0 0 6 8 21 Lenox 1 0 0 0 0 6 7 Leominster 277 44 0 2 3 72 398 Lexington 21 5 0 4 0 266 296 Lincoln 4 0 0 1 0 21 26
52
District Name Spanish Portuguese Cape
Verdean Creole Haitian Vietnamese Other LEP
Littleton 1 3 1 0 0 10 15 Longmeadow 5 2 0 0 1 31 39 Lowell 1595 324 3 14 131 2254 4321 Ludlow 6 11 0 0 0 25 42 Lunenburg 2 4 0 0 0 4 10 Lynn 2662 30 1 67 62 643 3465 Lynnfield 1 0 0 0 0 3 4 Malden 120 99 0 116 51 320 706 Mansfield 10 6 0 0 0 28 44 Marblehead 3 1 0 0 0 15 19 Marion 0 0 0 0 0 1 1 Marlborough 261 211 0 2 4 31 509 Marshfield 3 11 0 0 0 9 23 Mashpee 0 0 0 0 1 17 18 Mattapoisett 0 0 0 0 0 2 2 Maynard 14 11 0 2 0 6 33 Medfield 0 2 0 0 0 4 6 Medford 28 80 0 96 12 83 299 Medway 3 0 0 1 0 4 8 Melrose 4 5 0 7 2 58 76 Methuen 340 3 0 7 11 52 413 Middleborough 7 0 0 0 1 5 13 Middleton 2 1 0 0 0 10 13 Milford 100 101 0 0 2 24 227 Millbury 2 4 0 0 3 4 13 Millis 0 0 0 0 0 2 2 Milton 3 3 0 15 3 10 34 Monson 0 0 0 0 0 10 10 Nantucket 60 5 0 0 0 2 67 Natick 4 2 0 0 2 28 36 Needham 13 1 2 1 1 32 50
53
District Name Spanish Portuguese Cape
Verdean Creole Haitian Vietnamese Other LEP
New Bedford 289 31 1 2 5 133 461 Newburyport 4 3 0 0 0 5 12 Newton 112 22 0 7 11 536 688 North Adams 19 2 0 0 0 7 28 Northampton 40 0 0 0 0 10 50 North Andover 18 1 0 0 4 26 49 North Attleborough 19 0 0 0 1 18 38 Northborough 16 13 0 0 0 37 66 Northbridge 6 0 0 0 0 6 12 North Brookfield 0 0 0 0 0 3 3 North Reading 2 0 0 0 0 9 11 Norton 0 0 0 0 0 5 5 Norwell 2 0 0 0 0 1 3 Norwood 38 39 0 11 5 82 175 Oak Bluffs 0 19 0 0 0 1 20 Orleans 0 0 0 0 0 2 2 Oxford 3 0 0 0 0 2 5 Palmer 4 2 0 0 0 11 17 Peabody 175 100 0 0 11 70 356 Pittsfield 168 1 0 0 8 56 233 Plymouth 9 26 0 1 2 9 47 Provincetown 7 0 0 0 0 0 7 Quincy 41 31 0 6 126 840 1044 Randolph 17 6 3 71 54 33 184 Reading 1 3 0 0 1 11 16 Revere 392 39 0 8 31 155 625 Rockland 3 22 0 0 2 1 28 Rockport 1 0 0 0 0 4 5 Salem 430 9 0 5 7 56 507 Sandwich 0 0 0 0 0 1 1 Saugus 22 15 0 6 6 19 68
54
District Name Spanish Portuguese Cape
Verdean Creole Haitian Vietnamese Other LEP
Scituate 1 5 6 0 0 2 14 Seekonk 5 1 0 0 2 15 23 Sharon 1 0 0 5 6 32 44 Sherborn 0 0 0 0 0 1 1 Shirley 2 1 0 0 0 2 5 Shrewsbury 15 39 0 0 6 84 144 Somerset 0 0 0 0 0 2 2 Somerville 372 170 5 73 5 152 777 Southampton 1 0 0 0 0 2 3 Southborough 5 4 0 0 0 38 47 Southbridge 219 0 0 0 0 13 232 South Hadley 11 0 0 0 1 3 15 Springfield 2970 2 0 4 87 225 3288 Stoneham 17 11 0 1 3 26 58 Stoughton 21 60 8 17 9 51 166 Sturbridge 1 2 0 0 0 0 3 Sudbury 8 2 0 0 1 7 18 Sunderland 2 0 0 0 0 1 3 Swampscott 8 4 1 2 2 35 52 Swansea 3 2 0 0 0 5 10 Taunton 72 43 5 9 1 29 159 Tewksbury 2 1 0 0 2 7 12 Tisbury 0 26 0 0 0 2 28 Topsfield 0 0 0 0 0 2 2 Uxbridge 11 3 0 0 0 16 30 Wakefield 8 2 0 0 2 6 18 Wales 0 0 0 0 0 1 1 Walpole 18 14 0 13 1 36 82 Waltham 333 27 0 26 3 86 475 Ware 7 0 0 0 0 4 11 Wareham 4 2 0 0 2 9 17
55
District Name Spanish Portuguese Cape
Verdean Creole Haitian Vietnamese Other LEP
Watertown 52 32 0 2 0 182 268 Wayland 1 0 0 0 0 14 15 Webster 32 4 0 0 1 12 49 Wellesley 16 0 0 0 0 55 71 Westborough 43 38 0 1 0 174 256 West Boylston 0 1 0 0 0 2 3 West Bridgewater 0 0 0 2 0 0 2 Westfield 34 0 0 0 0 177 211 Westford 3 0 0 1 2 27 33 Weston 5 0 1 3 1 41 51 Westport 1 9 0 0 4 1 15 West Springfield 29 2 0 0 3 242 276 Westwood 3 0 0 0 0 28 31 Weymouth 12 49 0 1 4 38 104 Williamsburg 0 2 0 0 0 0 2 Williamstown 2 3 0 0 0 4 9 Wilmington 1 3 0 0 4 14 22 Winchendon 4 2 0 0 0 5 11 Winchester 10 10 0 2 2 117 141 Winthrop 18 9 0 1 0 38 66 Woburn 27 44 0 8 8 109 196 Worcester 3636 297 4 44 703 1704 6388 Wrentham 2 3 0 0 0 3 8 Northampton-Smith Voc Agr 5 0 0 0 0 0 5 Excel Academy CS 9 0 0 0 0 0 9 Academy Of the Pacific Rim CS 3 1 0 1 0 0 5 Boston Preparatory CS 3 0 0 2 0 0 5 Christa McAuliffe Regional CS 2 0 0 0 0 0 2 Smith Leadership Academy CS 1 0 0 0 0 0 1 Benjamin Banneker CS 5 0 0 16 0 1 22 Barnstable Horace Mann CS 6 16 0 0 0 9 31
56
District Name Spanish Portuguese Cape
Verdean Creole Haitian Vietnamese Other LEP
Barnstable Com Horace Mann CS 17 17 0 0 0 1 35 Edward Brooke CS 3 0 0 0 0 0 3 KIPP Academy Lynn CS 4 0 0 0 0 0 4 Innovation Academy CS 1 0 0 0 0 0 1 Community CS of Cambridge 3 0 0 5 0 2 10 City On A Hill CS 3 0 0 0 0 1 4 Codman Academy CS 1 0 0 0 0 0 1 Conservatory Lab Charter (District) 14 4 0 0 0 3 21 Community Day CS 96 0 0 2 0 0 98 Sabis International CS 17 0 0 0 4 4 25 Neighborhood House CS 3 0 1 1 3 1 9 Abby Kelley Foster CS 12 5 0 0 0 11 28 Foxborough Reg CS 2 0 0 5 0 22 29 Hilltown Cooperative CS 0 0 0 0 0 1 1 EM Kennedy Acad Health Careers HMCS 1 0 1 0 0 0 2 Holyoke Com CS 32 0 0 0 0 0 32 Lawrence Family Development CS 251 0 0 0 0 1 252 Hill View Montessori CS 6 0 0 0 0 1 7 Lowell Community CS 100 19 0 4 3 121 247 Marthas Vineyard CS 0 3 0 0 0 1 4 New Leadership Charter 3 0 0 0 0 1 4 North Central Charter Essential 2 0 0 0 0 1 3 Silver Hill Horace Mann Charter 25 1 0 1 0 4 31 Pioneer Valley Performing Arts CS 1 0 0 0 0 0 1 Boston Renaissance CS 43 1 2 4 1 7 58 Roxbury Preparatory CS 3 0 3 0 0 0 6 Salem Academy CS 13 0 0 0 0 3 16 Seven Hills CS 89 0 0 0 0 21 110 Prospect Hill Academy CS 9 4 0 11 0 5 29 MLK Jr CS of Excellence 19 0 0 1 0 0 20 Phoenix Charter Academy 23 0 0 1 0 1 25
57
District Name Spanish Portuguese Cape
Verdean Creole Haitian Vietnamese Other LEP
Pioneer Charter School of Science 2 3 0 2 0 0 7 Global Learning Charter Public 1 0 0 0 0 0 1 Pioneer Valley Chinese Imm CS 0 0 0 0 0 1 1 Acton-Boxborough 4 6 0 0 0 10 20 Adams-Cheshire 0 0 0 0 0 3 3 Amherst-Pelham 24 3 3 0 1 36 67 Ashburnham-Westminster 8 0 0 2 0 5 15 Athol-Royalston 8 0 0 0 0 7 15 Berkshire Hills 23 0 0 0 0 6 29 Berlin-Boylston 0 0 0 0 0 1 1 Blackstone-Millville 4 1 0 0 0 6 11 Bridgewater-Raynham 2 2 0 2 1 15 22 Central Berkshire 0 0 0 0 0 1 1 Concord-Carlisle 0 0 0 1 0 2 3 Dennis-Yarmouth 34 62 1 13 3 33 146 Dighton-Rehoboth 5 1 0 0 0 2 8 Dover-Sherborn 0 1 0 0 0 2 3 Dudley-Charlton Reg 14 4 0 0 0 32 50 Nauset 5 1 0 0 0 7 13 Freetown-Lakeville 0 1 0 0 0 0 1 Frontier 3 1 0 0 1 4 9 Gateway 1 0 0 0 0 10 11 Groton-Dunstable 6 1 0 0 0 4 11 Gill-Montague 24 0 0 1 0 20 45 Hamilton-Wenham 0 1 0 0 0 42 43 Hampden-Wilbraham 1 0 0 0 2 21 24 Hawlemont 0 1 0 0 0 0 1 King Philip 1 0 0 0 0 1 2 Lincoln-Sudbury 0 0 0 0 0 4 4 Manchester Essex Regional 0 0 0 0 0 3 3 Marthas Vineyard 0 16 0 0 0 0 16
58
District Name Spanish Portuguese Cape
Verdean Creole Haitian Vietnamese Other LEP
0 Masconomet 0 0 0 0 2 2 Mendon-Upton 1 1 0 0 0 8 10 Mount Greylock 0 0 0 0 0 2 2 Mohawk Trail 0 0 0 0 2 5 7 Narragansett 0 0 0 0 0 3 3 Nashoba 7 4 0 1 0 5 17 Northboro-Southboro 1 1 0 1 0 4 7 North Middlesex 11 1 0 0 0 4 16 Old Rochester 0 0 0 0 0 1 1 Pentucket 1 0 0 0 0 2 3 Quabbin 0 0 0 0 0 4 4 Ralph C Mahar 1 0 0 0 0 7 8 Silver Lake 0 0 0 0 0 1 1 Southern Berkshire 4 0 0 0 0 0 4 Southwick-Tolland 0 0 0 0 0 14 14 Spencer-E Brookfield 5 0 0 0 0 2 7 Triton 4 2 0 0 10 8 24 Up-Island Regional 2 1 0 0 0 2 5 Wachusett 3 3 0 0 7 34 47 Quaboag Regional 0 0 0 0 0 1 1 Whitman-Hanson 5 1 0 0 0 3 9 Assabet Valley Reg Voc Tech 8 1 0 0 0 0 9 Blue Hills Regional Vocational Technical 1 2 0 2 0 0 5 Bristol-Plymouth Reg Voc Tech 0 2 0 0 0 0 2 Cape Cod Reg Voc Tech 2 2 0 0 0 1 5 Greater Fall River Reg Voc Tech 1 1 0 0 0 0 2 Greater Lawrence Reg Voc Tech 33 0 0 0 0 1 34 GrNew Bedford Reg Voc Tech 14 6 0 0 0 0 20 Greater Lowell Reg Voc Tech 20 8 0 0 0 18 46 South Middlesex Reg Voc Tech 23 14 0 0 0 3 40 Minuteman Reg Voc Tech 2 0 0 0 0 1 3
59
60
District Name Spanish Portuguese Cape
Verdean Creole Haitian Vietnamese Other LEP
Montachusett Reg Voc Tech 4 0 0 0 0 4 8 Northeast Metro Reg Voc Tech 55 0 0 0 0 2 57 North Shore Reg Voc Tech 3 0 0 0 0 0 3 Southeastern Reg Voc Tech 0 2 3 3 0 1 9 Southern Worcester County Reg Voc Tech 3 0 0 0 0 1 4 Tri County Reg Voc Tech 0 1 0 0 0 0 1 Whittier Reg Voc Tech 6 0 0 0 0 0 6 TOTALS 31793 4209 2458 2433 2423 15842 59158
Source The Department Student Information Management System 2009
- Introduction
-
- Background
-
- I English Language Learners in Massachusetts
- II Educators Implementing Sheltered English Immersion Elementary and Secondary Content Teachers of English Language Learners
-
- Research on Professional Development for Educators of English Language Learners
- Gaps in Knowledge
-
- III Use of Funds for Category Training
-
- Future Need for Category Training
-
- IV Educators Implementing Sheltered English Immersion English as a Second Language (ESL) Teachers
-
- ESL Teacher Shortage
-
- V Use of Funds ESL Teachers and ESL Curriculum Development
-
- Massachusetts English Language Teacher Initiative (MELT)
- Improvement of Sheltered English Immersion Content-based ESL Instruction
- Future Need for ESL teachers
-
- VI Budget
- Attachments
-
- Attachment 1 All Massachusetts public school districts and changes in LEP population compared to changes in overall student population - SY 2006-SY 2010
- Attachment 1 Massachusetts public school districts and changes in LEP population compared to changes in overall student population - SY 2006-SY 2010
- Attachment 2 Massachusetts public school districts with large changes in LEP population compared to changes in overall student population - SY 2006-SY 2010
- Attachment 3 Bibliography Professional Development for Teachers of English Language Learners
- Attachment 4 Excerpts from the Commissionerrsquos Memorandum of June 2004 Guidance on Qualifications for Teachers of Limited English Proficient Students in Sheltered English Immersion Classrooms
- Attachment 5 Districts Receiving Sheltered English Immersion Professional Development 2004-2010
- Attachment 6 Collaboratives that have received grants for Sheltered English Immersion Professional Development 2004-2010
- Attachment 7 English Language Learners in Massachusetts District and Program Type October 2009
- Attachment 8 English Language Learners in Massachusetts District and First Language October 2009
-
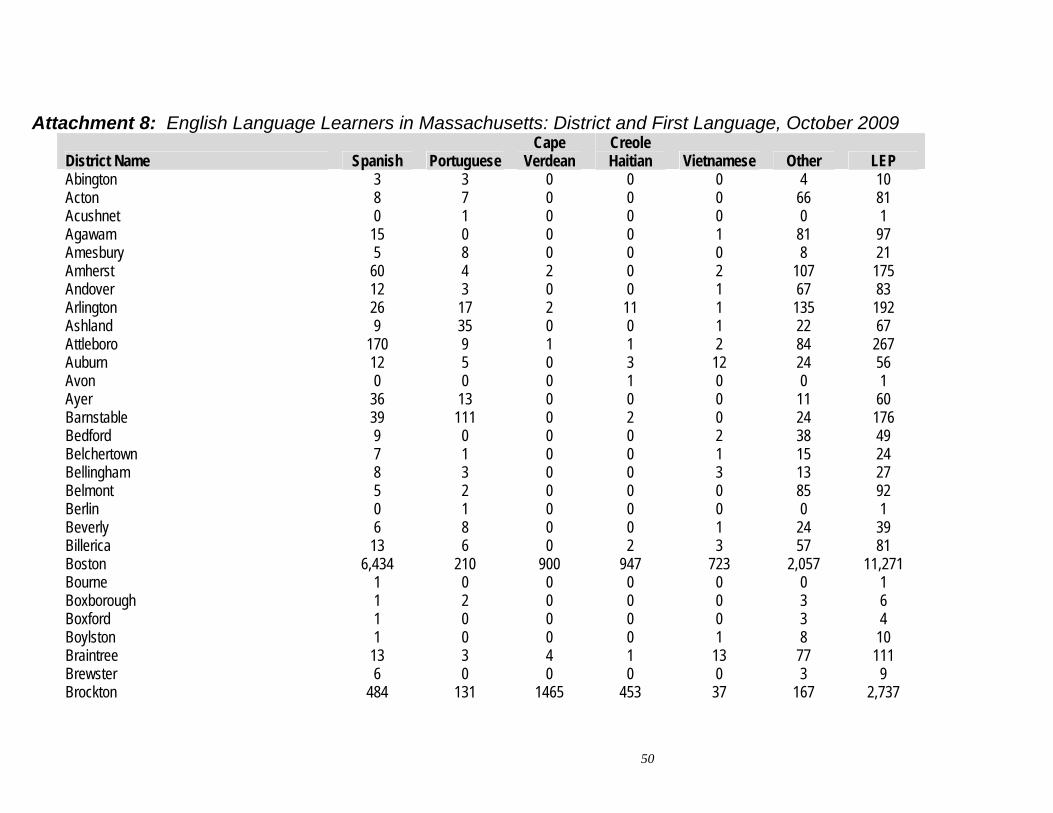
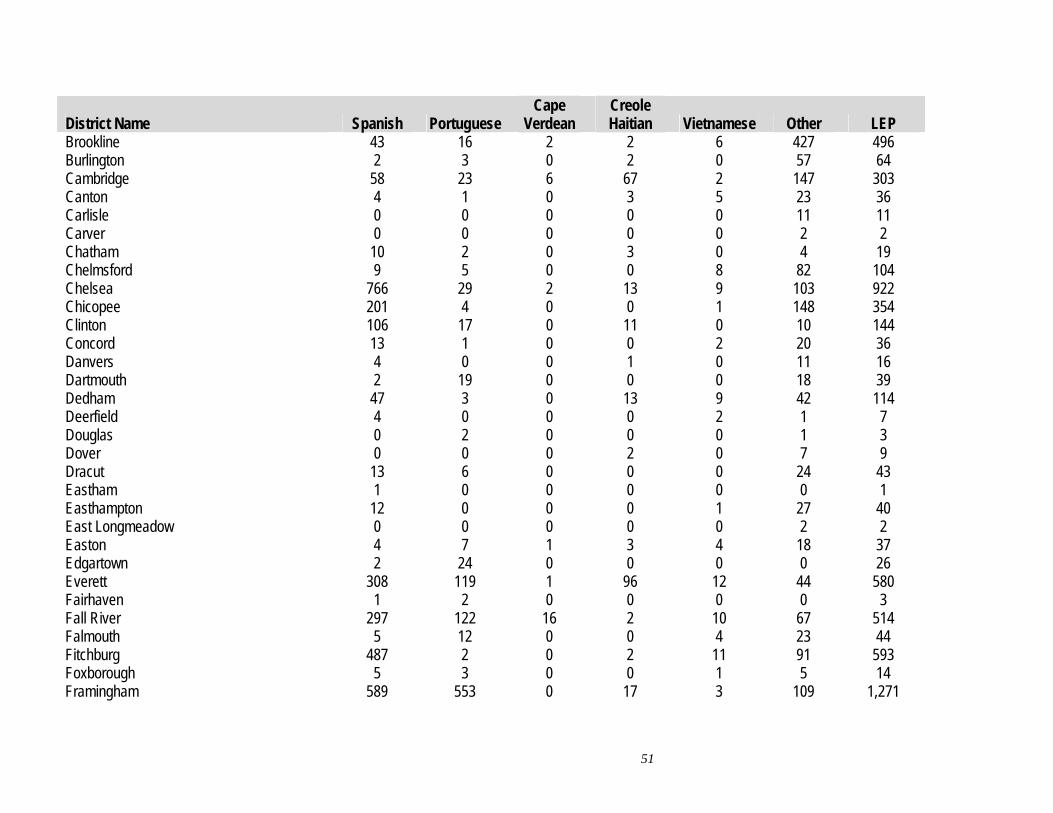
District Name Spanish Portuguese Cape
Verdean Creole Haitian Vietnamese Other LEP
Brookline 43 16 2 2 6 427 496 Burlington 2 3 0 2 0 57 64 Cambridge 58 23 6 67 2 147 303 Canton 4 1 0 3 5 23 36 Carlisle 0 0 0 0 0 11 11 Carver 0 0 0 0 0 2 2 Chatham 10 2 0 3 0 4 19 Chelmsford 9 5 0 0 8 82 104 Chelsea 766 29 2 13 9 103 922 Chicopee 201 4 0 0 1 148 354 Clinton 106 17 0 11 0 10 144 Concord 13 1 0 0 2 20 36 Danvers 4 0 0 1 0 11 16 Dartmouth 2 19 0 0 0 18 39 Dedham 47 3 0 13 9 42 114 Deerfield 4 0 0 0 2 1 7 Douglas 0 2 0 0 0 1 3 Dover 0 0 0 2 0 7 9 Dracut 13 6 0 0 0 24 43 Eastham 1 0 0 0 0 0 1 Easthampton 12 0 0 0 1 27 40 East Longmeadow 0 0 0 0 0 2 2 Easton 4 7 1 3 4 18 37 Edgartown 2 24 0 0 0 0 26 Everett 308 119 1 96 12 44 580 Fairhaven 1 2 0 0 0 0 3 Fall River 297 122 16 2 10 67 514 Falmouth 5 12 0 0 4 23 44 Fitchburg 487 2 0 2 11 91 593 Foxborough 5 3 0 0 1 5 14 Framingham 589 553 0 17 3 109 1271
51
District Name Spanish Portuguese Cape
Verdean Creole Haitian Vietnamese Other LEP
Franklin 13 5 0 1 4 32 55 Gardner 80 1 0 3 2 9 95 Georgetown 0 0 0 0 0 2 2 Gloucester 38 20 0 0 4 13 75 Grafton 3 0 0 0 0 11 14 Granby 3 0 0 0 0 10 13 Greenfield 18 0 0 0 1 35 54 Hadley 8 0 0 0 0 8 16 Hanover 1 0 0 0 1 6 8 Harvard 1 0 0 0 0 1 2 Harwich 12 3 0 8 1 24 48 Haverhill 407 11 0 3 7 33 461 Hingham 0 1 0 0 0 9 10 Holbrook 8 4 0 5 1 8 26 Holland 0 1 0 0 0 0 1 Holliston 7 14 0 0 0 16 37 Holyoke 1361 0 0 0 2 14 1377 Hopedale 2 2 0 0 0 5 9 Hopkinton 7 1 0 0 0 30 38 Hudson 32 67 0 1 1 13 114 Hull 0 1 1 0 0 1 3 Ipswich 5 3 0 0 0 10 18 Kingston 0 2 0 0 0 1 3 Lanesborough 0 0 0 0 0 2 2 Lawrence 2732 3 0 5 32 63 2835 Lee 13 1 0 0 0 4 18 Leicester 7 0 0 0 6 8 21 Lenox 1 0 0 0 0 6 7 Leominster 277 44 0 2 3 72 398 Lexington 21 5 0 4 0 266 296 Lincoln 4 0 0 1 0 21 26
52
District Name Spanish Portuguese Cape
Verdean Creole Haitian Vietnamese Other LEP
Littleton 1 3 1 0 0 10 15 Longmeadow 5 2 0 0 1 31 39 Lowell 1595 324 3 14 131 2254 4321 Ludlow 6 11 0 0 0 25 42 Lunenburg 2 4 0 0 0 4 10 Lynn 2662 30 1 67 62 643 3465 Lynnfield 1 0 0 0 0 3 4 Malden 120 99 0 116 51 320 706 Mansfield 10 6 0 0 0 28 44 Marblehead 3 1 0 0 0 15 19 Marion 0 0 0 0 0 1 1 Marlborough 261 211 0 2 4 31 509 Marshfield 3 11 0 0 0 9 23 Mashpee 0 0 0 0 1 17 18 Mattapoisett 0 0 0 0 0 2 2 Maynard 14 11 0 2 0 6 33 Medfield 0 2 0 0 0 4 6 Medford 28 80 0 96 12 83 299 Medway 3 0 0 1 0 4 8 Melrose 4 5 0 7 2 58 76 Methuen 340 3 0 7 11 52 413 Middleborough 7 0 0 0 1 5 13 Middleton 2 1 0 0 0 10 13 Milford 100 101 0 0 2 24 227 Millbury 2 4 0 0 3 4 13 Millis 0 0 0 0 0 2 2 Milton 3 3 0 15 3 10 34 Monson 0 0 0 0 0 10 10 Nantucket 60 5 0 0 0 2 67 Natick 4 2 0 0 2 28 36 Needham 13 1 2 1 1 32 50
53
District Name Spanish Portuguese Cape
Verdean Creole Haitian Vietnamese Other LEP
New Bedford 289 31 1 2 5 133 461 Newburyport 4 3 0 0 0 5 12 Newton 112 22 0 7 11 536 688 North Adams 19 2 0 0 0 7 28 Northampton 40 0 0 0 0 10 50 North Andover 18 1 0 0 4 26 49 North Attleborough 19 0 0 0 1 18 38 Northborough 16 13 0 0 0 37 66 Northbridge 6 0 0 0 0 6 12 North Brookfield 0 0 0 0 0 3 3 North Reading 2 0 0 0 0 9 11 Norton 0 0 0 0 0 5 5 Norwell 2 0 0 0 0 1 3 Norwood 38 39 0 11 5 82 175 Oak Bluffs 0 19 0 0 0 1 20 Orleans 0 0 0 0 0 2 2 Oxford 3 0 0 0 0 2 5 Palmer 4 2 0 0 0 11 17 Peabody 175 100 0 0 11 70 356 Pittsfield 168 1 0 0 8 56 233 Plymouth 9 26 0 1 2 9 47 Provincetown 7 0 0 0 0 0 7 Quincy 41 31 0 6 126 840 1044 Randolph 17 6 3 71 54 33 184 Reading 1 3 0 0 1 11 16 Revere 392 39 0 8 31 155 625 Rockland 3 22 0 0 2 1 28 Rockport 1 0 0 0 0 4 5 Salem 430 9 0 5 7 56 507 Sandwich 0 0 0 0 0 1 1 Saugus 22 15 0 6 6 19 68
54
District Name Spanish Portuguese Cape
Verdean Creole Haitian Vietnamese Other LEP
Scituate 1 5 6 0 0 2 14 Seekonk 5 1 0 0 2 15 23 Sharon 1 0 0 5 6 32 44 Sherborn 0 0 0 0 0 1 1 Shirley 2 1 0 0 0 2 5 Shrewsbury 15 39 0 0 6 84 144 Somerset 0 0 0 0 0 2 2 Somerville 372 170 5 73 5 152 777 Southampton 1 0 0 0 0 2 3 Southborough 5 4 0 0 0 38 47 Southbridge 219 0 0 0 0 13 232 South Hadley 11 0 0 0 1 3 15 Springfield 2970 2 0 4 87 225 3288 Stoneham 17 11 0 1 3 26 58 Stoughton 21 60 8 17 9 51 166 Sturbridge 1 2 0 0 0 0 3 Sudbury 8 2 0 0 1 7 18 Sunderland 2 0 0 0 0 1 3 Swampscott 8 4 1 2 2 35 52 Swansea 3 2 0 0 0 5 10 Taunton 72 43 5 9 1 29 159 Tewksbury 2 1 0 0 2 7 12 Tisbury 0 26 0 0 0 2 28 Topsfield 0 0 0 0 0 2 2 Uxbridge 11 3 0 0 0 16 30 Wakefield 8 2 0 0 2 6 18 Wales 0 0 0 0 0 1 1 Walpole 18 14 0 13 1 36 82 Waltham 333 27 0 26 3 86 475 Ware 7 0 0 0 0 4 11 Wareham 4 2 0 0 2 9 17
55
District Name Spanish Portuguese Cape
Verdean Creole Haitian Vietnamese Other LEP
Watertown 52 32 0 2 0 182 268 Wayland 1 0 0 0 0 14 15 Webster 32 4 0 0 1 12 49 Wellesley 16 0 0 0 0 55 71 Westborough 43 38 0 1 0 174 256 West Boylston 0 1 0 0 0 2 3 West Bridgewater 0 0 0 2 0 0 2 Westfield 34 0 0 0 0 177 211 Westford 3 0 0 1 2 27 33 Weston 5 0 1 3 1 41 51 Westport 1 9 0 0 4 1 15 West Springfield 29 2 0 0 3 242 276 Westwood 3 0 0 0 0 28 31 Weymouth 12 49 0 1 4 38 104 Williamsburg 0 2 0 0 0 0 2 Williamstown 2 3 0 0 0 4 9 Wilmington 1 3 0 0 4 14 22 Winchendon 4 2 0 0 0 5 11 Winchester 10 10 0 2 2 117 141 Winthrop 18 9 0 1 0 38 66 Woburn 27 44 0 8 8 109 196 Worcester 3636 297 4 44 703 1704 6388 Wrentham 2 3 0 0 0 3 8 Northampton-Smith Voc Agr 5 0 0 0 0 0 5 Excel Academy CS 9 0 0 0 0 0 9 Academy Of the Pacific Rim CS 3 1 0 1 0 0 5 Boston Preparatory CS 3 0 0 2 0 0 5 Christa McAuliffe Regional CS 2 0 0 0 0 0 2 Smith Leadership Academy CS 1 0 0 0 0 0 1 Benjamin Banneker CS 5 0 0 16 0 1 22 Barnstable Horace Mann CS 6 16 0 0 0 9 31
56
District Name Spanish Portuguese Cape
Verdean Creole Haitian Vietnamese Other LEP
Barnstable Com Horace Mann CS 17 17 0 0 0 1 35 Edward Brooke CS 3 0 0 0 0 0 3 KIPP Academy Lynn CS 4 0 0 0 0 0 4 Innovation Academy CS 1 0 0 0 0 0 1 Community CS of Cambridge 3 0 0 5 0 2 10 City On A Hill CS 3 0 0 0 0 1 4 Codman Academy CS 1 0 0 0 0 0 1 Conservatory Lab Charter (District) 14 4 0 0 0 3 21 Community Day CS 96 0 0 2 0 0 98 Sabis International CS 17 0 0 0 4 4 25 Neighborhood House CS 3 0 1 1 3 1 9 Abby Kelley Foster CS 12 5 0 0 0 11 28 Foxborough Reg CS 2 0 0 5 0 22 29 Hilltown Cooperative CS 0 0 0 0 0 1 1 EM Kennedy Acad Health Careers HMCS 1 0 1 0 0 0 2 Holyoke Com CS 32 0 0 0 0 0 32 Lawrence Family Development CS 251 0 0 0 0 1 252 Hill View Montessori CS 6 0 0 0 0 1 7 Lowell Community CS 100 19 0 4 3 121 247 Marthas Vineyard CS 0 3 0 0 0 1 4 New Leadership Charter 3 0 0 0 0 1 4 North Central Charter Essential 2 0 0 0 0 1 3 Silver Hill Horace Mann Charter 25 1 0 1 0 4 31 Pioneer Valley Performing Arts CS 1 0 0 0 0 0 1 Boston Renaissance CS 43 1 2 4 1 7 58 Roxbury Preparatory CS 3 0 3 0 0 0 6 Salem Academy CS 13 0 0 0 0 3 16 Seven Hills CS 89 0 0 0 0 21 110 Prospect Hill Academy CS 9 4 0 11 0 5 29 MLK Jr CS of Excellence 19 0 0 1 0 0 20 Phoenix Charter Academy 23 0 0 1 0 1 25
57
District Name Spanish Portuguese Cape
Verdean Creole Haitian Vietnamese Other LEP
Pioneer Charter School of Science 2 3 0 2 0 0 7 Global Learning Charter Public 1 0 0 0 0 0 1 Pioneer Valley Chinese Imm CS 0 0 0 0 0 1 1 Acton-Boxborough 4 6 0 0 0 10 20 Adams-Cheshire 0 0 0 0 0 3 3 Amherst-Pelham 24 3 3 0 1 36 67 Ashburnham-Westminster 8 0 0 2 0 5 15 Athol-Royalston 8 0 0 0 0 7 15 Berkshire Hills 23 0 0 0 0 6 29 Berlin-Boylston 0 0 0 0 0 1 1 Blackstone-Millville 4 1 0 0 0 6 11 Bridgewater-Raynham 2 2 0 2 1 15 22 Central Berkshire 0 0 0 0 0 1 1 Concord-Carlisle 0 0 0 1 0 2 3 Dennis-Yarmouth 34 62 1 13 3 33 146 Dighton-Rehoboth 5 1 0 0 0 2 8 Dover-Sherborn 0 1 0 0 0 2 3 Dudley-Charlton Reg 14 4 0 0 0 32 50 Nauset 5 1 0 0 0 7 13 Freetown-Lakeville 0 1 0 0 0 0 1 Frontier 3 1 0 0 1 4 9 Gateway 1 0 0 0 0 10 11 Groton-Dunstable 6 1 0 0 0 4 11 Gill-Montague 24 0 0 1 0 20 45 Hamilton-Wenham 0 1 0 0 0 42 43 Hampden-Wilbraham 1 0 0 0 2 21 24 Hawlemont 0 1 0 0 0 0 1 King Philip 1 0 0 0 0 1 2 Lincoln-Sudbury 0 0 0 0 0 4 4 Manchester Essex Regional 0 0 0 0 0 3 3 Marthas Vineyard 0 16 0 0 0 0 16
58
District Name Spanish Portuguese Cape
Verdean Creole Haitian Vietnamese Other LEP
0 Masconomet 0 0 0 0 2 2 Mendon-Upton 1 1 0 0 0 8 10 Mount Greylock 0 0 0 0 0 2 2 Mohawk Trail 0 0 0 0 2 5 7 Narragansett 0 0 0 0 0 3 3 Nashoba 7 4 0 1 0 5 17 Northboro-Southboro 1 1 0 1 0 4 7 North Middlesex 11 1 0 0 0 4 16 Old Rochester 0 0 0 0 0 1 1 Pentucket 1 0 0 0 0 2 3 Quabbin 0 0 0 0 0 4 4 Ralph C Mahar 1 0 0 0 0 7 8 Silver Lake 0 0 0 0 0 1 1 Southern Berkshire 4 0 0 0 0 0 4 Southwick-Tolland 0 0 0 0 0 14 14 Spencer-E Brookfield 5 0 0 0 0 2 7 Triton 4 2 0 0 10 8 24 Up-Island Regional 2 1 0 0 0 2 5 Wachusett 3 3 0 0 7 34 47 Quaboag Regional 0 0 0 0 0 1 1 Whitman-Hanson 5 1 0 0 0 3 9 Assabet Valley Reg Voc Tech 8 1 0 0 0 0 9 Blue Hills Regional Vocational Technical 1 2 0 2 0 0 5 Bristol-Plymouth Reg Voc Tech 0 2 0 0 0 0 2 Cape Cod Reg Voc Tech 2 2 0 0 0 1 5 Greater Fall River Reg Voc Tech 1 1 0 0 0 0 2 Greater Lawrence Reg Voc Tech 33 0 0 0 0 1 34 GrNew Bedford Reg Voc Tech 14 6 0 0 0 0 20 Greater Lowell Reg Voc Tech 20 8 0 0 0 18 46 South Middlesex Reg Voc Tech 23 14 0 0 0 3 40 Minuteman Reg Voc Tech 2 0 0 0 0 1 3
59
60
District Name Spanish Portuguese Cape
Verdean Creole Haitian Vietnamese Other LEP
Montachusett Reg Voc Tech 4 0 0 0 0 4 8 Northeast Metro Reg Voc Tech 55 0 0 0 0 2 57 North Shore Reg Voc Tech 3 0 0 0 0 0 3 Southeastern Reg Voc Tech 0 2 3 3 0 1 9 Southern Worcester County Reg Voc Tech 3 0 0 0 0 1 4 Tri County Reg Voc Tech 0 1 0 0 0 0 1 Whittier Reg Voc Tech 6 0 0 0 0 0 6 TOTALS 31793 4209 2458 2433 2423 15842 59158
Source The Department Student Information Management System 2009
- Introduction
-
- Background
-
- I English Language Learners in Massachusetts
- II Educators Implementing Sheltered English Immersion Elementary and Secondary Content Teachers of English Language Learners
-
- Research on Professional Development for Educators of English Language Learners
- Gaps in Knowledge
-
- III Use of Funds for Category Training
-
- Future Need for Category Training
-
- IV Educators Implementing Sheltered English Immersion English as a Second Language (ESL) Teachers
-
- ESL Teacher Shortage
-
- V Use of Funds ESL Teachers and ESL Curriculum Development
-
- Massachusetts English Language Teacher Initiative (MELT)
- Improvement of Sheltered English Immersion Content-based ESL Instruction
- Future Need for ESL teachers
-
- VI Budget
- Attachments
-
- Attachment 1 All Massachusetts public school districts and changes in LEP population compared to changes in overall student population - SY 2006-SY 2010
- Attachment 1 Massachusetts public school districts and changes in LEP population compared to changes in overall student population - SY 2006-SY 2010
- Attachment 2 Massachusetts public school districts with large changes in LEP population compared to changes in overall student population - SY 2006-SY 2010
- Attachment 3 Bibliography Professional Development for Teachers of English Language Learners
- Attachment 4 Excerpts from the Commissionerrsquos Memorandum of June 2004 Guidance on Qualifications for Teachers of Limited English Proficient Students in Sheltered English Immersion Classrooms
- Attachment 5 Districts Receiving Sheltered English Immersion Professional Development 2004-2010
- Attachment 6 Collaboratives that have received grants for Sheltered English Immersion Professional Development 2004-2010
- Attachment 7 English Language Learners in Massachusetts District and Program Type October 2009
- Attachment 8 English Language Learners in Massachusetts District and First Language October 2009
-
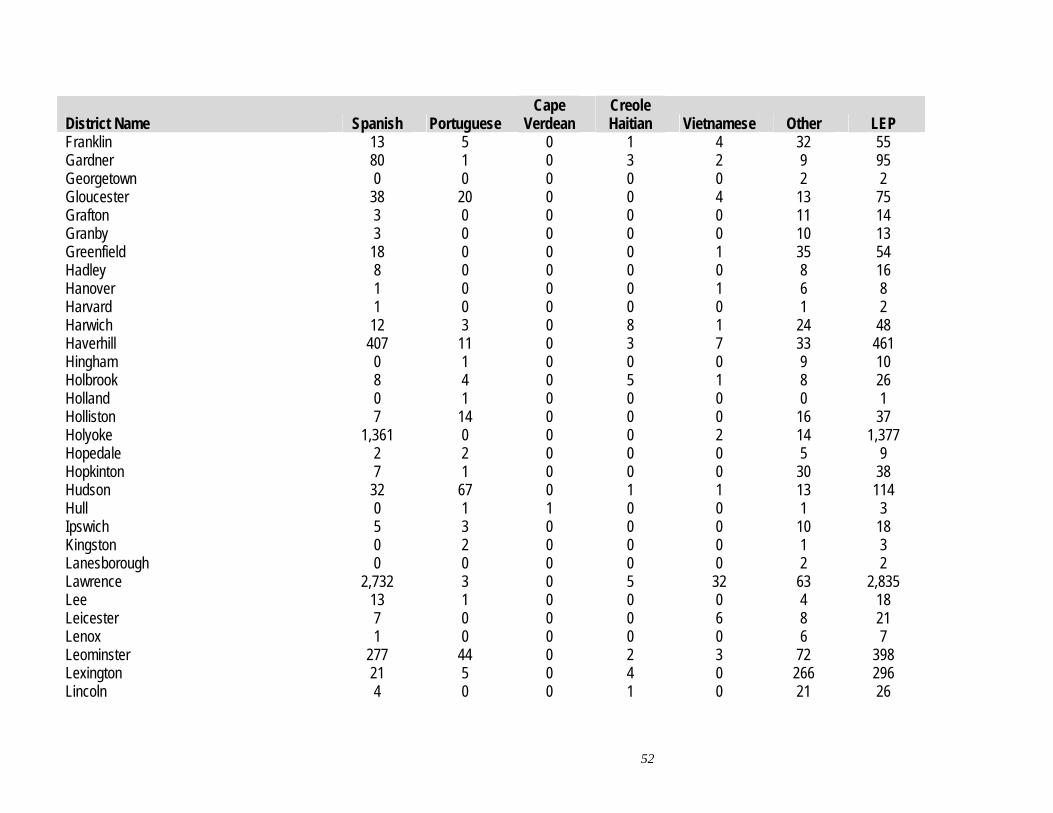
District Name Spanish Portuguese Cape
Verdean Creole Haitian Vietnamese Other LEP
Franklin 13 5 0 1 4 32 55 Gardner 80 1 0 3 2 9 95 Georgetown 0 0 0 0 0 2 2 Gloucester 38 20 0 0 4 13 75 Grafton 3 0 0 0 0 11 14 Granby 3 0 0 0 0 10 13 Greenfield 18 0 0 0 1 35 54 Hadley 8 0 0 0 0 8 16 Hanover 1 0 0 0 1 6 8 Harvard 1 0 0 0 0 1 2 Harwich 12 3 0 8 1 24 48 Haverhill 407 11 0 3 7 33 461 Hingham 0 1 0 0 0 9 10 Holbrook 8 4 0 5 1 8 26 Holland 0 1 0 0 0 0 1 Holliston 7 14 0 0 0 16 37 Holyoke 1361 0 0 0 2 14 1377 Hopedale 2 2 0 0 0 5 9 Hopkinton 7 1 0 0 0 30 38 Hudson 32 67 0 1 1 13 114 Hull 0 1 1 0 0 1 3 Ipswich 5 3 0 0 0 10 18 Kingston 0 2 0 0 0 1 3 Lanesborough 0 0 0 0 0 2 2 Lawrence 2732 3 0 5 32 63 2835 Lee 13 1 0 0 0 4 18 Leicester 7 0 0 0 6 8 21 Lenox 1 0 0 0 0 6 7 Leominster 277 44 0 2 3 72 398 Lexington 21 5 0 4 0 266 296 Lincoln 4 0 0 1 0 21 26
52
District Name Spanish Portuguese Cape
Verdean Creole Haitian Vietnamese Other LEP
Littleton 1 3 1 0 0 10 15 Longmeadow 5 2 0 0 1 31 39 Lowell 1595 324 3 14 131 2254 4321 Ludlow 6 11 0 0 0 25 42 Lunenburg 2 4 0 0 0 4 10 Lynn 2662 30 1 67 62 643 3465 Lynnfield 1 0 0 0 0 3 4 Malden 120 99 0 116 51 320 706 Mansfield 10 6 0 0 0 28 44 Marblehead 3 1 0 0 0 15 19 Marion 0 0 0 0 0 1 1 Marlborough 261 211 0 2 4 31 509 Marshfield 3 11 0 0 0 9 23 Mashpee 0 0 0 0 1 17 18 Mattapoisett 0 0 0 0 0 2 2 Maynard 14 11 0 2 0 6 33 Medfield 0 2 0 0 0 4 6 Medford 28 80 0 96 12 83 299 Medway 3 0 0 1 0 4 8 Melrose 4 5 0 7 2 58 76 Methuen 340 3 0 7 11 52 413 Middleborough 7 0 0 0 1 5 13 Middleton 2 1 0 0 0 10 13 Milford 100 101 0 0 2 24 227 Millbury 2 4 0 0 3 4 13 Millis 0 0 0 0 0 2 2 Milton 3 3 0 15 3 10 34 Monson 0 0 0 0 0 10 10 Nantucket 60 5 0 0 0 2 67 Natick 4 2 0 0 2 28 36 Needham 13 1 2 1 1 32 50
53
District Name Spanish Portuguese Cape
Verdean Creole Haitian Vietnamese Other LEP
New Bedford 289 31 1 2 5 133 461 Newburyport 4 3 0 0 0 5 12 Newton 112 22 0 7 11 536 688 North Adams 19 2 0 0 0 7 28 Northampton 40 0 0 0 0 10 50 North Andover 18 1 0 0 4 26 49 North Attleborough 19 0 0 0 1 18 38 Northborough 16 13 0 0 0 37 66 Northbridge 6 0 0 0 0 6 12 North Brookfield 0 0 0 0 0 3 3 North Reading 2 0 0 0 0 9 11 Norton 0 0 0 0 0 5 5 Norwell 2 0 0 0 0 1 3 Norwood 38 39 0 11 5 82 175 Oak Bluffs 0 19 0 0 0 1 20 Orleans 0 0 0 0 0 2 2 Oxford 3 0 0 0 0 2 5 Palmer 4 2 0 0 0 11 17 Peabody 175 100 0 0 11 70 356 Pittsfield 168 1 0 0 8 56 233 Plymouth 9 26 0 1 2 9 47 Provincetown 7 0 0 0 0 0 7 Quincy 41 31 0 6 126 840 1044 Randolph 17 6 3 71 54 33 184 Reading 1 3 0 0 1 11 16 Revere 392 39 0 8 31 155 625 Rockland 3 22 0 0 2 1 28 Rockport 1 0 0 0 0 4 5 Salem 430 9 0 5 7 56 507 Sandwich 0 0 0 0 0 1 1 Saugus 22 15 0 6 6 19 68
54
District Name Spanish Portuguese Cape
Verdean Creole Haitian Vietnamese Other LEP
Scituate 1 5 6 0 0 2 14 Seekonk 5 1 0 0 2 15 23 Sharon 1 0 0 5 6 32 44 Sherborn 0 0 0 0 0 1 1 Shirley 2 1 0 0 0 2 5 Shrewsbury 15 39 0 0 6 84 144 Somerset 0 0 0 0 0 2 2 Somerville 372 170 5 73 5 152 777 Southampton 1 0 0 0 0 2 3 Southborough 5 4 0 0 0 38 47 Southbridge 219 0 0 0 0 13 232 South Hadley 11 0 0 0 1 3 15 Springfield 2970 2 0 4 87 225 3288 Stoneham 17 11 0 1 3 26 58 Stoughton 21 60 8 17 9 51 166 Sturbridge 1 2 0 0 0 0 3 Sudbury 8 2 0 0 1 7 18 Sunderland 2 0 0 0 0 1 3 Swampscott 8 4 1 2 2 35 52 Swansea 3 2 0 0 0 5 10 Taunton 72 43 5 9 1 29 159 Tewksbury 2 1 0 0 2 7 12 Tisbury 0 26 0 0 0 2 28 Topsfield 0 0 0 0 0 2 2 Uxbridge 11 3 0 0 0 16 30 Wakefield 8 2 0 0 2 6 18 Wales 0 0 0 0 0 1 1 Walpole 18 14 0 13 1 36 82 Waltham 333 27 0 26 3 86 475 Ware 7 0 0 0 0 4 11 Wareham 4 2 0 0 2 9 17
55
District Name Spanish Portuguese Cape
Verdean Creole Haitian Vietnamese Other LEP
Watertown 52 32 0 2 0 182 268 Wayland 1 0 0 0 0 14 15 Webster 32 4 0 0 1 12 49 Wellesley 16 0 0 0 0 55 71 Westborough 43 38 0 1 0 174 256 West Boylston 0 1 0 0 0 2 3 West Bridgewater 0 0 0 2 0 0 2 Westfield 34 0 0 0 0 177 211 Westford 3 0 0 1 2 27 33 Weston 5 0 1 3 1 41 51 Westport 1 9 0 0 4 1 15 West Springfield 29 2 0 0 3 242 276 Westwood 3 0 0 0 0 28 31 Weymouth 12 49 0 1 4 38 104 Williamsburg 0 2 0 0 0 0 2 Williamstown 2 3 0 0 0 4 9 Wilmington 1 3 0 0 4 14 22 Winchendon 4 2 0 0 0 5 11 Winchester 10 10 0 2 2 117 141 Winthrop 18 9 0 1 0 38 66 Woburn 27 44 0 8 8 109 196 Worcester 3636 297 4 44 703 1704 6388 Wrentham 2 3 0 0 0 3 8 Northampton-Smith Voc Agr 5 0 0 0 0 0 5 Excel Academy CS 9 0 0 0 0 0 9 Academy Of the Pacific Rim CS 3 1 0 1 0 0 5 Boston Preparatory CS 3 0 0 2 0 0 5 Christa McAuliffe Regional CS 2 0 0 0 0 0 2 Smith Leadership Academy CS 1 0 0 0 0 0 1 Benjamin Banneker CS 5 0 0 16 0 1 22 Barnstable Horace Mann CS 6 16 0 0 0 9 31
56
District Name Spanish Portuguese Cape
Verdean Creole Haitian Vietnamese Other LEP
Barnstable Com Horace Mann CS 17 17 0 0 0 1 35 Edward Brooke CS 3 0 0 0 0 0 3 KIPP Academy Lynn CS 4 0 0 0 0 0 4 Innovation Academy CS 1 0 0 0 0 0 1 Community CS of Cambridge 3 0 0 5 0 2 10 City On A Hill CS 3 0 0 0 0 1 4 Codman Academy CS 1 0 0 0 0 0 1 Conservatory Lab Charter (District) 14 4 0 0 0 3 21 Community Day CS 96 0 0 2 0 0 98 Sabis International CS 17 0 0 0 4 4 25 Neighborhood House CS 3 0 1 1 3 1 9 Abby Kelley Foster CS 12 5 0 0 0 11 28 Foxborough Reg CS 2 0 0 5 0 22 29 Hilltown Cooperative CS 0 0 0 0 0 1 1 EM Kennedy Acad Health Careers HMCS 1 0 1 0 0 0 2 Holyoke Com CS 32 0 0 0 0 0 32 Lawrence Family Development CS 251 0 0 0 0 1 252 Hill View Montessori CS 6 0 0 0 0 1 7 Lowell Community CS 100 19 0 4 3 121 247 Marthas Vineyard CS 0 3 0 0 0 1 4 New Leadership Charter 3 0 0 0 0 1 4 North Central Charter Essential 2 0 0 0 0 1 3 Silver Hill Horace Mann Charter 25 1 0 1 0 4 31 Pioneer Valley Performing Arts CS 1 0 0 0 0 0 1 Boston Renaissance CS 43 1 2 4 1 7 58 Roxbury Preparatory CS 3 0 3 0 0 0 6 Salem Academy CS 13 0 0 0 0 3 16 Seven Hills CS 89 0 0 0 0 21 110 Prospect Hill Academy CS 9 4 0 11 0 5 29 MLK Jr CS of Excellence 19 0 0 1 0 0 20 Phoenix Charter Academy 23 0 0 1 0 1 25
57
District Name Spanish Portuguese Cape
Verdean Creole Haitian Vietnamese Other LEP
Pioneer Charter School of Science 2 3 0 2 0 0 7 Global Learning Charter Public 1 0 0 0 0 0 1 Pioneer Valley Chinese Imm CS 0 0 0 0 0 1 1 Acton-Boxborough 4 6 0 0 0 10 20 Adams-Cheshire 0 0 0 0 0 3 3 Amherst-Pelham 24 3 3 0 1 36 67 Ashburnham-Westminster 8 0 0 2 0 5 15 Athol-Royalston 8 0 0 0 0 7 15 Berkshire Hills 23 0 0 0 0 6 29 Berlin-Boylston 0 0 0 0 0 1 1 Blackstone-Millville 4 1 0 0 0 6 11 Bridgewater-Raynham 2 2 0 2 1 15 22 Central Berkshire 0 0 0 0 0 1 1 Concord-Carlisle 0 0 0 1 0 2 3 Dennis-Yarmouth 34 62 1 13 3 33 146 Dighton-Rehoboth 5 1 0 0 0 2 8 Dover-Sherborn 0 1 0 0 0 2 3 Dudley-Charlton Reg 14 4 0 0 0 32 50 Nauset 5 1 0 0 0 7 13 Freetown-Lakeville 0 1 0 0 0 0 1 Frontier 3 1 0 0 1 4 9 Gateway 1 0 0 0 0 10 11 Groton-Dunstable 6 1 0 0 0 4 11 Gill-Montague 24 0 0 1 0 20 45 Hamilton-Wenham 0 1 0 0 0 42 43 Hampden-Wilbraham 1 0 0 0 2 21 24 Hawlemont 0 1 0 0 0 0 1 King Philip 1 0 0 0 0 1 2 Lincoln-Sudbury 0 0 0 0 0 4 4 Manchester Essex Regional 0 0 0 0 0 3 3 Marthas Vineyard 0 16 0 0 0 0 16
58
District Name Spanish Portuguese Cape
Verdean Creole Haitian Vietnamese Other LEP
0 Masconomet 0 0 0 0 2 2 Mendon-Upton 1 1 0 0 0 8 10 Mount Greylock 0 0 0 0 0 2 2 Mohawk Trail 0 0 0 0 2 5 7 Narragansett 0 0 0 0 0 3 3 Nashoba 7 4 0 1 0 5 17 Northboro-Southboro 1 1 0 1 0 4 7 North Middlesex 11 1 0 0 0 4 16 Old Rochester 0 0 0 0 0 1 1 Pentucket 1 0 0 0 0 2 3 Quabbin 0 0 0 0 0 4 4 Ralph C Mahar 1 0 0 0 0 7 8 Silver Lake 0 0 0 0 0 1 1 Southern Berkshire 4 0 0 0 0 0 4 Southwick-Tolland 0 0 0 0 0 14 14 Spencer-E Brookfield 5 0 0 0 0 2 7 Triton 4 2 0 0 10 8 24 Up-Island Regional 2 1 0 0 0 2 5 Wachusett 3 3 0 0 7 34 47 Quaboag Regional 0 0 0 0 0 1 1 Whitman-Hanson 5 1 0 0 0 3 9 Assabet Valley Reg Voc Tech 8 1 0 0 0 0 9 Blue Hills Regional Vocational Technical 1 2 0 2 0 0 5 Bristol-Plymouth Reg Voc Tech 0 2 0 0 0 0 2 Cape Cod Reg Voc Tech 2 2 0 0 0 1 5 Greater Fall River Reg Voc Tech 1 1 0 0 0 0 2 Greater Lawrence Reg Voc Tech 33 0 0 0 0 1 34 GrNew Bedford Reg Voc Tech 14 6 0 0 0 0 20 Greater Lowell Reg Voc Tech 20 8 0 0 0 18 46 South Middlesex Reg Voc Tech 23 14 0 0 0 3 40 Minuteman Reg Voc Tech 2 0 0 0 0 1 3
59
60
District Name Spanish Portuguese Cape
Verdean Creole Haitian Vietnamese Other LEP
Montachusett Reg Voc Tech 4 0 0 0 0 4 8 Northeast Metro Reg Voc Tech 55 0 0 0 0 2 57 North Shore Reg Voc Tech 3 0 0 0 0 0 3 Southeastern Reg Voc Tech 0 2 3 3 0 1 9 Southern Worcester County Reg Voc Tech 3 0 0 0 0 1 4 Tri County Reg Voc Tech 0 1 0 0 0 0 1 Whittier Reg Voc Tech 6 0 0 0 0 0 6 TOTALS 31793 4209 2458 2433 2423 15842 59158
Source The Department Student Information Management System 2009
- Introduction
-
- Background
-
- I English Language Learners in Massachusetts
- II Educators Implementing Sheltered English Immersion Elementary and Secondary Content Teachers of English Language Learners
-
- Research on Professional Development for Educators of English Language Learners
- Gaps in Knowledge
-
- III Use of Funds for Category Training
-
- Future Need for Category Training
-
- IV Educators Implementing Sheltered English Immersion English as a Second Language (ESL) Teachers
-
- ESL Teacher Shortage
-
- V Use of Funds ESL Teachers and ESL Curriculum Development
-
- Massachusetts English Language Teacher Initiative (MELT)
- Improvement of Sheltered English Immersion Content-based ESL Instruction
- Future Need for ESL teachers
-
- VI Budget
- Attachments
-
- Attachment 1 All Massachusetts public school districts and changes in LEP population compared to changes in overall student population - SY 2006-SY 2010
- Attachment 1 Massachusetts public school districts and changes in LEP population compared to changes in overall student population - SY 2006-SY 2010
- Attachment 2 Massachusetts public school districts with large changes in LEP population compared to changes in overall student population - SY 2006-SY 2010
- Attachment 3 Bibliography Professional Development for Teachers of English Language Learners
- Attachment 4 Excerpts from the Commissionerrsquos Memorandum of June 2004 Guidance on Qualifications for Teachers of Limited English Proficient Students in Sheltered English Immersion Classrooms
- Attachment 5 Districts Receiving Sheltered English Immersion Professional Development 2004-2010
- Attachment 6 Collaboratives that have received grants for Sheltered English Immersion Professional Development 2004-2010
- Attachment 7 English Language Learners in Massachusetts District and Program Type October 2009
- Attachment 8 English Language Learners in Massachusetts District and First Language October 2009
-
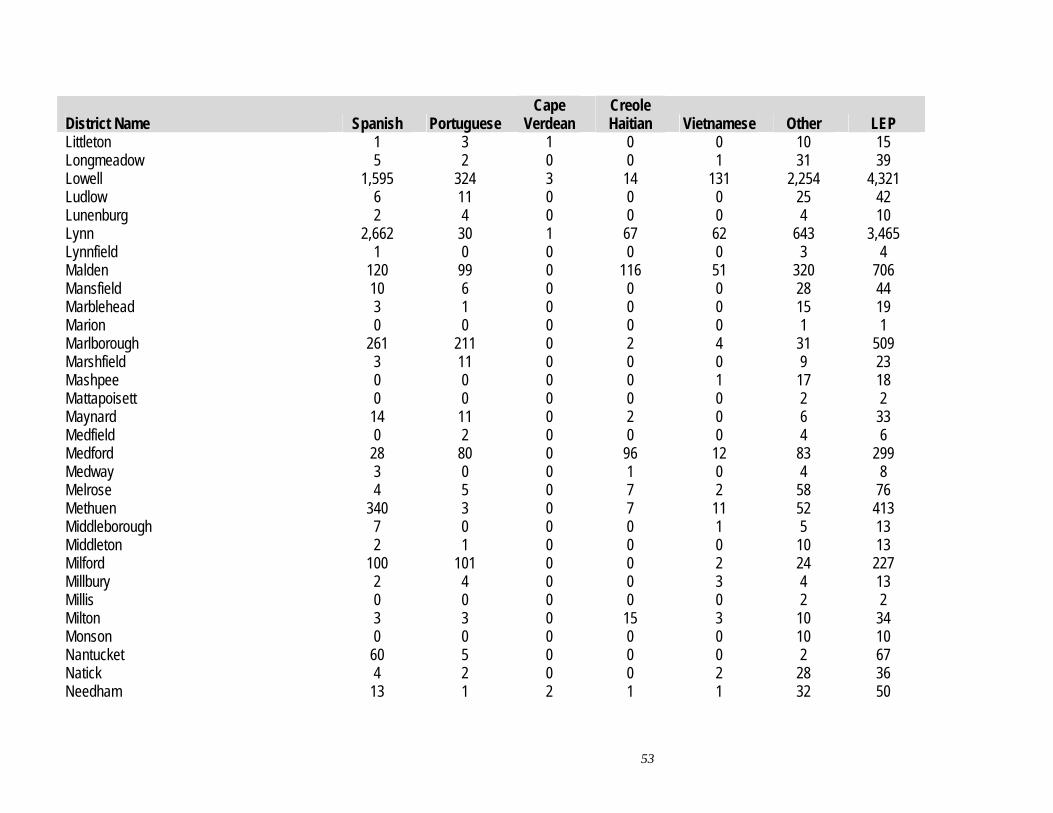
District Name Spanish Portuguese Cape
Verdean Creole Haitian Vietnamese Other LEP
New Bedford 289 31 1 2 5 133 461 Newburyport 4 3 0 0 0 5 12 Newton 112 22 0 7 11 536 688 North Adams 19 2 0 0 0 7 28 Northampton 40 0 0 0 0 10 50 North Andover 18 1 0 0 4 26 49 North Attleborough 19 0 0 0 1 18 38 Northborough 16 13 0 0 0 37 66 Northbridge 6 0 0 0 0 6 12 North Brookfield 0 0 0 0 0 3 3 North Reading 2 0 0 0 0 9 11 Norton 0 0 0 0 0 5 5 Norwell 2 0 0 0 0 1 3 Norwood 38 39 0 11 5 82 175 Oak Bluffs 0 19 0 0 0 1 20 Orleans 0 0 0 0 0 2 2 Oxford 3 0 0 0 0 2 5 Palmer 4 2 0 0 0 11 17 Peabody 175 100 0 0 11 70 356 Pittsfield 168 1 0 0 8 56 233 Plymouth 9 26 0 1 2 9 47 Provincetown 7 0 0 0 0 0 7 Quincy 41 31 0 6 126 840 1044 Randolph 17 6 3 71 54 33 184 Reading 1 3 0 0 1 11 16 Revere 392 39 0 8 31 155 625 Rockland 3 22 0 0 2 1 28 Rockport 1 0 0 0 0 4 5 Salem 430 9 0 5 7 56 507 Sandwich 0 0 0 0 0 1 1 Saugus 22 15 0 6 6 19 68
54
District Name Spanish Portuguese Cape
Verdean Creole Haitian Vietnamese Other LEP
Scituate 1 5 6 0 0 2 14 Seekonk 5 1 0 0 2 15 23 Sharon 1 0 0 5 6 32 44 Sherborn 0 0 0 0 0 1 1 Shirley 2 1 0 0 0 2 5 Shrewsbury 15 39 0 0 6 84 144 Somerset 0 0 0 0 0 2 2 Somerville 372 170 5 73 5 152 777 Southampton 1 0 0 0 0 2 3 Southborough 5 4 0 0 0 38 47 Southbridge 219 0 0 0 0 13 232 South Hadley 11 0 0 0 1 3 15 Springfield 2970 2 0 4 87 225 3288 Stoneham 17 11 0 1 3 26 58 Stoughton 21 60 8 17 9 51 166 Sturbridge 1 2 0 0 0 0 3 Sudbury 8 2 0 0 1 7 18 Sunderland 2 0 0 0 0 1 3 Swampscott 8 4 1 2 2 35 52 Swansea 3 2 0 0 0 5 10 Taunton 72 43 5 9 1 29 159 Tewksbury 2 1 0 0 2 7 12 Tisbury 0 26 0 0 0 2 28 Topsfield 0 0 0 0 0 2 2 Uxbridge 11 3 0 0 0 16 30 Wakefield 8 2 0 0 2 6 18 Wales 0 0 0 0 0 1 1 Walpole 18 14 0 13 1 36 82 Waltham 333 27 0 26 3 86 475 Ware 7 0 0 0 0 4 11 Wareham 4 2 0 0 2 9 17
55
District Name Spanish Portuguese Cape
Verdean Creole Haitian Vietnamese Other LEP
Watertown 52 32 0 2 0 182 268 Wayland 1 0 0 0 0 14 15 Webster 32 4 0 0 1 12 49 Wellesley 16 0 0 0 0 55 71 Westborough 43 38 0 1 0 174 256 West Boylston 0 1 0 0 0 2 3 West Bridgewater 0 0 0 2 0 0 2 Westfield 34 0 0 0 0 177 211 Westford 3 0 0 1 2 27 33 Weston 5 0 1 3 1 41 51 Westport 1 9 0 0 4 1 15 West Springfield 29 2 0 0 3 242 276 Westwood 3 0 0 0 0 28 31 Weymouth 12 49 0 1 4 38 104 Williamsburg 0 2 0 0 0 0 2 Williamstown 2 3 0 0 0 4 9 Wilmington 1 3 0 0 4 14 22 Winchendon 4 2 0 0 0 5 11 Winchester 10 10 0 2 2 117 141 Winthrop 18 9 0 1 0 38 66 Woburn 27 44 0 8 8 109 196 Worcester 3636 297 4 44 703 1704 6388 Wrentham 2 3 0 0 0 3 8 Northampton-Smith Voc Agr 5 0 0 0 0 0 5 Excel Academy CS 9 0 0 0 0 0 9 Academy Of the Pacific Rim CS 3 1 0 1 0 0 5 Boston Preparatory CS 3 0 0 2 0 0 5 Christa McAuliffe Regional CS 2 0 0 0 0 0 2 Smith Leadership Academy CS 1 0 0 0 0 0 1 Benjamin Banneker CS 5 0 0 16 0 1 22 Barnstable Horace Mann CS 6 16 0 0 0 9 31
56
District Name Spanish Portuguese Cape
Verdean Creole Haitian Vietnamese Other LEP
Barnstable Com Horace Mann CS 17 17 0 0 0 1 35 Edward Brooke CS 3 0 0 0 0 0 3 KIPP Academy Lynn CS 4 0 0 0 0 0 4 Innovation Academy CS 1 0 0 0 0 0 1 Community CS of Cambridge 3 0 0 5 0 2 10 City On A Hill CS 3 0 0 0 0 1 4 Codman Academy CS 1 0 0 0 0 0 1 Conservatory Lab Charter (District) 14 4 0 0 0 3 21 Community Day CS 96 0 0 2 0 0 98 Sabis International CS 17 0 0 0 4 4 25 Neighborhood House CS 3 0 1 1 3 1 9 Abby Kelley Foster CS 12 5 0 0 0 11 28 Foxborough Reg CS 2 0 0 5 0 22 29 Hilltown Cooperative CS 0 0 0 0 0 1 1 EM Kennedy Acad Health Careers HMCS 1 0 1 0 0 0 2 Holyoke Com CS 32 0 0 0 0 0 32 Lawrence Family Development CS 251 0 0 0 0 1 252 Hill View Montessori CS 6 0 0 0 0 1 7 Lowell Community CS 100 19 0 4 3 121 247 Marthas Vineyard CS 0 3 0 0 0 1 4 New Leadership Charter 3 0 0 0 0 1 4 North Central Charter Essential 2 0 0 0 0 1 3 Silver Hill Horace Mann Charter 25 1 0 1 0 4 31 Pioneer Valley Performing Arts CS 1 0 0 0 0 0 1 Boston Renaissance CS 43 1 2 4 1 7 58 Roxbury Preparatory CS 3 0 3 0 0 0 6 Salem Academy CS 13 0 0 0 0 3 16 Seven Hills CS 89 0 0 0 0 21 110 Prospect Hill Academy CS 9 4 0 11 0 5 29 MLK Jr CS of Excellence 19 0 0 1 0 0 20 Phoenix Charter Academy 23 0 0 1 0 1 25
57
District Name Spanish Portuguese Cape
Verdean Creole Haitian Vietnamese Other LEP
Pioneer Charter School of Science 2 3 0 2 0 0 7 Global Learning Charter Public 1 0 0 0 0 0 1 Pioneer Valley Chinese Imm CS 0 0 0 0 0 1 1 Acton-Boxborough 4 6 0 0 0 10 20 Adams-Cheshire 0 0 0 0 0 3 3 Amherst-Pelham 24 3 3 0 1 36 67 Ashburnham-Westminster 8 0 0 2 0 5 15 Athol-Royalston 8 0 0 0 0 7 15 Berkshire Hills 23 0 0 0 0 6 29 Berlin-Boylston 0 0 0 0 0 1 1 Blackstone-Millville 4 1 0 0 0 6 11 Bridgewater-Raynham 2 2 0 2 1 15 22 Central Berkshire 0 0 0 0 0 1 1 Concord-Carlisle 0 0 0 1 0 2 3 Dennis-Yarmouth 34 62 1 13 3 33 146 Dighton-Rehoboth 5 1 0 0 0 2 8 Dover-Sherborn 0 1 0 0 0 2 3 Dudley-Charlton Reg 14 4 0 0 0 32 50 Nauset 5 1 0 0 0 7 13 Freetown-Lakeville 0 1 0 0 0 0 1 Frontier 3 1 0 0 1 4 9 Gateway 1 0 0 0 0 10 11 Groton-Dunstable 6 1 0 0 0 4 11 Gill-Montague 24 0 0 1 0 20 45 Hamilton-Wenham 0 1 0 0 0 42 43 Hampden-Wilbraham 1 0 0 0 2 21 24 Hawlemont 0 1 0 0 0 0 1 King Philip 1 0 0 0 0 1 2 Lincoln-Sudbury 0 0 0 0 0 4 4 Manchester Essex Regional 0 0 0 0 0 3 3 Marthas Vineyard 0 16 0 0 0 0 16
58
District Name Spanish Portuguese Cape
Verdean Creole Haitian Vietnamese Other LEP
0 Masconomet 0 0 0 0 2 2 Mendon-Upton 1 1 0 0 0 8 10 Mount Greylock 0 0 0 0 0 2 2 Mohawk Trail 0 0 0 0 2 5 7 Narragansett 0 0 0 0 0 3 3 Nashoba 7 4 0 1 0 5 17 Northboro-Southboro 1 1 0 1 0 4 7 North Middlesex 11 1 0 0 0 4 16 Old Rochester 0 0 0 0 0 1 1 Pentucket 1 0 0 0 0 2 3 Quabbin 0 0 0 0 0 4 4 Ralph C Mahar 1 0 0 0 0 7 8 Silver Lake 0 0 0 0 0 1 1 Southern Berkshire 4 0 0 0 0 0 4 Southwick-Tolland 0 0 0 0 0 14 14 Spencer-E Brookfield 5 0 0 0 0 2 7 Triton 4 2 0 0 10 8 24 Up-Island Regional 2 1 0 0 0 2 5 Wachusett 3 3 0 0 7 34 47 Quaboag Regional 0 0 0 0 0 1 1 Whitman-Hanson 5 1 0 0 0 3 9 Assabet Valley Reg Voc Tech 8 1 0 0 0 0 9 Blue Hills Regional Vocational Technical 1 2 0 2 0 0 5 Bristol-Plymouth Reg Voc Tech 0 2 0 0 0 0 2 Cape Cod Reg Voc Tech 2 2 0 0 0 1 5 Greater Fall River Reg Voc Tech 1 1 0 0 0 0 2 Greater Lawrence Reg Voc Tech 33 0 0 0 0 1 34 GrNew Bedford Reg Voc Tech 14 6 0 0 0 0 20 Greater Lowell Reg Voc Tech 20 8 0 0 0 18 46 South Middlesex Reg Voc Tech 23 14 0 0 0 3 40 Minuteman Reg Voc Tech 2 0 0 0 0 1 3
59
60
District Name Spanish Portuguese Cape
Verdean Creole Haitian Vietnamese Other LEP
Montachusett Reg Voc Tech 4 0 0 0 0 4 8 Northeast Metro Reg Voc Tech 55 0 0 0 0 2 57 North Shore Reg Voc Tech 3 0 0 0 0 0 3 Southeastern Reg Voc Tech 0 2 3 3 0 1 9 Southern Worcester County Reg Voc Tech 3 0 0 0 0 1 4 Tri County Reg Voc Tech 0 1 0 0 0 0 1 Whittier Reg Voc Tech 6 0 0 0 0 0 6 TOTALS 31793 4209 2458 2433 2423 15842 59158
Source The Department Student Information Management System 2009
- Introduction
-
- Background
-
- I English Language Learners in Massachusetts
- II Educators Implementing Sheltered English Immersion Elementary and Secondary Content Teachers of English Language Learners
-
- Research on Professional Development for Educators of English Language Learners
- Gaps in Knowledge
-
- III Use of Funds for Category Training
-
- Future Need for Category Training
-
- IV Educators Implementing Sheltered English Immersion English as a Second Language (ESL) Teachers
-
- ESL Teacher Shortage
-
- V Use of Funds ESL Teachers and ESL Curriculum Development
-
- Massachusetts English Language Teacher Initiative (MELT)
- Improvement of Sheltered English Immersion Content-based ESL Instruction
- Future Need for ESL teachers
-
- VI Budget
- Attachments
-
- Attachment 1 All Massachusetts public school districts and changes in LEP population compared to changes in overall student population - SY 2006-SY 2010
- Attachment 1 Massachusetts public school districts and changes in LEP population compared to changes in overall student population - SY 2006-SY 2010
- Attachment 2 Massachusetts public school districts with large changes in LEP population compared to changes in overall student population - SY 2006-SY 2010
- Attachment 3 Bibliography Professional Development for Teachers of English Language Learners
- Attachment 4 Excerpts from the Commissionerrsquos Memorandum of June 2004 Guidance on Qualifications for Teachers of Limited English Proficient Students in Sheltered English Immersion Classrooms
- Attachment 5 Districts Receiving Sheltered English Immersion Professional Development 2004-2010
- Attachment 6 Collaboratives that have received grants for Sheltered English Immersion Professional Development 2004-2010
- Attachment 7 English Language Learners in Massachusetts District and Program Type October 2009
- Attachment 8 English Language Learners in Massachusetts District and First Language October 2009
-
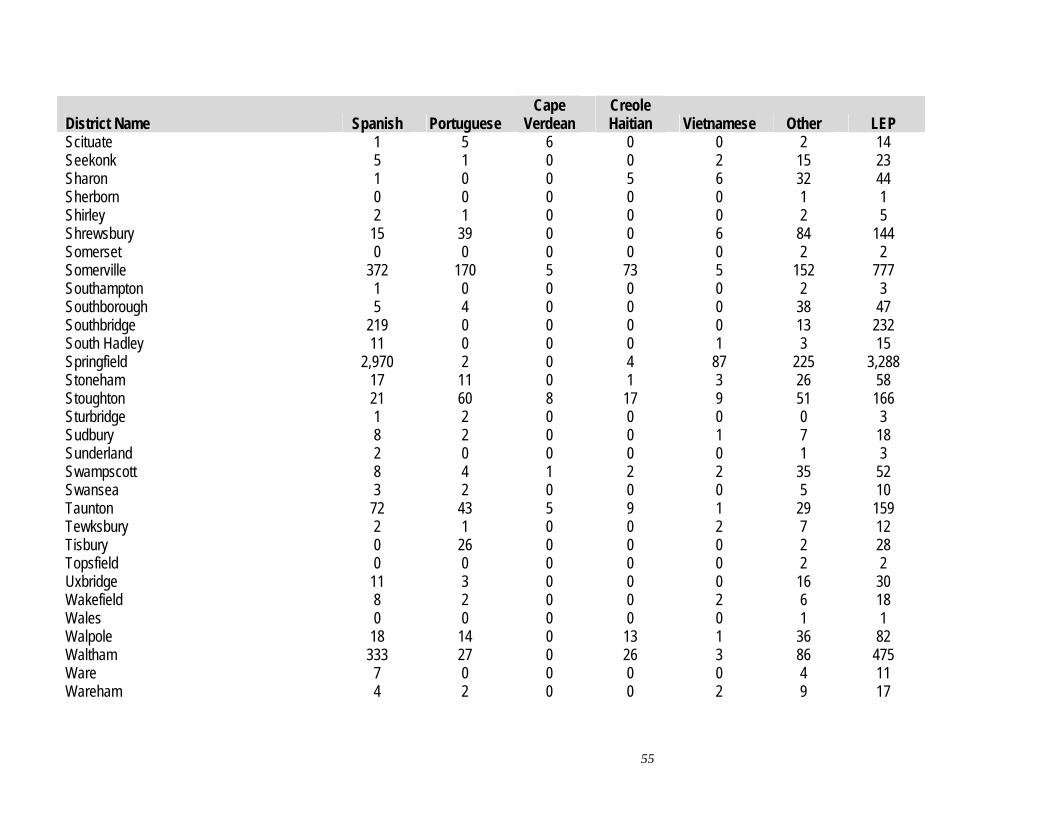
District Name Spanish Portuguese Cape
Verdean Creole Haitian Vietnamese Other LEP
Scituate 1 5 6 0 0 2 14 Seekonk 5 1 0 0 2 15 23 Sharon 1 0 0 5 6 32 44 Sherborn 0 0 0 0 0 1 1 Shirley 2 1 0 0 0 2 5 Shrewsbury 15 39 0 0 6 84 144 Somerset 0 0 0 0 0 2 2 Somerville 372 170 5 73 5 152 777 Southampton 1 0 0 0 0 2 3 Southborough 5 4 0 0 0 38 47 Southbridge 219 0 0 0 0 13 232 South Hadley 11 0 0 0 1 3 15 Springfield 2970 2 0 4 87 225 3288 Stoneham 17 11 0 1 3 26 58 Stoughton 21 60 8 17 9 51 166 Sturbridge 1 2 0 0 0 0 3 Sudbury 8 2 0 0 1 7 18 Sunderland 2 0 0 0 0 1 3 Swampscott 8 4 1 2 2 35 52 Swansea 3 2 0 0 0 5 10 Taunton 72 43 5 9 1 29 159 Tewksbury 2 1 0 0 2 7 12 Tisbury 0 26 0 0 0 2 28 Topsfield 0 0 0 0 0 2 2 Uxbridge 11 3 0 0 0 16 30 Wakefield 8 2 0 0 2 6 18 Wales 0 0 0 0 0 1 1 Walpole 18 14 0 13 1 36 82 Waltham 333 27 0 26 3 86 475 Ware 7 0 0 0 0 4 11 Wareham 4 2 0 0 2 9 17
55
District Name Spanish Portuguese Cape
Verdean Creole Haitian Vietnamese Other LEP
Watertown 52 32 0 2 0 182 268 Wayland 1 0 0 0 0 14 15 Webster 32 4 0 0 1 12 49 Wellesley 16 0 0 0 0 55 71 Westborough 43 38 0 1 0 174 256 West Boylston 0 1 0 0 0 2 3 West Bridgewater 0 0 0 2 0 0 2 Westfield 34 0 0 0 0 177 211 Westford 3 0 0 1 2 27 33 Weston 5 0 1 3 1 41 51 Westport 1 9 0 0 4 1 15 West Springfield 29 2 0 0 3 242 276 Westwood 3 0 0 0 0 28 31 Weymouth 12 49 0 1 4 38 104 Williamsburg 0 2 0 0 0 0 2 Williamstown 2 3 0 0 0 4 9 Wilmington 1 3 0 0 4 14 22 Winchendon 4 2 0 0 0 5 11 Winchester 10 10 0 2 2 117 141 Winthrop 18 9 0 1 0 38 66 Woburn 27 44 0 8 8 109 196 Worcester 3636 297 4 44 703 1704 6388 Wrentham 2 3 0 0 0 3 8 Northampton-Smith Voc Agr 5 0 0 0 0 0 5 Excel Academy CS 9 0 0 0 0 0 9 Academy Of the Pacific Rim CS 3 1 0 1 0 0 5 Boston Preparatory CS 3 0 0 2 0 0 5 Christa McAuliffe Regional CS 2 0 0 0 0 0 2 Smith Leadership Academy CS 1 0 0 0 0 0 1 Benjamin Banneker CS 5 0 0 16 0 1 22 Barnstable Horace Mann CS 6 16 0 0 0 9 31
56
District Name Spanish Portuguese Cape
Verdean Creole Haitian Vietnamese Other LEP
Barnstable Com Horace Mann CS 17 17 0 0 0 1 35 Edward Brooke CS 3 0 0 0 0 0 3 KIPP Academy Lynn CS 4 0 0 0 0 0 4 Innovation Academy CS 1 0 0 0 0 0 1 Community CS of Cambridge 3 0 0 5 0 2 10 City On A Hill CS 3 0 0 0 0 1 4 Codman Academy CS 1 0 0 0 0 0 1 Conservatory Lab Charter (District) 14 4 0 0 0 3 21 Community Day CS 96 0 0 2 0 0 98 Sabis International CS 17 0 0 0 4 4 25 Neighborhood House CS 3 0 1 1 3 1 9 Abby Kelley Foster CS 12 5 0 0 0 11 28 Foxborough Reg CS 2 0 0 5 0 22 29 Hilltown Cooperative CS 0 0 0 0 0 1 1 EM Kennedy Acad Health Careers HMCS 1 0 1 0 0 0 2 Holyoke Com CS 32 0 0 0 0 0 32 Lawrence Family Development CS 251 0 0 0 0 1 252 Hill View Montessori CS 6 0 0 0 0 1 7 Lowell Community CS 100 19 0 4 3 121 247 Marthas Vineyard CS 0 3 0 0 0 1 4 New Leadership Charter 3 0 0 0 0 1 4 North Central Charter Essential 2 0 0 0 0 1 3 Silver Hill Horace Mann Charter 25 1 0 1 0 4 31 Pioneer Valley Performing Arts CS 1 0 0 0 0 0 1 Boston Renaissance CS 43 1 2 4 1 7 58 Roxbury Preparatory CS 3 0 3 0 0 0 6 Salem Academy CS 13 0 0 0 0 3 16 Seven Hills CS 89 0 0 0 0 21 110 Prospect Hill Academy CS 9 4 0 11 0 5 29 MLK Jr CS of Excellence 19 0 0 1 0 0 20 Phoenix Charter Academy 23 0 0 1 0 1 25
57
District Name Spanish Portuguese Cape
Verdean Creole Haitian Vietnamese Other LEP
Pioneer Charter School of Science 2 3 0 2 0 0 7 Global Learning Charter Public 1 0 0 0 0 0 1 Pioneer Valley Chinese Imm CS 0 0 0 0 0 1 1 Acton-Boxborough 4 6 0 0 0 10 20 Adams-Cheshire 0 0 0 0 0 3 3 Amherst-Pelham 24 3 3 0 1 36 67 Ashburnham-Westminster 8 0 0 2 0 5 15 Athol-Royalston 8 0 0 0 0 7 15 Berkshire Hills 23 0 0 0 0 6 29 Berlin-Boylston 0 0 0 0 0 1 1 Blackstone-Millville 4 1 0 0 0 6 11 Bridgewater-Raynham 2 2 0 2 1 15 22 Central Berkshire 0 0 0 0 0 1 1 Concord-Carlisle 0 0 0 1 0 2 3 Dennis-Yarmouth 34 62 1 13 3 33 146 Dighton-Rehoboth 5 1 0 0 0 2 8 Dover-Sherborn 0 1 0 0 0 2 3 Dudley-Charlton Reg 14 4 0 0 0 32 50 Nauset 5 1 0 0 0 7 13 Freetown-Lakeville 0 1 0 0 0 0 1 Frontier 3 1 0 0 1 4 9 Gateway 1 0 0 0 0 10 11 Groton-Dunstable 6 1 0 0 0 4 11 Gill-Montague 24 0 0 1 0 20 45 Hamilton-Wenham 0 1 0 0 0 42 43 Hampden-Wilbraham 1 0 0 0 2 21 24 Hawlemont 0 1 0 0 0 0 1 King Philip 1 0 0 0 0 1 2 Lincoln-Sudbury 0 0 0 0 0 4 4 Manchester Essex Regional 0 0 0 0 0 3 3 Marthas Vineyard 0 16 0 0 0 0 16
58
District Name Spanish Portuguese Cape
Verdean Creole Haitian Vietnamese Other LEP
0 Masconomet 0 0 0 0 2 2 Mendon-Upton 1 1 0 0 0 8 10 Mount Greylock 0 0 0 0 0 2 2 Mohawk Trail 0 0 0 0 2 5 7 Narragansett 0 0 0 0 0 3 3 Nashoba 7 4 0 1 0 5 17 Northboro-Southboro 1 1 0 1 0 4 7 North Middlesex 11 1 0 0 0 4 16 Old Rochester 0 0 0 0 0 1 1 Pentucket 1 0 0 0 0 2 3 Quabbin 0 0 0 0 0 4 4 Ralph C Mahar 1 0 0 0 0 7 8 Silver Lake 0 0 0 0 0 1 1 Southern Berkshire 4 0 0 0 0 0 4 Southwick-Tolland 0 0 0 0 0 14 14 Spencer-E Brookfield 5 0 0 0 0 2 7 Triton 4 2 0 0 10 8 24 Up-Island Regional 2 1 0 0 0 2 5 Wachusett 3 3 0 0 7 34 47 Quaboag Regional 0 0 0 0 0 1 1 Whitman-Hanson 5 1 0 0 0 3 9 Assabet Valley Reg Voc Tech 8 1 0 0 0 0 9 Blue Hills Regional Vocational Technical 1 2 0 2 0 0 5 Bristol-Plymouth Reg Voc Tech 0 2 0 0 0 0 2 Cape Cod Reg Voc Tech 2 2 0 0 0 1 5 Greater Fall River Reg Voc Tech 1 1 0 0 0 0 2 Greater Lawrence Reg Voc Tech 33 0 0 0 0 1 34 GrNew Bedford Reg Voc Tech 14 6 0 0 0 0 20 Greater Lowell Reg Voc Tech 20 8 0 0 0 18 46 South Middlesex Reg Voc Tech 23 14 0 0 0 3 40 Minuteman Reg Voc Tech 2 0 0 0 0 1 3
59
60
District Name Spanish Portuguese Cape
Verdean Creole Haitian Vietnamese Other LEP
Montachusett Reg Voc Tech 4 0 0 0 0 4 8 Northeast Metro Reg Voc Tech 55 0 0 0 0 2 57 North Shore Reg Voc Tech 3 0 0 0 0 0 3 Southeastern Reg Voc Tech 0 2 3 3 0 1 9 Southern Worcester County Reg Voc Tech 3 0 0 0 0 1 4 Tri County Reg Voc Tech 0 1 0 0 0 0 1 Whittier Reg Voc Tech 6 0 0 0 0 0 6 TOTALS 31793 4209 2458 2433 2423 15842 59158
Source The Department Student Information Management System 2009
- Introduction
-
- Background
-
- I English Language Learners in Massachusetts
- II Educators Implementing Sheltered English Immersion Elementary and Secondary Content Teachers of English Language Learners
-
- Research on Professional Development for Educators of English Language Learners
- Gaps in Knowledge
-
- III Use of Funds for Category Training
-
- Future Need for Category Training
-
- IV Educators Implementing Sheltered English Immersion English as a Second Language (ESL) Teachers
-
- ESL Teacher Shortage
-
- V Use of Funds ESL Teachers and ESL Curriculum Development
-
- Massachusetts English Language Teacher Initiative (MELT)
- Improvement of Sheltered English Immersion Content-based ESL Instruction
- Future Need for ESL teachers
-
- VI Budget
- Attachments
-
- Attachment 1 All Massachusetts public school districts and changes in LEP population compared to changes in overall student population - SY 2006-SY 2010
- Attachment 1 Massachusetts public school districts and changes in LEP population compared to changes in overall student population - SY 2006-SY 2010
- Attachment 2 Massachusetts public school districts with large changes in LEP population compared to changes in overall student population - SY 2006-SY 2010
- Attachment 3 Bibliography Professional Development for Teachers of English Language Learners
- Attachment 4 Excerpts from the Commissionerrsquos Memorandum of June 2004 Guidance on Qualifications for Teachers of Limited English Proficient Students in Sheltered English Immersion Classrooms
- Attachment 5 Districts Receiving Sheltered English Immersion Professional Development 2004-2010
- Attachment 6 Collaboratives that have received grants for Sheltered English Immersion Professional Development 2004-2010
- Attachment 7 English Language Learners in Massachusetts District and Program Type October 2009
- Attachment 8 English Language Learners in Massachusetts District and First Language October 2009
-
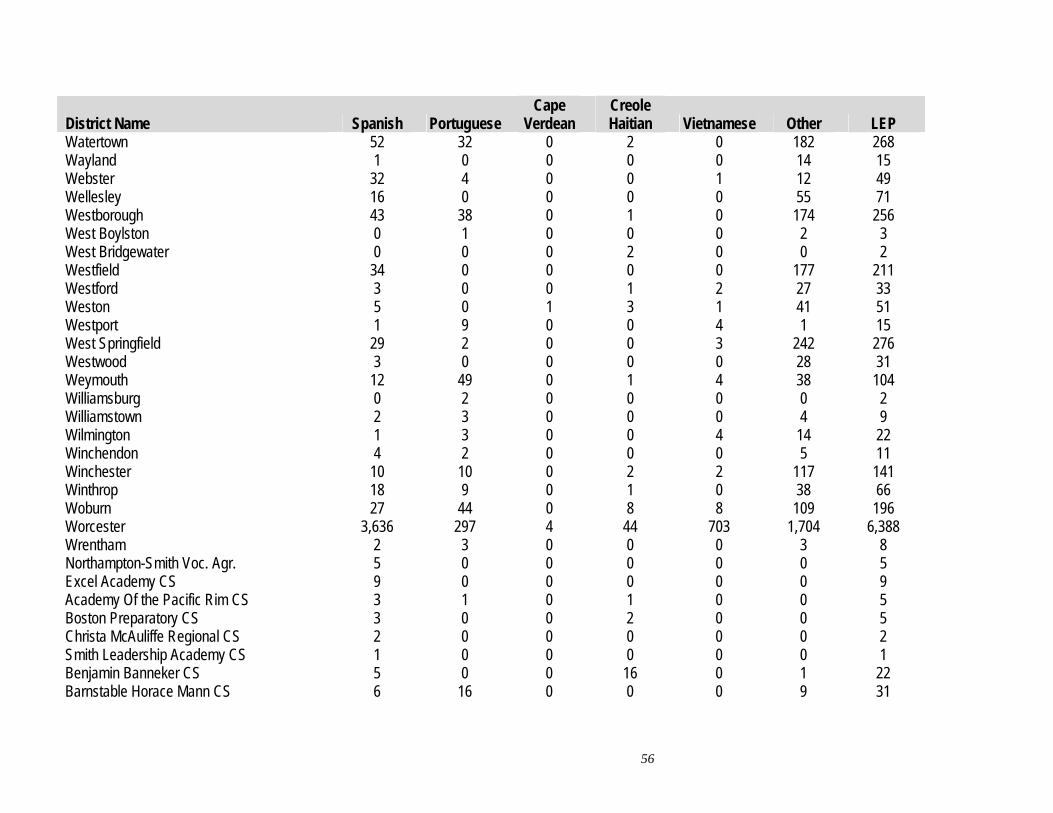
District Name Spanish Portuguese Cape
Verdean Creole Haitian Vietnamese Other LEP
Watertown 52 32 0 2 0 182 268 Wayland 1 0 0 0 0 14 15 Webster 32 4 0 0 1 12 49 Wellesley 16 0 0 0 0 55 71 Westborough 43 38 0 1 0 174 256 West Boylston 0 1 0 0 0 2 3 West Bridgewater 0 0 0 2 0 0 2 Westfield 34 0 0 0 0 177 211 Westford 3 0 0 1 2 27 33 Weston 5 0 1 3 1 41 51 Westport 1 9 0 0 4 1 15 West Springfield 29 2 0 0 3 242 276 Westwood 3 0 0 0 0 28 31 Weymouth 12 49 0 1 4 38 104 Williamsburg 0 2 0 0 0 0 2 Williamstown 2 3 0 0 0 4 9 Wilmington 1 3 0 0 4 14 22 Winchendon 4 2 0 0 0 5 11 Winchester 10 10 0 2 2 117 141 Winthrop 18 9 0 1 0 38 66 Woburn 27 44 0 8 8 109 196 Worcester 3636 297 4 44 703 1704 6388 Wrentham 2 3 0 0 0 3 8 Northampton-Smith Voc Agr 5 0 0 0 0 0 5 Excel Academy CS 9 0 0 0 0 0 9 Academy Of the Pacific Rim CS 3 1 0 1 0 0 5 Boston Preparatory CS 3 0 0 2 0 0 5 Christa McAuliffe Regional CS 2 0 0 0 0 0 2 Smith Leadership Academy CS 1 0 0 0 0 0 1 Benjamin Banneker CS 5 0 0 16 0 1 22 Barnstable Horace Mann CS 6 16 0 0 0 9 31
56
District Name Spanish Portuguese Cape
Verdean Creole Haitian Vietnamese Other LEP
Barnstable Com Horace Mann CS 17 17 0 0 0 1 35 Edward Brooke CS 3 0 0 0 0 0 3 KIPP Academy Lynn CS 4 0 0 0 0 0 4 Innovation Academy CS 1 0 0 0 0 0 1 Community CS of Cambridge 3 0 0 5 0 2 10 City On A Hill CS 3 0 0 0 0 1 4 Codman Academy CS 1 0 0 0 0 0 1 Conservatory Lab Charter (District) 14 4 0 0 0 3 21 Community Day CS 96 0 0 2 0 0 98 Sabis International CS 17 0 0 0 4 4 25 Neighborhood House CS 3 0 1 1 3 1 9 Abby Kelley Foster CS 12 5 0 0 0 11 28 Foxborough Reg CS 2 0 0 5 0 22 29 Hilltown Cooperative CS 0 0 0 0 0 1 1 EM Kennedy Acad Health Careers HMCS 1 0 1 0 0 0 2 Holyoke Com CS 32 0 0 0 0 0 32 Lawrence Family Development CS 251 0 0 0 0 1 252 Hill View Montessori CS 6 0 0 0 0 1 7 Lowell Community CS 100 19 0 4 3 121 247 Marthas Vineyard CS 0 3 0 0 0 1 4 New Leadership Charter 3 0 0 0 0 1 4 North Central Charter Essential 2 0 0 0 0 1 3 Silver Hill Horace Mann Charter 25 1 0 1 0 4 31 Pioneer Valley Performing Arts CS 1 0 0 0 0 0 1 Boston Renaissance CS 43 1 2 4 1 7 58 Roxbury Preparatory CS 3 0 3 0 0 0 6 Salem Academy CS 13 0 0 0 0 3 16 Seven Hills CS 89 0 0 0 0 21 110 Prospect Hill Academy CS 9 4 0 11 0 5 29 MLK Jr CS of Excellence 19 0 0 1 0 0 20 Phoenix Charter Academy 23 0 0 1 0 1 25
57
District Name Spanish Portuguese Cape
Verdean Creole Haitian Vietnamese Other LEP
Pioneer Charter School of Science 2 3 0 2 0 0 7 Global Learning Charter Public 1 0 0 0 0 0 1 Pioneer Valley Chinese Imm CS 0 0 0 0 0 1 1 Acton-Boxborough 4 6 0 0 0 10 20 Adams-Cheshire 0 0 0 0 0 3 3 Amherst-Pelham 24 3 3 0 1 36 67 Ashburnham-Westminster 8 0 0 2 0 5 15 Athol-Royalston 8 0 0 0 0 7 15 Berkshire Hills 23 0 0 0 0 6 29 Berlin-Boylston 0 0 0 0 0 1 1 Blackstone-Millville 4 1 0 0 0 6 11 Bridgewater-Raynham 2 2 0 2 1 15 22 Central Berkshire 0 0 0 0 0 1 1 Concord-Carlisle 0 0 0 1 0 2 3 Dennis-Yarmouth 34 62 1 13 3 33 146 Dighton-Rehoboth 5 1 0 0 0 2 8 Dover-Sherborn 0 1 0 0 0 2 3 Dudley-Charlton Reg 14 4 0 0 0 32 50 Nauset 5 1 0 0 0 7 13 Freetown-Lakeville 0 1 0 0 0 0 1 Frontier 3 1 0 0 1 4 9 Gateway 1 0 0 0 0 10 11 Groton-Dunstable 6 1 0 0 0 4 11 Gill-Montague 24 0 0 1 0 20 45 Hamilton-Wenham 0 1 0 0 0 42 43 Hampden-Wilbraham 1 0 0 0 2 21 24 Hawlemont 0 1 0 0 0 0 1 King Philip 1 0 0 0 0 1 2 Lincoln-Sudbury 0 0 0 0 0 4 4 Manchester Essex Regional 0 0 0 0 0 3 3 Marthas Vineyard 0 16 0 0 0 0 16
58
District Name Spanish Portuguese Cape
Verdean Creole Haitian Vietnamese Other LEP
0 Masconomet 0 0 0 0 2 2 Mendon-Upton 1 1 0 0 0 8 10 Mount Greylock 0 0 0 0 0 2 2 Mohawk Trail 0 0 0 0 2 5 7 Narragansett 0 0 0 0 0 3 3 Nashoba 7 4 0 1 0 5 17 Northboro-Southboro 1 1 0 1 0 4 7 North Middlesex 11 1 0 0 0 4 16 Old Rochester 0 0 0 0 0 1 1 Pentucket 1 0 0 0 0 2 3 Quabbin 0 0 0 0 0 4 4 Ralph C Mahar 1 0 0 0 0 7 8 Silver Lake 0 0 0 0 0 1 1 Southern Berkshire 4 0 0 0 0 0 4 Southwick-Tolland 0 0 0 0 0 14 14 Spencer-E Brookfield 5 0 0 0 0 2 7 Triton 4 2 0 0 10 8 24 Up-Island Regional 2 1 0 0 0 2 5 Wachusett 3 3 0 0 7 34 47 Quaboag Regional 0 0 0 0 0 1 1 Whitman-Hanson 5 1 0 0 0 3 9 Assabet Valley Reg Voc Tech 8 1 0 0 0 0 9 Blue Hills Regional Vocational Technical 1 2 0 2 0 0 5 Bristol-Plymouth Reg Voc Tech 0 2 0 0 0 0 2 Cape Cod Reg Voc Tech 2 2 0 0 0 1 5 Greater Fall River Reg Voc Tech 1 1 0 0 0 0 2 Greater Lawrence Reg Voc Tech 33 0 0 0 0 1 34 GrNew Bedford Reg Voc Tech 14 6 0 0 0 0 20 Greater Lowell Reg Voc Tech 20 8 0 0 0 18 46 South Middlesex Reg Voc Tech 23 14 0 0 0 3 40 Minuteman Reg Voc Tech 2 0 0 0 0 1 3
59
60
District Name Spanish Portuguese Cape
Verdean Creole Haitian Vietnamese Other LEP
Montachusett Reg Voc Tech 4 0 0 0 0 4 8 Northeast Metro Reg Voc Tech 55 0 0 0 0 2 57 North Shore Reg Voc Tech 3 0 0 0 0 0 3 Southeastern Reg Voc Tech 0 2 3 3 0 1 9 Southern Worcester County Reg Voc Tech 3 0 0 0 0 1 4 Tri County Reg Voc Tech 0 1 0 0 0 0 1 Whittier Reg Voc Tech 6 0 0 0 0 0 6 TOTALS 31793 4209 2458 2433 2423 15842 59158
Source The Department Student Information Management System 2009
- Introduction
-
- Background
-
- I English Language Learners in Massachusetts
- II Educators Implementing Sheltered English Immersion Elementary and Secondary Content Teachers of English Language Learners
-
- Research on Professional Development for Educators of English Language Learners
- Gaps in Knowledge
-
- III Use of Funds for Category Training
-
- Future Need for Category Training
-
- IV Educators Implementing Sheltered English Immersion English as a Second Language (ESL) Teachers
-
- ESL Teacher Shortage
-
- V Use of Funds ESL Teachers and ESL Curriculum Development
-
- Massachusetts English Language Teacher Initiative (MELT)
- Improvement of Sheltered English Immersion Content-based ESL Instruction
- Future Need for ESL teachers
-
- VI Budget
- Attachments
-
- Attachment 1 All Massachusetts public school districts and changes in LEP population compared to changes in overall student population - SY 2006-SY 2010
- Attachment 1 Massachusetts public school districts and changes in LEP population compared to changes in overall student population - SY 2006-SY 2010
- Attachment 2 Massachusetts public school districts with large changes in LEP population compared to changes in overall student population - SY 2006-SY 2010
- Attachment 3 Bibliography Professional Development for Teachers of English Language Learners
- Attachment 4 Excerpts from the Commissionerrsquos Memorandum of June 2004 Guidance on Qualifications for Teachers of Limited English Proficient Students in Sheltered English Immersion Classrooms
- Attachment 5 Districts Receiving Sheltered English Immersion Professional Development 2004-2010
- Attachment 6 Collaboratives that have received grants for Sheltered English Immersion Professional Development 2004-2010
- Attachment 7 English Language Learners in Massachusetts District and Program Type October 2009
- Attachment 8 English Language Learners in Massachusetts District and First Language October 2009
-
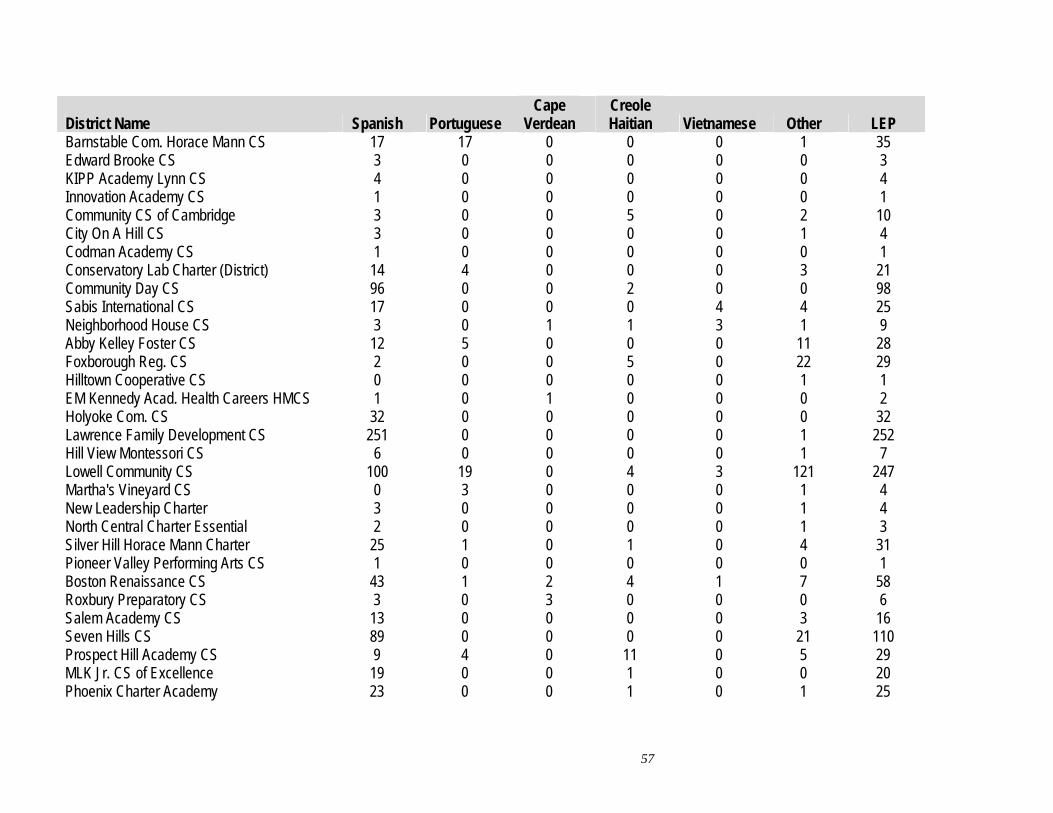
District Name Spanish Portuguese Cape
Verdean Creole Haitian Vietnamese Other LEP
Barnstable Com Horace Mann CS 17 17 0 0 0 1 35 Edward Brooke CS 3 0 0 0 0 0 3 KIPP Academy Lynn CS 4 0 0 0 0 0 4 Innovation Academy CS 1 0 0 0 0 0 1 Community CS of Cambridge 3 0 0 5 0 2 10 City On A Hill CS 3 0 0 0 0 1 4 Codman Academy CS 1 0 0 0 0 0 1 Conservatory Lab Charter (District) 14 4 0 0 0 3 21 Community Day CS 96 0 0 2 0 0 98 Sabis International CS 17 0 0 0 4 4 25 Neighborhood House CS 3 0 1 1 3 1 9 Abby Kelley Foster CS 12 5 0 0 0 11 28 Foxborough Reg CS 2 0 0 5 0 22 29 Hilltown Cooperative CS 0 0 0 0 0 1 1 EM Kennedy Acad Health Careers HMCS 1 0 1 0 0 0 2 Holyoke Com CS 32 0 0 0 0 0 32 Lawrence Family Development CS 251 0 0 0 0 1 252 Hill View Montessori CS 6 0 0 0 0 1 7 Lowell Community CS 100 19 0 4 3 121 247 Marthas Vineyard CS 0 3 0 0 0 1 4 New Leadership Charter 3 0 0 0 0 1 4 North Central Charter Essential 2 0 0 0 0 1 3 Silver Hill Horace Mann Charter 25 1 0 1 0 4 31 Pioneer Valley Performing Arts CS 1 0 0 0 0 0 1 Boston Renaissance CS 43 1 2 4 1 7 58 Roxbury Preparatory CS 3 0 3 0 0 0 6 Salem Academy CS 13 0 0 0 0 3 16 Seven Hills CS 89 0 0 0 0 21 110 Prospect Hill Academy CS 9 4 0 11 0 5 29 MLK Jr CS of Excellence 19 0 0 1 0 0 20 Phoenix Charter Academy 23 0 0 1 0 1 25
57
District Name Spanish Portuguese Cape
Verdean Creole Haitian Vietnamese Other LEP
Pioneer Charter School of Science 2 3 0 2 0 0 7 Global Learning Charter Public 1 0 0 0 0 0 1 Pioneer Valley Chinese Imm CS 0 0 0 0 0 1 1 Acton-Boxborough 4 6 0 0 0 10 20 Adams-Cheshire 0 0 0 0 0 3 3 Amherst-Pelham 24 3 3 0 1 36 67 Ashburnham-Westminster 8 0 0 2 0 5 15 Athol-Royalston 8 0 0 0 0 7 15 Berkshire Hills 23 0 0 0 0 6 29 Berlin-Boylston 0 0 0 0 0 1 1 Blackstone-Millville 4 1 0 0 0 6 11 Bridgewater-Raynham 2 2 0 2 1 15 22 Central Berkshire 0 0 0 0 0 1 1 Concord-Carlisle 0 0 0 1 0 2 3 Dennis-Yarmouth 34 62 1 13 3 33 146 Dighton-Rehoboth 5 1 0 0 0 2 8 Dover-Sherborn 0 1 0 0 0 2 3 Dudley-Charlton Reg 14 4 0 0 0 32 50 Nauset 5 1 0 0 0 7 13 Freetown-Lakeville 0 1 0 0 0 0 1 Frontier 3 1 0 0 1 4 9 Gateway 1 0 0 0 0 10 11 Groton-Dunstable 6 1 0 0 0 4 11 Gill-Montague 24 0 0 1 0 20 45 Hamilton-Wenham 0 1 0 0 0 42 43 Hampden-Wilbraham 1 0 0 0 2 21 24 Hawlemont 0 1 0 0 0 0 1 King Philip 1 0 0 0 0 1 2 Lincoln-Sudbury 0 0 0 0 0 4 4 Manchester Essex Regional 0 0 0 0 0 3 3 Marthas Vineyard 0 16 0 0 0 0 16
58
District Name Spanish Portuguese Cape
Verdean Creole Haitian Vietnamese Other LEP
0 Masconomet 0 0 0 0 2 2 Mendon-Upton 1 1 0 0 0 8 10 Mount Greylock 0 0 0 0 0 2 2 Mohawk Trail 0 0 0 0 2 5 7 Narragansett 0 0 0 0 0 3 3 Nashoba 7 4 0 1 0 5 17 Northboro-Southboro 1 1 0 1 0 4 7 North Middlesex 11 1 0 0 0 4 16 Old Rochester 0 0 0 0 0 1 1 Pentucket 1 0 0 0 0 2 3 Quabbin 0 0 0 0 0 4 4 Ralph C Mahar 1 0 0 0 0 7 8 Silver Lake 0 0 0 0 0 1 1 Southern Berkshire 4 0 0 0 0 0 4 Southwick-Tolland 0 0 0 0 0 14 14 Spencer-E Brookfield 5 0 0 0 0 2 7 Triton 4 2 0 0 10 8 24 Up-Island Regional 2 1 0 0 0 2 5 Wachusett 3 3 0 0 7 34 47 Quaboag Regional 0 0 0 0 0 1 1 Whitman-Hanson 5 1 0 0 0 3 9 Assabet Valley Reg Voc Tech 8 1 0 0 0 0 9 Blue Hills Regional Vocational Technical 1 2 0 2 0 0 5 Bristol-Plymouth Reg Voc Tech 0 2 0 0 0 0 2 Cape Cod Reg Voc Tech 2 2 0 0 0 1 5 Greater Fall River Reg Voc Tech 1 1 0 0 0 0 2 Greater Lawrence Reg Voc Tech 33 0 0 0 0 1 34 GrNew Bedford Reg Voc Tech 14 6 0 0 0 0 20 Greater Lowell Reg Voc Tech 20 8 0 0 0 18 46 South Middlesex Reg Voc Tech 23 14 0 0 0 3 40 Minuteman Reg Voc Tech 2 0 0 0 0 1 3
59
60
District Name Spanish Portuguese Cape
Verdean Creole Haitian Vietnamese Other LEP
Montachusett Reg Voc Tech 4 0 0 0 0 4 8 Northeast Metro Reg Voc Tech 55 0 0 0 0 2 57 North Shore Reg Voc Tech 3 0 0 0 0 0 3 Southeastern Reg Voc Tech 0 2 3 3 0 1 9 Southern Worcester County Reg Voc Tech 3 0 0 0 0 1 4 Tri County Reg Voc Tech 0 1 0 0 0 0 1 Whittier Reg Voc Tech 6 0 0 0 0 0 6 TOTALS 31793 4209 2458 2433 2423 15842 59158
Source The Department Student Information Management System 2009
- Introduction
-
- Background
-
- I English Language Learners in Massachusetts
- II Educators Implementing Sheltered English Immersion Elementary and Secondary Content Teachers of English Language Learners
-
- Research on Professional Development for Educators of English Language Learners
- Gaps in Knowledge
-
- III Use of Funds for Category Training
-
- Future Need for Category Training
-
- IV Educators Implementing Sheltered English Immersion English as a Second Language (ESL) Teachers
-
- ESL Teacher Shortage
-
- V Use of Funds ESL Teachers and ESL Curriculum Development
-
- Massachusetts English Language Teacher Initiative (MELT)
- Improvement of Sheltered English Immersion Content-based ESL Instruction
- Future Need for ESL teachers
-
- VI Budget
- Attachments
-
- Attachment 1 All Massachusetts public school districts and changes in LEP population compared to changes in overall student population - SY 2006-SY 2010
- Attachment 1 Massachusetts public school districts and changes in LEP population compared to changes in overall student population - SY 2006-SY 2010
- Attachment 2 Massachusetts public school districts with large changes in LEP population compared to changes in overall student population - SY 2006-SY 2010
- Attachment 3 Bibliography Professional Development for Teachers of English Language Learners
- Attachment 4 Excerpts from the Commissionerrsquos Memorandum of June 2004 Guidance on Qualifications for Teachers of Limited English Proficient Students in Sheltered English Immersion Classrooms
- Attachment 5 Districts Receiving Sheltered English Immersion Professional Development 2004-2010
- Attachment 6 Collaboratives that have received grants for Sheltered English Immersion Professional Development 2004-2010
- Attachment 7 English Language Learners in Massachusetts District and Program Type October 2009
- Attachment 8 English Language Learners in Massachusetts District and First Language October 2009
-
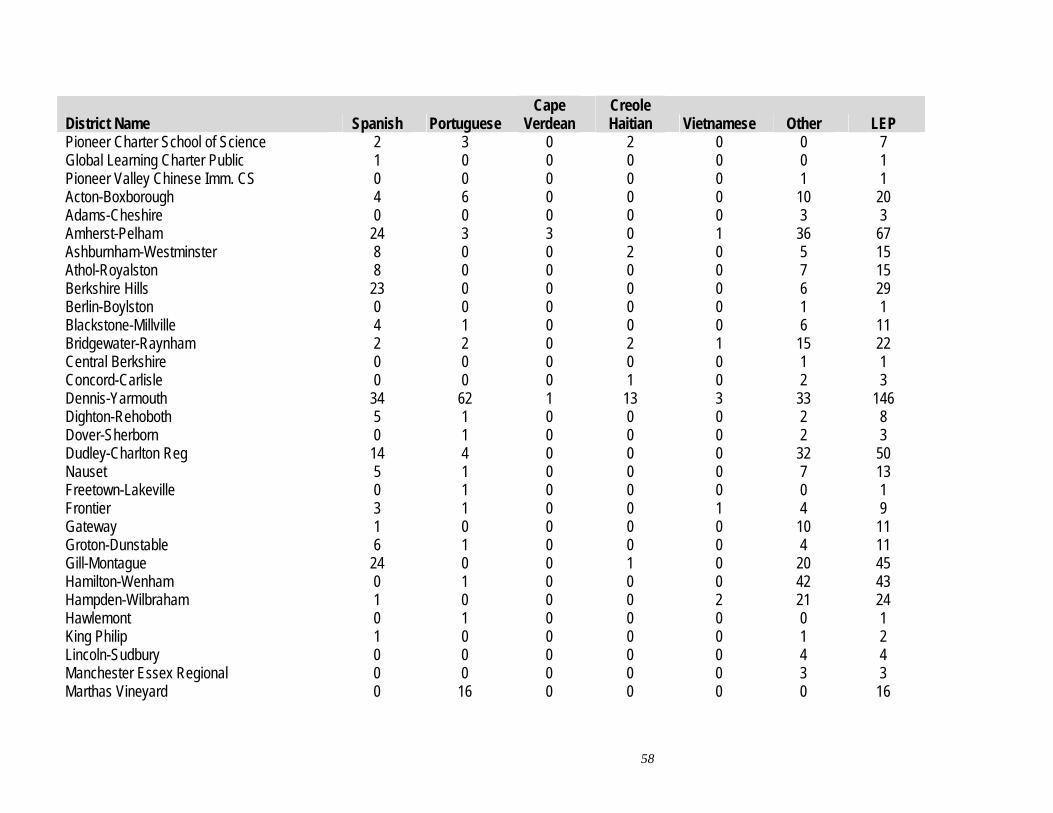
District Name Spanish Portuguese Cape
Verdean Creole Haitian Vietnamese Other LEP
Pioneer Charter School of Science 2 3 0 2 0 0 7 Global Learning Charter Public 1 0 0 0 0 0 1 Pioneer Valley Chinese Imm CS 0 0 0 0 0 1 1 Acton-Boxborough 4 6 0 0 0 10 20 Adams-Cheshire 0 0 0 0 0 3 3 Amherst-Pelham 24 3 3 0 1 36 67 Ashburnham-Westminster 8 0 0 2 0 5 15 Athol-Royalston 8 0 0 0 0 7 15 Berkshire Hills 23 0 0 0 0 6 29 Berlin-Boylston 0 0 0 0 0 1 1 Blackstone-Millville 4 1 0 0 0 6 11 Bridgewater-Raynham 2 2 0 2 1 15 22 Central Berkshire 0 0 0 0 0 1 1 Concord-Carlisle 0 0 0 1 0 2 3 Dennis-Yarmouth 34 62 1 13 3 33 146 Dighton-Rehoboth 5 1 0 0 0 2 8 Dover-Sherborn 0 1 0 0 0 2 3 Dudley-Charlton Reg 14 4 0 0 0 32 50 Nauset 5 1 0 0 0 7 13 Freetown-Lakeville 0 1 0 0 0 0 1 Frontier 3 1 0 0 1 4 9 Gateway 1 0 0 0 0 10 11 Groton-Dunstable 6 1 0 0 0 4 11 Gill-Montague 24 0 0 1 0 20 45 Hamilton-Wenham 0 1 0 0 0 42 43 Hampden-Wilbraham 1 0 0 0 2 21 24 Hawlemont 0 1 0 0 0 0 1 King Philip 1 0 0 0 0 1 2 Lincoln-Sudbury 0 0 0 0 0 4 4 Manchester Essex Regional 0 0 0 0 0 3 3 Marthas Vineyard 0 16 0 0 0 0 16
58
District Name Spanish Portuguese Cape
Verdean Creole Haitian Vietnamese Other LEP
0 Masconomet 0 0 0 0 2 2 Mendon-Upton 1 1 0 0 0 8 10 Mount Greylock 0 0 0 0 0 2 2 Mohawk Trail 0 0 0 0 2 5 7 Narragansett 0 0 0 0 0 3 3 Nashoba 7 4 0 1 0 5 17 Northboro-Southboro 1 1 0 1 0 4 7 North Middlesex 11 1 0 0 0 4 16 Old Rochester 0 0 0 0 0 1 1 Pentucket 1 0 0 0 0 2 3 Quabbin 0 0 0 0 0 4 4 Ralph C Mahar 1 0 0 0 0 7 8 Silver Lake 0 0 0 0 0 1 1 Southern Berkshire 4 0 0 0 0 0 4 Southwick-Tolland 0 0 0 0 0 14 14 Spencer-E Brookfield 5 0 0 0 0 2 7 Triton 4 2 0 0 10 8 24 Up-Island Regional 2 1 0 0 0 2 5 Wachusett 3 3 0 0 7 34 47 Quaboag Regional 0 0 0 0 0 1 1 Whitman-Hanson 5 1 0 0 0 3 9 Assabet Valley Reg Voc Tech 8 1 0 0 0 0 9 Blue Hills Regional Vocational Technical 1 2 0 2 0 0 5 Bristol-Plymouth Reg Voc Tech 0 2 0 0 0 0 2 Cape Cod Reg Voc Tech 2 2 0 0 0 1 5 Greater Fall River Reg Voc Tech 1 1 0 0 0 0 2 Greater Lawrence Reg Voc Tech 33 0 0 0 0 1 34 GrNew Bedford Reg Voc Tech 14 6 0 0 0 0 20 Greater Lowell Reg Voc Tech 20 8 0 0 0 18 46 South Middlesex Reg Voc Tech 23 14 0 0 0 3 40 Minuteman Reg Voc Tech 2 0 0 0 0 1 3
59
60
District Name Spanish Portuguese Cape
Verdean Creole Haitian Vietnamese Other LEP
Montachusett Reg Voc Tech 4 0 0 0 0 4 8 Northeast Metro Reg Voc Tech 55 0 0 0 0 2 57 North Shore Reg Voc Tech 3 0 0 0 0 0 3 Southeastern Reg Voc Tech 0 2 3 3 0 1 9 Southern Worcester County Reg Voc Tech 3 0 0 0 0 1 4 Tri County Reg Voc Tech 0 1 0 0 0 0 1 Whittier Reg Voc Tech 6 0 0 0 0 0 6 TOTALS 31793 4209 2458 2433 2423 15842 59158
Source The Department Student Information Management System 2009
- Introduction
-
- Background
-
- I English Language Learners in Massachusetts
- II Educators Implementing Sheltered English Immersion Elementary and Secondary Content Teachers of English Language Learners
-
- Research on Professional Development for Educators of English Language Learners
- Gaps in Knowledge
-
- III Use of Funds for Category Training
-
- Future Need for Category Training
-
- IV Educators Implementing Sheltered English Immersion English as a Second Language (ESL) Teachers
-
- ESL Teacher Shortage
-
- V Use of Funds ESL Teachers and ESL Curriculum Development
-
- Massachusetts English Language Teacher Initiative (MELT)
- Improvement of Sheltered English Immersion Content-based ESL Instruction
- Future Need for ESL teachers
-
- VI Budget
- Attachments
-
- Attachment 1 All Massachusetts public school districts and changes in LEP population compared to changes in overall student population - SY 2006-SY 2010
- Attachment 1 Massachusetts public school districts and changes in LEP population compared to changes in overall student population - SY 2006-SY 2010
- Attachment 2 Massachusetts public school districts with large changes in LEP population compared to changes in overall student population - SY 2006-SY 2010
- Attachment 3 Bibliography Professional Development for Teachers of English Language Learners
- Attachment 4 Excerpts from the Commissionerrsquos Memorandum of June 2004 Guidance on Qualifications for Teachers of Limited English Proficient Students in Sheltered English Immersion Classrooms
- Attachment 5 Districts Receiving Sheltered English Immersion Professional Development 2004-2010
- Attachment 6 Collaboratives that have received grants for Sheltered English Immersion Professional Development 2004-2010
- Attachment 7 English Language Learners in Massachusetts District and Program Type October 2009
- Attachment 8 English Language Learners in Massachusetts District and First Language October 2009
-
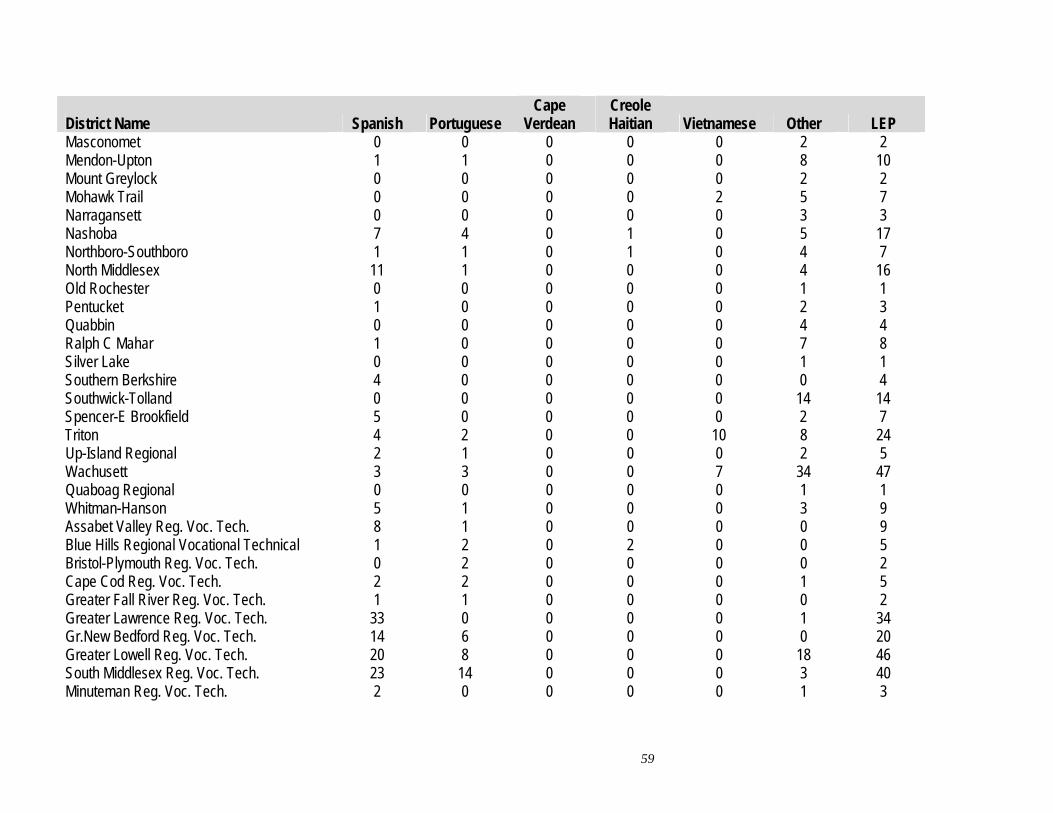
District Name Spanish Portuguese Cape
Verdean Creole Haitian Vietnamese Other LEP
0 Masconomet 0 0 0 0 2 2 Mendon-Upton 1 1 0 0 0 8 10 Mount Greylock 0 0 0 0 0 2 2 Mohawk Trail 0 0 0 0 2 5 7 Narragansett 0 0 0 0 0 3 3 Nashoba 7 4 0 1 0 5 17 Northboro-Southboro 1 1 0 1 0 4 7 North Middlesex 11 1 0 0 0 4 16 Old Rochester 0 0 0 0 0 1 1 Pentucket 1 0 0 0 0 2 3 Quabbin 0 0 0 0 0 4 4 Ralph C Mahar 1 0 0 0 0 7 8 Silver Lake 0 0 0 0 0 1 1 Southern Berkshire 4 0 0 0 0 0 4 Southwick-Tolland 0 0 0 0 0 14 14 Spencer-E Brookfield 5 0 0 0 0 2 7 Triton 4 2 0 0 10 8 24 Up-Island Regional 2 1 0 0 0 2 5 Wachusett 3 3 0 0 7 34 47 Quaboag Regional 0 0 0 0 0 1 1 Whitman-Hanson 5 1 0 0 0 3 9 Assabet Valley Reg Voc Tech 8 1 0 0 0 0 9 Blue Hills Regional Vocational Technical 1 2 0 2 0 0 5 Bristol-Plymouth Reg Voc Tech 0 2 0 0 0 0 2 Cape Cod Reg Voc Tech 2 2 0 0 0 1 5 Greater Fall River Reg Voc Tech 1 1 0 0 0 0 2 Greater Lawrence Reg Voc Tech 33 0 0 0 0 1 34 GrNew Bedford Reg Voc Tech 14 6 0 0 0 0 20 Greater Lowell Reg Voc Tech 20 8 0 0 0 18 46 South Middlesex Reg Voc Tech 23 14 0 0 0 3 40 Minuteman Reg Voc Tech 2 0 0 0 0 1 3
59
60
District Name Spanish Portuguese Cape
Verdean Creole Haitian Vietnamese Other LEP
Montachusett Reg Voc Tech 4 0 0 0 0 4 8 Northeast Metro Reg Voc Tech 55 0 0 0 0 2 57 North Shore Reg Voc Tech 3 0 0 0 0 0 3 Southeastern Reg Voc Tech 0 2 3 3 0 1 9 Southern Worcester County Reg Voc Tech 3 0 0 0 0 1 4 Tri County Reg Voc Tech 0 1 0 0 0 0 1 Whittier Reg Voc Tech 6 0 0 0 0 0 6 TOTALS 31793 4209 2458 2433 2423 15842 59158
Source The Department Student Information Management System 2009
- Introduction
-
- Background
-
- I English Language Learners in Massachusetts
- II Educators Implementing Sheltered English Immersion Elementary and Secondary Content Teachers of English Language Learners
-
- Research on Professional Development for Educators of English Language Learners
- Gaps in Knowledge
-
- III Use of Funds for Category Training
-
- Future Need for Category Training
-
- IV Educators Implementing Sheltered English Immersion English as a Second Language (ESL) Teachers
-
- ESL Teacher Shortage
-
- V Use of Funds ESL Teachers and ESL Curriculum Development
-
- Massachusetts English Language Teacher Initiative (MELT)
- Improvement of Sheltered English Immersion Content-based ESL Instruction
- Future Need for ESL teachers
-
- VI Budget
- Attachments
-
- Attachment 1 All Massachusetts public school districts and changes in LEP population compared to changes in overall student population - SY 2006-SY 2010
- Attachment 1 Massachusetts public school districts and changes in LEP population compared to changes in overall student population - SY 2006-SY 2010
- Attachment 2 Massachusetts public school districts with large changes in LEP population compared to changes in overall student population - SY 2006-SY 2010
- Attachment 3 Bibliography Professional Development for Teachers of English Language Learners
- Attachment 4 Excerpts from the Commissionerrsquos Memorandum of June 2004 Guidance on Qualifications for Teachers of Limited English Proficient Students in Sheltered English Immersion Classrooms
- Attachment 5 Districts Receiving Sheltered English Immersion Professional Development 2004-2010
- Attachment 6 Collaboratives that have received grants for Sheltered English Immersion Professional Development 2004-2010
- Attachment 7 English Language Learners in Massachusetts District and Program Type October 2009
- Attachment 8 English Language Learners in Massachusetts District and First Language October 2009
-
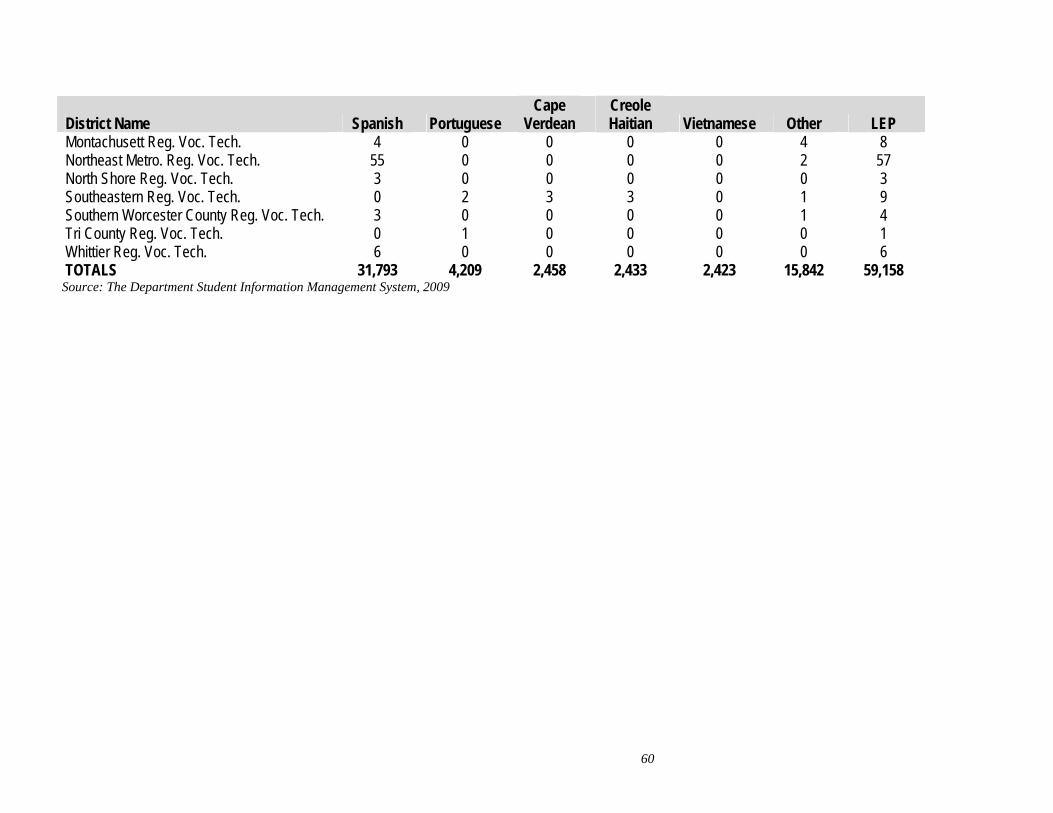


