Engineers Australia Electrical College Newcastle Branch Nuclear energy – Australia’s...
30
Engineers Australia Electrical College Newcastle Branch Nuclear energy – Australia’s opportunity? Martin H Thomas AM FTSE HonFIEAust FAIE Member UMPNER Taskforce 23 February 2012
-
Upload
jase-grapes -
Category
Documents
-
view
213 -
download
0
Transcript of Engineers Australia Electrical College Newcastle Branch Nuclear energy – Australia’s...

Engineers AustraliaElectrical College
Newcastle Branch
Nuclear energy – Australia’s opportunity?
Martin H Thomas AM FTSE HonFIEAust FAIEMember UMPNER Taskforce
23 February 2012
The big pictureThe world nuclear power industry – some facts
In February 2012 there were:– 434 reactors operating in ... – 30 countries generating nearly 14% of world’s electricity
totalling ...– 370 GW installed (over 8 times Australia’s 45 GW) with ...– 61 reactors under construction (another 61 GW) and ...– 160 reactors planned (177 GW more) and.. – 335 reactors proposed (another 380 GW)
Despite Fukushima - the nuclear renaissance continues!Source: World Nuclear Association (WNA) website http://www.world-nuclear.org/info/reactors.html

Do we live in a risk free world?
This was just one short week last August!

Boat Sinks in Moscow, Killing Nine
Cheers, then screams as plane breaks up
Chinese bullet train crashed
into another high-speed train
that had stalled after being
struck by lightning – 39 dead,
191 injured
Anders Breivik massacres 77
World wide nuclear industry deaths over 2,500 weeks?Three Mile Island (1979) – 0 Chernobyl (1986) - 50 Fukushima (2011) - 0

And others?
Seven die in Indian train accident
Russian Hydroelectric Dam Disaster 76 Dead - 2009
Pacific Highway crash claims two
more lives

Meantime - nuclear power still gaining public support in UK
Support for nuclear power in Britain has risen over past year, despite Fukushima disaster. Independent March poll shows UK nuclear acceptance continuing decade-long rise.
41% believe benefits of nuclear outweigh risks, compared with 38% in 2010 and 32% in 2005.
Those who feel risks are greater than benefits dropped to 28% from 36% in 2010 and 41% in 2005.
Will the same trend arise in Australia? I think so.

The Australian picture• Uranium part of Australia's mining heritage. Three mines –
Ranger (NT), Beverley (SA) and Olympic Dam (SA) - more planned.
• Australia's uranium reserves - world's largest at 23%. • In 2009 Australia exported over 9,700 tonnes (over A$ 1.1
billion). • Australia third largest producer after Kazakhstan (~18kta)
and Canada (~10kta) • But – Australia is the only G20 country not using nuclear
power! With carbon constraints and rising electricity costs inevitable, nuclear power is an economic imperative – if policy to reduce CO2 by 80% by 2050 has any meaning!

Uranium deposits are widespread

The Nuclear Fuel Cycle

Ranger uranium mine

U3O8 (Yellowcake) export

Fuel pellet

Equivalents
1 uranium fuel pellet ……
= 1 similar spent fuel pellet
= 3 barrels of oil
= 1 tonne of coal
= 3 tonnes CO2
= 17,000 cubic feet of natural gas

More interesting equivalents
1 golf ball of uranium (or thorium) could provide a
lifetime’s energy use for a typical American or
Australian, including all electricity, transport and
food production. It would yield same quantity of
spent fuel with no other emissions
3,200 tonnes of coal (about a 16m cube) will do the
same, but with over 11,000 tonnes of CO2 and
much toxic ash.
Think about it – then ask why our leaders refuse to!

Typical nuclear power station
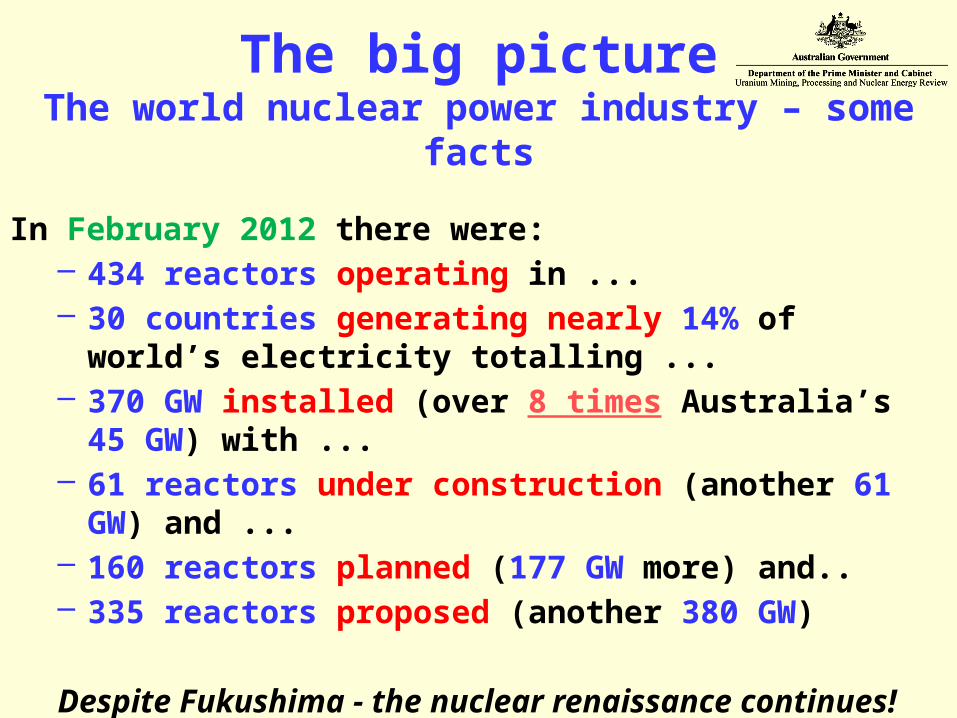
Evolution of nuclearpower plant designs
- current technologies
• Generation I – 1950s to 60s - Early prototypes (eg UK Magnox) – now nearly all decommissioned
• Generation II – Mid 1960s – Commercial power reactors (eg LWR, PWR (eg Fukushima), BWR, CANDU, RBMK (eg Chernobyl) – many installed but designs now superseded
• Generation III – Mid 1990s – Advanced light water reactors (LWRs) (eg ABWR, System 80+, AP-600 and AP-1000, EPR) – high safety - current generation of new reactors worldwide
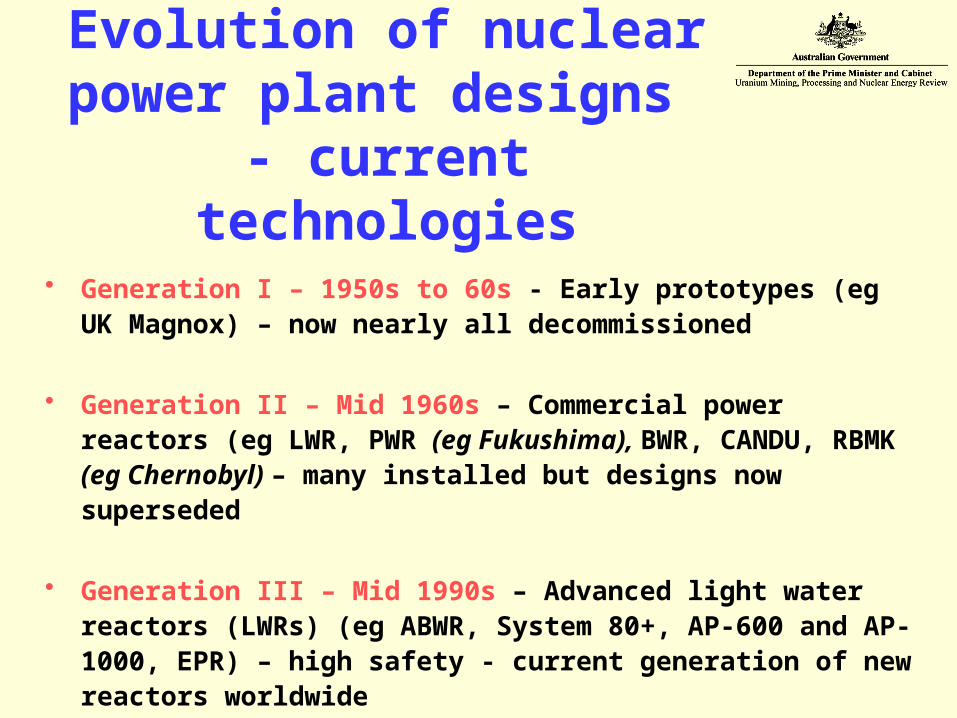
Evolution of nuclearpower plant designs- future technologies
• Generation III+ 2010 onwards – Advanced light water reactors (LWRs) (eg
ABWR, System 80+, AP-600 and AP-1000, EPR) – being installed now for
generation this decade
• Generation IV – 2020 at earliest – Very advanced ‘fast neutron’
technologies - highly economical (60 times energy from enriched uranium
– minimal waste (much is ‘burnt’) – inherently safe (shut down on fault) –
proliferation resistant – likely circa 2030+ (the golf ball!)
Generation IV Forum – Australia not a member
• Fusion reactors – say 2050? – Physics complex, deuterium fuel,
theoretically possible, no radiation and no wastes – circa 2050++
Cadarache ITER demonstration project in France. Australia not involved

Electricity generation to 2050
• Australian electricity demand set to double before 2050
– Around 100 GW new generating capacity needed (currently 45 GW )
– Portfolio of technologies needed for 2050 will include clean coal, CCS, wind, solar and nuclear power.
– Essential mix to meet energy security and heroic CO2 reduction targets (80% reduction from 2000 levels!) without excessive pollution permits
• Nuclear power - proven least cost option for many countries
– Includes lifetime waste disposal and decommissioning
• Costs vary - nuclear not yet competitive with Australia’s low cost coal without carbon tax
– Still 20-50% more costly – situation changing with carbon tax imminent (or is it?)
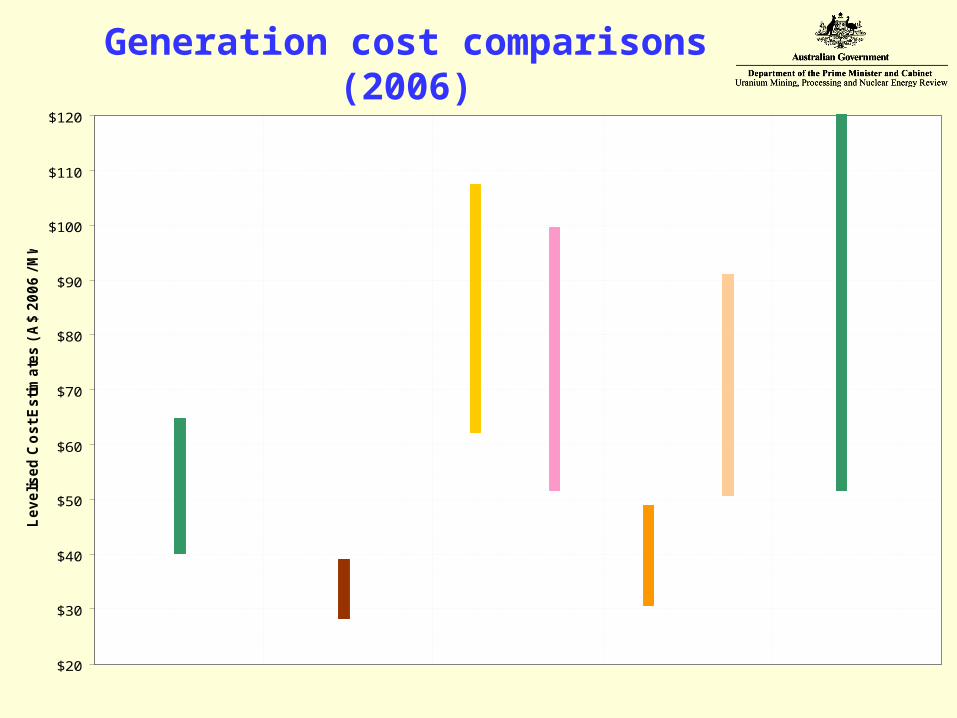
Generation cost comparisons (2006)
$20
$30
$40
$50
$60
$70
$80
$90
$100
$110
$120
Le
ve
lise
d C
os
t E
sti
ma
tes
( A
$ 2
00
6 /
MW
h )
Nuclear costs are for an established industry
Nuclear
Coal
Coal - Supercritical Pulverised Coal
Combustion + CCS
Gas - Combined Cycle Gas Turbine
+ CCS
Coal - Integrated Gasification Combined
Cycle + CCS
Renewables
High Capacity Factor Wind / Small Hydro
Solar PV
Solar Thermal / Biomass
Gas - Combined Cycle Gas Turbine
CCS estimates are indicative onlyRenewables have large ranges and substantial overlaps

Life cycle greenhouse gas emissionsfrom electricity generation
wind21
nuclear60
solar PV106
gas combined
cycle577
black coal supercritical
863
brown coalsubcritical
1175
hydro 15
0
200
400
600
800
1000
1200
1400
1600
kg
CO 2-e
pe
r M
Wh
u shows most likely value;bar shows range

Power plant siting criteria
• Land – comparable coal PS without chimneys, mine or ash dam. Typical 1000MWe NPS generates ~ 1,000W/m2, cf conc solar power ~ 15W/m2 , offshore wind ~ 3W/m2.
• Water – 20% more CW due lower efficiency – once-through sea/estuary water, evap cooling towers or radiator cooling
• Air pollution – >10 times less than coal – no CO2
• Solid waste – dramatically below coal - radioactivity and toxics contained
• Access – same as coal for generation plant• Safety – better than any other major generation technology• Location – anywhere near grid – unlike coal
Reprocessing spent fuel and high-level waste (HLW) disposal
• Medium term HLW disposal in cooling ponds - heat and radioactivity decays
• Reprocessing HLW to retrieve uranium and plutonium - highly complex – unattractive for Australia
• Long term deep HLW disposal - mature long before Australian need – earliest 2050
• Much of Australia ideal for long term deep (>500m) geological HLW disposal
• HLW volumes small – around one ensuite bathroom per 1000MW reactor year if fuel reprocessed – cf 7 million tonnes of CO2 for coal

Implementing deep HLW disposal

1.2
0.5
0.4
0.3
0.4
0.005 0.002 0.0020
0.2
0.4
0.6
0.8
1
1.2
1.4
Radonfrom
ground &buildings
Gammarays fromground
andbuildings
Cosmicrays
Ingestion Medical Nucleartests
Chernobyl Nuclear power
millis
iev
ert
sRelevance of background radiation(International Commission on Radiological Protection (IRCP)
limit is 1 millisieverts pa above natural background)
The contribution from nuclear power is minute!
Nuclear power plant safety
• Radiation dose return Sydney-London flight greater than living near nuclear power plant for 60 years – but still minimal. Pilots and flight crew don’t die of radiation!
• Modern reactors, like modern cars, have dramatically improved safety and operator training post TMI (1979) and inherently unsafe Chernobyl (1986) – 33 years and 26 years ago!
• Enormous improvements made and in prospect - new Gen III+ reactors are ‘inherently safe’.

In summary - the bad news
• Technology costly - ($M3-5/MWe) cf coal and gas• Political block - Australia refuses to consider nuclear despite UMPNER report and fact that all other G20 nations use nuclear power safely• Regulatory environment - Still inadequate• Australian engineers - Lack of qualified numbers• Water – Significant need (but can use dry cooling)• Public concerns - Australians still concerned about:
• Waste disposal• Nuclear weapons proliferation, and • NIMBY siting issues

In summary - the good news• Uranium - Vast Australian resources (~40% world’s low cost supplies) – politics good for exports!• Technologies - Mining, enrichment, reactors, spent fuel management and permanent disposal proven• Base load generation - Ideal - capacity factors typically >90%, unlike wind (30-40%) and solar PV (15-20%)• Technology proven – 440 reactors safely generate ~14% of world supply - steam plant conventional• Minimal emissions – Australia could achieve CO2 targets• Generation III and III+ reactors inherently safe• Generation IV reactors inherently safe ~ with 60 times more energy recovery from uranium fuel • RD&D - Worldwide RD&D promises further gains, eg Gen IV & fusion• Engineering capability – Australia strong, but still to grasp nettle• Debate? - Warming up – but slowly
But - infrastructure is on the cliff edge!
“Australia is facing a potential monumental infrastructure disaster as the politicians dither with long-term carbon questions and undertake speculative research on coal technologies.
“Unless someone starts actually making hard decisions now, fasten your safety belts for a very large rise in power prices in the eastern states, which will flow into inflation and interest rates.”
COMMENTARY ROBERT GOTTLIEBSEN 15 Jul 2009

G8 leaders tighten carbon targets
Leaders of the G8 have agreed to a goal of achieving at least a 50% reduction in
global greenhouse gas emissions by 2050, with developed countries
achieving an 80% reduction by then.
Australia too has committed to 80% reduction by 2050!

So what choices would you make?