ENGINEERING TRIPOS, PART IIA MANUFACTURING … · HANDOUT 4 STEELS, HEAT TREATMENT AND ALLOYING 1....
18
1 ENGINEERING TRIPOS, PART IIA MANUFACTURING ENGINEERING TRIPOS, PART IIA MODULE 3C1: MATERIALS PROCESSING AND DESIGN MODULE 3P1: MATERIALS INTO PRODUCTS HANDOUT 4 STEELS, HEAT TREATMENT AND ALLOYING 1. PHASE TRANSFORMATIONS AND MICROSTRUCTURES (Revision) 1.1 Iron-Carbon Equilibrium Diagram 1.2 Equilibrium Microstructures of Plain Carbon Steels 1.3 Phase Transformations 1.4 TTT Diagrams 2. HEAT TREATMENT OF CARBON AND ALLOY STEELS 2.1 CCT Diagrams 2.2 British Steel (BS) CCT Diagrams 2.3 Hardenability of Carbon Steels 2.4 Effects of Composition and Grain Size on Hardenability 2.5 Hardenability and Weldability 2.6 Selection of Heat-treatable Steels 3. ALLOYING OF STEELS (AND OTHER FERRO-ALLOYS) 3.1 Summary: Reasons for Alloying 3.2 Stainless Steels Useful Websites: SteelMatter (http://www.matter.org.uk/steelmatter) Steel University (http://www.steeluniversity.org/) ASM Handbook (http://products.asminternational.org/hbk) H.R. Shercliff October 2012
Transcript of ENGINEERING TRIPOS, PART IIA MANUFACTURING … · HANDOUT 4 STEELS, HEAT TREATMENT AND ALLOYING 1....

1
ENGINEERING TRIPOS, PART IIA
MANUFACTURING ENGINEERING TRIPOS, PART IIA
MODULE 3C1: MATERIALS PROCESSING AND DESIGN
MODULE 3P1: MATERIALS INTO PRODUCTS
HANDOUT 4 STEELS, HEAT TREATMENT AND ALLOYING
1. PHASE TRANSFORMATIONS AND MICROSTRUCTURES (Revision)
1.1 Iron-Carbon Equilibrium Diagram 1.2 Equilibrium Microstructures of Plain Carbon Steels 1.3 Phase Transformations 1.4 TTT Diagrams
2. HEAT TREATMENT OF CARBON AND ALLOY STEELS
2.1 CCT Diagrams 2.2 British Steel (BS) CCT Diagrams 2.3 Hardenability of Carbon Steels 2.4 Effects of Composition and Grain Size on Hardenability 2.5 Hardenability and Weldability 2.6 Selection of Heat-treatable Steels
3. ALLOYING OF STEELS (AND OTHER FERRO-ALLOYS)
3.1 Summary: Reasons for Alloying 3.2 Stainless Steels Useful Websites: SteelMatter (http://www.matter.org.uk/steelmatter) Steel University (http://www.steeluniversity.org/) ASM Handbook (http://products.asminternational.org/hbk)
H.R. Shercliff October 2012

2
1. PHASE TRANSFORMATIONS AND MICROSTRUCTURES
1.1 Iron-Carbon Equilibrium Diagram
Main phases
Austenite, (FCC). Maximum solubility of C: 1.7 wt% Ferrite, (BCC). Maximum solubility of C: 0.035 wt% Cementite, or iron carbide, Fe3C. Chemical compound (6.7 wt% C) Martensite, ' (body centred tetragonal – BCT). Metastable phase.
Composite microstructures
Pearlite: alternate plates of and Fe3C. Equilibrium carbon content 0.80 wt% C, but actual carbon content depends on cooling rate at which it formed.
Bainite: finer mixture of and Fe3C, formed at faster cooling rates and lower temperatures than pearlite.
Key temperatures A1: the eutectoid temperature, 723°C (lowest temperature for stable austenite). A3: lower limit of austenite field for hypo-eutectoid steels (< 0.8wt% C). Acm: lower limit of austenite field for hyper-eutectoid steels (> 0.8wt% C).

3
1.2 Equilibrium Microstructures of Plain Carbon Steels
Eutectoid Steel
Pearlite in a eutectoid steel (Source: ASM handbook)
Hypo-Eutectoid and Hyper-Eutectoid Steels
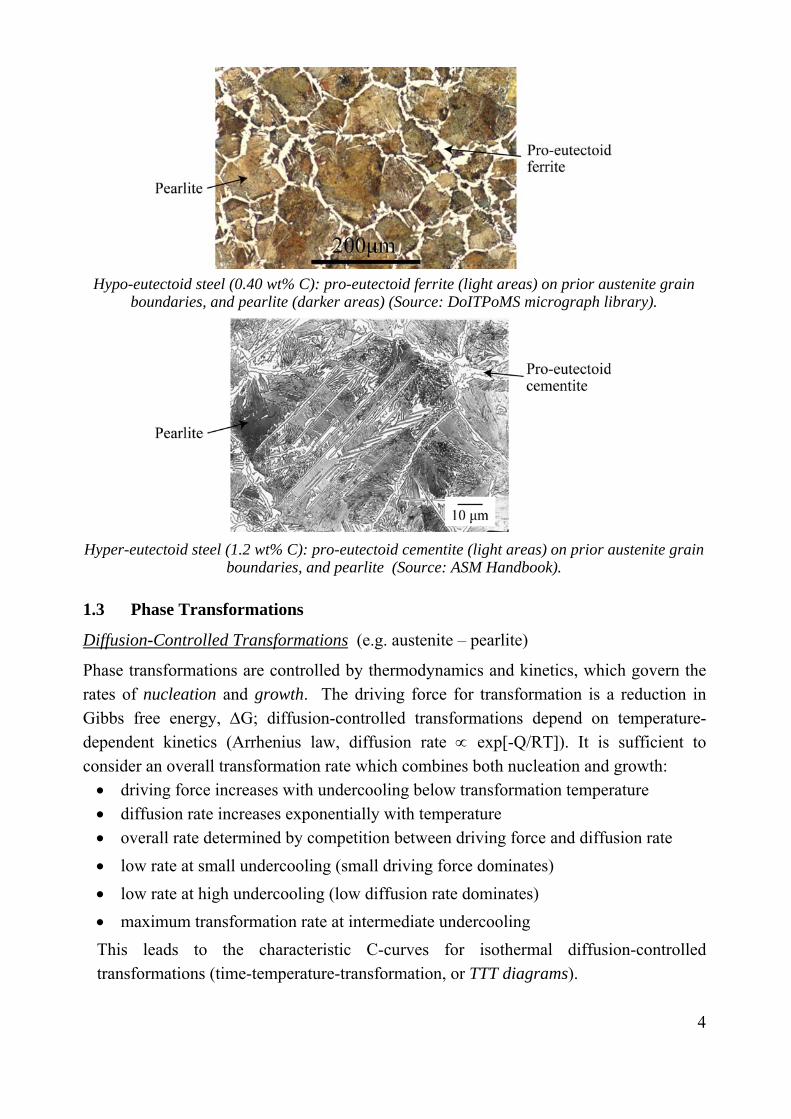
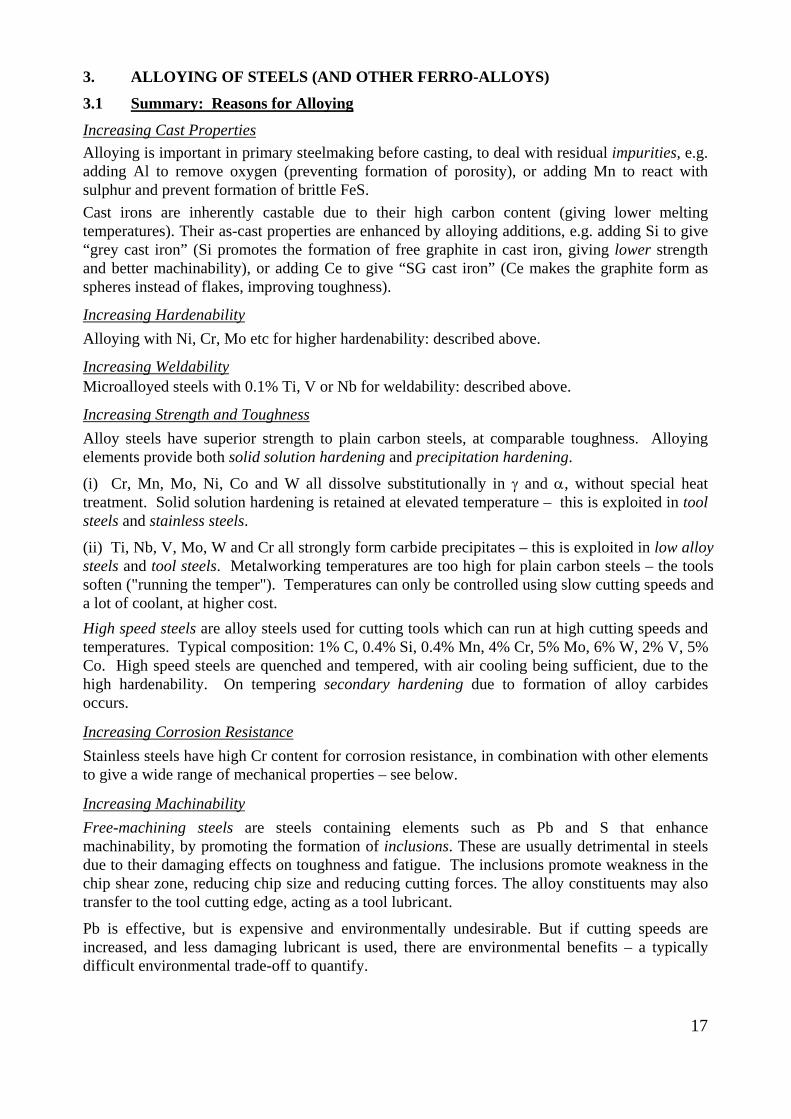
On slow cooling of hypo-eutectoid carbon steels (<0.8 wt% C), pro-eutectoid α ferrite forms on prior austenite grain boundaries (rejecting C into the remaining austenite). At 723°C, the remaining austenite, now containing 0.8wt% C, transforms to pearlite. In hyper-eutectoid steel (>0.8 wt% C) the pro-eutectoid phase is cementite (Fe3C), which also forms along prior-austenite grain boundaries, removing C from the austenite until it reaches the eutectoid composition (then forming pearlite).
Schematic microstructures formed during slow cooling of
(a) hypo-eutectoid and(b) hyper-eutectoid steels.
On slow cooling of eutectoid steel (0.8wt% C), austenite transforms ( +Fe3C) to pearlite, a lamellar mixture of ferrite and iron carbide. The lamellar structure minimizes the diffusion distance at the migrating interface between pearlite and austenite.
4
Hypo-eutectoid steel (0.40 wt% C): pro-eutectoid ferrite(light areas) on prior austenite grain
boundaries, and pearlite (darker areas) (Source: DoITPoMS micrograph library).
Hyper-eutectoid steel (1.2 wt% C): pro-eutectoid cementite (light areas) on prior austenite grain
boundaries, and pearlite (Source: ASM Handbook).
1.3 Phase Transformations
Diffusion-Controlled Transformations (e.g. austenite – pearlite)
Phase transformations are controlled by thermodynamics and kinetics, which govern the rates of nucleation and growth. The driving force for transformation is a reduction in Gibbs free energy, G; diffusion-controlled transformations depend on temperature-dependent kinetics (Arrhenius law, diffusion rate exp[-Q/RT]). It is sufficient to consider an overall transformation rate which combines both nucleation and growth: driving force increases with undercooling below transformation temperature diffusion rate increases exponentially with temperature overall rate determined by competition between driving force and diffusion rate
low rate at small undercooling (small driving force dominates)
low rate at high undercooling (low diffusion rate dominates)
maximum transformation rate at intermediate undercooling
This leads to the characteristic C-curves for isothermal diffusion-controlled transformations (time-temperature-transformation, or TTT diagrams).

5
(a) Trade-off between driving force and diffusion rate leading to peak in transformation rate
below equilibrium transformation temperature TE; (b) TTT diagram: temperature versus (log) time for different fractions transformed.
Diffusionless (Displacive) Transformations (e.g. austenite – martensite)
Diffusionless (displacive) transformations occur on quenching, bypassing the TTT diagram. The new crystal structure forms by shear of the lattice, from FCC to body-centred tetragonal, retaining the carbon as a supersaturated solid solution, distorting the BCT lattice (i.e. with no diffusion). The transformation interface moves at very high speeds (e.g. 1000 ms-1, effectively instantaneous). A critical undercooling below a martensite start temperature, Ms, is needed in order to nucleate martensite. Further undercooling is needed to complete the transformation due to the strain energy of the supersaturated martensite. The fraction of martensite increases with undercooling below Ms, until the martensite finish temperature, Mf, is reached.
(a) Temperature versus fraction of martensite transformed, defining Ms and Mf;
(b) Temperature versus (log) time for different fractions transformed.
Mechanism of Martensite Formation
In the martensite transformation, a strain imposed on the FCC lattice of austenite (the Bain strain), generates the BCC lattice without diffusion. The packing of adjacent FCC unit cells of austenite reveals a body-centred tetragonal (BCT) unit cell, with a simple geometric relationship to BCC. To accommodate the transformation strain, martensite grows in the form of thin plates, nucleating from prior austenite grain boundaries.

6
(a) Relationship between two adjacent FCC unit cells of austenite, and BCT lattice; (b) Bain strain deforming BCT lattice to a BCC martensite lattice.
1.4 TTT Diagrams
TTT diagrams capture information on isothermal phase transformations by plotting the transformed fraction as a function of time and temperature. To construct such a diagram, a number of small steel specimens are austenitised and quenched and held at lower temperatures. The extent of transformation as a function of time is measured by dilatometry, magnetic permeability or some other physical technique.
TTT diagrams for eutectoid steel (0.8% C), hypo-eutectoid (< 0.8% C) and hyper-eutectoid (> 0.8% C) steels are shown below. Pearlite (P) and bainite (B) form by distinct processes, with their own C-curves. To an adequate approximation, pearlite forms above the "knee", and bainite below. For hypo-eutectoid steels, some ferrite (F) forms between the A1 and A3 temperatures, and precedes the formation of pearlite below A1 (up to the "carbide line"). Hypereutectoid steels (> 0.8% C) form Fe3C, or cementite, (C) between the Acm and A1 temperatures.
Optical micrograph of martensite
(Courtesy of H. Bhadeshia)

7
Schematic TTT diagrams for (a) eutectoid, (b) hypo-eutectoid and (c) hyper-eutectoid steels.
(Source: Engineering Materials II, M.F. Ashby & D.R.H. Jones).

8
2. HEAT TREATMENT OF CARBON AND ALLOY STEELS
2.1 CCT Diagrams
TTT diagrams are a useful laboratory tool for studying phase transformations, uniquely characterising the isothermal transformation rate. Practical heat treatment occurs by continuous cooling: how does this relate to the TTT diagram?
Consider a cooling curve superimposed on a TTT diagram, and treat this as a series of quench-and-isothermal-hold time steps, t.
log(TIME)
T
TE
t*(T) A
At point A: isothermally: 1*
t
t , but for continuous cooling: 1*
t
t ,
since the transformation rate is slower in the earlier time-steps during continuous cooling (higher t*). Hence for continuous cooling, the C-curves are shifted to longer times and lower temperatures.
TTT diagram CCT diagram
Commercial CCT diagrams for steels use a cross-plot of the temperature-time CCT diagram onto axes of temperature against cooling rate.
For a C-curve corresponding to a given fraction transformed (e.g. 1%, 50%, 99%), let t* be the time to reach that fraction transformed, isothermally, at temperature T.

9
2.2 British Steel (BS) CCT Diagrams
CCT diagrams for over 150 steels are found in British Steel's Atlas of CCT Diagrams for Engineering Steels – the example below is for a eutectoid 0.75% C steel.
Reading BS CCT diagrams:
Cooling rate is plotted increasing from right to left (see scale in °C/min)
Heat flow analysis is used to convert from this scale to the more practical scale of bar diameter in air with the corresponding cooling rate at its centre. This gives the upper x-axis scale: log(bar diameter cooled in air).
The two parallel x-axes show the corresponding bar diameters, cooled in oil and water, which have the same cooling rate at their centres.
CCT diagrams are read vertically, for a given bar diameter and quenching medium.
The microstructure at the bar centre is given by the contours of cumulative fraction transformed (P: pearlite, B: bainite, M: martensite).
The corresponding hardness at the centre of the bar is found from the curve below the bar diameter scales (and in some cases after tempering for 1 hour at specified temperatures).
Surface hardness may be taken to be the value at the left hand end, for oil and water quenching (i.e. rapid surface cooling rate). For air cooling, the surface and centre cooling rates are effectively the same – so the surface and centre hardness is the same.

10
Critical diameter Do (see below) for still air quench = still oil quench = still water quench =

11
2.3 Hardenability of Carbon Steels
Hardenability is the ability of a steel to form martensite on quenching – the pre-requisite for producing a tempered microstructure. The important feature of martensite here is that it is a supersaturated solution of carbon, from which fine carbides can be precipitated, not that it is hard and brittle (which in fact can lead to undesirable side effects like quench cracking).
Critical cooling rate (CCR) is a possible measure of hardenability – the lower the CCR, the higher the hardenability. In practical heat treatment, we need to know the dimension of component which will form enough martensite through-thickness, on quenching, e.g. we define the critical diameter Do for a steel as the diameter of bar, quenched in a given medium, which forms 50% martensite at its centre.
Jominy End-Quench Test
The Jominy end-quench test imposes a gradient of cooling rates on a single sample. A 100 mm long by 25 mm diameter bar is austenitised, dropped into a rig, and water-quenched on one end. After cooling, the hardness is measured along the bar length (a Jominy curve).
Optical micrographs from Jominy test in a 0.4%C steel (0.4% C): (a) martensite & bainite (2mm from end); (b) ferrite & pearlite (40mm from end)
Cooling rate vs. distance from quenched end
Jominy end-quench test

12
Heat flow analysis provides the conversion between Jominy distance, and the bar diameter which has the same cooling rate at its centre. Hence CCT hardness curves can be converted to Jominy curves, and vice versa.
Correlation between bar diameter and distance along Jominy bar for equivalent cooling rates.
For equivalence of cooling rate at the centre of an oil-quenched bar, use “radius/bar radius = 0”
2.4 Effects of Composition and Grain size on Hardenability
Effect of carbon content
For hypo-eutectoid plain carbon steels (<0.8 wt% C):
ferrite formation precedes the formation of pearlite.
hardenability increases as C content increases (curves for bainite/pearlite move to the right)
martensite start (Ms) and finish (Mf) temperatures fall with increasing C content (reflecting greater strain energy in higher C martensite)
(a) hypo-eutectoid steel (0.44 wt% C) (b) eutectoid steel (0.75 wt% C)
Do (air) = Do (air) =

13
Effect of austenite grain size
Fine grain sizes are desirable in steels as fine-grained structures have higher hardness and toughness. Hardenability is best obtained by other means (alloying).
Effect of alloying
Eutectoid steel only has sufficient hardenability to form martensite through-thickness in sections of diameter 20-30 mm. To quench and temper larger sections, we need higher hardenability – this is achieved by alloying.
Substitutional alloying elements such as Mn, Ni, Cr, Mo diffuse slowly in iron, and delay the diffusional transformations from austenite to ferrite and pearlite. The CCT curves move to the right, enabling martensite to form with lower cooling rates. The C-curves for pearlite and bainite formation also separate in low alloys steels.
The austenite grain size affects both the rate of nucleation of ferrite and pearlite, and the time taken for growth to complete the transformation. The larger the austenite grains, the higher the hardenability.
Grain size can typically change the CCR by up to a factor of 10 – this is comparable to the effect of changing C content from 0.1 to 0.8 wt%.

14
Tempering
Martensite is too brittle for use as a bulk microstructure in a component, so it is softened and toughened by tempering. Tempering is reheating to a temperature below A1 to allow the supersaturated solution of carbon to precipitate as spheroidal Fe3C precipitates in a matrix of ferrite. A wide range of combinations of strength and toughness can be achieved by varying the temper temperature and time. In alloy steels, alloy carbides also form during tempering – this is called secondary hardening.
Critical diameters, Do
air:
oil:
water:
(compare with values for eutectoid steel, p.10)
Note curves for tempered hardness also included.

15
2.5 Hardenability and Weldability
The low hardenability of a fine-grained steel improves its weldability, but austenite grain growth must be prevented to maintain low hardenability. Microalloyed steels contain small alloying additions which form stable carbide particles (e.g. Ti to form TiC) to prevent grain growth during welding, and thereby reduce the possibility of forming martensite on cooling.
A simple empirical measure of both hardenability and weldability is the "carbon equivalent", CE:
6 5 15
Mn Cr Mo V Ni CuCE C
The higher the CE the higher the hardenability, hence CE provides a warning for loss of weldability. The normal upper limit for welding of steels without taking special precautions against embrittlement is typically CE = 0.45.
2.6 Selection of heat-treatable steels
Selection procedure
(1) Choose possible quench procedures (probably oil, but the less severe the better, to reduce the risk of cracking).
(2) Use the British Standard for equivalent diameters to convert the real shape of the part into an equivalent long cylinder – see below.
(3) Use the Atlas of CCT Diagrams to choose a steel (selection in Datasheet) – locate the equivalent diameter on the axis for the chosen quenching medium.
(4) Read off the as-quenched hardness (or % martensite) – or identify the quench/temper treatment which gives at least the minimum hardness specified.
(5) If there is a requirement for a minimum surface hardness, read the same curve at its left hand end (for oil, water only; in air, same hardness as centre). Equivalent diameters Definition: the equivalent diameter of a component is the diameter of an infinitely long circular cylinder which, if subjected to the same cooling conditions as the component, would have a cooling rate on its axis equal to that at the position of slowest cooling in the component.
(Note: the cooling curves for the two cases are not identical – for "the same cooling rate" the British Standard BS5046 (1971) defines that the time to cool to 0.35 of the overall temperature drop is the same, i.e. roughly the martensite start temperature).

16
British Standard BS5046 gives equivalent diameters (see Datasheet) for: - cylinders and discs - two or three cylinders with a common axis - rectangular sections
Real, irregular shapes must first be approximated to one of these shapes using a certain amount of judgement:
- first identify the bulkiest section (which has the lowest internal cooling rate) - note that cooling at that location is dominated by its smallest dimension.
For each class of shape, the equivalent diameter eD
is given by: lfDe .
where l is the leading (smallest) dimension of the component at the location of
interest (e.g. its radius, width, wall thickness etc.) The factor f depends on:
- the geometry and dimensions of the body - the heat transfer coefficient, h (i.e. the quenching medium) Example: find De for an oil-quenched slab, 10 50 200 mm
17
3. ALLOYING OF STEELS (AND OTHER FERRO-ALLOYS)
3.1 Summary: Reasons for Alloying
Increasing Cast Properties
Alloying is important in primary steelmaking before casting, to deal with residual impurities, e.g. adding Al to remove oxygen (preventing formation of porosity), or adding Mn to react with sulphur and prevent formation of brittle FeS.
Cast irons are inherently castable due to their high carbon content (giving lower melting temperatures). Their as-cast properties are enhanced by alloying additions, e.g. adding Si to give “grey cast iron” (Si promotes the formation of free graphite in cast iron, giving lower strength and better machinability), or adding Ce to give “SG cast iron” (Ce makes the graphite form as spheres instead of flakes, improving toughness).
Increasing Hardenability
Alloying with Ni, Cr, Mo etc for higher hardenability: described above.
Increasing Weldability Microalloyed steels with 0.1% Ti, V or Nb for weldability: described above.
Increasing Strength and Toughness
Alloy steels have superior strength to plain carbon steels, at comparable toughness. Alloying elements provide both solid solution hardening and precipitation hardening.
(i) Cr, Mn, Mo, Ni, Co and W all dissolve substitutionally in and , without special heat treatment. Solid solution hardening is retained at elevated temperature – this is exploited in tool steels and stainless steels.
(ii) Ti, Nb, V, Mo, W and Cr all strongly form carbide precipitates – this is exploited in low alloy steels and tool steels. Metalworking temperatures are too high for plain carbon steels – the tools soften ("running the temper"). Temperatures can only be controlled using slow cutting speeds and a lot of coolant, at higher cost.
High speed steels are alloy steels used for cutting tools which can run at high cutting speeds and temperatures. Typical composition: 1% C, 0.4% Si, 0.4% Mn, 4% Cr, 5% Mo, 6% W, 2% V, 5% Co. High speed steels are quenched and tempered, with air cooling being sufficient, due to the high hardenability. On tempering secondary hardening due to formation of alloy carbides occurs.
Increasing Corrosion Resistance
Stainless steels have high Cr content for corrosion resistance, in combination with other elements to give a wide range of mechanical properties – see below.
Increasing Machinability
Free-machining steels are steels containing elements such as Pb and S that enhance machinability, by promoting the formation of inclusions. These are usually detrimental in steels due to their damaging effects on toughness and fatigue. The inclusions promote weakness in the chip shear zone, reducing chip size and reducing cutting forces. The alloy constituents may also transfer to the tool cutting edge, acting as a tool lubricant.
Pb is effective, but is expensive and environmentally undesirable. But if cutting speeds are increased, and less damaging lubricant is used, there are environmental benefits – a typically difficult environmental trade-off to quantify.

18
3.2 Stainless Steels
Stainless steels contain a high proportion of Cr, which forms Cr oxide in preference to Fe, preventing rust formation. There are three main classes – ferritic, martensitic, and austenitic.
Ferritic Stainless Steel
Ferritic stainless steels are Fe-Cr ferro-alloys with enough Cr and other elements to stabilise BCC ferrite at all temperatures. They are solid-solution strengthened, because heat treatment cannot be used to harden the alloys.
High temperature embrittlement is a risk in alloys with moderate to high interstitial C and N contents. This is caused by depletion of Cr in solution (“sensitisation”) due to precipitated Cr carbides and nitrides, resulting in embrittlement and loss of corrosion resistance. Strong carbide and nitride forming elements such as Ti or Nb may be added to “stabilise” the steel (i.e. to clean up the free interstitial carbon).
Ferritic steels have relatively low yield strength, and work hardening is limited. Good ductility requires very low levels of carbon and nitrogen.
Martensitic Stainless Steel
Martensitic stainless steels are hardenable – they contain typically 0.6 wt% C. Carbon changes the Fe-Cr phase diagram, expanding the FCC field to high Cr content. For instance, a 15% Cr, 0.6% C steel at 1000°C lies in the austenite field, and can thus be quenched and tempered. Martensitic stainless steels are characterised by high strength and acceptable toughness.
Austenitic Stainless Steel
The majority of stainless steels are austenitic – the commonest being grades 304 and 316 (18% Cr, 8% Ni, and 0.08% C). They contain sufficient austenite-stabilising elements, such as Ni, to retain austenite down to room temperature.
To minimise susceptibility to “sensitisation” during welding, “L-grade” alloys with especially low C contents are used, e.g. “304L”.
Austenitic stainless steels are not hardenable by quenching and tempering, but the high solute content gives a reasonable yield stress and strong work hardening, combined with very high ductility and toughness.
On cooling below room temperature, martensitic and ferritic steels are characterised by a transition in toughness, from tough to brittle behaviour. The austenitic stainless steels do not exhibit a toughness transition – they retain toughness at all temperatures, and are the alloys of choice for cryogenic applications (storage of liquefied gas).


![Surface Hardening of Stainless Steels - · PDF fileof the surface with hardening species ... Process methods for the surface hardening of steels [7] ... in: International Heat Treatment](https://static.fdocuments.net/doc/165x107/5ab1f2327f8b9aea528d035c/surface-hardening-of-stainless-steels-the-surface-with-hardening-species-process.jpg)